Article

Exploring the Effects of Support Restoration on Pictorial Layers Through Multi-Resolution 3D Survey

by
Emma Vannini
1,2,
Silvia Belardi
3,
Irene Lunghi
1,4,
Alice Dal Fovo
1,* and
Raffaella Fontana
1
1
National Research Council—National Institute of Optics (CNR-INO), Largo E. Fermi 6, 50125 Firenze, FI, Italy
2
Department of Physics and Astronomy, University of Florence, Via Sansone 1, 50019 Sesto Fiorentino, FI, Italy
3
School of Mathematical, Physical and Natural Sciences, University of Florence, Viale Morgagni 40/44, 50134 Firenze, FI, Italy
4
Department of Chemistry “Ugo Schiff”, University of Florence, Via della Lastruccia 3-13, 50019 Sesto Fiorentino, FI, Italy
*
Author to whom correspondence should be addressed.
Remote Sens. 2025, 17(14), 2487; https://doi.org/10.3390/rs17142487
Submission received: 9 June 2025 / Revised: 15 July 2025 / Accepted: 16 July 2025 / Published: 17 July 2025
(This article belongs to the Special Issue New Insight into Point Cloud Data Processing)

Abstract

Three-dimensional (3D) reproduction of artworks has advanced significantly, offering valuable insights for conservation by documenting the objects’ conservative state at both macroscopic and microscopic scales. This paper presents the 3D survey of an earthquake-damaged panel painting, whose wooden support suffered severe deformation during a seismic event, posing unique restoration challenges. Our work focuses on quantifying how shape variations in the support—induced during restoration—affect the surface morphology of the pictorial layers. To this end, we conducted measurements before and after support consolidation using two complementary 3D techniques: structured-light projection to generate 3D models of the painting, tracking global shape changes in the panel, and laser-scanning microprofilometry to produce high-resolution models of localized areas, capturing surface morphology, superficial cracks, and pictorial detachments. By processing and cross-comparing 3D point cloud data from both techniques, we quantified shape variations and evaluated their impact on the pictorial layers. This approach demonstrates the utility of multi-scale 3D documentation in guiding complex restoration interventions.

1. Introduction

Three-dimensional (3D) scanning has become a cornerstone technology in Cultural Heritage, enabling the study, archiving, and visualization of artifacts with unparalleled precision. Its widespread adoption stems not only from the rich data it provides but also from its non-invasive nature, as most 3D scanners operate without physical contact. The portability of modern systems further allows for on-site applications, which is crucial for large or fragile artworks that cannot be relocated.
Three-dimensional models allow documenting the state of conservation of artworks with high accuracy, precision, and resolution, often incorporating color information (XYZ coordinates and RGB values for each point). Several studies have demonstrated the effectiveness of combining 3D techniques with other analytical methods (e.g., thermography [1,2,3], multispectral and hyperspectral reflectance imaging in the UV-Vis-NIR range, and UV fluorescence [4,5]) in advanced diagnostic campaigns, enabling the integration of spectral and spatial data into a unified coordinate system [6,7]. For canvas and panel paintings, 3D modeling provides quantitative insights across scales, from micro-scale craquelure to macro-scale support deformations [8,9].
Currently, a variety of non-contact 3D techniques exist, each offering unique advantages in resolution, depth of field, and speed [10,11]. Combining instruments based on different working principles allows for comprehensive analysis through dataset integration [12]. Specifically, structured-light topography and optical scanning microprofilometry have demonstrated efficacy in the detailed examination of panel paintings at different levels of resolution [13,14]. Structured-light topography, a triangulation-based method, projects patterns of incoherent light (e.g., variable-frequency fringes) onto the object’s surface. The resulting distortions, captured by one or two cameras, yield 3D topographical data [15,16]. In contrast, microprofilometry employs conoscopic holography, an interferometric technique where interference patterns generated by a birefringent crystal correlate with surface-probe-distances [17]. This method excels in detecting micrometric surface features like detachments, craquelure, and roughness due to its exceptional lateral and axial resolution.
The state of conservation of panel paintings requires systematic documentation and monitoring, as environmental factors (e.g., temperature, humidity) and restoration interventions (e.g., cleaning, support consolidation) can alter their structural and superficial properties [18]. Strategies for tracking deformation [19]—such as non-rigid registration algorithm [20], multi-temporal 3D model comparison [21], and Digital Holographic Speckle Pattern Interferometry (DHSPI) [22]—have proven effective. However, some methods (e.g., mechanical fastening for deformation tracking [23,24]) remain invasive.
Multianalytical approaches, including laser-scanning microprofilometry, have also been used to assess surface changes induced by cleaning treatments [25]. The removal of surface materials with solvents, gels, or laser ablation can alter the surface topography and cause microscopic deformations. For instance, conoscopic holography quantified micro-topographical alterations in Tintoretto’s masterpiece following laser-chemical cleaning [26].
Restoration of severely damaged wooden supports can significantly alter an artwork’s shape, risking cracks or detachments in pictorial layers, and making it desirable for conservators to have a reliable method of accurately monitoring the consolidation process. Despite this, to the best of our knowledge, no prior studies have quantitatively examined the effects of support consolidation on paint surfaces using 3D analysis, a gap this work addresses.
Our case study focuses on the left panel of a late Gothic triptych (1480–1490), critically damaged during an earthquake in 2016. While earlier works [27,28] monitored the consolidation of the central and right panels via photogrammetry and structured-light scanning, the impact on pictorial layers remained unassessed.
In this work, we used structured-light projection—for full-panel 3D models—and laser-scanning microprofilometry—for high-resolution regions of interest (ROIs) analysis—not only to quantify macro- and microscopic changes pre- and post-restoration but also to give a quantitative evaluation of any effects of the restoration intervention on the pictorial layer. This dual-technique approach detects new cracks, detachments, and craquelure, providing conservators with feedback on the effects of their restoration work and actionable insights for future interventions.

2. Materials and Methods
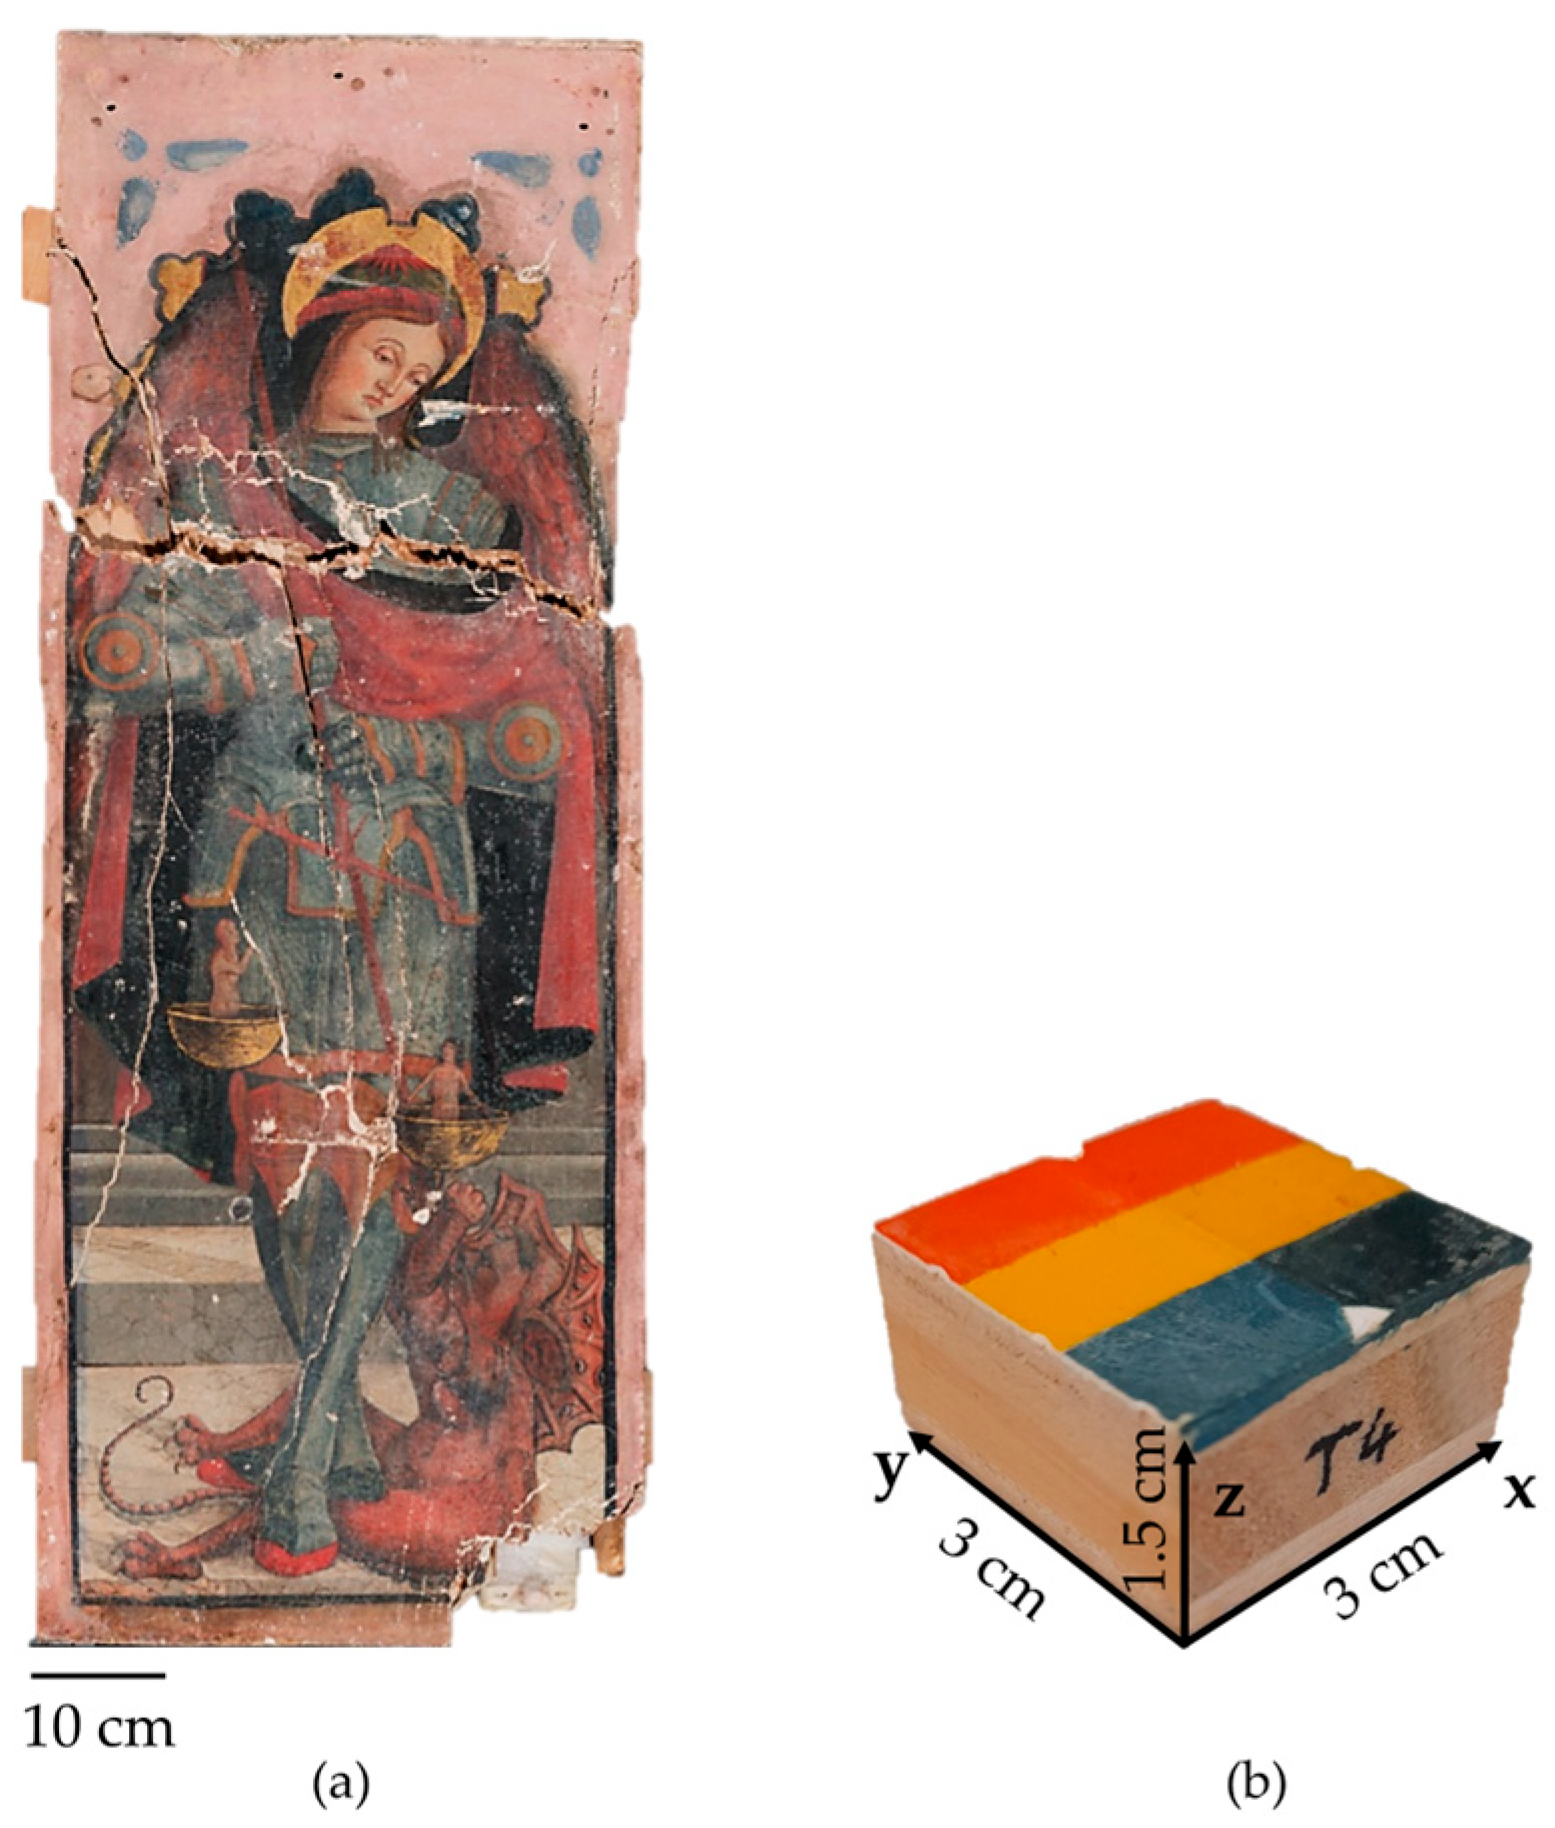
2.1. Case Study

The painting under examination is the left wooden panel (120 cm × 45 cm) of the triptych, depicting St. Michael the Archangel. The artwork was likely executed by Paolo da Visso, a prominent artist of the period, in collaboration with painters from his workshop in central Italy. Originally positioned behind the main altar of the S. Vittorino church in the province of Macerata (Marche, Italy), the painting suffered severe damage due to the 2016 earthquake (Figure 1a). The seismic event caused structural deformations, cracks, and splits across the panel, as well as the detachment of both macro- and micro-scale elements. Consequently, an extensive restoration plan was required to stabilize the support, reintegrate missing sections, and install new crosspieces.
A more detailed description of the triptych can be found in our previous studies [27,28].

2.2. Reference Sample

To ensure reliable point cloud data processing, a painted wooden cube (3 × 3 × 1.5 cm3, Figure 1b), simulating a panel painting, was used as a reference. Two separate point clouds were acquired at different time intervals from the unaltered mock-up and compared to quantify variations introduced by fine alignment. These data establish a threshold for distinguishing genuine alterations in the pictorial layers of the studied panel painting (see Section 2.5).

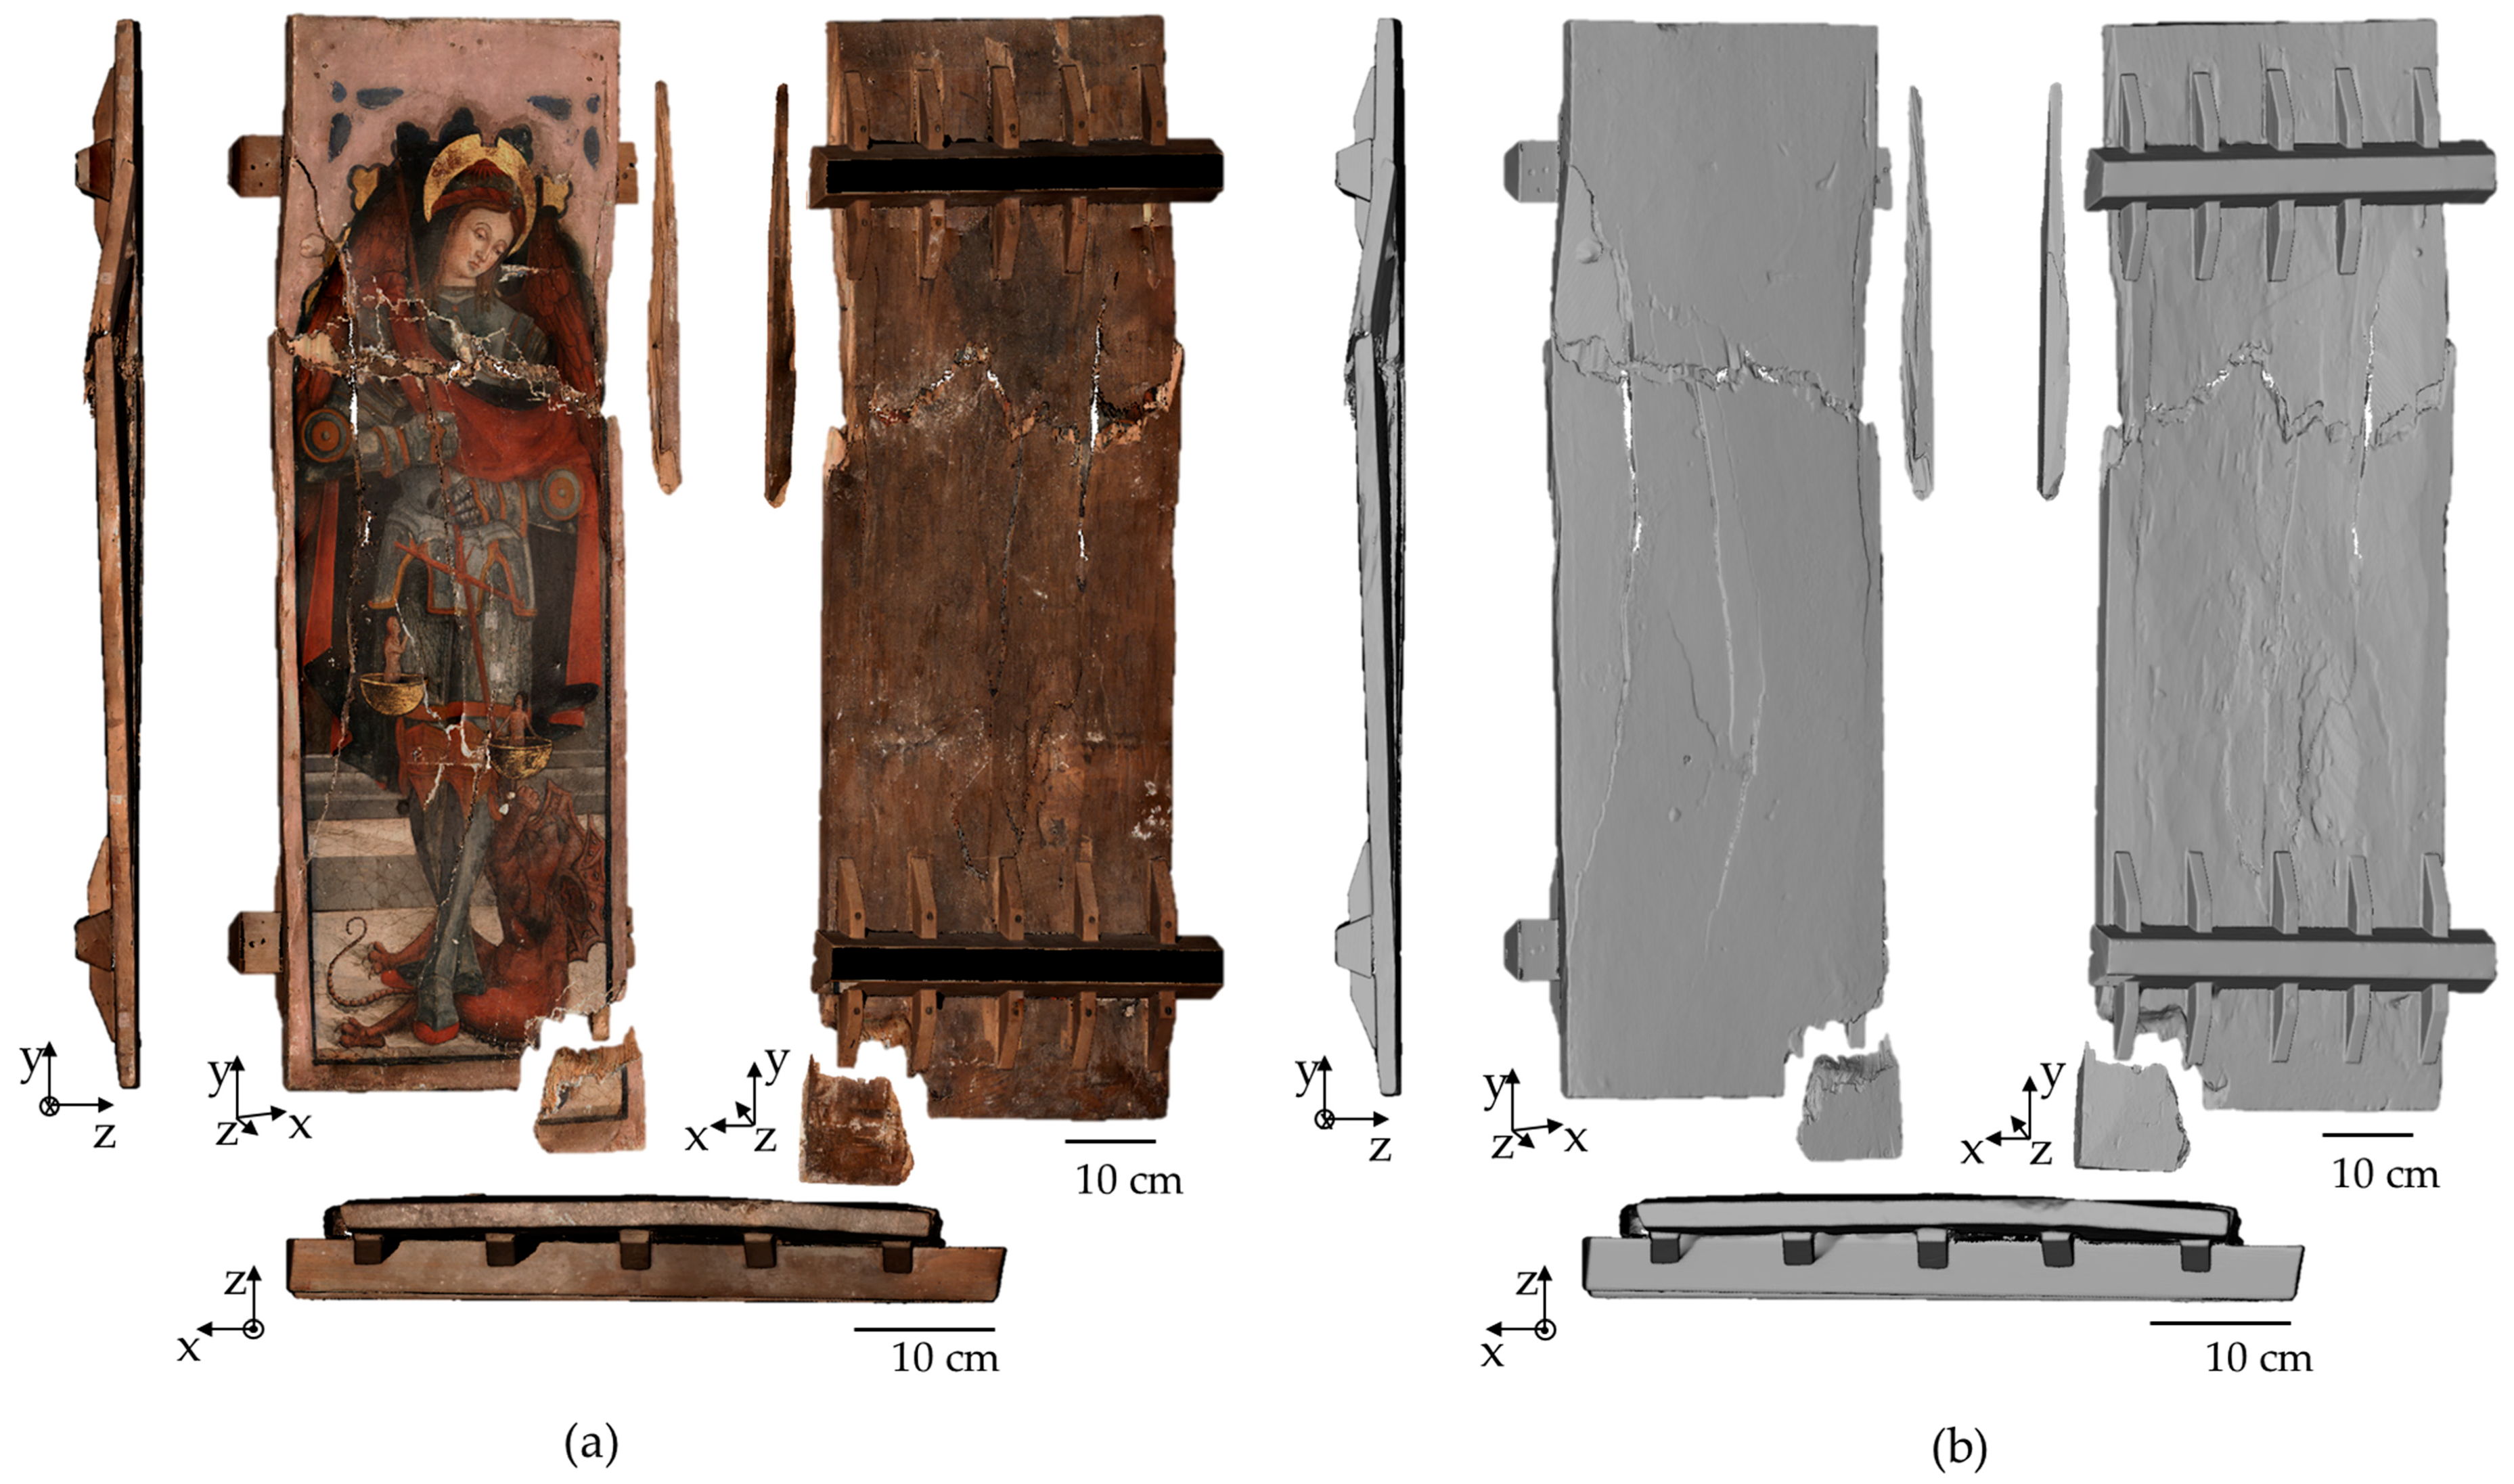
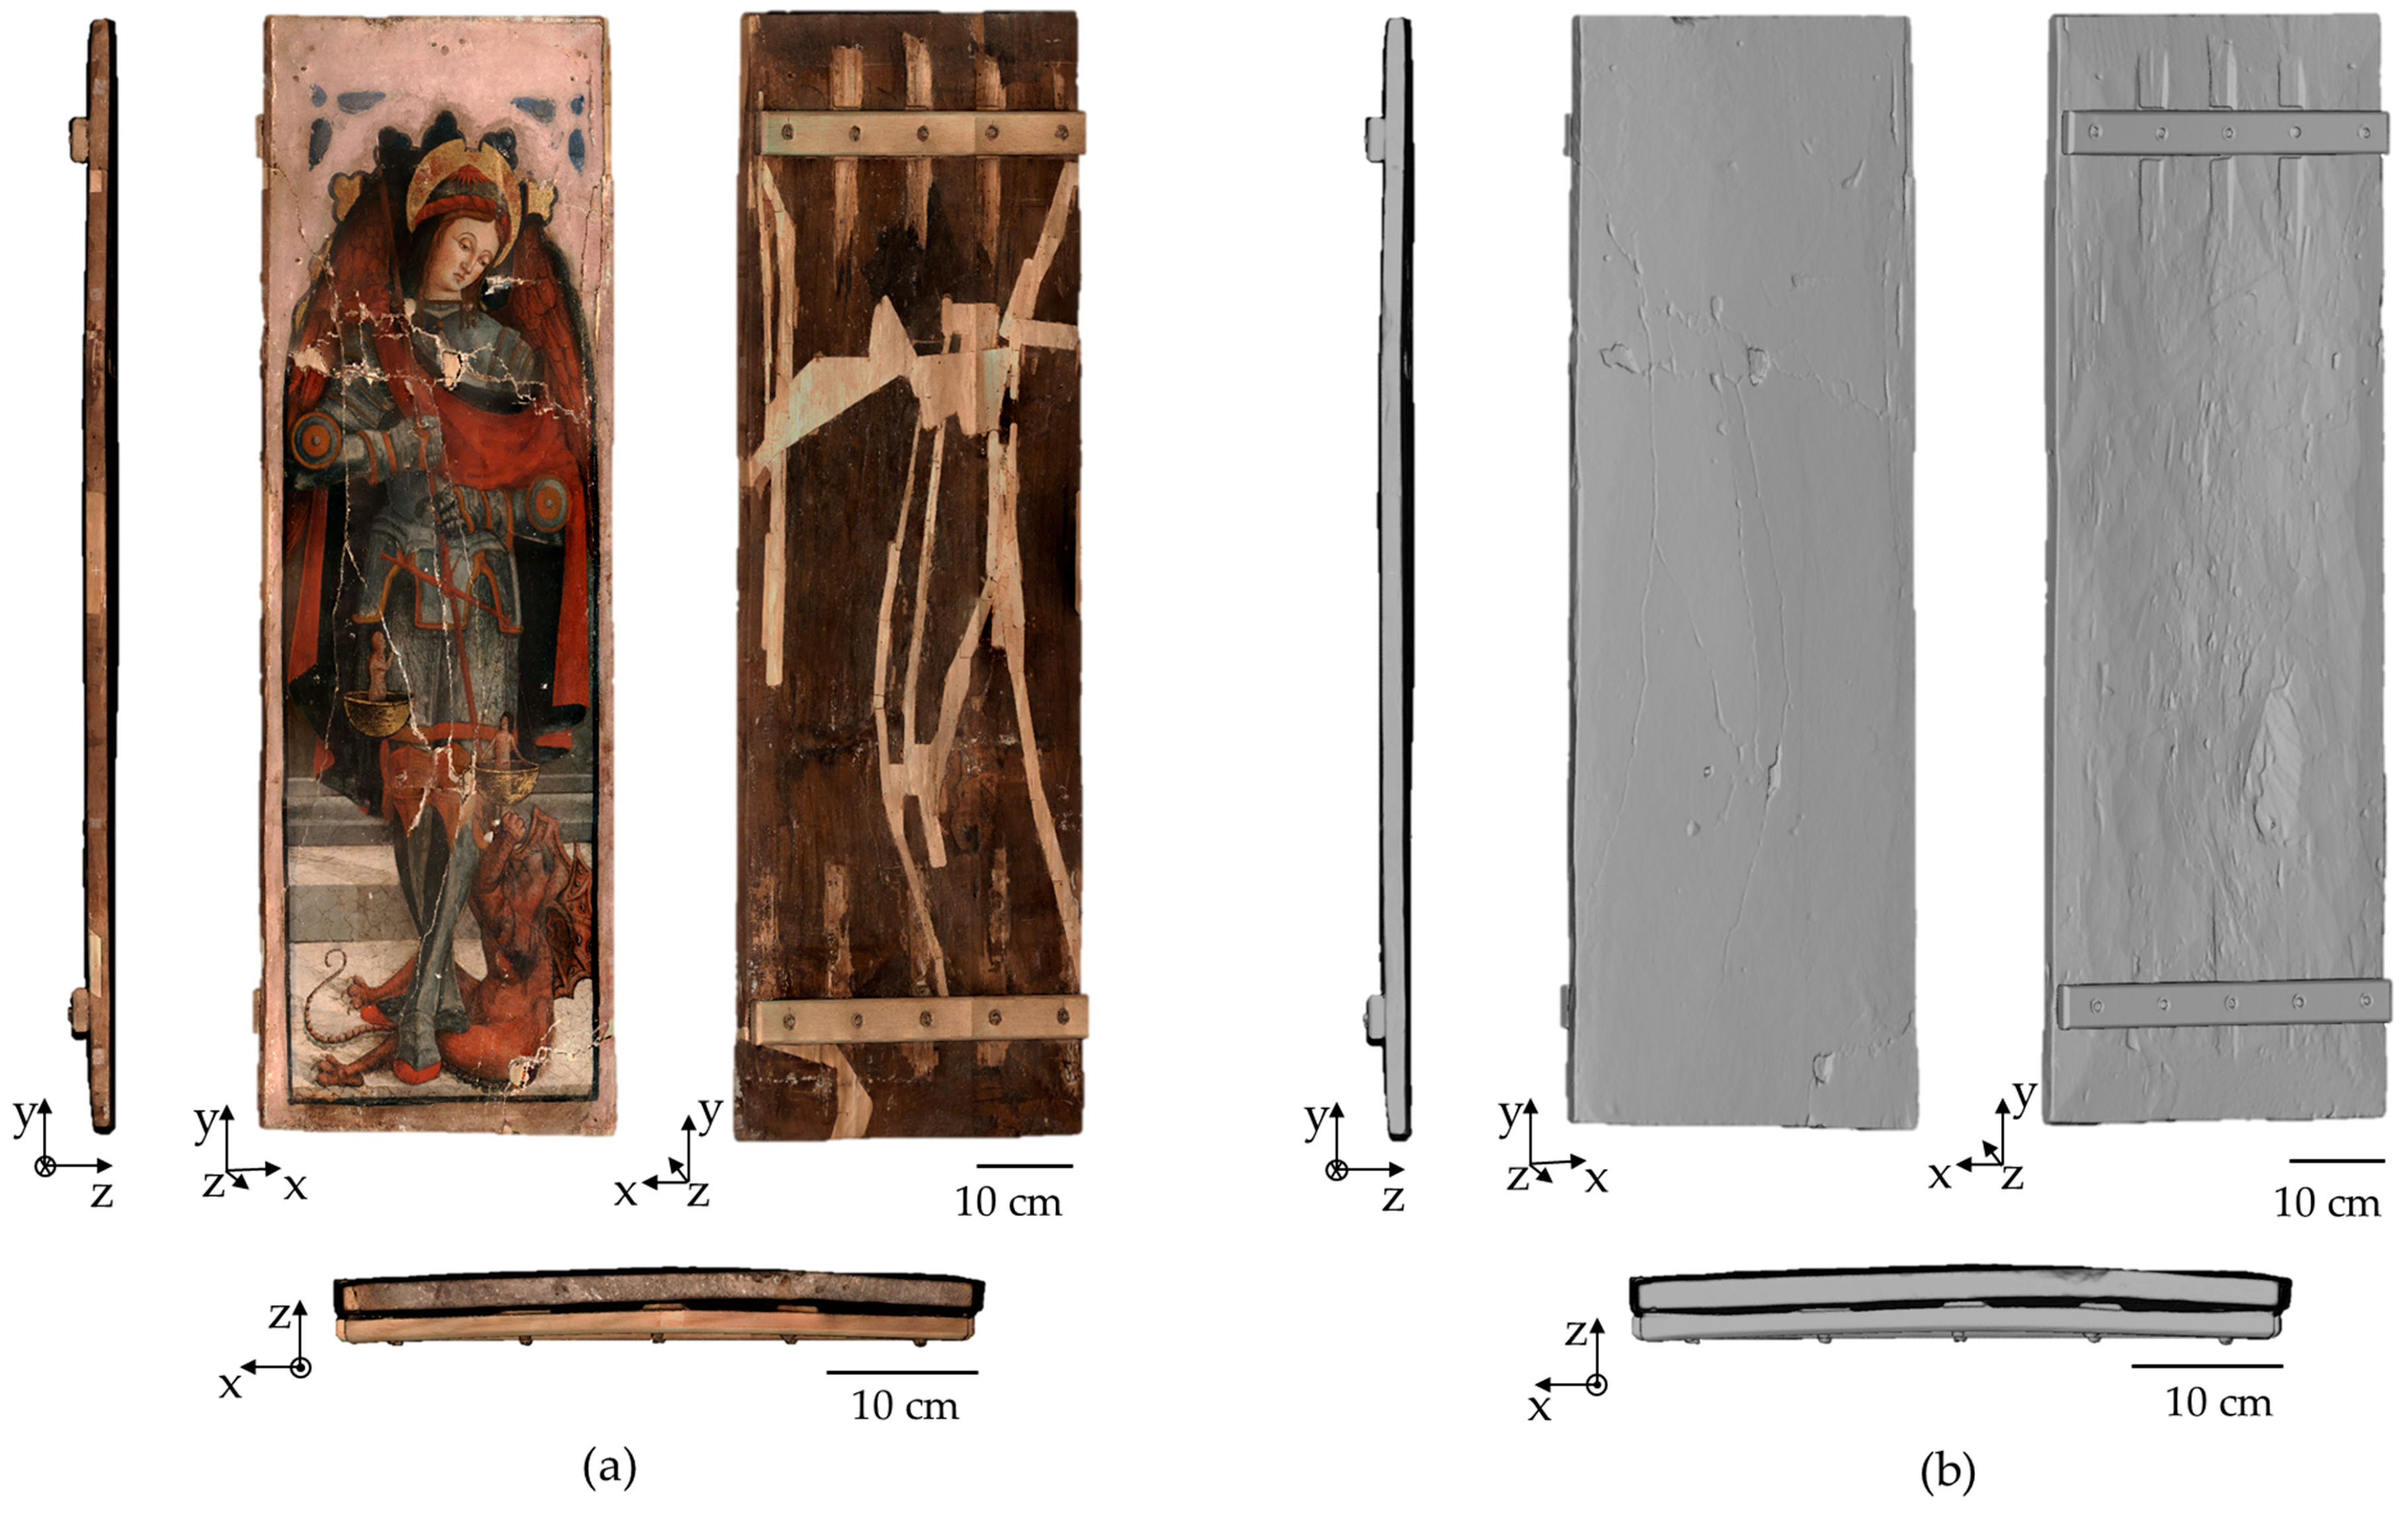
2.3. Structured-Light Projection

To generate 3D models of the entire panel, we employed the MICRON3D color structured-light scanner (SMARTTECH 3D, Warsaw, Poland), a mobile device designed for high-resolution digitization of small- to medium-sized objects.
The system projects fringe patterns with variable spatial frequency using a white LED and captures data via two lateral high-resolution CCD cameras (18 Mpx each). Key specifications include field of view: 30 × 40 cm; depth of field: 20 cm (optimal working distance: 70 cm); system accuracy: 60 µm; distance between points: 80 µm. The scanner is mounted on a tripod with a tilt head for adaptability and features integrated lighting to minimize shadows. A rotary stage (max load: 60 kg, diameter: 50 cm) facilitates multi-angle acquisitions. Data processing was performed using the proprietary SMARTTECH3Dmeasure v.23 software, which records XYZ coordinates and RGB color values for each point, enabling simultaneous surface and texture capture (see Table 1 for full specifications).
The instrument specifications, including a measured axial resolution of less than 50 μm [11], allow for the comprehensive examination of objects with complex geometries, such as severely damaged panels, while maintaining the ability to detect fine details. Moreover, the 70 cm working distance facilitated the placement of the painting on an easel, enabling optimal mobility to acquire data from the front, back, and edges with precision.
We performed measurements at full resolution, yielding a total of 76 and 70 scans for the pre- and post-restoration models, respectively. As previously noted (Section 2.1), the panel before consolidation exhibited missing sections—specifically the lower right corner and a portion of the right edge (Figure 2). The recovery of these fragments near the panel following the earthquake enabled their separate scanning via turntable, requiring 19 and 18 acquisitions, respectively. All models were processed using the proprietary software through the following systematic workflow: initial point cloud refinement involving manual removal of noise artifacts; subsequent data alignment through registration of individual scans into a unified coordinate system based on a minimum of three homologous reference points; optimized point cloud simplification employing homogeneous reduction and overlap removal with an 80 µm radius threshold to maintain resolution while ensuring manageable data size; and final surface reconstruction through triangulated mesh generation with integrated texture mapping. The resulting 3D models, representing both pre- and post-restoration states, are shown in Figure 2 and Figure 3, respectively.

2.4. Laser-Scanning Microprofilometry

To evaluate restoration effects on the pictorial layers, we employed an optical microprofilometer developed in-house by the Heritage Science Group (National Institute of Optics—CNR).
The system consists of a ConoPoint-10 laser probe (Optimet, Jerusalem, Israel) mounted on two motorized linear stages (precision of 0.1 µm), allowing a maximum scanning area of 300 × 300 mm2. The probe can be equipped with different focal length lenses; in this study, the instrument configuration with a 50 mm lens set a working distance of 44 mm, a depth of field of 8 mm, and a spot diameter of 37 µm (at beam waist). The instrument accuracy is 6 µm (see Table 1 for full specifications). The system generates high-resolution topographic maps exportable as either 3D models (.ply format) or grayscale/color images. High-resolution grazing-light images can also be created by simulating the direction of the impinging light on the model to enhance surface morphology details and improve resolution over traditional photography.
The instrument was chosen based on its lateral and axial resolution, which are critical for identifying micrometric surface features such as detachments and craquelure. The lens selection was driven by the requirement to optimize resolution while maintaining an appropriate depth of field, taking into account the specific characteristics of the selected regions of interest (ROIs).
Conservators identified four 10 × 10 cm2 ROIs for detailed analysis. To maintain positional consistency between pre- and post-restoration scans and facilitate accurate alignment, each ROI was outlined using adhesive paper tape, a conservation-approved material. High-resolution 3D surface models were acquired with a sampling step of 20 µm along both X and Y axes, for a total of nearly 25,000,000 points and 50,000,000 faces per ROI. For quality control, the reference sample (Figure 1b) underwent duplicate scanning under identical conditions (50 mm lens and 20 µm sampling step yielding 2,250,000 points and 4,500,000 faces). Scans were performed with minimal time separation to eliminate environmental effects. To replicate real-world measurement conditions between restoration phases, the probe-sample orientation was altered between acquisitions to simulate actual operational variables.
For all microprofilometric models, the raw data underwent form removal through 1st order least-squares fitting to derive the conditioned surface representation.

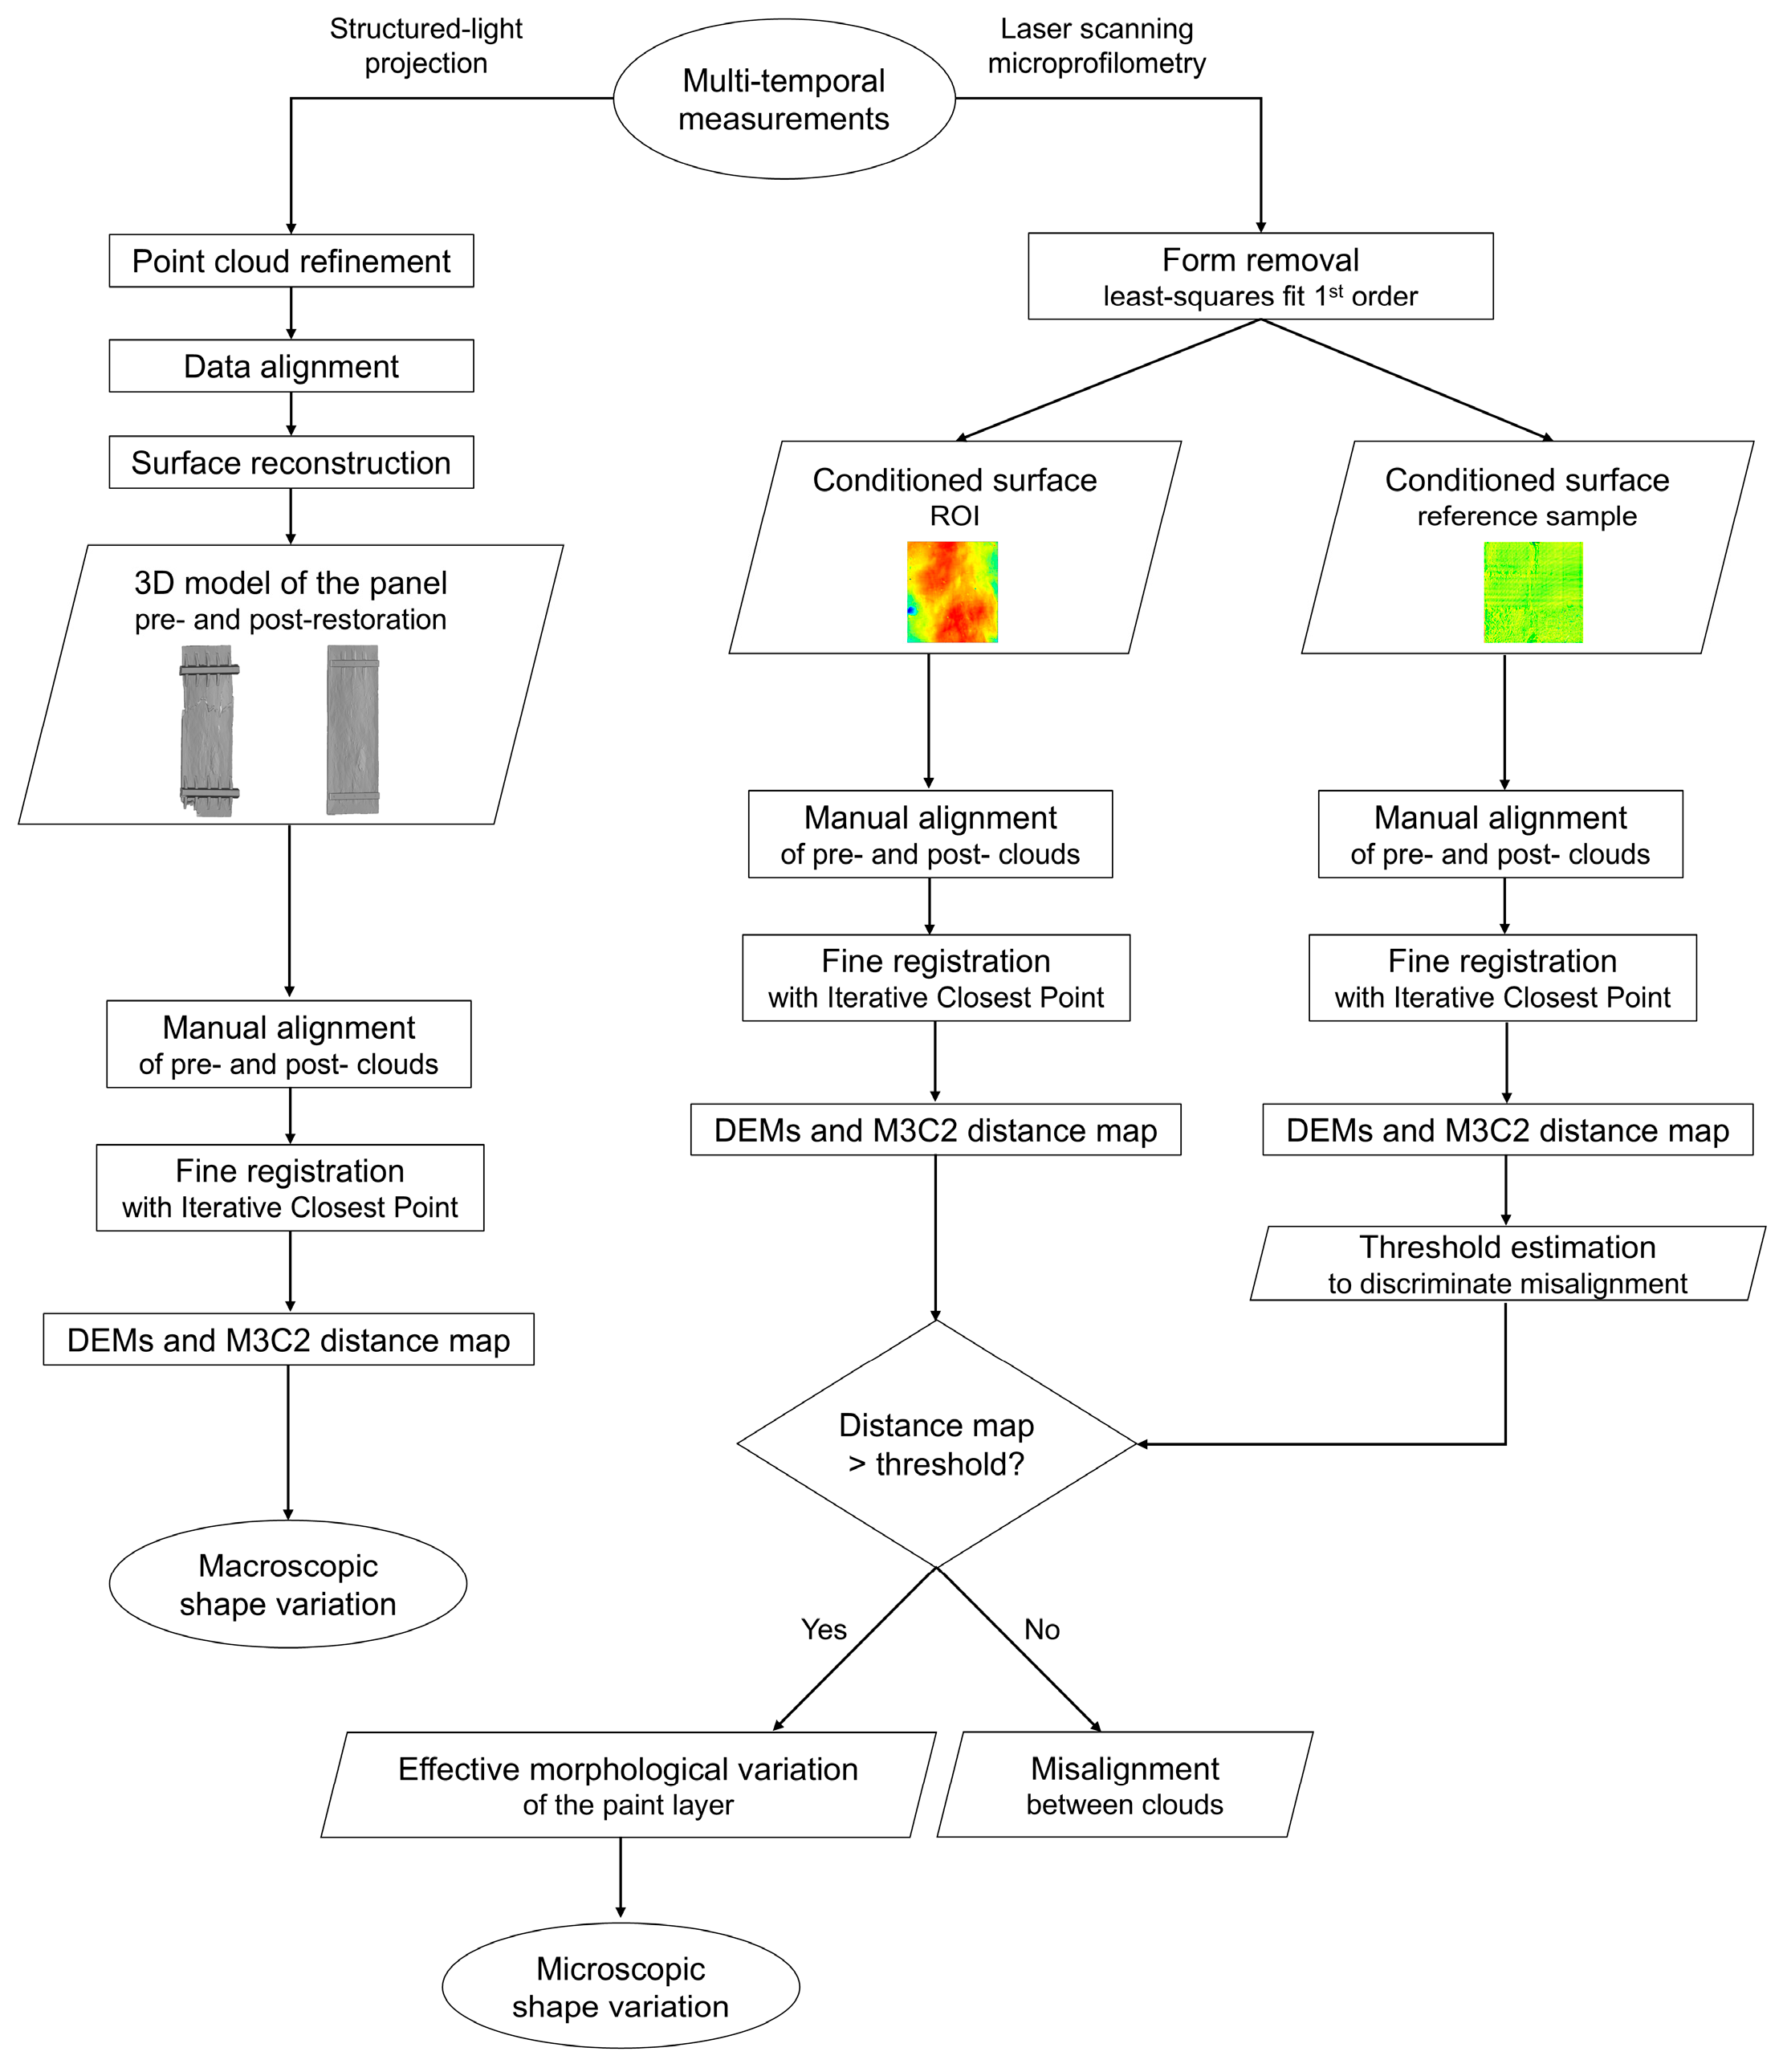
2.5. Point Cloud Data Processing

Differences between multitemporal point clouds of an object can be derived from distance-based, machine, and deep learning methods [29]. This study employs distance-based techniques for analyzing differences between multitemporal point clouds, offering a flexible approach without requiring datasets for the time-consuming training of AI models. The methodology incorporates rigorous uncertainty quantification to distinguish meaningful changes (where magnitude exceeds uncertainty thresholds) from non-significant variations (where changes fall within uncertainty bounds). Key uncertainty sources systematically evaluated include point cloud registration errors, surface roughness characteristics, and range-dependent positional inaccuracies [30]. To comprehensively evaluate both macroscopic and microscopic changes resulting from the conservation treatment, we implemented a multi-scale analytical approach using point cloud data (Figure 4). Our methodology combined qualitative assessments with quantitative measurements through two primary analytical outputs: Digital Elevation Models (DEMs) and Multiscale Model to Model Cloud Comparison (M3C2) distance maps.
All data processing was performed using CloudCompare (v.2.12.4, https://www.danielgm.net/cc/, accessed on 20 January 2025), beginning with coarse alignment using manually identified corresponding points between pre- and post-restoration point clouds. We then refined the registration using the Iterative Closest Point (ICP) algorithm (20 iterations, RMS convergence threshold of 10−5), consistently referencing the pre-restoration scans as our baseline.
The DEMs provided us with a powerful visualization tool, transforming our 3D point clouds into detailed elevation maps where each pixel’s color intensity corresponds to precise height values [31,32,33,34]. We carefully tailored the resolution of these models (80 μm for structured-light scanning data and 20 μm for microprofilometer data) to match each instrument’s native spatial resolution, ensuring optimal data fidelity.
We employed the M3C2 algorithm, an advanced technique that calculates signed and robust distances between two point clouds (one arbitrarily chosen as a reference), to evaluate the changes over time due to the restoration intervention. The algorithm is based on projecting a cylindrical neighborhood around each reference point. This dual-directional approach (forward and backward along the local normal vector) yields signed distance values: positive for outward displacements and negative for inward displacements relative to the reference surface. These measurements are then visualized as a color-coded displacement map, where hue variations quantitatively represent morphological changes [30,35,36,37]. The M3C2 algorithm calculates a confidence interval for each distance measurement based on the roughness and alignment errors of the clouds. The directional analysis is performed by computing normal vectors at each point using a defined normal scale parameter D, which establishes the local neighborhood for fitting an optimal plane through least-squares minimization of orthogonal point-to-plane distances. To minimize the influence of local roughness and ensure a good fit of the optimal plane, we set D to 1.5 mm. The number of points and the standard deviation σ of their orthogonal distances from the best-fit plane are then used to estimate the uncertainty associated with each measured difference. This is performed by quantifying a locally variable level of detection (LoDetection), which also accounts for alignment errors between point clouds. LoDetection is calculated at a 95% confidence level using a statistical t-test, assuming normally distributed errors [36].
To validate our methodology’s sensitivity and confirm our ability to distinguish genuine surface changes from measurement artifacts at the micron scale through M3C2 maps, we measured and analyzed the painted mock-up (see Section 2.2) as a control sample. Given that approximately 68.26% of the values fall within one standard deviation of the mean, we used σ of the distance distribution observed in the control sample as a threshold for uncertainty assessment to distinguish between misalignments (registered displacement less than or equal to the threshold) and actual changes in surface morphology (registered displacements exceeding the threshold).
Building on our previous work [27,28], we quantified panel warping in the pre- and post-restoration clouds through the computation of deformation vectors (known as ‘warping arrows’, which correspond to the height of a circular segment when the section of the point cloud is considered as a circumference). This involved extracting four cross-sections from the microprofilometer ROIs and calculating ten times the deformation vectors relative to the ideal plane.

3. Results

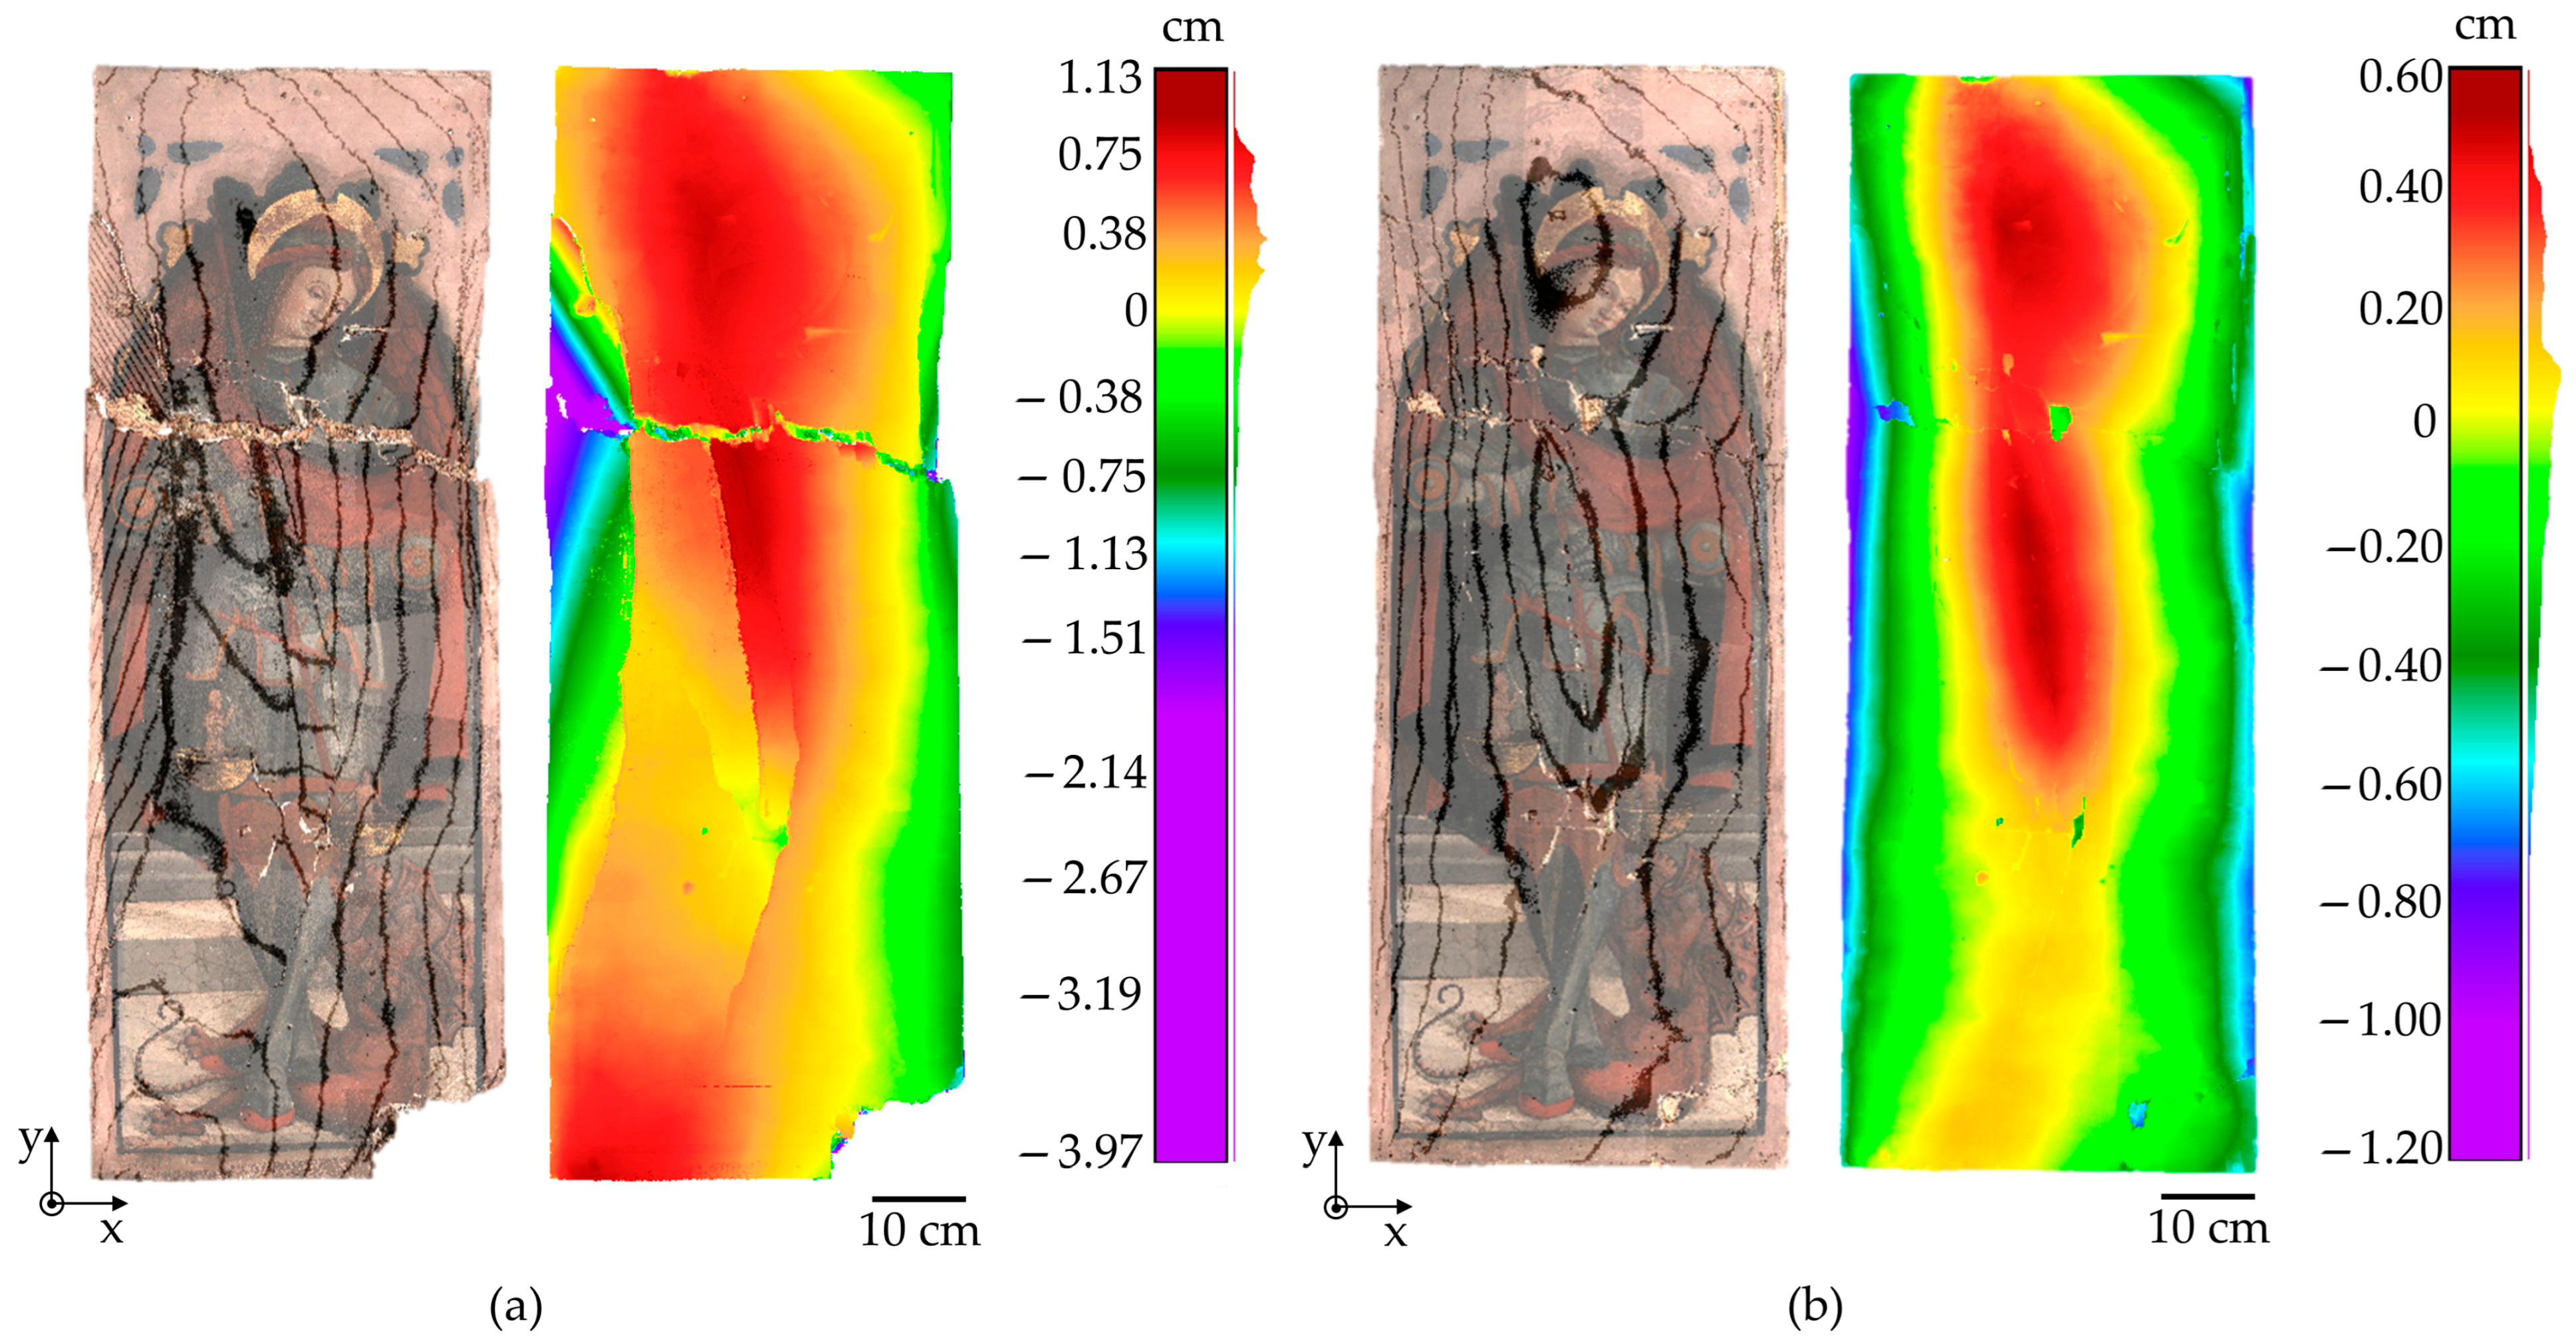
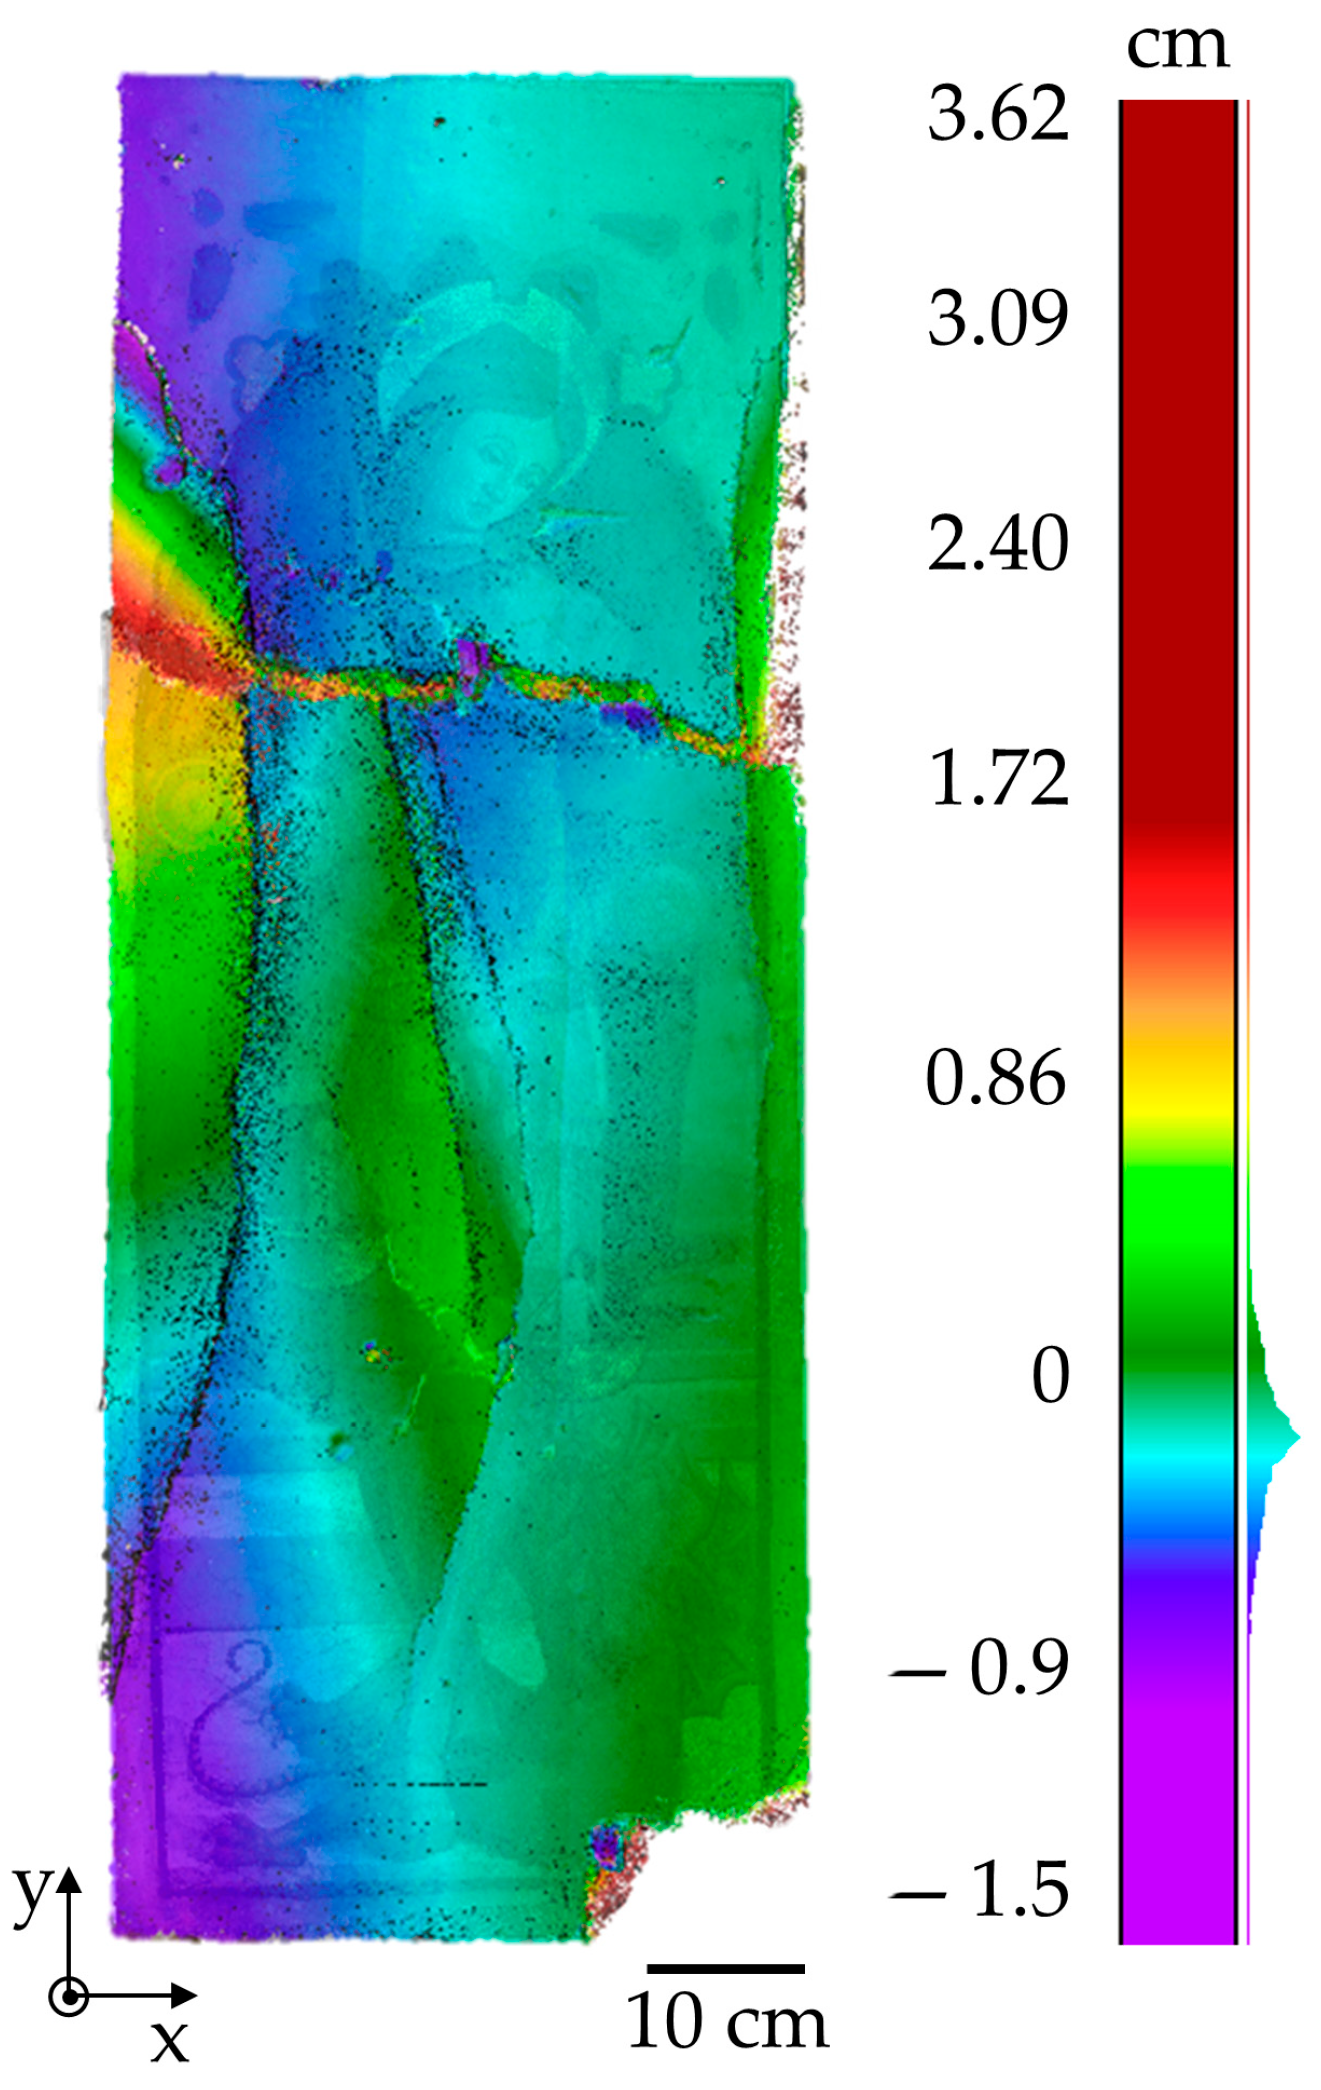
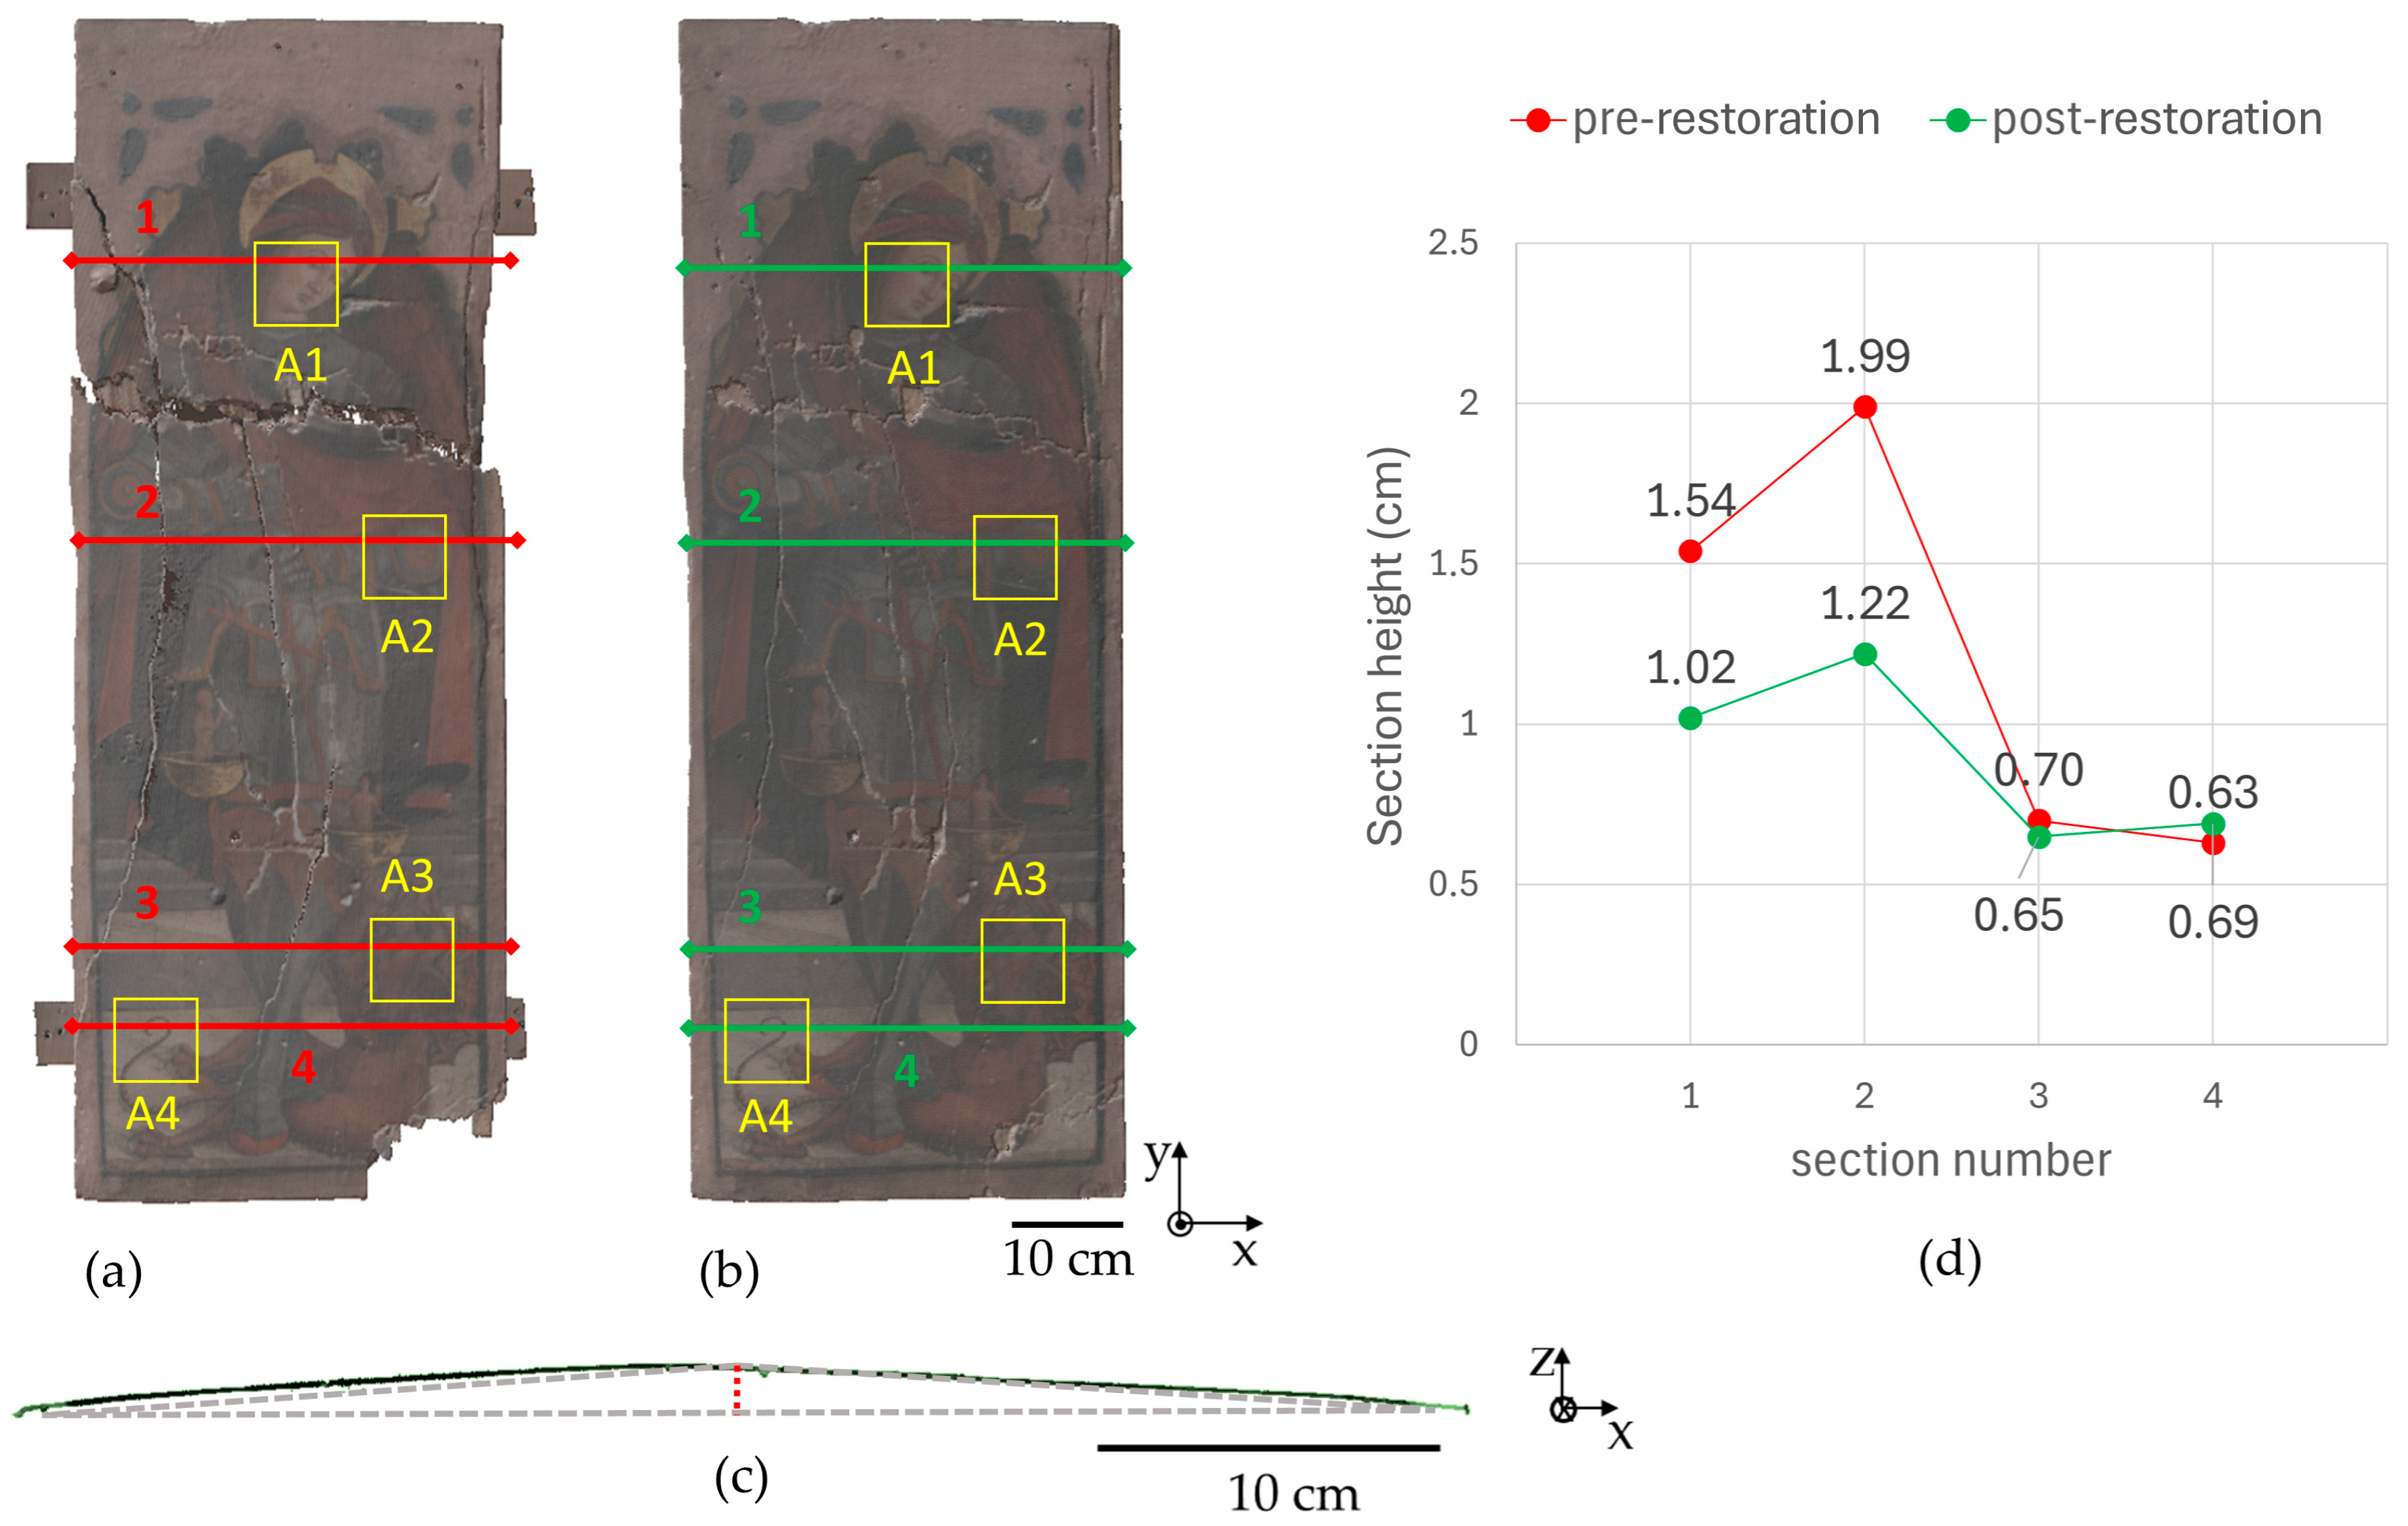
3.1. Analysis of the Panel Shape: Macroscopic Deformation

The structural stability of wooden supports in panel paintings is a critical factor in preserving the integrity of the artwork. As the support restoration necessarily induces shape variations in the wooden substrate, a precise evaluation of these deformations is essential, as they may generate mechanical stresses that propagate to the paint layer, potentially leading to cracking, delamination, or other forms of deterioration. The comparative analysis of pre- and post-restoration 3D models allowed for a quantitative assessment of macroscopic deformations induced by the conservation treatment. Figure 5 displays the DEMs derived from structured-light scanning, with a color scale where zero corresponds to the reference plane used for elevation measurements. To enhance the visualization of altimetric variations, contour lines (isohypses) were extracted from the elevation model and overlaid on the textured point clouds in transparency, facilitating correlation between elevation and color-coded data. The pre-restoration DEM (Figure 5a) highlights cracks across the panel and a pronounced out-of-plane deformation of nearly 4 cm on the left side (indicated in purple), consistent with the side views in Figure 2. In contrast, the post-restoration DEM (Figure 5b) shows that the seismic-induced deformations have been corrected, leaving only a residual warping of approximately 1.5 cm. The M3C2 distance map in Figure 6 illustrates areas that have been either raised (positive values, indicating post-restoration points above pre-restoration levels) or lowered (negative values) during consolidation. Key examples include the left side, the top and bottom left corners, and the central region traversed by two major cracks.
Figure 7 presents the warping arrow analysis. A comparison between the two point clouds indicates a reduction in panel warping across sections 1 and 2, whereas sections 3 and 4 remain substantially unchanged. It should be noted, however, that the pre-restoration warping arrows may be less reliable due to potential distortions caused by cracks, missing fragments, and out-of-plane deformations. This is especially true for sections 1 and 2 since they were extracted along a segment that includes a very out-of-plane fragment, as seen in Figure 5a. For all sections, the error on the warping arrow value is within the size of the symbol in Figure 7d (ranging from 0.01 to 0.05 cm).

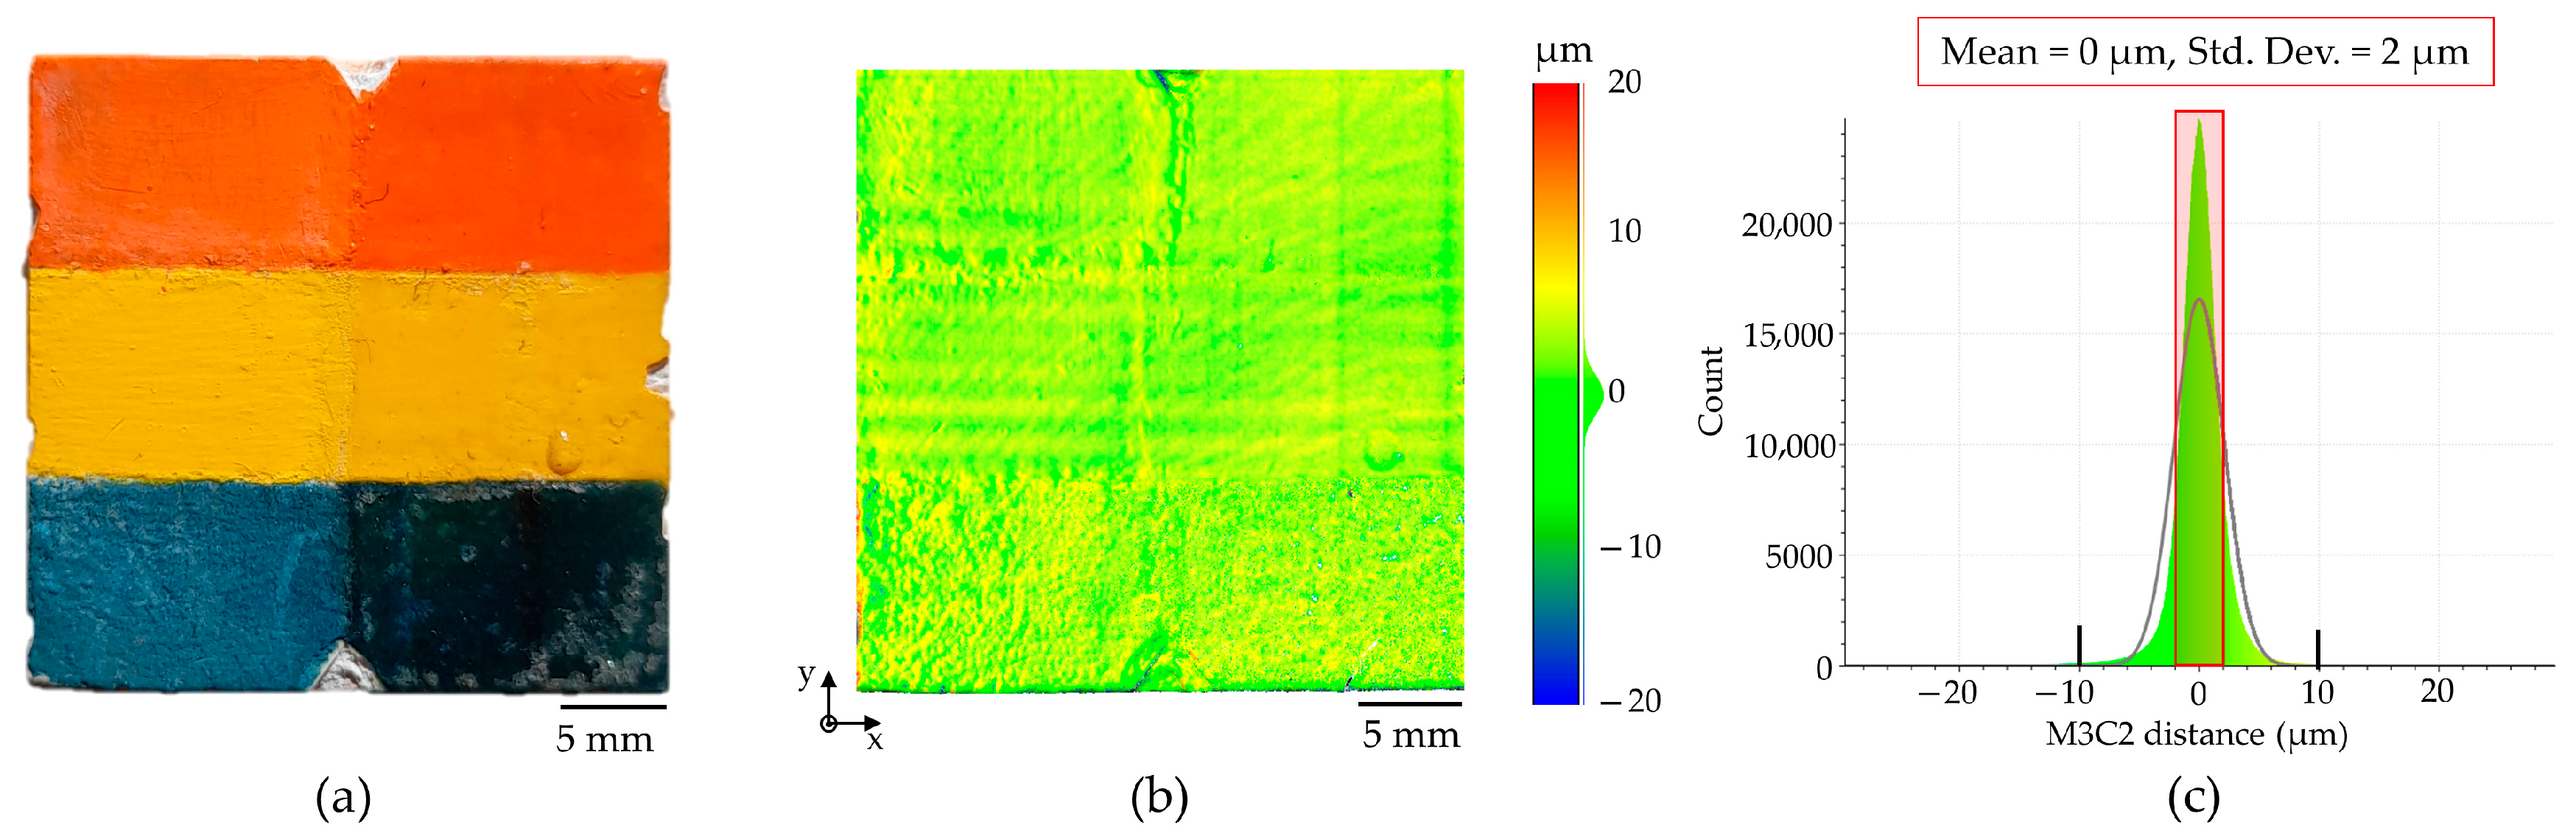
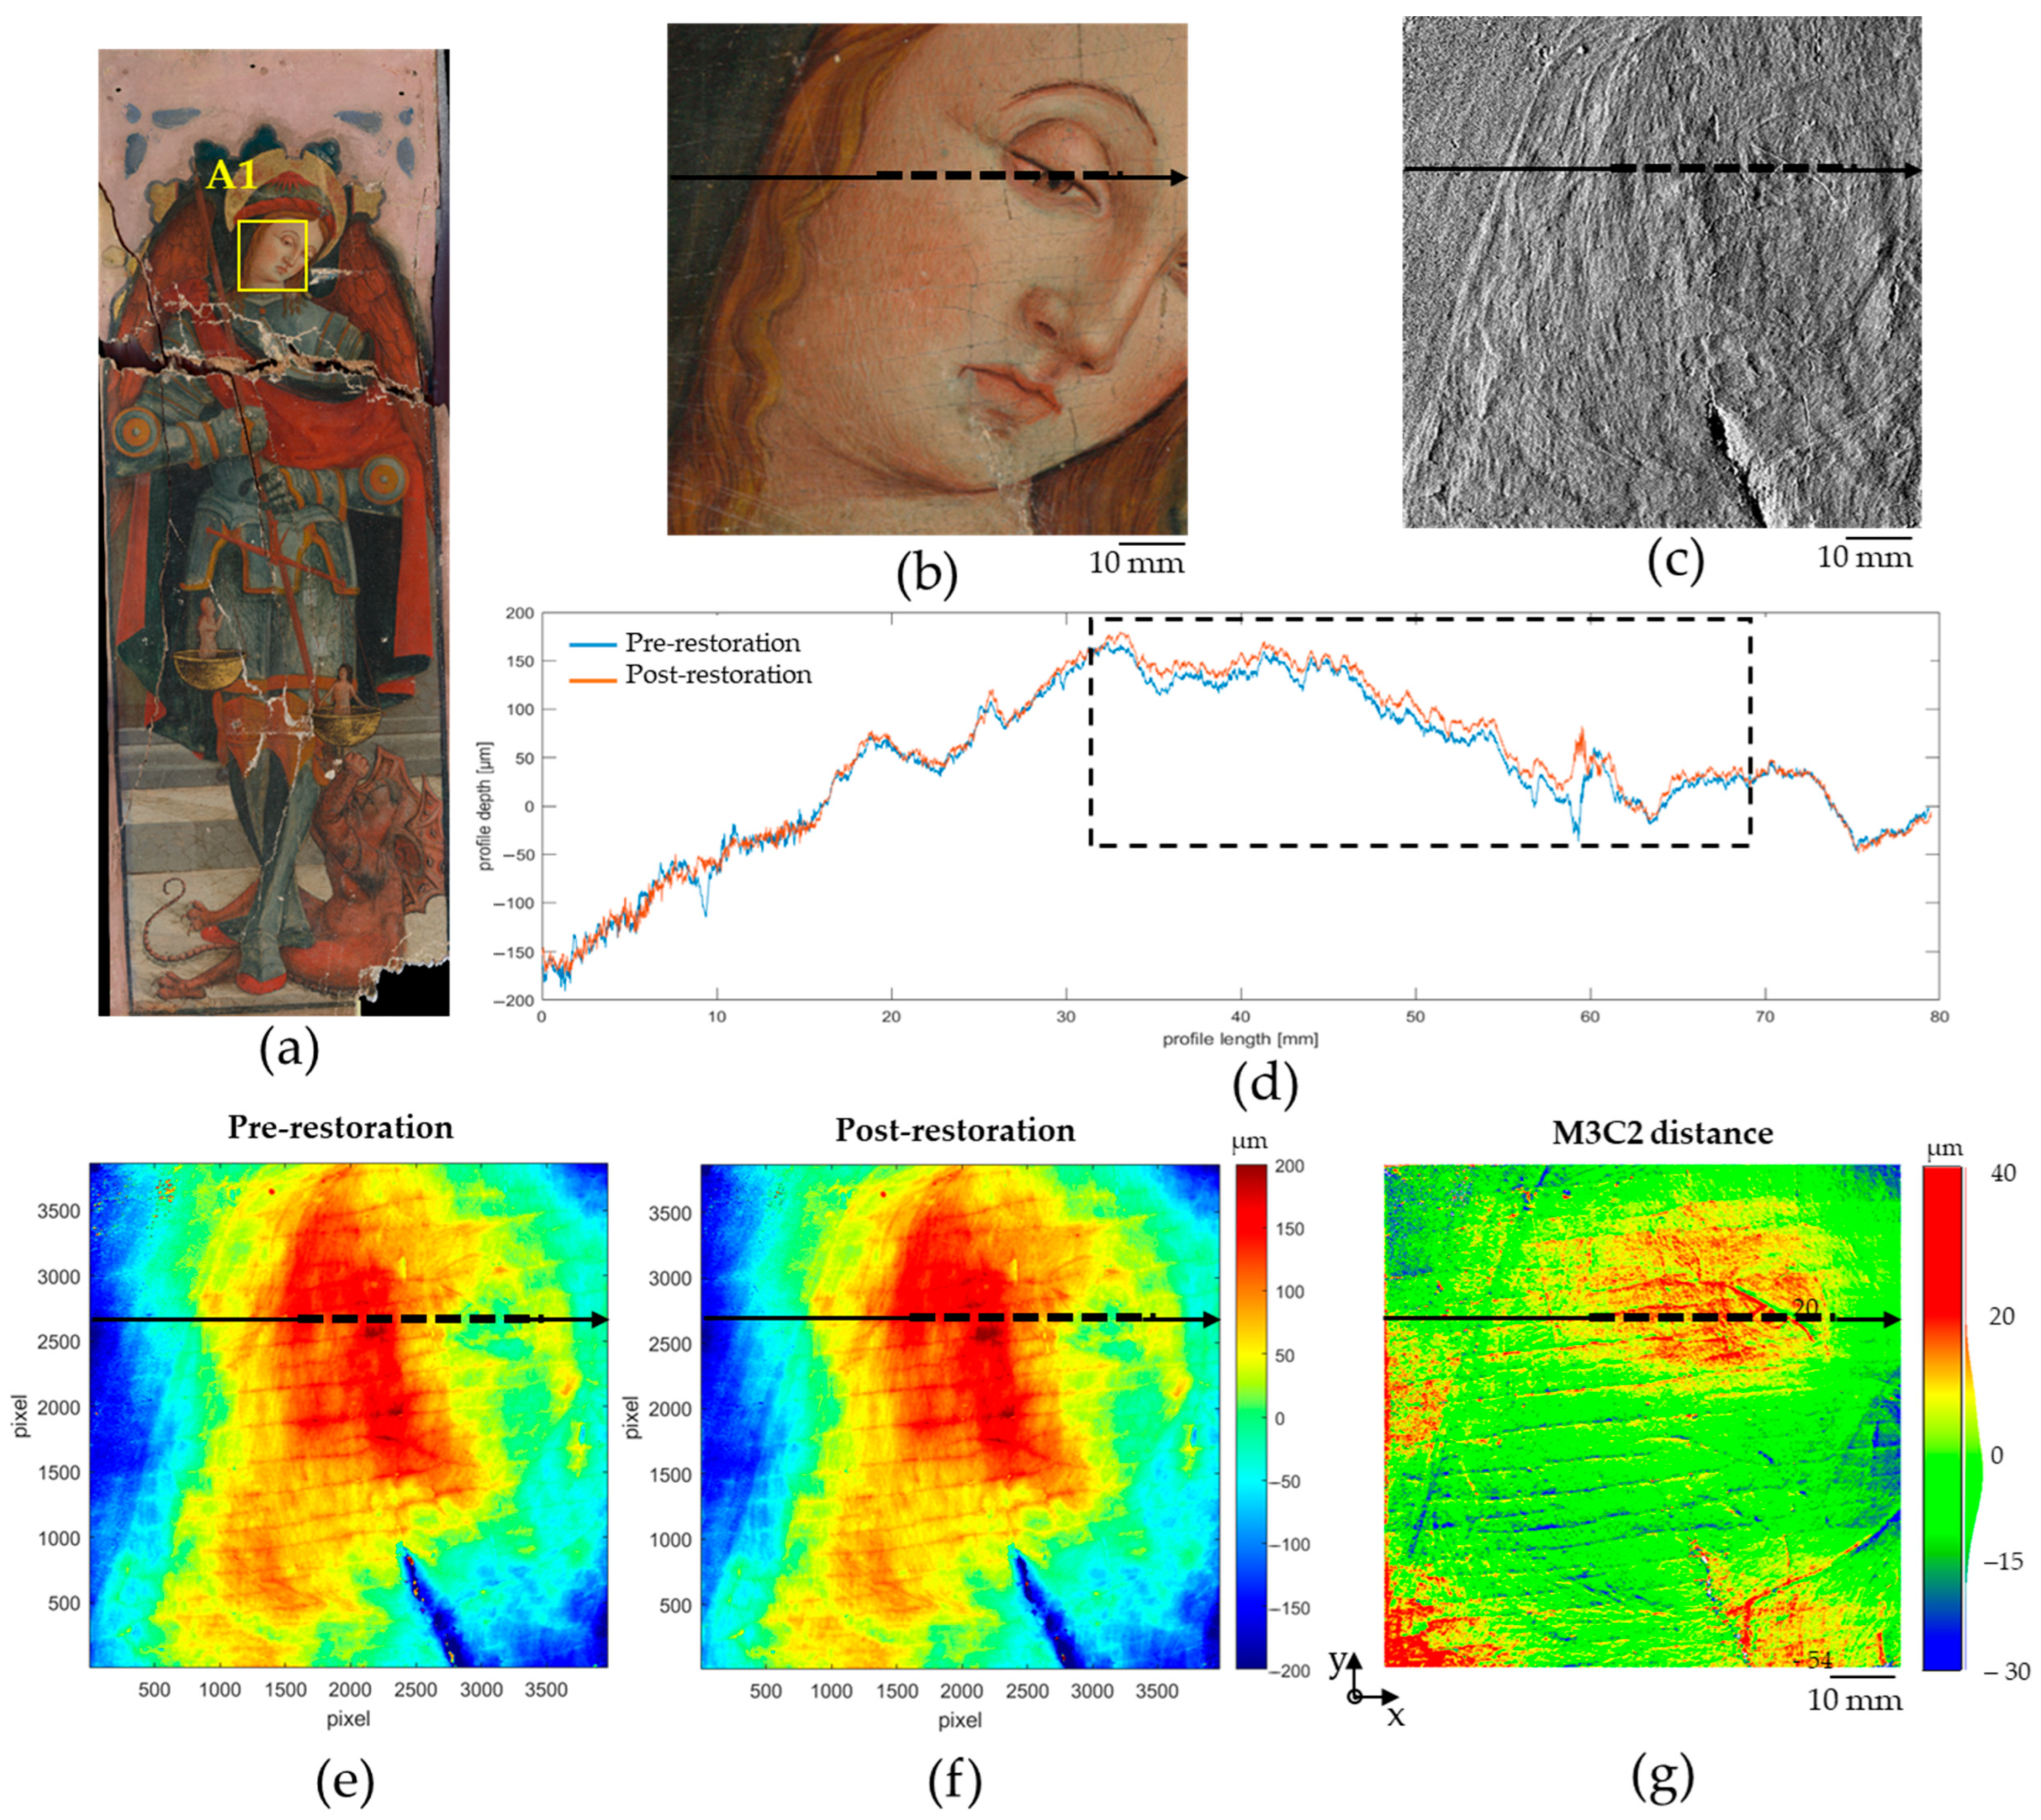
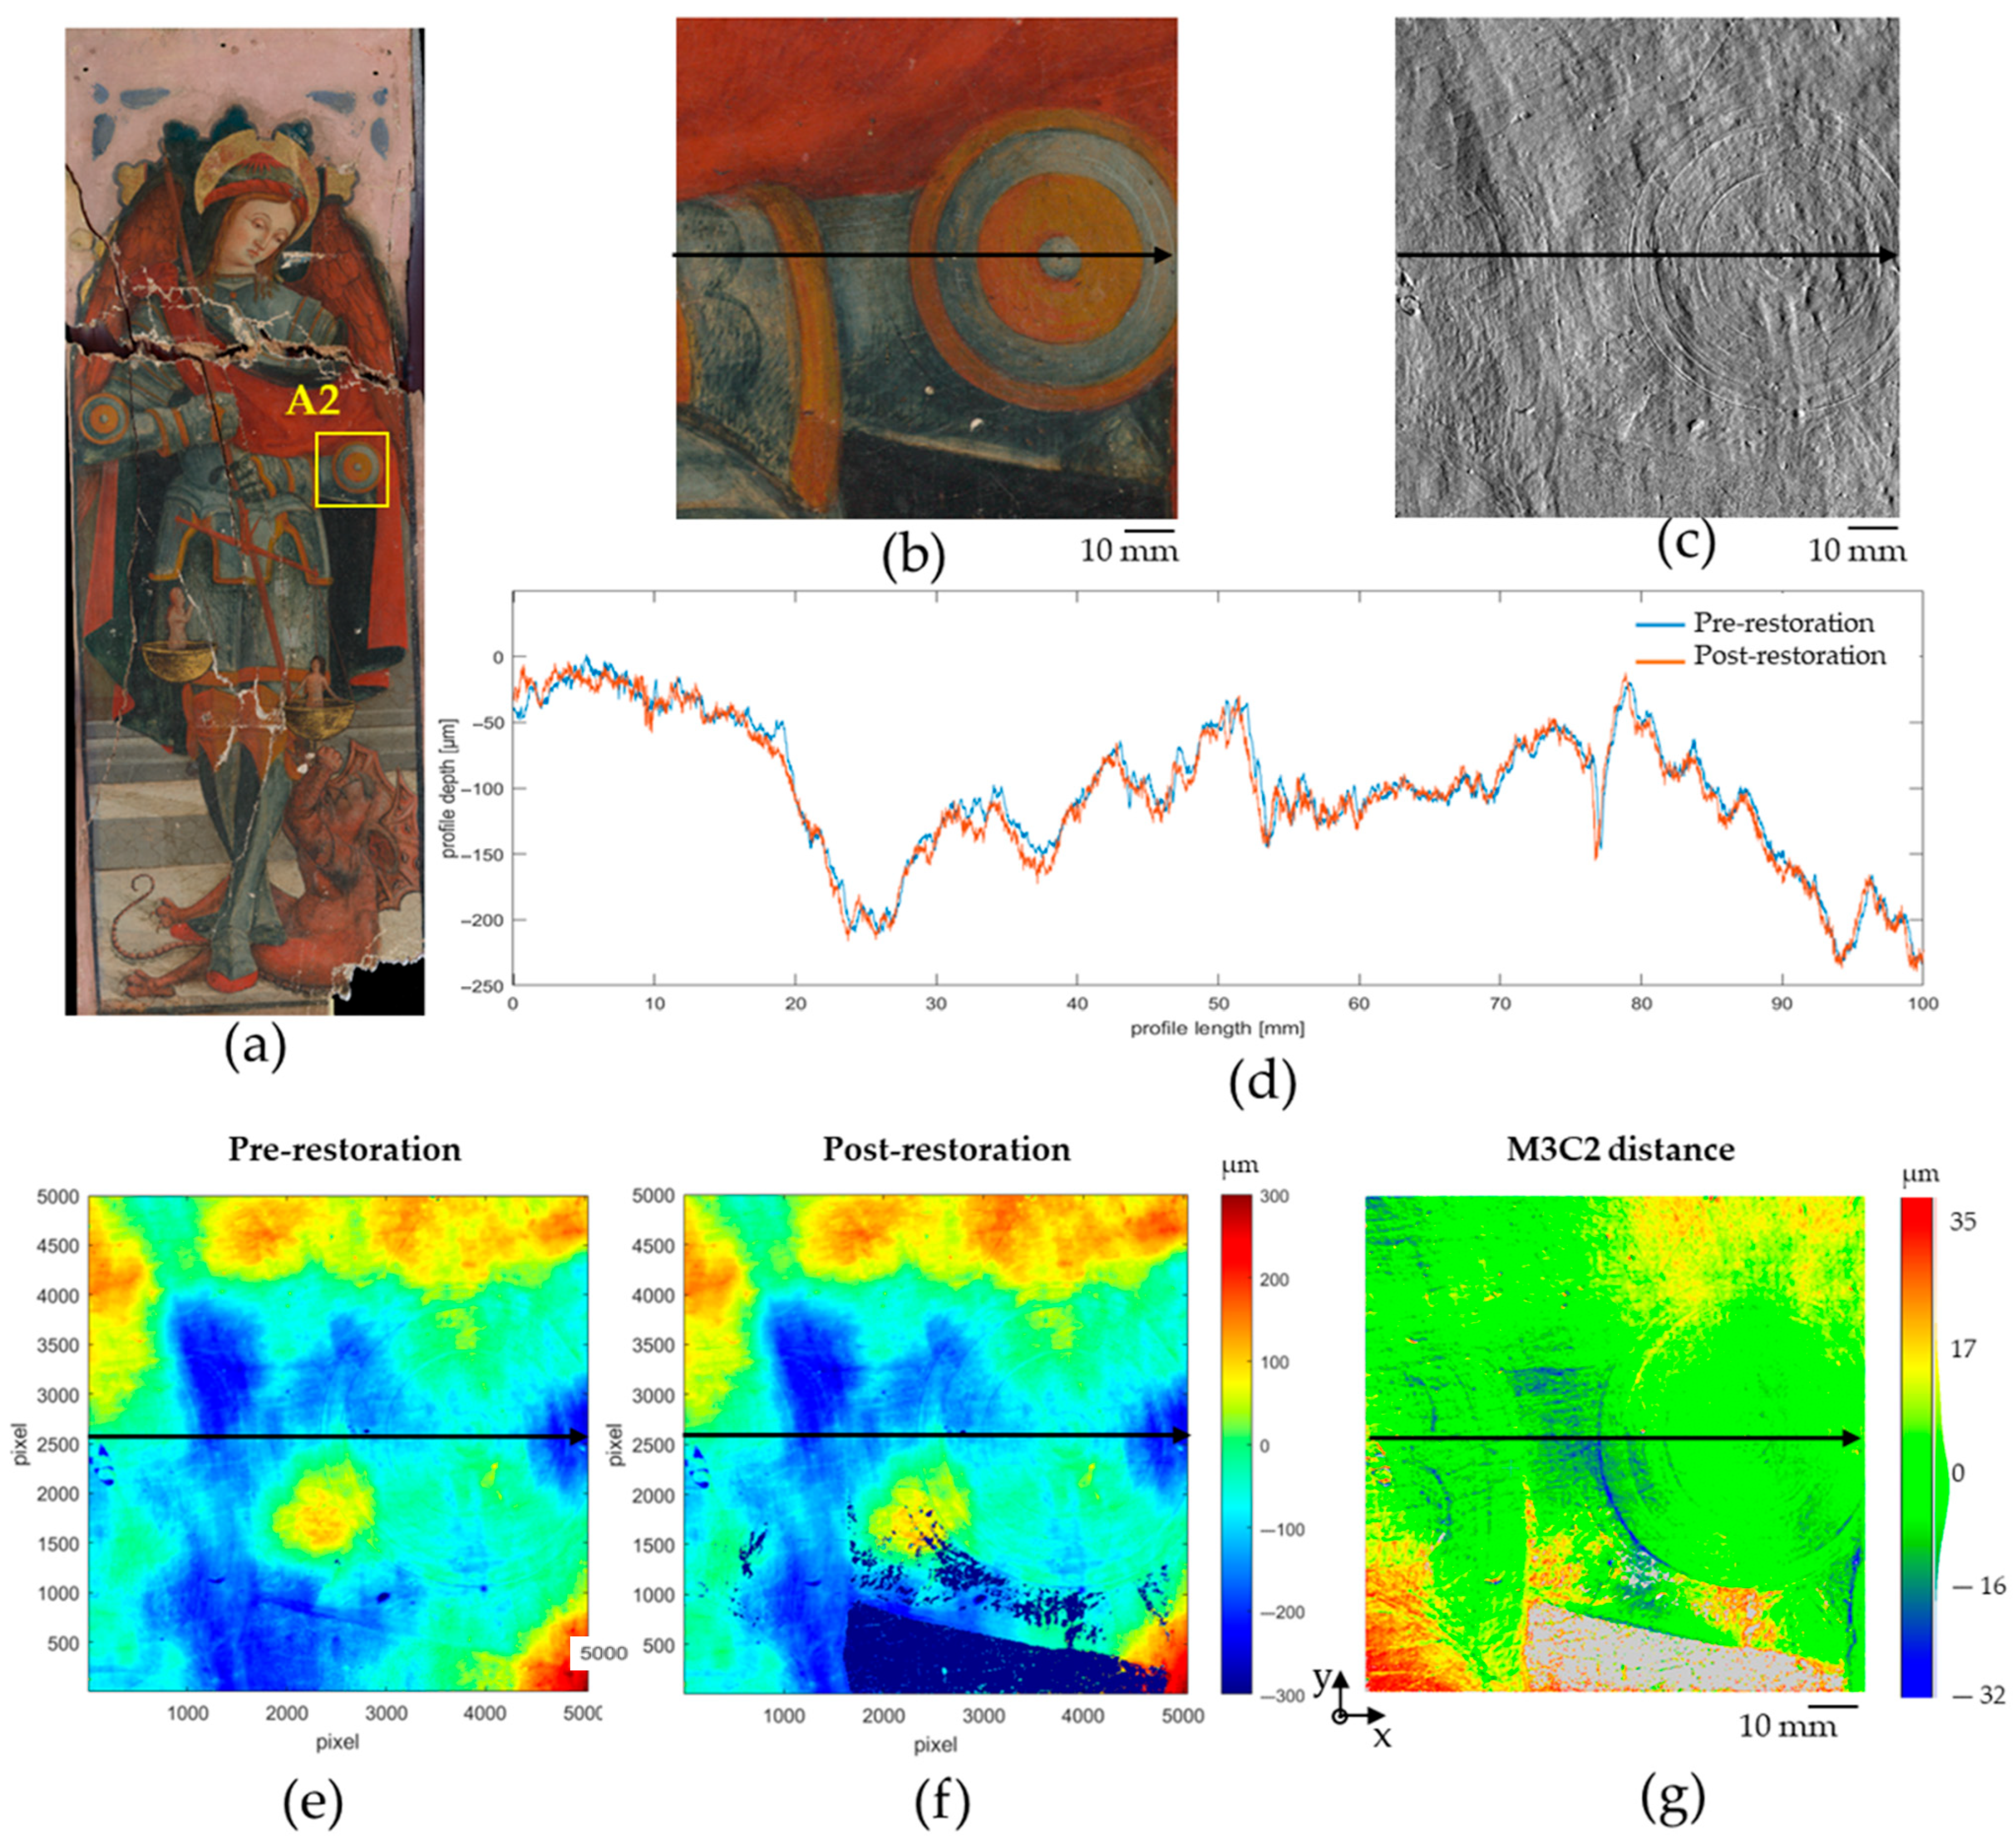
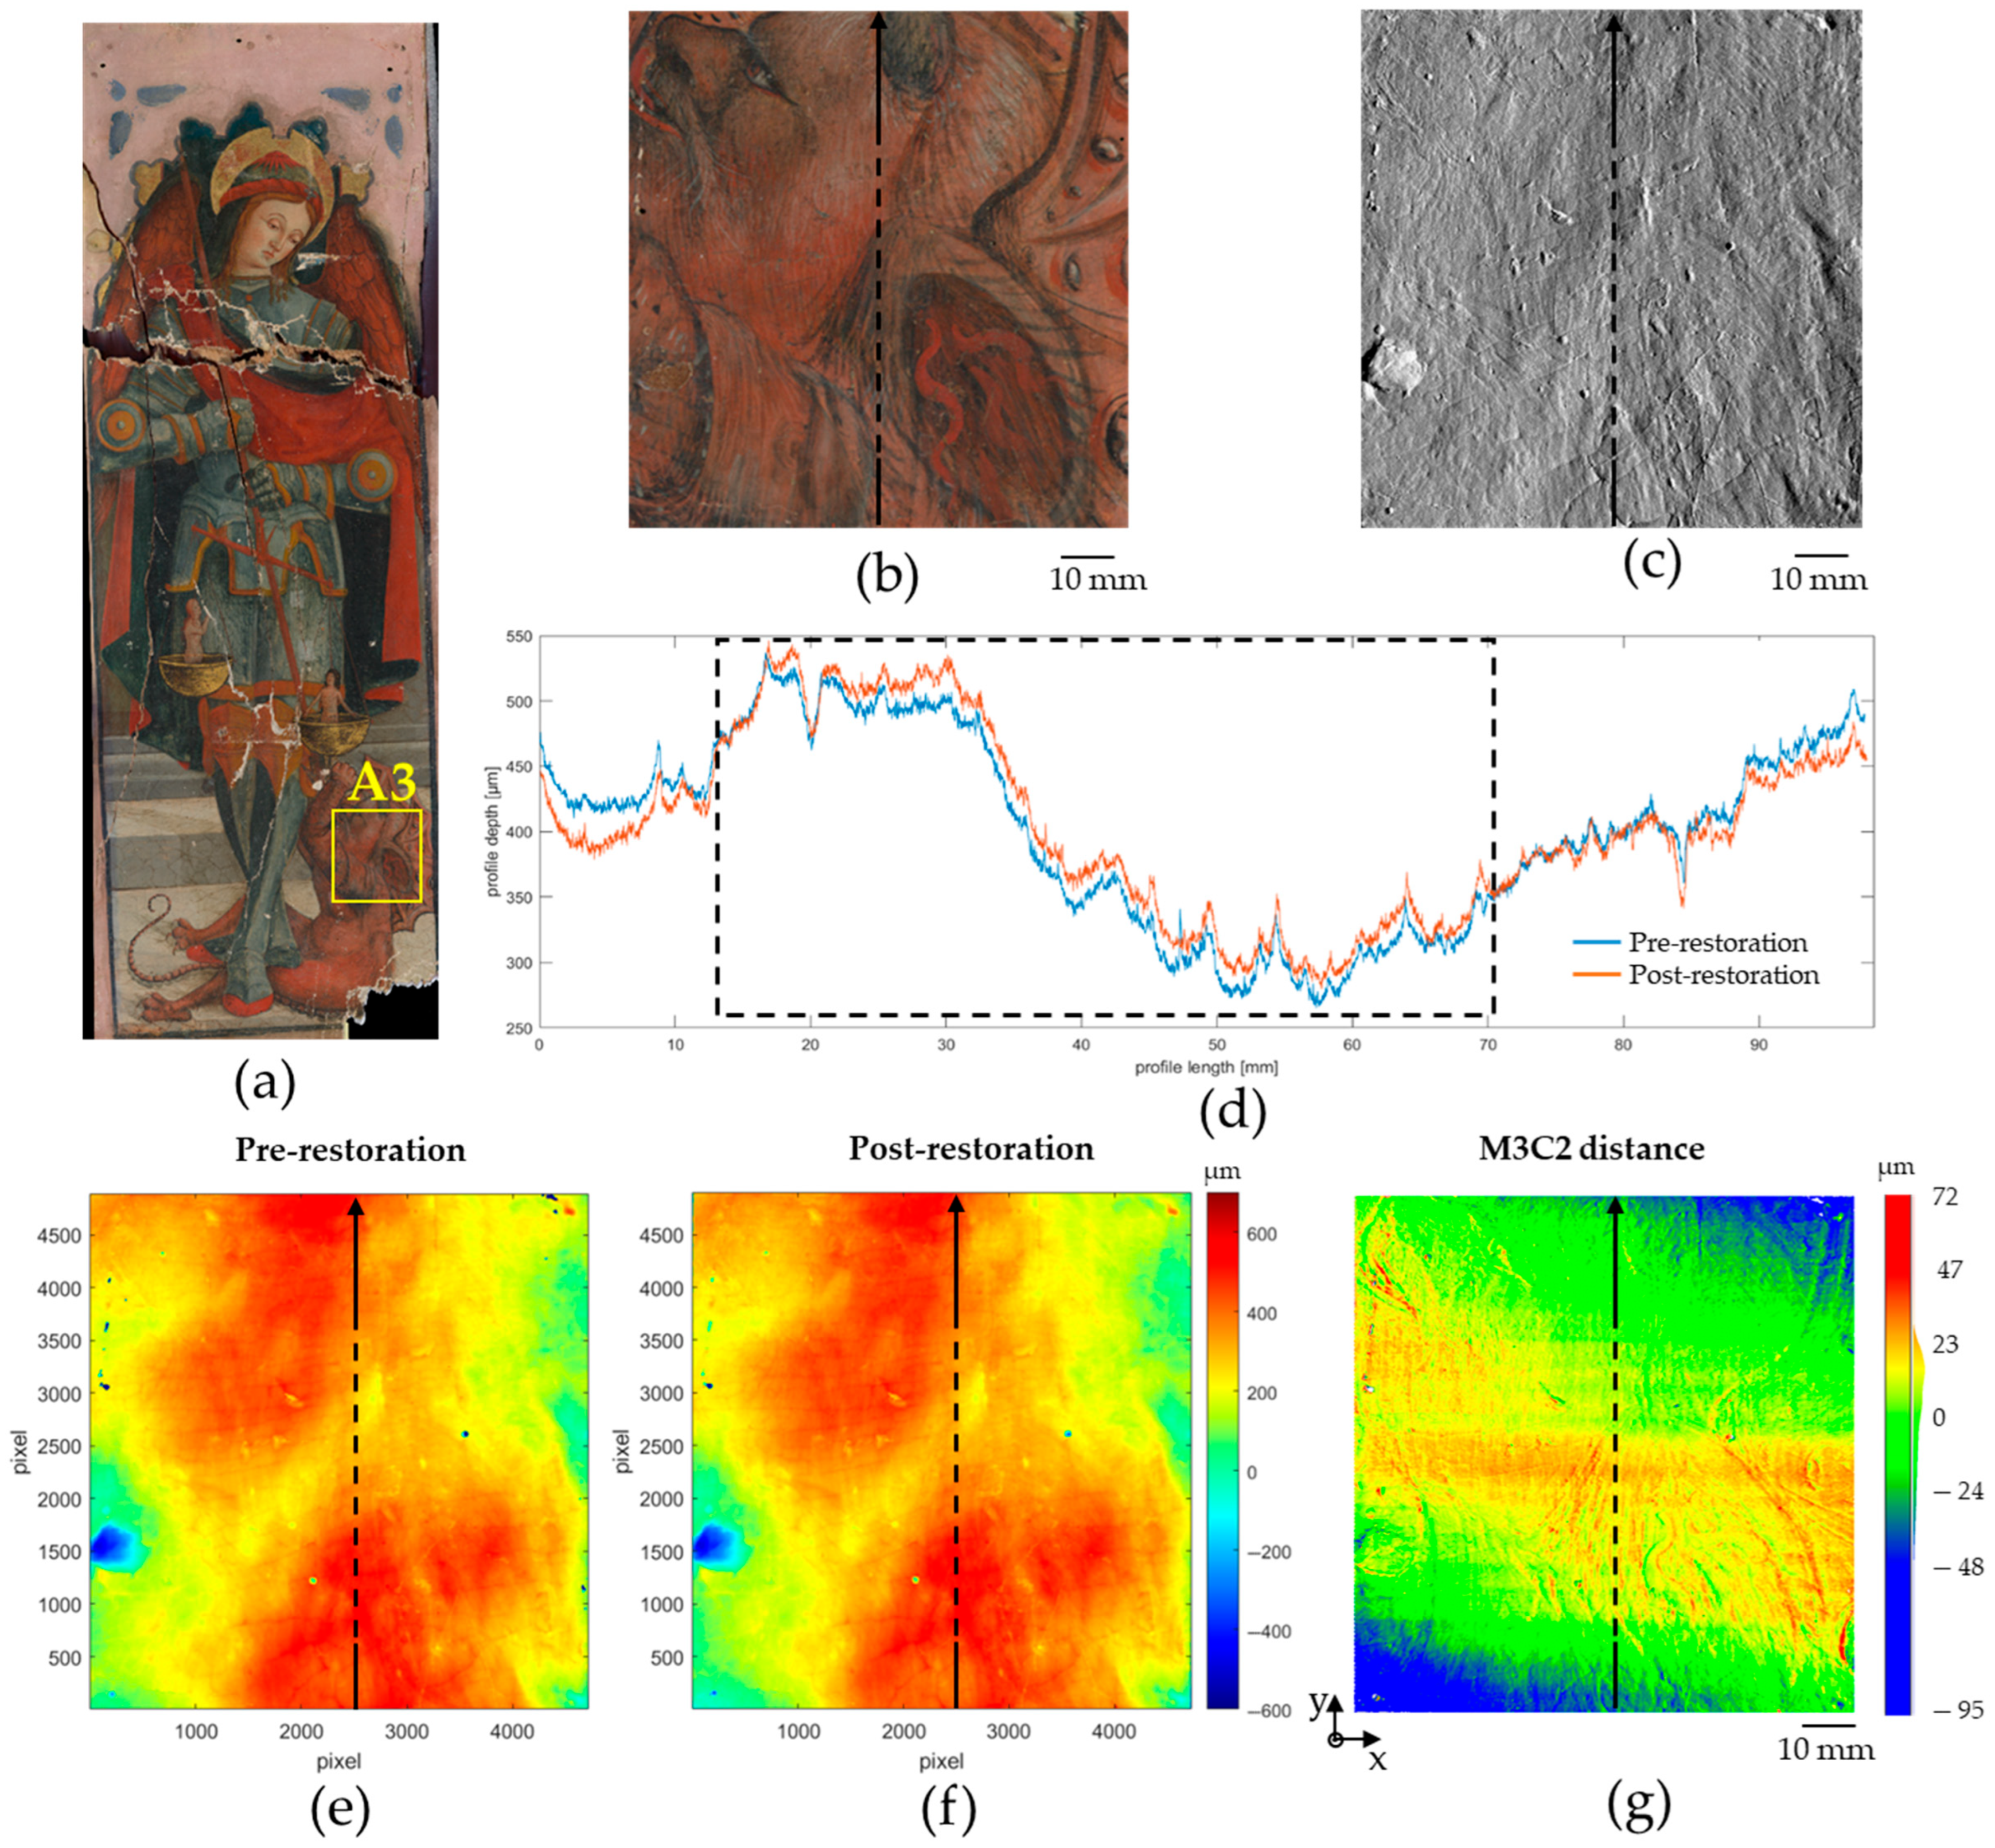
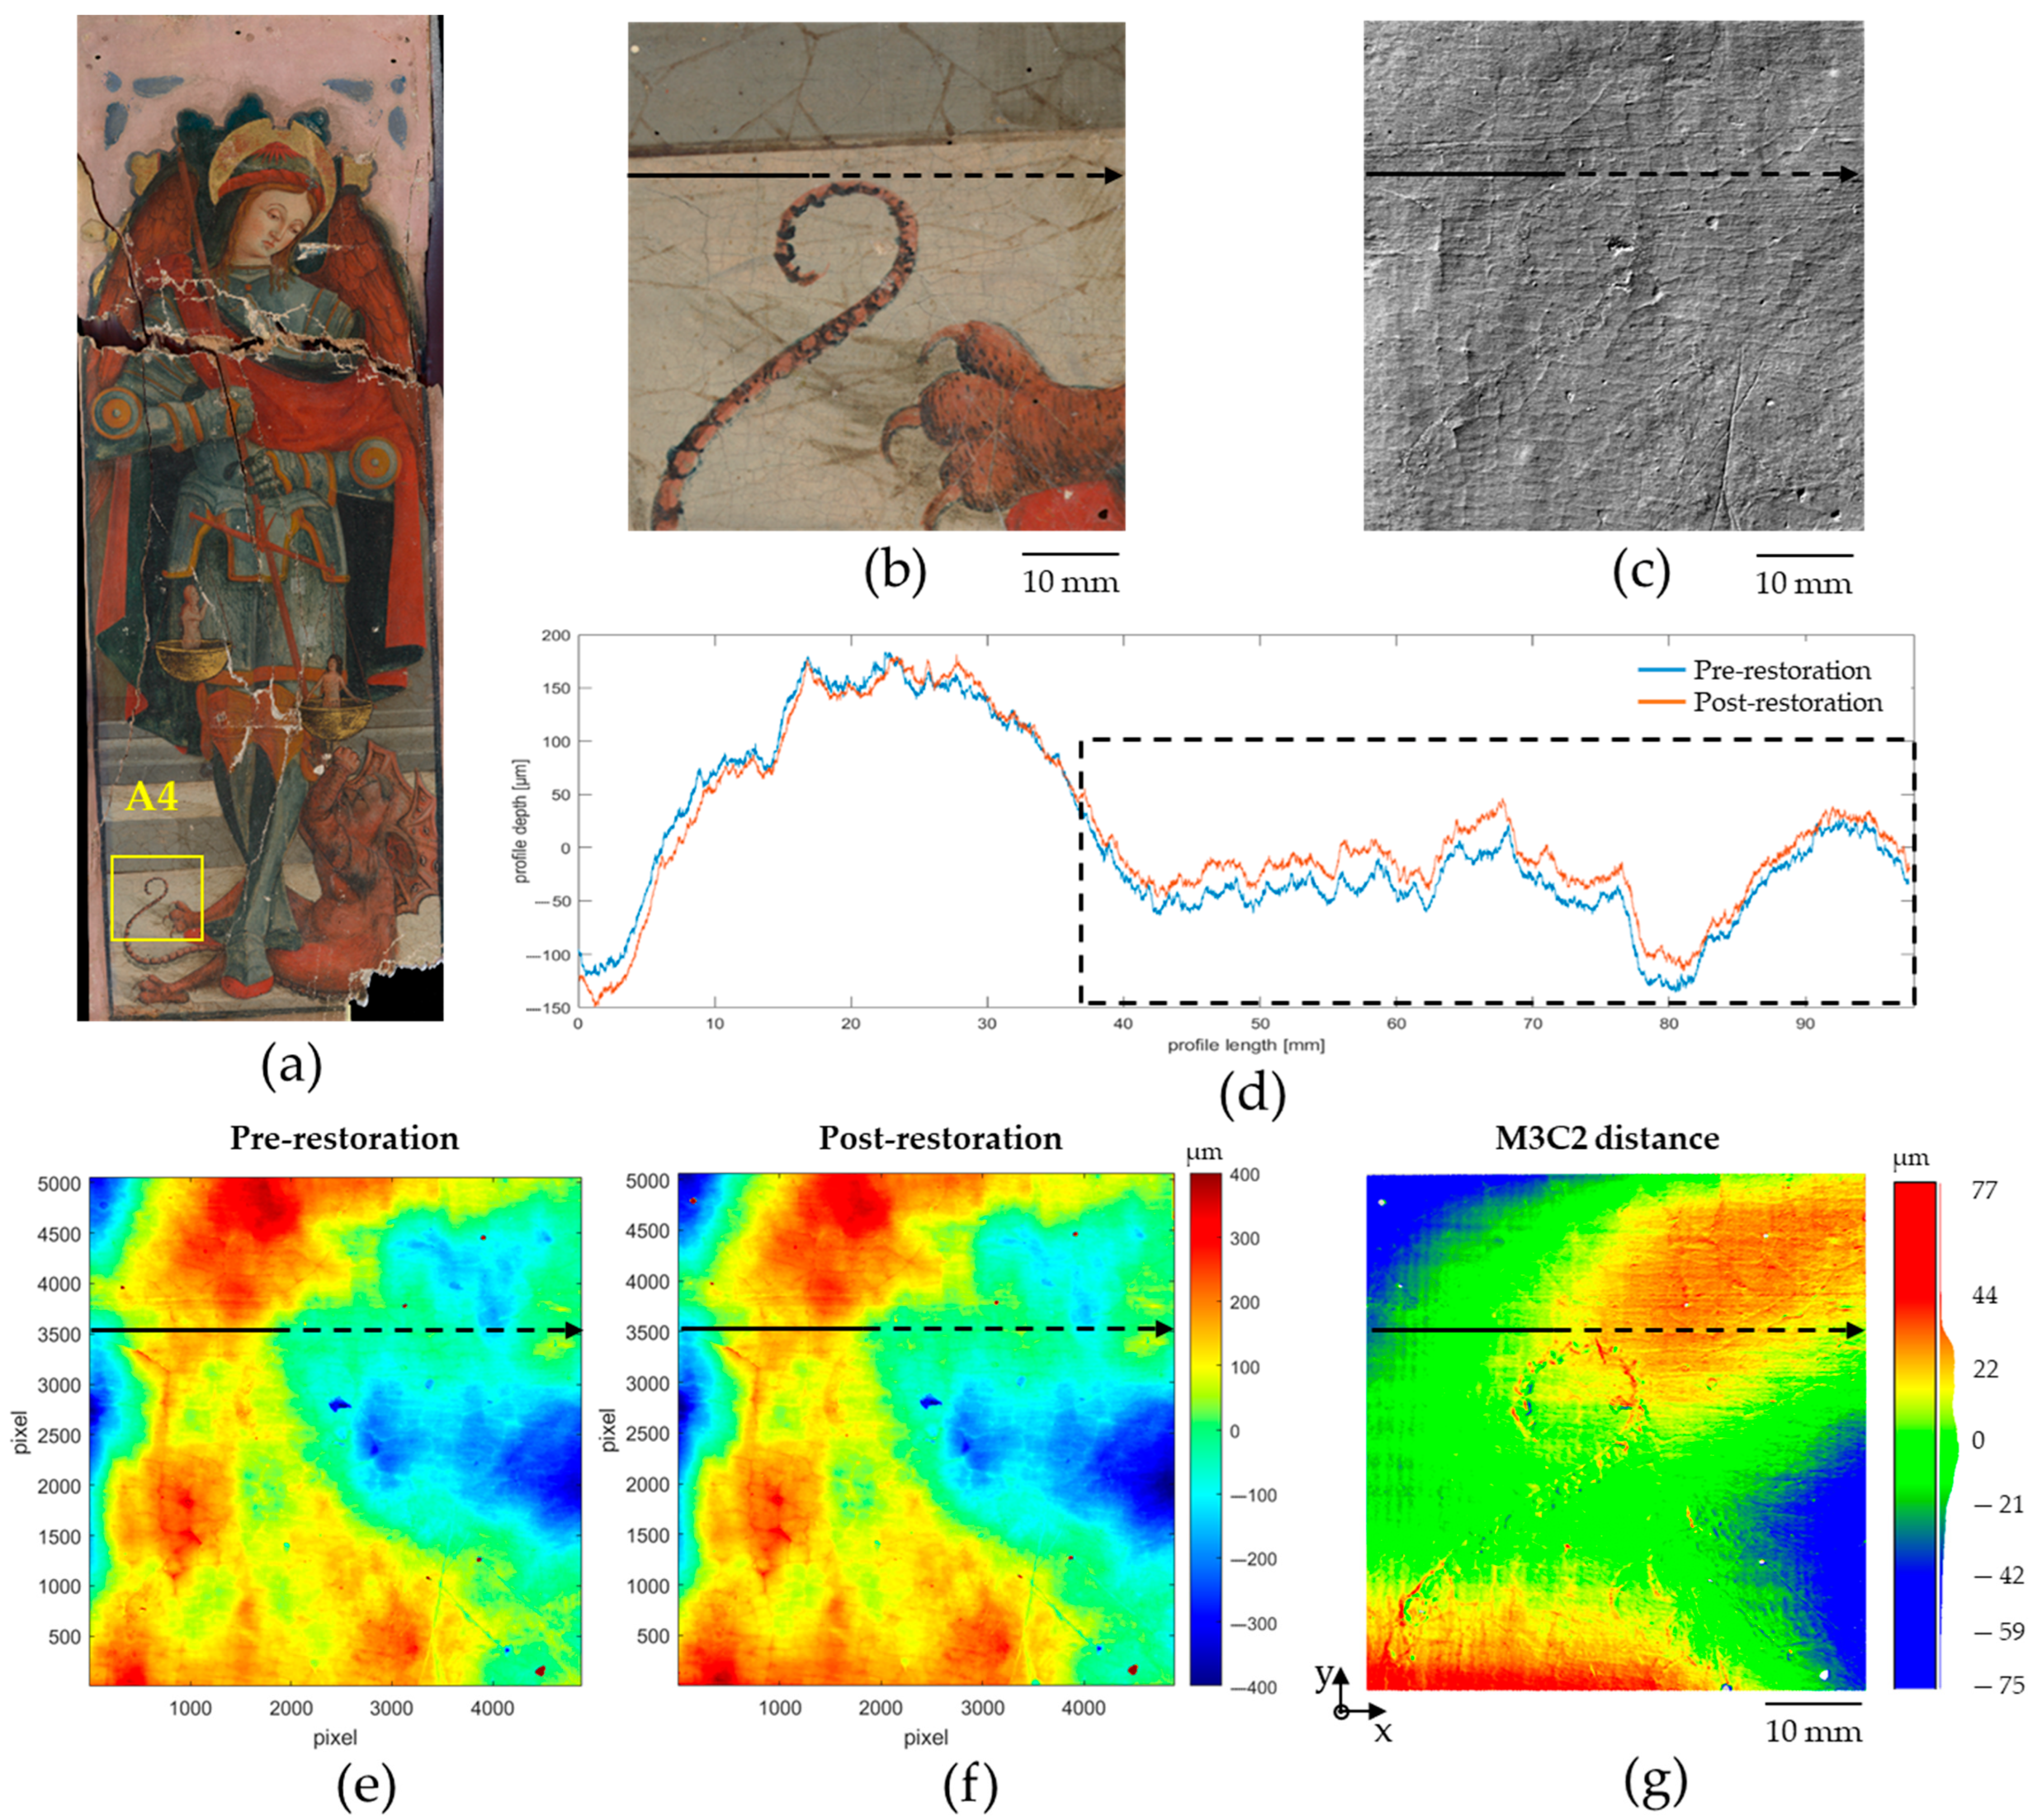
3.2. Analysis of the Surface Morphology: Microscopic Deformation

Microprofilometry was employed to examine specific regions of the panel painting before and after restoration, assessing potential microscopic alterations induced by the consolidation process. These included new detachments, liftings, micro-cracks, or widening of existing fractures.
The M3C2 results of the control sample showed excellent reproducibility, with measured displacements centered around 0 μm and standard deviation: 2 μm (Figure 8). According to our methodology (see Section 2.5), any distance values observed in the artwork that exceed 2 µm can be attributed to actual differences in surface morphology rather than misalignments between point clouds.
Microprofilometry results are shown in Figure 9, Figure 10, Figure 11 and Figure 12. For each ROI, pre-restoration simulated grazing-light images revealed pre-existing cracks, surface micro-deformation, craquelure, and detachments. Post-intervention raking light images were omitted as no defects were detected. DEMs and M3C2 maps are presented for each area. While DEM comparison alone proves inadequate for detecting conservation-state differences, M3C2 maps provided effective direct comparison. Elevation models were imported as matrices into MATLAB (R2023a) for profile extraction.
In ROI A1 (Figure 9) the Archangel’s eye region showed an ∼20 µm elevation in the post-restoration cloud (Figure 9d,g), potentially related to panel shape changes observed in Figure 5. Isohypses indicated shifts in this region and the bottom left corner, suggesting panel warping.
The central-right area (ROI A2, Figure 10) showed no significant changes, with most cloud-to-cloud distances within the displacement threshold (Figure 10g). The lower cloud portion was excluded due to insufficient illumination (Figure 10a).
The painting’s bottom regions (ROIs A3 and A4, Figure 11 and Figure 12) exhibited the most pronounced changes. A3 demonstrated X-axis warping with displacements > 20 µm (Figure 11g); A4 showed Y-axis warping with displacements ranging from −75 to 77 µm (Figure 12g).
The detection discrepancy observed in Figure 12 between the DEM images and M3C2 distance map (where the devil’s tail in ROI A4 is only visible in the latter) stems from fundamental methodological differences in data processing. The M3C2 algorithm’s enhanced sensitivity to local surface variations, combined with our optimized chromatic scale range for distance visualization, enables detection of subtle pictorial features that remain below the threshold of DEM-based representations. This analytical approach specifically highlights areas of significant morphological variation, making it particularly effective for revealing fine details like the tail contour where pronounced surface differences occur.

4. Discussion

The 3D modeling of the panel painting before and after the restoration was performed both to quantify macroscopic and microscopic variations and to relate the possible effect of support deformations on the pictorial layer. Our comparison between the pre- and post-restoration models revealed measurable changes on the order of centimeters. The significant deformations caused by the seismic event made it challenging to accurately assess the panel’s warping prior to restoration, whether through DEM analysis or warping arrow calculations. In contrast, the post-restoration DEM demonstrated significantly reduced deformation, with warping measurements consistently below 1.5 cm across the entire panel surface. The most substantial displacement (∼4 cm) between the two conservative states was detected on the left side, where a noticeable out-of-plane deformation was present. Other displacements related to restoration intervention remained more modest, never exceeding 1.5 cm, as confirmed by the M3C2 scale bar measurements.
The centimeter-scale deviations observed in the Digital Elevation Model are to be expected, given the pronounced out-of-plane deformations present in multiple regions of the support. These non-planar sections contribute significantly to the cumulative displacement values derived from the point cloud difference analysis, thereby influencing the overall magnitude of the computed deformations. In contrast, the computed warping arrow—whose percentage variation ranges from 0.1% to 1.7%—indicates that the restoration interventions did not induce significant alterations in the support’s curvature. This minimal deviation suggests that the structural geometry of the substrate remained largely stable post-treatment. These findings corroborate the restorer’s assertion that the support was stabilized exclusively through translational realignment of the board’s dislocated segments, which were then mechanically secured using custom-fabricated wooden inserts. The minimal curvature variation observed further confirms that no bending or torsional adjustments were applied, preserving the original structural kinematics of the substrate.
At the microscopic level, the microprofilometry point clouds enabled us to quantify the effects of consolidation-induced changes on the painted surfaces. Through careful analysis of a painted mock-up, we established a displacement threshold of ±2 µm to reliably distinguish genuine micro-variations from potential alignment artifacts. In ROI A1, corresponding to the Archangel’s face, we observed localized deformations affecting both the eye area and lower left corner, consistent with the isohypses shown in Figure 5, indicating a shift in this region. Given the negligible embankment effect resulting from the restoration, the observed deformations are more likely attributable to the removal of the original crossbeams and their replacement with new structural elements. This intervention plausibly altered the mechanical equilibrium of the support, leading to both the localized profile variation observed in the eye region and the onset of color uplift. The latter is particularly evident in the peak displacement along the profile in Figure 9d (orange curve), which coincides with a pre-existing micro-crack (blue curve). Such a correlation suggests that the modification of the support’s bracing system reactivated latent stresses, concentrating strain at pre-existing weaknesses, and triggering interfacial failure within the paint layer. These findings align with documented cases where structural reinforcements in panel paintings inadvertently induced secondary damage due to altered load distribution. Consequently, while the restoration successfully stabilized the support through translational reassembly, the replacement of crossbeams appears to have introduced a new set of mechanical interactions that merit further investigation to optimize future conservation strategies. ROI A2 showed remarkable stability, with neither the M3C2 distance map nor contour line analysis revealing any significant displacement. The most pronounced microscopic changes appeared in areas A3 and A4, which exhibited distinct warping patterns along the X and Y axes, respectively. These effects may be attributed to the two key restoration interventions: the treatment of vertical central cracks that caused subtle displacements of adjacent areas, and the reconnection of the lower right corner that may have introduced compressive forces leading to microscopic warping.
In conclusion, while the restoration process intentionally introduced macroscopic alterations to recover the artwork’s original shape—changes that were both expected and necessary—these interventions had remarkably limited impact on the delicate pictorial layers. Crucially, our analysis detected no new cracks or detachments in the paint layer. The observed surface modifications remained extremely subtle, with all displacements measuring below 100 µm, confirming that the restoration achieved its goals while maintaining the highest standards of conservation practice through minimally invasive techniques.
Future development of this research could harness the capability of AI-based methods for point cloud processing [38,39,40]. Specifically, deep neural networks (NNs) offer considerable potential for object classification, semantic segmentation, and deformation monitoring within complex spatial datasets [41]. The limitations inherent in manual approaches or those that rely solely on geometric metrics can be addressed through the ability of these AI-based models to learn hierarchical representations of features directly from raw data. Furthermore, deep learning (DL) algorithms can be profitably employed to extract distinctive features for 3D points and find accurate correspondences for point cloud alignment to reduce uncertainties [42]. Conventional registration optimization methods can be used in combination with DL techniques in an end-to-end framework [29].
The multi-time annotated 3D dataset, such as those acquired during this study, forms the basis for supervised training of DL architectures. Point-by-point records of morphological changes and structural anomalies in the examined object enable detection and automatic classification of similar phenomena across other objects of the same category. This approach can significantly improve the efficiency and accuracy of condition monitoring in different settings, not only supporting restoration workflows but also allowing early detection of signs of deterioration and facilitating preventive conservation procedures.

5. Conclusions

This paper presents the results of a comprehensive 3D survey conducted on a panel painting that suffered severe damage during a seismic event. Our research specifically focused on evaluating how the restoration of the wooden support affected the delicate pictorial layers above. Through a carefully designed multi-resolution approach, we employed complementary documentation techniques—structured-light projection for overall geometry and laser-scanning microprofilometry for surface details—both before and after the conservation intervention. This dual methodology allowed for direct temporal comparison of the artwork’s condition through precisely aligned point cloud data.
The documentation process involved a mobile structured-light scanner (Micron3D color) to create complete 3D models of the entire panel, while a high-precision laser-scanning microprofilometer captured microscopic details in selected regions of interest. From these datasets, we generated Digital Elevation Models and performed rigorous quantitative comparisons using the M3C2 algorithm. For the microprofilometric analysis, we established a conservative displacement threshold of ±2 µm based on reference measurements, ensuring reliable detection of genuine variations rather than alignment artifacts. Our macroscopic analysis revealed measurable displacements in the centimeter range, with the most significant change (approximately 4 cm) occurring on the panel’s left side, while other areas showed more modest movements not exceeding 1.5 cm. At the microscopic scale, the topographic maps demonstrated remarkably stable surface conditions, with any detected variations remaining below 100 µm. These minimal changes appear related to necessary restoration procedures including the integration of detached elements, crack stabilization, and panel adjustments. Crucially, our findings confirm that the conservators’ skillful interventions, limited to controlled in-plane and out-of-plane wood displacements, successfully avoided introducing any deformation of the support. The most critical operation turned out to be the removal of the crossbars, which may have caused a micro-lifting of the paint layer. This study, which compares structured-light and microprofilometric data across the restoration timeline, provides unprecedented quantitative evidence of how structural treatments affect painted surfaces. The methodology developed here offers conservators a powerful tool for assessing treatment outcomes while demonstrating that even significant structural interventions can be performed without compromising delicate surface layers when executed with appropriate care and precision.

Author Contributions

Conceptualization, E.V., I.L., A.D.F., and R.F.; methodology, E.V., S.B., and I.L.; validation, A.D.F. and R.F.; formal analysis, E.V., S.B., and I.L.; investigation, E.V., S.B., I.L., A.D.F., and R.F.; resources, R.F.; data curation, E.V. and A.D.F.; writing—original draft preparation, E.V.; writing—review and editing, I.L., A.D.F., and R.F.; visualization, E.V., S.B., and I.L.; supervision, R.F.; project administration, R.F.; funding acquisition, R.F. All authors have read and agreed to the published version of the manuscript.

Funding

This research was funded by the project PNRR CHANGES (Cultural Heritage Active Innovation for Sustainable Society) Project (PE_00000020), CUP_D53C22002560006, funded by the European Union—Next Generation EU M4.C2.1.3 and PNRR H2IOSC (Humanities and Cultural Heritage ItalianOpen Science Cloud) Project (IR0000029), CUP_B63C22000730005, funded by Next Generation EU. The structured-light scanner Micron3D color was acquired through the project PIR01_00016 SHINE—Potenziamento dei nodi italiani in E-RIHS, funded by M.I.U.R.—Azione II.1 del P.O.N. Ricerca e Innovazione 2014–2020, CUP B27E19000030007.

Data Availability Statement

The data presented in this study are available on request from the corresponding author.

Acknowledgments

Arcidiocesi di Camerino e San Severino Marche, Soprintendenza Archeologica, Belle Arti e Paesaggio per le province di Ascoli Piceno, Fermo e Macerata and Opificio delle Pietre Dure are gratefully acknowledged for their interest in this research. The restoration was carried out by the restorers Marina Ginanni, Andrea Santacesaria, Alberto Dimuccio, and Elena Bartolozzi, who are gratefully acknowledged for their assistance during the measurements.

Conflicts of Interest

The authors declare no conflicts of interest.

References

  1. Daffara, C.; Muradore, R.; Piccinelli, N.; Gaburro, N.; De Rubeis, T.; Ambrosini, D. A Cost-Effective System for Aerial 3D Thermography of Buildings. J. Imaging 2020, 6, 76. [Google Scholar] [CrossRef] [PubMed]
  2. Sels, S.; Bogaerts, B.; Verspeek, S.; Ribbens, B.; Steenackers, G.; Penne, R.; Vanlanduit, S. 3D Defect Detection Using Weighted Principal Component Thermography. Opt. Lasers Eng. 2020, 128, 106039. [Google Scholar] [CrossRef]
  3. Campione, I.; Lucchi, F.; Santopuoli, N.; Seccia, L. 3D Thermal Imaging System with Decoupled Acquisition for Industrial and Cultural Heritage Applications. Appl. Sci. 2020, 10, 828. [Google Scholar] [CrossRef]
  4. Grifoni, E.; Bonizzoni, L.; Gargano, M.; Melada, J.; Ludwig, N.; Bruni, S.; Mignani, I. Hyper-Dimensional Visualization of Cultural Heritage: A Novel Multi-Analytical Approach on 3D Pomological Models in the Collection of the University of Milan. J. Comput. Cult. Herit. 2022, 15, 1–15. [Google Scholar] [CrossRef]
  5. Es Sebar, L.; Lombardo, L.; Buscaglia, P.; Cavaleri, T.; Lo Giudice, A.; Re, A.; Borla, M.; Aicardi, S.; Grassini, S. 3D Multispectral Imaging for Cultural Heritage Preservation: The Case Study of a Wooden Sculpture of the Museo Egizio Di Torino. Heritage 2023, 6, 2783–2795. [Google Scholar] [CrossRef]
  6. Simon Chane, C.; Mansouri, A.; Marzani, F.S.; Boochs, F. Integration of 3D and Multispectral Data for Cultural Heritage Applications: Survey and Perspectives. Image Vis. Comput. 2013, 31, 91–102. [Google Scholar] [CrossRef]
  7. Chane, C.; Schütze, R.; Boochs, F.; Marzani, F. Registration of 3D and Multispectral Data for the Study of Cultural Heritage Surfaces. Sensors 2013, 13, 1004–1020. [Google Scholar] [CrossRef] [PubMed]
  8. Sánchez-Jiménez, D.; Buchón-Moragues, F.; Bravo, J.M.; Sánchez-Pérez, J.V. Estimation of the Precision of a Structured Light System in Oil Paintings on Canvas. Sensors 2019, 19, 4966. [Google Scholar] [CrossRef] [PubMed]
  9. Blais, F.; Cournoyer, L.; Beraldin, J.-A.; Picard, M. 3D Imaging from Theory to Practice: The Mona Lisa Story. In Current Developments in Lens Design and Optical Engineering IX; Mouroulis, P.Z., Smith, W.J., Johnson, R.B., Eds.; SPIE: San Diego, CA, USA, 2008; p. 70600L. [Google Scholar]
  10. Sansoni, G.; Trebeschi, M.; Docchio, F. State-of-The-Art and Applications of 3D Imaging Sensors in Industry, Cultural Heritage, Medicine, and Criminal Investigation. Sensors 2009, 9, 568–601. [Google Scholar] [CrossRef] [PubMed]
  11. Lunghi, I.; Vannini, E.; Dal Fovo, A.; Di Sarno, V.; Rocco, A.; Fontana, R. A Performance Comparison of 3D Survey Instruments for Their Application in the Cultural Heritage Field. Sensors 2024, 24, 3876. [Google Scholar] [CrossRef] [PubMed]
  12. Elkhuizen, W.S.; Callewaert, T.W.J.; Leonhardt, E.; Vandivere, A.; Song, Y.; Pont, S.C.; Geraedts, J.M.P.; Dik, J. Comparison of Three 3D Scanning Techniques for Paintings, as Applied to Vermeer’s ‘Girl with a Pearl Earring’. Herit. Sci. 2019, 7, 89. [Google Scholar] [CrossRef]
  13. Pelagotti, A.; Uccheddu, F.; Massa, E.; Carfagni, M. Comparing Two 3D Measurement Techniques for Documenting Painted Wooden Panels Surface Deformations on a Real Test Case: “Mystical Marriage of Saint Catherine” by Renaissance Artist Piero Di Cosimo. In IOP Conference Series: Materials Science and Engineering, Proceedings of the Florence Heri-Tech—The Future of Heritage Science and Technologies, Florence, Italy, 16–18 May 2018; IOP Publishing Ltd.: Bristol, UK, 2018; Volume 364, p. 012090. [Google Scholar] [CrossRef]
  14. Dal Fovo, A.; Morello, M.; Mazzinghi, A.; Toso, C.; Pampaloni, E.; Fontana, R. Disclosure of a Concealed Michelangelo-Inspired Depiction in a 16th-Century Painting. J. Imaging 2024, 10, 175. [Google Scholar] [CrossRef] [PubMed]
  15. Tornero-Martínez, N.; Trujillo-Schiaffino, G.; Anguiano-Morales, M.; Mendoza-Villegas, P.G.; Salas-Peimbert, D.P.; Corral-Martínez, L.F. Color Profilometry Techniques: A Review. Opt. Pura Apl. 2018, 51, 0136021. [Google Scholar] [CrossRef]
  16. Zhang, S. High-Speed 3D Shape Measurement with Structured Light Methods: A Review. Opt. Lasers Eng. 2018, 106, 119–131. [Google Scholar] [CrossRef]
  17. Mazzocato, S.; Daffara, C. Experiencing the Untouchable: A Method for Scientific Exploration and Haptic Fruition of Artworks Microsurface Based on Optical Scanning Profilometry. Sensors 2021, 21, 4311. [Google Scholar] [CrossRef] [PubMed]
  18. Mazzocato, S.; Daffara, C. Spatio-Temporal Monitoring of the Microsurface Modification in Artworks under Environmental Forcing. Eur. Phys. J. Plus 2025, 140, 382. [Google Scholar] [CrossRef]
  19. Gagliardi, C.; Riparbelli, L.; Mazzanti, P.; Fioravanti, M. A Critical Review of Methods and Techniques Used for Monitoring Deformations in Wooden Panel Paintings. Forests 2025, 16, 546. [Google Scholar] [CrossRef]
  20. Palma, G.; Pingi, P.; Siotto, E. Temporal Deformation Analysis of 3D Models as Diagnostic Tool for Panel Paintings. In Handbook of Cultural Heritage Analysis; D’Amico, S., Venuti, V., Eds.; Springer International Publishing: Cham, Switzerland, 2022; pp. 1915–1931. ISBN 978-3-030-60015-0. [Google Scholar]
  21. Badillo, P.D.; Parfenov, V.A.; Kuleshov, D.S. 3D Scanning for Periodical Conservation State Monitoring of Oil Paintings. In Proceedings of the 2022 Conference of Russian Young Researchers in Electrical and Electronic Engineering (ElConRus), Saint Petersburg, Russia, 25–28 January 2022; IEEE: Saint Petersburg, Russia, 2022; pp. 1098–1102. [Google Scholar]
  22. Auber--Le Saux, J.; Detalle, V.; Bai, X.; Andrianakis, M.; Wilkie-Chancellier, N.; Tornari, V. Surface Displacement Measurements of Artworks: New Data Processing for Speckle Pattern Interferometry. Appl. Sci. 2022, 12, 11969. [Google Scholar] [CrossRef]
  23. Uzielli, L.; Cocchi, L.; Mazzanti, P.; Togni, M.; Jullien, D.; Dionisi-Vici, P. The Deformometric Kit: A Method and an Apparatus for Monitoring the Deformation of Wooden Panels. J. Cult. Herit. 2012, 13, S94–S101. [Google Scholar] [CrossRef]
  24. Mazzanti, P.; Marcon, B.; Cocchi, L.; Goli, G.; Riparbelli, L.; Uzielli, L. An Innovative Method Based on In Situ Deformometric Monitoring to Support Decisions for the Structural Restoration of a Historic Panel Painting. Heritage 2024, 7, 4193–4205. [Google Scholar] [CrossRef]
  25. Fontana, R.; Dal Fovo, A.; Striova, J.; Pezzati, L.; Pampaloni, E.; Raffaelli, M.; Barucci, M. Application of Non-Invasive Optical Monitoring Methodologies to Follow and Record Painting Cleaning Processes. Appl. Phys. A 2015, 121, 957–966. [Google Scholar] [CrossRef]
  26. Daffara, C.; Mazzocato, S. Surface Metrology Based on Scanning Conoscopic Holography for In Situ and In-Process Monitoring of Microtexture in Paintings. Sensors 2022, 22, 6637. [Google Scholar] [CrossRef] [PubMed]
  27. Grifoni, E.; Vannini, E.; Lunghi, I.; Faraioli, P.; Ginanni, M.; Santacesarea, A.; Fontana, R. 3D Multi-Modal Point Clouds Data Fusion for Metrological Analysis and Restoration Assessment of a Panel Painting. J. Cult. Herit. 2024, 66, 356–366. [Google Scholar] [CrossRef]
  28. Vannini, E.; Lunghi, I.; Grifoni, E.; Farioli, P.; Ginanni, M.; Santacesaria, A.; Fontana, R. Three-Dimensional Analysis for the Documentation of the Restoration of an Earthquake-Damaged Triptych. Heritage 2024, 7, 2176–2194. [Google Scholar] [CrossRef]
  29. Ioannidou, S.; Pantazis, G. Detection of Deformations and Alterations in Paintings Using a New Industrial Geodetic Methodology. J. Nondestruct. Eval. 2025, 44, 36. [Google Scholar] [CrossRef]
  30. Lague, D.; Brodu, N.; Leroux, J. Accurate 3D Comparison of Complex Topography with Terrestrial Laser Scanner: Application to the Rangitikei Canyon (N-Z). ISPRS J. Photogramm. Remote Sens. 2013, 82, 10–26. [Google Scholar] [CrossRef]
  31. Abate, D. Documentation of Paintings Restoration through Photogrammetry and Change Detection Algorithms. Herit. Sci. 2019, 7, 13. [Google Scholar] [CrossRef]
  32. Bitelli, G.; Girelli, V.A.; Sammarini, G. 4-Dimensional Recording and Visualization of Urban Archeological Excavations. Appl. Geomat. 2018, 10, 415–426. [Google Scholar] [CrossRef]
  33. Riminesi, C.; Fà, R.M.D.; Brizzi, S.; Rocco, A.; Fontana, R.; Bertasa, M.; Grifoni, E.; Impallaria, A.; Leucci, G.; De Giorgi, L.; et al. Architectural Assessment of Wall Paintings Using a Multimodal and Multi-Resolution Diagnostic Approach: The Test Site of the Brancacci Chapel in Firenze. J. Cult. Herit. 2024, 66, 99–109. [Google Scholar] [CrossRef]
  34. Angheluță, L.M.; Rădvan, R. Macro photogrammetry for the damage assessment of artwork painted surfaces. Int. Arch. Photogramm. Remote Sens. Spat. Inf. Sci. 2019, XLII-2/W15, 101–107. [Google Scholar] [CrossRef]
  35. Yang, Y.; Schwieger, V. Patch-Based M3C2: Towards Lower-Uncertainty and Higher-Resolution Deformation Analysis of 3D Point Clouds. Int. J. Appl. Earth Obs. Geoinf. 2023, 125, 103535. [Google Scholar] [CrossRef]
  36. Zahs, V.; Winiwarter, L.; Anders, K.; Williams, J.G.; Rutzinger, M.; Höfle, B. Correspondence-Driven Plane-Based M3C2 for Lower Uncertainty in 3D Topographic Change Quantification. ISPRS J. Photogramm. Remote Sens. 2022, 183, 541–559. [Google Scholar] [CrossRef]
  37. James, M.R.; Robson, S.; Smith, M.W. 3-D Uncertainty-based Topographic Change Detection with Structure-from-motion Photogrammetry: Precision Maps for Ground Control and Directly Georeferenced Surveys. Earth Surf. Process. Landf. 2017, 42, 1769–1788. [Google Scholar] [CrossRef]
  38. Zhang, Z.; Dai, Y.; Sun, J. Deep Learning Based Point Cloud Registration: An Overview. Virtual Real. Intell. Hardw. 2020, 2, 222–246. [Google Scholar] [CrossRef]
  39. Monji-Azad, S.; Hesser, J.; Löw, N. A Review of Non-Rigid Transformations and Learning-Based 3D Point Cloud Registration Methods. ISPRS J. Photogramm. Remote Sens. 2023, 196, 58–72. [Google Scholar] [CrossRef]
  40. Yao, W.; Chu, T.; Tang, W.; Wang, J.; Cao, X.; Zhao, F.; Li, K.; Geng, G.; Zhou, M. SPPD: A Novel Reassembly Method for 3D Terracotta Warrior Fragments Based on Fracture Surface Information. IJGI 2021, 10, 525. [Google Scholar] [CrossRef]
  41. Vinodkumar, P.K.; Karabulut, D.; Avots, E.; Ozcinar, C.; Anbarjafari, G. A Survey on Deep Learning Based Segmentation, Detection and Classification for 3D Point Clouds. Entropy 2023, 25, 635. [Google Scholar] [CrossRef] [PubMed]
  42. Huang, X.; Mei, G.; Zhang, J.; Abbas, R. A comprehensive survey on point cloud registration. arXiv 2021, arXiv:2103.02690. [Google Scholar]
Figure 1. (a) Panel painting after the earthquake; (b) sample used as a reference for microprofilomeric point cloud processing.
Remotesensing 17 02487 g001
Figure 2. Three-dimensional models of the artwork before the restoration (a) with and (b) without texture obtained with the structured-light scanner. Top: side, front, and back views with reference scale bar; bottom: top view with reference scale bar. Note that the front and back views are slightly rotated to emphasize the 3D information (Entire panel: 180,182,937 cloud points; 15,611,541 mesh vertices; 31,089,000 mesh faces. Lower right corner: 16,814,059 cloud points; 2,811,778 mesh vertices; 5,623,131 mesh faces. Right edge: 11,320,688 cloud points; 2,652,689 mesh vertices; 5,305,418 mesh faces).
Remotesensing 17 02487 g002
Figure 3. Three-dimensional models of the artwork after the restoration (a) with and (b) without texture obtained with structured-light scanner. Top: side, front, and back views with reference scale bar; bottom: top view with reference scale bar. Note that the front and back views are slightly rotated to emphasize the 3D information (266,896,675 cloud points; 14,318,360 mesh vertices; 28,631,861 mesh faces).
Remotesensing 17 02487 g003
Figure 4. Workflow diagram illustrating the pipeline of our methodology.
Remotesensing 17 02487 g004
Figure 5. Three-dimensional models acquired (a) before and (b) after restoration. From left to right: contour lines overlaid on the textured point cloud (semi-transparent), and the corresponding DEM with elevation color scale.
Remotesensing 17 02487 g005
Figure 6. M3C2 distance map (pre-restoration cloud as reference), with textured point cloud overlaid in transparency.
Remotesensing 17 02487 g006
Figure 7. Structured-light 3D models (a) before and (b) after restoration. Yellow squares indicate areas scanned by the microprofilometer. Red and green lines mark the sections numbered from 1 to 4, which were used for warping arrow calculations. (c) Bottom view of a section, showing the warping arrow calculation method (red dotted line). (d) Plot of the warping arrow values as a function of the section number. The error bars are within the size of the symbol.
Remotesensing 17 02487 g007
Figure 8. (a) Photo of the sample used as a reference for the alignment threshold computation; (b) M3C2 distance map; (c) M3C2 distance distribution with mean value and standard deviation.
Remotesensing 17 02487 g008
Figure 9. (a) Image of the panel painting with the yellow square marking A1; (b) RGB image and (c) simulated grazing-light image of the ROI; (d) profiles extracted from the pre- and post-restoration DEMs shown in (e) and (f), respectively (same color bar); (g) M3C2 distance map with corresponding color bar. Black arrows indicate profile extraction location, while dotted lines highlight the region where the post-restoration profile lies above the pre-restoration one.
Remotesensing 17 02487 g009
Figure 10. (a) Image of the panel painting with the yellow square highlighting ROI A2 (dotted line marks the scanned area); (b) RGB image and (c) simulated grazing-light image of the ROI; (d) profiles extracted from the pre- and post-restoration DEMs shown in (e) and (f), respectively (same color bar); (g) M3C2 distance map with corresponding color bar. Black arrows indicate profile extraction locations.
Remotesensing 17 02487 g010
Figure 11. (a) Image of the panel painting with the yellow square marking ROI A3; (b) RGB image and (c) simulated grazing-light image of the ROI; (d) profiles extracted from the pre- and post-restoration DEMs shown in (e) and (f), respectively (same color bar); (g) M3C2 distance map with corresponding color bar. Black arrows indicate profile extraction sites, while dotted lines highlight the region where the post-restoration profile exceeds the pre-restoration one.
Remotesensing 17 02487 g011
Figure 12. (a) Panel painting image showing ROI A4 (marked by yellow square); (b) RGB and (c) simulated grazing-light images of the ROI; (d) profiles comparison from pre- (e) and post-restoration (f) DEMs (shared color bar); (g) M3C2 distance map with associated color scale. Black arrows denote profile locations; dotted lines highlight areas where post-restoration levels exceed original ones.
Remotesensing 17 02487 g012
Table 1. Technical specifications of the two instruments.
MICRON3D ColorConoPoint-10 with 50 mm Lens
Remotesensing 17 02487 i001Remotesensing 17 02487 i002
Working distance70 cm44 mm
Depth of field20 cm8 mm
Field of view30 × 40 cm/
Spot diameter/37 µm
Distance between points80 µm20 µm (= sampling step 1)
Accuracy60 µm6 µm
1 Set by the user.
Disclaimer/Publisher’s Note: The statements, opinions and data contained in all publications are solely those of the individual author(s) and contributor(s) and not of MDPI and/or the editor(s). MDPI and/or the editor(s) disclaim responsibility for any injury to people or property resulting from any ideas, methods, instructions or products referred to in the content.

