Article

Retrieval of Cloud, Atmospheric, and Surface Properties from Far-Infrared Spectral Radiances Measured by FIRMOS-B During the 2022 HEMERA Stratospheric Balloon Campaign

1
Consiglio Nazionale delle Ricerche, National Institute of Optics, Via Madonna del Piano, 10, Sesto Fiorentino, 50019 Firenze, Italy
2
Consiglio Nazionale delle Ricerche, Institute of Applied Physics “Nello Carrara”, Via Madonna del Piano, 10, Sesto Fiorentino, 50019 Firenze, Italy
3
Consiglio Nazionale delle Ricerche, Institute for Atmospheric Sciences and Climate, Via Gobetti, 101, 40129 Bologna, Italy
*
Author to whom correspondence should be addressed.
Remote Sens. 2025, 17(14), 2458; https://doi.org/10.3390/rs17142458
Submission received: 3 June 2025 / Revised: 4 July 2025 / Accepted: 7 July 2025 / Published: 16 July 2025

Abstract

The knowledge of the radiative properties of clouds and the atmospheric state is of fundamental importance in modelling phenomena in numerical weather predictions and climate models. In this study, we show the results of the retrieval of cloud properties, along with the atmospheric state and the surface temperature, from far-infrared spectral radiances, in the 100–1000 cm−1 range, measured by the Far-Infrared Radiation Mobile Observation System-Balloon version (FIRMOS-B) spectroradiometer from a stratospheric balloon launched from Timmins (Canada) in August 2022 within the HEMERA 3 programme. The retrieval study is performed with the Optimal Estimation inversion approach, using three different forward models and retrieval codes to compare the results. Cloud optical depth, particle effective size, and cloud top height are retrieved with good accuracy, despite the relatively high measurement noise of the FIRMOS-B observations used for this study. The retrieved atmospheric profiles, computed simultaneously with cloud parameters, are in good agreement with both co-located radiosonde measurements and ERA-5 profiles, under all-sky conditions. The findings are very promising for the development of an optimised retrieval procedure to analyse the high-precision FIR spectral measurements, which will be delivered by the ESA FORUM mission.

1. Introduction

The characterisation of the radiative properties of clouds and the atmospheric state is of primary importance in climate studies. In particular, clouds play multiple roles in atmospheric processes, ranging from the hydrological cycle to the Earth radiation budget (ERB) [1]. While water clouds tend to cool the planet, ice clouds can exert either radiative cooling or warming depending on their type [2], their optical and micro-physical properties, and thermodynamic phase [3,4]. This occurs by trapping the outgoing longwave (LW) infrared radiative flux at the top of the atmosphere (TOA) or enhancing the planetary albedo by reflecting the incoming shortwave (SW) solar radiative flux back to space [5]. Both these mechanisms contribute to regulating the ERB [6]. Since clouds cover most of the planet, about 30% globally and 70% at the tropics, it is clear that a correct cloud parametrisation is needed to simulate their impact in general circulation models (GCMs) [7].
Even though cloud modelling, particularly in case of ice clouds, composed of myriad of crystal habits [3,8] with different radiative properties [9,10], is still uncertain, many studies showed that they have a strong effect in the far infrared (FIR), the portion of the electromagnetic spectrum below 667 cm−1. For example, the cloud radiative forcing (CRF), defined as the spectral difference between cloudy and clear-sky conditions [11], affects the surface radiation energy balance and is responsible for an enhanced warming of the polar regions [12]. Since the FIR region accounts for more than 50% of the entire thermal flux emitted by the Earth and about 60% of the associated radiative cooling occurs in the FIR [13], we understand that measurements in this spectral region are essential.
However, spectral measurements covering the FIR spectral range are still scarce [14], both from the ground and from airborne/satellite platforms. Only a small number of field campaigns, some of them still ongoing, have been carried out in the last few decades. Ground-based field campaigns to measure the atmospheric FIR spectrum need to be performed in very dry sites, such as high mountains [15,16] or polar regions, because the presence of water vapour makes the FIR transmission very low and prevents sounding the higher atmospheric layers.
In the Arctic, various ground-based field campaigns were performed with the Atmospheric Emitted Radiance Interferometer (AERI) Fourier transform spectrometer (FTS) in Alaska [17,18] and Greenland [19,20] and with the FINESSE spectrometer in Norway [21,22], covering part of the FIR spectrum down to 550 cm−1 (Polar-AERI), and to 400 cm−1 for the extended versions of AERI and FINESSE. In Antarctica, measurement field campaigns were performed from the South Pole site with AERI [23,24] and from the Dome-C site, in the middle of the Antarctic Plateau, with the Radiation Explorer in Far-Infrared-Prototype for Applications and Development (REFIR-PAD) [25], which has been operating in continuous and unattended mode since 2011 [26,27,28]. At high-altitude sites, measurements were carried out using REFIR-PAD [29,30,31], the Far-Infrared Spectroscopy of the Troposphere (FIRST) [32,33,34], and the Far-Infrared Radiation Mobile Observation System (FIRMOS) [35]. The two most significant campaigns were conducted from Cerro Toco in Chile, at 5380 m AMSL, within the Radiative Heating in Unexplored Bands Campaign Part 2 (RHUBC-II) [36] and the other from the summit of Zugspitze Mountain [16,37] in the German Alps, at 2950 m AMSL. Among all the cited instruments, only REFIR-PAD and FIRMOS are able to measure the FIR spectral radiance down to 100 cm−1.
From aircraft, measurements covering the FIR portion of the spectrum were performed with the Tropospheric Airborne Fourier Transform Spectrometer (TAFTS) [38]. These measurements allowed the characterisation of the radiative signatures of water vapour [39] and cirrus clouds [40], and the retrieval of surface emissivity employing FIR observations [41,42]. Recently, Panditharatne et al. (2025) [43] showed the retrieval of cirrus cloud parameters along with the atmospheric profiles from the joint spectral measurements carried out from aircraft with TAFTS, which covers the FIR portion between 80 and 600 cm−1, and the Airborne Research Interferometer Evaluation System (ARIES) [44] that covers the mid-infrared (MIR) part of the spectrum, between 550 and 3000 cm−1.
From stratospheric platforms, observations of the FIR spectral radiance at nadir were performed by the REFIR-PAD spectroradiometer, from a balloon launched in Teresina (Brazil) in June 2005 [45] as part of ESA’s validation and long-term monitoring programme for the atmospheric chemistry instruments on board ENVISAT, and by FIRST launched from Fort Sumner, New Mexico, in June 2005 [46].
Concerning measurements from space, a few hyperspectral radiometers, such as the Atmospheric Infrared Sounder (AIRS), onboard of the AQUA satellite, and the Infrared Atmospheric Sounding Interferometer (IASI) cover only the middle infrared (MIR) spectral region, limited to the carbon dioxide band down to 645 and 650 cm−1, respectively. The FIR is measured only as an integrated component, without spectral resolution, by missions dedicated to characterise the Earth’s radiation budget, such as the Clouds and the Earth’s Radiant Energy Budget System (CERES) mission [47,48] in which seven instruments on board five satellites (TRMM, Terra, Aqua, S-NPP, and NOAA-20) have been measuring Earth’s integrated spectrum across three bands: total band (50–33,333 cm−1), the shortwave band (2000–33,333 cm−1), and the longwave band (833–1250 cm−1).
A complete spectral coverage of the FIR band would allow to improve the characterisation of cirrus clouds’ radiative properties, the abundance of water vapour in the upper troposphere–lower stratosphere (UTLS), and the surface spectral emissivity (at least over polar regions).
To this aim, the Far-infrared Outgoing Radiation for Understanding and Monitoring (FORUM) mission [49,50] was selected by the European Space Agency (ESA) for launch as Earth Explorer 9 in 2027. The satellite will carry a spectroradiometer to measure the full spectral range from 100 to 1600 cm−1 from space, systematically covering the FIR portion of the Earth’s thermal emission for the first time.
In preparation for the FORUM mission, a measurement campaign was carried out using FIRMOS-B (the balloon-borne version of FIRMOS) during the HEMERA 3 stratospheric balloon launches to observe the outgoing spectral radiance in the 100 to 1000 cm−1 range from the stratosphere, which closely replicates the radiance observed at TOA and that FORUM will measure. These measurements can contribute to the development of the algorithms that will be used to analyse the data delivered by the FORUM mission [51].
This paper introduces, in Section 2 , the HEMERA 3 campaign, conducted from Timmins (Canada) in August 2022. Section 3 outlines the retrieval procedure that allows to characterise cloud properties, along with the simultaneous computation of the atmospheric profiles of water vapour and temperature and the surface temperature using FIRMOS-B spectral measurements. Section 4 and Section 5 present the retrieval results in cloudy and clear-sky conditions, respectively, while Section 6 provides the conclusions.

2. FIRMOS-B HEMERA Balloon Campaign

FIRMOS-B is an FTS designed and built at the National Institute of Optics (CNR-INO) in Florence as a demonstrator of the capabilities of measuring the FIR portion of the atmospheric spectrum, between 100 and 1000 cm−1, in perspective of the future ESA FORUM mission. The instrument was already successfully used in its previous ground version during the high-altitude campaign in the German Alps at Mount Zugspitze in 2018–2019, as described in detail in [35,37].
These ground-based measurements allowed to retrieve the optical and micro-physical properties of ice and mixed-phase clouds by exploiting the whole spectral emission band of the atmosphere as discussed in [16]. The field campaign on Zugspitze, together with the REFIR-PAD campaign in Antarctica, represented the first step for testing the capability to reproduce the measurement that the FORUM spectrometer will provide, although limited to ground-based observation.
FIRMOS-B is an adaptation of the original ground-based instrument for application onboard a stratospheric balloon and represents the next step to providing the far-infrared spectrum of the Earth from an altitude near the TOA using the same nadir-looking observation geometry of FORUM.
In August 2022, FIRMOS-B was deployed, together with several other instruments, on board the CARMEN gondola provided by the Centre National d’Etudes Spatiales (CNES) (see Figure 1) within the HEMERA 3 infrastructure project. The gondola was launched from Timmins (Canada) for a 15 h flight; Figure 2.
The HEMERA 3 flight started at 18:02 UTC on 23 August, reached the maximum altitude of approximately 36 km at 20:00 UTC and ended at 09:15 UTC on 24 August, after a total flight duration of 15 h and 10 min. The ground track of the flight is shown in Figure 3.
Unfortunately, during the flight, the scanning of the FIRMOS-B interferometric moving mirror stage was disturbed by unexpected vibrations generated by a cryogenic pump on the gondola, which caused the degradation of the measurements with a resulting noise significantly above the typical instrument specifications. Therefore, a selection procedure was developed to identify the measurements less affected by the vibrations. In this way, we selected and analysed a subset of 235 calibrated Level 1 spectra collected in seven measurement sequences. A single spectrum corresponds to an acquisition of 17 s.
The first two sequences were measured in clear-sky conditions at 18:36 and 19:53 UTC; they include 33 and 32 spectra, and are denoted as f1s002 and f1s007, respectively. The five remaining sequences are composed of 34 spectra each and were acquired in cloudy sky, as shown in the images captured by the visible camera on board FIRMOS-B, which is co-aligned with the instrument field of view (FOV) (see Figure 4), where the red circles represent the FIRMOS-B FOV. The sequences, labelled as f2s002, f2s010, f2s011, f2s012, and f2s013, have initial times 20:46, 22:33, 23:04, 23:19, and 23:34 UTC, respectively. The pictures show the presence of low and, apparently, liquid clouds surmounted by higher tenuous clouds, probably composed of ice. The overlap of the different types of clouds is visible in the magnified pictures in Figure 5.
The presence of clouds during the flight represents a great opportunity to test the retrieval capability of their optical, micro-physical, and macro-physical properties from FORUM-like measurements.
As an example, in Figure 6, the FIRMOS-B spectra for three sequences (one in clear-sky and two in cloudy conditions) are shown. In the figure, we can see that the effect of clouds on the spectrum is a reduction of the radiance mostly in the atmospheric window (above 800 cm−1) due to the cloud absorption of the upwelling radiation.

3. Retrieval Methods

The retrieval of the Level 2 geophysical parameters was performed using different codes to analyse the measurements both in clear-sky and in cloudy conditions.
The retrieval in cloudy sky was performed using two different codes, the Simultaneous Atmospheric and Cloud Retrieval (SACR) [27] and the Fast Retrieval Model (FARM) [52,53]. Both codes are able to take into account the multiple scattering processes due to the presence of clouds but using different methods. SACR is based on a full-physics forward model that uses the well-known algorithm Line-By-Line Radiative Transfer Model (LBLRTM) [54] to simulate the clear-sky contribution to the spectrum and the two-stream δ -Eddington approximation for the scattering simulation. FARM is instead based on the σ -FORUM forward model [55] that simulates the radiative transfer by using pre-compiled lookup tables of gas optical depths (ODs) to drastically reduce the computation time, and represents the multiple scattering using the Chou approximation [56]. Another difference between the two retrieval codes is that the SACR retrieval targets are the ice fraction, the cloud OD, and the cloud top height (CTH), while FARM retrieves vertical profiles of the cloud particles’ effective diameters (separate numbers for ice D e i and water D e w ) and of the mass mixing ratio (in kg·kg−1) of ice and liquid water. However, the FARM-retrieved cloud parameters can be used to derive the OD and ice fraction for comparison with what is retrieved by SACR. Preliminary tests with FARM showed that FIRMOS-B measurements were not sensitive enough to the vertical profiles of the cloud particle size. Therefore, in the FARM analysis, the values of D e i and D e w were fixed to 30 and 28 μ m , respectively. The chosen fixed values of D e i and D e w were derived from preliminary test results obtained with SACR.
The retrieval in clear sky was again performed with two codes: the FARM code (that also includes among the possible targets the surface and atmospheric states) and the Kyoto protocoL Informed Management of the Adaptation (KLIMA). The KLIMA code [57] embeds a line-by-line full-physics forward model, able to simulate the radiative transfer only in clear-sky conditions, and performs the retrieval of the atmospheric profiles, surface temperature, and surface spectral emissivity.
The atmospheric state vector retrieved by SACR in case of cloudy-sky scenarios is
x = ( D e i , D e w , OD , γ , CTH , U , T , T s , Ω , β )
where D e i indicates the effective diameter of ice crystals, as defined in [58] assuming a mixture of crystal habits as introduced by [59], D e w the effective diameter of water droplets, and γ the ice fraction as defined in [60]; U and T represent the vectors of the vertical profiles of water vapour and temperature at fixed altitude levels. Sixteen retrieval levels were considered for both water vapour and temperature between 0 and 30 km of height with a vertical resolution of 2 km. Ω is the solid angle of the interferometer beam divergence, which determines the factor used to combine linearly a sinc and a sinc2 function, used to represent the Instrument Line Shape (ILS) as described in [16,25]. Finally, the frequency stretch β indicates the scale factor on the frequency grid, compensating for a possible drift of the FIRMOS-B laser reference and the shift due to the internal finite instrumental aperture [16,25].
The cloud geometrical thickness was fixed to 3 km, whereas the CTH was varied by the algorithm moving the cloud along the vertical grid. This choice was made because the upwelling infrared spectrum is not very sensitive to the cloud bottom height (CBH).
FARM code does not retrieve the OD directly, but retrieves the mass mixing ratio profiles in kg·kg−1 of ice and liquid water, q i c e and q w a t e r , respectively. Therefore, the corresponding OD values can be derived from the latter by using the conversion formulas reported in Appendix A that allow us to obtain the IWC and LWC profiles. Subsequently, the IWC/LWC can be integrated between the CBH and CTH, corresponding to the minimum and maximum heights where total water content (TWC = IWC + LWC) profiles are greater than a specific threshold set to 5 · 10 7 kg/m3 to obtain the IWP/LWP ratio, as shown in Appendix A. Finally, the total OD is found as the sum of OD for ice and water ( O D i , O D w , respectively) through the formula [61]
O D = O D i + O D w = 3 · I W P D e i ρ i + 3 · L W P D e w ρ w
where ρ i and ρ w are the densities of ice and water equal to 917 and 1000 kg·m−3, respectively. As FARM also retrieves the surface spectral emissivity ε s , the FARM state vector in cloudy-sky conditions is
x = ( IWC , LWC , T s , ε s , Ω , β )
where IWC and LWC denote the vectors containing the retrieval levels of IWC and LWC, respectively. The atmospheric state vector used both by KLIMA and FARM in clear-sky scenarios includes the vertical values of water vapour concentration and temperature, surface temperature, and surface spectral emissivity, along with the two instrumental parameters Ω and β :
x = ( U , T , T s , ε s , Ω , β )
All the retrieval algorithms adopt the optimal estimation (OE) approach [62], which makes use of a priori information, and the Levenberg–Marquardt (LM) iterative formula [63] to minimise the cost function:
x i + 1 = x i + [ K i T S y 1 K i + γ i D i + S a 1 ] 1 [ K i T S y 1 ( y F ( x i ) ) S a 1 ( x i x a ) ]
where y , F , and x a denote the vector of the measurements, the forward model, and the vector of the a priori information, respectively; S y and S a are the Variance Covariance Matrices (VCMs) of the measurements and the a priori information; γ i is the damping factor at the iteration i, K i denotes the Jacobian matrix of F , and D i is a diagonal matrix as described in [27]. The convergence is reached when the variations on χ 2 are less than 1‰. The VCM of the retrieved parameters is obtained with the relation [62]
S x = ( K T S y 1 K + S a 1 ) 1
where K is the Jacobian matrix at the last iteration.
The a priori/initial guess profiles were chosen equal to the Initial Guess-2 (IG2) profiles [64]. The a priori errors were taken from the vertical distribution of uncertainties used for the Michelson Interferometer for Passive Atmospheric Sounding (MIPAS) analysis, but doubling the temperature error at heights below 3 km (≃13 K at the ground) and above 20 km. The water vapour error was assumed to be equal to 100% of the a priori profile at heights below 2 km (≃11,000 ppmv at the ground) and equal to 7 ppmv at heights above 12 km. This was done to further reduce the a priori constraint over the atmospheric state.

4. Retrieval Results in Cloudy Conditions

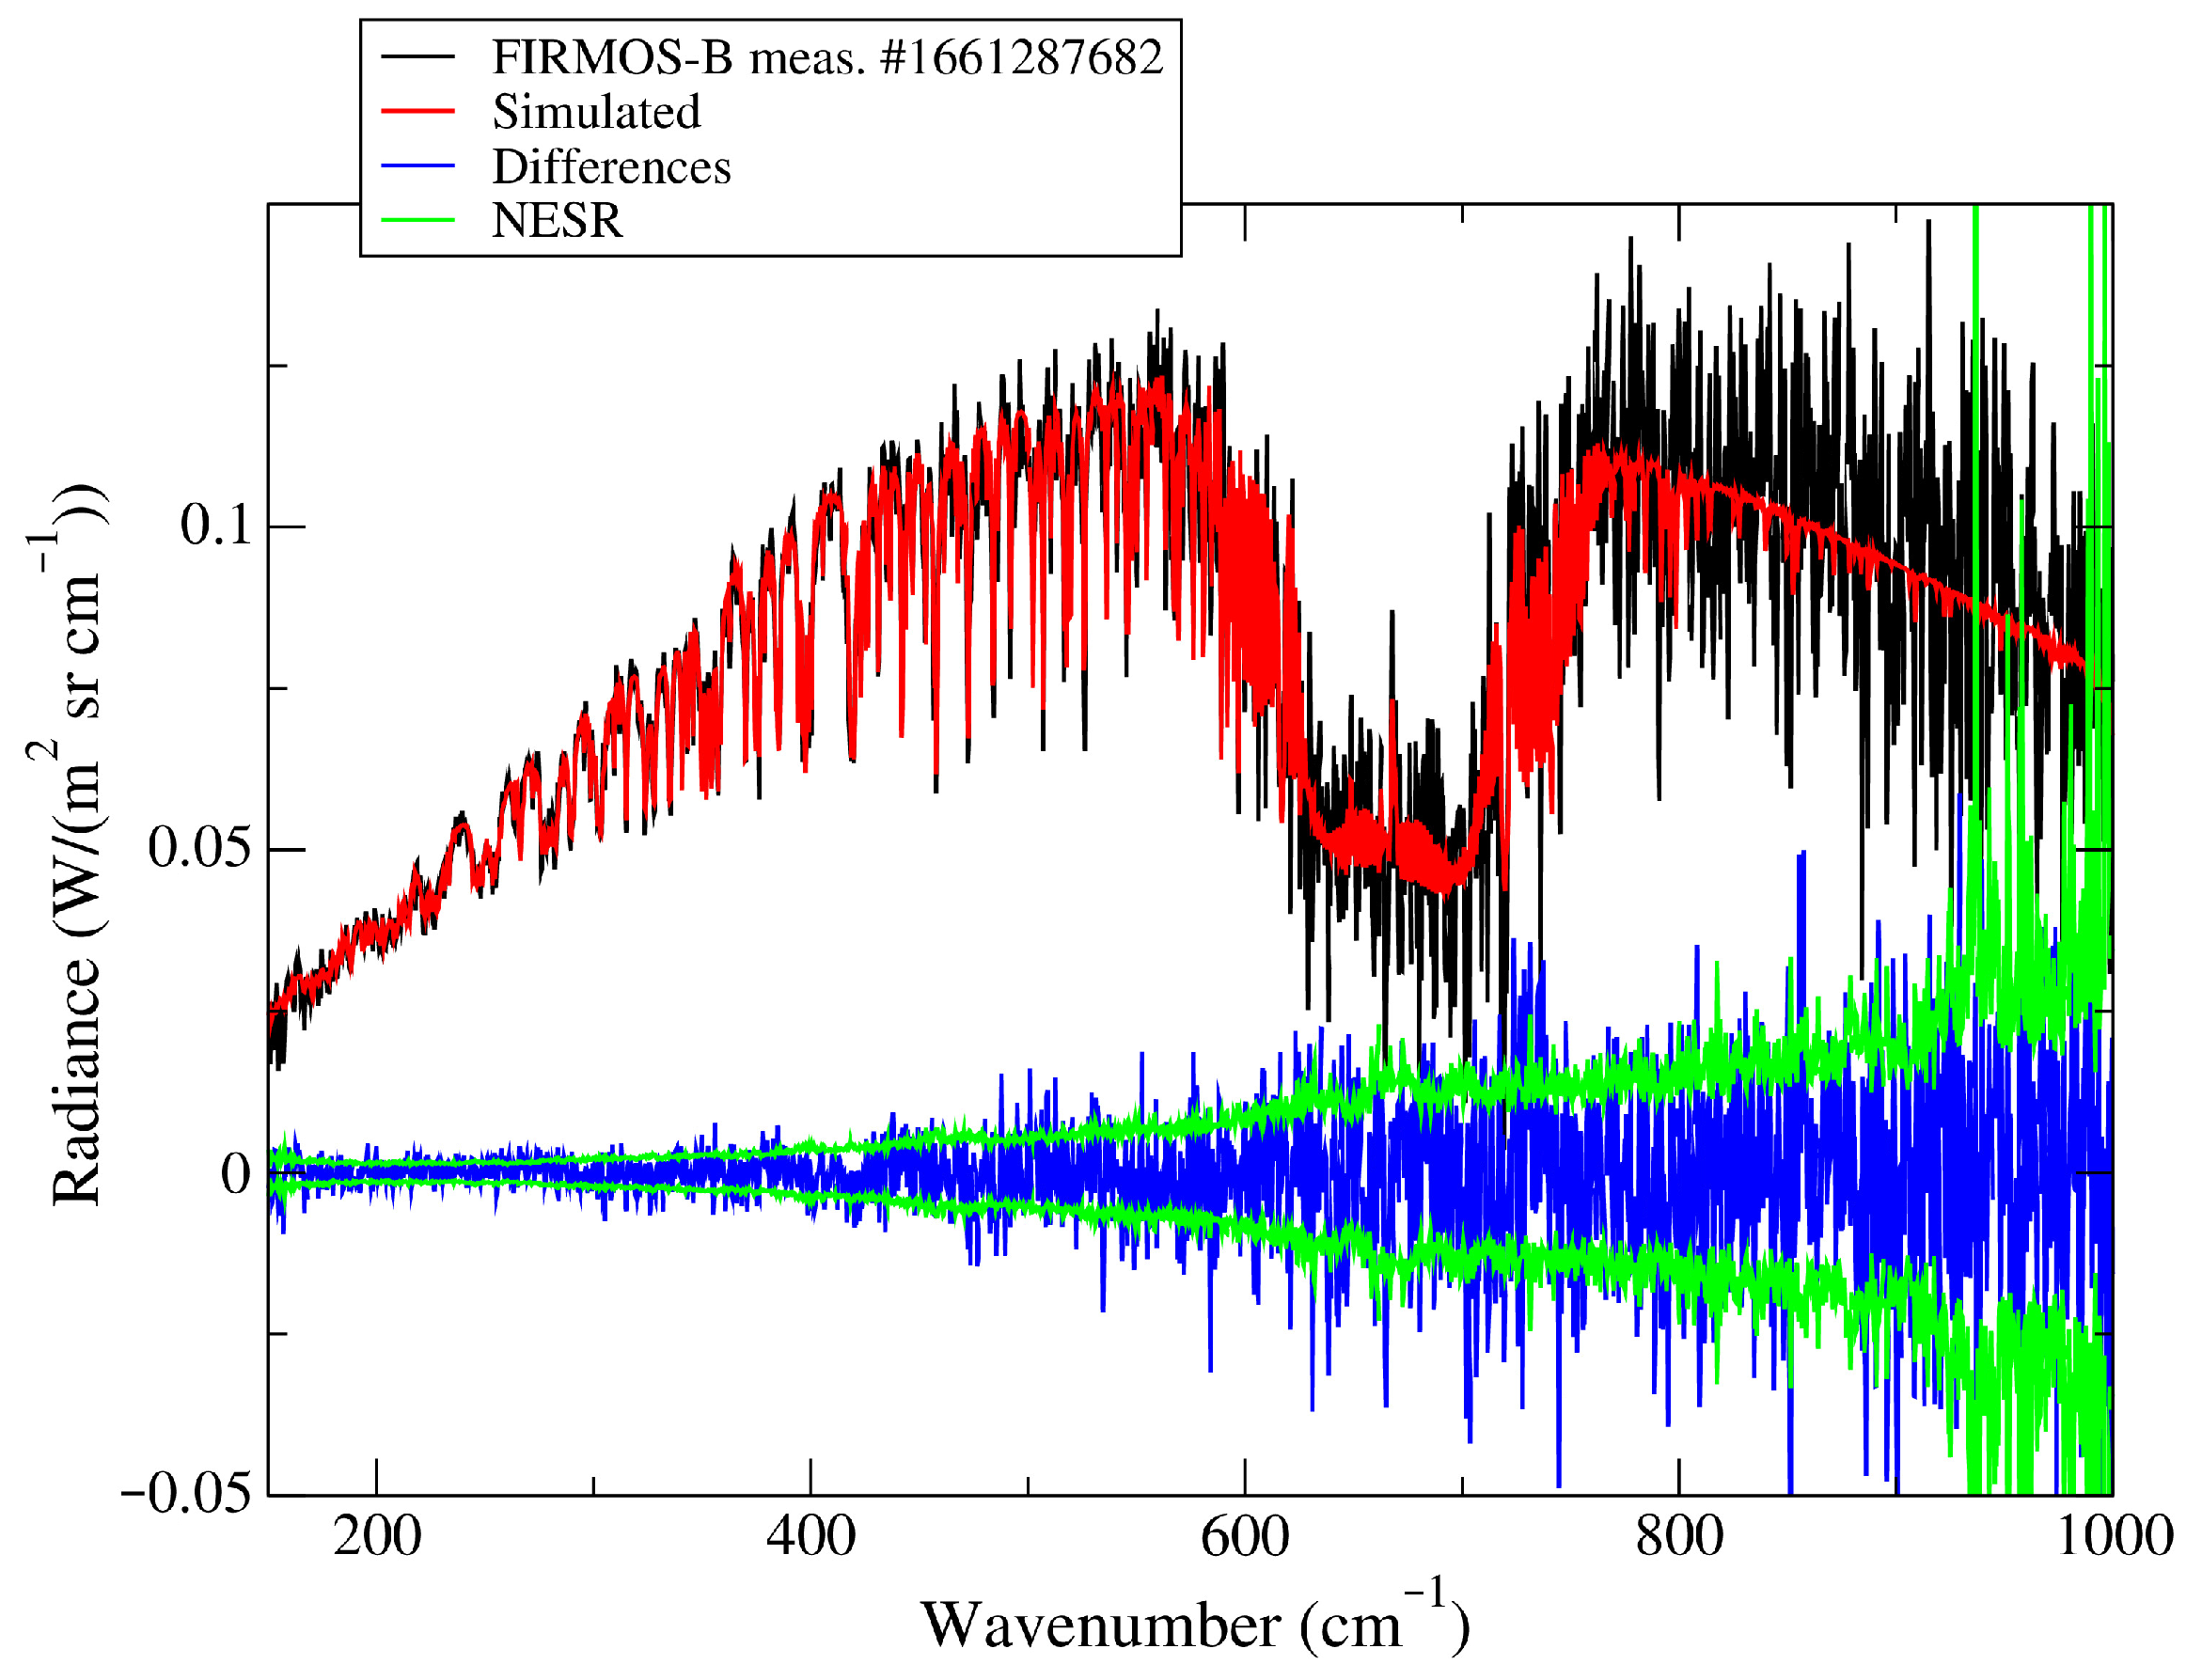
4.1. Spectral Fitting Results

As an example of results for the spectral fitting, a fitted spectrum (#1661287649) of the scenario f2s002 (the first complete sequence occurring in cloudy-sky conditions) obtained using SACR is shown in Figure 7 (red curve), together with the FIRMOS-B measurement (black curve). The difference (blue curve) between the measured radiance and the simulated spectrum is also plotted and compared to the instrument Noise Equivalent Spectral Radiance (NESR, green curve) calculated as in [37]. Residuals are inside the estimated NESR; as a matter of fact, the normalised cost function χ N 2 , which is the cost function divided by the number N of the spectral channels considered in the retrieval, is in this case equal to 1.08.

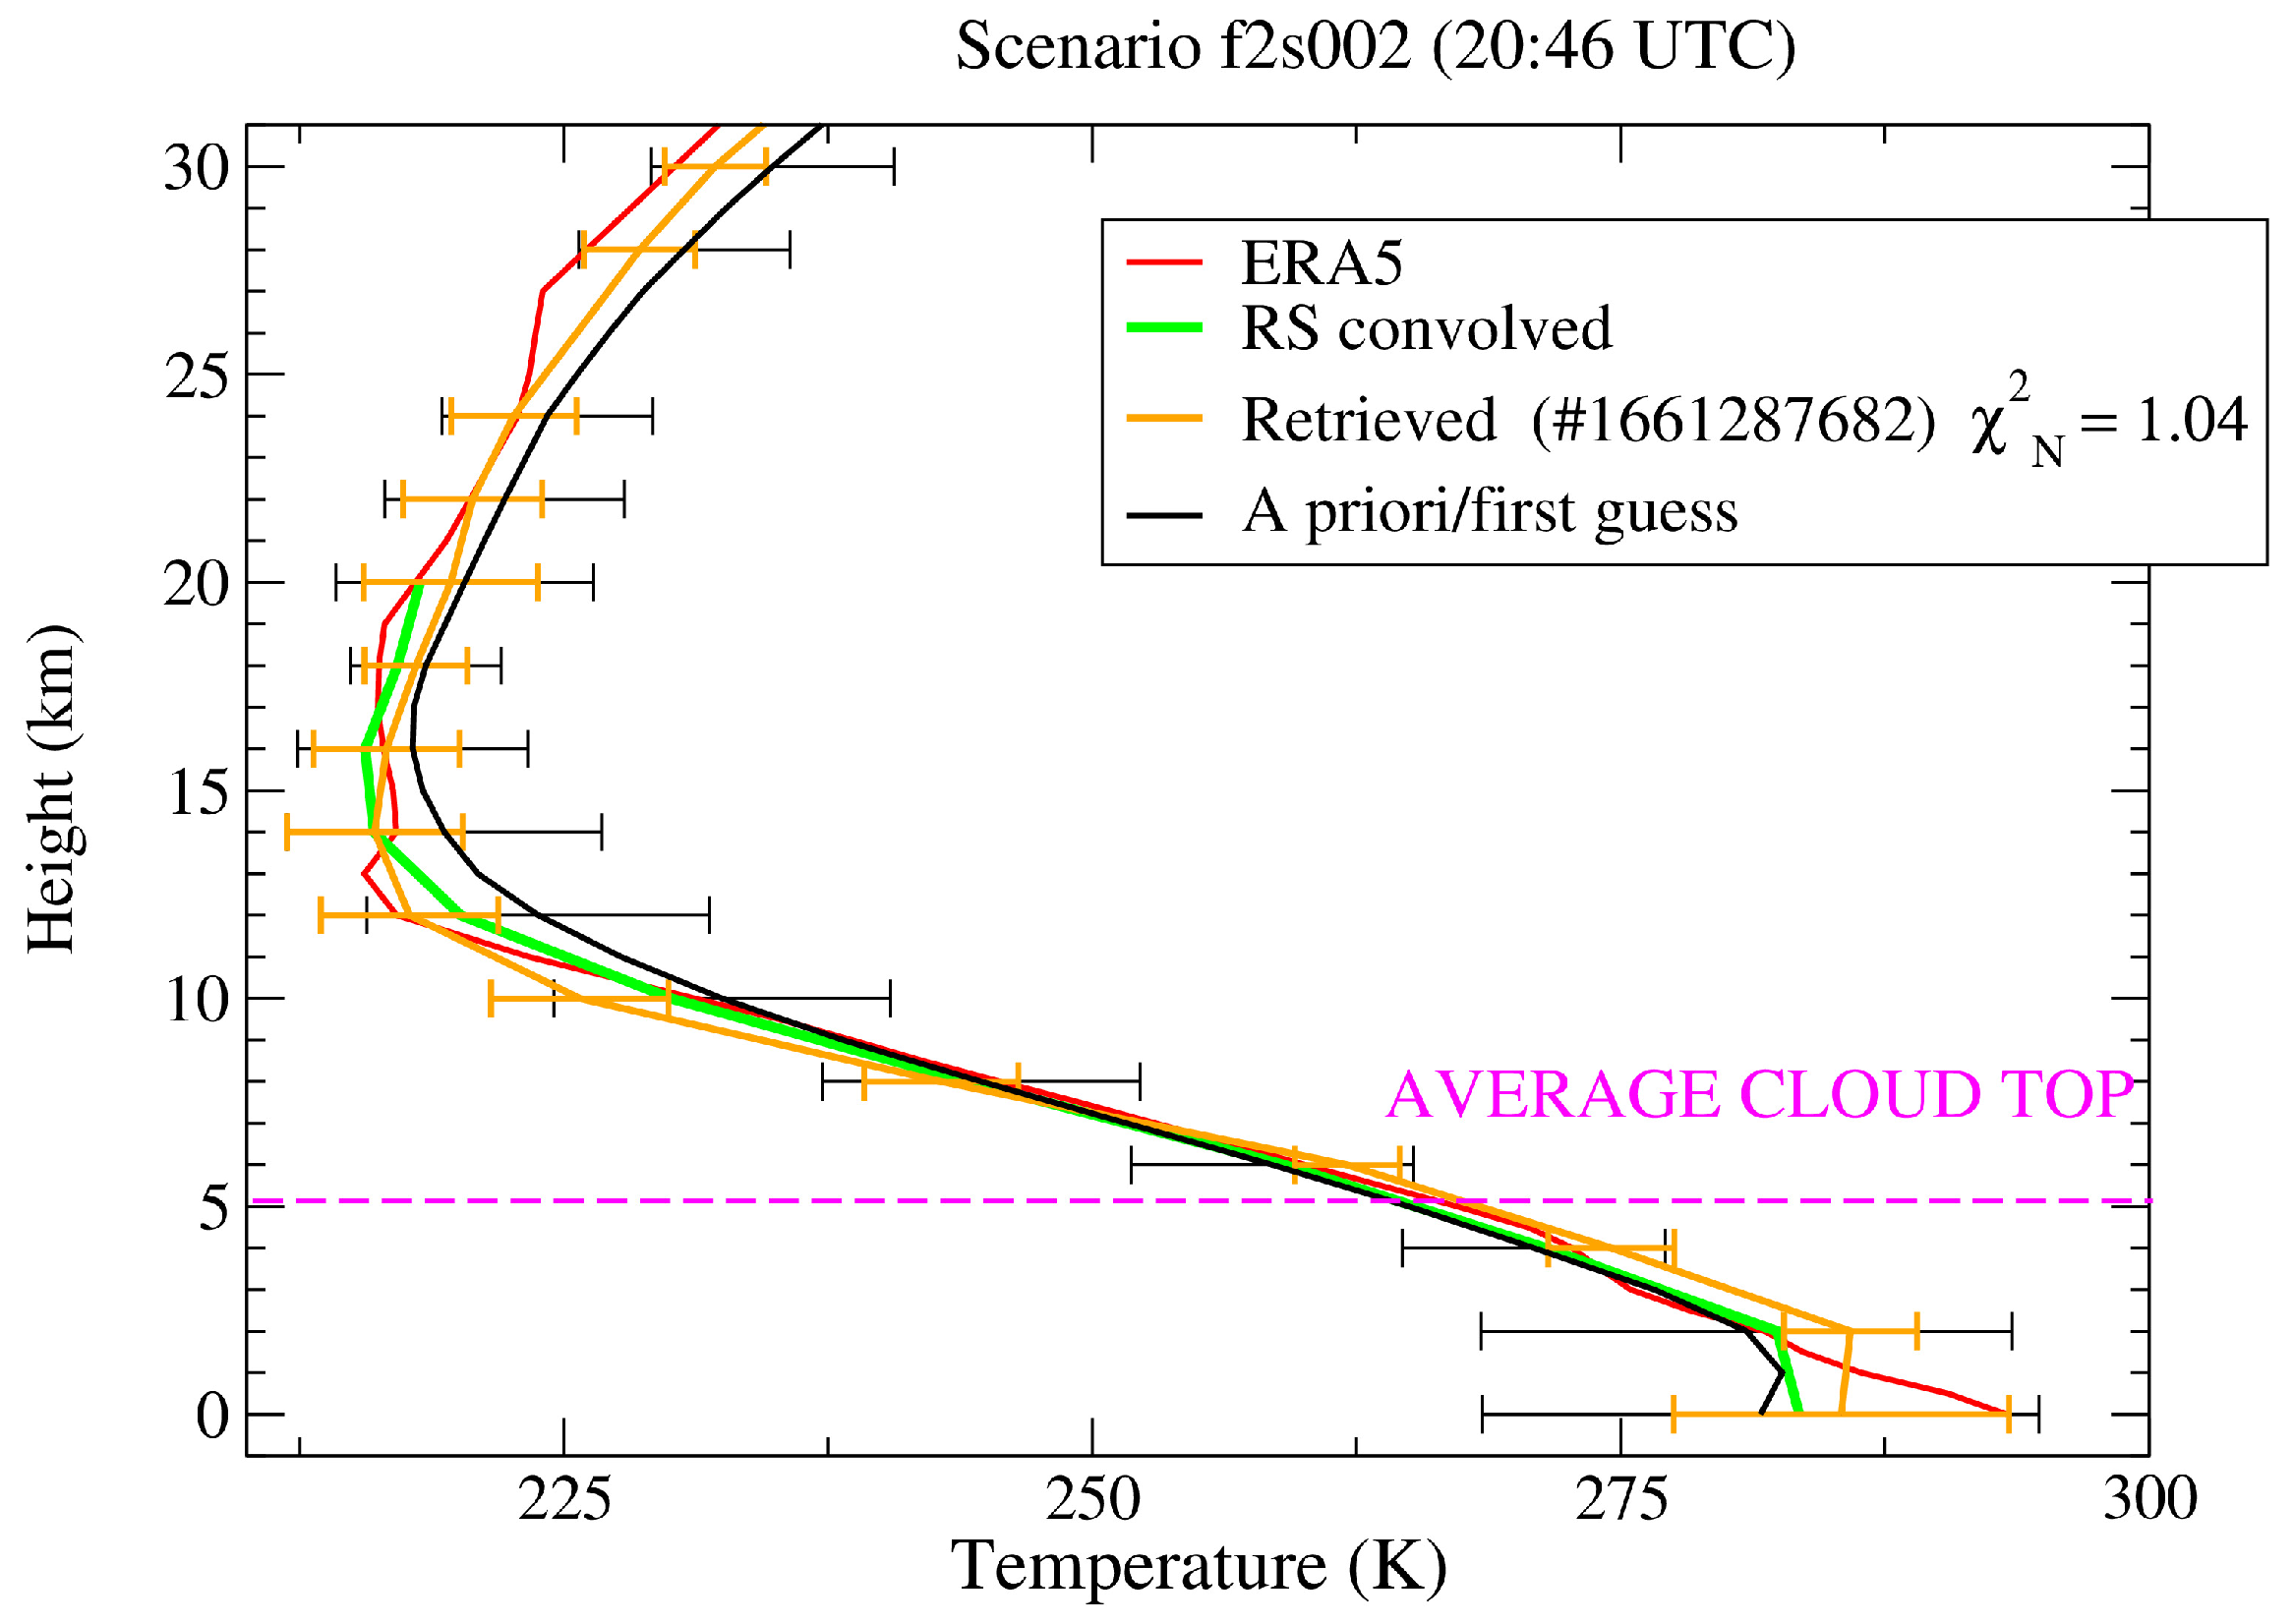
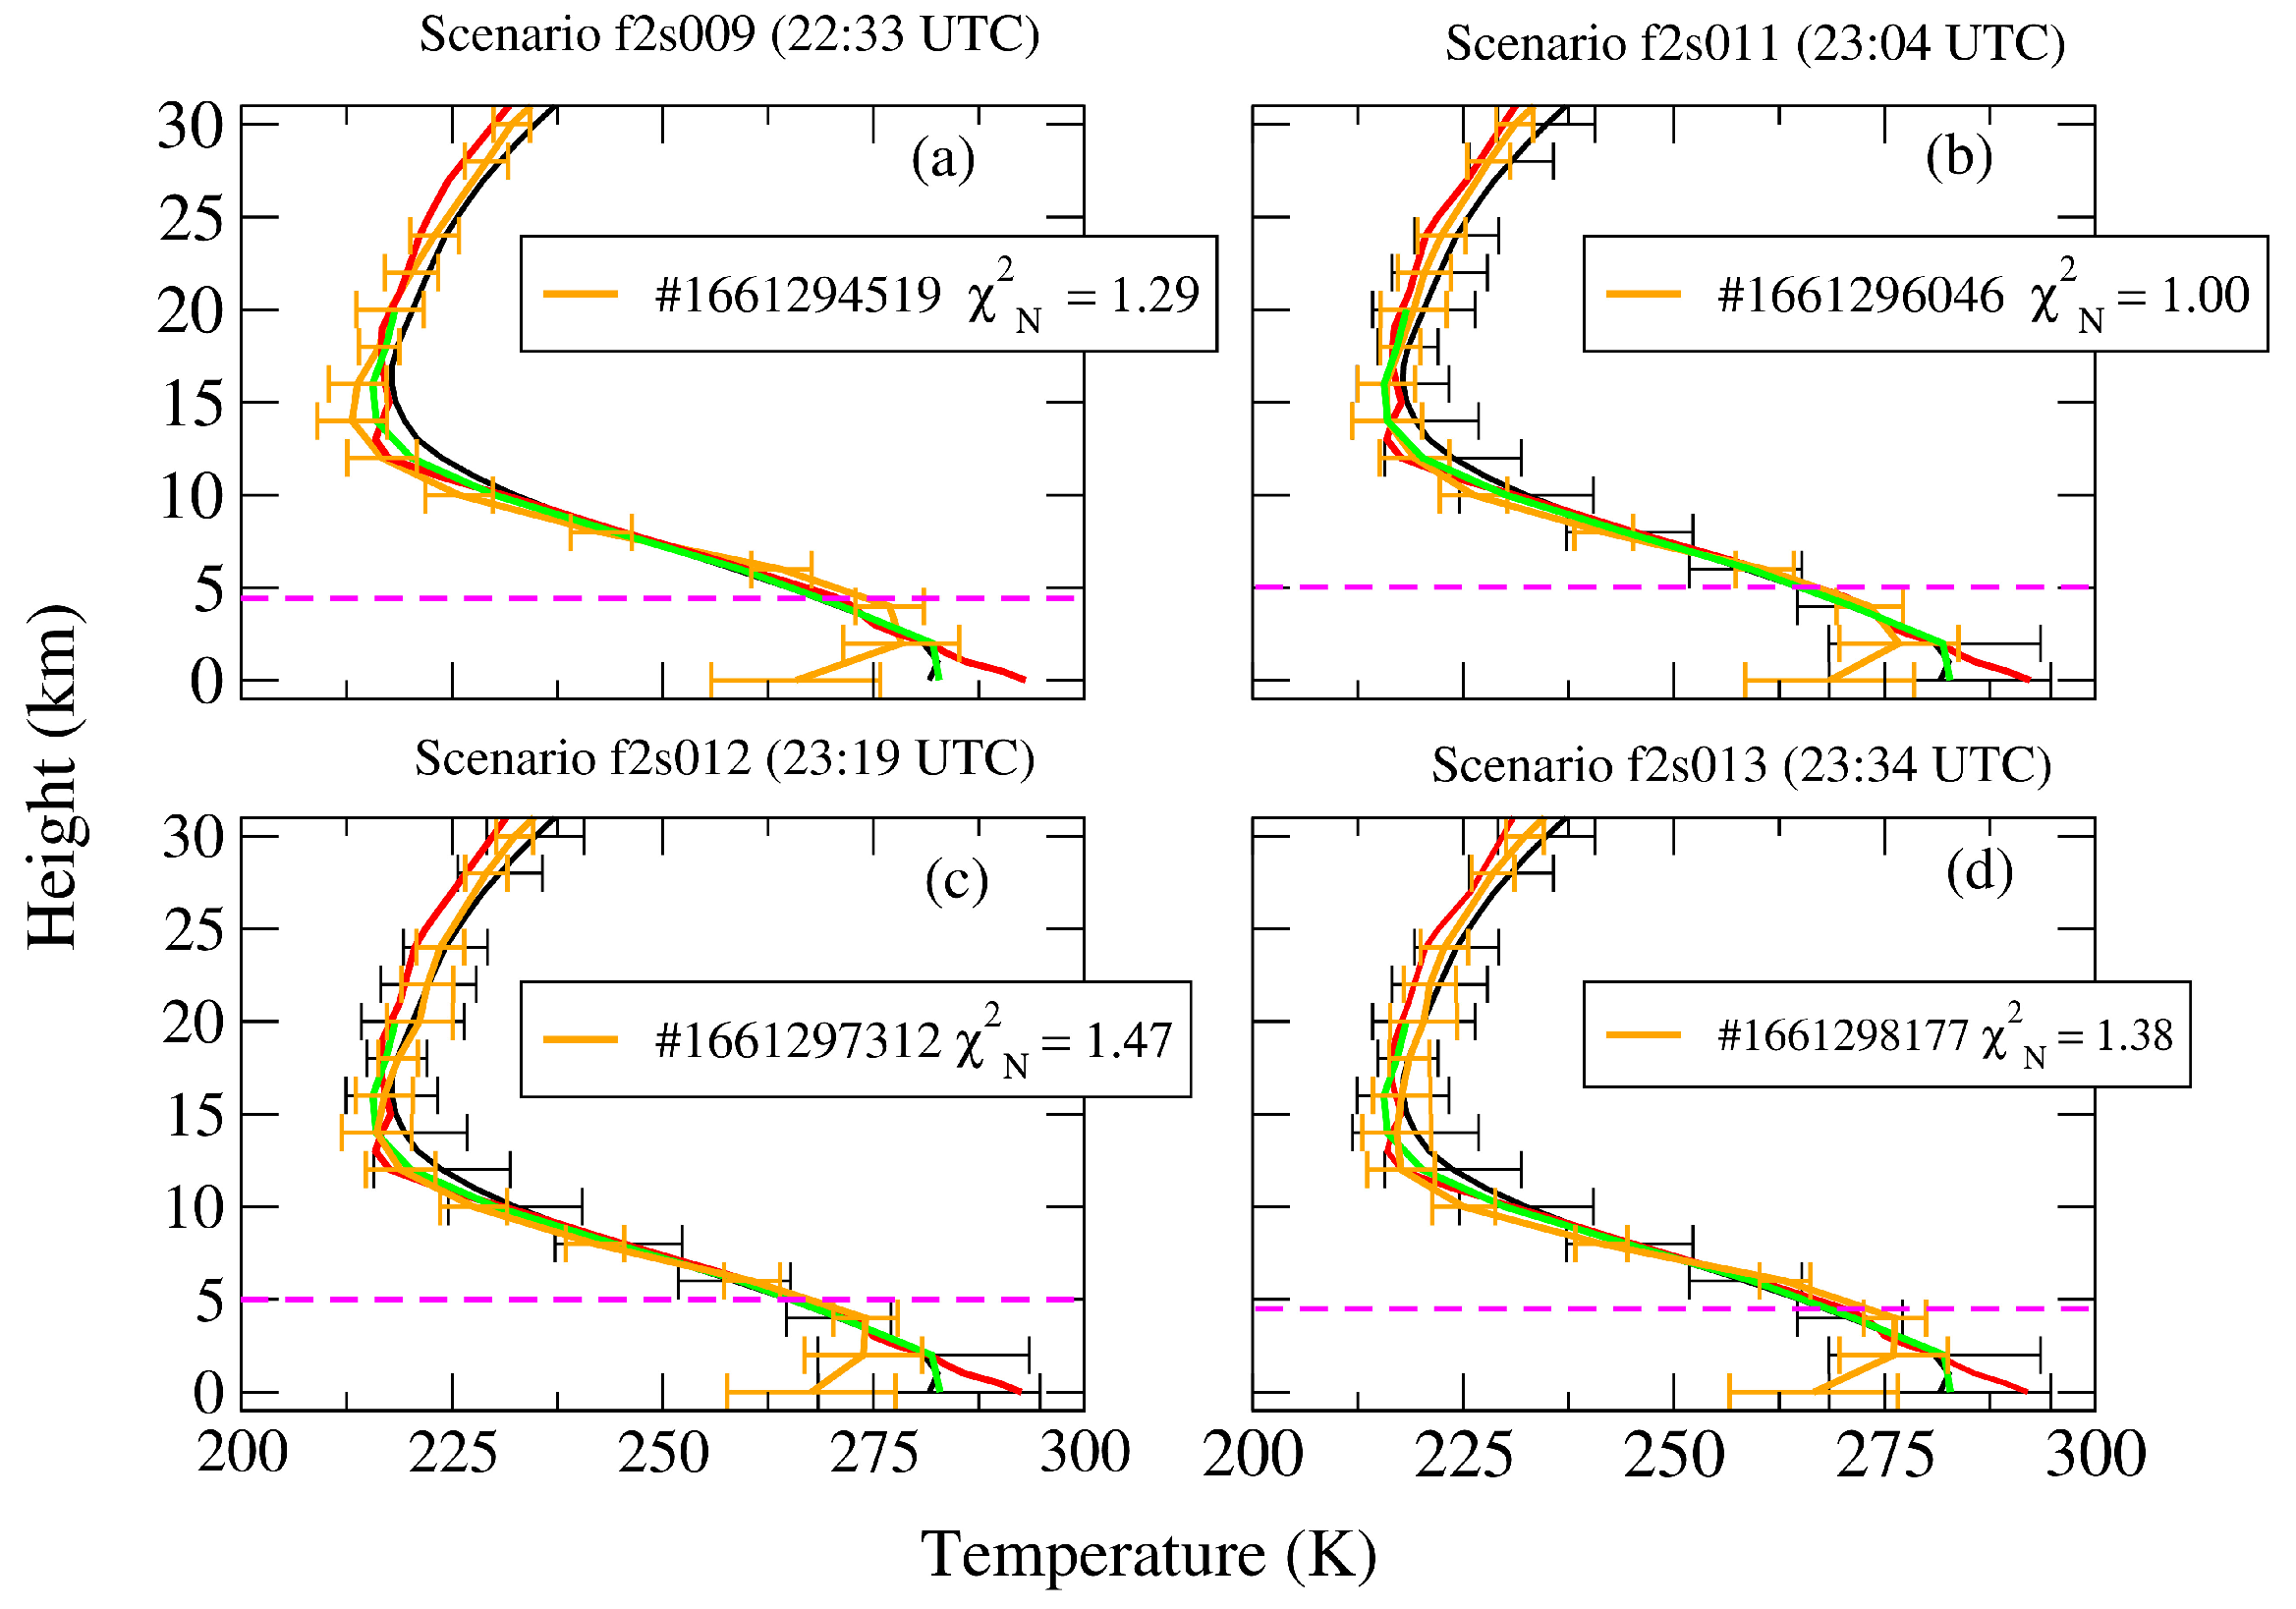
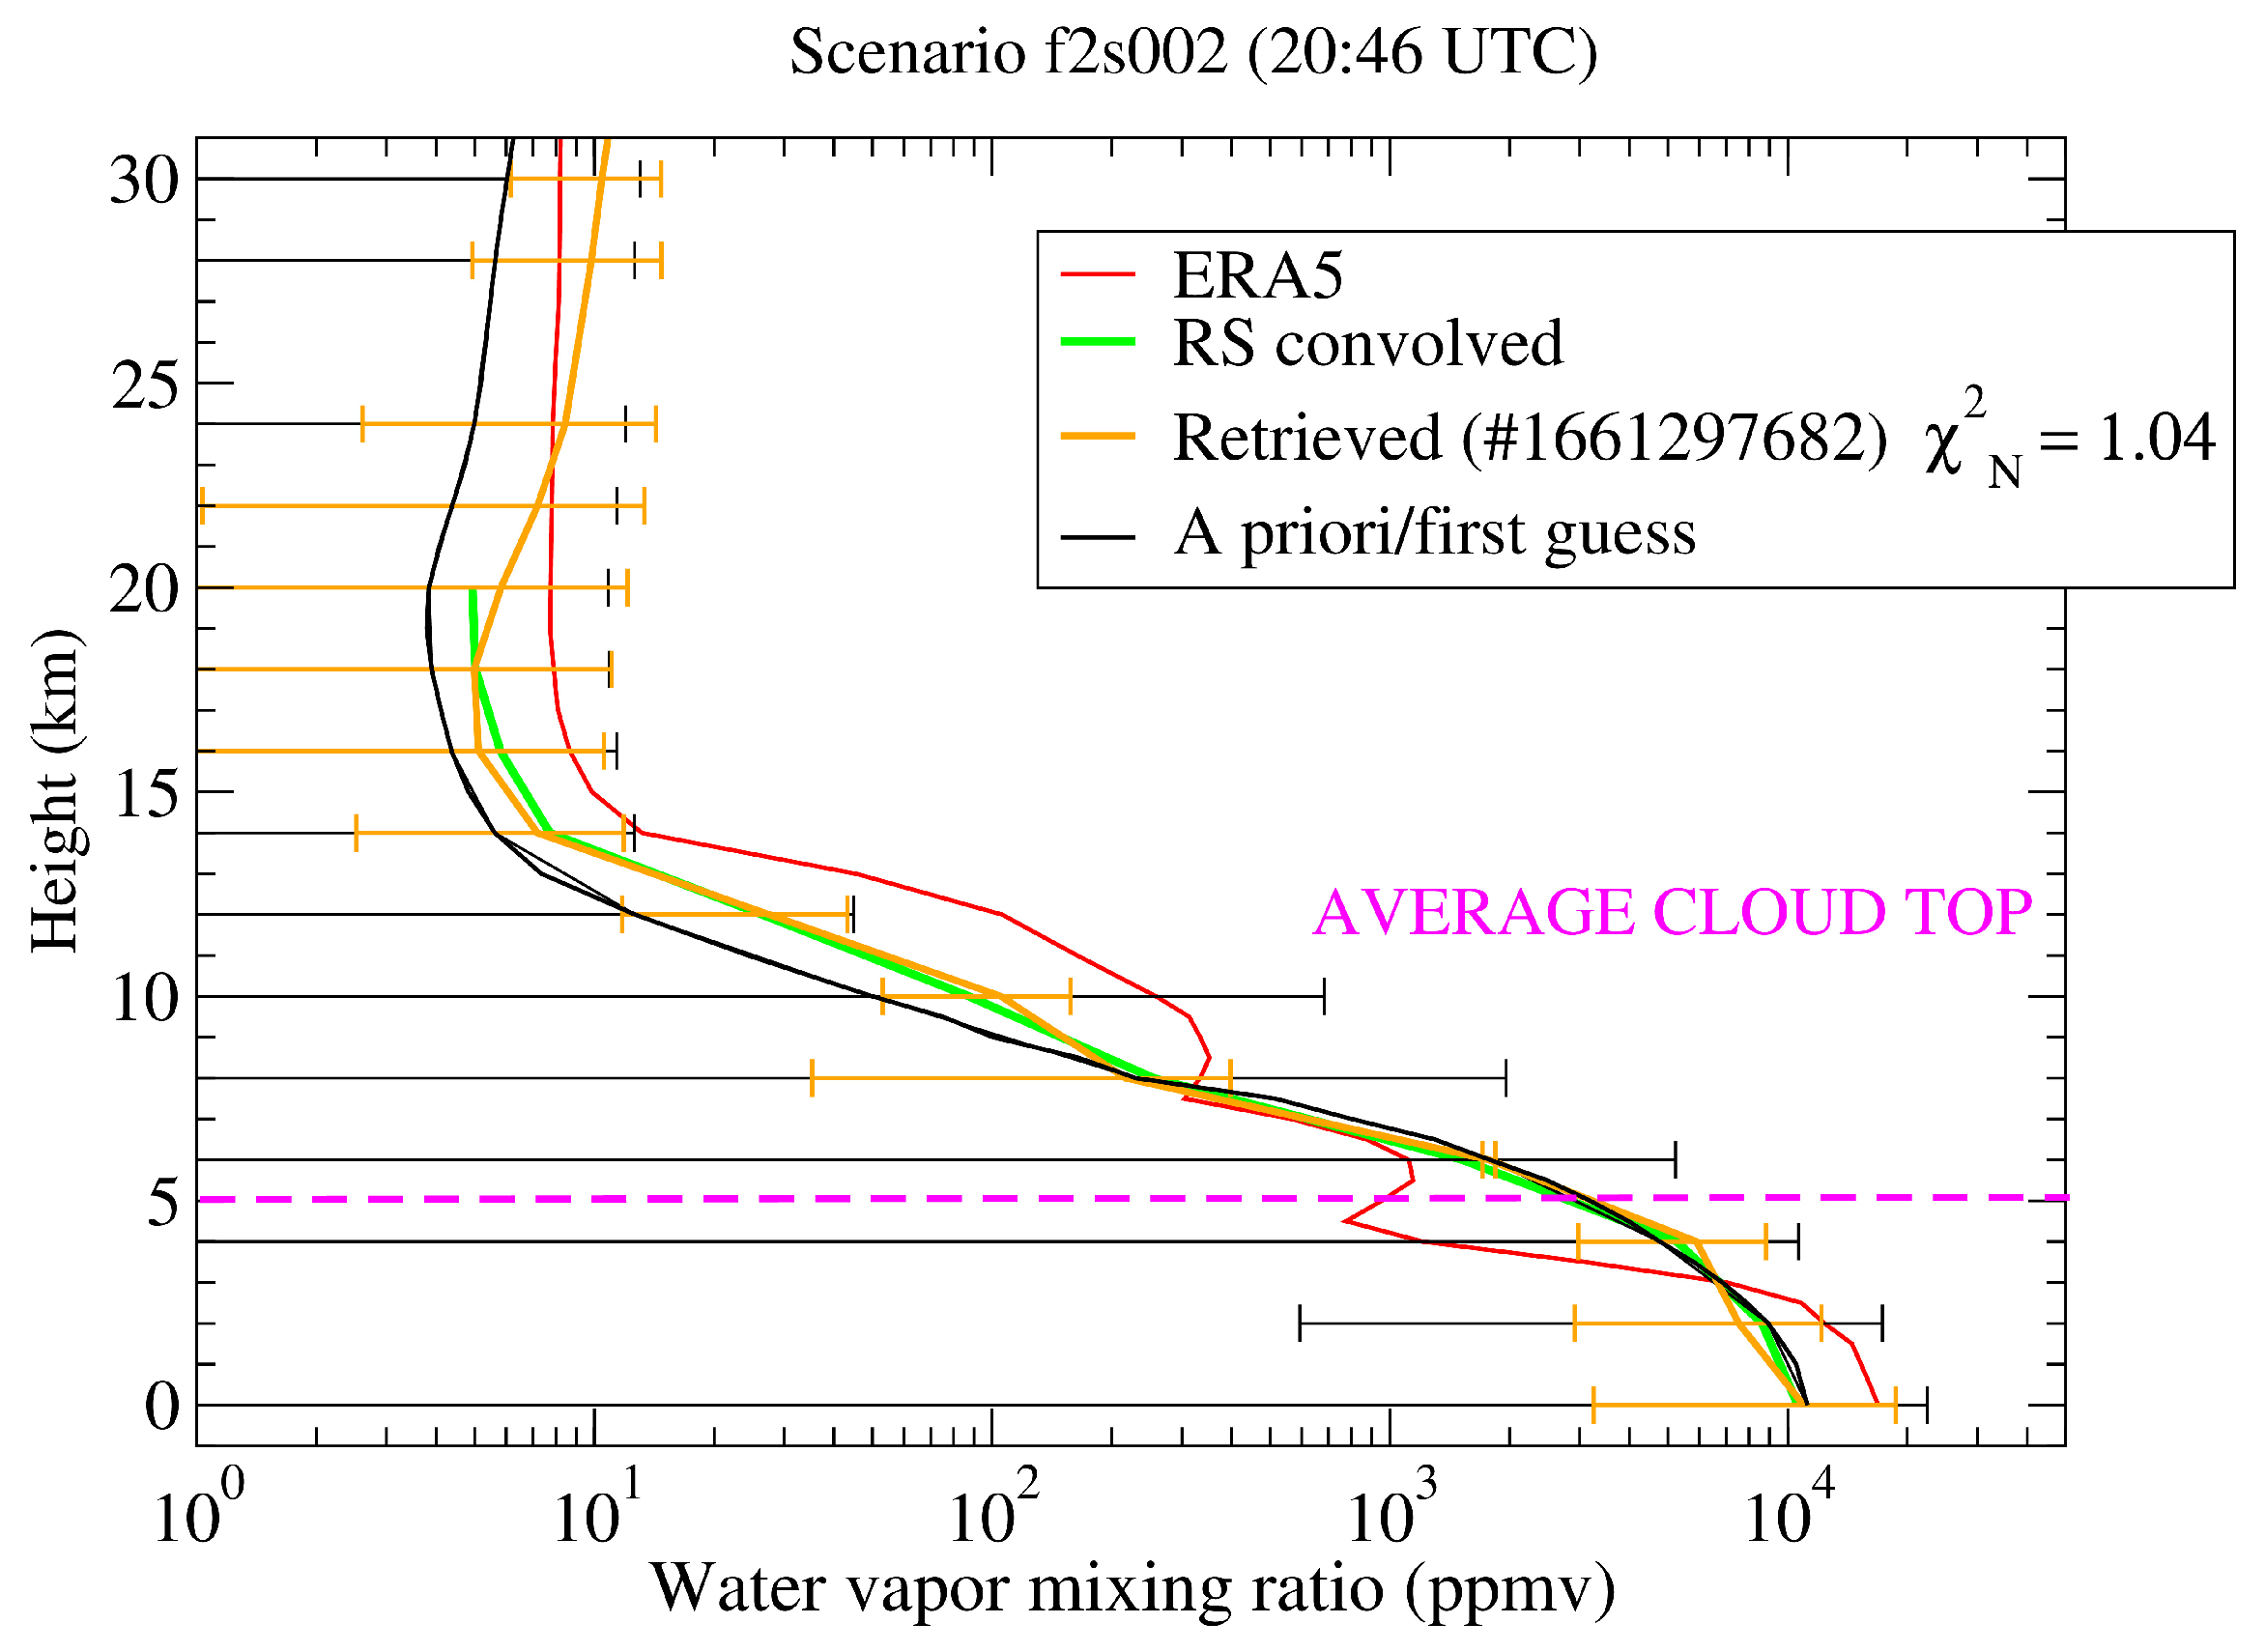
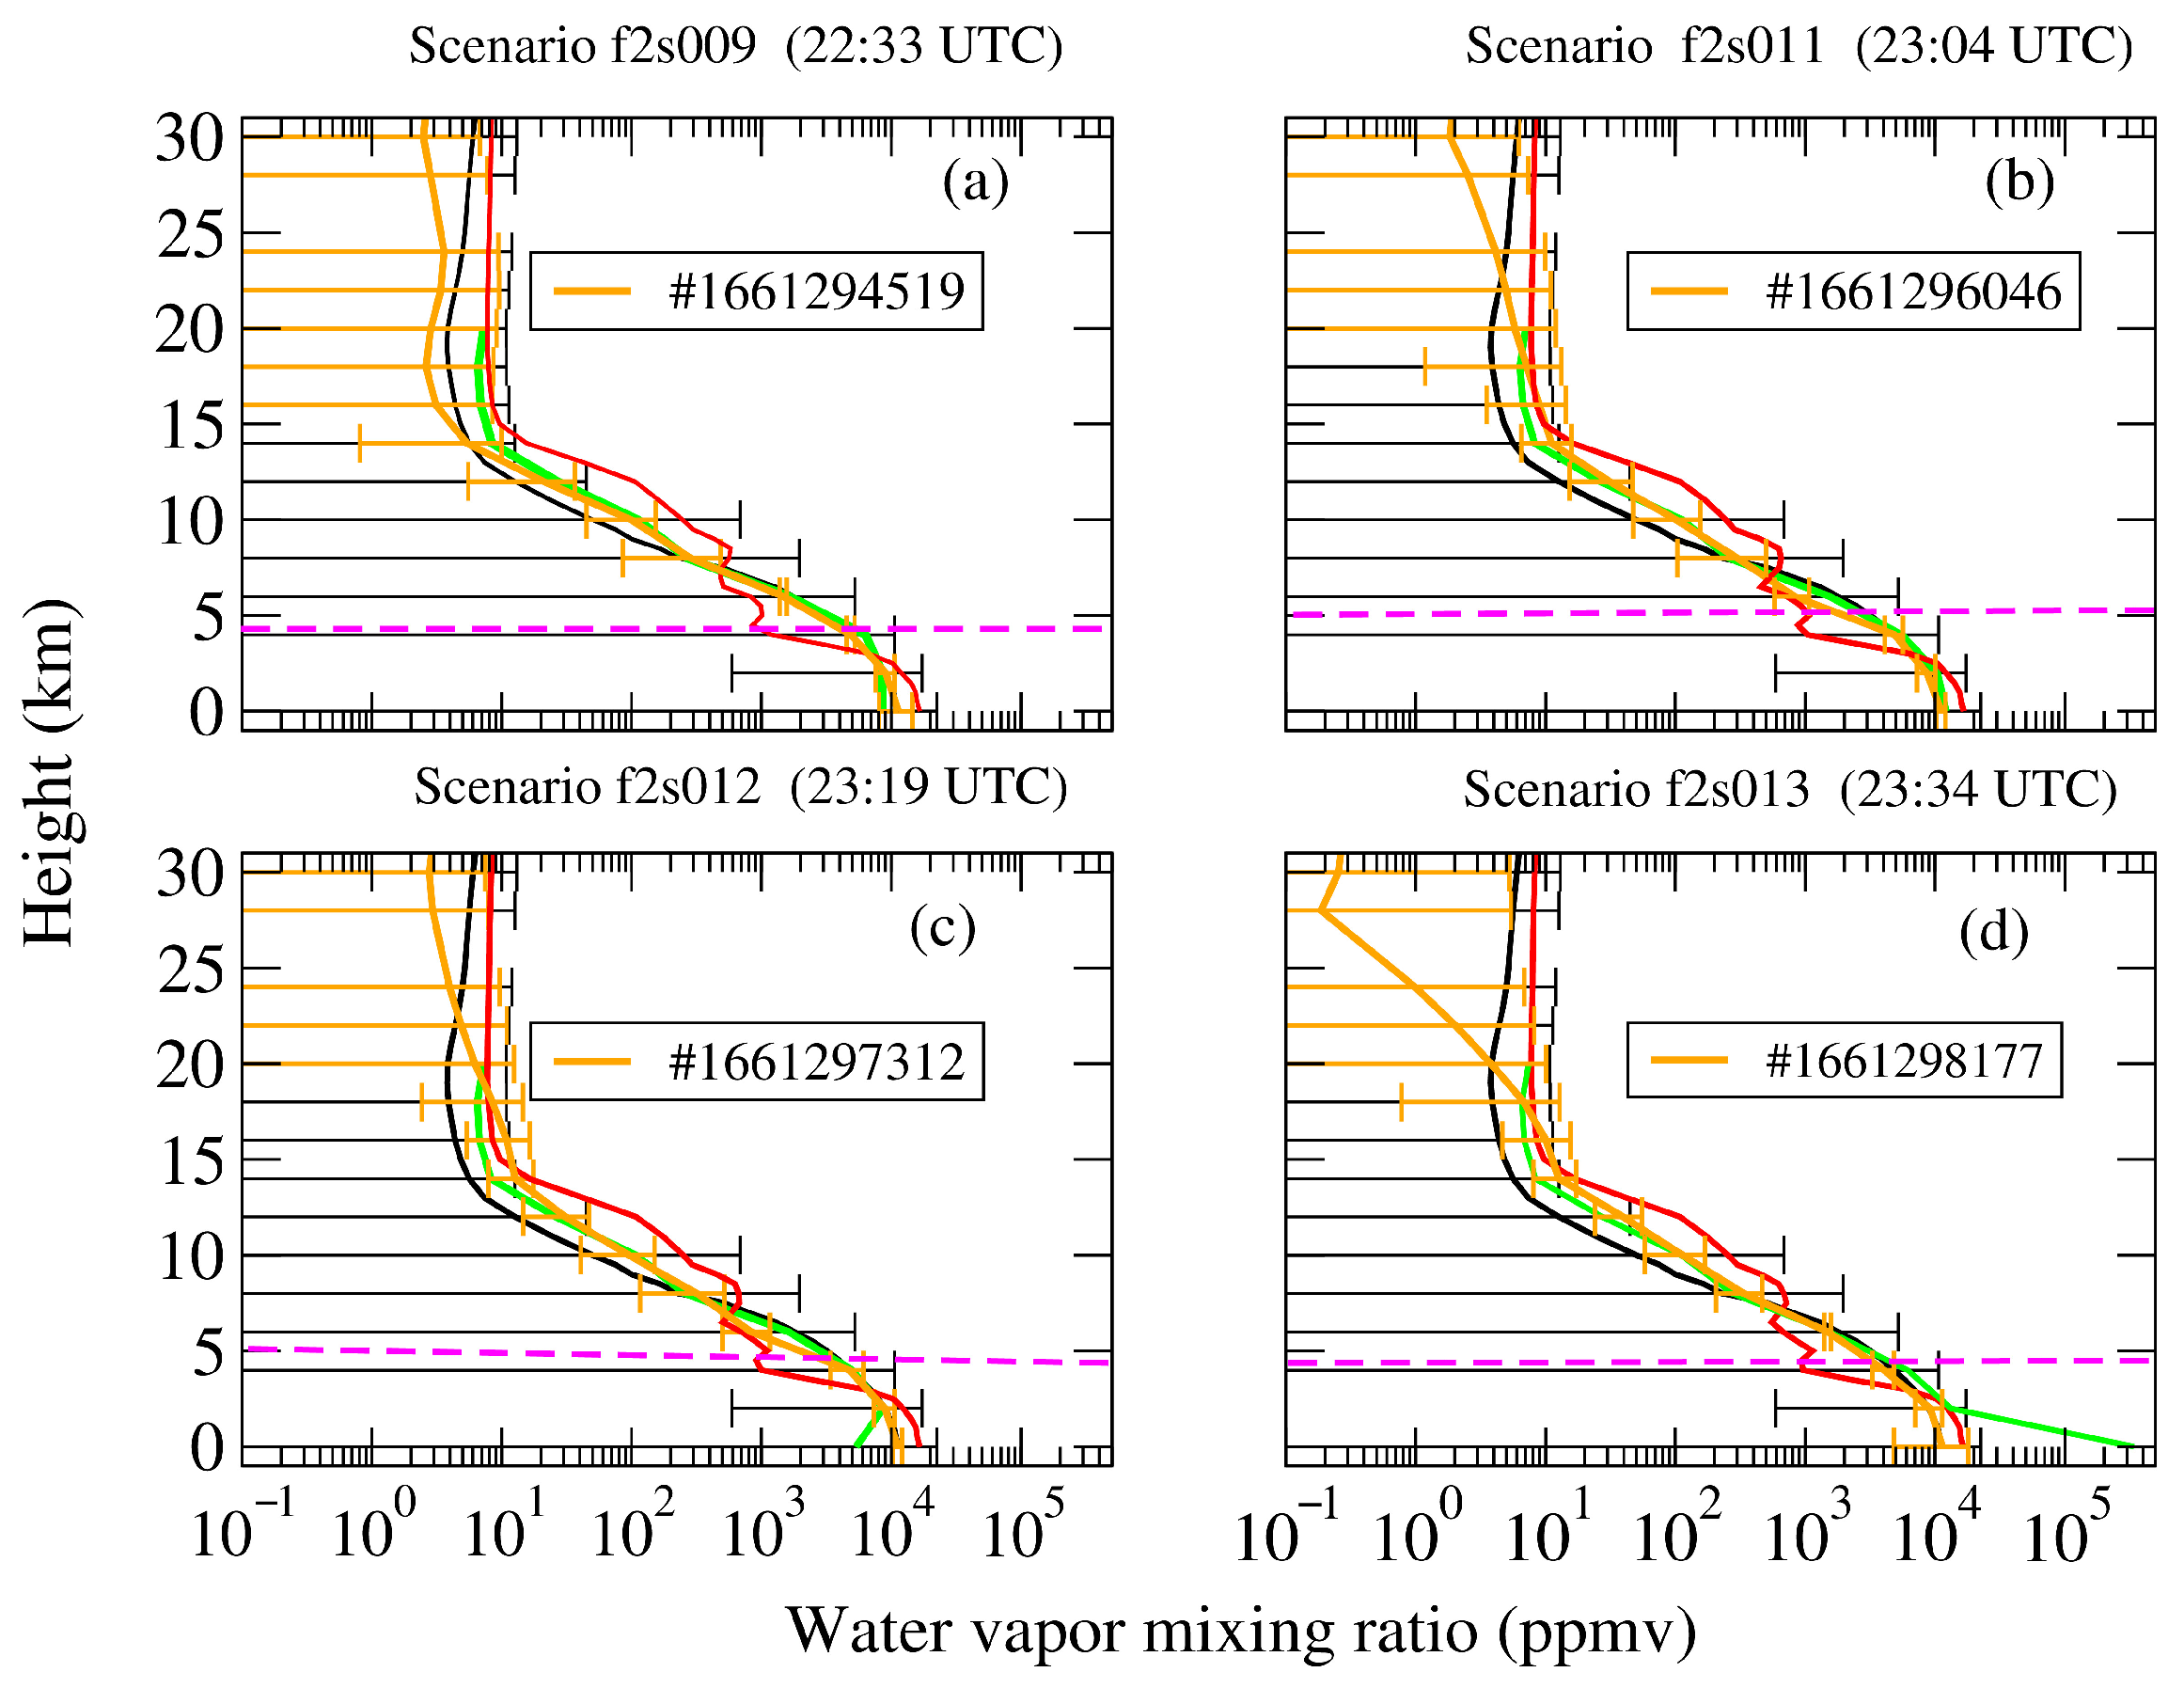
4.2. Retrieval of Atmospheric Profiles of Water Vapour and Temperature in the Presence of Clouds

Although all the above-mentioned codes are able to perform the retrieval of the atmospheric vertical profiles of water vapour and temperature, KLIMA does not include the retrieval in cloudy conditions. Here, for simplicity and better readability, we report only the products provided by SACR to be compared with the in situ measurements, while the FARM products are used in Section 4.3 to corroborate our results in cloudy conditions.
For the comparison, the radiosoundings were convolved with the retrieval averaging kernels (AK) A j (index j indicates water vapour or temperature) at the last retrieval iteration to take into account the resolution degradation due to the retrieved grid, coarser than that of radiosoundings, and the retrieval sensitivity that varies with height.
The expression of the convolved radiosounding is given by
P conv, j = A j · ( P j ( s ) P j a ( s ) ) + P a
where P j ( s ) and P j a ( s ) are the retrieved and a priori profiles, respectively, interpolated over the radiosonde profiles’ vertical grid, while P j denotes the a priori profiles over the assumed retrieval grid.
The retrieved water vapour and temperature profiles for all the analysed scenarios are in good agreement with the radiosoundings, as shown in Figure 8, Figure 9, Figure 10 and Figure 11. With respect to the a priori profiles, the retrieval allows an improvement on the precision with which the profiles are known of about 33% and 50% for water vapour and temperature, respectively.
In Figure 8, we show the comparison of the temperature profile retrieved from the spectrum #1661287682 of sequence f2s002 and in Figure 9a–d from other spectra of the sequences f2s009, f2s011, f2s012, and f2s013. Although there is a temporal mismatch and a not perfect co-location with the radiosonde, launched at about 18:30 UTC, about two hours before the first cloudy scenario, we found disagreement on temperatures only at the ground level. For the remaining levels, all values of radiosoundings are inside the retrieval error bars; this is also true just below the CTH, where we would expect a loss in the retrieval sensitivity.
Similarly, retrieved water vapour profiles compared to radiosonde profiles (convolved with AKs) are shown in Figure 10 for sequence f2s002 and in Figure 11a–d for the remaining sequences. The comparisons show that the values of the radiosonde profiles are inside the retrieval error bars at each retrieval level with the exception of the first one in sequences 6 and 7 (Figure 11c,d).
All the retrievals and radiosonde profiles are closer to the ERA5 profiles than to IG2, used as an a priori/initial guess, at least below the tropopause at 20 km; in the first three sequences (Figure 8 and Figure 9a,b), they are also closer in the lower stratosphere up to 30 km.
In general, the retrieval water vapour and temperature uncertainties are reduced with respect to the a priori errors; however, these values are significantly higher than the anticipated requirements for the corresponding FORUM-retrieved parameters.

4.3. Simultaneous Retrieval of Cloud Parameters

Cloud optical and micro-physical properties and the CTH were simultaneously retrieved with the atmospheric profiles and the surface temperature, using the SACR code. Independently, the FARM code was used to retrieve the IWC and LWC profiles along with the atmospheric profiles, surface temperature, and spectral surface emissivity, while the microphysics was set to 30 and 28 μ m for ice and water, respectively. Then, to compare the retrieval products from both codes, the CTH and the OD were derived from the IWC/LWC profiles retrieved with FARM. In Figure 12 we reported in orange the retrieved cloud OD (panel (a)), CTH (panel (b)), and the surface temperature (panel (c)). The a priori values (used also as an initial guess) with the corresponding error bars are indicated with the red and blue dashed lines, respectively. In the case of the ODs, the a priori value was set to 1 but the corresponding error is not shown since it is set to a value greater than 10 to avoid overconstraining the retrieval.
Figure 12a shows the good agreement between the ODs derived by the two retrieval codes. We see that the retrieved OD values obtained by the two codes are in accordance within the retrieval error bars, even though a small bias is present mostly in the scenarios f2s009 and f2s013. In fact, the average values found from all the scenarios are equal to 1.67 ± 0.06 and 1.17 ± 0.04, respectively, for SACR and FARM. These differences can be due to the fact that FARM retrieves the internal profiles of clouds in terms of IWC and LWC, while SACR retrieves only the integrated bulk properties. For the comparison, the effective diameters were fixed in FARM at the average value retrieved by SACR, since generally spectral radiance measurements do not show any sensitivity to the cloud’s internal vertical structure of particle sizes.
The retrieved CTHs are shown in Figure 12b. The CTH derived from FARM TWC profiles corresponds to the maximum height where the TWC profile is greater than the threshold defined in Section 3. SACR and FARM retrievals provide values in good accordance. In this case, the a priori CTH is derived from IWC/LWC profiles provided by the ERA5 database and is equal to 4.8 km with an error set to 4 km. The CTHs retrieved by SACR and FARM, neglecting those higher than 10 km, are on average (5.17 ± 0.06) km and (5.22 ± 0.10) km, respectively, and are in agreement within a 1- σ error.
The retrieved surface temperatures are shown in Figure 12c. The red dashed lines represent the a priori values used for the retrieval with SACR and are equal to the ERA5 values (on average 292 K) with an associated error of 2 K (blue dashed lines). For the retrieval using FARM, an a priori error of 4 K is used (not shown in the figure for better clarity). It is worth noticing that during the sequence f2s002 (indexes between 1 and 34 in Figure 12), where the ODs are smaller, the surface temperature is almost coincident with that provided by ERA5 but in some cases, the CTHs are probably overestimated with values that seem unrealistic. In the subsequent sequences, when the retrieved ODs increase, the surface temperature retrieved by SACR is slightly lower than ERA5 (about −1.5 K), while that retrieved by FARM is slightly higher (about +0.8 K); nevertheless, they are both still consistent within the error bars. It should be noted that the slight discrepancy between SACR and FARM might be attributed to the different retrieval approaches, with FARM also fitting the spectral surface emissivity, which is strongly correlated with surface temperature, as shown in [51,65].
Although the FIRMOS-B measurements show a good sensitivity to the cloud OD and CTH, as mentioned above, we found that the effective diameters of the ice crystals and the ice fraction are retrieved with large errors, as shown in Figure 13a, even greater than 100%. The solid lines represent the fixed value set equal to 30 μ m used by FARM (green solid line) to retrieve the IWC and LWC. On the other hand, SACR is able to determine the D e w (red curve) with good precision, and the values mostly include the fixed value set to 28 μ m used by FARM (yellow solid line) to retrieve the IWC and LWC. We also find large retrieval errors in the ice fraction γ provided by SACR (orange curve), as shown in panel (b), which also includes the values derived from FARM (green curve). In panel (c) the normalized χ N 2 is also reported to indicate the good quality of the fit, since only a few cases in the first and second sequence show values larger than 2. The large uncertainties found in the retrieval of the ice effective diameters and the ice fraction are mostly due to the fact that these parameters are strongly sensitive to the slope of the spectrum in the atmospheric window but this portion of the spectrum is measured by FIRMOS-B with high noise. As a result, an increase in the measurement noise makes the solution largely variable. Conversely, the OD and CTH parameters are more sensitive to a translation of the spectrum, which is less affected by measurement noise.
The total degrees of freedom (DOFs) of water vapour and temperature profiles depend, in the presence of a cloud, on the value of the cloud optical depth. Generally, the larger the optical depth, the lower the number of DOFs; the dependency is stronger for water vapour. For example, the average DOFs calculated for all the retrieved cloudy cases are 5.7 and 5.0, for water vapour and temperature, respectively. If we consider only cases with OD < 1, the DOFs increase to 6.2 and 5.2 and if we select cases with OD < 0.5, they further increase up to 6.7 and 5.3, respectively.
This measurement demonstrates the capability to retrieve OD, CTH, and Ts with good accuracy, consistent with the expected uncertainties required by the FORUM products [49] even under the high measurement noise of about 1 mW m−2 sr−1 cm in the FIR provided by FIRMOS-B in this flight. On the contrary, the retrieval of the effective diameters and the ice fraction requires a lower noise level, such as that specified for FORUM.

5. Retrieval of Surface Emissivity in Clear-Sky Conditions

For the clear-sky sequences f1s002 and f1s007 (pictures shown in Figure 14), we performed the retrieval of the surface spectral emissivity using both the KLIMA and the FARM codes. The two codes use two different spectral resolutions to retrieve the surface emissivity, i.e., 100 cm−1 and 50 cm−1, respectively.
Figure 15 shows that FIRMOS-B measurements are sensitive to the ground emissivity only in the spectral band between 700 and 1000 cm−1, where the retrieved values deviate from the a priori values. This is because at the latitude of Timmins, the amount of the total column of water vapour is too high (between 20 and 25 mm) to retrieve the surface emissivity from the FIR portion of the spectrum.
The retrieval results obtained from the two codes for the sequences f1s002 (left panel) and f1s007 (right panel) are shown in Figure 15. The results for sequence f1s002 are not adequate, probably because during this sequence the balloon was still in the ascending phase, so the scene observed at nadir was rapidly changing. In the other case, during sequence f1s007, the balloon was at the ceiling constant altitude, the observed scene was more stable, and the results obtained from the two codes are in good agreement. As a reference, the retrieved surface emissivity is compared with the modelled values provided by the Huang database [66] for the type of surface that could be found in the area. The best agreement is with the emissivity values of a surface covered in dry grass.

6. Conclusions

Far-infrared stratospheric spectral radiance measurements of the Earth’s outgoing radiation in the 100–1000 cm−1 range were performed in all-sky conditions in August 2022 by the FIRMOS-B spectroradiometer from a stratospheric balloon launched as part of the HEMERA 3 field campaign over Timmins, Canada.
In cloudy conditions, from seven selected scenarios, we performed a simultaneous retrieval of the cloud optical and micro-physical properties, cloud top height, together with the atmospheric profiles of water vapour and temperature and the surface temperature. For these scenarios, the results obtained with two independent forward model/retrieval codes, SACR and FARM, were in good agreement for all the retrieved cloud properties. The cloud ODs ranged between 0.15 and 3.50, with a mean value of 1.67, the CTHs had a mean value of 5.2 km, and the mean particle effective diameters were 30 μ m. For the ice micro-physics, the retrieval study showed poor sensitivity as a consequence of the relatively high measurement noise. Similarly, the resulting ice fraction, i.e., the thermodynamic phase, was also determined with a large uncertainty.
In clear-sky conditions, for the two selected scenarios, together with the atmospheric variables, we also retrieved the surface spectral emissivity. For these retrievals, the results obtained from two codes, KLIMA and FARM, showed the best match with the modelled dry grass emissivity values provided by the Huang database. The results also indicated that we had information only in the spectral band between 700 and 1000 cm−1, because of the opacity of the atmosphere in the FIR spectral region due to the high amount of water vapour present at the mid-latitudes.
The retrieved atmospheric profiles of water vapour and temperature were in all cases in good agreement with the vertical profiles measured with radiosoundings, after convolution with the averaging kernels obtained at the last retrieval iteration. Only the temperature of the layer closest to the ground under cloudy conditions was in most cases not consistent with the radiosounding values, probably due to the loss of sensitivity below the cloud.
This analysis represents the attempt to simultaneously retrieve atmospheric profiles, and cloud and surface properties from outgoing FIR spectral radiances measured from a stratospheric balloon platform. We show that by using two independent analysis codes that work differently in retrieving the cloud properties, we obtain results in good agreement between the models, taking into account the retrieval errors. The results show that we can recover cloud OD, particle size, and CTH with good accuracy, despite the relatively high measurement noise of the FIRMOS-B observations used in this study.
These results are very promising in view of the upcoming FORUM satellite mission that will provide high-accuracy measurements of the TOA outgoing FIR spectral radiances on a global scale, useful to constrain climate models and improve our understanding of the forcing/feedback mechanisms that influence Earth’s radiation budget. The simultaneous retrieval approach, presented in this paper, confirms that a noise of about 1 mW m−2 sr−1 cm in the FIR is adequate to perform the retrieval of the cloud OD and CTH, and the Ts with the required accuracy. On the contrary, the other cloud parameters, the surface emissivity, and the vertical distribution of water vapour concentration require improved noise performance, such as that anticipated for the FORUM spectrometer of 0.4 mW m−2 sr−1 cm in the FIR. Nevertheless, this approach has demonstrated the capability to simultaneously retrieve atmospheric, cloud, and surface properties from FORUM-like measurements collected from the stratosphere by FIRMOS-B in a nadir-view geometry. These results can therefore contribute to the preparation of the algorithms that will be used to analyse the measurements delivered by the FORUM mission.

Author Contributions

Conceptualization, G.D.N.; data curation, G.D.N., C.B., M.R., S.D.B., B.M.D. and L.P.; funding acquisition, L.P.; investigation, C.B., M.B., S.V., F.D. and L.P.; methodology, G.D.N.; project administration, L.P.; software, G.D.N., M.R., S.D.B. and B.M.D.; writing—original draft, G.D.N.; writing—review and editing, L.P. All authors have read and agreed to the published version of the manuscript.

Funding

This research and the campaign participation were funded by FIRMOS–Balloon—Technical Assistance for a Far-Infrared Radiation airborne Observation System (EE9 Forum) Project, ESA Contract No. 4000137321/22/NL/AD. The campaign participation was partially supported by the EU Horizon 2020 research and innovation programme HEMERA (grant no. 730970). The FARM code was developed within the ASI-supported agreement FIT-FORUM—Forward and Inverse Tool for FORUM (agreement n. 2023-23-HH.0, CUP n. F33C23000240005).

Data Availability Statement

Data of FIRMOS-B Level 1 measurements and Level 2 analysis are available on request to the authors.

Acknowledgments

We are grateful to the CNES balloon team for the HEMERA 3 campaign organisation in Timmins (Ontario, Canada) in August 2022. We thank the EMM (Earth–Moon–Mars) project funded under the National Recovery and Resilience Plan (NRRP), Mission 4, Component 2, Investment 3.1, Action 3.1.1, funded by the European Union—NextGenerationEU.

Conflicts of Interest

The authors declare no conflicts of interest.

Appendix A. Conversion from Ice/Water Mass Mixing Ratio to Integrated Ice/Water Path (IWP/LWP)

From the mass mixing ratio profiles for water ( q w a t ) and ice ( q i c e ), liquid and ice water content (LWC and IWC) in kg·m−3 are expressed as
L W C ( z ) = 100 · P ( z ) R m o i s t · T ( z ) · q w a t ( z ) I W C ( z ) = 100 · P ( z ) R m o i s t · T ( z ) · q i c e ( z )
where P ( z ) and T ( z ) denote the pressure in hPa and the temperature in K, respectively, as a function of the height z, whereas R m o i s t is the moist air gas constant (in J·g−1·K−1) expressed as
R m o i s t = R d r y · ( 1 + ( 1 ϵ d ) ϵ d ) · q h 2 o ( z ) )
with q h 2 o mass mixing ratio profile of water vapour over moist air and the coefficient ϵ d given by
ϵ d = M h 2 o M d r y
and the R d r y :
R d r y = R M d r y
with M h 2 o , M d r y , and R the molar masses of water and dry air, and the gas constant. Finally, IWP and LWP can be obtained from Equation (A1) by integrating over the height between CTH and CBH:
L W P = C B H C T H L W C ( z ) d z I W P = C B H C T H I W C ( z ) d z

References

  1. Kumar, B.; Ranjan, R.; Yau, M.K.; Bera, S.; Rao, S.A. Impact of high- and low-vorticity turbulence on cloud–environment mixing and cloud microphysics processes. Atmos. Chem. Phys. 2021, 21, 12317–12329. [Google Scholar] [CrossRef]
  2. Hartmann, D.L.; Ockert-Bell, M.E.; Michelsen, M.L. The Effect of Cloud Type on Earth’s Energy Balance: Global Analysis. J. Clim. 1992, 5, 1281–1304. [Google Scholar] [CrossRef]
  3. Baran, A.J. A review of the light scattering properties of cirrus. J.Quant. Spectrosc. Radit. Transf. 2009, 110, 1239–1260. [Google Scholar] [CrossRef]
  4. Matus, A.V.; L’Ecuyer, T.S. The role of cloud phase in Earth’s radiation budget. J. Geophys. Res. Atmos. 2017, 122, 2559–2578. [Google Scholar] [CrossRef]
  5. Boucher, O.; Randall, D.; Artaxo, P.; Bretherton, C.; Feingold, G.; Forster, P.; Kerminen, V.M.; Kondo, Y.; Liao, H.; Lohmann, U.; et al. 2013: Clouds and Aerosols. In Climate Change 2013: The Physical Science Basis; Contribution of Working Group I to the Fifth Assessment Report of the Intergovernmental Panel on Climate Change; Cambridge University Press: Cambridge, UK, 2013. [Google Scholar]
  6. Cox, C.V.; Harries, J.E.; Taylor, J.P.; Green, P.D.; Baran, A.J.; Pickering, J.C.; Last, A.E.; Murray, J.E. Measurement and simulation of mid-and far-infrared spectra in the presence of cirrus. Q. J. R. Meteorol. Soc. 2010, 136, 718–739. [Google Scholar] [CrossRef]
  7. Lubin, D.; Chen, B.; Bromwitch, D.H.; Somerville, R.C.J.; Lee, W.H.; Hines, K.M. The Impact of Antarctic Cloud Radiative Properties on a GCM Climate Simulation. J. Clim. 1998, 11, 447–462. [Google Scholar] [CrossRef]
  8. Lawson, R.P.; Baker, B.A.; Zmarzly, P.; O’Connor, D.; Mo, Q.; Gayet, J.F.; Shcherbakov, V. Microphysical and Optical Properties of Atmospheric Ice Crystals at South Pole Station. J. Appl. Meteorol. Climatol. 2006, 45, 1505–1524. [Google Scholar] [CrossRef]
  9. Yang, P.; Bi, L.; Baum, B.A.; Liou, K.N.; Kattawar, G.W.; Mishchenko, M.I.; Cole, B. Spectrally Consistent Scattering, Absorption, and Polarization Properties of Atmospheric Ice Crystals at Wavelengths from 0.2 to 100 μm. J. Atmos. Sci. 2013, 70, 330–347. [Google Scholar] [CrossRef]
  10. Bi, L.; Yang, P. Improved ice particle optical property simulations in the ultraviolet to far-infrared regime. J. Quant. Spectrosc. Radiat. Transf. 2017, 189, 228–237. [Google Scholar] [CrossRef]
  11. Intrieri, J.M.; Fairall, C.W.; Shupe, M.D.; Persson, P.O.G.; Andreas, E.L.; Guest, P.S.; Moritz, R.E. An annual cycle of Arctic surface cloud forcing at SHEBA. J. Geophys. Res. Ocean. 2002, 107, SHE 13-1–SHE 13-14. [Google Scholar] [CrossRef]
  12. Stapf, J.; Ehrlich, A.; Jäkel, E.; Lüpkes, C.; Wendisch, M. Reassessment of shortwave surface cloud radiative forcing in the Arctic: Consideration of surface-albedo–cloud interactions. Atmos. Chem. Phys. 2020, 20, 9895–9914. [Google Scholar] [CrossRef]
  13. Clough, S.A.; Iacono, M.J.; Moncet, J.L. Line-by-line calculations of atmospheric fluxes and cooling rates: Application to water vapor. J. Geophys. Res. Atmos. 1992, 97, 15761–15785. [Google Scholar] [CrossRef]
  14. Harries, J.; Carli, B.; Rizzi, R.; Serio, C.; Mlynczak, M.; Palchetti, L.; Maestri, T.; Brindley, H.; Masiello, G. The Far Infrared Earth. Rev. Geophys. 2008, 46, 1–34. [Google Scholar] [CrossRef]
  15. Palchetti, L.; Natale, G.D.; Bianchini, G. Remote sensing of cirrus microphysical properties using spectral measurements over the full range of their thermal emission. J. Geophys. Res. 2016, 121, 10,804–10,819. [Google Scholar] [CrossRef]
  16. Di Natale, G.; Barucci, M.; Belotti, C.; Bianchini, G.; D’Amato, F.; Del Bianco, S.; Gai, M.; Montori, A.; Sussmann, R.; Viciani, S.; et al. Comparison of mid-latitude single- and mixed-phase cloud optical depth from co-located infrared spectrometer and backscatter lidar measurements. Atmos. Meas. Tech. 2021, 14, 6749–6758. [Google Scholar] [CrossRef]
  17. Knuteson, R.O.; Revercomb, H.E.; Best, F.A.; Ciganovich, N.C.; Dedecker, R.G.; Dirkx, T.P.; Ellington, S.C.; Feltz, W.F.; Garcia, R.K.; Howell, H.B.; et al. Atmospheric Emitted Radiance Interferometer. Part I: Instrument Design. J. Atmos. Ocean. Technol. 2004, 21, 1763–1776. [Google Scholar] [CrossRef]
  18. Garrett, T.J.; Zhao, C. Ground-based remote sensing of thin clouds in the Arctic. Atmos. Meas. Tech. 2013, 6, 1227–1243. [Google Scholar] [CrossRef]
  19. Turner, D.D. Microphysical Properties of Single and Mixed-Phase Arctic Clouds Derived from Ground-Based AERI Observations. Ph.D. Thesis, University of Wisconsin–Madison, Madison, WI, USA, 2003. Volume 35. pp. 1–167. [Google Scholar]
  20. Shupe, M.D.; Turner, D.D.; Walden, V.P.; Bennartz, R.; Cadeddu, M.P.; Castellani, B.B.; Cox, C.J.; Hudak, D.R.; Kulie, M.S.; Miller, N.B.; et al. High and Dry: New Observations of Tropospheric and Cloud Properties above the Greenland Ice Sheet. Bull. Am. Meteorol. Soc. 2013, 94, 169–186. [Google Scholar] [CrossRef]
  21. Murray, J.E.; Warwick, L.; Brindley, H.; Last, A.; Quigley, P.; Rochester, A.; Dewar, A.; Cummins, D. The Far INfrarEd Spectrometer for Surface Emissivity (FINESSE). Part 1: Instrument description and level 1 radiances. Atmos. Meas. Tech. Discuss. 2024, 2024, 1–32. [Google Scholar] [CrossRef]
  22. Warwick, L.; Murray, J.; Brindley, H. The Far-INfrarEd Spectrometer for Surface Emissivity (FINESSE) Part II: First measurements of the emissivity of water in the far-infrared. Atmos. Meas. Tech. Discuss. 2024, 2024, 1–21. [Google Scholar] [CrossRef]
  23. Maesh, A.; Walden, V.P.; Warren, S.G. Ground-Based Infrared Remote Sensing of Cloud Properties over the Antarctic Plateau. Part I: Cloud-Base Heights. J. Appl. Meteorol. 2001, 40, 1265–1277. [Google Scholar] [CrossRef]
  24. Maesh, A.; Walden, V.P.; Warren, S.G. Ground-based remote sensing of cloud properties over the Antarctic Plateau: Part II: Cloud optical depth and particle sizes. J. Appl. Meteorol. 2001, 40, 1279–1294. [Google Scholar] [CrossRef]
  25. Bianchini, G.; Castagnoli, F.; Natale, G.D.; Palchetti, L. A Fourier transform spectroradiometer for ground-based remote sensing of the atmospheric downwelling long-wave radiance. Atmos. Meas. Tech. 2019, 12, 619–635. [Google Scholar] [CrossRef]
  26. Palchetti, L.; Bianchini, G.; Natale, G.D.; Guasta, M.D. Far-Infrared radiative properties of water vapor and clouds in Antarctica. Bull. Am. Meteorol. Soc. 2015, 96, 1505–1518. [Google Scholar] [CrossRef]
  27. Di Natale, G.; Palchetti, L.; Bianchini, G.; Ridolfi, M. The two-stream δ-Eddington approximation to simulate the far infrared Earth spectrum for the simultaneous atmospheric and cloud retrieval. J. Quant. Spectrosc. Radiat. Transf. 2020, 246, 106927. [Google Scholar] [CrossRef]
  28. Di Natale, G.; Palchetti, L.; Bianchini, G.; Guasta, M.D. Simultaneous retrieval of water vapour, temperature and cirrus clouds properties from measurements of far infrared spectral radiance over the Antarctic Plateau. Atmos. Meas. Tech. 2017, 10, 825–837. [Google Scholar] [CrossRef]
  29. Bhawar, R.; Bianchini, G.; Bozzo, A.; Cacciani, M.; Calvello, M.R.; Carlotti, M.; Castagnoli, F.; Cuomo, V.; Di Girolamo, P.; Di Iorio, T.; et al. Spectrally resolved observations of atmospheric emitted radiance in the H2O rotation band. Geophys. Res. Lett. 2008, 35. [Google Scholar] [CrossRef]
  30. Serio, C.; Masiello, G.; Esposito, F.; Di Girolamo, P.; Di Iorio, T.; Palchetti, L.; Bianchini, G.; Muscari, G.; Pavese, G.; Rizzi, R.; et al. Retrieval of foreign-broadened water vapor continuum coefficients from emitted spectral radiance in the H2O rotational band from 240 to 590 cm−1. Opt. Express 2008, 16, 15816–15833. [Google Scholar] [CrossRef] [PubMed]
  31. Mlawer, E.J.; Turner, D.D.; Paine, S.N.; Palchetti, L.; Bianchini, G.; Payne, V.H.; Cady-Pereira, K.E.; Pernak, R.L.; Alvarado, M.J.; Gombos, D.; et al. Analysis of Water Vapor Absorption in the Far-Infrared and Submillimeter Regions Using Surface Radiometric Measurements From Extremely Dry Locations. J. Geophys. Res. Atmos. 2019, 124, 8134–8160. [Google Scholar] [CrossRef]
  32. Mlynczak, M.G.; Johnson, D.G.; Bingham, G.E.; Jucks, K.W.; Traub, W.A.; Gordley, L.; Yang, P. The far-infrared spectroscopy of the troposphere (FIRST) project. In Enabling Sensor and Platform Technologies for Spaceborne Remote Sensing; Komar, G.J., Wang, J., Kimura, T., Eds.; SPIE: Bellingham, WA, USA, 2006; Volume 5659, pp. 81–87. [Google Scholar] [CrossRef]
  33. Mast, J.C.; Mlynczak, M.G.; Cageao, R.P.; Kratz, D.P.; Latvakoski, H.; Johnson, D.G.; Turner, D.D.; Mlawer, E.J. Measurements of downwelling far-infrared radiance during the RHUBC-II campaign at Cerro Toco, Chile and comparisons with line-by-line radiative transfer calculations. J. Quant. Spectrosc. Radiat. Transf. 2017, 198, 25–39. [Google Scholar] [CrossRef]
  34. Mlynczak, M.G.; Cageao, R.P.; Mast, J.C.; Kratz, D.P.; Latvakoski, H.; Johnson, D.G. Observations of downwelling far-infrared emission at Table Mountain California made by the FIRST instrument. J. Quant. Spectrosc. Radiat. Transf. 2016, 170, 90–105. [Google Scholar] [CrossRef]
  35. Belotti, C.; Barbara, F.; Barucci, M.; Bianchini, G.; D’Amato, F.; Del Bianco, S.; Di Natale, G.; Gai, M.; Montori, A.; Pratesi, F.; et al. The Far-Infrared Radiation Mobile Observation System (FIRMOS) for spectral characterization of the atmospheric emission. Atmos. Meas. Tech. 2023, 16, 2511–2529. [Google Scholar] [CrossRef]
  36. Turner, D.D.; Mlawer, E.J.; Bianchini, G.; Cadeddu, M.P.; Crewell, S.; Delamere, J.S.; Knuteson, R.O.; Maschwitz, G.; Mlynczak, M.; Paine, S.; et al. Ground-based high spectral resolution observations of the entire terrestrial spectrum under extremely dry conditions. Geophys. Res. Lett. 2012, 39. [Google Scholar] [CrossRef]
  37. Palchetti, L.; Barucci, M.; Belotti, C.; Bianchini, G.; Cluzet, B.; D’Amato, F.; Del Bianco, S.; Di Natale, G.; Gai, M.; Khordakova, D.; et al. Observations of the downwelling far-infrared atmospheric emission at the Zugspitze observatory. Earth Syst. Sci. Data 2021, 13, 4303–4312. [Google Scholar] [CrossRef]
  38. Canas, T.A.; Murray, J.E.; Harries, J.E. Tropospheric airborne Fourier transform spectrometer (TAFTS). In Satellite Remote Sensing of Clouds and the Atmosphere II; Haigh, J.D., Ed.; International Society for Optics and Photonics, SPIE: Bellingham, WA, USA, 1997; Volume 3220, pp. 91–102. [Google Scholar] [CrossRef]
  39. Cox, C.V.; Murray, J.E.; Taylor, J.P.; Green, P.D.; Pickering, J.C.; Harries, J.E.; Last, A.E. Clear-sky far-infrared measurements observed with TAFTS during the EAQUATE campaign, September 2004. Q. J. R. Meteorol. Soc. 2007, 133, 273–283. [Google Scholar] [CrossRef]
  40. Bantges, R.J.; Brindley, H.E.; Murray, J.E.; Last, A.E.; Russell, J.E.; Fox, C.; Fox, S.; Harlow, C.; O’Shea, S.J.; Bower, K.N.; et al. A test of the ability of current bulk optical models to represent the radiative properties of cirrus cloud across the mid- and far-infrared. Atmos. Chem. Phys. 2020, 20, 12889–12903. [Google Scholar] [CrossRef]
  41. Bellisario, C.; Brindley, H.E.; Murray, J.E.; Last, A.; Pickering, J.; Harlow, R.C.; Fox, S.; Fox, C.; Newman, S.M.; Smith, M.; et al. Retrievals of the Far Infrared Surface Emissivity Over the Greenland Plateau Using the Tropospheric Airborne Fourier Transform Spectrometer (TAFTS). J. Geophys. Res. Atmos. 2017, 122, 12,152–12,166. [Google Scholar] [CrossRef]
  42. Warwick, L.; Brindley, H.; Roma, A.; Fox, S.; Havemann, S.; Murray, J.; Oetjen, H.; Price, H.; Schuettemeyer, D.; Sgheri, L.; et al. Retrieval of Tropospheric Water Vapor From Airborne Far-Infrared Measurements: A Case Study. J. Geophys. Res. Atmos. 2022, 127, e2020JD034229. [Google Scholar] [CrossRef]
  43. Panditharatne, S.; Brindley, H.; Cox, C.; Song, R.; Siddans, R.; Bantges, R.; Murray, J.; Fox, S.; Fox, C. Exploiting airborne far-infrared measurements to optimise an ice cloud retrieval. EGUsphere 2025, 2025, 1–28. [Google Scholar] [CrossRef]
  44. Wilson, S.H.S.; Atkinson, N.C.; Smith, J.A. The Development of an Airborne Infrared Interferometer for Meteorological Sounding Studies. J. Atmos. Ocean. Technol. 1999, 16, 1912–1927. [Google Scholar] [CrossRef]
  45. Palchetti, L.; Belotti, C.; Bianchini, G.; Castagnoli, F.; Carli, B.; Cortesi, U.; Pellegrini, M.; Camy-Peyret, C.; Jeseck, P.; Té, Y. Technical note: First spectral measurement of the Earth’s upwelling emission using an uncooled wideband Fourier transform spectrometer. Atmos. Chem. Phys. 2006, 6, 5025–5030. [Google Scholar] [CrossRef]
  46. Mlynczak, M.G.; Johnson, D.G.; Latvakoski, H.; Jucks, K.; Watson, M.; Kratz, D.P.; Bingham, G.; Traub, W.A.; Wellard, S.J.; Hyde, C.R.; et al. First light from the Far-Infrared Spectroscopy of the Troposphere (FIRST) instrument. Geophys. Res. Lett. 2006, 33. [Google Scholar] [CrossRef]
  47. Loeb, N.G.; Mayer, M.; Kato, S.; Fasullo, J.T.; Zuo, H.; Senan, R.; Lyman, J.M.; Johnson, G.C.; Balmaseda, M. Evaluating Twenty-Year Trends in Earth’s Energy Flows From Observations and Reanalyses. J. Geophys. Res. Atmos. 2022, 127, e2022JD036686. [Google Scholar] [CrossRef]
  48. Kato, S.; Rose, F.G.; Rutan, D.A.; Thorsen, T.J.; Loeb, N.G.; Doelling, D.R.; Huang, X.; Smith, W.L.; Su, W.; Ham, S.H. Surface Irradiances of Edition 4.0 Clouds and the Earth’s Radiant Energy System (CERES) Energy Balanced and Filled (EBAF) Data Product. J. Clim. 2018, 31, 4501–4527. [Google Scholar] [CrossRef]
  49. Palchetti, L.; Brindley, H.; Bantges, R.; Buehler, S.A.; Camy-Peyret, C.; Carli, B.; Cortesi, U.; Del Bianco, S.; Di Natale, G.; Dinelli, B.M.; et al. FORUM: Unique far-infrared satellite observations to better understand how Earth radiates energy to space. Bull. Am. Meteorol. Soc. 2020, 101, E2030–E2046. [Google Scholar] [CrossRef]
  50. Palchetti, L.; Olivieri, M.; Pompei, C.; Labate, D.; Brindley, H.; Natale, G.D.; Bianchini, G. The Far Infrared FTS for the FORUM Mission. In Light, Energy and the Environment; Optical Society of America: Leipzig, Germany, 2016; p. FTu3C.1. [Google Scholar] [CrossRef]
  51. Sgheri, L.; Belotti, C.; Ben-Yami, M.; Bianchini, G.; Carnicero Dominguez, B.; Cortesi, U.; Cossich, W.; Del Bianco, S.; Di Natale, G.; Guardabrazo, T.; et al. The FORUM end-to-end simulator project: Architecture and results. Atmos. Meas. Tech. 2022, 15, 573–604. [Google Scholar] [CrossRef]
  52. Ridolfi, M.; Tirelli, C.; Ceccherini, S.; Belotti, C.; Cortesi, U.; Palchetti, L. Synergistic retrieval and complete data fusion methods applied to simulated FORUM and IASI-NG measurements. Atmos. Meas. Tech. 2022, 15, 6723–6737. [Google Scholar] [CrossRef]
  53. Dinelli, B.M.; Ridolfi, M.; Masiello, G.; Serio, C.; Venafra, S.; Maestri, T.; Del Bianco, S.; Raspollini, P.; Lorenzi, G.; Palchetti, L. A Fast Retrieval Model for the Inversion of Surface, Atmospheric and Cloud properties from Nadir FIR and TIR measurements. In Proceedings of the Living Planet Symposium, Bonn, Germany, 23–27 May 2022. [Google Scholar]
  54. Clough, S.A.; Shephard, M.W.; Mlawer, E.J.; Delamere, J.S.; Iacono, M.J.; Cady-Pereira, K.; Boukabara, S.; Brown, P.D. Atmospheric radiative transfer modeling: A summary of the AER codes. Short Commun. J. Quant. Spectrosc. Radiat. Transf. 2005, 91, 233–244. [Google Scholar] [CrossRef]
  55. Masiello, G.; Serio, C.; Maestri, T.; Martinazzo, M.; Masin, F.; Liuzzi, G.; Venafra, S. The new σ—IASI code for all sky radiative transfer calculations in the spectral range 10 to 2760 cm−1: σ—IASI/F2N. J. Quant. Spectrosc. Radiat. Transf. 2024, 312, 108814. [Google Scholar] [CrossRef]
  56. Chou, M.D.; Lee, K.T.; Tsay, S.C.; Fu, Q. Parameterization for Cloud Longwave Scattering for Use in Atmospheric Models. J. Clim. 1999, 12, 159–169. [Google Scholar] [CrossRef]
  57. Dinelli, B.M.; Del Bianco, S.; Castelli, E.; Di Roma, A.; Lorenzi, G.; Premuda, M.; Barbara, F.; Gai, M.; Raspollini, P.; Di Natale, G. GBB-Nadir and KLIMA: Two Full Physics Codes for the Computation of the Infrared Spectrum of the Planetary Radiation Escaping to Space. Remote Sens. 2023, 15, 2532. [Google Scholar] [CrossRef]
  58. Yang, P.; Liou, K.N.; Bi, L.; Liu, C.; Yi, B.; Baum, B.A. On the radiative properties of ice clouds: Light scattering, remote sensing, and radiation parameterization. Adv. Atmos. Sci. 2015, 32, 32–63. [Google Scholar] [CrossRef]
  59. King, M.D.; Platnick, S.; Yang, P.; Arnold, G.T.; Gray, M.A.; Riedi, J.C.; Ackerman, S.A.; Liou, K.N. Remote Sensing of Liquid Water and Ice Cloud Optical Thickness and Effective Radius in the Arctic: Application of Airborne Multispectral MAS Data. J. Atmos. Ocean. Technol. 2004, 21, 857–875. [Google Scholar] [CrossRef]
  60. Yang, P.; Wei, H.L.; Baum, B.A.; Huang, H.L.; Heymsfield, A.J.; Hu, Y.X.; Gao, B.C.; Turner, D.D. The spectral signature of mixed-phase clouds composed of non-spherical ice crystals and spherical liquid droplets in the terrestrial window region. J. Quant. Spectrosc. Radiat. Transfer 2003, 79–80, 1171–1188. [Google Scholar] [CrossRef]
  61. Yang, P.; Wei, H.; Huang, H.-L.; Baum, B.A.; Hu, Y.X.; Kattawar, G.W.; Mishchenko, M.I.; Fu, Q. Scattering and absorption property database for nonspherical ice particles in the near-through far-infrared spectral region. Appl. Opt. 2005, 44, 5512–5523. [Google Scholar] [CrossRef] [PubMed]
  62. Rodgers, C.D. Inverse Methods for Atmospheric Sounding: Theory and Practice; World Scientific Publishing: Singapore; Hackensack, NJ, USA; London, UK, 2000. [Google Scholar]
  63. Levenberg, K. A Method for the Solution of Certain Non-Linear Problems in Least Squares. Q. Appl. Math. 1944, 2, 164–168. [Google Scholar] [CrossRef]
  64. Remedios, J.J.; Leigh, R.J.; Waterfall, A.M.; Moore, D.P.; Sembhi, H.; Parkes, I.; Greenhough, J.; Chipperfield, M.P.; Hauglustaine, D. MIPAS reference atmospheres and comparisons to V4.61/V4.62 MIPAS level 2 geophysical data sets. Atmos. Chem. Phys. Discuss. 2007, 7, 9973–10017. [Google Scholar] [CrossRef]
  65. Ben-Yami, M.; Oetjen, H.; Brindley, H.; Cossich, W.; Lajas, D.; Maestri, T.; Magurno, D.; Raspollini, P.; Sgheri, L.; Warwick, L. Emissivity retrievals with FORUM’s end-to-end simulator: Challenges and recommendations. Atmos. Meas. Tech. 2022, 15, 1755–1777. [Google Scholar] [CrossRef]
  66. Huang, X.; Chen, X.; Zhou, D.K.; Liu, X. An Observationally Based Global Band-by-Band Surface Emissivity Dataset for Climate and Weather Simulations. J. Atmos. Sci. 2016, 73, 3541–3555. [Google Scholar] [CrossRef]
Figure 1. Scheme of the CARMEN flight gondola showing the positions of FIRMOS-B and its field of view (FOV).
Remotesensing 17 02458 g001
Figure 2. (Left and right panels): launch and ascending phases of the stratospheric balloon from Timmins, Canada, on 23 August 2022.
Remotesensing 17 02458 g002
Figure 3. Trajectory and height of the stratospheric balloon over Timmins (Canada), during the flight on 23 August 2022. The blue arrow indicates the maximum horizontal distance of 150 km covered by the balloon.
Remotesensing 17 02458 g003
Figure 4. Panels (ad): consecutive pictures in cloudy sky taken from the visible camera on board the gondola during the sequences f2s002, at 20:46 UTC, f2s009, at 22:33 UTC, f2s011, at 23:04 UTC, and f2s012, at 23:34 UTC. The red circles indicate the instrument FOV.
Remotesensing 17 02458 g004
Figure 5. Close-ups of panels (a,b) of Figure 4, which show the presence of higher tenuous clouds (probably composed of ice crystals) located above the lower clouds, presumably liquid.
Remotesensing 17 02458 g005
Figure 6. Calibrated average spectral radiance measured by FIRMOS-B for three different sequences, one in clear sky (black curve) and the others in cloudy sky showing a thin (red curve) and a thick cloud (green curve).
Remotesensing 17 02458 g006
Figure 7. In black: FIRMOS-B radiance measured in cloudy sky at 20:46 UTC from the stratospheric balloon over Timmins (Canada); in red: simulated radiance at the last iteration; in green: measurement NESR; in blue: difference between the measurement and the simulation.
Remotesensing 17 02458 g007
Figure 8. Retrieved temperature profile (orange curve) obtained from a single spectrum with the retrieval error bars for the cloudy scenario f2s002 compared with the AK-convolved radiosound profiles (green curve), the a priori/initial guess (black curve), and the ERA5 profile (red curve). The average retrieved cloud top is also reported (magenta dashed line).
Remotesensing 17 02458 g008
Figure 9. Retrieved temperature profiles (orange curves) obtained from single spectra with the retrieval error bars for the cloudy scenarios of sequences f2s009, f2s011, f2s012, and f2s013 compared with the convolved radiosoundings (green curves), the a priori/initial guesses (black curves), and the ERA5 profiles (red curves). The average retrieved cloud tops are also reported (magenta dashed lines).
Remotesensing 17 02458 g009
Figure 10. Retrieved water vapour profile (orange curve) obtained from the same spectrum as Figure 8 with the retrieval error bars for the cloudy scenarios of sequence f2s002 compared with the convolved radiosounding (green curve), the a priori/initial guess (black curve), and the ERA5 profile (red curve). The average retrieved cloud top is also reported (magenta dashed line).
Remotesensing 17 02458 g010
Figure 11. Retrieved water vapour profiles (orange curves) obtained from the same spectra as Figure 9 with the retrieval error bars for the cloudy scenarios of sequences f2s009, f2s011, f2s012, and f2s013 compared with the convolved radiosoundings (green curves), the a priori/initial guesses (black curves), and the ERA5 profiles (red curves). The average retrieved cloud tops are also reported (magenta dashed lines).
Remotesensing 17 02458 g011
Figure 12. Panel (a): in orange and green, retrieved cloud ODs obtained from the single spectra by SACR and FARM code, respectively; red and blue dashed lines denote the a priori and the corresponding error, respectively. Panel (b): retrieved CTH. Panel (c): retrieved T s .
Remotesensing 17 02458 g012
Figure 13. Panel (a) shows the effective diameters retrieved by SACR of ice crystals (cyan curve) and water droplets (red curve); the violet and the yellow solid lines denote the fixed values used by FARM. Panel (b) shows in orange and green the retrieved ice fraction γ obtained by SACR (orange) and FARM (green), respectively. Panel (c) shows the normalized χ N 2 of each retrieval.
Remotesensing 17 02458 g013
Figure 14. Clear-sky pictures taken from the visible camera, corresponding to sequences f1s002 (left panel) and f1s007 (right panel) at 18:36 UTC and 19:53 UTC, respectively. The FIRMOS-B FOV (red circles) is also shown.
Remotesensing 17 02458 g014
Figure 15. Comparison of the retrieved surface spectral emissivity obtained with KLIMA (left panel) and FARM (right panel) codes for single clear-sky FIRMOS-B spectra of sequences f1s002 and f1s007, respectively, with different spectral emissivities provided by the [66] database.
Remotesensing 17 02458 g015
Disclaimer/Publisher’s Note: The statements, opinions and data contained in all publications are solely those of the individual author(s) and contributor(s) and not of MDPI and/or the editor(s). MDPI and/or the editor(s) disclaim responsibility for any injury to people or property resulting from any ideas, methods, instructions or products referred to in the content.

