
Evaluating the Interferometric Performance of China’s Dual-Star SAR Satellite Constellation in Large Deformation Scenarios: A Case Study in the Jinchuan Mining Area, Gansu

 ,
,
Abstract
1. Introduction
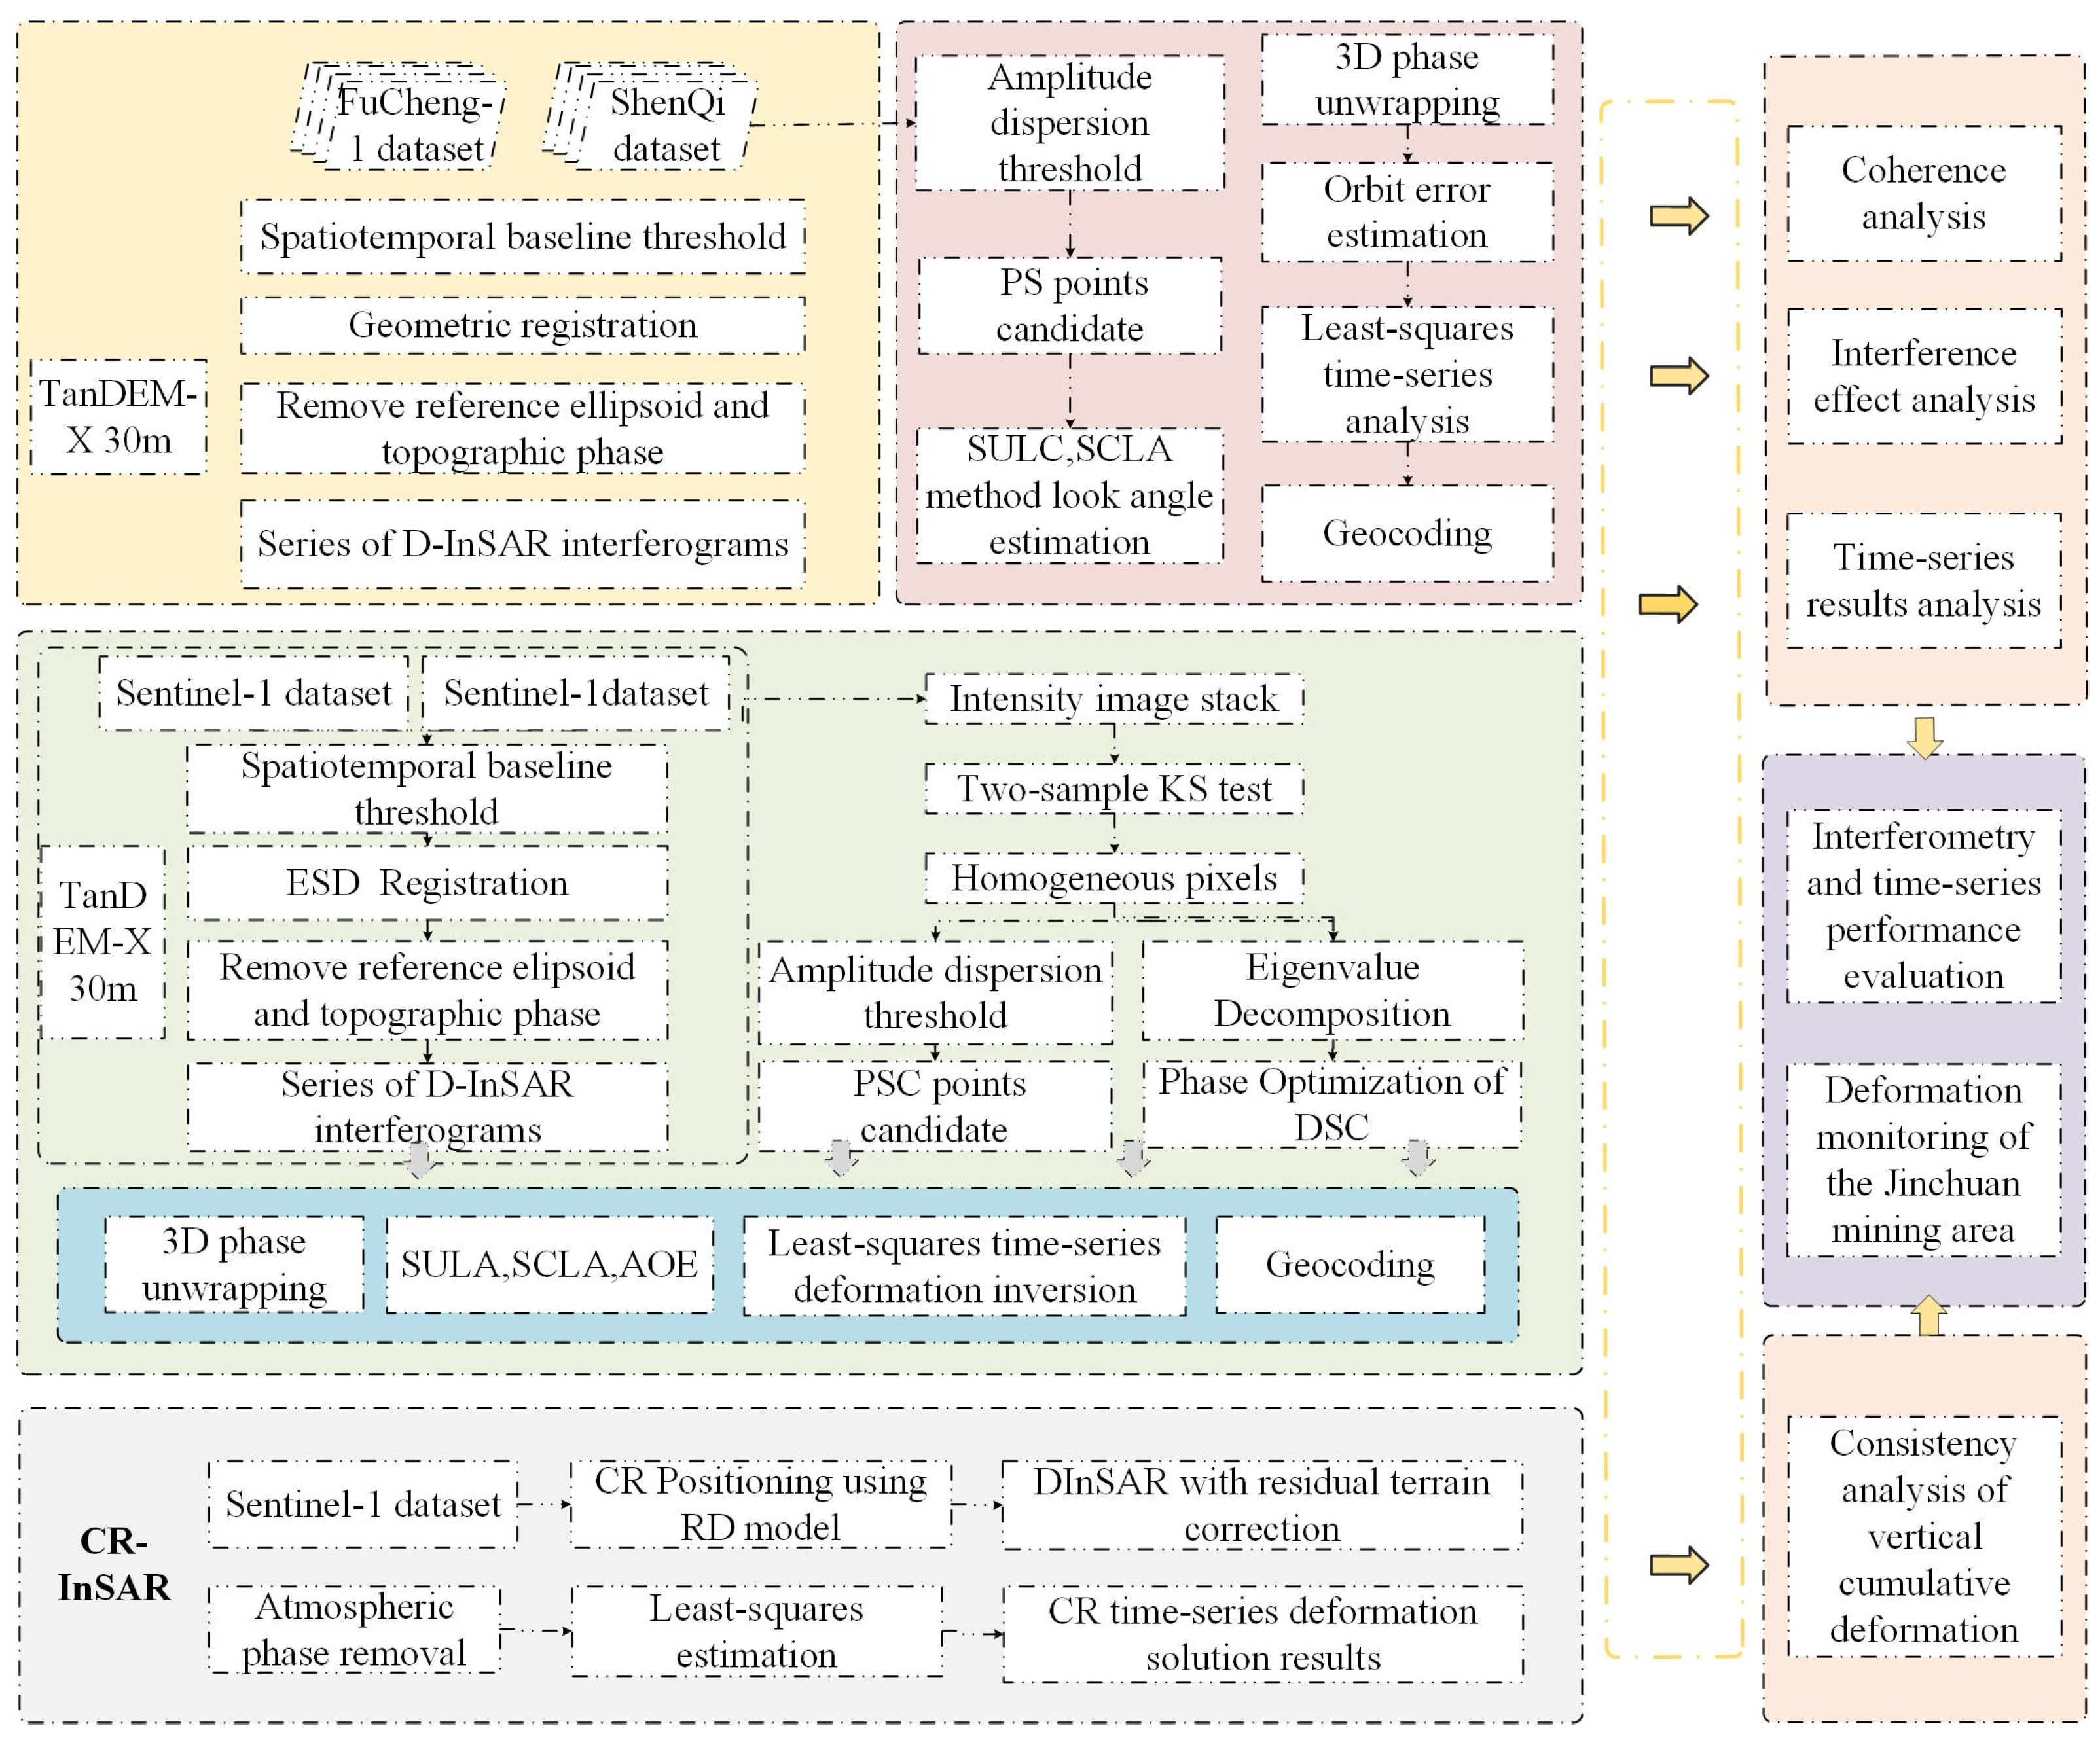
2. Methodology
2.1. Traditional TS-InSAR Data Processing
2.2. DS-InSAR Phase Optimization
3. Study Area and Data Sources
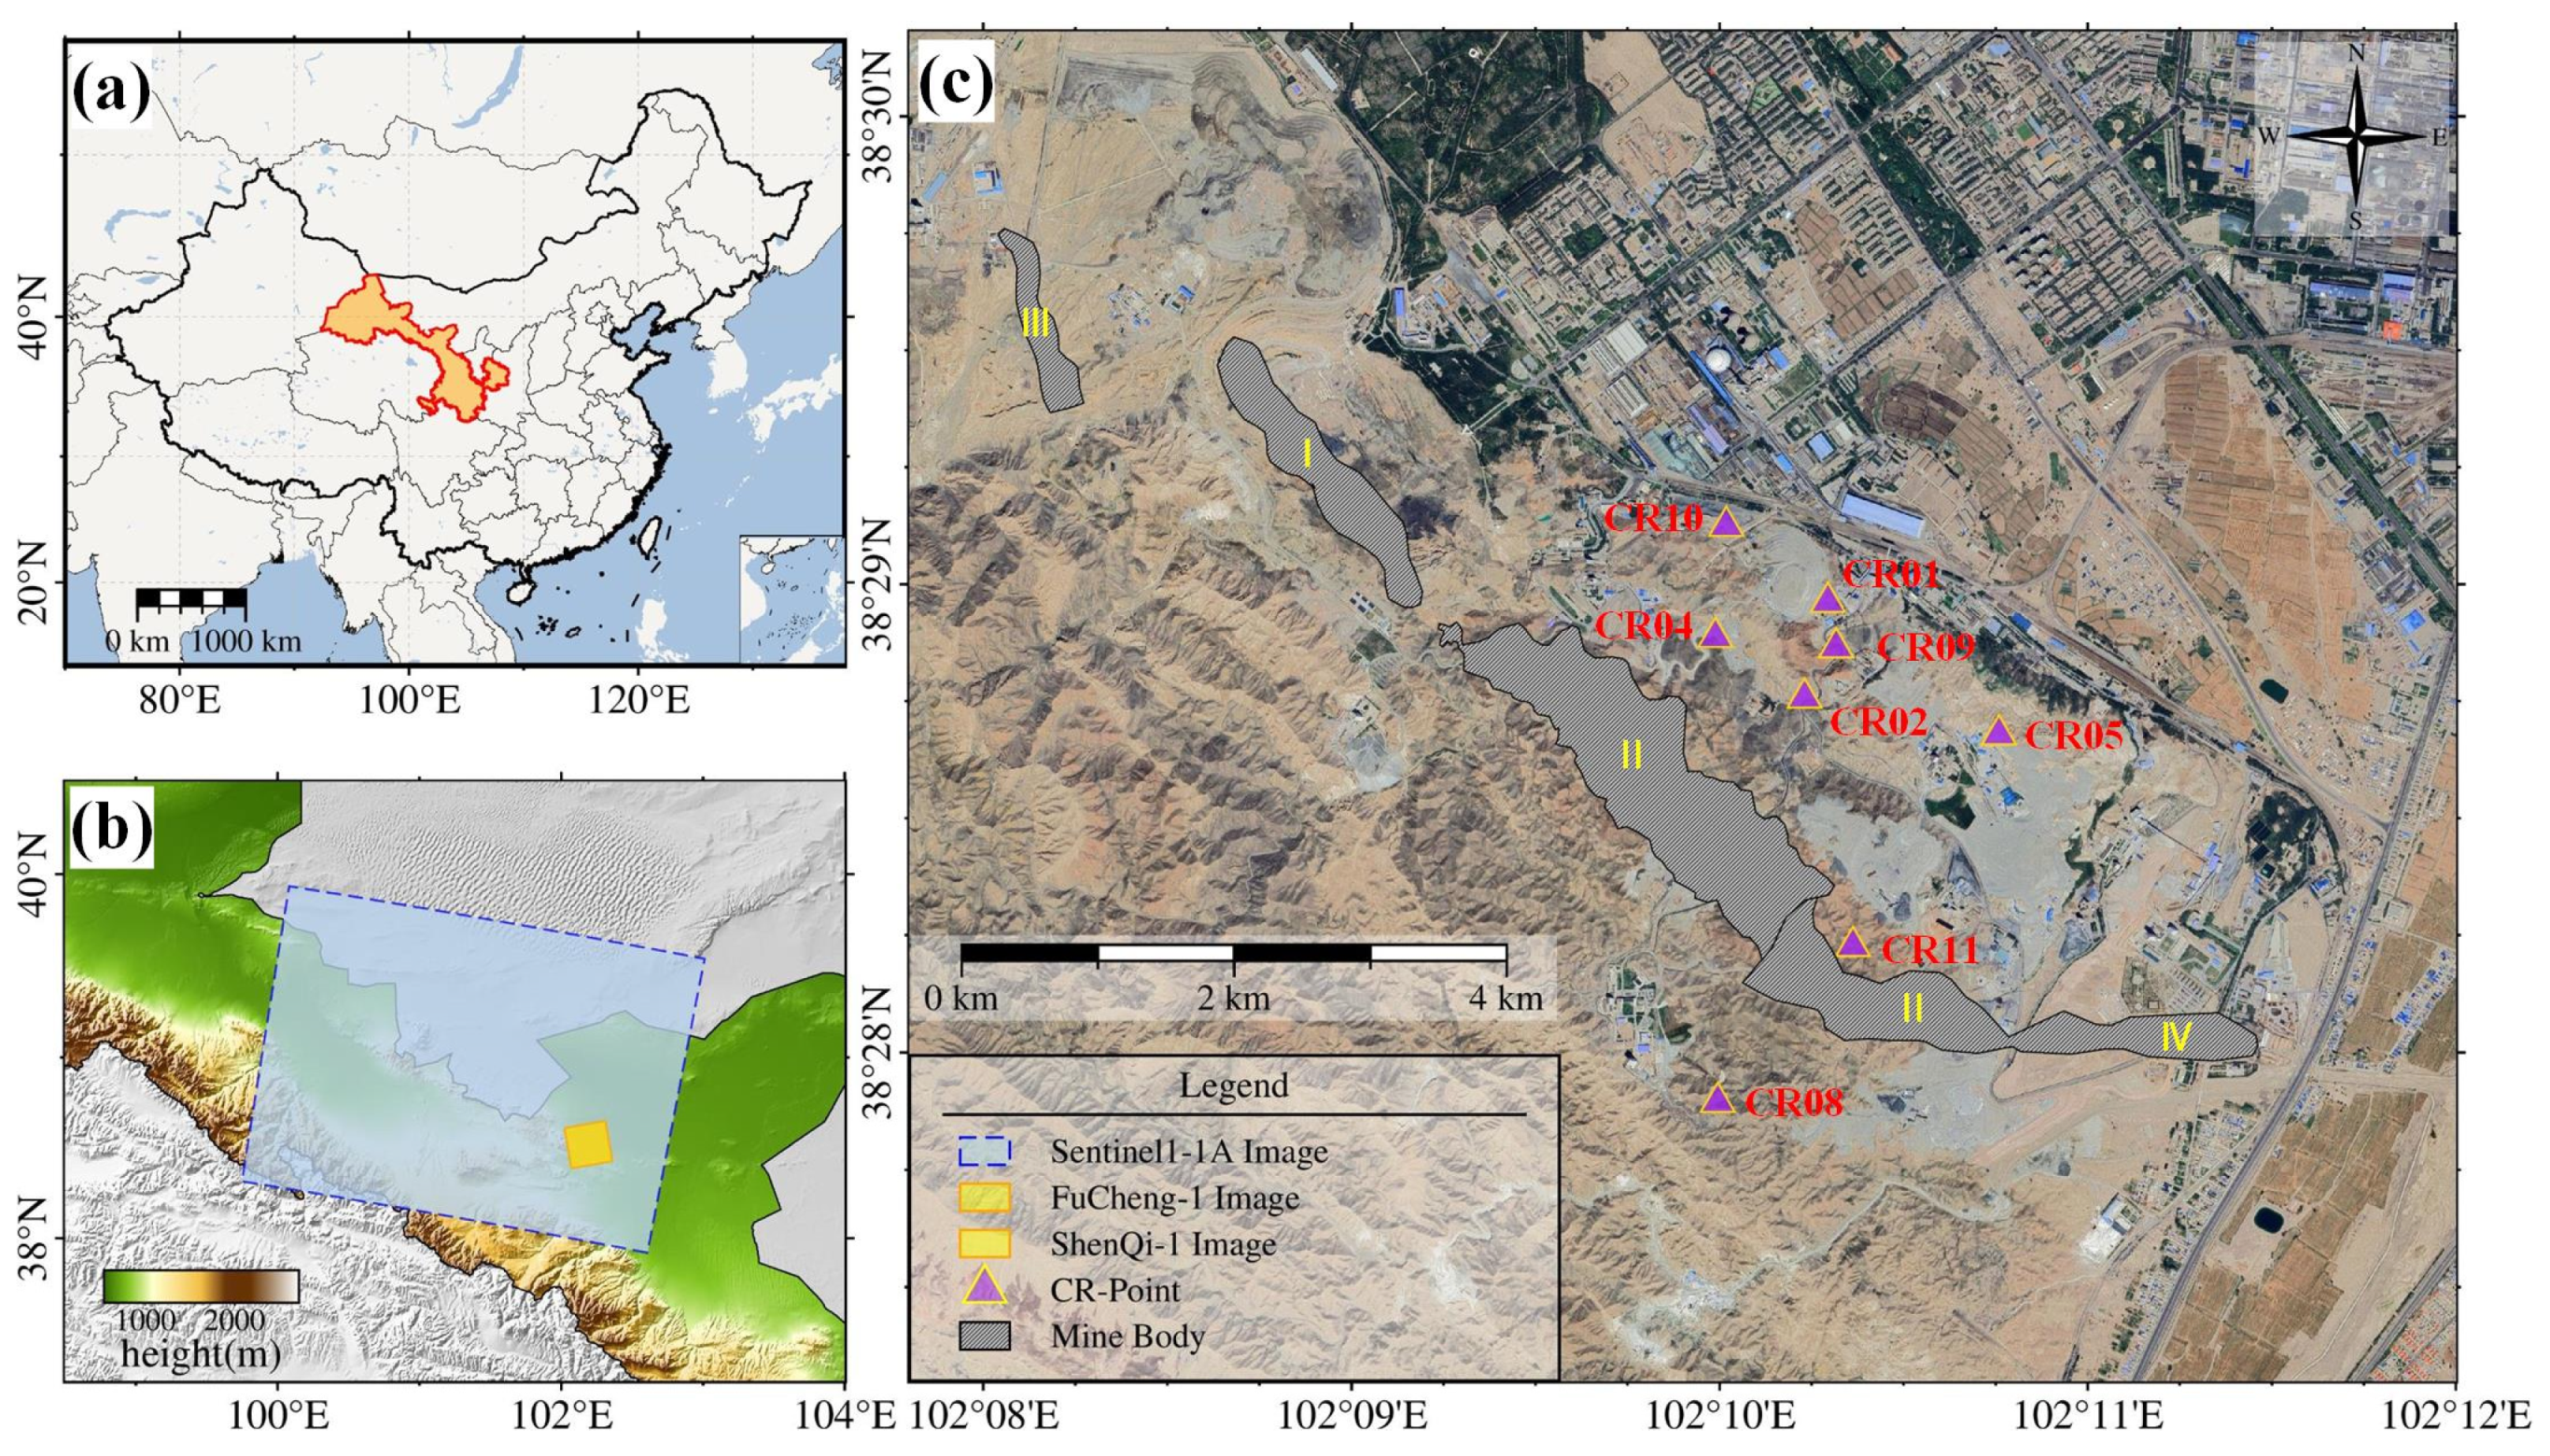
3.1. Study Area Overview
3.2. Available Datasets
3.2.1. Sentinel-1A
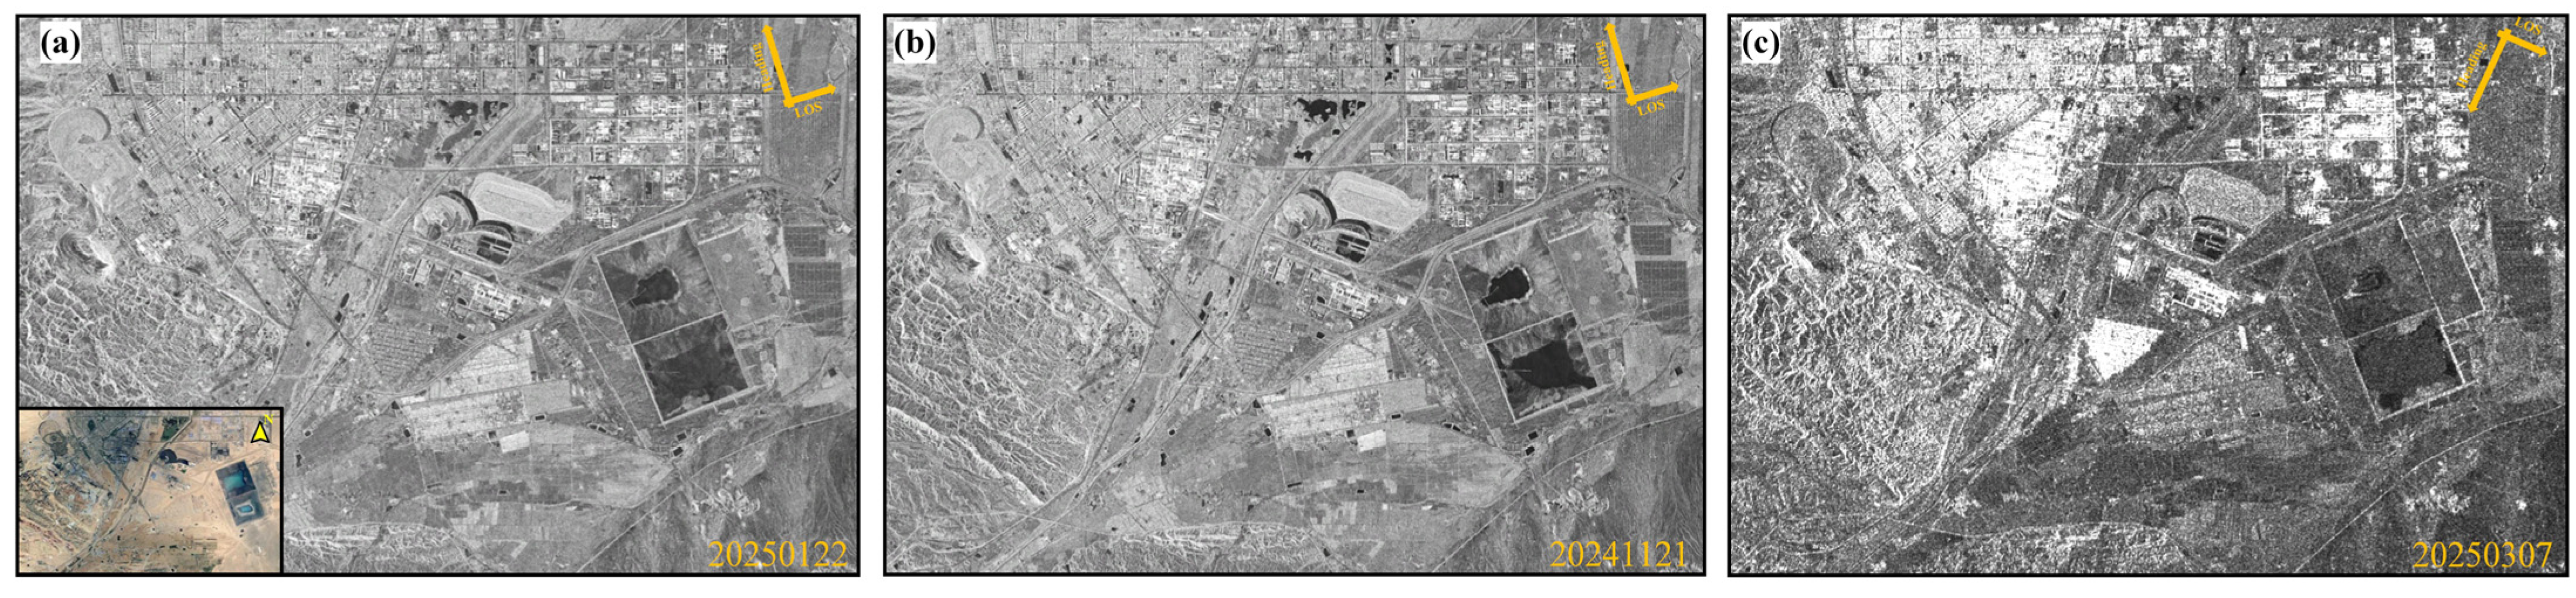
3.2.2. Fucheng-1/Shenqi
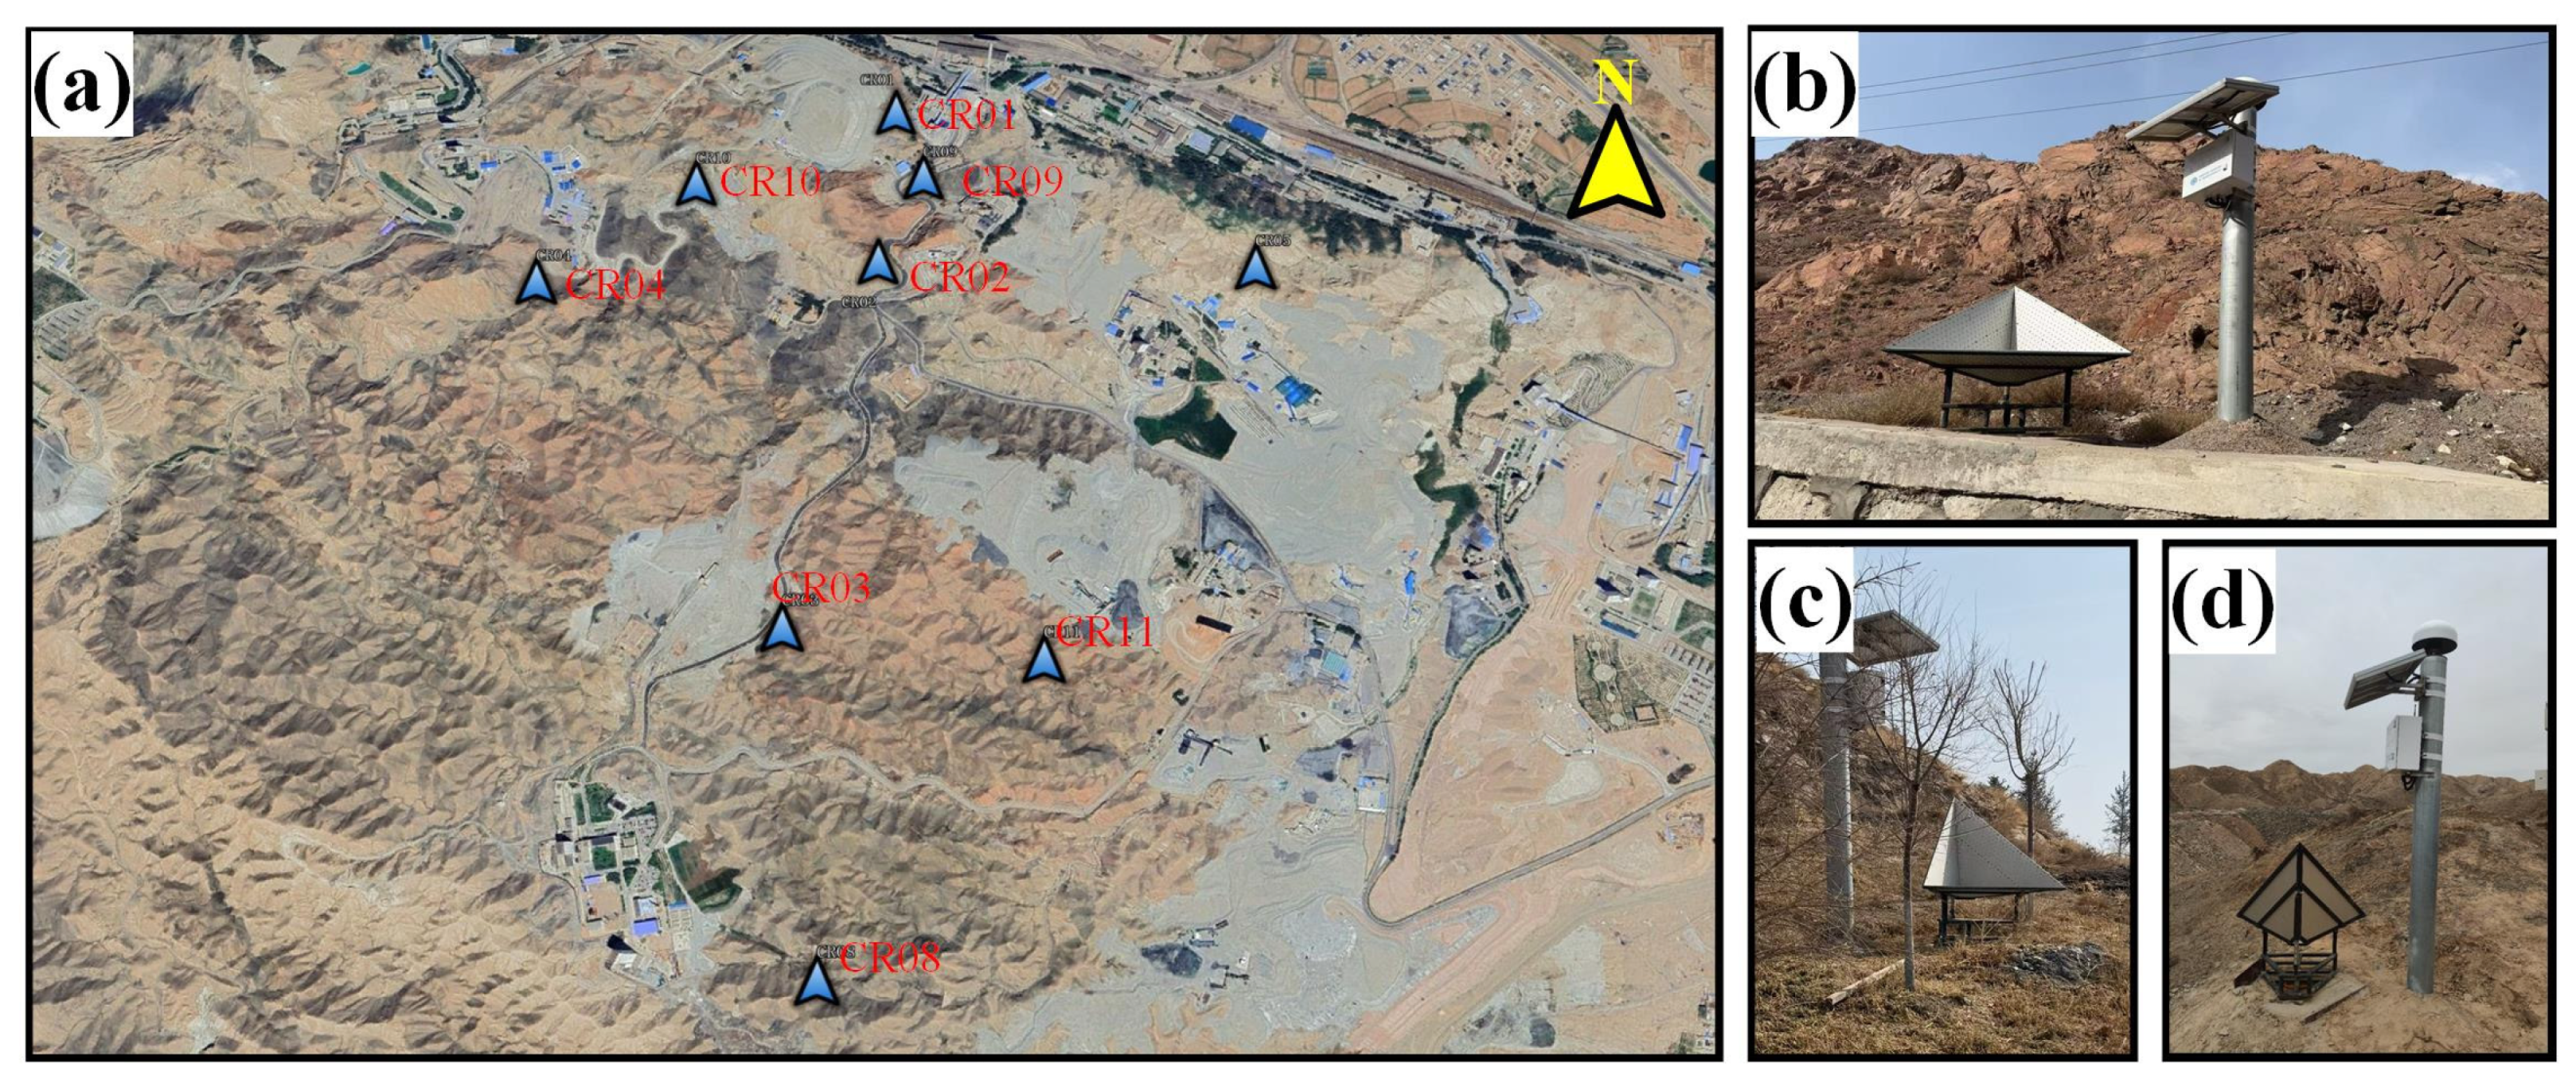
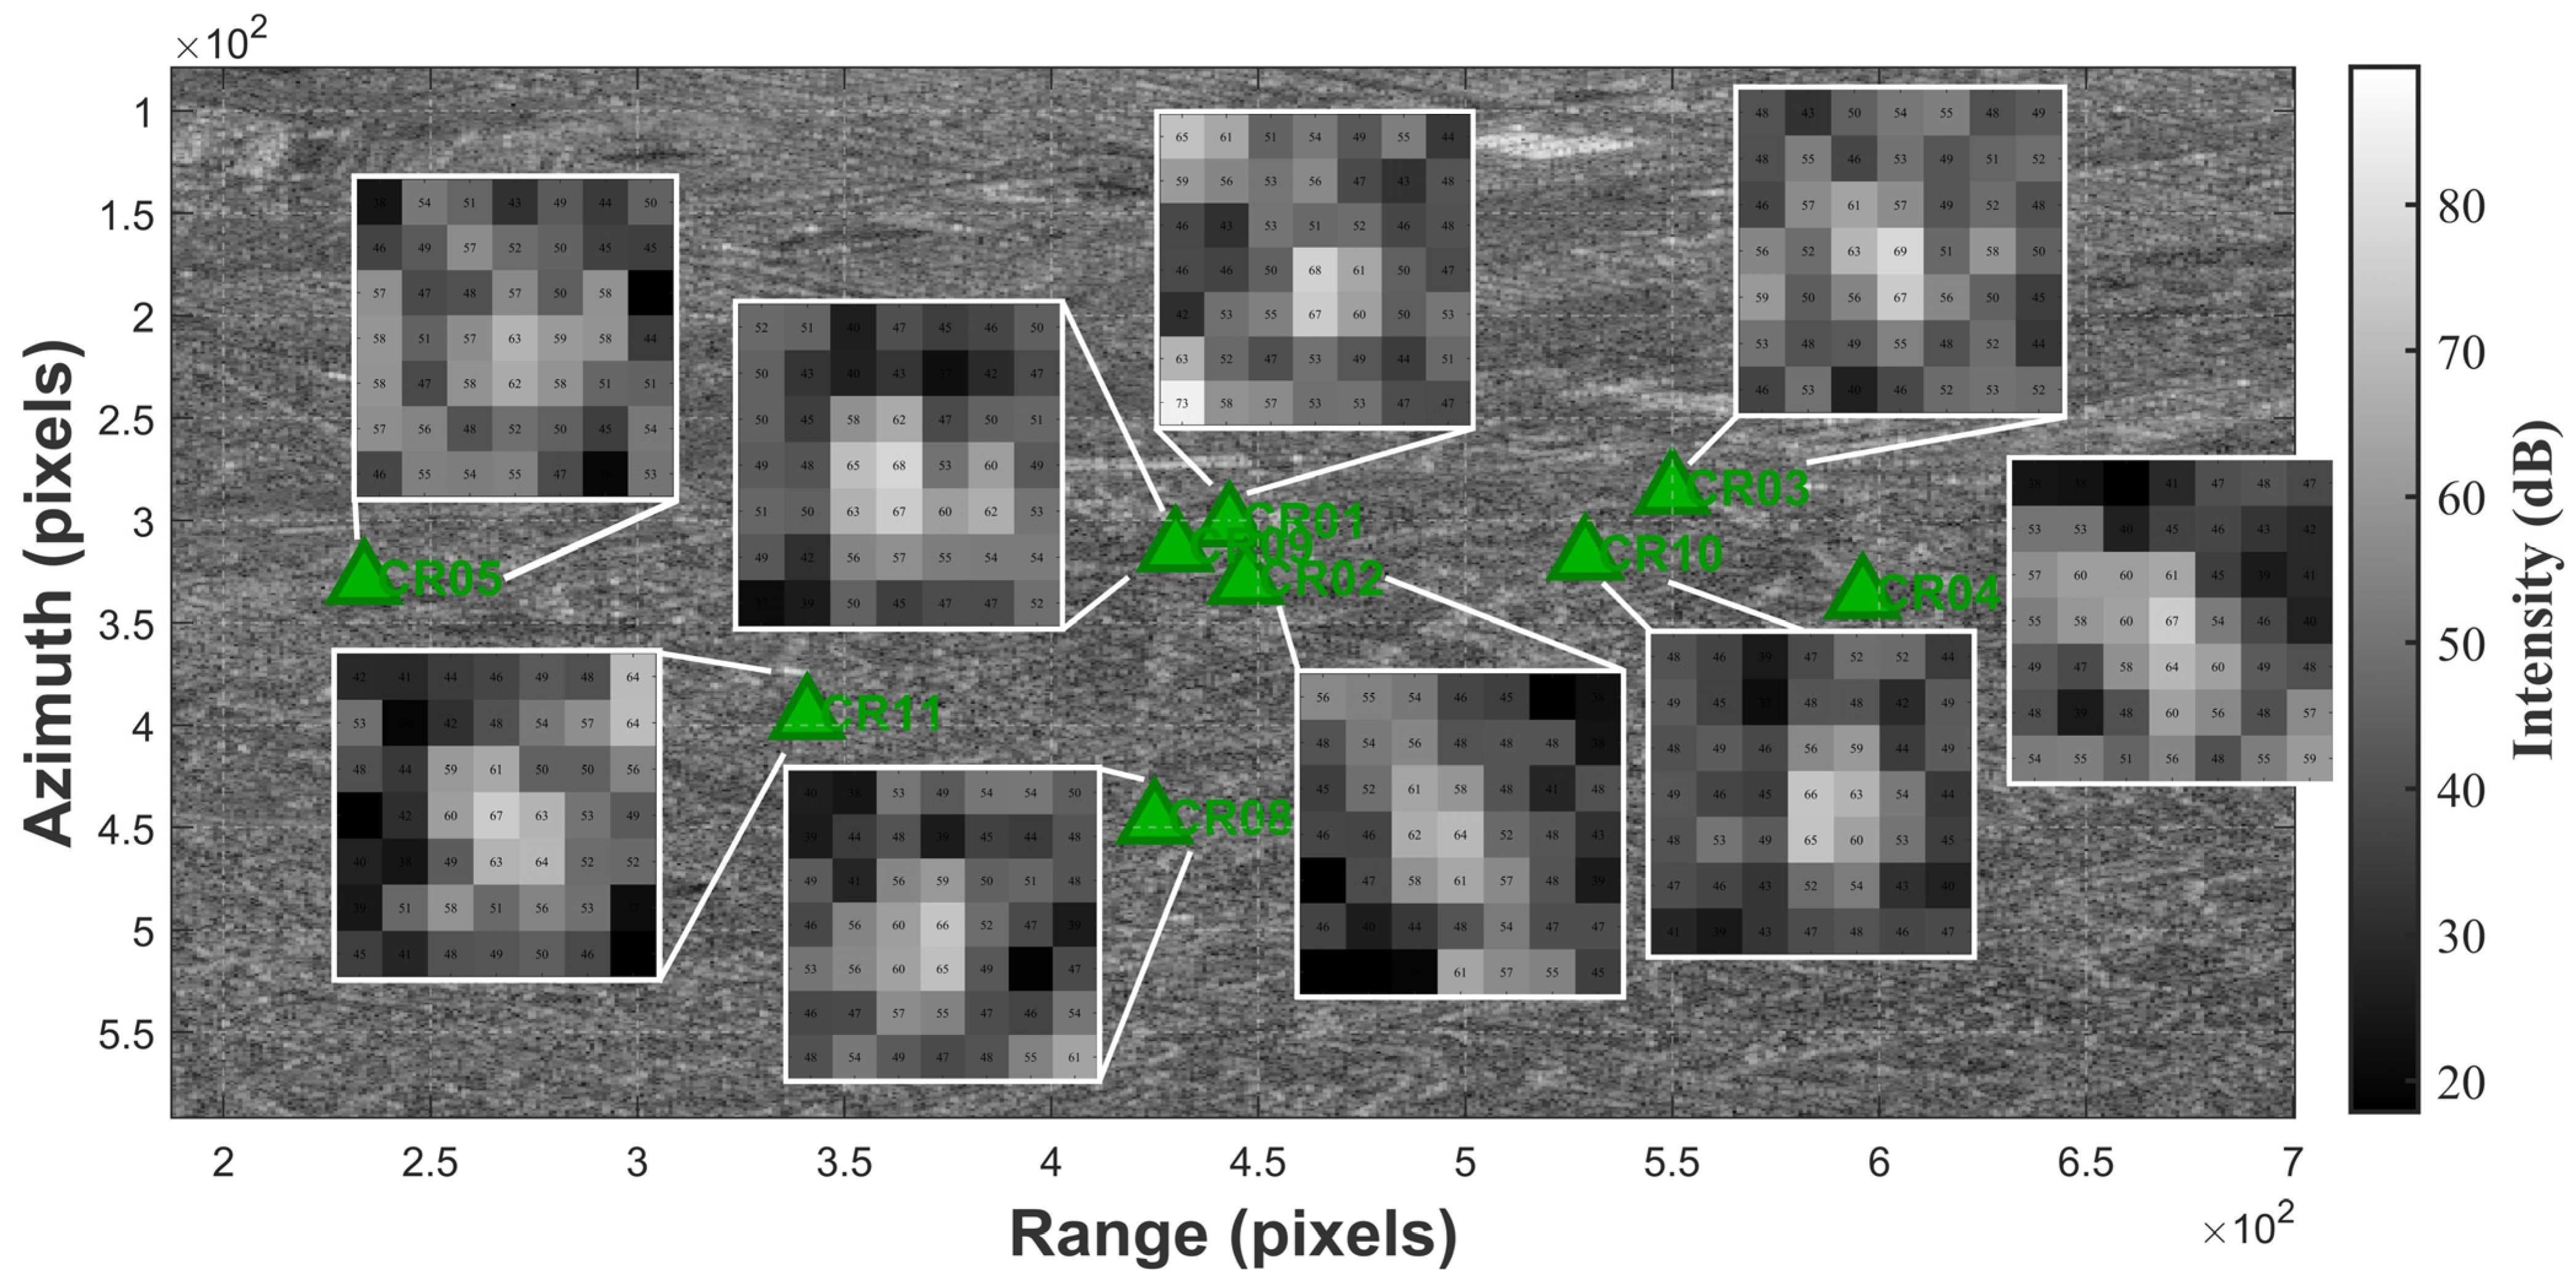
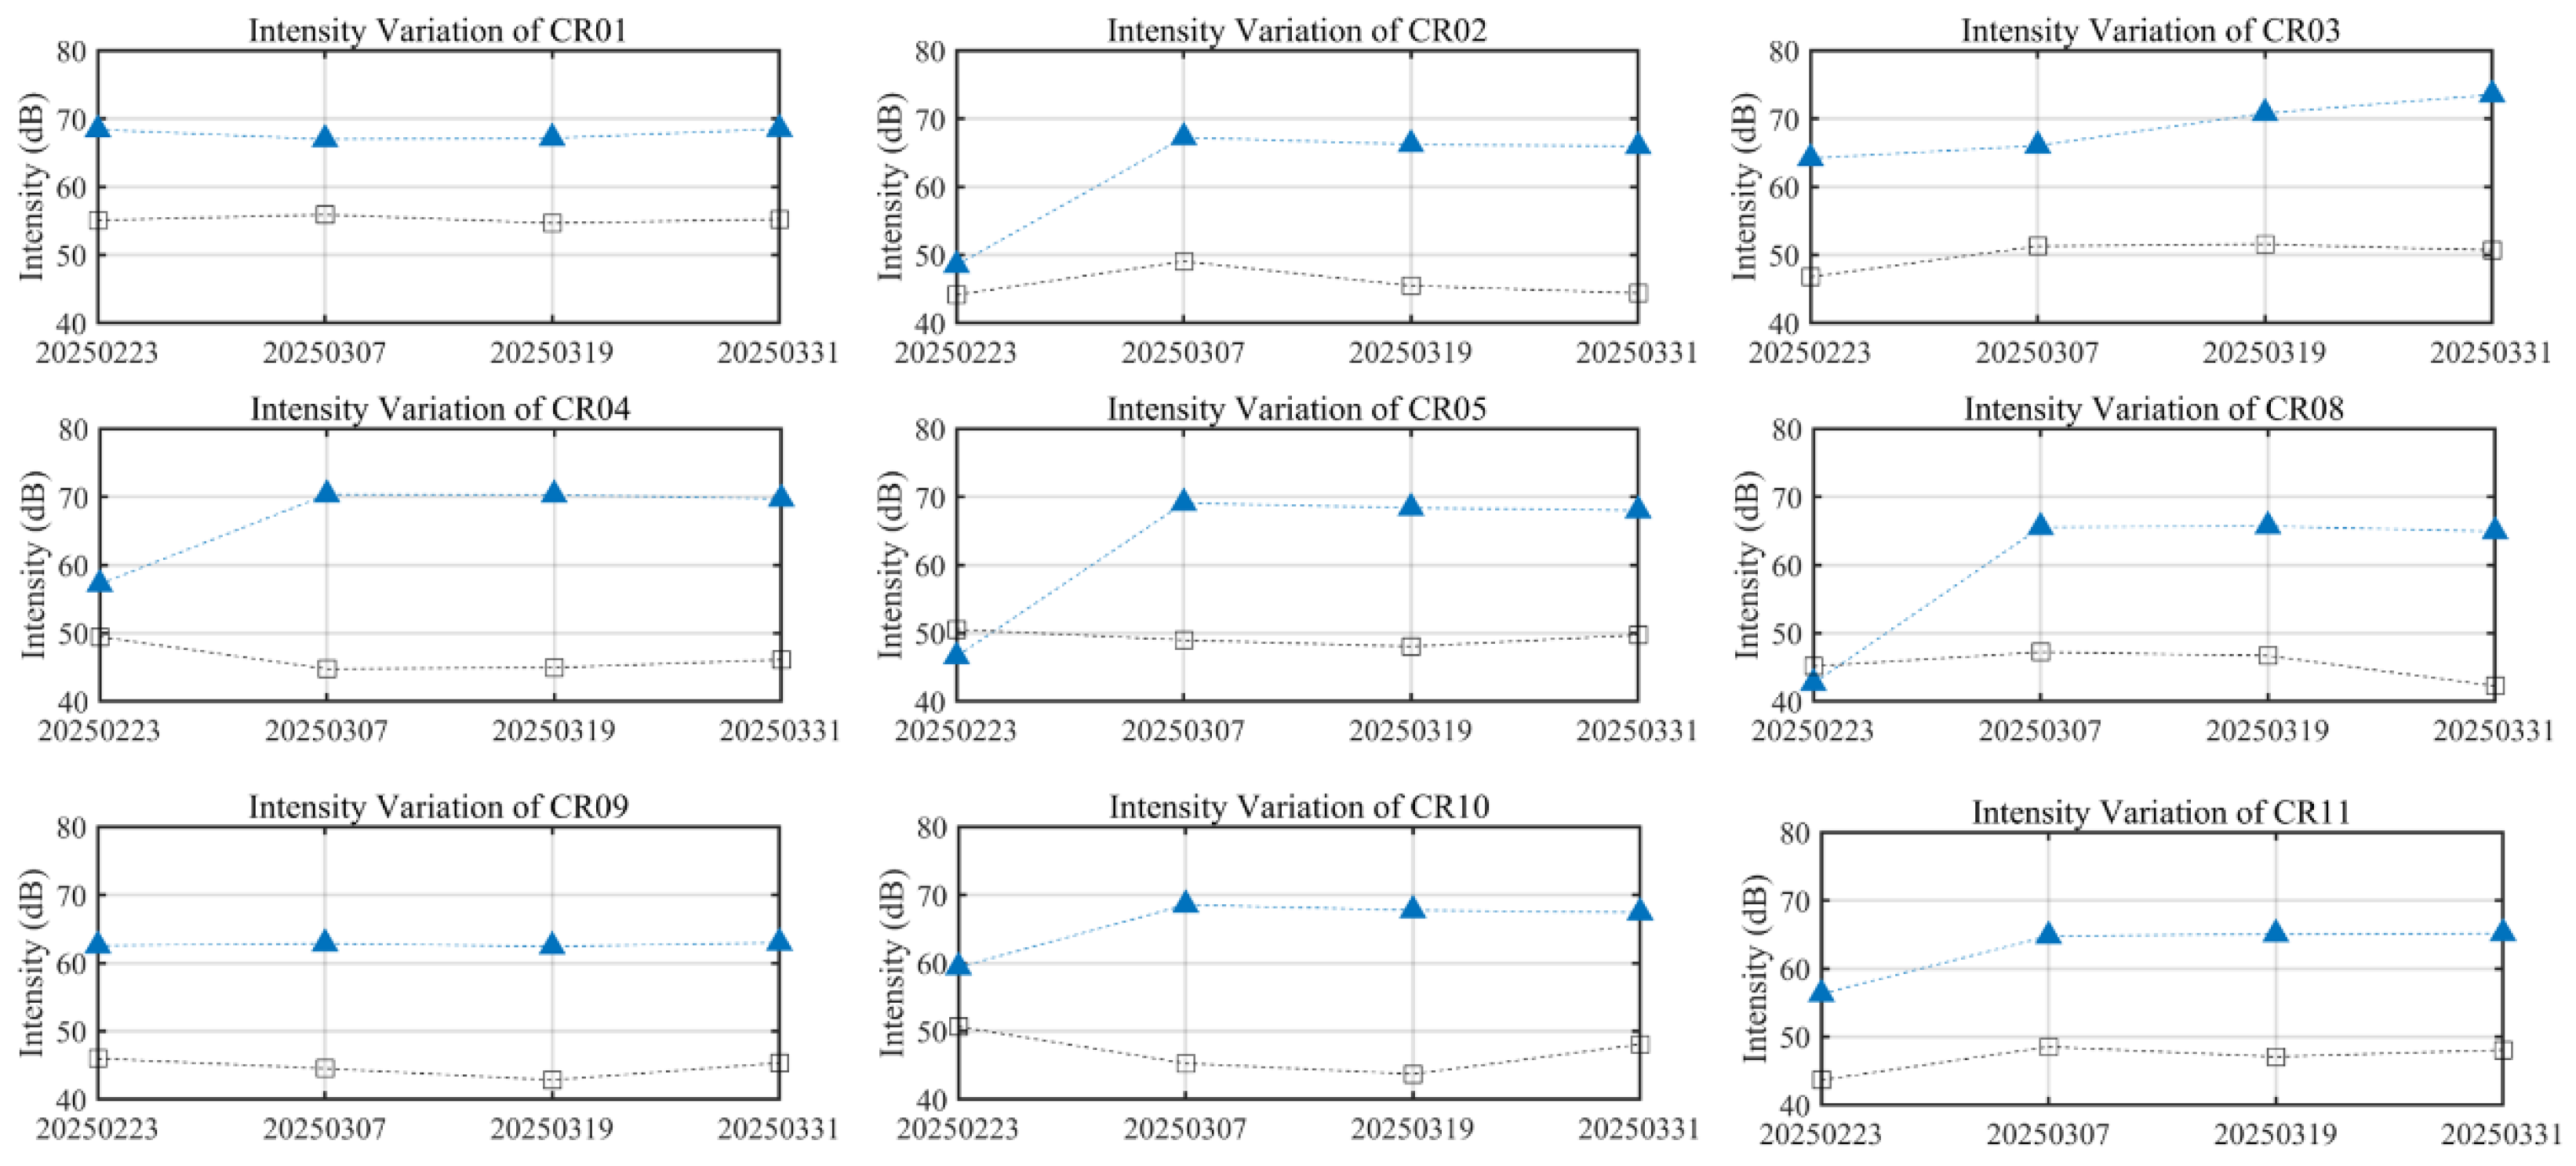
3.2.3. CR
4. Results and Discussion
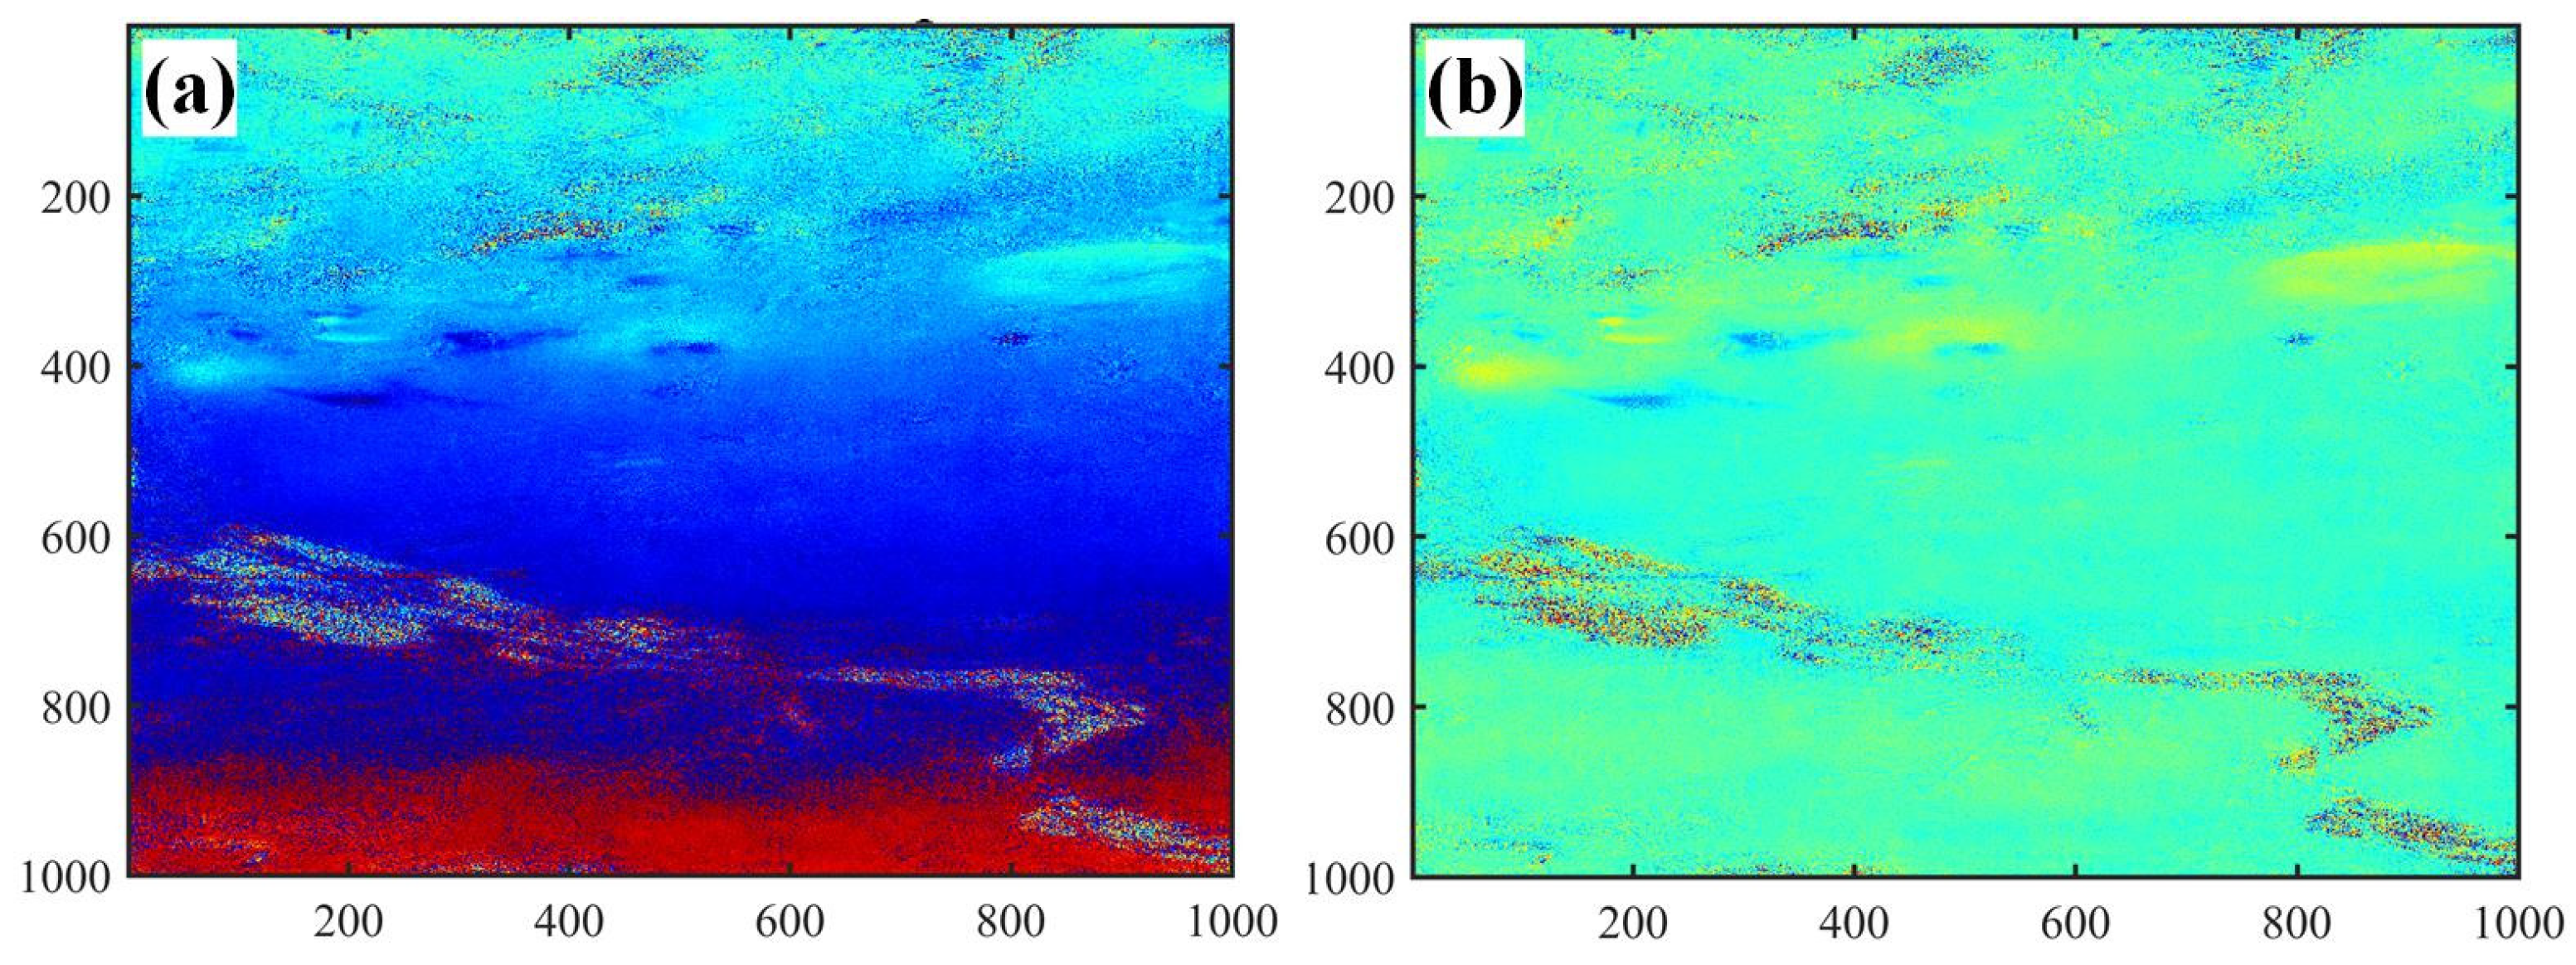
4.1. Analysis of Coherence Coefficient Results
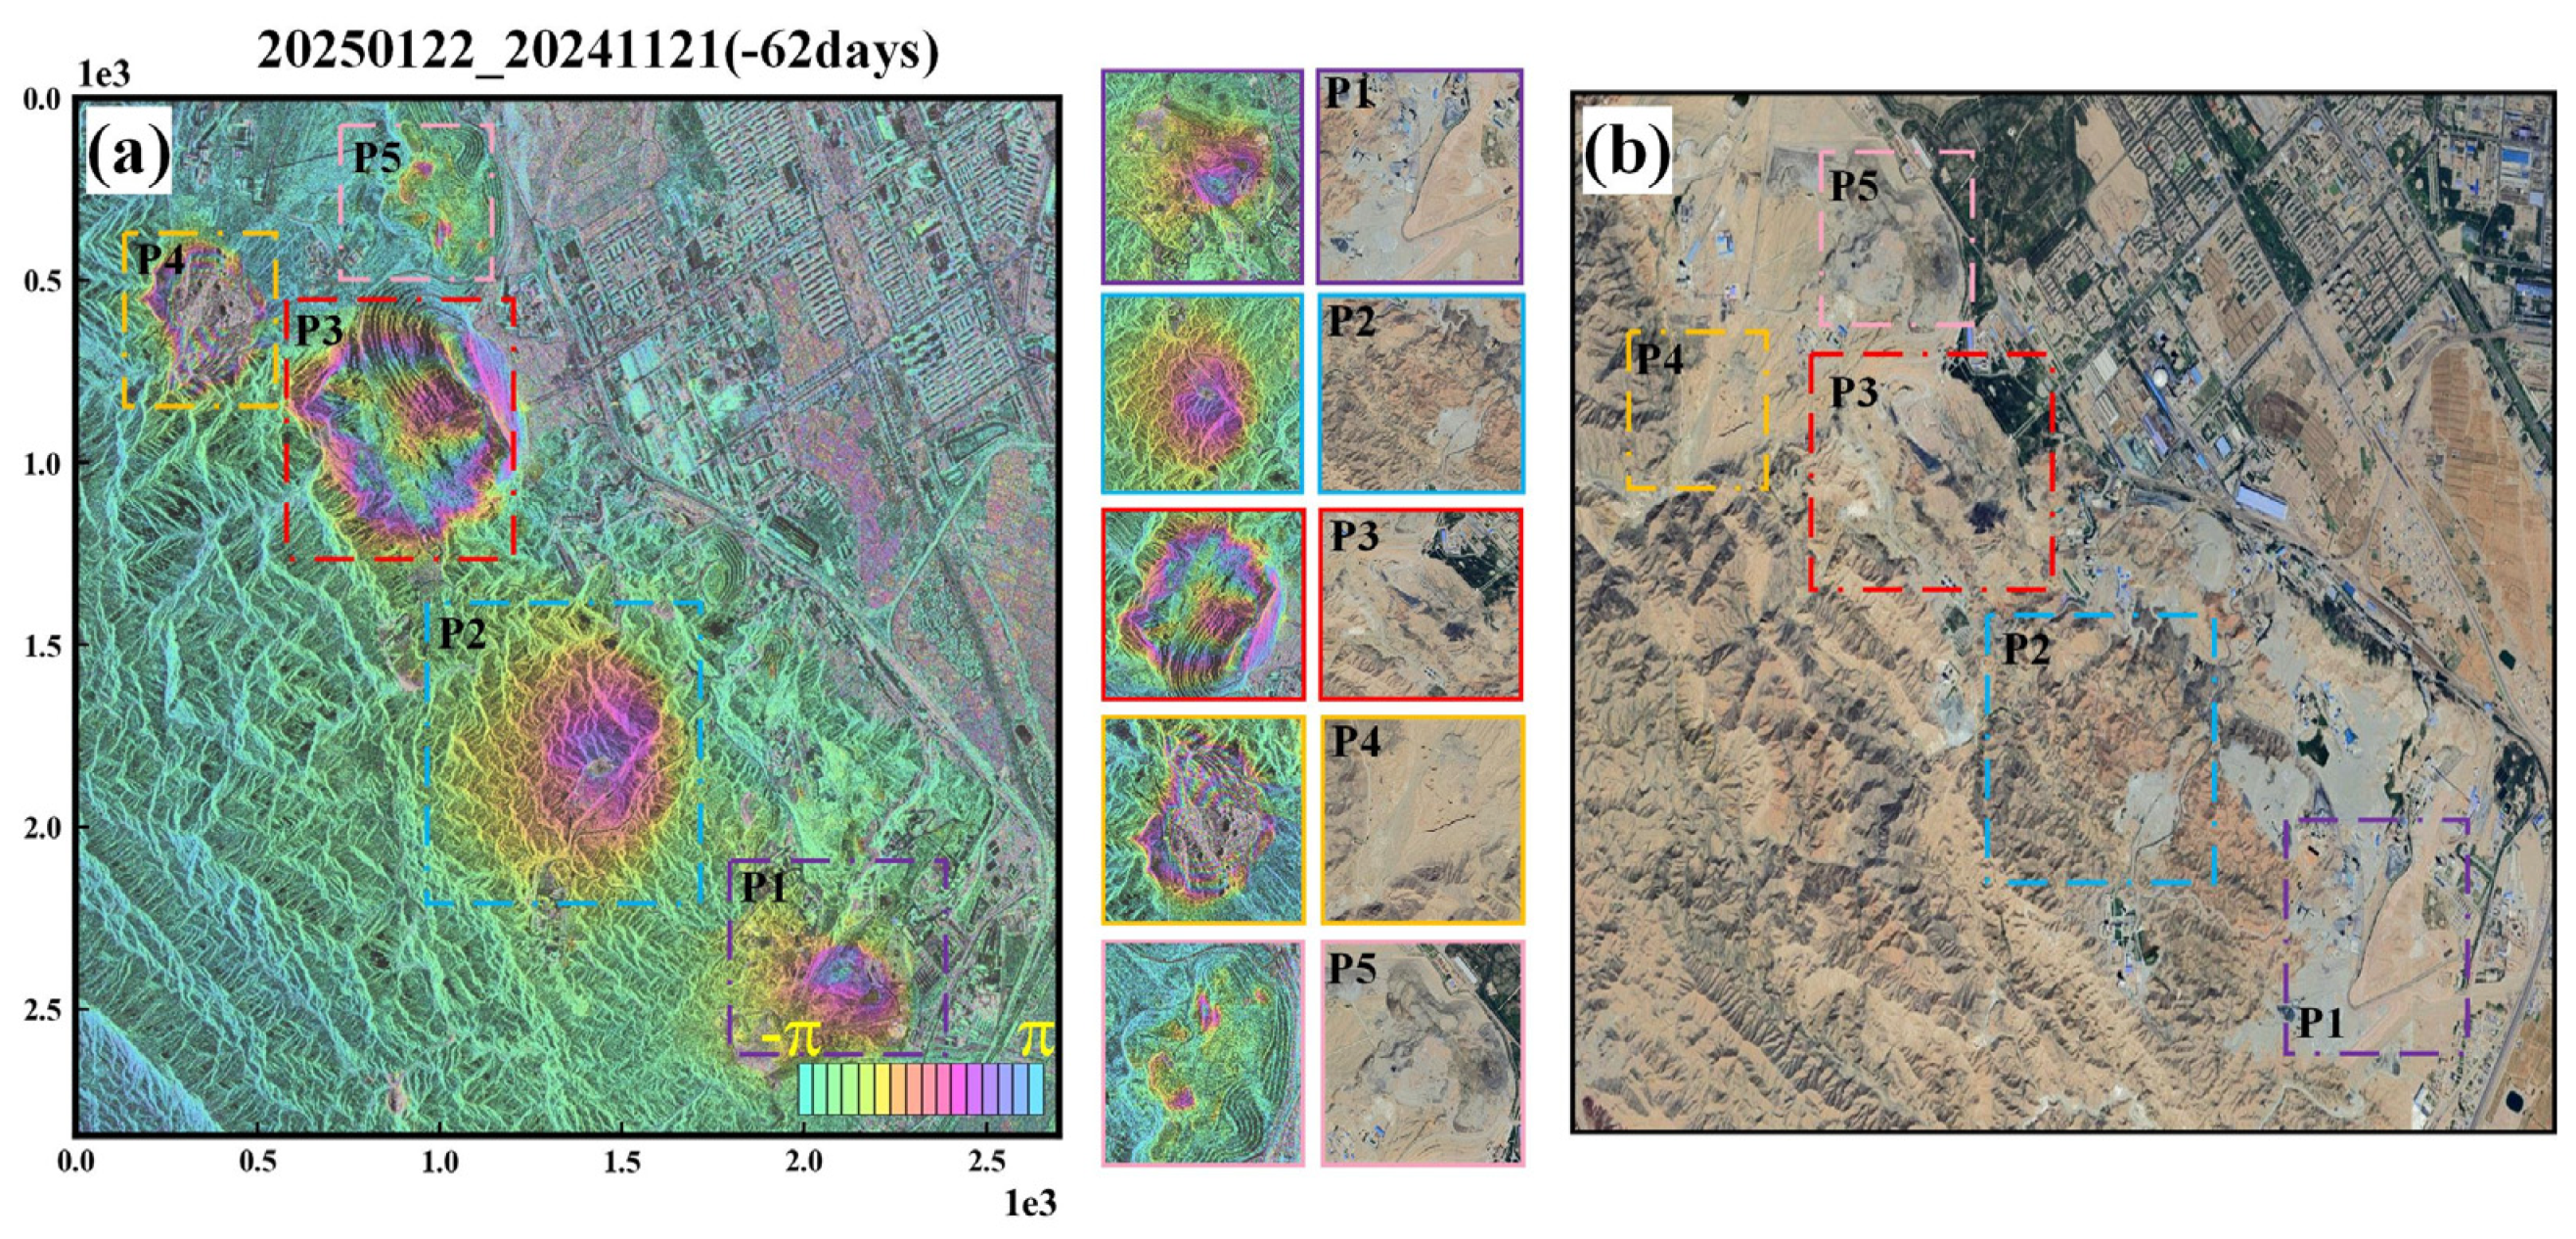
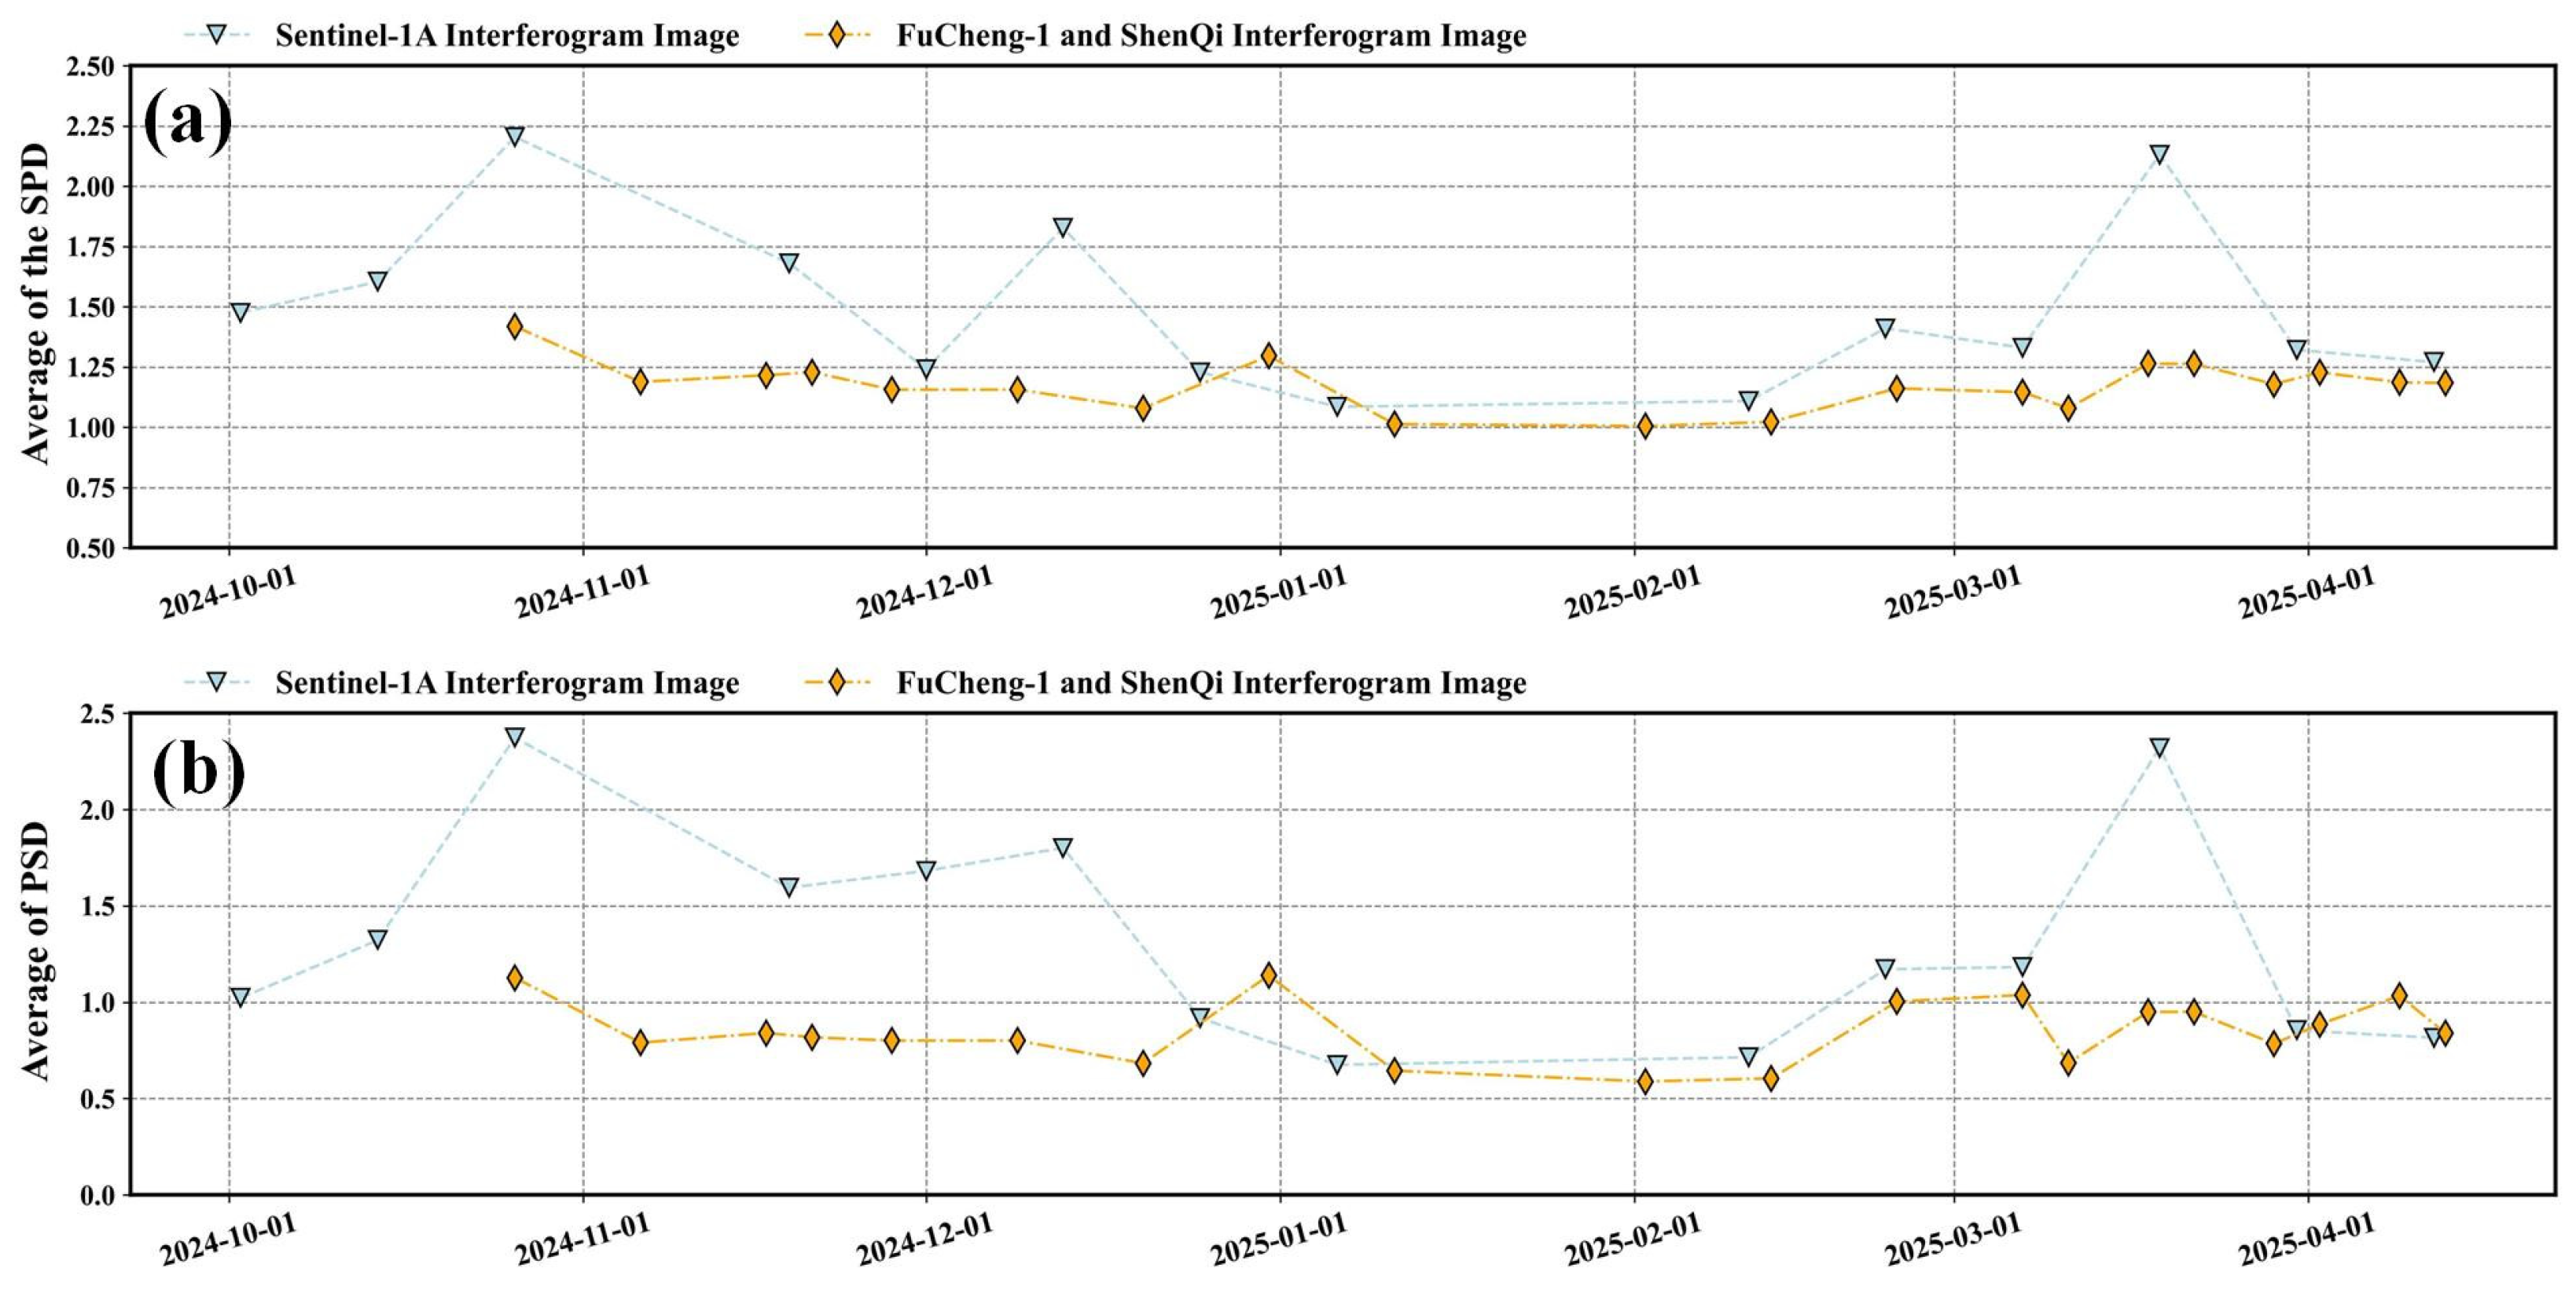
4.2. Analysis of Differential Interferometric Effects
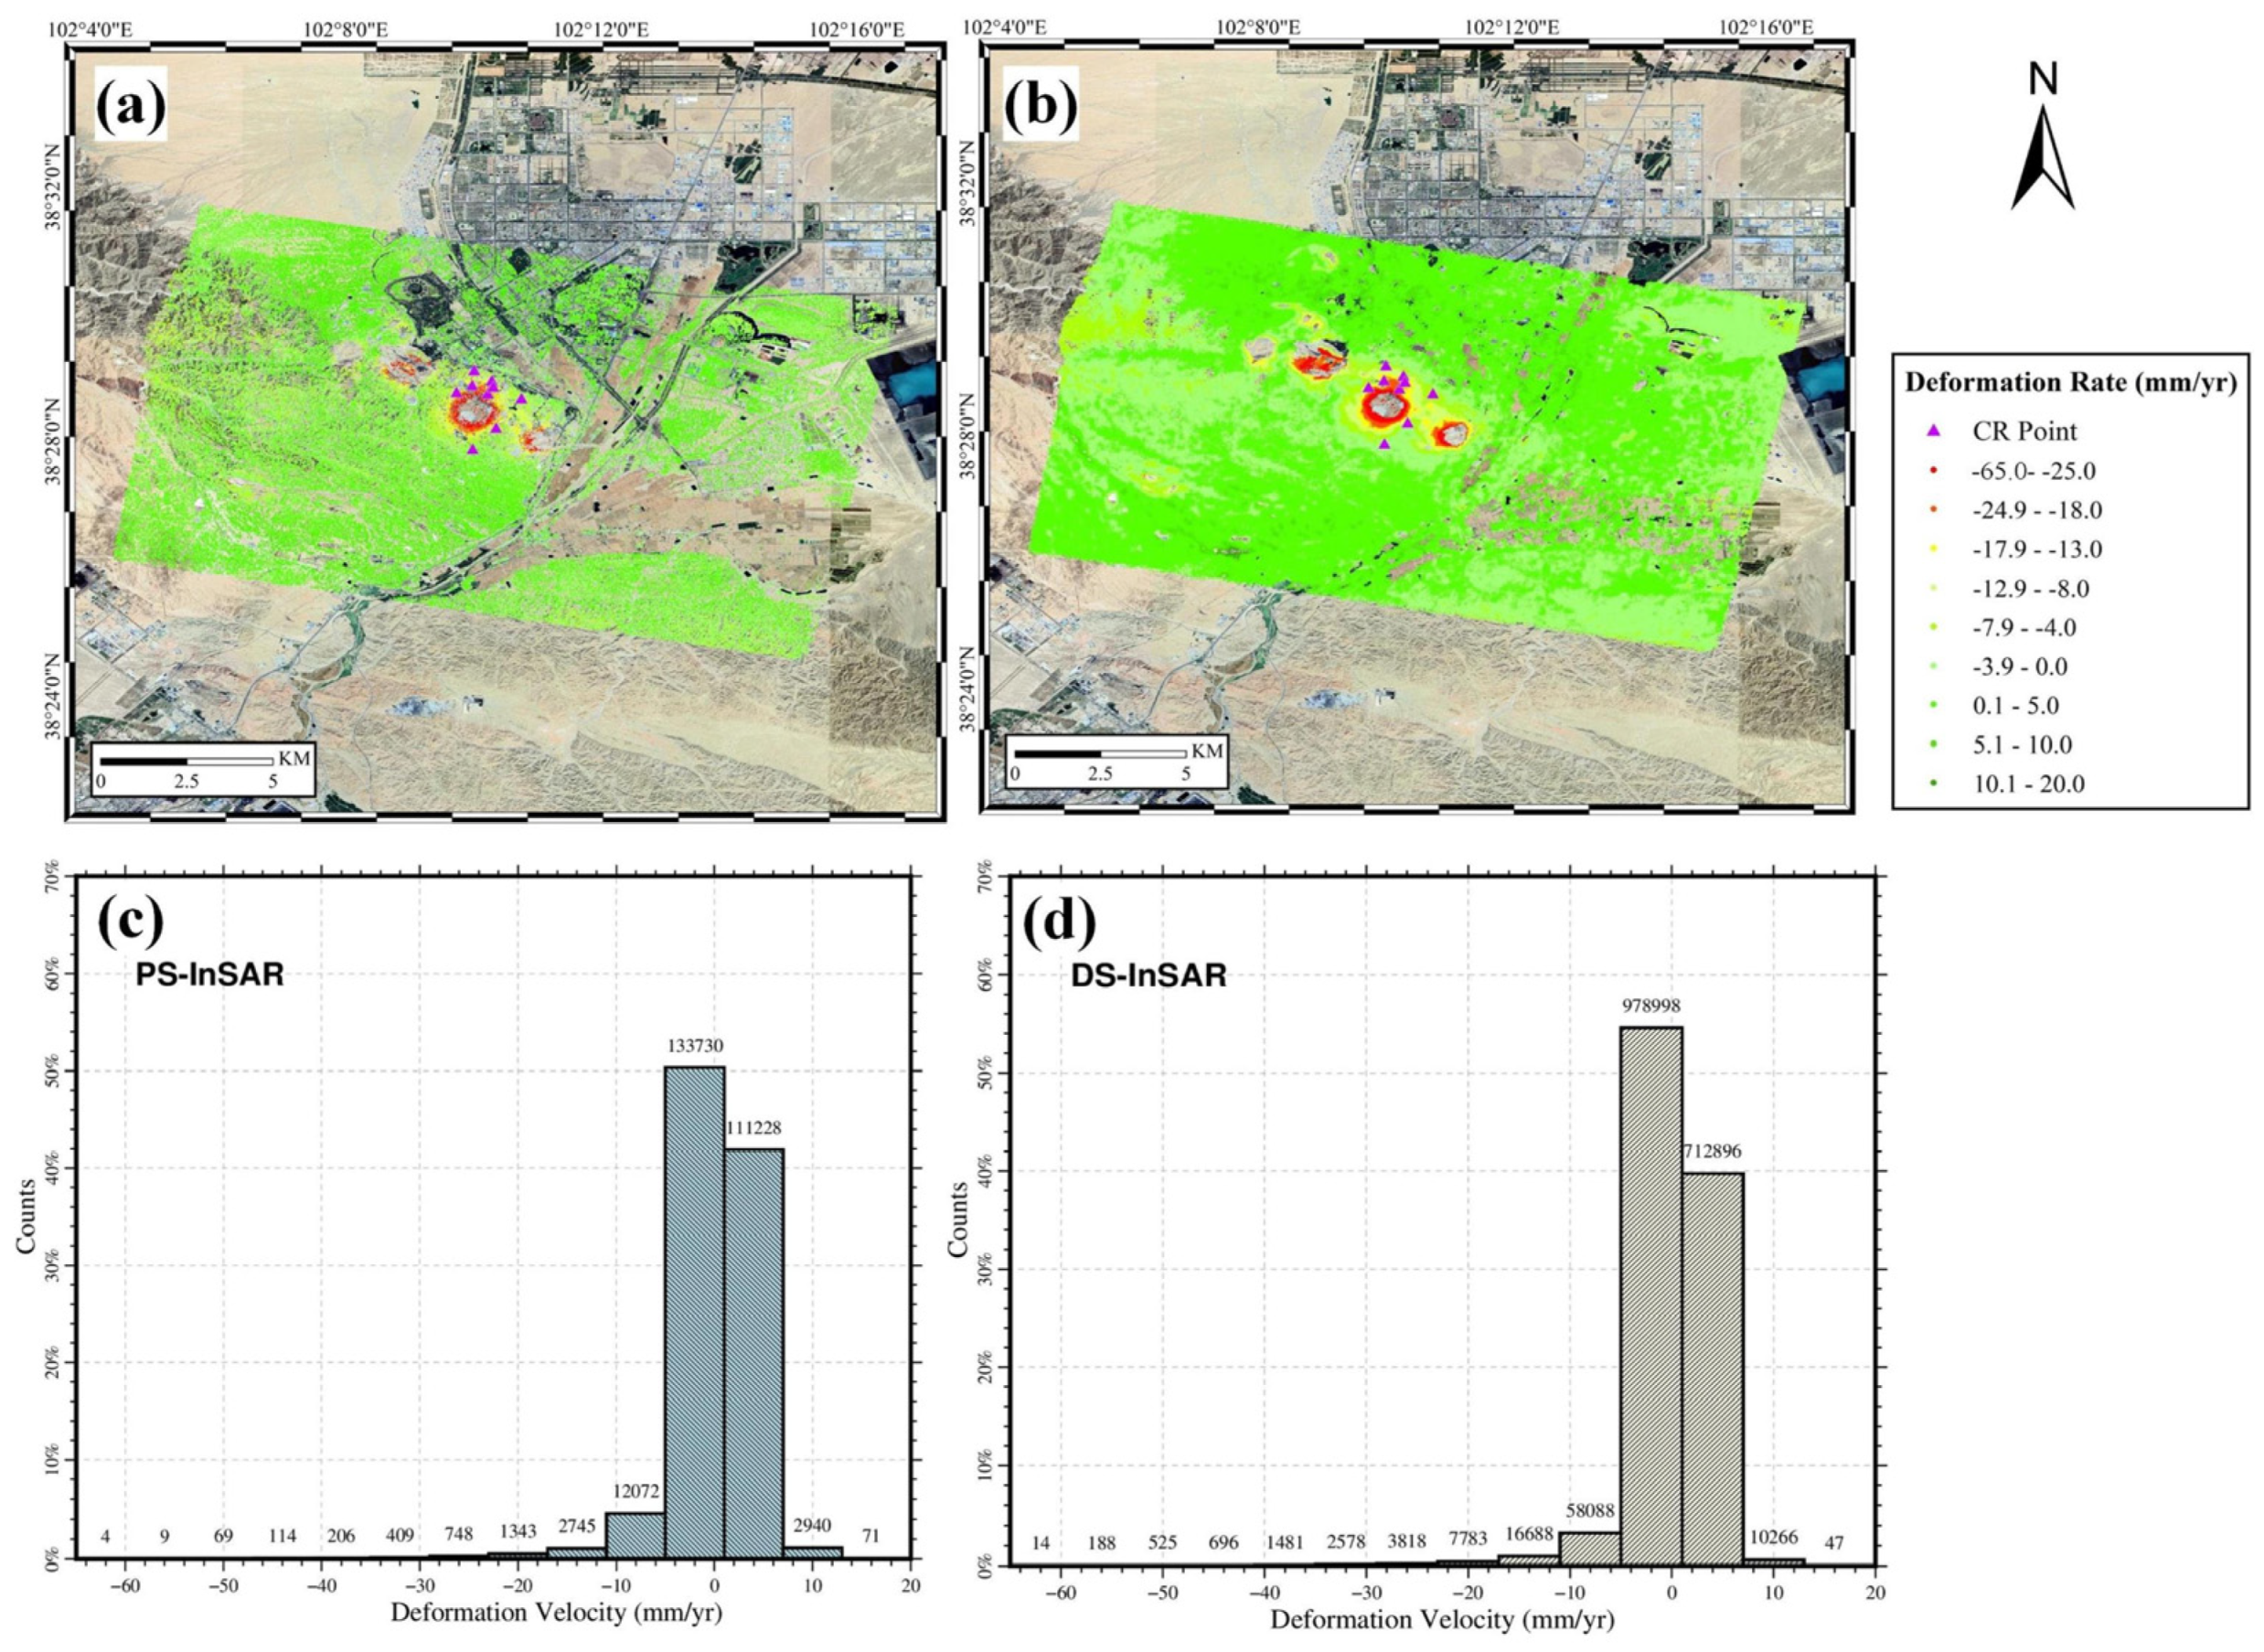
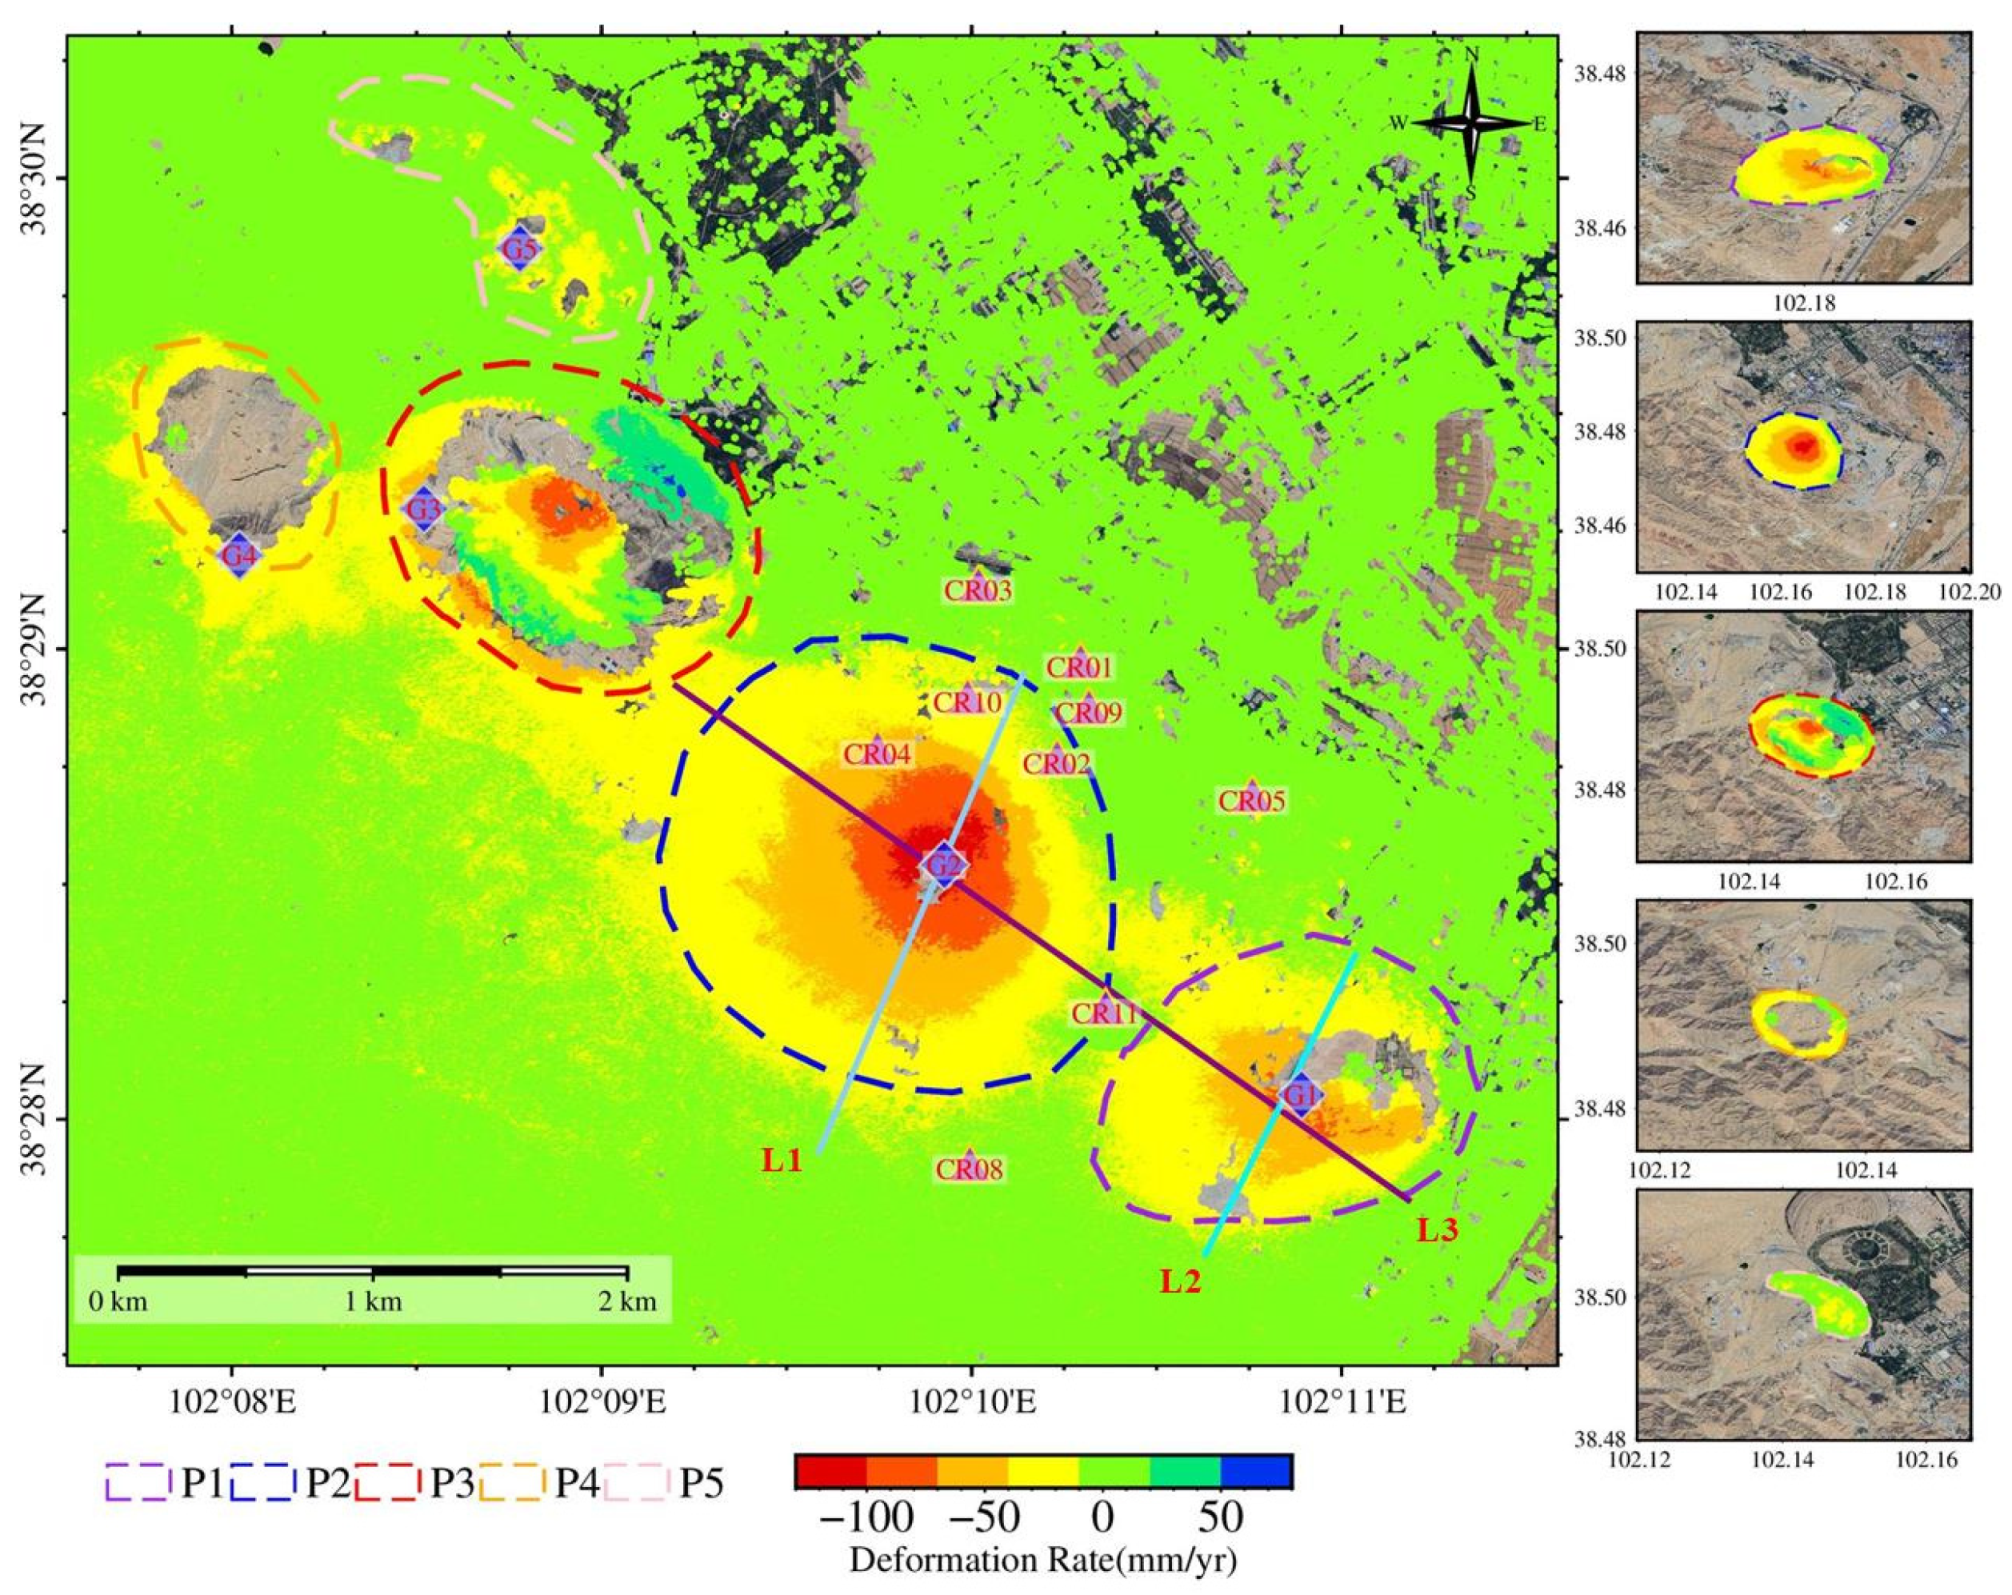
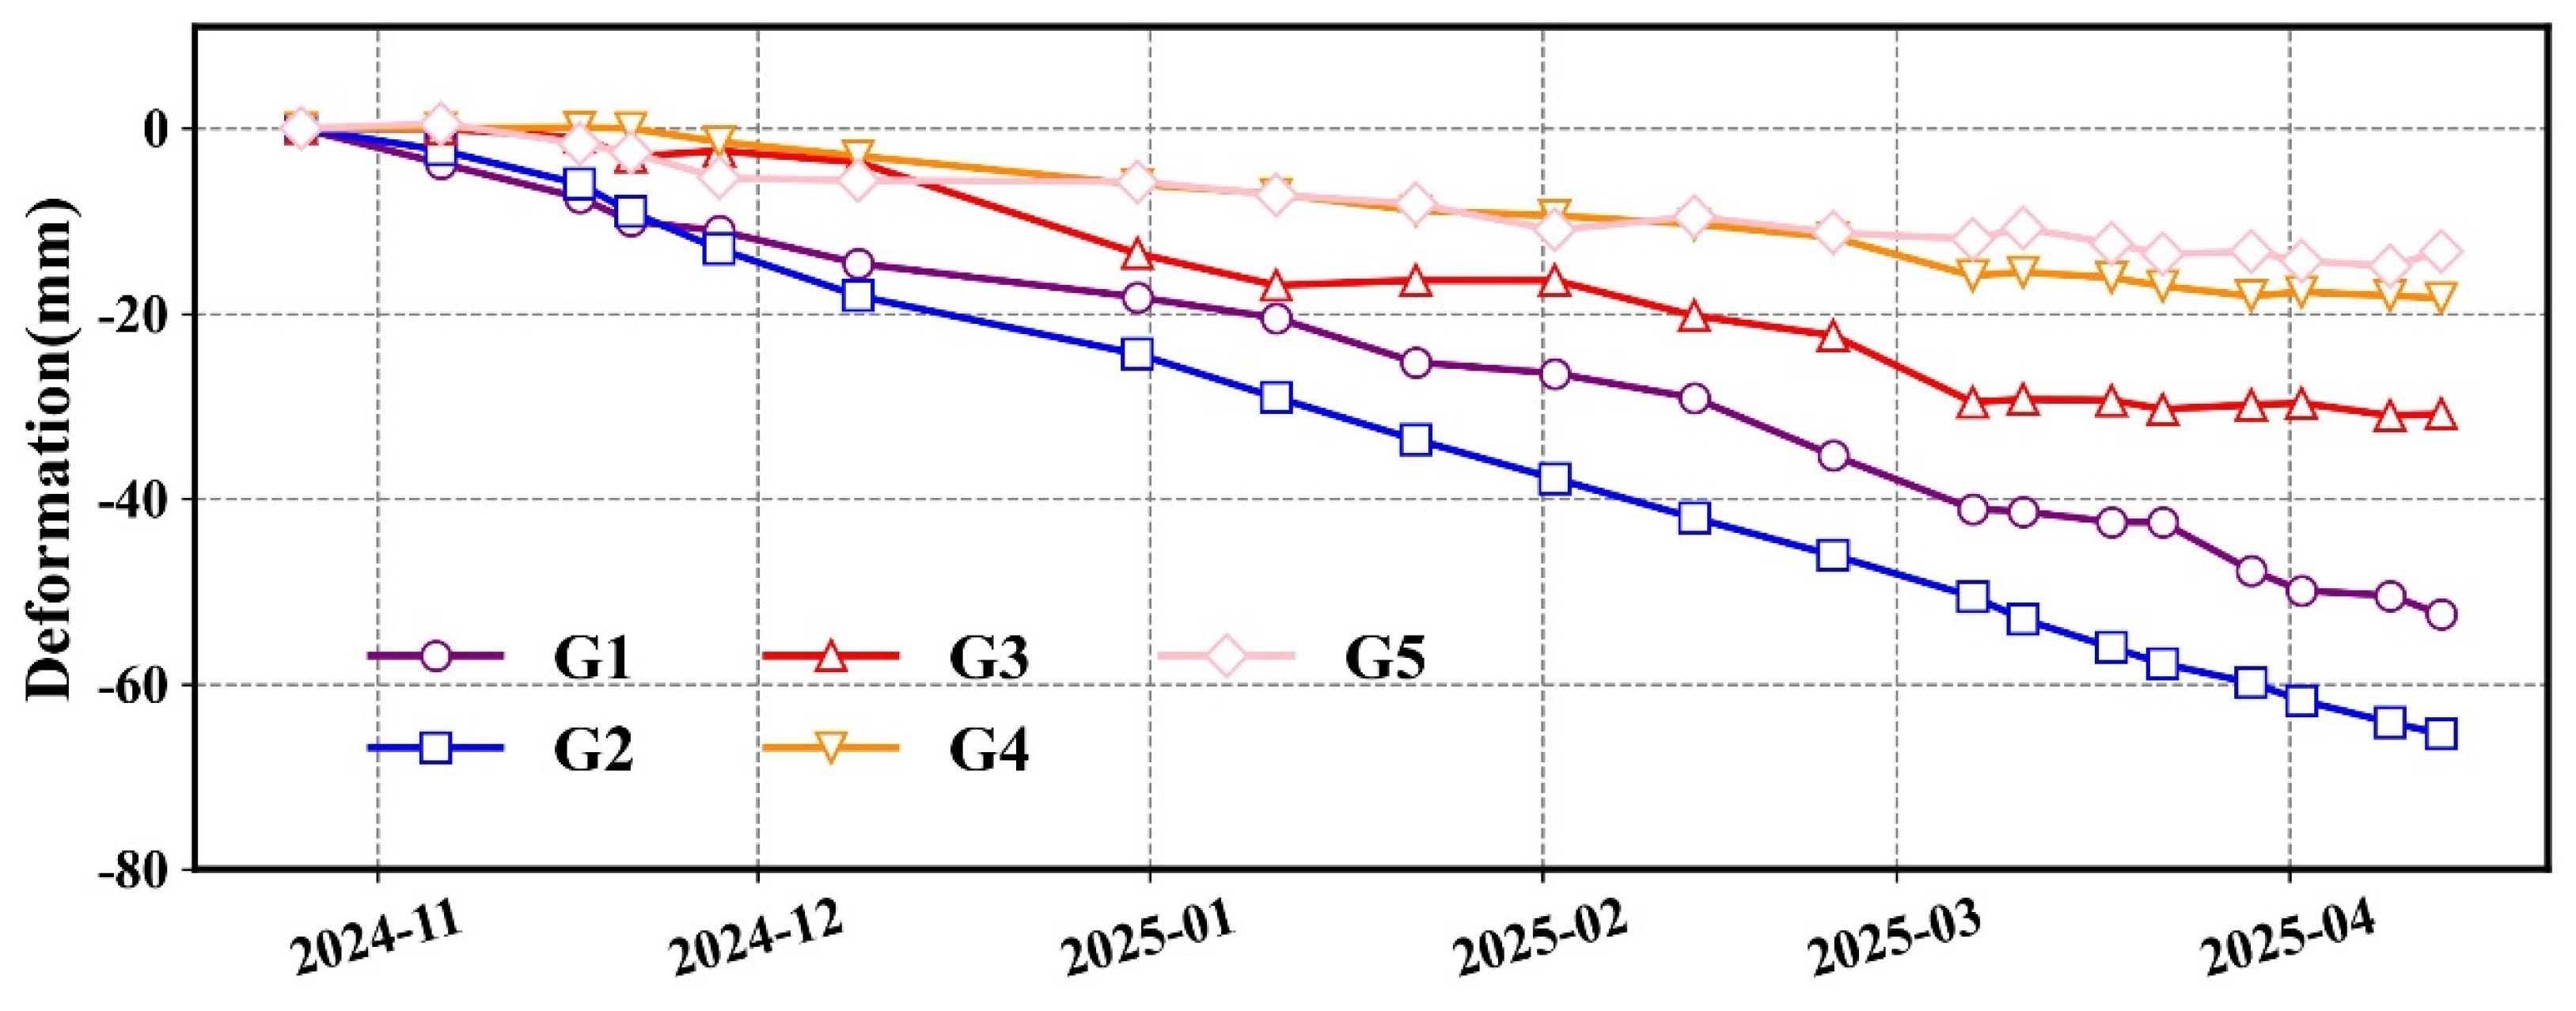
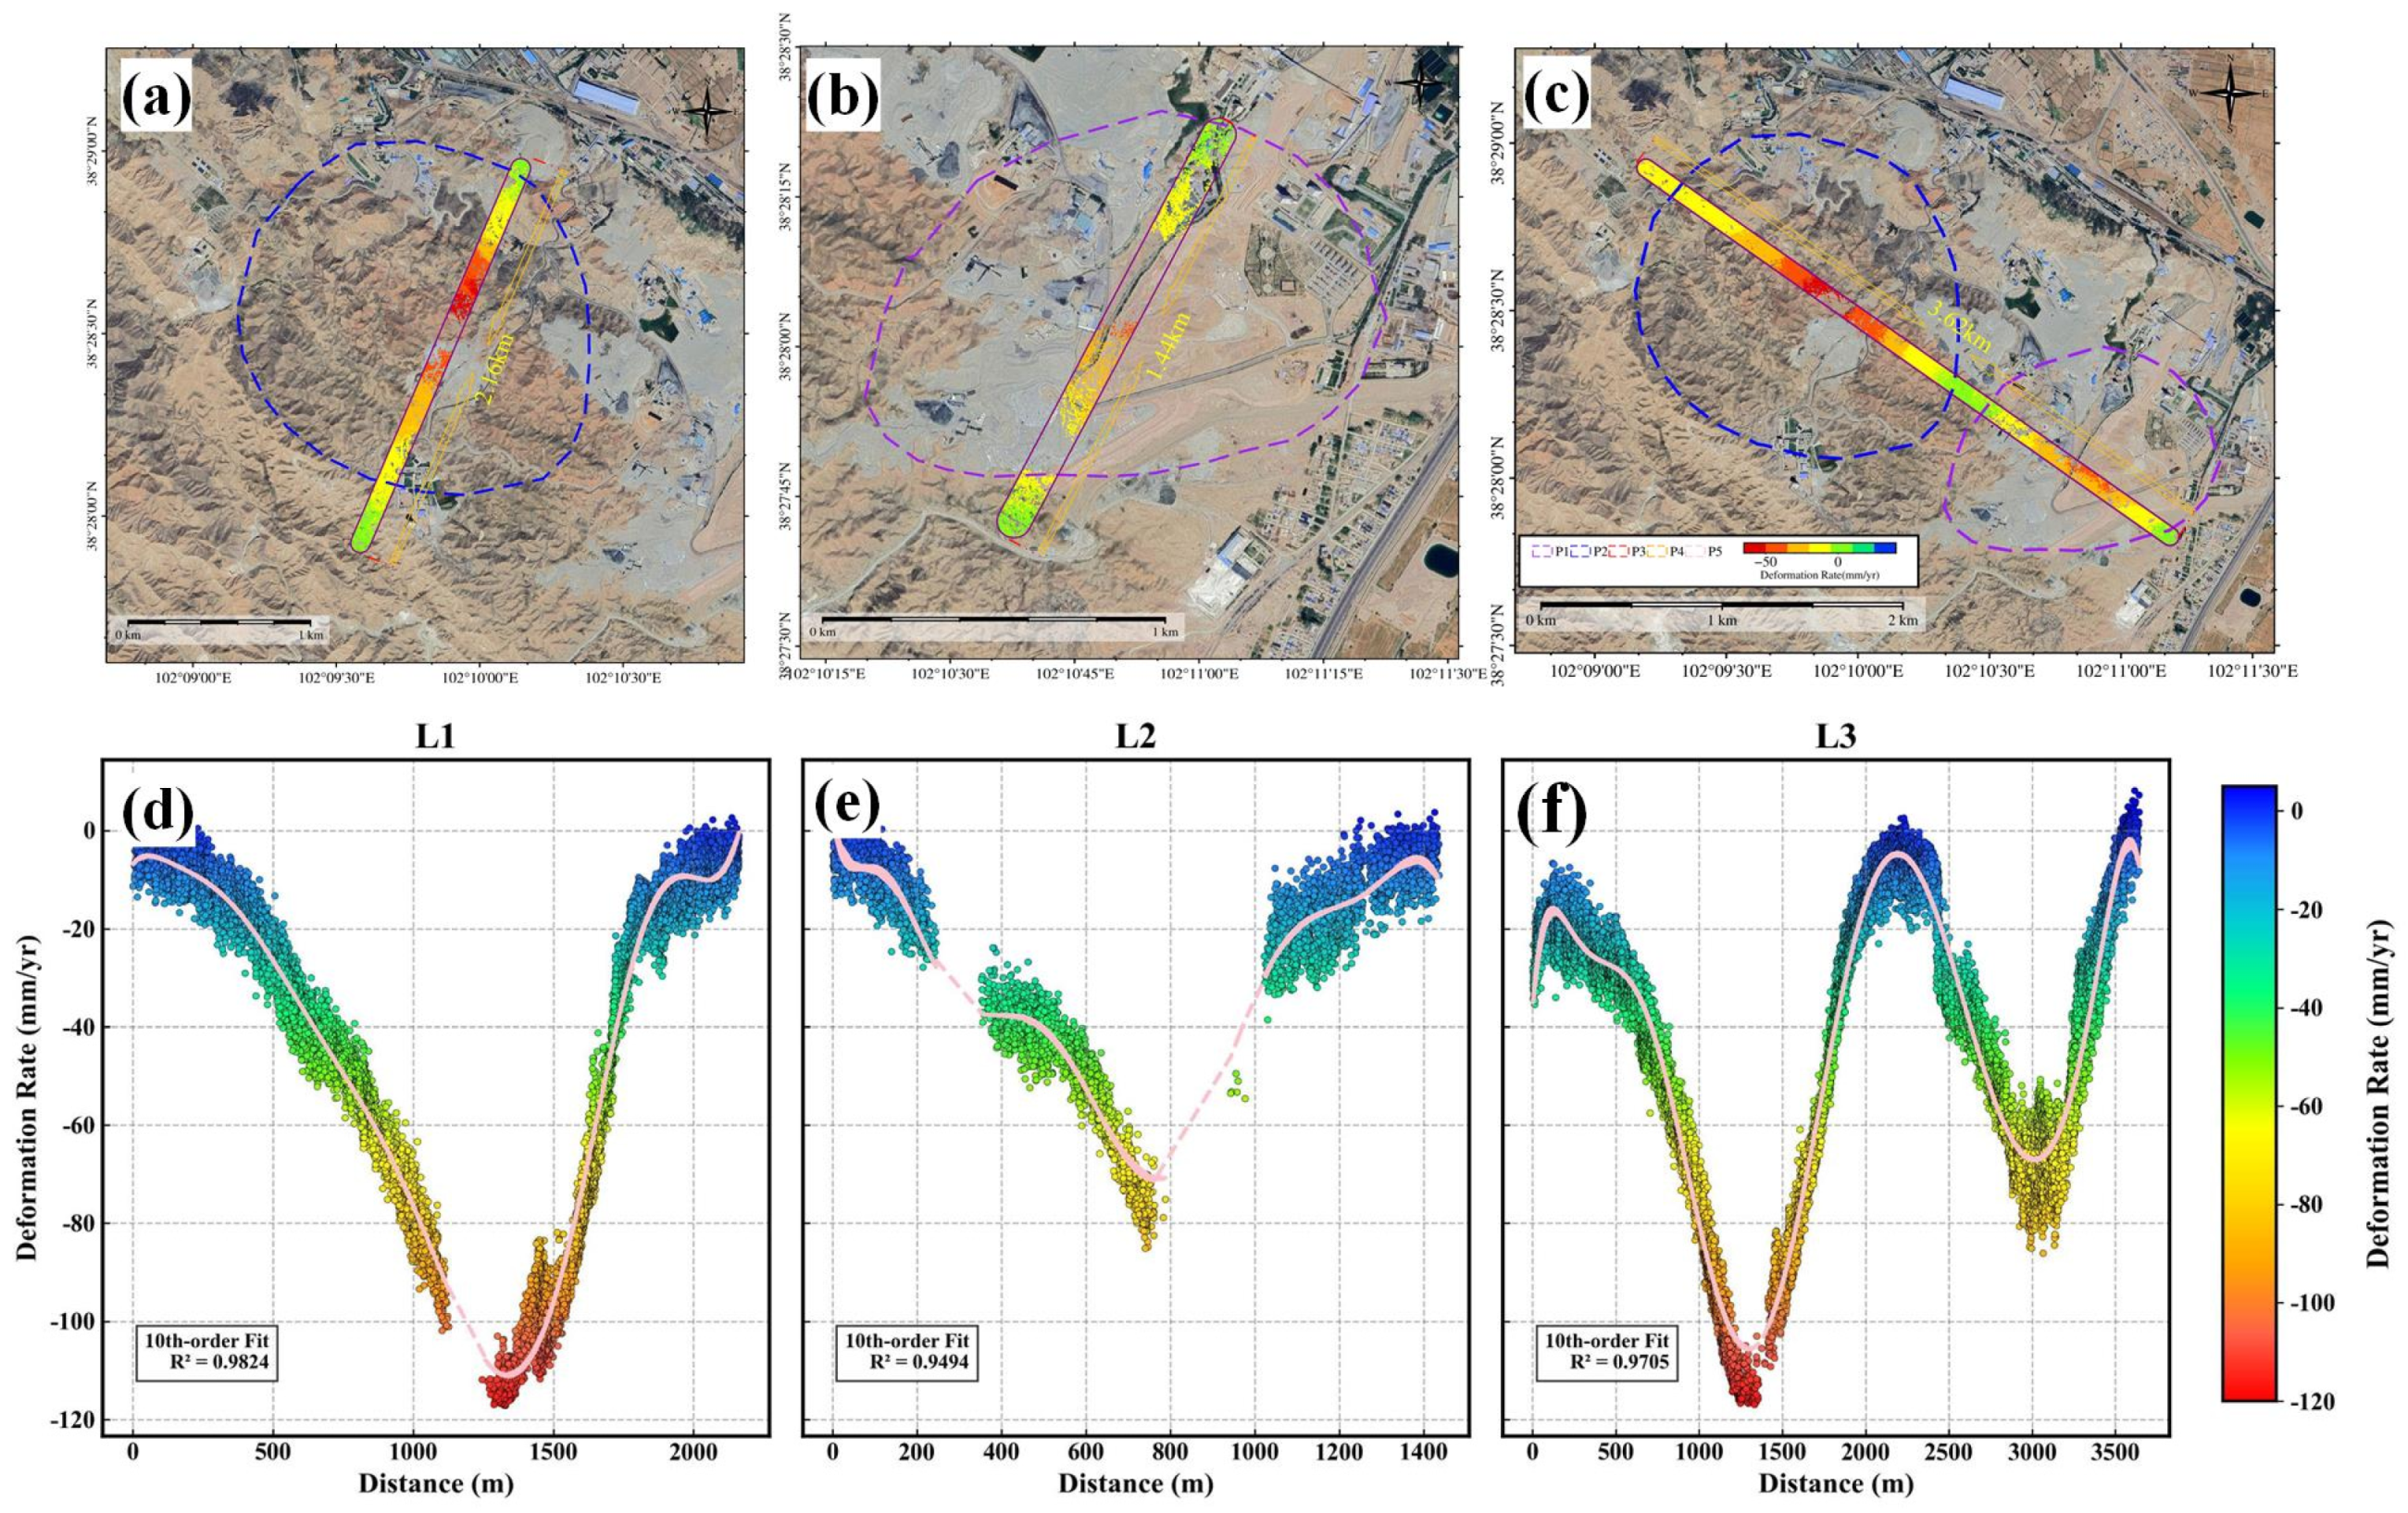
4.3. TS-InSAR Deformation Monitoring Results
4.3.1. Sentinel-1A PS/DS-InSAR Deformation Inversion Results
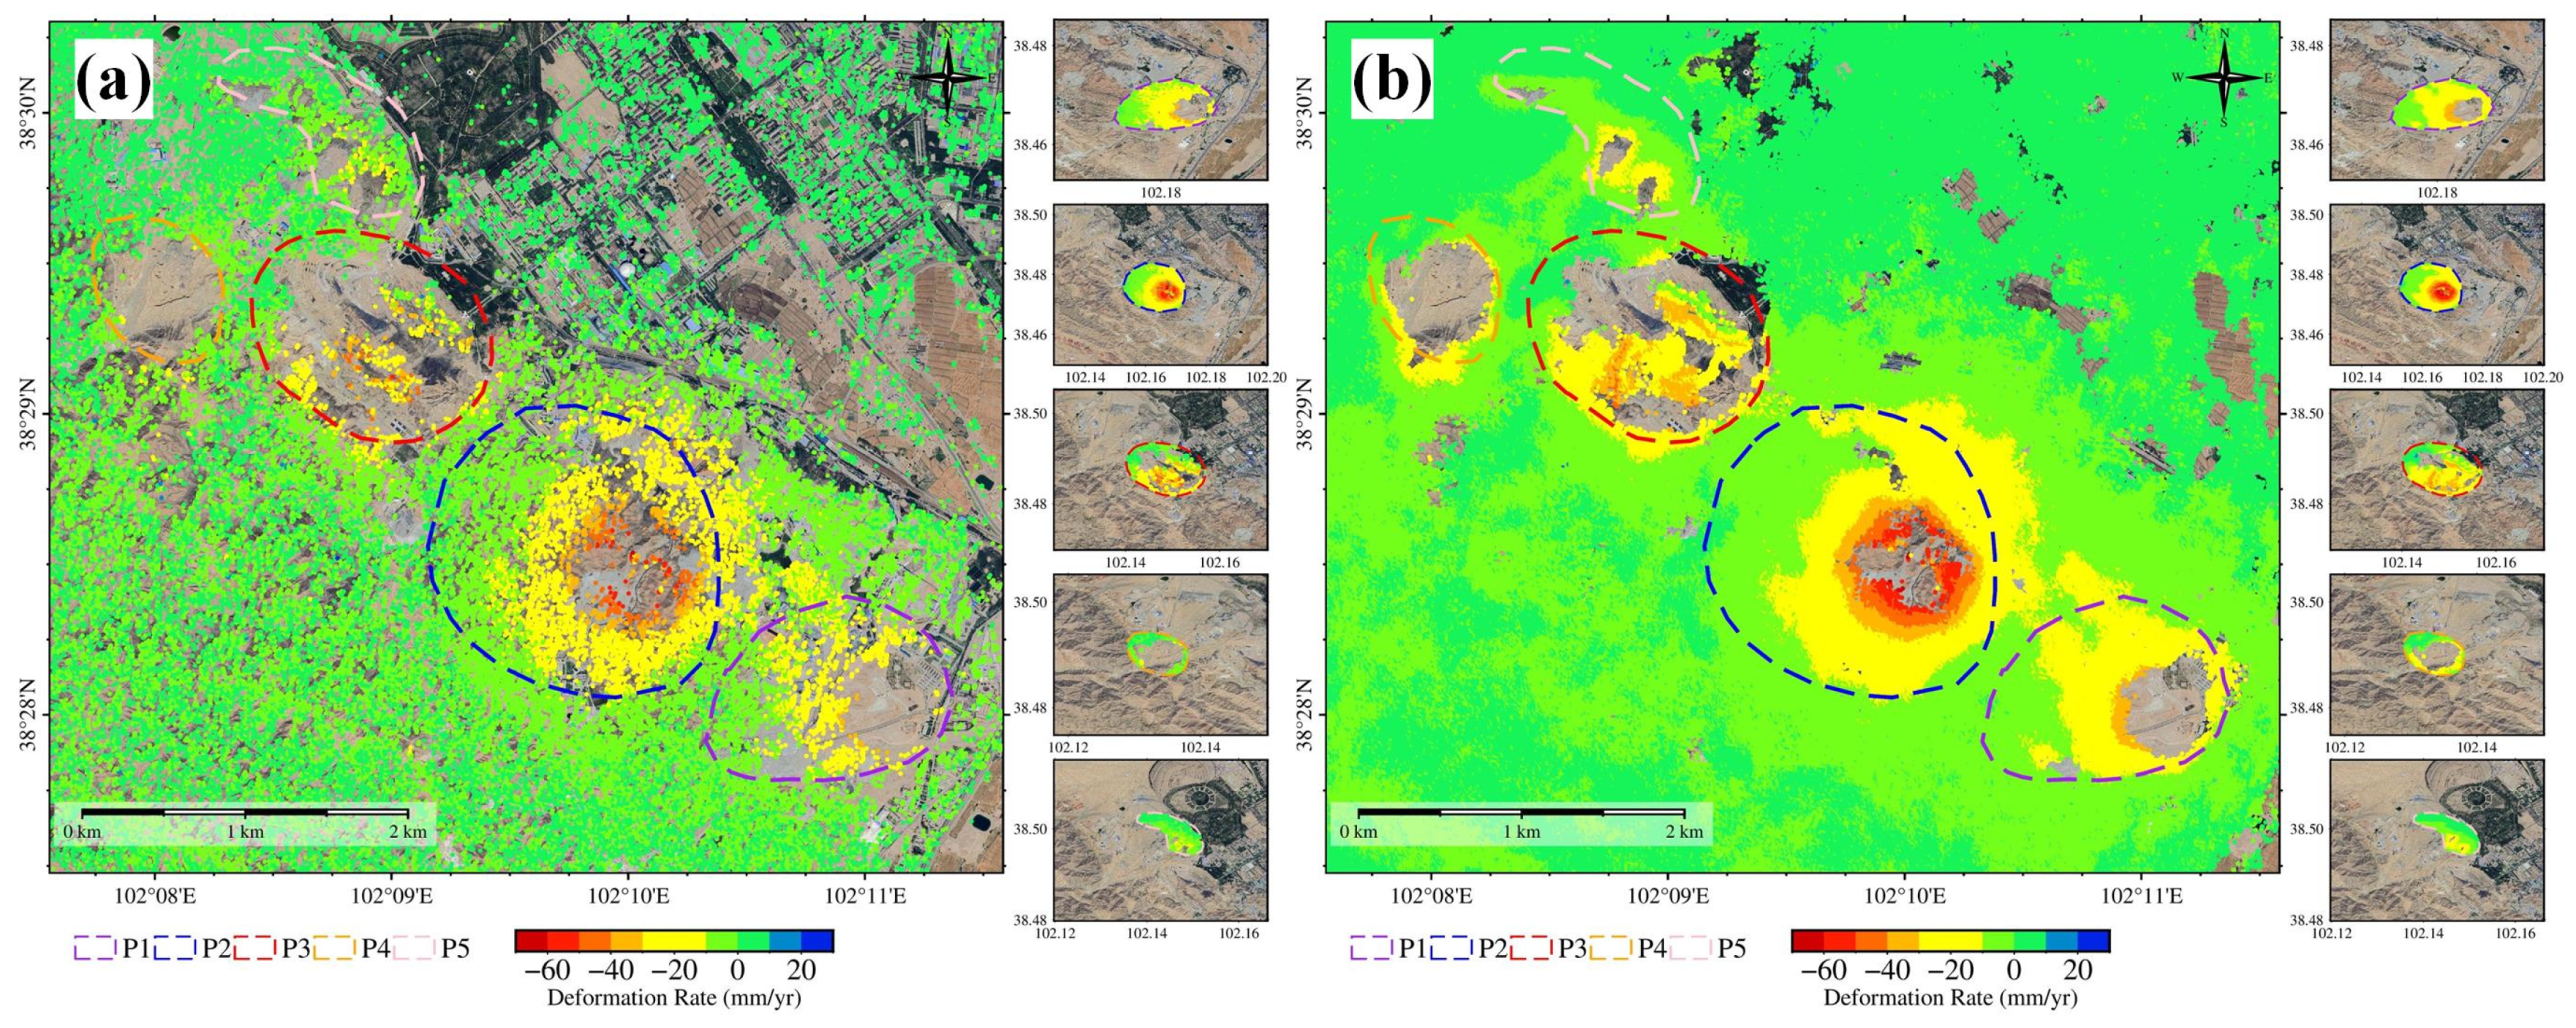
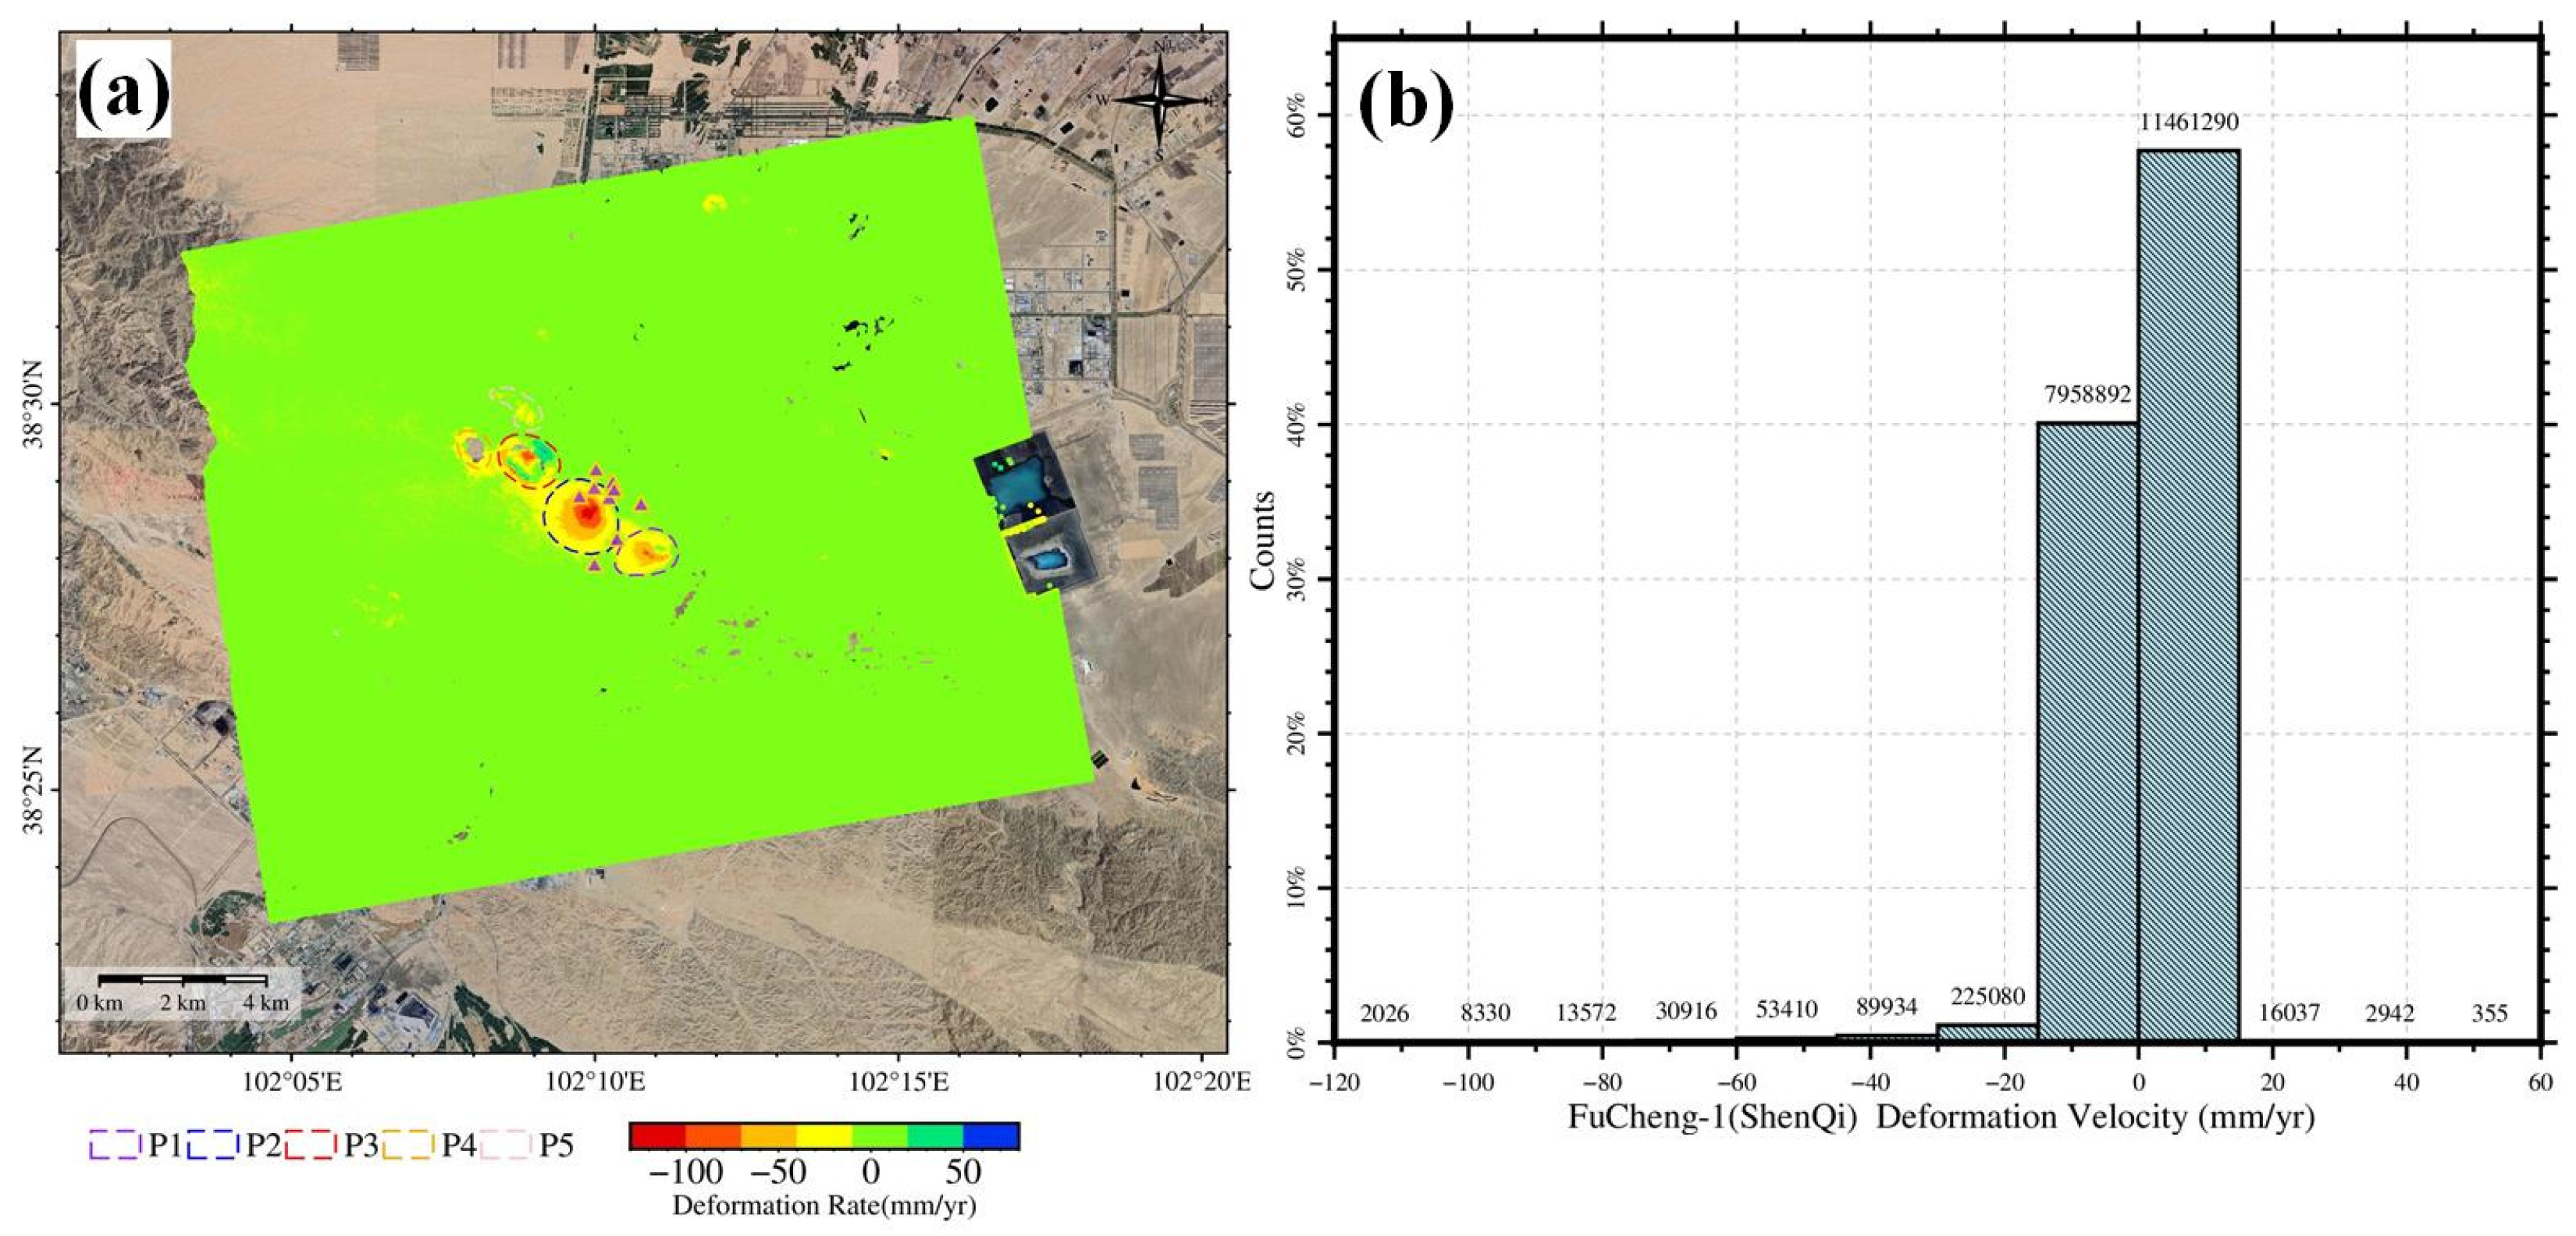
4.3.2. “Fucheng-1” and “Shenqi” PS-InSAR Deformation Inversion Results
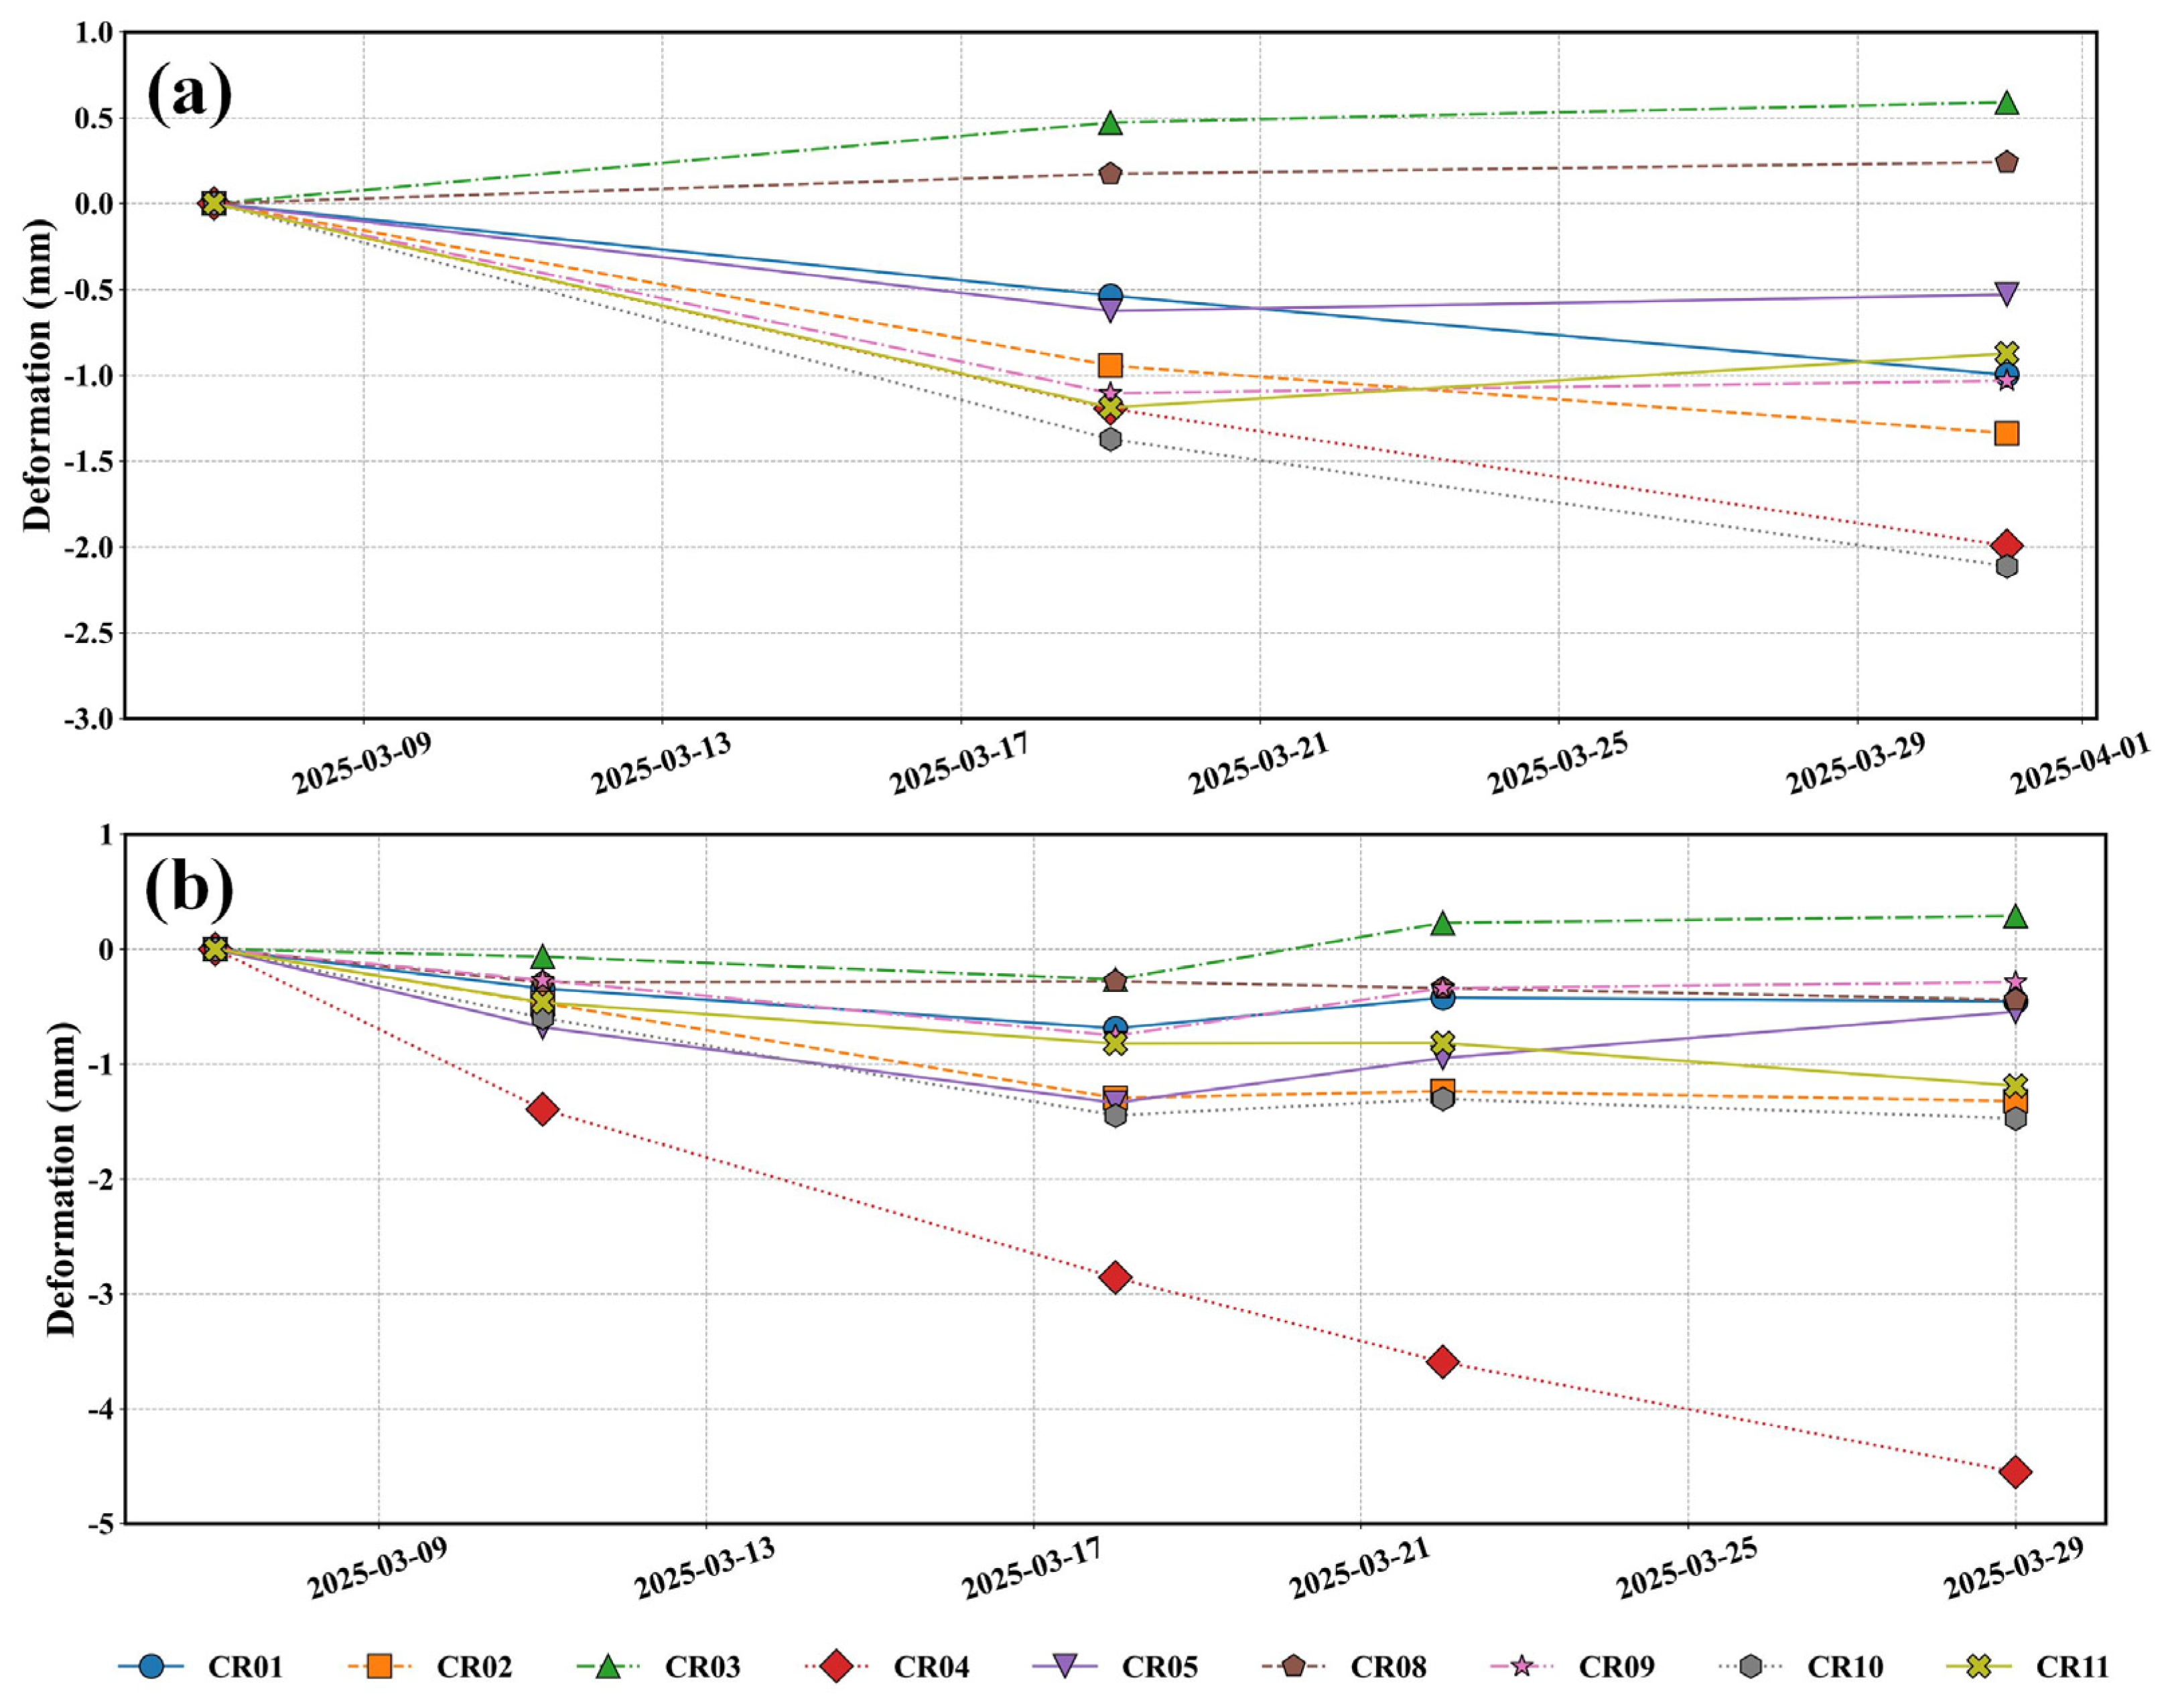
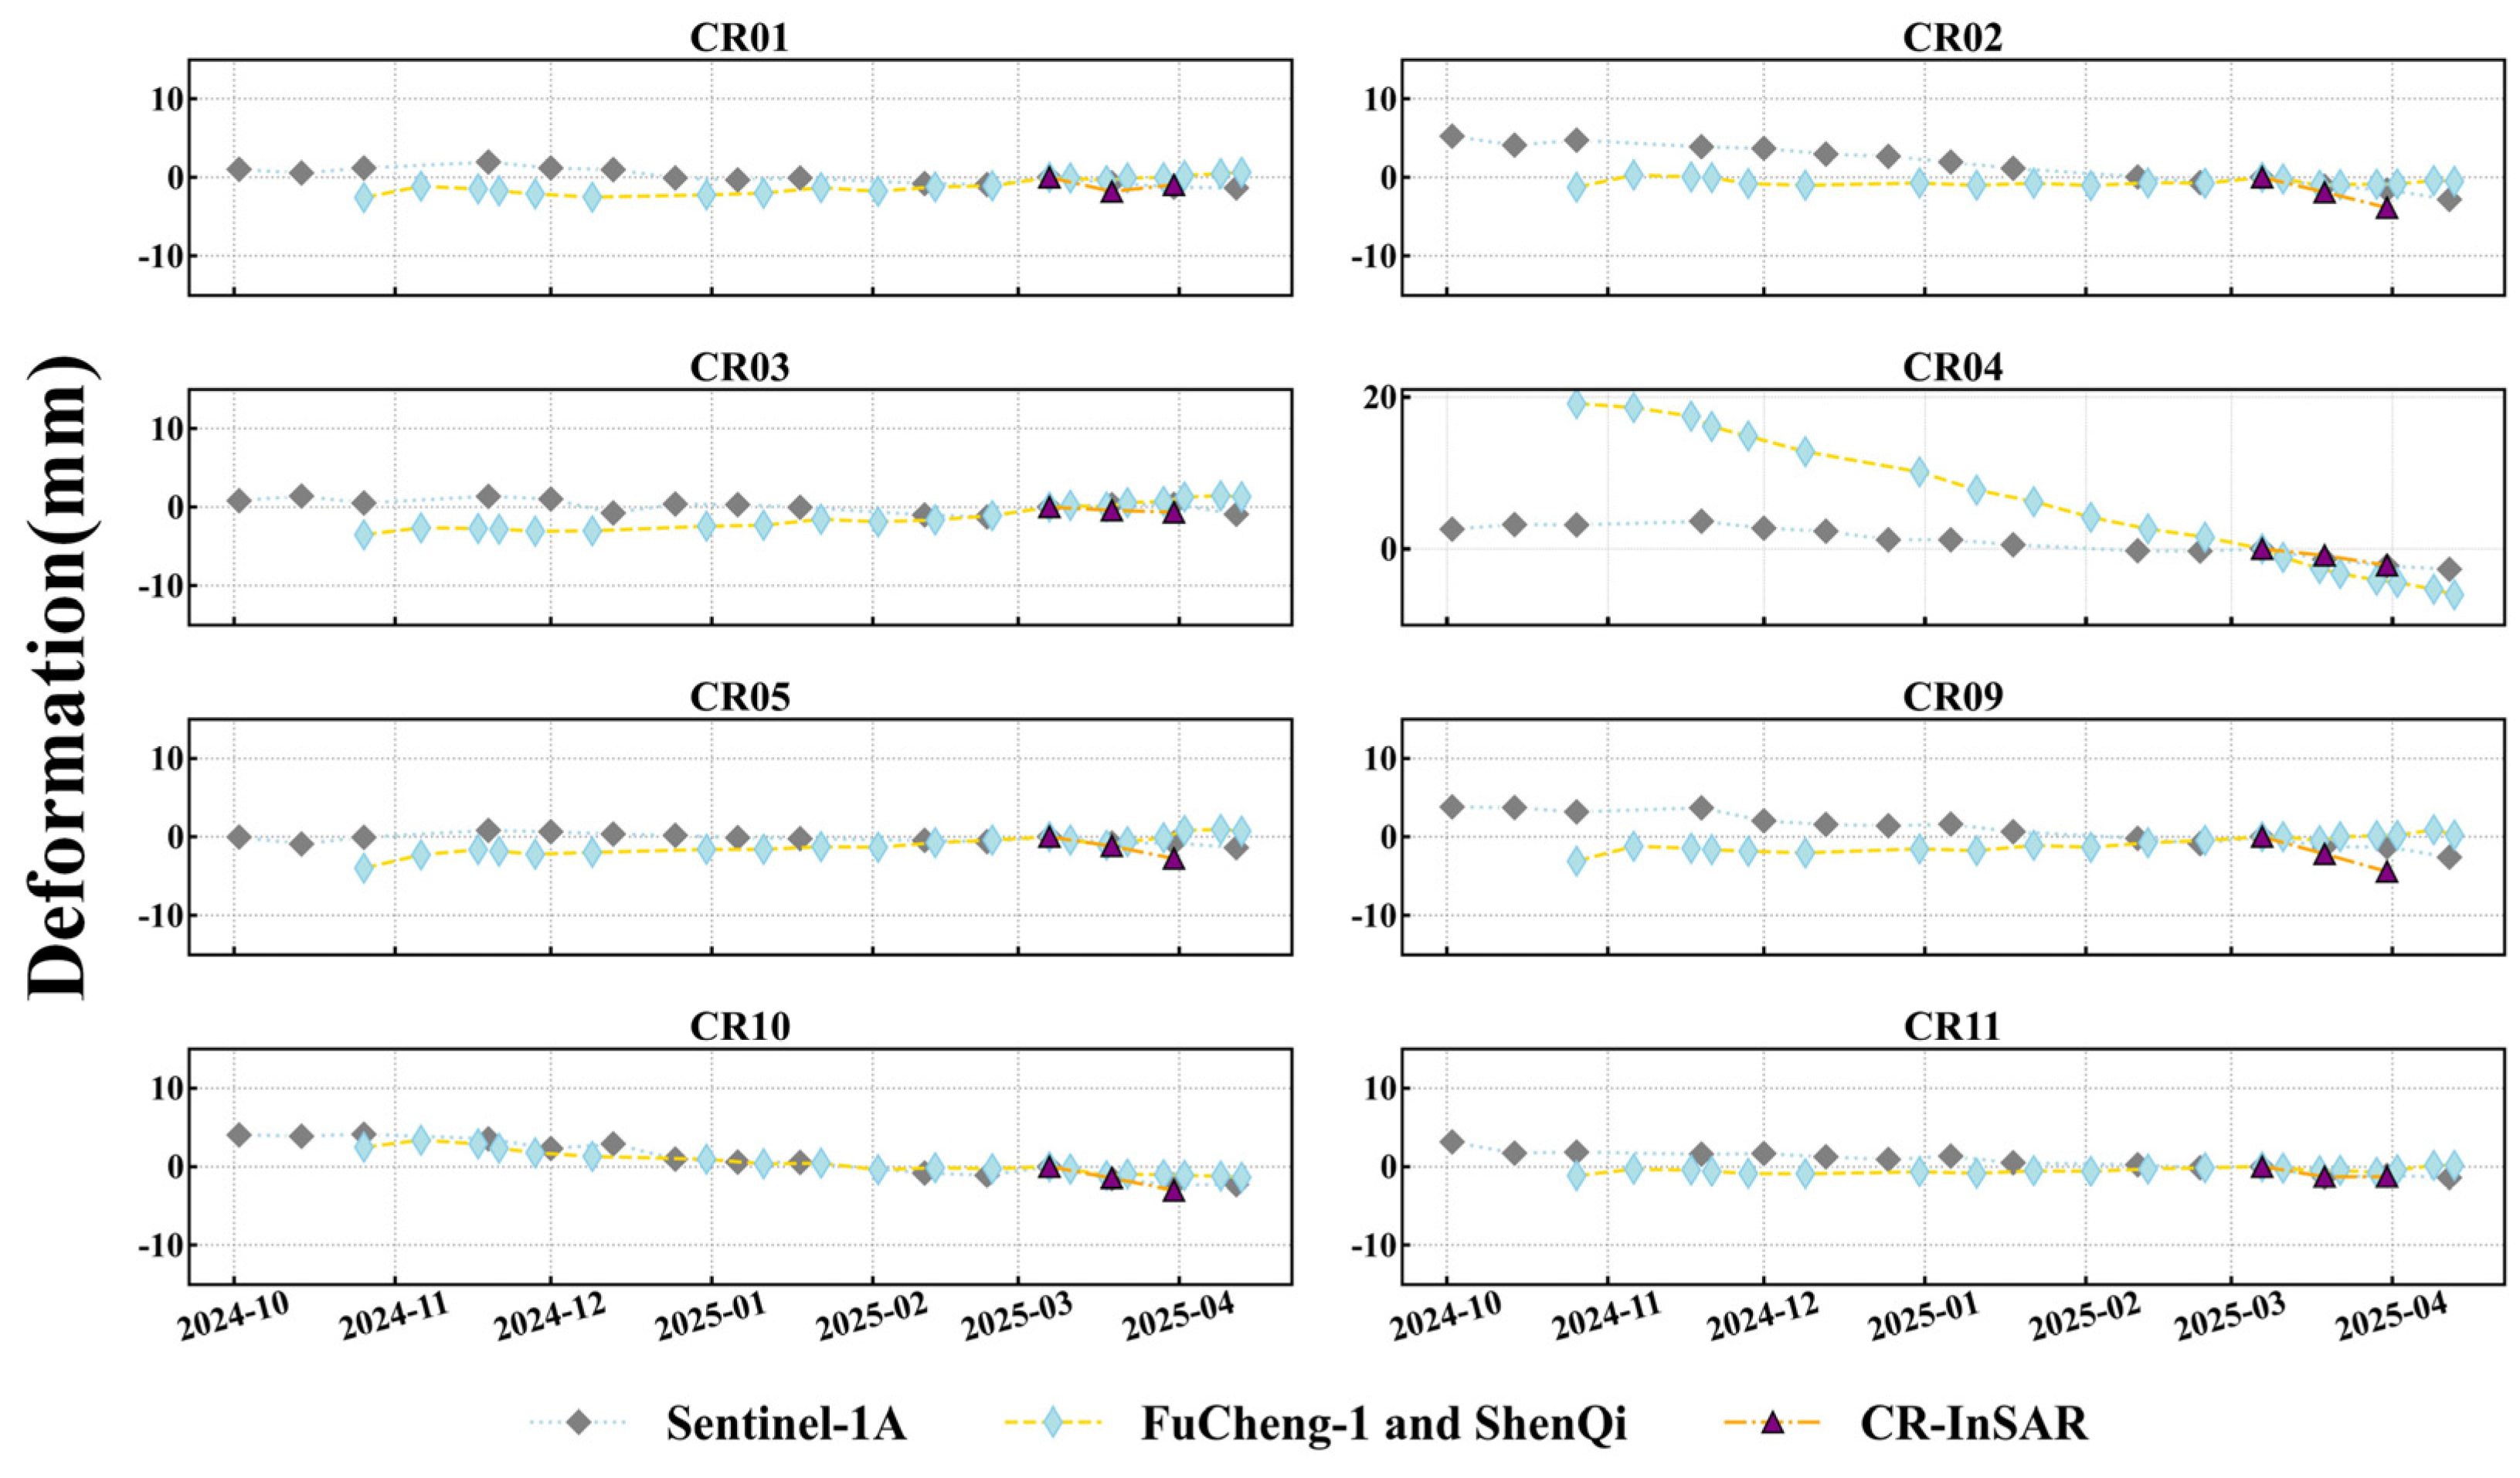
4.3.3. Comparative Analysis of TS-InSAR Results: “Fucheng-1”, “Shenqi”, and Sentinel-1A
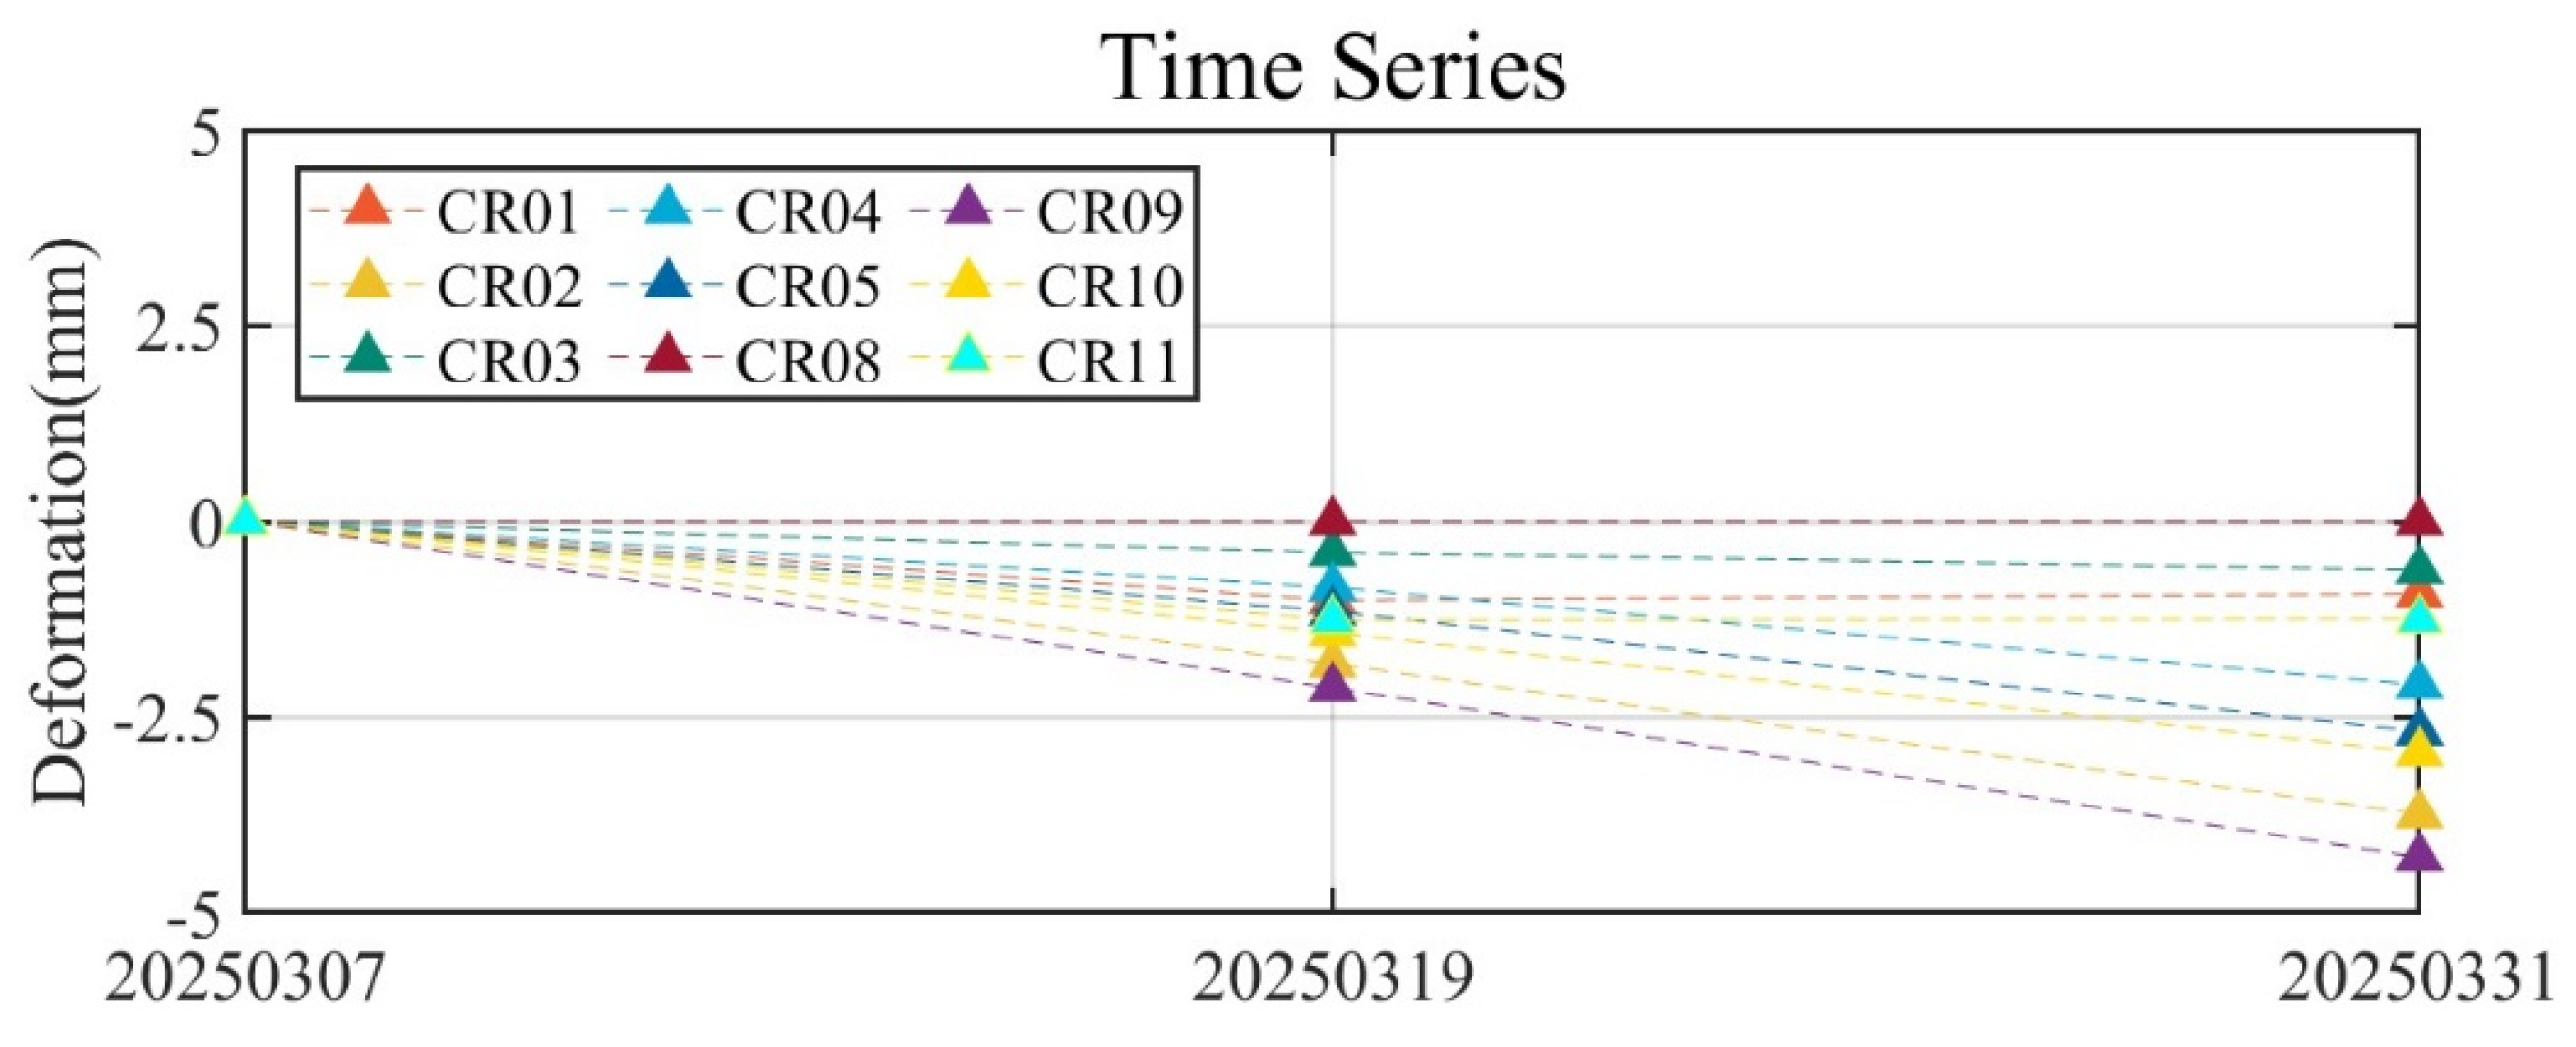
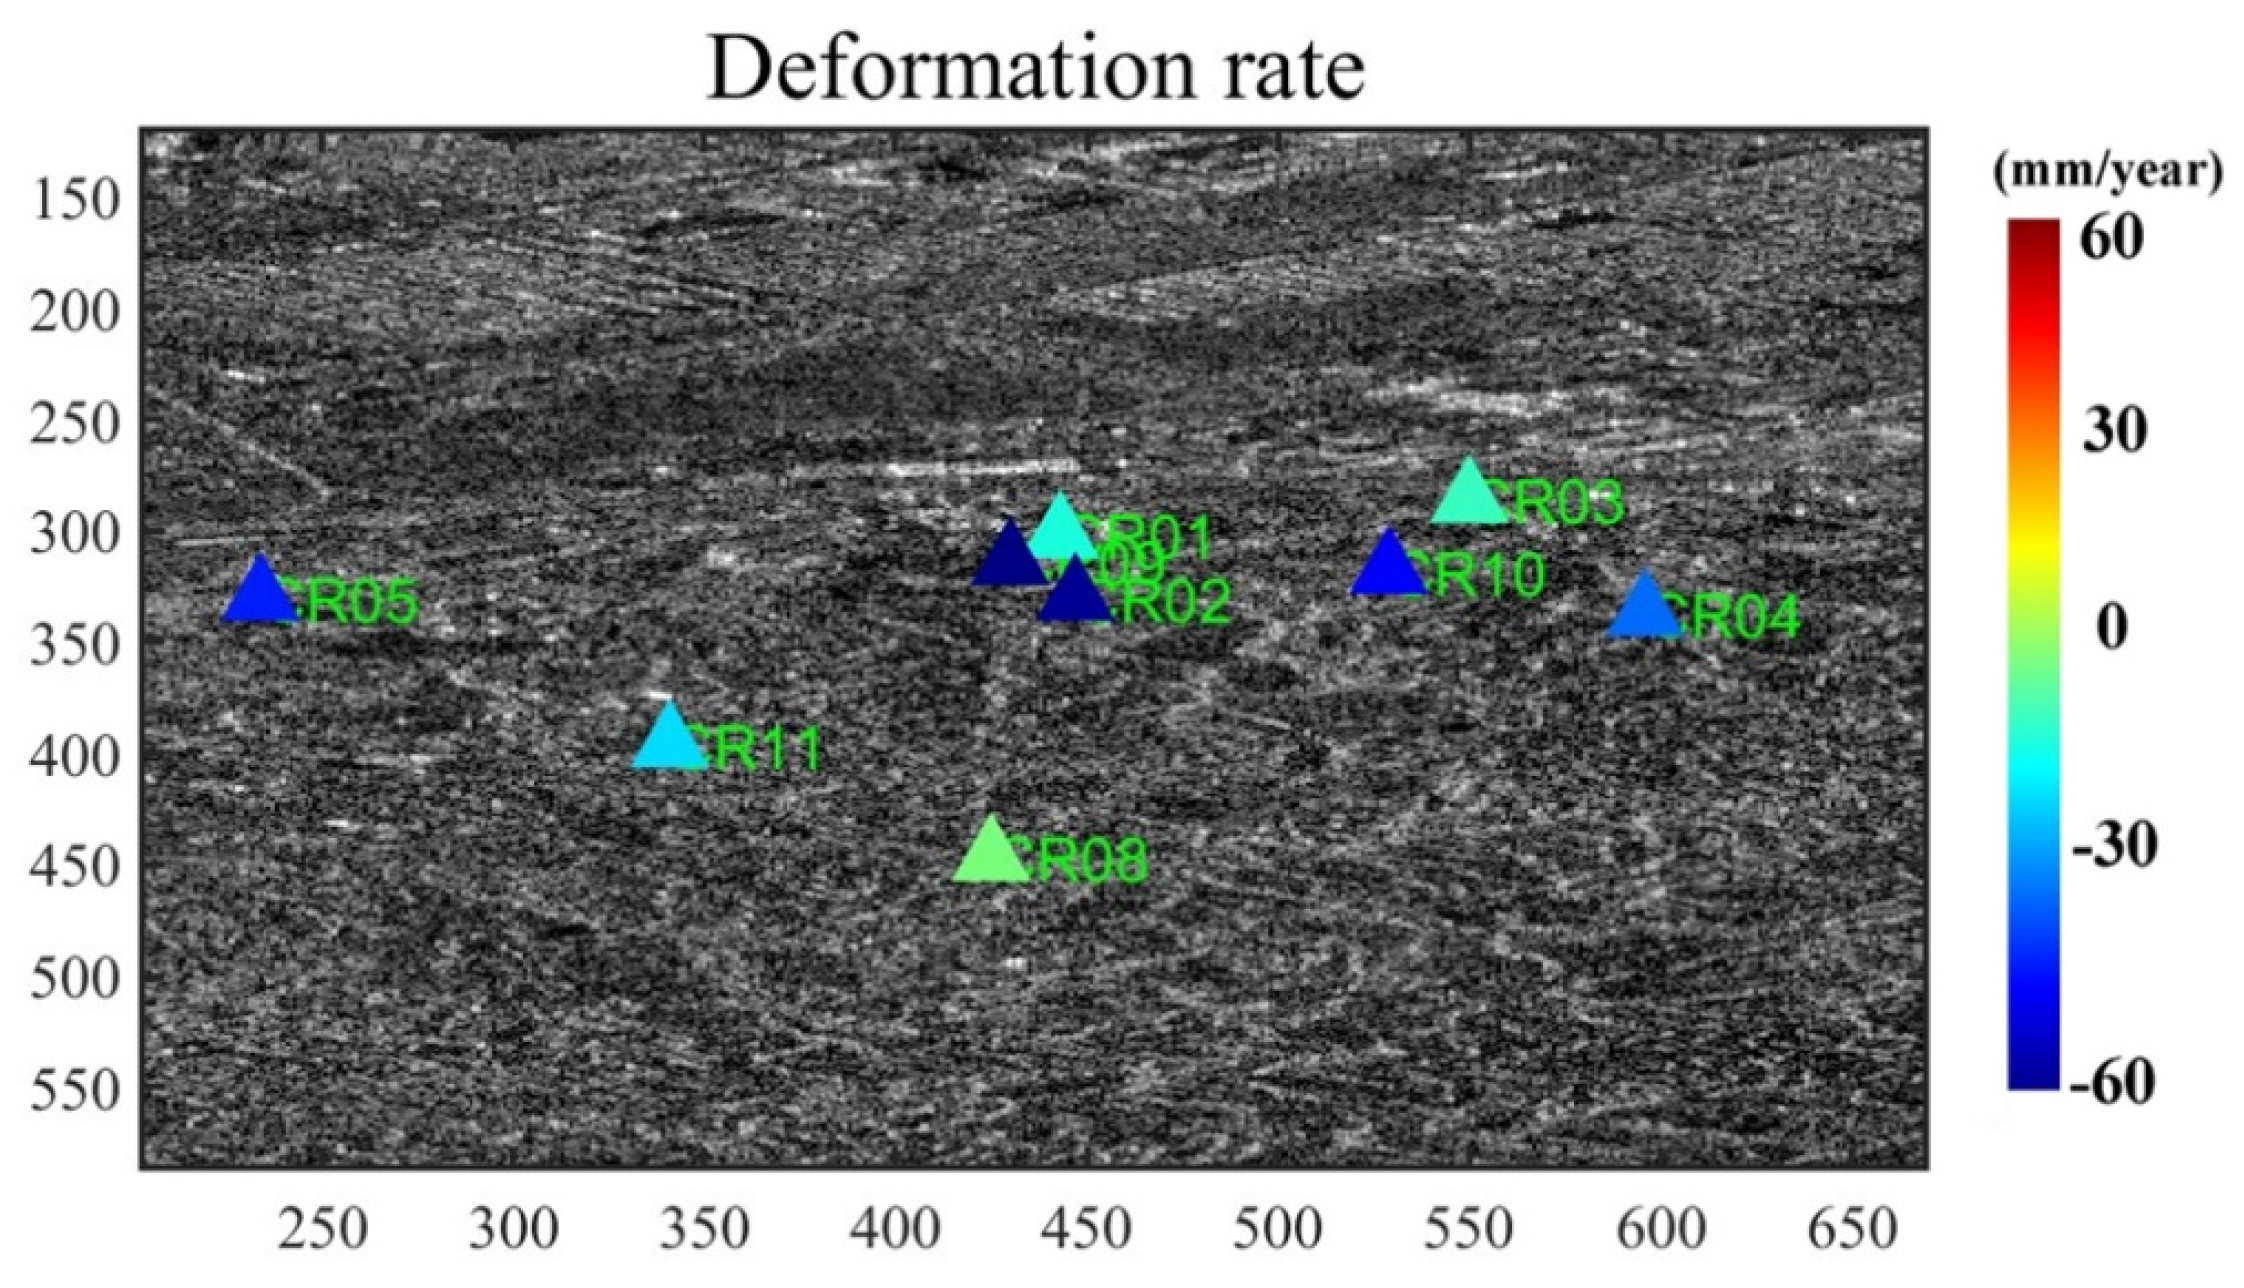
4.4. CR-InSAR Deformation Monitoring Results
5. Conclusions
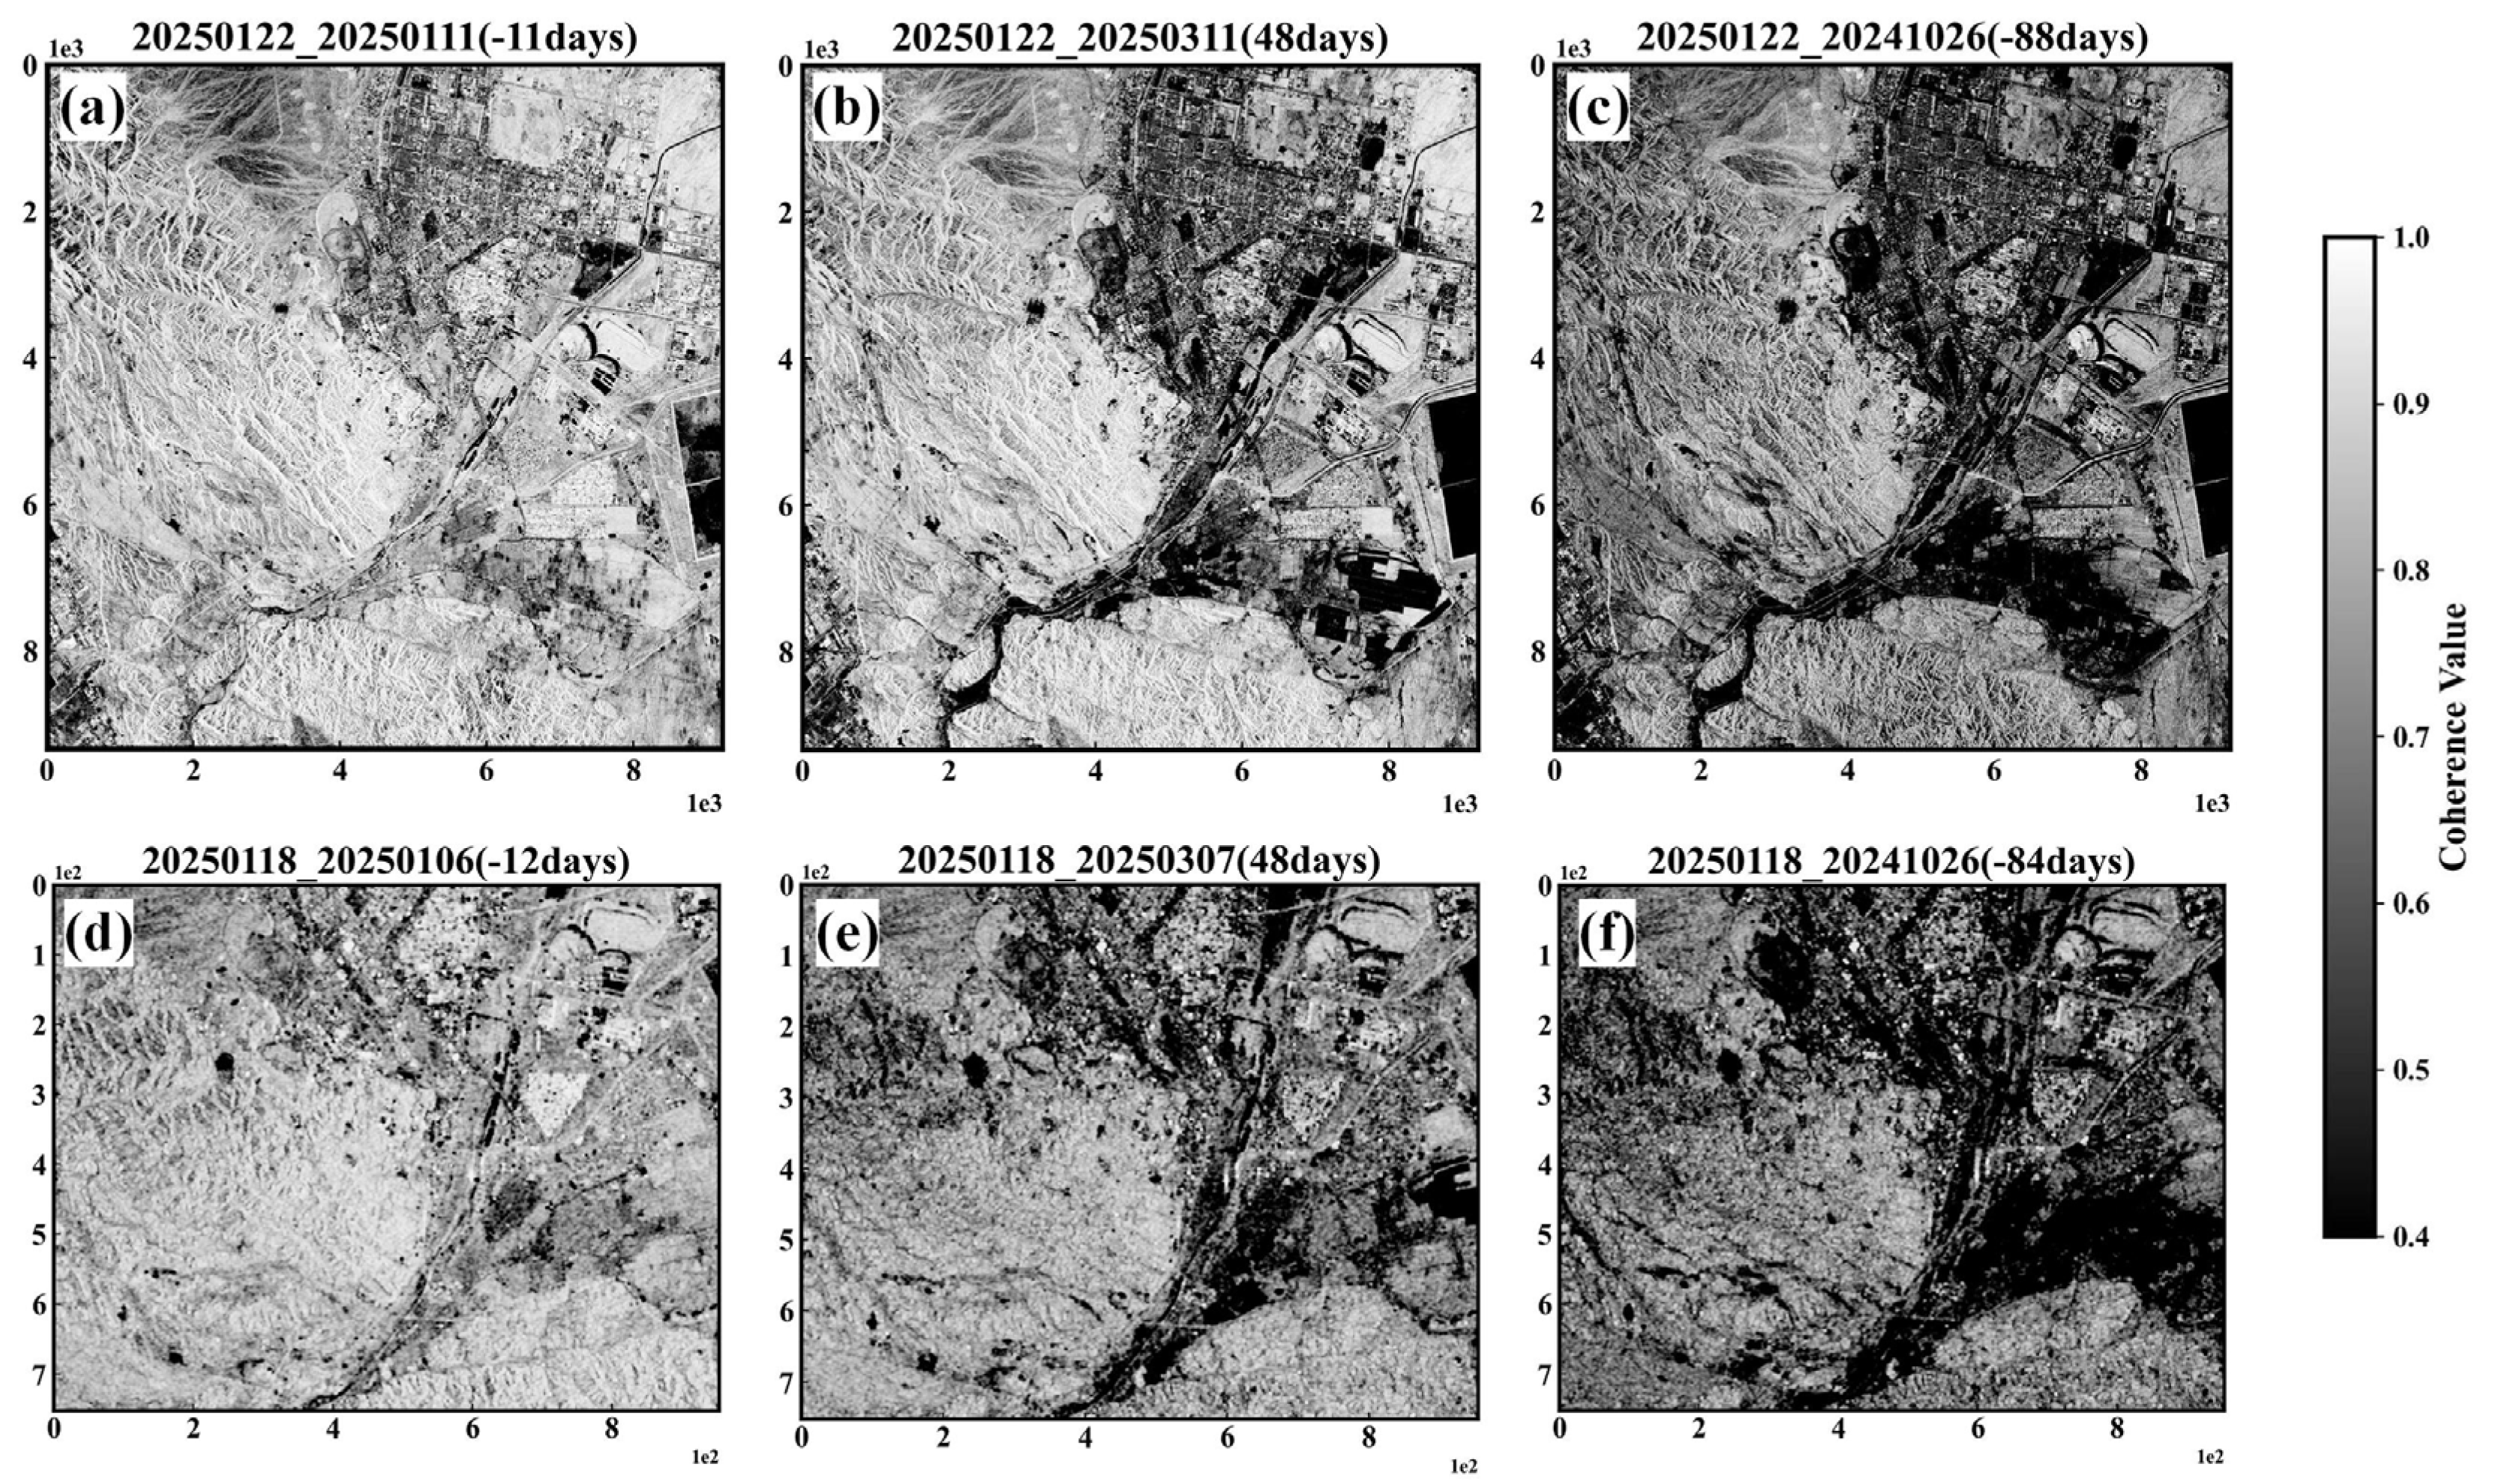
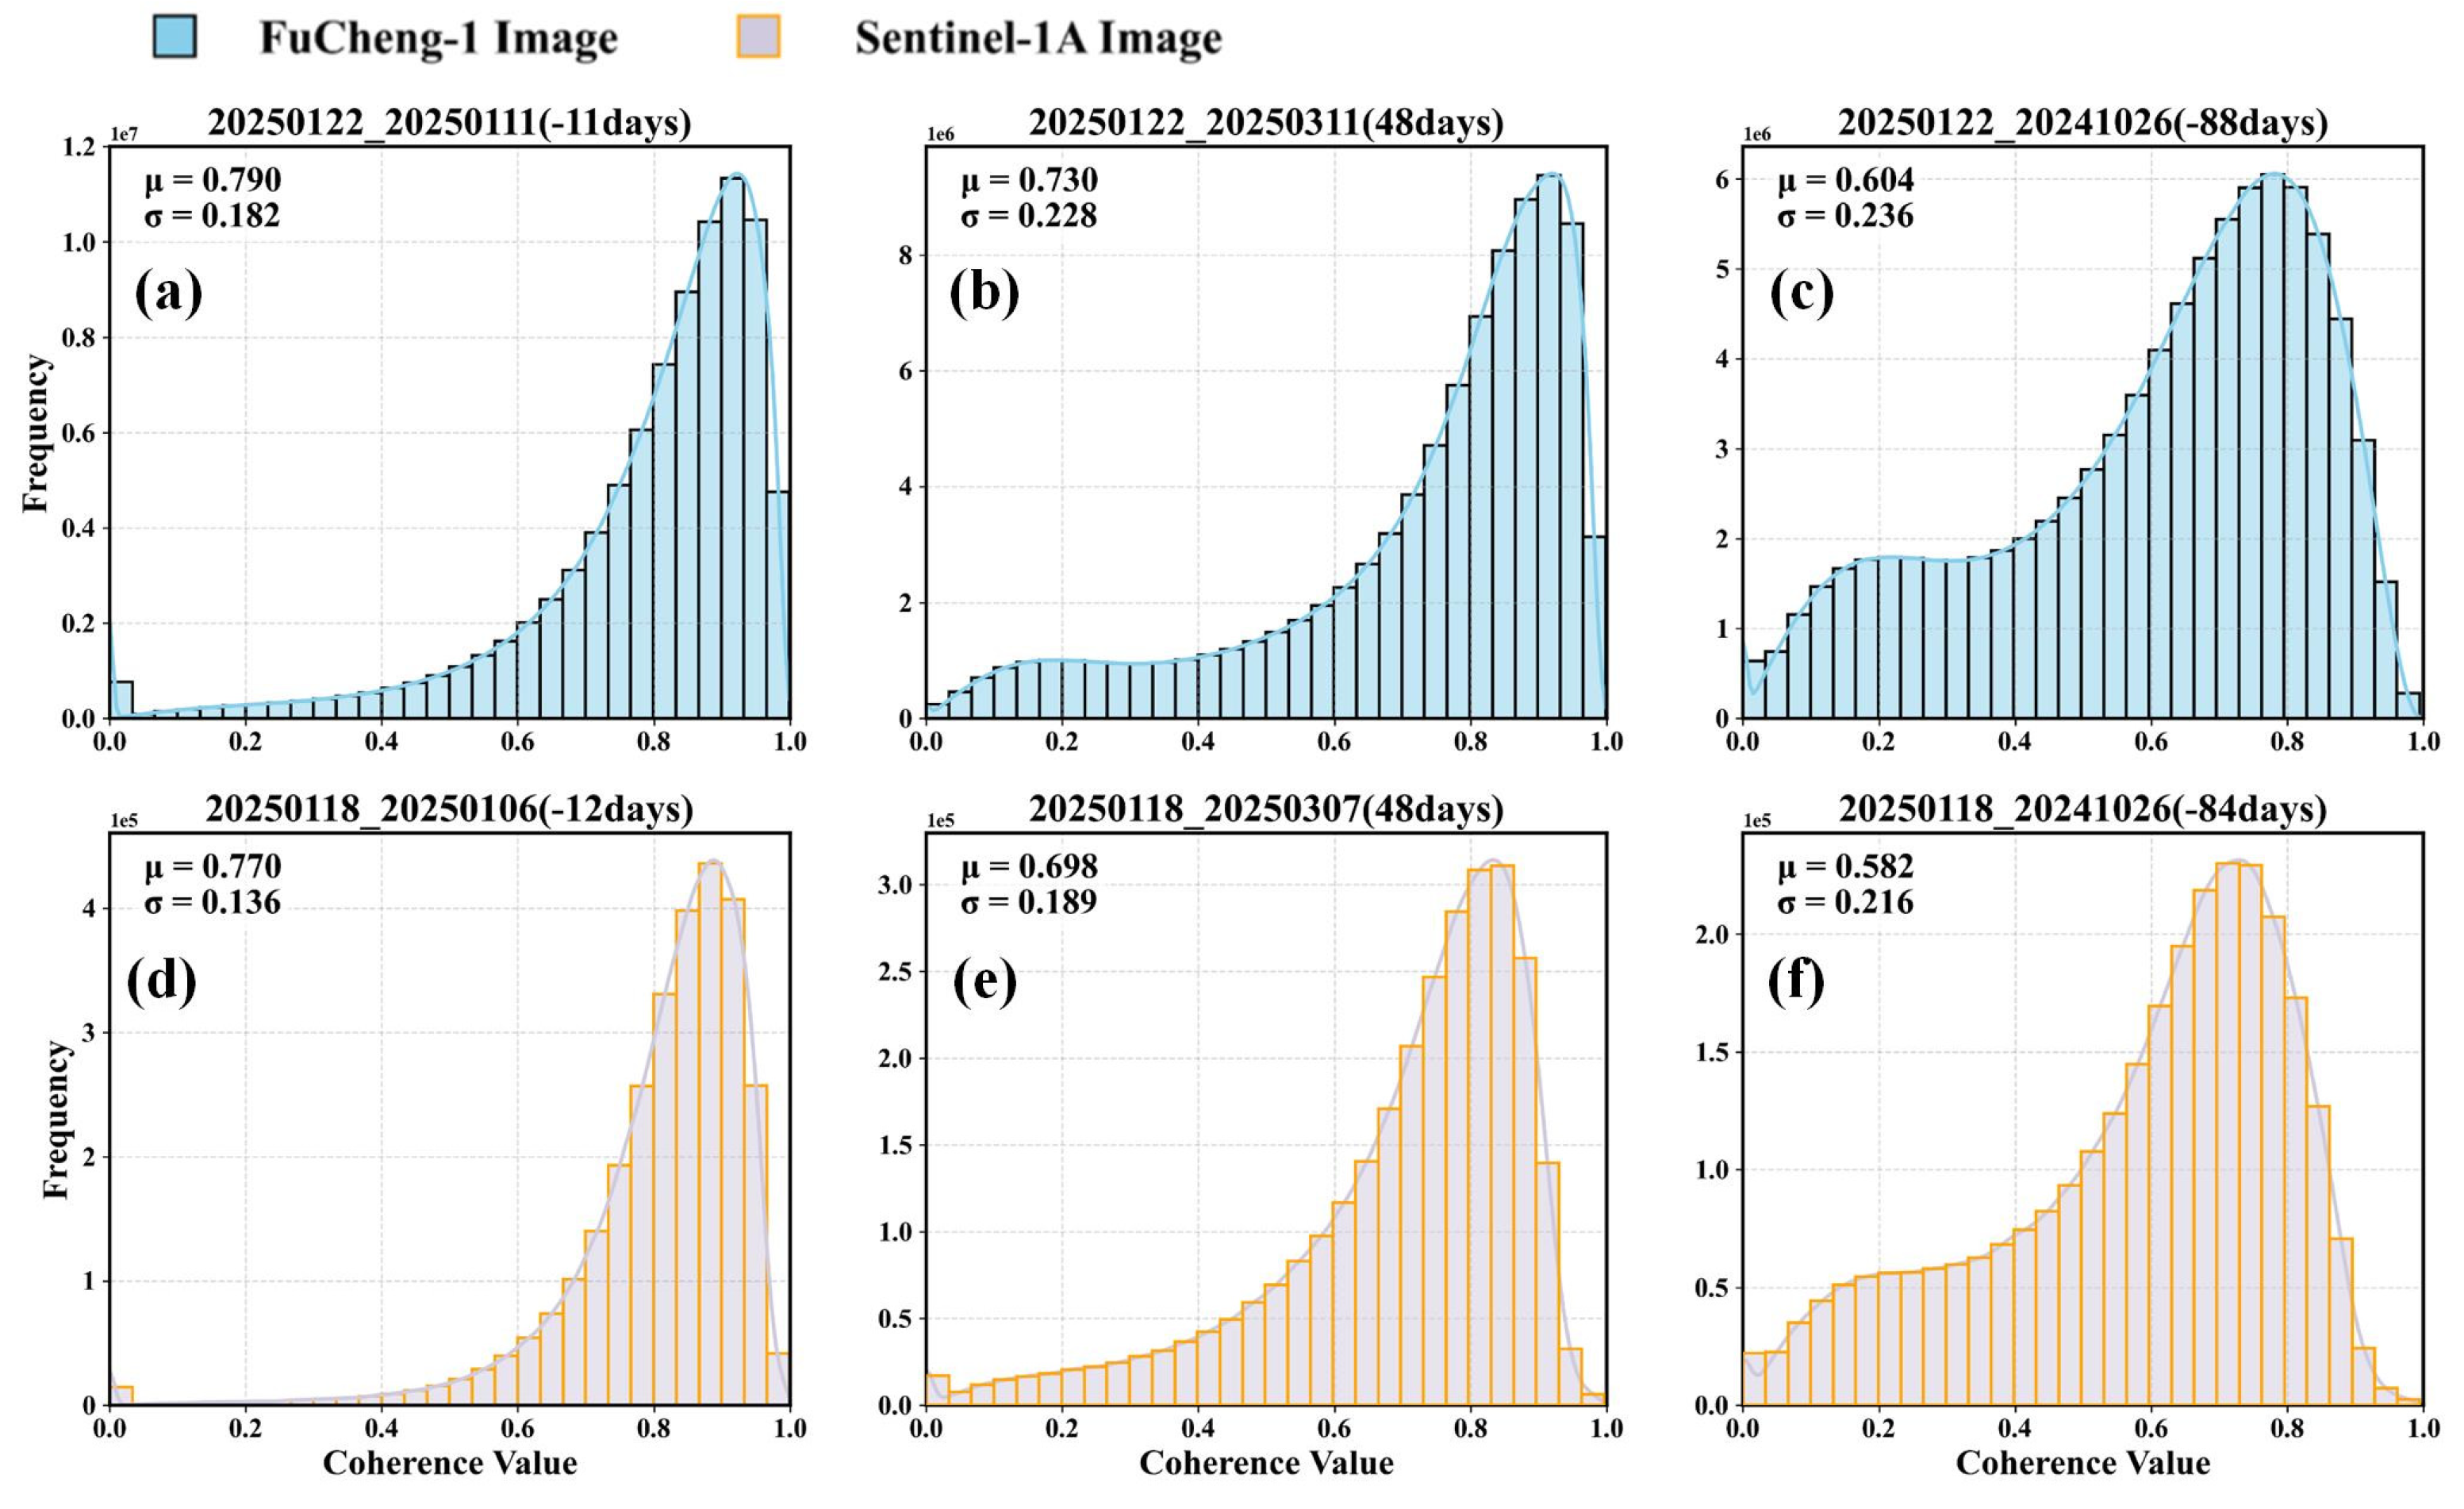
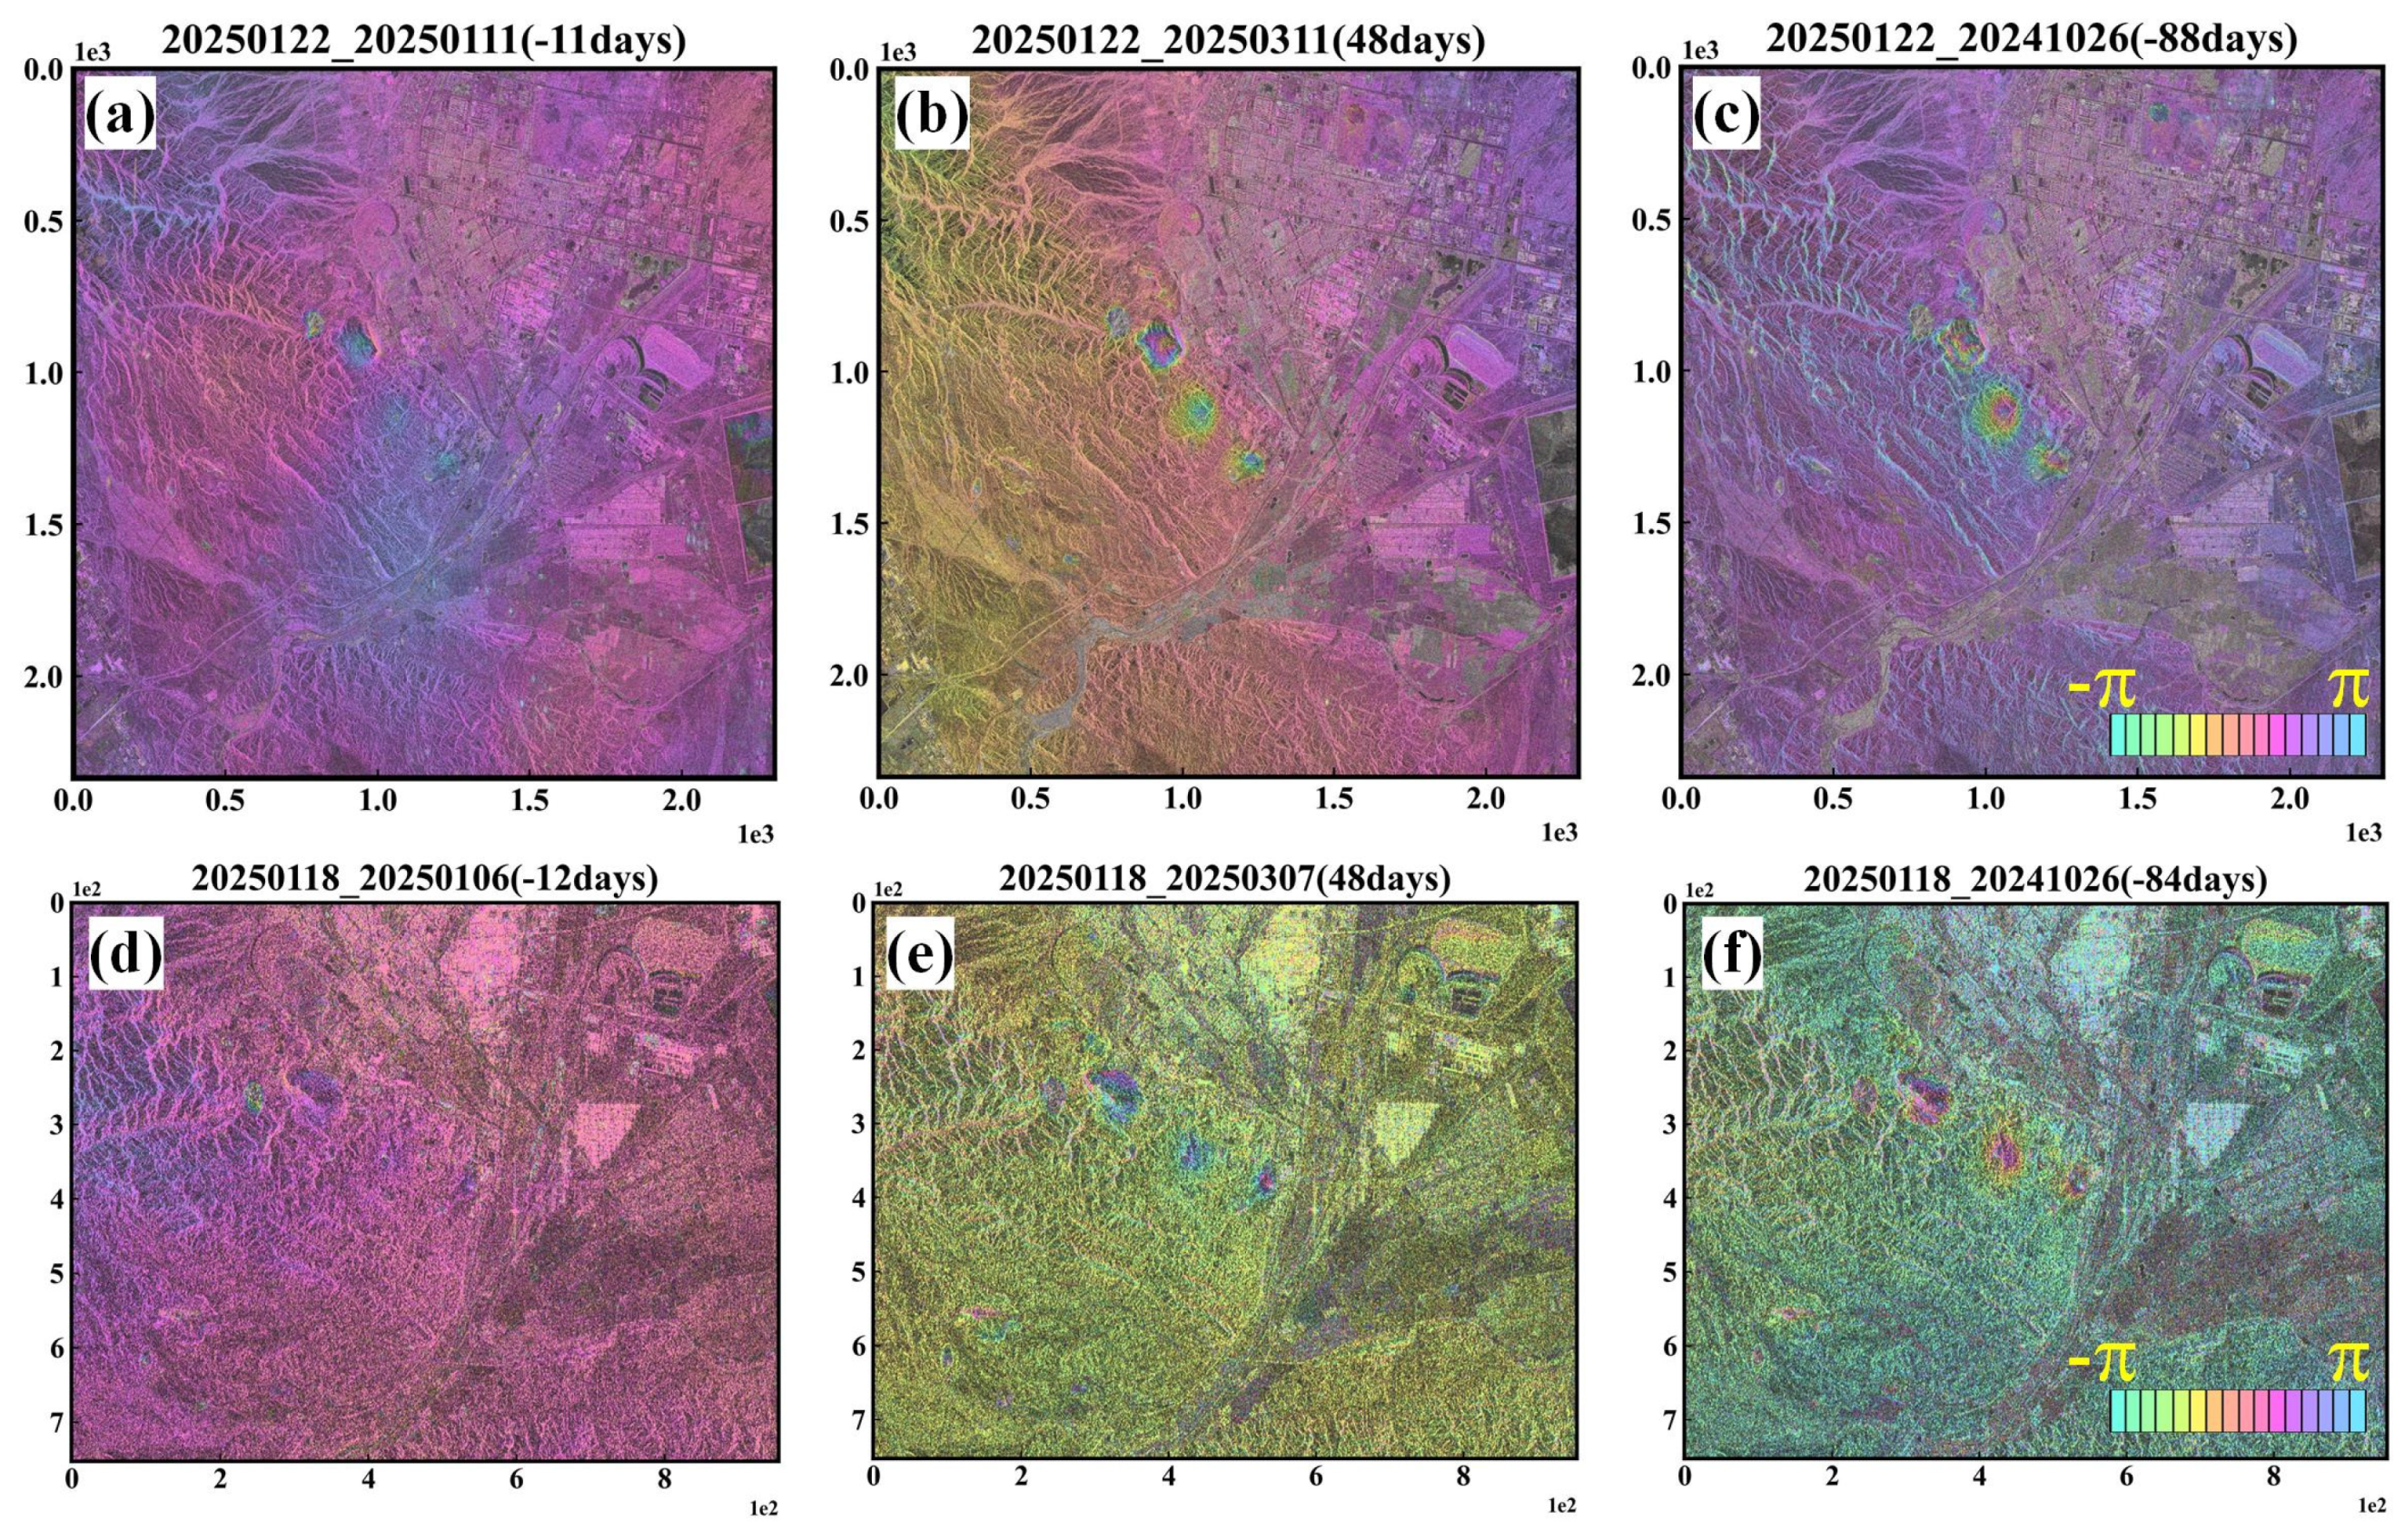
- The “Fucheng-1” and “Shenqi” SAR satellites, with their higher spatial resolution and shorter revisiting period characteristics, maintained a spatial vertical baseline within 70 m in this study. Compared to the Sentinel-1A satellite, the interferometric coherence exhibited similar temporally and spatially distributed characteristics, and the overall interferometric effect showed relatively clear improvements. In terms of time-series processing, the high-resolution characteristics of the dual-star constellation resulted in a denser monitoring point distribution, which stood out against the prominent consistency of the spatial deformation characteristics in the Sentinel-1A results. Overall, the calculation results align with the regional outcomes from Sentinel-1A, with certain mining areas demonstrating a relatively superior performance compared to the results obtained from Sentinel-1A.
- Nine CR points were deployed in the Jinchuan mining area to verify the reliability of the results from “Fucheng-1” and “Shenqi”. A comparison of CR-InSAR results with Sentinel-1A PS-InSAR results showed a relatively high degree of consistency in the monitoring outcomes.
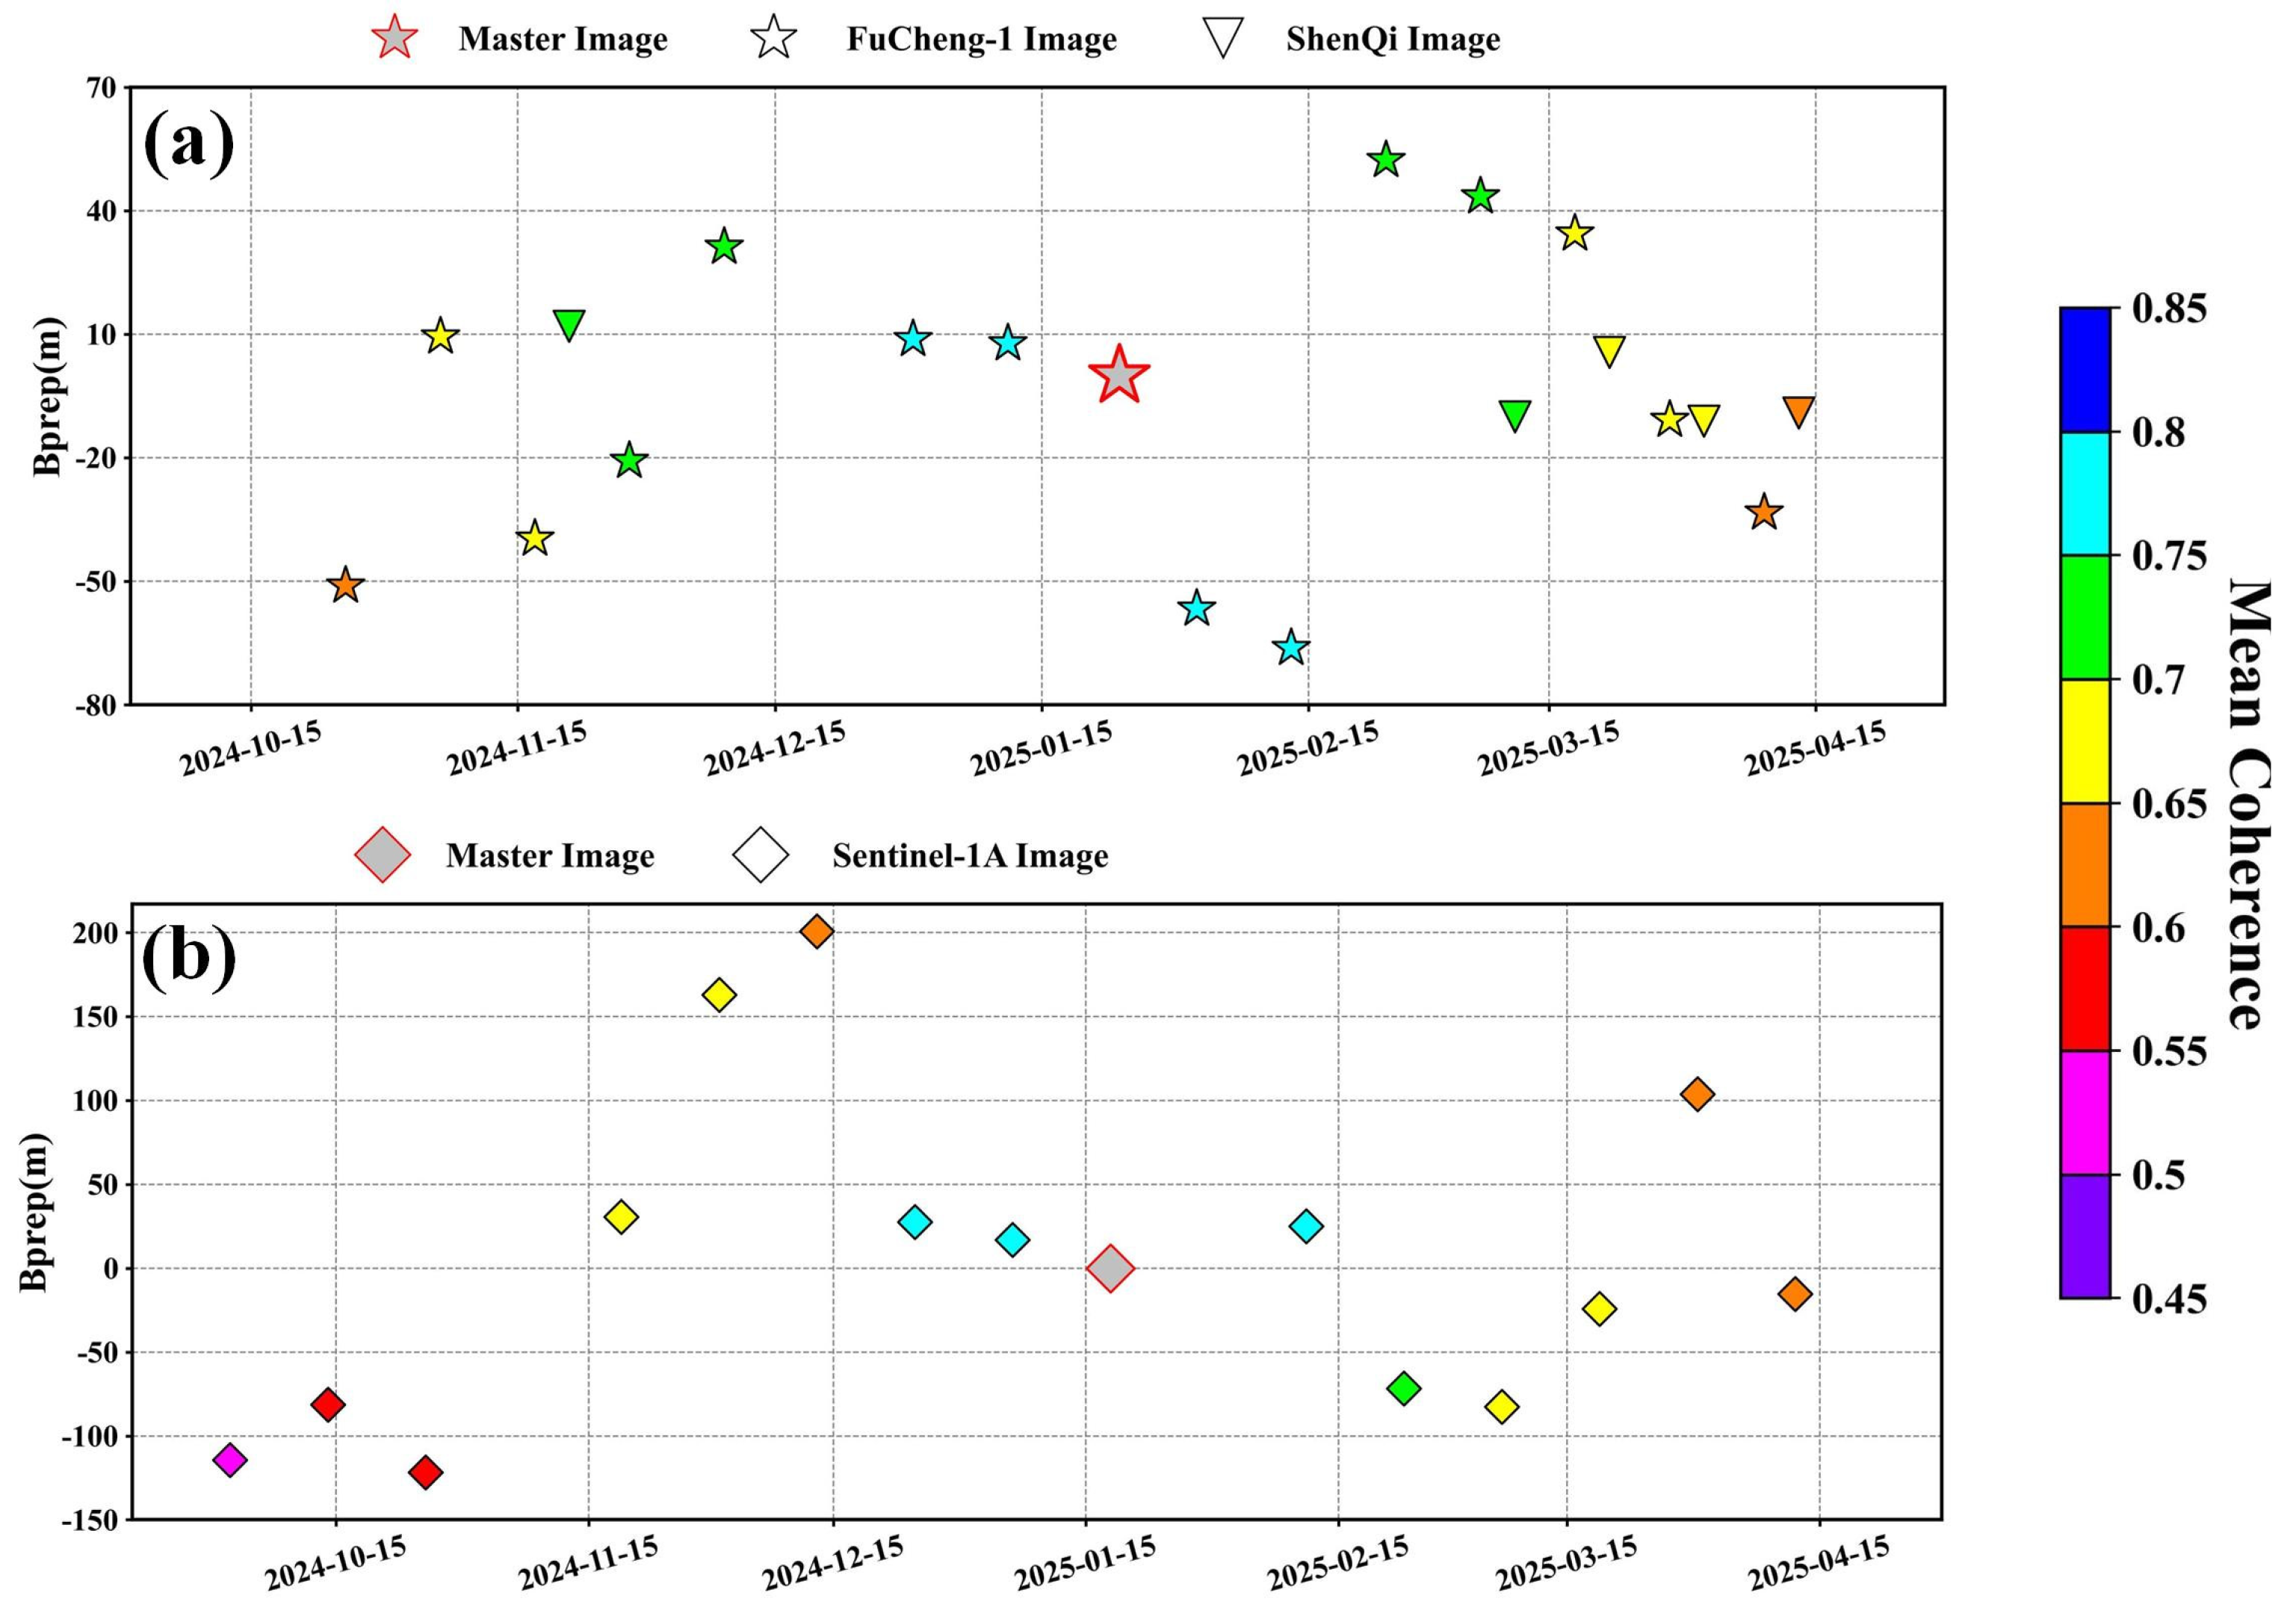
- We used “Fucheng-1” and “Shenqi” images from 21 November 2024, to 13 April 2025. Before 24 February 2025, only one “Shenqi” image was available. Most image revisiting periods were 11 days due to the limited number of “Shenqi” images. This caused decorrelation and unwrapping errors in some areas. To enhance the result accuracy, future work should maintain dual-star imaging and keep the temporal baseline within seven days.
Author Contributions
Funding
Data Availability Statement
Conflicts of Interest
References
- Dai, M.; Li, H.; Long, B.; Wang, X. Quantitative identification of landslide hazard in mountainous open-pit mining areas combined with ascending and descending orbit InSAR technology. Landslides 2024, 21, 2975–2991. [Google Scholar] [CrossRef]
- Abolfazlzadeh, Y.; Hudyma, M. Identifying and Describing a Seismogenic Zone in a Sublevel Caving Mine. Rock Mech. Rock Eng. 2016, 49, 3735–3751. [Google Scholar] [CrossRef]
- Si, G.; Cai, W.; Wang, S.; Li, X. Prediction of Relatively High-Energy Seismic Events Using Spatial–Temporal Parametrisation of Mining-Induced Seismicity. Rock Mech. Rock Eng. 2020, 53, 5111–5132. [Google Scholar] [CrossRef]
- Nishiguchi, T.; Tsuchiya, S.; Imaizumi, F. Detection and accuracy of landslide movement by InSAR analysis using PALSAR-2 data. Landslides 2017, 14, 1483–1490. [Google Scholar] [CrossRef]
- Dai, S.; Zhang, Z.; Li, Z.; Liu, X.; Chen, Q. Prediction of Mining-Induced 3-D Deformation by Integrating Single-Orbit SBAS-InSAR, GNSS, and Log-Logistic Model (LL-SIG). IEEE Trans. Geosci. Remote Sens. 2023, 61, 5222213. [Google Scholar] [CrossRef]
- Ferretti, A.; Prati, C.; Rocca, F. Nonlinear subsidence rate estimation using permanent scatterers in differential SAR interferometry. IEEE Trans. Geosci. Remote Sens. 2000, 38, 2202–2212. [Google Scholar] [CrossRef]
- Ferretti, A.; Prati, C.; Rocca, F. Permanent scatterers in SAR interferometry. IEEE Trans. Geosci. Remote Sens. 2001, 39, 8–20. [Google Scholar] [CrossRef]
- Berardino, P.; Fornaro, G.; Lanari, R.; Sansosti, E. A new algorithm for surface deformation monitoring based on small baseline differential SAR interferograms. IEEE Trans. Geosci. Remote Sens. 2002, 40, 2375–2383. [Google Scholar] [CrossRef]
- Ferretti, A.; Fumagalli, A.; Novali, F.; Prati, C.; Rocca, F.; Rucci, A. A New Algorithm for Processing Interferometric Data-Stacks: SqueeSAR. IEEE Trans. Geosci. Remote Sens. 2011, 49, 3460–3470. [Google Scholar] [CrossRef]
- He, K.; Zou, Y.; Han, Z.; Huang, J. Time-Series InSAR Technology for Monitoring and Analyzing Surface Deformations in Mining Areas Affected by Fault Disturbances. Remote Sens. 2024, 16, 4811. [Google Scholar] [CrossRef]
- Du, Y.; Yan, S.; Yang, H.; Jiang, J.; Zhao, F. Investigation of deformation patterns by DS-InSAR in a coal resource-exhausted region with spaceborne SAR imagery. J. Asian Earth Sci. X 2021, 5, 100049. [Google Scholar] [CrossRef]
- Gao, H.; Luo, L.; Lin, H.; Feng, G.; Wang, L. Observation and evaluation of surface and underground space changes in well salt mining based on InSAR: A case study of Qingjiang salt mine, Zhangshu, China. Int. J. Digit. Earth 2025, 18, 2458683. [Google Scholar] [CrossRef]
- Przyłucka, M.; Herrera, G.; Graniczny, M.; Colombo, D.; Béjar-Pizarro, M. Combination of Conventional and Advanced DInSAR to Monitor Very Fast Mining Subsidence with TerraSAR-X Data: Bytom City (Poland). Remote Sens. 2015, 7, 5300–5328. [Google Scholar] [CrossRef]
- Tang, W.; Motagh, M.; Zhan, W. Monitoring active open-pit mine stability in the Rhenish coalfields of Germany using a coherence-based SBAS method. Int. J. Appl. Earth Obs. Geoinf. 2020, 93, 102217. [Google Scholar] [CrossRef]
- Zhang, Y.; Zhao, C.; Chen, H.; Feng, X.; Lu, Z.; Khan, B.A. Detection and monitoring of mining-induced subsidence with Gaofen-3 and Sentinel-1A SAR datasets. Remote Sens. Lett. 2024, 15, 537–547. [Google Scholar] [CrossRef]
- Li, Z.; Zhu, W.; Yu, C.; Zhang, Q.; Zhang, C.; Liu, Z.; Zhang, X.; Chen, B.; Du, J.; Song, C.; et al. Interferometric synthetic aperture radar for deformation mapping: Opportunities, challenges and the outlook. Acta Geod. Et Cartogr. Sin. 2022, 51, 1485–1519. [Google Scholar]
- Han, Y.; Dai, K.; Deng, J.; Wen, N.; Ren, W.; Chen, X.; Du, J.; Wang, H. Fucheng-1, high-resolution Chinese interferometric SAR: First DInSAR result for landslides monitoring. Measurement 2025, 247, 116876. [Google Scholar] [CrossRef]
- Serrano, M.M.; Shurmer, I.; Marc, X. Sentinel-1: Operational approach to the orbit control strategy. In Proceedings of the 23d International Symposium on Space Flight Dynamics, Pasadena, CA, USA, 29 October–2 November 2012. [Google Scholar]
- Kampes, B.M.; Hanssen, R.F.; Perski, Z. Radar interferometry with public domain tools. In Proceedings of the FRINGE 2003 workshop, Frascati, Italy, 1–5 December 2004; p. 10. [Google Scholar]
- Kampes, B.; Usai, S. Doris: The delft object-oriented radar interferometric software. In Proceedings of the 2nd International Symposium on Operationalization of Remote Sensing, Enschede, The Netherlands, 16–20 August 1999; p. 20. [Google Scholar]
- Hooper, A.; Zebker, H.; Segall, P.; Kampes, B. A new method for measuring deformation on volcanoes and other natural terrains using InSAR persistent scatterers. Geophys. Res. Lett. 2004, 31, 1–5. [Google Scholar] [CrossRef]
- Huang, L.; Zhu, P.; Zhang, T.; He, L.; Wu, W.; Ge, Z.; Ai, H. Investigation of land subsidence in Guangdong Province, China, using PS-InSAR technique. Adv. Space Res. 2025, 75, 3507–3520. [Google Scholar] [CrossRef]
- Liu, Y.; Yang, H.; Wang, S.; Xu, L.; Peng, J. Monitoring and Stability Analysis of the Deformation in the Woda Landslide Area in Tibet, China by the DS-InSAR Method. Remote Sens. 2022, 14, 532. [Google Scholar] [CrossRef]
- Li, Y.; Zuo, X.; Zhu, D.; Wu, W.; Yang, X.; Guo, S.; Shi, C.; Huang, C.; Li, F.; Liu, X. Identification and Analysis of Landslides in the Ahai Reservoir Area of the Jinsha River Basin Using a Combination of DS-InSAR, Optical Images, and Field Surveys. Remote Sens. 2022, 14, 6274. [Google Scholar] [CrossRef]
- Wang, M.; Tao, L.; Jiang, L.; Xu, K.; Wu, W. An Improved Coherent Targets Technology for Monitoring Surface Deformation. Acta Geod. Cartogr. Sin. 2016, 45, 36–43. [Google Scholar]
- Du, Y.; Yan, S.; Zhao, F.; Chen, D.; Zhang, H. DS-InSAR Based Long-Term Deformation Pattern Analysis in the Mining Region With an Improved Phase Optimization Algorithm. Front. Environ. Sci. 2022, 10, 799946. [Google Scholar] [CrossRef]
- Cloude, S.R.; Pottier, E. An entropy based classification scheme for land applications of polarimetric SAR. IEEE Trans. Geosci. Remote Sens. 1997, 35, 68–78. [Google Scholar] [CrossRef]
- Hooper, A.; Spaans, K.; Bekaert, D.; Cuenca, M.C.; Arıkan, M.; Oyen, A. StaMPS/MTI manual. Delft Inst. Earth Obs. Space Syst. Delft Univ. Technol. Kluyverweg 2010, 1, 2629. [Google Scholar]
- Zhao, H.; Ma, F.; Zhang, Y.; Guo, J. Monitoring and mechanisms of ground deformation and ground fissures induced by cut-and-fill mining in the Jinchuan Mine 2, China. Environ. Earth Sci. 2013, 68, 1903–1911. [Google Scholar] [CrossRef]
- Li, X.; Wang, S.J.; Liu, T.Y.; Ma, F.S. Engineering geology, ground surface movement and fissures induced by underground mining in the Jinchuan Nickel Mine. Eng. Geol. 2004, 76, 93–107. [Google Scholar] [CrossRef]
- Zhou, W.; Zhang, W.; Yang, X.; Wu, W. An Improved GNSS and InSAR Fusion Method for Monitoring the 3D Deformation of a Mining Area. IEEE Access 2021, 9, 155839–155850. [Google Scholar] [CrossRef]
- Li, Z.; Zou, W.; Ding, X.; Chen, Y.; Liu, G. A quantitative measure for the quality of InSAR interferograms based on phase differences. Photogramm. Eng. Remote Sens. 2004, 70, 1131–1137. [Google Scholar] [CrossRef]
- Gens, R. Two-dimensional phase unwrapping for radar interferometry: Developments and new challenges. Int. J. Remote Sens. 2003, 24, 703–710. [Google Scholar] [CrossRef]
- Yi, C.; Sjöberg, J.; Johansson, D. Numerical modelling for blast-induced fragmentation in sublevel caving mines. Tunn. Undergr. Space Technol. 2017, 68, 167–173. [Google Scholar] [CrossRef]
- Sheshpari, M. A review of underground mine backfilling methods with emphasis on cemented paste backfill. Electron. J. Geotech. Eng. 2015, 20, 5183–5208. [Google Scholar]
- Zhu, W.; Xu, J.; Xu, J.; Chen, D.; Shi, J. Pier-column backfill mining technology for controlling surface subsidence. Int. J. Rock Mech. Min. Sci. 2017, 96, 58–65. [Google Scholar] [CrossRef]
- Dheenathayalan, P.; Cuenca, M.C.; Hoogeboom, P.; Hanssen, R.F. Small Reflectors for Ground Motion Monitoring With InSAR. IEEE Trans. Geosci. Remote Sens. 2017, 55, 6703–6712. [Google Scholar] [CrossRef]
- Czikhardt, R.; van der Marel, H.; Papco, J. GECORIS: An Open-Source Toolbox for Analyzing Time Series of Corner Reflectors in InSAR Geodesy. Remote Sens. 2021, 13, 926. [Google Scholar] [CrossRef]

| Parameter | Value |
|---|---|
| Max_topo_err | 35 |
| Unwrap_grid_size | 100 |
| Weed_max_noise | 0.4 |
| Weed_standard_dev | 1 |
| Density_rand | 20 |
| Coherence threshold | 0.7 |
| Satellite Name | Band | Acquisition Mode | Orbit/View Angle | Pixel Spacing (m) | Incidence Angle (°) | Heading Angle (°) | Time Span |
|---|---|---|---|---|---|---|---|
| Shenqi | C | Strip | Ascending/right | 1.3/1.8 | 38.18 | 12.30 | 20241121–20250413 (Total: 5 scenes) |
| Fucheng | C | Strip | Ascending/right | 1.3/1.8 | 38.18 | 12.30 | 20241026–20250409 (Total: 15 scenes) |
| Sentinel-1A | C | IW | Descending/right | 2.3/14.0 | 30.6 | 193.37 | TS-InSAR: 20241002–20250412 (Total: 15 scenes) |
| CR-InSAR: 20240223–20250331 (Total: 4 scenes) |
| ID | Height (m) | Mode | ||
|---|---|---|---|---|
| CR1 | 38.482 | 102.171 | 1558.54 | Descending |
| CR2 | 38.479 | 102.170 | 1563.60 | |
| CR3 | 38.485 | 102.166 | 1559.92 | |
| CR4 | 38.479 | 102.162 | 1616.83 | |
| CR5 | 38.477 | 102.179 | 1629.61 | |
| CR8 | 38.464 | 102.166 | 1651.77 | |
| CR9 | 38.481 | 102.171 | 1551.08 | |
| CR10 | 38.481 | 102.166 | 1594.23 | |
| CR11 | 38.470 | 102.172 | 1608.33 |
| ID | ||
|---|---|---|
| G1 | −52.45 | −83.00 |
| G2 | −65.32 | −115.28 |
| G3 | −30.81 | −62.84 |
| G4 | −18.31 | −37.70 |
| G5 | −13.29 | −24.22 |
| ID | ||
|---|---|---|
| CR01 | −0.92 | −14.04 |
| CR02 | −3.74 | −56.91 |
| CR03 | −0.62 | −9.44 |
| CR04 | −2.09 | −31.77 |
| CR05 | −2.68 | −40.82 |
| CR08 | 0.0 | 0.0 |
| CR09 | −4.29 | −65.27 |
| CR10 | −2.95 | −44.89 |
| CR11 | −1.25 | −19.00 |
Disclaimer/Publisher’s Note: The statements, opinions and data contained in all publications are solely those of the individual author(s) and contributor(s) and not of MDPI and/or the editor(s). MDPI and/or the editor(s) disclaim responsibility for any injury to people or property resulting from any ideas, methods, instructions or products referred to in the content. |
© 2025 by the authors. Licensee MDPI, Basel, Switzerland. This article is an open access article distributed under the terms and conditions of the Creative Commons Attribution (CC BY) license (https://creativecommons.org/licenses/by/4.0/).
Share and Cite
Ge, Z.; Wu, W.; Hu, J.; Muhetaer, N.; Zhu, P.; Guo, J.; Li, Z.; Zhang, G.; Bai, Y.; Ren, W. Evaluating the Interferometric Performance of China’s Dual-Star SAR Satellite Constellation in Large Deformation Scenarios: A Case Study in the Jinchuan Mining Area, Gansu. Remote Sens. 2025, 17, 2451. https://doi.org/10.3390/rs17142451
Ge Z, Wu W, Hu J, Muhetaer N, Zhu P, Guo J, Li Z, Zhang G, Bai Y, Ren W. Evaluating the Interferometric Performance of China’s Dual-Star SAR Satellite Constellation in Large Deformation Scenarios: A Case Study in the Jinchuan Mining Area, Gansu. Remote Sensing. 2025; 17(14):2451. https://doi.org/10.3390/rs17142451
Chicago/Turabian StyleGe, Zixuan, Wenhao Wu, Jiyuan Hu, Nijiati Muhetaer, Peijie Zhu, Jie Guo, Zhihui Li, Gonghai Zhang, Yuxing Bai, and Weijia Ren. 2025. "Evaluating the Interferometric Performance of China’s Dual-Star SAR Satellite Constellation in Large Deformation Scenarios: A Case Study in the Jinchuan Mining Area, Gansu" Remote Sensing 17, no. 14: 2451. https://doi.org/10.3390/rs17142451
APA StyleGe, Z., Wu, W., Hu, J., Muhetaer, N., Zhu, P., Guo, J., Li, Z., Zhang, G., Bai, Y., & Ren, W. (2025). Evaluating the Interferometric Performance of China’s Dual-Star SAR Satellite Constellation in Large Deformation Scenarios: A Case Study in the Jinchuan Mining Area, Gansu. Remote Sensing, 17(14), 2451. https://doi.org/10.3390/rs17142451