Article

Vegetation Baseline and Urbanization Development Level: Key Determinants of Long-Term Vegetation Greening in China’s Rapidly Urbanizing Region

1
Global Institute for Urban and Regional Sustainability, Zhejiang Zhoushan Island Ecosystem Observation and Research Station, School of Ecological and Environmental Sciences, East China Normal University, Shanghai 200241, China
2
Institute of Eco-Chongming (IEC), Shanghai 200062, China
*
Author to whom correspondence should be addressed.
These authors contributed equally to this work.
Remote Sens. 2025, 17(14), 2449; https://doi.org/10.3390/rs17142449
Submission received: 26 May 2025 / Revised: 2 July 2025 / Accepted: 13 July 2025 / Published: 15 July 2025

Abstract

Urban vegetation shows significant spatial differences due to the combined effects of natural and human factors, yet fine-scale evolutionary patterns and their cross-scale feedback mechanisms remain limited. This study focuses on the Yangtze River Delta (YRD), the top economic area in China. By integrating data from multiple Landsat sensors, we built a high—resolution framework to track vegetation dynamics from 1990 to 2020. It generates annual 30-m Enhanced Vegetation Index (EVI) data and uses a new Vegetation Green—Brown Balance Index (VBI) to measure changes between greening and browning. We combined Mann-Kendall trend analysis with machine—learning based attribution analysis to look into vegetation changes across different city types and urban—rural gradients. Over 30 years, the YRD’s annual EVI increased by 0.015/10 a, with greening areas 3.07 times larger than browning. Spatially, urban centers show strong greening, while peri—urban areas experience remarkable browning. Vegetation changes showed a city-size effect: larger cities had higher browning proportions but stronger urban cores’ greening trends. Cluster analysis finds four main evolution types, showing imbalances in grey—green infrastructure allocation. Vegetation baseline in 1990 is the main factor driving the long-term trend of vegetation greenness, while socioeconomic and climate drivers have different impacts depending on city size and position on the urban—rural continuum. In areas with low urbanization levels, climate factors matter more than human factors. These multi-scale patterns challenge traditional urban greening ideas, highlighting the need for vegetation governance that adapts to specific spatial conditions and city—unique evolution paths.

1. Introduction

With the accelerated urbanization, urban land-use structures and green-space distributions have undergone significant shifts, with natural surfaces extensively replaced by impervious surfaces like buildings and roads [1]. Urban vegetation, a key part of urban ecosystems, not only enhances air, water, and soil quality but also regulates the microclimate [2] and boosts urban residents’ physical and mental well-being [3]. Yet, urban vegetation is affected by both the natural environment and human activities, showing complex spatiotemporal dynamics. These effects are likely to intensify with ongoing urbanization [4].
Urbanization affects vegetation growth in two principal ways [5]. First, the conversion of natural and productive land to impervious surfaces—driven by urban expansion—directly reduces vegetated areas and stresses urban ecosystems, resulting in lower productivity. Second, at broader scales, elevated urban temperatures and CO2 levels can enhance vegetation growth, partially compensating for productivity losses caused by land-use change [6]. Enhanced urban greening has been observed in 32 Chinese provincial capitals [7] and 377 U.S. metropolitan areas [8]. Moreover, targeted green-space planning and ecological policies have further reinforced urban vegetation cover [9]. From 2001 to 2018, among 841 global cities with built-up areas exceeding 100 km2, 325 experienced greening across more than 10% of their urban extent [10]. Driven by coordinated urban renewal and planning strategies [11], China has achieved the most extensive “green recovery” worldwide over the past three decades, nearly double that of developed regions in North America and Europe [12]. Notably, this recovery exhibits a clear urban-rural gradient: central city districts have seen significant greening, whereas suburban zones show minimal gains or even browning, highlighting the heterogeneous response of vegetation dynamics to urbanization [13].
Cities serve as “Bellwethers” of future climate change; thus, investigating how urbanization alters vegetation growth is essential for understanding plant responses under global warming [7]. Although several studies have linked urbanization to vegetation change at regional scales [14], they have largely overlooked the heterogeneous response patterns across urban-rural gradients within cities. Globally, about two-thirds of vegetated areas have experienced greening and one-third browning [15], yet such statistics primarily capture broad-scale trends and mask intra-urban variability. Spatiotemporal scale provides a critical perspective for accurately understanding the mechanisms underlying vegetation growth dynamics [16]; however, most research relies on post-2000 short time-series data [17,18], limiting understanding of the long-term impacts of urbanization. In addition, the coarse spatial resolution of common remote-sensing products (250–1000 m) impedes detection and monitoring of fragmented urban green spaces, such as community gardens and pocket parks, resulting in a lack of fine-grained spatial information [19]. For instance, in a study of 35 typical cities in China using 1 km resolution Normalized Difference Vegetation Index (NDVI) data, researchers found that the negative impact of urbanization on vegetation generally diminished with increasing distance from the urban center—except in megacities such as Shanghai, Beijing, and Shenzhen [17], where greening was more concentrated in the urban core. However, due to resolution limitations, the study was unable to accurately capture greening patterns in the urban cores of medium-sized and small cities. Therefore, a systematic, multiscale investigation that integrates medium-to-high-resolution remote-sensing data over extended time frames is urgently needed to elucidate the heterogeneous mechanisms by which urbanization influences vegetation growth across different city sizes and urban-rural gradients, thereby providing a scientific basis for refined urban ecosystem management and climate-resilient planning.
As one of China’s most urbanized regions, the Yangtze River Delta (YRD) exhibits pronounced disparities in development levels across its cities. Such intra-regional imbalance offers an ideal laboratory for examining the spatiotemporal heterogeneity of urbanization’s effects on vegetation growth [20]. In this study, we leveraged Landsat imagery to construct a long-term, 30 m resolution Enhanced Vegetation Index (EVI) time series spanning 1990–2020. By systematically analyzing spatial patterns and temporal trends of vegetation across the YRD, we assess differentiated vegetation responses to urbanization both among cities of varying sizes and along urban-rural gradients within cities. Specifically, this study aims to: (1) quantify the overall trends and spatiotemporal dynamics of vegetation growth in the YRD over the past three decades; (2) identify vegetation-evolution patterns across different city sizes and urban-rural gradients; and (3) investigate driving factors of vegetation-cover change from city-size and urban-rural gradient perspectives.

2. Materials and Methods

2.1. Study Area

The Yangtze River Delta (YRD) (27.11–35.16°N, 114.87–122.85°E) is a delta plain formed where the Yangtze River meets the sea and ranks among China’s most economically advanced and human-activity-intensive regions (Figure 1a). Encompassing 41 cities across Shanghai, and the provinces of Jiangsu, Zhejiang, and Anhui, it spans roughly 358,000 km2. The northern YRD consists primarily of flat plains, while the southwest is characterized by mountains and hills. Under a subtropical monsoon climate, annual temperatures range from 14 to 16 °C, with precipitation between 1000 and 1400 mm [21]. Croplands dominate the north, whereas forests concentrate in the western and southern portions (Figure 1c) [20]. By 2020, forest cover exhibited a clear provincial gradient: Zhejiang (61.15%) > Anhui (30.22%) > Jiangsu (24.00%) > Shanghai (18.49%). With a resident population of 235 million—4.5 times the national average density—and a GDP of 24.5 trillion RMB (24.1% of China’s total) according to the China Statistical Yearbook 2021, the YRD displays stark intra-regional disparities in urban development and human-activity intensity, which have profoundly shaped its vegetation distribution and growth dynamics [22].

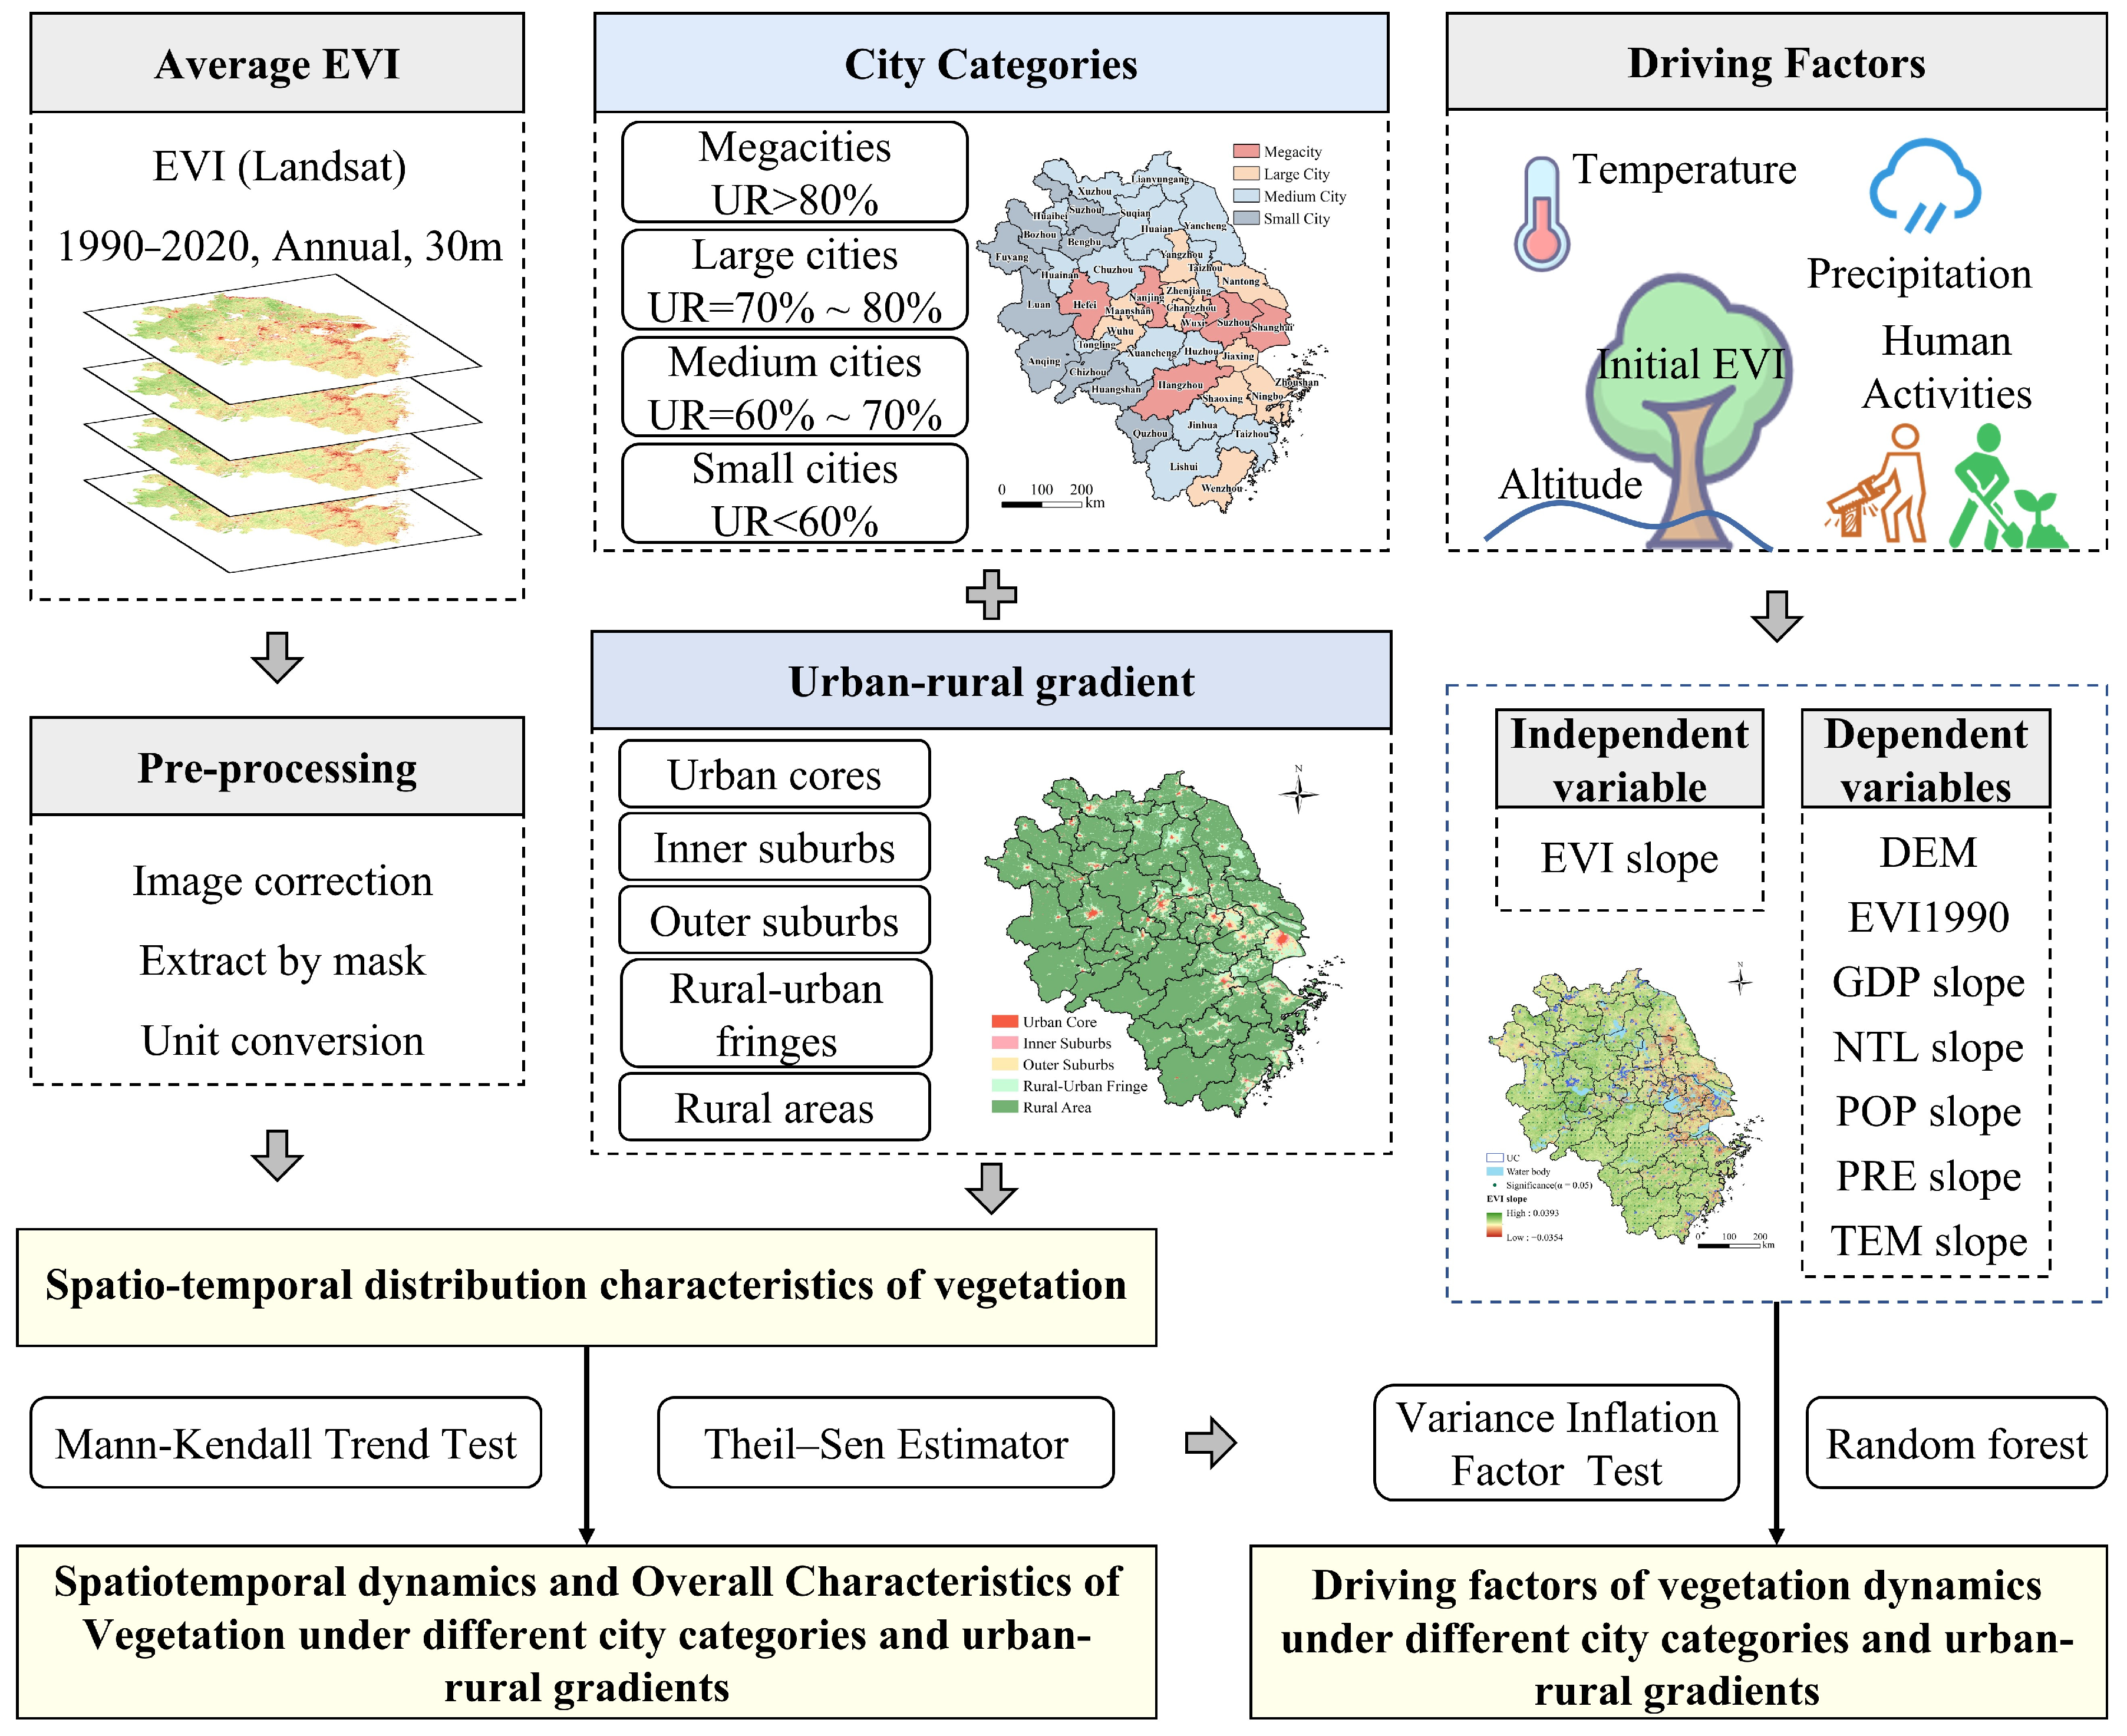
2.2. Data and Methods

2.2.1. Data Sources

The Enhanced Vegetation Index (EVI) is widely used to characterize vegetation status and dynamics [23]. In this study, we utilized Landsat EVI data from the United States Geological Survey (USGS) Earth Resources Observation and Science (EROS) Center (https://earthexplorer.usgs.gov/, accessed on 4 March 2024). Land use changes in the YRD were assessed using the China Land-Use Cover Dataset (CLCD) provides annual 30 m land cover data from 1990 to 2020, developed using over 330,000 Landsat images, with an overall accuracy of 79.31% and shows good consistency with other thematic products [24]. The digital elevation model (DEM) data were obtained from the Copernicus Digital Elevation Model (COP-DEM) released by the European Space Agency. The Global Urban Boundaries (GUB) dataset (http://data.ess.tsinghua.edu.cn, accessed on 3 January 2025) was developed based on a 30 m resolution Global Artificial Impervious Area (GAIA) dataset through an automatic delineation framework, capturing multi-temporal urban expansion globally [25]. City size was classified according to the urban population proportion (UR) indicator from the China Statistical Yearbook (2021). Detailed information on data sources is provided in Table 1. The overall research framework is illustrated in Figure 2.

2.2.2. Generation of EVI Datasets

We generated annual maximum EVI time series at 30 m resolution using Google Earth Engine (GEE). For each year from 1990 to 2020, we compiled all cloud-free and snow-free scenes from Landsat 5, 7, and 8 covering the YRD, totaling 15,007 images (Landsat 5: 9133 images; Landsat 7: 1568 images; Landsat 8: 4306 images), and applied standardized preprocessing to ensure radiometric and geometric consistency. Annual composites were generated using the maximum value compositing method based on all available scenes acquired during the full year (January–December), to capture peak vegetation conditions. To improve temporal continuity and reduce spectral noise, we applied pixel-wise linear interpolation and Savitzky-Golay filtering to the EVI time series [26]. This process supports robust long-term trend analysis across the region.

2.2.3. The Division of City Categories and Urban-Rural Gradients

City categories were defined based on the urbanization rate (UR) of the population [21]. Accordingly, the 41 cities within the YRD were classified into four types: megacities (6 cities, UR > 80%), large cities (11 cities, UR = 70–80%), medium cities (15 cities, UR = 60–70%), and small cities (9 cities, UR < 60%) (Table S1).
Meanwhile, each city was divided into five urban-rural gradient zones using multi-temporal GUB data: urban cores (UC, areas within the 1990 urban boundaries), inner suburbs (IS, urban expansion areas from 1990 to 2000), outer suburbs (OS, urban expansion areas from 2000 to 2010), rural-urban fringes (RUF, urban expansion areas from 2010 to 2020), and rural areas (RA, areas outside the 2020 urban boundaries). The earliest available urban boundary (from 1990) was designated as the urban cores, and subsequent urban-rural gradients were delineated at 10-year intervals based on boundary changes (Figure 1b).

2.2.4. Trend Analysis of Vegetation Spatiotemporal Dynamics at the Pixel Scale

This study employed Theil-Sen median trend analysis and the Mann-Kendall (M-K) test to assess the long-term vegetation dynamics in the Yangtze River Delta (YRD) from 1990 to 2020. Given that EVI time series typically do not satisfy the assumptions of normality and homoscedasticity required by parametric methods, the Sen’s slope estimator was used [31,32]. The M-K test, a non-parametric method, is preferred for its minimal assumptions regarding data distribution, providing more robust results with reduced sensitivity to outliers [33].
When the variable is EVI, the calculation formula is:
E V I   Slope = Median EVI j EVI i j i ,     1990     i   < j     2020
where EVI Slope represents the trend of vegetation change, EVIi and EVIj represent the EVI values of the year i and year j. If EVI Slope > 0, it indicates an increasing trend in EVI, suggesting vegetation restoration or improvement (a greening trend) during the study period; If EVI Slope < 0, it indicates a decreasing trend, suggesting vegetation degradation (a browning trend). Similarly, the slopes for GDP, NTL, POP, PRE, and TEM are also calculated using this method.
M-K test assesses the significance of EVI Slope, the test statistic Z is defined as [34]:
S = j   = 1 n 1 i   =   j   + 1 n s g n EVI j EVI i
s g n EVI j EVI i = 1 ,   E VI j EVI i   >   0 0 ,   E VI j EVI i = 0 1 ,   E VI j EVI i   <   0
s S = n n 1 2 n + 5 30
Z = S 1 s S ,     S   >   0                     0 ,     S = 0 S 1 s S ,     S   <   0
where n is the length of the time series, the sgn is the sign function. At a given significance level α, if |Z| > Z1−α/2, the time series exhibits a significant trend at the α level. In this study, α is set to 0.05, meaning that when |Z| > 1.96, the EVI trend is considered statistically significant at the 0.05 confidence level.

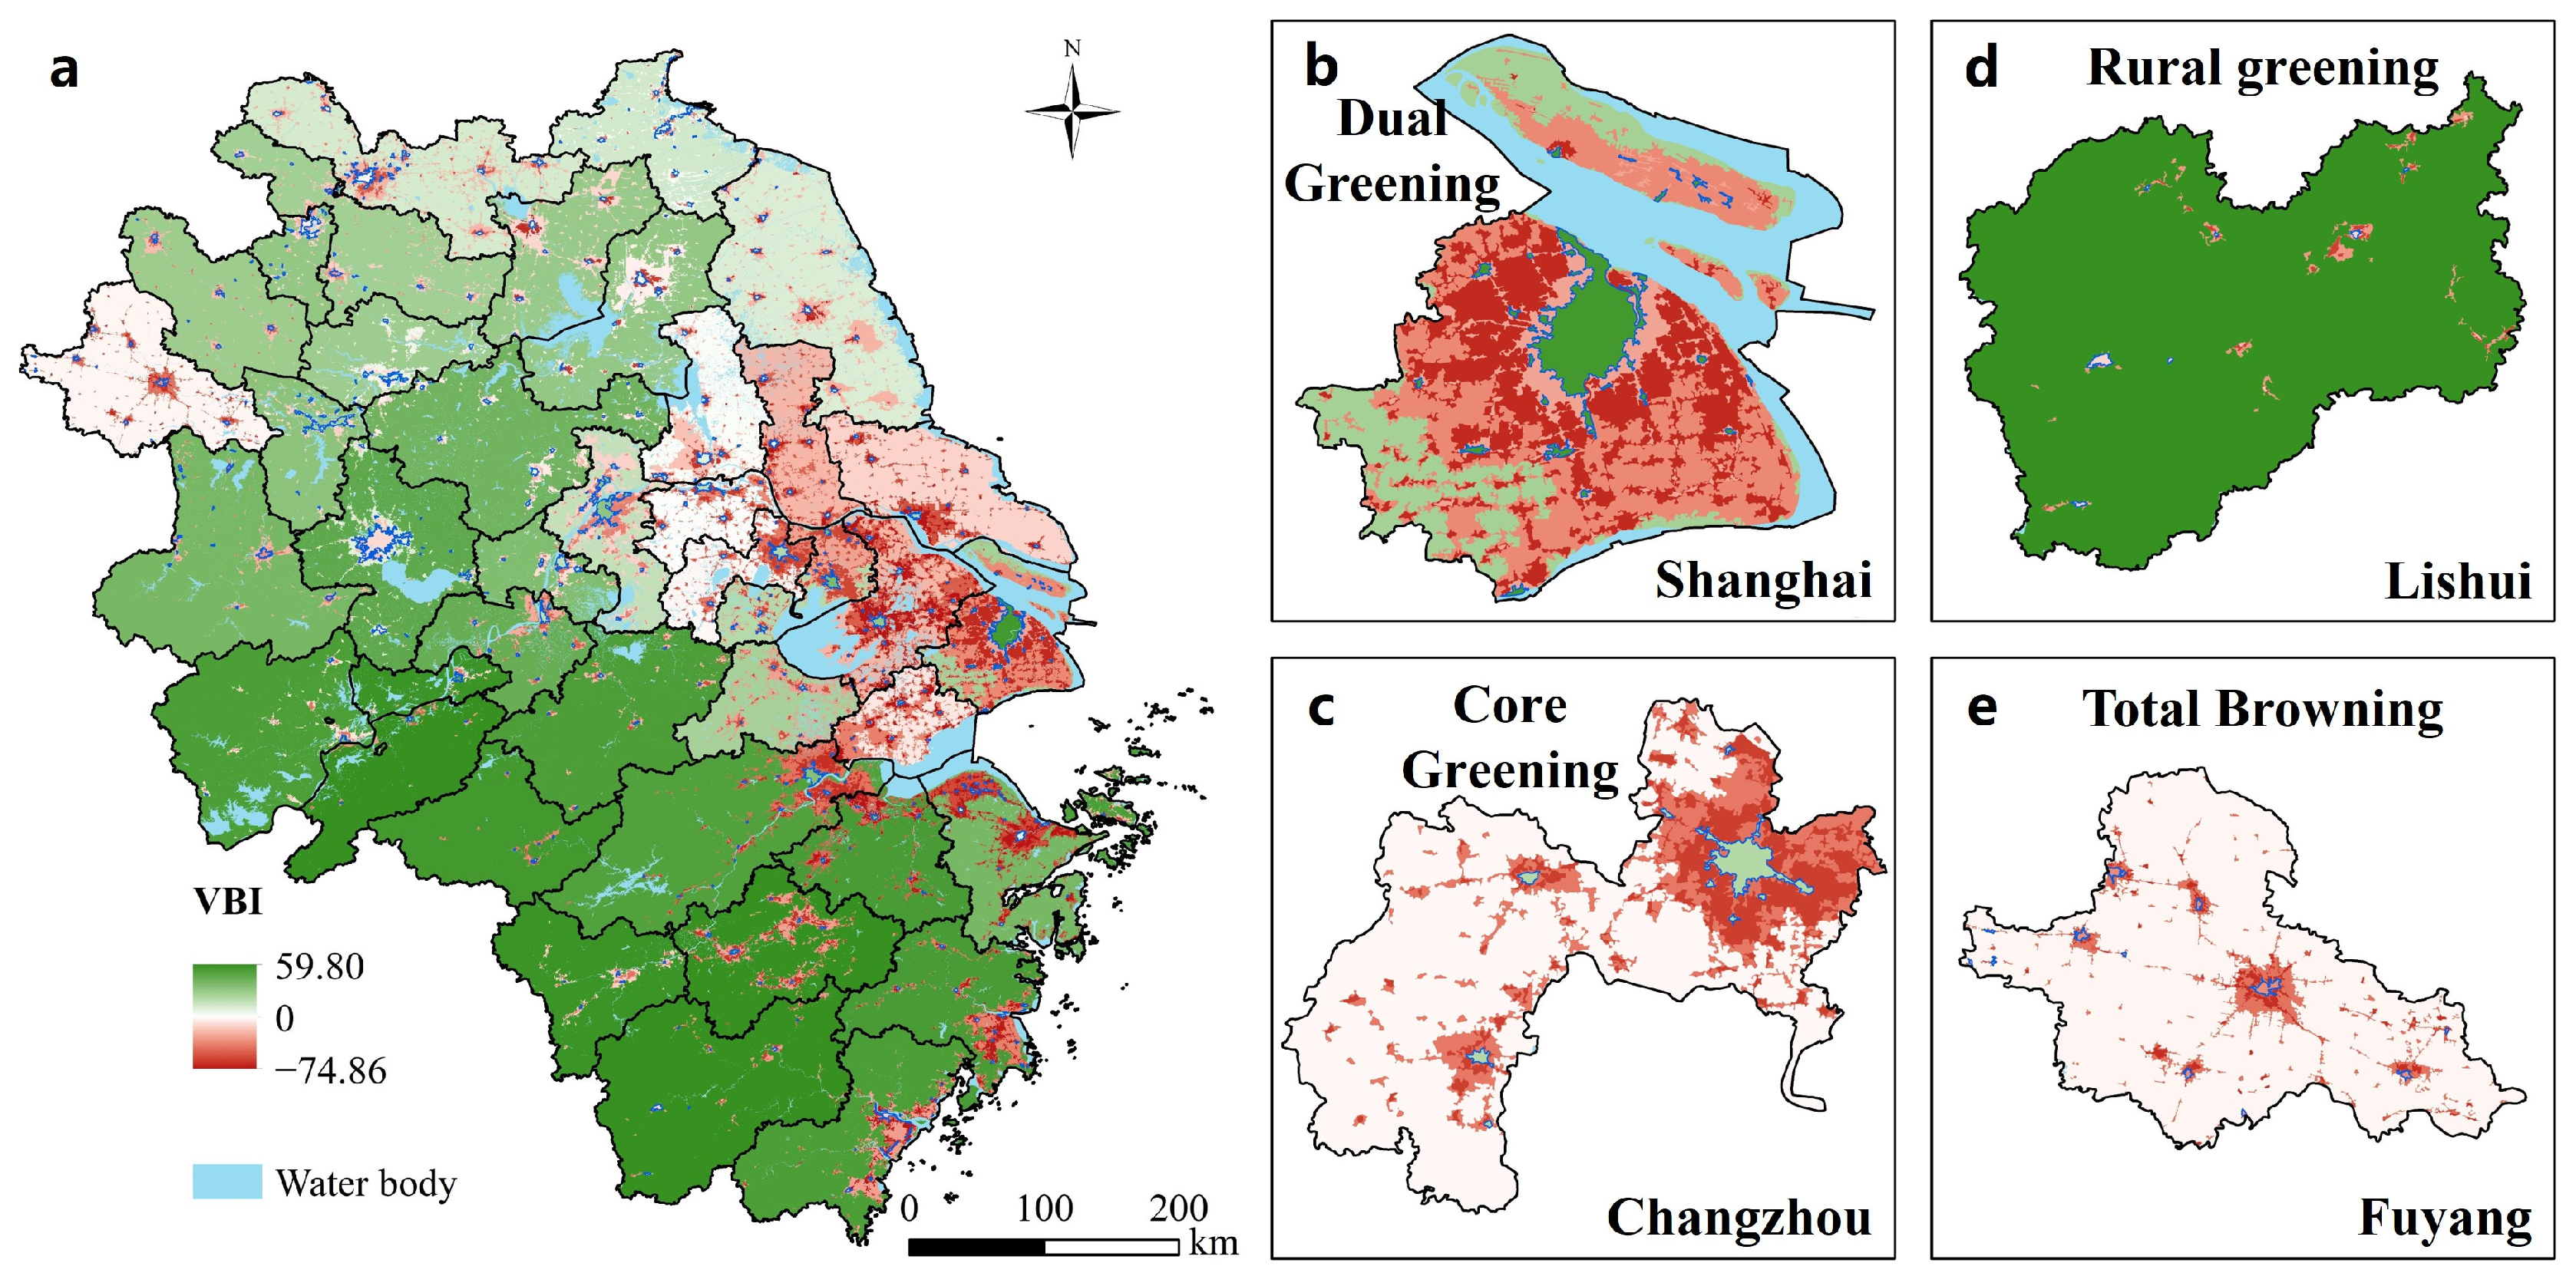
2.2.5. The Construction of Vegetation Green-Brown Balance Index

While ΔEVI reflects EVI differences across regions and gradients, it cannot directly quantify the proportion of greening and browning pixels within the same gradient. To address this, we developed a Vegetation Green-Brown Balance Index (VBI) to quantify net vegetation trends by integrating significant greening and browning areas within each urban-rural gradient zone of each city. We first define the Relative Greening Area Ratio (RGR) and the Relative Browning Area Ratio (RBR) as:
R G R i , j = S G i , j / A r e a i , j   ×   100 %
R B R i , j = S B i , j / A r e a i , j   ×   100 %
where SGi,j and SBi,j represent the areas of significant greening and browning, respectively, within urban-rural gradient class j of city i, and Areai,j denotes the total area of gradient class j in city i. The VBI is calculated as:
V B I i , j = R G R i , j     R B R i , j
A positive VBIi,j indicates a net greening trend, whereas a negative value indicates net browning; larger absolute values reflect more pronounced trends. Like ΔEVI, the VBI is also a relative difference index, but it allows for a quantitative comparison of greening and browning ratios within each gradient. By normalizing these ratios by regional area, it eliminates the deviation of different regional sizes and enhances the comparability between cities and gradients. This method not only offers a more intuitive reflection of vegetation trends but also provides a new perspective for the detailed analysis of vegetation dynamics across urban-rural gradients.

2.2.6. Socio-Ecological Drivers of Vegetation Dynamics

Vegetation growth is governed by multiple drivers, including human activities and natural ecological conditions [35]. Constrained by data availability, gross domestic product (GDP), nighttime light (NTL) and population density (POP) were used as proxies for anthropogenic influence, while precipitation (PRE), temperature (TEM) [27], elevation, and baseline vegetation status (EVI in 1990) represented natural ecological drivers [36] (Table 1). GDP captures regional economic development [29], NTL reflects the intensity of human activity and socioeconomic progress through nocturnal light emissions [28], and POP serves as an indicator of human activity concentration, often aligned with economic centers [30].
To quantify the contributions of these seven drivers to vegetation cover changes in the YRD over the past 30 years, this study employs the Random Forest (RF) algorithm. RF is a non-parametric machine learning method well-suited for capturing nonlinearities and complex interactions [37]. To mitigate the effects of temporal data gaps, long-term trends were extracted by calculating the slope of each variable at the grid level using Sen’s slope estimator (with missing pixels filled using mean values). The original 30 m EVI data were resampled to 1 km to ensure spatial alignment with other datasets. Then, the variance inflation factor (VIF) [38,39] was utilized to assess multicollinearity among variables, with no significant collinearity detected (Table S2). In the RF model, the number of trees was set to 500 for stability, with a node size of 5 to reduce overfitting. The number of variables tried at each split (mtry) was set to 2 (p/3), enhancing model generalization. Model performance was evaluated using the coefficient of determination (R2), with EVI slope as the dependent variable and the remaining seven factors as independent variables; the closer R2 is to 1, the stronger the model’s explanatory power and the higher the prediction accuracy. In addition, the relative importance of each socio-ecological driver for vegetation cover change was assessed by the percentage increase in mean squared error (%IncMSE) [40] across different city sizes and urban-rural gradients within the YRD:
R I i =   i n c i / i = 1 n i n c i
where RIi is the relative importance of driver i, inci is the %IncMSE associated with driver I, and n = 7 is the total number of drivers included. This quantification method based on the internal model mechanisms, can more objectively evaluate the importance of each driver.

3. Results

3.1. Spatiotemporal Dynamics and Overall Characteristics of Vegetation in the YRD

The long-term annual EVI of vegetation in the YRD from 1990 to 2020 was 0.55 ± 0.12. At the city level, Bozhou exhibited the highest EVI (0.63), whereas Suzhou recorded the lowest (0.44). When stratified by city size, EVI declined with increasing urban scale: small cities (0.59) > medium cities (0.55) > large cities (0.50) > megacities (0.46) (Figure 3a–d). Within each size category, EVI increased systematically along the urban-rural gradient, rising with distance from urban cores (Figure 3e). Notably, in the urban cores (UC), inner suburbs (IS), and outer suburbs (OS) gradient classes, EVI across the four size groups displayed a ‘V’-shaped pattern, indicating comparatively poorer vegetation growth in large cities.
Over the past 30 years, the YRD’s overall EVI exhibited a highly significant upward trend at 0.015/10 a. However, vegetation dynamics varied markedly by city type (Figure 4). Small and medium cities mirrored the regional greening trend, with small cities showing the largest increase (0.026/10 a). In contrast, megacities and large cities displayed comparatively modest EVI changes.
Spatially, the YRD exhibited an overall greening trend from 1990 to 2020, with areas undergoing significant greening (35.45%) far exceeding those experiencing significant browning (11.56%). Greening was mainly in the southwestern region, whereas browning occurred chiefly in Shanghai and nearby cities, showing patchy and banded distributions (Figure 5a). Significant greening was concentrated in urban cores (UC) and rural areas (RA), while significant browning was mostly at the periphery of UC, extending outward along the urban-rural gradient. Core zone greening was linked to urban renewal and enhanced vegetation growth (Figure 5b–e). Meanwhile, several medium and small cities had notable browning, primarily due to land-use changes, such as residential development (Figure 5e).
Across the five urban-rural gradient classes (Figure 5f), EVI slopes form a pronounced “V”-shaped distribution: browning peaks in the OS, while both the UC and RA exhibited greening trends. Within the UC gradient, a clear city-size effect emerged—larger cities showed more pronounced greening. In contrast, RA zones generally experienced greening, with small cities showing the highest increase (0.027/10 a). In the remaining three gradients (IS, OS, and RUF), all city categories browned, most markedly in large cities. Notable inter-city variability exists within the same size and gradient classes (Figure 5f,g). For instance, UC browning in Hefei and Wenzhou reflects rapid urbanization and conversion of natural surfaces to impervious surfaces. Moreover, because Hefei’s urban expansion has been concentrated near the UC boundary, the RUF has not yet exhibited a pronounced browning trend. Browning in the RA zones of Suzhou, Taiizhou, and Fuyang corresponded to the conversion of agricultural land to impervious surfaces during accelerated rural development (Figure S1).

3.2. Multi-Scale Analysis of Greening-Browning Patterns and Urban Vegetation Evolution Modes

Among the 41 YRD cities, Shanghai and its neighbors exhibited the highest proportions of significant browning, whereas southwestern cities were predominantly greening (Figure 6a). Suzhou recorded the maximum browning ratio (47.97%), while Lishui achieved the highest greening ratio (61.26%). Vegetation-change patterns revealed a clear city-size effect: larger cities experienced higher browning and lower greening proportions, although greening exceeded browning across all categories (Figure 6b). Across urban-rural gradients, the relative browning area ratio (RBR) followed an inverted-V distribution (Figure 6c), whereas the relative greening area ratio (RGR) displayed a U-shaped pattern (Figure 6d), indicating that browning responded more sensitively to gradient transitions. Urban expansion hotspots were concentrated in IS, OS, and RUF, with RBR peaking in OS for all categories. In UC, RGR increased steadily with city size; notably, the RGR of UC in megacities and large cities even surpassed that in RA, consistent with re-greening trends in historic cores and likely reflecting urban renewal. Furthermore, large cities exhibited a “high-browning, low-greening” profile in IS, OS, and RUF, suggesting that vegetation in these cities was most adversely impacted by anthropogenic activities.
Results of the Vegetation Green-Brown Balance Index (VBI) indicate that greening in UC areas is relatively widespread across the YRD, observed in 31 of 41 cities, not just in megacities or large cities. In most cities (36/41), VBI values for IS, OS, and RUF gradients are negative, implying that vegetation in these zones is highly susceptible to anthropogenic impacts during urban expansion, resulting in predominant browning trends (Table S3). Disparities in resource allocation and development strategies among cities have likely caused divergent vegetation trends in UC and RA areas. Based on the VBI results for UC and RA gradients, the 41 cities in the YRD can be grouped into four vegetation evolution patterns (Table 2): Dual Greening (most common, with greening in both UC and RA); Core Greening (UC greening but RA browning, mainly seen in large cities, including one megacity and four large cities); Rural Greening (UC browning but RA greening, mainly found in medium and small cities); and Total Browning (browning in both UC and RA, observed in only two cities—one medium city and one small city) (Figure 7). In most cities, strong urban renewal efforts and ecological governance have enabled green infrastructure in UC areas to effectively offset the adverse effects of intensive construction, leading to visible greening trends. However, in some cases, the prioritization of urban development over ecological investment and planning has resulted in an imbalance of “gray”–“green” spaces between UC and RA areas, manifesting in localized browning.

3.3. Driving Factors of Vegetation Dynamics in the YRD

From 1990 to 2020, the YRD witnessed remarkable land-use changes that influenced vegetation dynamics. The total cropland area decreased by 11.76%, primarily converted to impervious surfaces, which expanded to 2.72 times their original extent. Forests declined by 2.35%, grasslands and shrublands also reduced, and wetlands nearly disappeared (Figure S2a). Grid-level analysis revealed that 87.26% of the initial impervious surfaces (the impervious surface pixels in 1990) remained unchanged, indicating greening in these areas was mostly independent of land-use conversion. In contrast, 19.73% of initial cropland converted to impervious surfaces with significant browning (−0.078/10 a). Forests converted to other land-use types also experienced consistent browning, especially when turned into barren land (−0.110/10 a). Even without land-use transitions, vegetation dynamics varied markedly over time. Among unchanged land-use types, forest areas had the strongest greening trend (0.047/10 a), followed by impervious surfaces (0.023/10 a), while cropland showed the weakest greening (0.013/10 a) (Figure S2b–d). This suggests that vegetation changes were likely influenced more by climatic and socioeconomic factors than by land-use conversion.
To validate this hypothesis, we employed the Random Forest algorithm to assess the relative contributions of seven socio-ecological drivers—elevation (DEM), initial vegetation condition (EVI1990), socioeconomic factors (GDP, NTL and POP), and climatic factors (PRE and TEM)—to vegetation changes in the YRD from 1990 to 2020. Results indicate that both model performance (R2) and the relative importance (RI) of drivers varied across city categories and urban–rural gradients. Overall, the model performed well in the YRD (R2 = 0.65). Among different city types, the highest performance was observed in megacities (R2 = 0.77), while small cities showed lower performance (R2 = 0.54). Across urban–rural gradients, the model performed best in urban core areas (R2 = 0.62) and worst in the rural–urban fringe (RUF) zones (R2 = 0.51). Detailed results were presented in Table S4. Initial vegetation condition was the dominant driver across all city types, particularly within the UC regions of large, medium, and small cities. Overall, as city size decreased, the RI of climatic factors increased (Megacities: 15.29%; Small cities: 33.14%). Similarly, along the urban-rural gradients, the RI of socioeconomic factors gradually declined, while the influence of climate became more pronounced. This indicated that vegetation in UC was more affected by human activities, whereas in rural areas (RA), with less urbanization, vegetation was more strongly influenced by natural climatic conditions (Figure 8).
In summary, smaller cities and areas near RA showed higher RI values for climatic factors, reflecting an enhanced dominance of natural climate effects in the context of reduced human interference. Conversely, in regions with intense anthropogenic activities, the influence of climate was diminished. Particularly, the RI of DEM also increased along urban-rural gradients, reaching 34.74% in RA. This may be attributed to the prevalence of nature reserves and forest parks in high-elevation rural areas, where ecosystems are relatively stable and biodiversity is high. Under the combined effect of low-intensity human disturbance and conservation management, topographic heterogeneity likely amplified the vegetation greening response.

4. Discussion

4.1. Trends in Vegetation Dynamics Along Urban Size and Urban-Rural Gradients

Global analyses indicate a rising trend in urban vegetation greenness in recent years [15]. Zhang et al. used MODIS NDVI data to analyze 1688 major cities and found that about 70% experienced vegetation gains from 2000 to 2018 [41]. Our study of the Yangtze River Delta (YRD) reveals a significant increase in vegetation cover between 1990 and 2020, with a growth rate of 0.015/10 a. During this period, 35.45% of the YRD area showed significant greening, slightly lower than the 43.18% recorded for 2000–2020 [20], highlighting an accelerated greening trend post-2000. Before 2005, most Chinese cities witnessed vegetation declines due to urban expansion driven by rapid economic growth and reform-and-opening policies [42,43]. After 2005, heightened environmental awareness and large-scale greening initiatives, such as the Grain for Green Program and the construction of National Forest City [44], spurred urban vegetation recovery. Land-use policies in the YRD have also significantly influenced these trends. For instance, “Opinions on Promoting Urban and Rural Ecological Environment Construction in Jiangsu Province (2008)” emphasized expanding urban and rural green spaces, promoting integrated greening. “Anhui Province Forestry Ecological Construction Plan (2009–2020)” focused on afforestation to improve forest cover. Shanghai’s “Urban Planning Ordinance” and “Environmental Protection Regulations” strengthened green space planning and protected existing vegetation, while the “Land Use Master Plan (2006–2020)” guided green land allocation. In Zhejiang, the “Regulations on the Protection and Management of Forest Land” safeguarded forest resources, promoting sustainable greening.
Between 1990 and 2022, vegetation changes in Chinese cities showed significant spatial heterogeneity both across and within cities [45]. To investigate how city size and urban-rural gradients affect vegetation dynamics, we classified 41 cities in YRD by urbanization rate (UR) and further divided them into five gradient zones using GUB data. Results indicate that 31 cities exhibited greening trends in their urban cores (UC), with greening magnitude increasing with city size. Similar trends have been observed in rapidly urbanizing areas in Europe and China, where EVI and NDVI in urban core areas have increased. However, in most African and South American cities, EVI and NDVI have declined [13]. Compared to the traditional three-tier classification [21], our five-tier gradient approach provided finer insights. Regardless of city size, the inner suburbs (IS), outer suburbs (OS), and rural-urban fringes (RUF) consistently exhibited browning trends. These trends were most pronounced in large cities and reached their peak in the OS zone. Other studies have also observed similar patterns, such as a decline in NDVI in urban areas from 2000 to 2018, while NDVI in urban centers of major Chinese cities showed an upward trend [46]. However, previous studies were limited in their ability to reveal the varying degrees of browning across different areas within regions. Our research fills this gap by precisely identifying these differences, emphasizing that as cities transition into the large-city stage, urban planning needs to give priority to reducing vegetation loss in these key gradient zones, especially in OS.
Furthermore, to enhance comparability both among cities and within urban areas, we developed the Vegetation Green-Brown Balance Index (VBI) to measure internal greening and browning dynamics. We mapped the spatial distribution of zones with VBI < 0 (indicating browning-dominated areas), addressing the excessive bias on greening areas in previous studies. Using VBI, we identified four distinct vegetation-evolution patterns. Cities exhibiting the “Total Browning” pattern require attention due to their urban expansion model and potential ecosystem degradation. This pattern is especially prevalent in cities across the Global South, where urban core areas (with KEVI = −0.007 ± 0.0004 per decade) and urban transition zones (with KEVI = −0.016) experienced widespread browning between 2003 and 2020 [47]. To balance urbanization and ecological conservation, a “plan-before-development” approach is necessary. Additionally, measures such as rooftop greening [2], protecting existing green spaces, and optimizing green corridor layouts should be taken to reduce vegetation fragmentation and promote sustainable urban development.

4.2. Impacts of Socio-Ecological Factors on Vegetation Dynamics and Policy Recommendations

We applied the Random Forest model to quantify the relative contributions of seven drivers—elevation (DEM), initial vegetation condition (EVI1990), socioeconomic factors (GDP, NTL, and POP), and climatic factors (PRE and TEM)—to vegetation change in the YRD (Table S4). Initial vegetation condition was a key driver across all cities, with relative importance (RI) values ranging from 15.28% to 59.61%. Socioeconomic and climatic influences exhibited clear urban-rural gradient dependence: the RI of socioeconomic drivers declined from 34.39% in UC to 13.62% in RA, while climatic drivers’ RI rose from 19.58% to 29.24%. This pattern reflects underlying differences in resource allocation and management. In rural zones with weaker infrastructure, vegetation dynamics depend more on natural precipitation and temperature [48]. However, areas near UC see intensive human interventions (i.e., artificial lakes, irrigation systems, and green-space policies) that mitigate the climate’s relative effect [49]. NTL showed low RI across most gradients, particularly in RA (<10%). This likely reflects its role as an indirect proxy for human activity without directly influencing vegetation growth. High-intensity lighting is predominantly found in commercial and industrial zones, which typically have sparse green cover. This spatial association further limits NTL’s influence on vegetation dynamics [50]. Additionally, in rural areas, the scarcity of lighting infrastructure results in generally low NTL radiance values, often approaching zero [51]. Similarly, the RI of POP remains below 10% across all gradients, possibly because its impact on vegetation is indirect and mediated by multiple factors. For instance, a high POP can increase land development pressure, but the actual effect on vegetation, whether destruction or protection, depends on land use policies and urban planning. Furthermore, the random forest model may be more inclined to select those variables that have a more direct and definite impact on vegetation changes [52], thereby making the relative importance of POP relatively low.
Specifically, RI of DEM increases along the urban-rural gradients, peaking at 36.38% in RA. High-elevation rural areas experience less human disturbance, cooler temperatures, higher precipitation, and greater soil water retention, favoring vegetation growth [53]. Many such areas also coincide with nature reserves and forest parks, enhancing ecosystem stability through conservation management. Conversely, low-elevation areas face faster urbanization, soil degradation, reduced moisture retention, and stronger urban heat island effects, all of which inhibit vegetation growth [54].
Based on these findings, we recommend tailored urban planning and vegetation management measures to optimize greening and enhance vegetation cover. Megacities, marked by advanced urbanization and scarce green resources, can enhance green infrastructure quantity and quality by setting clear urban-forest cover targets, promoting rooftop greening, and adopting intelligent irrigation systems [55]. In large cities, where vegetation cover is more influenced by climatic than socioeconomic factors, optimizing water management, conserving wetlands, and using permeable pavements can boost ecosystem stability [56]. Medium cities, facing challenges like industrial pollution and land-use changes, should increase green infrastructure investment, strictly regulate industrial land use, and encourage eco-industrial transformation to curb ecological damage [57]. Finally, with their higher restoration potential, small cities can achieve sustainable development by expanding green spaces, strengthening ecological compensation, and promoting natural regeneration through measures like forest enclosure [58].

4.3. Limitations and Future Work

Current studies typically categorize city size based on urban population [2], resident population [17], or urbanization rate (UR) [21]. In this work, we adopted UR as the metric. However, UR did not always reveal a city’s actual developmental profile. For example, Hefei is classified as a “megacity” by UR but resembles a large city in characteristics. Thus, a more comprehensive city classification system is needed. It can be achieved by integrating variables like industrial structure, public infrastructure, and transportation networks, or by using the City Prosperity Index (CPI) proposed by UN-Habitat for a thorough assessment of urban development levels [59].
For driver-mechanism analysis, we selected seven factors—elevation (DEM), baseline vegetation condition (EVI1990), socioeconomic indicators (GDP, NTL, and POP), and climatic variables (PRE and TEM). However, vegetation dynamics result from coupled socio-ecological processes across multiple scales, and single economic or climatic factors alone can’t fully explain observed spatial patterns [60]. Future studies should incorporate additional drivers, such as population density and land-use policy intensity, to enrich the explanatory framework. Although remote sensing and big-data approaches are common in urban vegetation monitoring [61], the lack of 30 m resolution socioeconomic and climate datasets forced us to rely on 1 km-scale data. At the same time, data gaps in certain years introduce additional complexity to our analysis. These limitations created a spatial mismatch with the 30 m vegetation metrics. Future work should acquire finer-resolution ancillary data and ensure more consistent temporal coverage to enhance the accuracy of urban ecological process analyses.
Moreover, despite development pressures, urban ecosystems retain inherent natural attributes and follow unique evolutionary trajectories and response mechanisms [62]. While we have quantified differences in driver importance across city sizes and urban-rural gradients, the precise pathways and interactions of these factors on vegetation change remain unclear. Clarifying these mechanisms is crucial for supporting precision greening management and sustainable urban development.

5. Conclusions

This study used a fine-resolution Enhanced Vegetation Index (EVI) dataset to analyze vegetation dynamics across 41 Yangtze River Delta (YRD) cities over the past 30 years, exploring changes related to city size, urban-rural gradients, and their driving factors. From 1990 to 2020, the region saw a significant greening trend. Greening was mainly in the southwest, while browning occurred mostly in Shanghai and nearby cities. Within cities, both urban cores (UC) and rural areas (RA) exhibited greening trends, but outer suburbs (OS) exhibited strong browning. Larger cities had higher browning proportions but also more pronounced UC greening. We identified four distinct vegetation change patterns reflecting “gray-green” space balance across urban-rural gradients. 31/41 cities showed UC greening, highlighting the positive effects of urban renewal. Driver analysis revealed that initial vegetation condition was a key factor, while the importance of social and climatic drivers varied with city size and urban-rural gradient. As city size decreased from megacities to small cities and areas shifted from UC to RA, socioeconomic influence declined while climatic impact increased. The findings highlight vegetation dynamics’ spatial heterogeneity and the need for differentiated green space management, offering valuable insights for urban management and sustainable development.

Supplementary Materials

The following supporting information can be downloaded at: https://www.mdpi.com/article/10.3390/rs17142449/s1, Figure S1: Historical satellite images (from Google Earth Pro); Figure S2: Relationship between land use change and EVI slope in the Yangtze River Delta from 1990 to 2020; Table S1: The classifications of 41 cities in in the YRD; Table S2: Variance Inflation Factor (VIF) Test Results; Table S3: VBI results across urban–rural gradients for 41 cities in the YRD; Table S4: Relative Importance of Seven Factors in Urban Vegetation Evolution Based on the Random Forest Model Across City Categories and Urban–Rural Gradients.

Author Contributions

Conceptualization, K.Z., S.Z., H.Z. and M.L.; methodology, K.Z., S.Z., H.Z. and Y.Z.; formal analysis, K.Z.; investigation, K.Z., Z.J., H.T. and M.L.; software, K.Z., M.C., S.Z., R.Z. and Y.Z.; data curation, K.Z. and M.C.; validation, Z.J.; resources, Z.J.; writing—original draft, K.Z.; writing—review and editing, M.C., H.T. and M.L.; Visualization, R.Z. and H.T.; supervision, Y.W. and M.L.; project administration, K.Z., M.C. and Y.W.; funding acquisition, M.L. All authors have read and agreed to the published version of the manuscript.

Funding

This research was funded by the National Key Research and Development Program of China (No. 2022YFF0802104) and the Joint Research Fund of the “Island Atmosphere and Ecology” Category IV Peak Discipline (No. ZD202501).

Data Availability Statement

The data presented in this study are available on request from the corresponding author.

Acknowledgments

The authors would like to thank the reviewers for their constructive comments and suggestions.

Conflicts of Interest

The authors declare that they have no conflicts of interest.

References

  1. Small, C.; Sousa, D.; Yetman, G.; Elvidge, C.; MacManus, K. Decades of urban growth and development on the Asian megadeltas. Glob. Planet. Change 2018, 165, 62–89. [Google Scholar] [CrossRef]
  2. Zhang, P.; Dong, Y.; Ren, Z.; Wang, G.; Guo, Y.; Wang, C.; Ma, Z. Rapid urbanization and meteorological changes are reshaping the urban vegetation pattern in urban core area: A national 315-city study in China. Sci. Total Environ. 2023, 904, 167269. [Google Scholar] [CrossRef] [PubMed]
  3. Jabbar, M.; Yusoff, M.M.; Shafie, A. Assessing the role of urban green spaces for human well-being: A systematic review. GeoJournal 2022, 87, 4405–4423. [Google Scholar] [CrossRef] [PubMed]
  4. Calfapietra, C.; Peñuelas, J.; Niinemets, Ü. Urban plant physiology: Adaptation-mitigation strategies under permanent stress. Trends Plant Sci. 2015, 20, 72–75. [Google Scholar] [CrossRef]
  5. Zhang, L.; Yang, L.; Zohner, C.M.; Crowther, T.W.; Li, M.; Shen, F.; Guo, M.; Qin, J.; Yao, L.; Zhou, C. Direct and indirect impacts of urbanization on vegetation growth across the world’s cities. Sci. Adv. 2022, 8, eabo0095. [Google Scholar] [CrossRef]
  6. Guan, X.; Shen, H.; Li, X.; Gan, W.; Zhang, L. A long-term and comprehensive assessment of the urbanization-induced impacts on vegetation net primary productivity. Sci. Total Environ. 2019, 669, 342–352. [Google Scholar] [CrossRef]
  7. Zhao, S.; Liu, S.; Zhou, D.; Zhao, S.; Liu, S.; Zhou, D. Prevalent vegetation growth enhancement in urban environment. Proc. Natl. Acad. Sci. USA 2016, 113, 6313–6318. [Google Scholar] [CrossRef]
  8. Jia, W.; Zhao, S.; Liu, S. Vegetation growth enhancement in urban environments of the Conterminous United States. Glob. Change Biol. 2018, 24, 4084–4094. [Google Scholar] [CrossRef]
  9. Capotorti, G.; Alós Ortí, M.M.; Copiz, R.; Fusaro, L.; Mollo, B.; Salvatori, E.; Zavattero, L. Biodiversity and ecosystem services in urban green infrastructure planning: A case study from the metropolitan area of Rome (Italy). Urban For. Urban Green. 2019, 37, 87–96. [Google Scholar] [CrossRef]
  10. Sun, L.; Chen, J.; Li, Q.; Huang, D. Dramatic uneven urbanization of large cities throughout the world in recent decades. Nat. Commun. 2020, 11, 5366. [Google Scholar] [CrossRef]
  11. Fu, Y.; Li, J.; Weng, Q.; Zheng, Q.; Li, L.; Dai, S.; Guo, B. Characterizing the spatial pattern of annual urban growth by using time series Landsat imagery. Sci. Total Environ. 2019, 666, 274–284. [Google Scholar] [CrossRef]
  12. Liu, X.; Huang, Y.; Xu, X.; Li, X.; Li, X.; Ciais, P.; Lin, P.; Gong, K.; Ziegler, A.D.; Chen, A.; et al. High-spatiotemporal-resolution mapping of global urban change from 1985 to 2015. Nat. Sustain. 2020, 3, 564–570. [Google Scholar] [CrossRef]
  13. Zhong, Q.; Li, Z. Long-term trends of vegetation greenness under different urban development intensities in 889 global cities. Sustain. Cities Soc. 2024, 106, 105406. [Google Scholar] [CrossRef]
  14. Yao, R.; Cao, J.; Wang, L.; Zhang, W.; Wu, X. Urbanization effects on vegetation cover in major African cities during 2001–2017. Int. J. Appl. Earth Obs. Geoinf. 2019, 75, 44–53. [Google Scholar] [CrossRef]
  15. Gui, Y.; Wang, K.; Huntingford, C.; Wei, S.; Li, X.; Myneni, R.B.; Piao, S. Vegetation greenness in 2024. Nat. Rev. Earth Environ. 2025, 6, 255–257. [Google Scholar] [CrossRef]
  16. Yan, Y.; Piao, S.; Hammond, W.M.; Chen, A.; Hong, S.; Xu, H.; Munson, S.M.; Myneni, R.B.; Allen, C.D. Climate-induced tree-mortality pulses are obscured by broad-scale and long-term greening. Nat. Ecol. Evol. 2024, 8, 912–923. [Google Scholar] [CrossRef]
  17. Miao, L.; He, Y.; Kattel, G.R.; Shang, Y.; Wang, Q.; Zhang, X. Double Effect of Urbanization on Vegetation Growth in China’s 35 Cities during 2000–2020. Remote Sens. 2022, 14, 3312. [Google Scholar] [CrossRef]
  18. Gregg, J.W.; Jones, C.G.; Dawson, T.E. Urbanization effects on tree growth in the vicinity of New York City. Nature 2003, 424, 183–187. [Google Scholar] [CrossRef]
  19. Hu, T.; Dong, J.; Hu, Y.; Qiu, S.; Yang, Z.; Zhao, Y.; Cheng, X.; Peng, J. Stage response of vegetation dynamics to urbanization in megacities: A case study of Changsha City, China. Sci Total Environ. 2023, 858, 159659. [Google Scholar] [CrossRef]
  20. Zhang, S.; Jia, W.; Zhu, H.; You, Y.; Zhao, C.; Gu, X.; Liu, M. Vegetation growth enhancement modulated by urban development status. Sci. Total Environ. 2023, 883, 163626. [Google Scholar] [CrossRef]
  21. Zhao, C.; Zhu, H.; Zhang, S.; Jin, Z.; Zhang, Y.; Wang, Y.; Shi, Y.; Jiang, J.; Chen, X.; Liu, M. Long-term trends in surface thermal environment and its potential drivers along the urban development gradients in rapidly urbanizing regions of China. Sustain. Cities Soc. 2024, 105, 105324. [Google Scholar] [CrossRef]
  22. She, Q.; Cao, S.; Zhang, S.; Zhang, J.; Zhu, H.; Bao, J.; Meng, X.; Liu, M.; Liu, Y. The impacts of comprehensive urbanization on PM2.5 concentrations in the Yangtze River Delta, China. Ecol. Indic. 2021, 132, 108337. [Google Scholar] [CrossRef]
  23. Jiang, Z.; Huete, A.R.; Didan, K.; Miura, T. Development of a two-band enhanced vegetation index without a blue band. Remote Sens. Environ. 2008, 112, 3833–3845. [Google Scholar] [CrossRef]
  24. Yang, J.; Huang, X. The 30 m annual land cover dataset and its dynamics in China from 1990 to 2019. Earth Syst. Sci. Data 2021, 13, 3907–3925. [Google Scholar] [CrossRef]
  25. Li, X.; Gong, P.; Zhou, Y.; Wang, J.; Bai, Y.; Chen, B.; Hu, T.; Xiao, Y.; Xu, B.; Yang, J.; et al. Mapping global urban boundaries from the global artificial impervious area (GAIA) data. Environ. Res Lett 2020, 15, 094044. [Google Scholar] [CrossRef]
  26. Zeng, K.; Ci, M.; Zhu, H.; Zhang, S.; Wang, Y.; Zhang, Y.; Liu, M. A dataset of annual maximum vegetation indices at a 30-meter resolution for the Yangtze River Delta region from 1984 to 2023. China Sci. Data 2025, 10, 563–576. [Google Scholar] [CrossRef]
  27. Peng, S.; Ding, Y.; Liu, W.; Li, Z. 1 km monthly temperature and precipitation dataset for China from 1901 to 2017. Earth Syst. Sci. Data 2019, 11, 1931–1946. [Google Scholar] [CrossRef]
  28. Wu, Y.; Shi, K.; Chen, Z.; Liu, S.; Chang, Z. Developing Improved Time-Series DMSP-OLS-Like Data (1992–2019) in China by Integrating DMSP-OLS and SNPP-VIIRS. IEEE Trans. Geosci. Remote Sens. 2022, 60, 4407714. [Google Scholar] [CrossRef]
  29. Chen, J.; Gao, M.; Cheng, S.; Hou, W.; Song, M.; Liu, X.; Liu, Y. Global 1 km × 1 km gridded revised real gross domestic product and electricity consumption during 1992–2019 based on calibrated nighttime light data. Sci. Data 2022, 9, 202. [Google Scholar] [CrossRef]
  30. Liu, L.; Cao, X.; Li, S.; Jie, N. A 31-year (1990–2020) global gridded population dataset generated by cluster analysis and statistical learning. Sci. Data 2024, 11, 124. [Google Scholar] [CrossRef]
  31. Sen, P.K. Estimates of the Regression Coefficient Based on Kendall’s Tau. J. Am. Stat. Assoc. 1968, 63, 1379–1389. [Google Scholar] [CrossRef]
  32. Fensholt, R.; Proud, S.R. Evaluation of Earth Observation based global long term vegetation trends—Comparing GIMMS and MODIS global NDVI time series. Remote Sens. Environ. 2012, 119, 131–147. [Google Scholar] [CrossRef]
  33. Yi, Y.; Hu, X.; Shi, M.C.; Kang, H.Z.; Wang, B.; Zhang, C.; Liu, C.J. Vegetation dynamics and its relationship with climate factors in the middle reaches of the Yangtze River Based on MODIS NDVI. Acta Ecol. Sin. 2021, 41, 7796–7807. [Google Scholar] [CrossRef]
  34. Burn, D.H.; Hag Elnur, M.A. Detection of hydrologic trends and variability. J. Hydrol. 2002, 255, 107–122. [Google Scholar] [CrossRef]
  35. Li, L.; Zhan, W.; Ju, W.; Peñuelas, J.; Zhu, Z.; Peng, S.; Zhu, X.; Liu, Z.; Zhou, Y.; Li, J.; et al. Competition between biogeochemical drivers and land-cover changes determines urban greening or browning. Remote Sens. Environ. 2023, 287, 113481. [Google Scholar] [CrossRef]
  36. Zhu, H.; Zeng, K.; Zhang, Y.; Zhang, S.; Wang, Y.; Zhao, C.; Zhang, J.; Liu, M. Evolution of vegetation dynamics and its responses to environmental factors and land cover change in Shanghai, China. Acta Ecol. Sin. 2025, 45, 898–910. [Google Scholar]
  37. Yi, D.; Guo, J.; Pueppke, S.G.; Han, Y.; Ding, G.; Ou, M.; Koomen, E. What dominates the variation of ecosystem services across different urban expansion patterns?—Evidence from the Yangtze River Delta region, China. Environ. Impact Assess. Rev. 2025, 110, 107674. [Google Scholar] [CrossRef]
  38. Marquardt, D.W. Generalized Inverses, Ridge Regression, Biased Linear Estimation, and Nonlinear Estimation. Technometrics 1970, 12, 591–612. [Google Scholar] [CrossRef]
  39. O’brien, R.M. A Caution Regarding Rules of Thumb for Variance Inflation Factors. Qual. Quant. 2007, 41, 673–690. [Google Scholar] [CrossRef]
  40. Breiman, L. Random forests. Mach. Learn. 2001, 45, 5–32. [Google Scholar] [CrossRef]
  41. Zhang, W.; Randall, M.; Jensen, M.B.; Brandt, M.; Wang, Q.; Fensholt, R. Socio-economic and climatic changes lead to contrasting global urban vegetation trends. Glob. Environ. Change 2021, 71, 102385. [Google Scholar] [CrossRef]
  42. Zhou, T.; Liu, H.; Gou, P.; Xu, N. Conflict or Coordination? measuring the relationships between urbanization and vegetation cover in China. Ecol. Indic. 2023, 147, 109993. [Google Scholar] [CrossRef]
  43. Gong, P.; Li, X.; Zhang, W. 40-Year (1978–2017) human settlement changes in China reflected by impervious surfaces from satellite remote sensing. Sci. Bull. 2019, 64, 756–763. [Google Scholar] [CrossRef]
  44. Yu, W.; Zhou, W.; Dawa, Z.; Wang, J.; Qian, Y.; Wang, W. Quantifying Urban Vegetation Dynamics from a Process Perspective Using Temporally Dense Landsat Imagery. Remote Sens. 2021, 13, 3217. [Google Scholar] [CrossRef]
  45. Feng, F.; Yang, X.; Jia, B.; Li, X.; Li, X.; Xu, C.; Wang, K. Variability of urban fractional vegetation cover and its driving factors in 328 cities in China. Sci. China Earth Sci. 2024, 54, 486–502. [Google Scholar] [CrossRef]
  46. Yang, K.; Sun, W.; Luo, Y.; Zhao, L. Impact of urban expansion on vegetation: The case of China (2000–2018). J. Environ. Manag. 2021, 291, 112598. [Google Scholar] [CrossRef] [PubMed]
  47. Du, H.; Zhan, W.; Zhou, B.; Ju, Y.; Liu, Z.; Middel, A.; Huang, K.; Zhao, L.; Chakraborty, T.C.; Wang, Z.; et al. Exacerbated heat stress induced by urban browning in the Global South. Nat. Cities 2025, 2, 157–169. [Google Scholar] [CrossRef]
  48. Wu, J.; Li, W.; Du, H.; Wan, Y.; Yang, S.; Xiao, Y. Nonlinear responses of coupled socioecological systems to land use and climate changes in the Yangtze river basin. Sci. Rep. 2025, 15, 6940. [Google Scholar] [CrossRef] [PubMed]
  49. Li, R.; Xu, Q.; Yu, J.; Chen, L.; Peng, Y. Multiscale assessment of the spatiotemporal coupling relationship between urbanization and ecosystem service value along an urban–rural gradient:A case study of the Yangtze River Delta urban agglomeration, China. Ecol. Indic. 2024, 160, 111864. [Google Scholar] [CrossRef]
  50. Wei, W.; Wang, N.; Yin, L.; Guo, S.; Bo, L. Spatio-temporal evolution characteristics and driving mechanisms of Urban–Agricultural–Ecological space in ecologically fragile areas: A case study of the upper reaches of the Yangtze River Economic Belt, China. Land Use Policy 2024, 145, 107282. [Google Scholar] [CrossRef]
  51. Cao, C.; Zhang, B.; Xia, F.; Bai, Y. Exploring VIIRS Night Light Long-Term Time Series with CNN/SI for Urban Change Detection and Aerosol Monitoring. Remote Sens. 2022, 14, 3126. [Google Scholar] [CrossRef]
  52. Liaw, A.; Wiener, M. Classification and Regression by RandomForest. Forest 2001, 23, 18–22. [Google Scholar]
  53. Huang, Y.; Wu, J. Spatial and temporal driving mechanisms of ecosystem service trade-off/synergy in national key urban agglomerations: A case study of the Yangtze River Delta urban agglomeration in China. Ecol. Indic. 2023, 154, 110800. [Google Scholar] [CrossRef]
  54. Zhang, K.; Jin, Y.; Li, D.; Wang, S.; Liu, W. Spatiotemporal variation and evolutionary analysis of the coupling coordination between urban social-economic development and ecological environments in the Yangtze River Delta cities. Sustain. Cities Soc. 2024, 111, 105561. [Google Scholar] [CrossRef]
  55. Todeschini, C.C.; Fett-Neto, A.G. Life at the Top: Extensive Green Roof Plant Species and Their Traits for Urban Use. Plants 2025, 14, 735. [Google Scholar] [CrossRef]
  56. Leppänen, P.-K.; Kinnunen, A.; Hautamäki, R.; Järvi, L.; Havu, M.; Junnila, S.; Tahvonen, O. Impact of changing urban typologies on residential vegetation and its climate-effects—A case study from Helsinki, Finland. Urban For. Urban Green. 2024, 96, 128343. [Google Scholar] [CrossRef]
  57. Ruzieva, M.; Ruziev, U. Assessing environmental problems: Primary indicators and their role in ecosystem management. E3S Web Conf. 2024, 587, 02012. [Google Scholar] [CrossRef]
  58. Mostafa, A.M.; Alshahrani, A. Humanizing sustainable development through green spaces: A case study of Saudi cities. Front. Sustain. Cities 2024, 6, 1416983. [Google Scholar] [CrossRef]
  59. Wong, C. A framework for ‘City Prosperity Index’: Linking indicators, analysis and policy. Habitat Int. 2015, 45, 3–9. [Google Scholar] [CrossRef]
  60. Xia, H.; Yuan, S.; Prishchepov, A.V. Spatial-temporal heterogeneity of ecosystem service interactions and their social-ecological drivers: Implications for spatial planning and management. Resour. Conserv. Recycl. 2023, 189, 106767. [Google Scholar] [CrossRef]
  61. Van de Voorde, T.; Vlaeminck, J.; Canters, F. Comparing Different Approaches for Mapping Urban Vegetation Cover from Landsat ETM+ Data: A Case Study on Brussels. Sensors 2008, 8, 3880–3902. [Google Scholar] [CrossRef]
  62. Cao, H.; Li, P.; Chen, J.; Chen, C.; Song, W. Spatiotemporal evolution of the rural-urban interface and its effects on ecological landscape structure and function: A case study of Nanjing, China. Ecol. Indic. 2024, 166, 112267. [Google Scholar] [CrossRef]
Figure 1. Regional overview of the Yangtze River Delta: Geographical location (a), urban-rural gradient division (b), and land use type (c) in 2020.
Remotesensing 17 02449 g001
Figure 2. Research framework and workflow of this study.
Remotesensing 17 02449 g002
Figure 3. Overall EVI characteristics in the YRD from 1990 to 2020. Spatial distribution of average EVI in Suzhou (a), Bozhou (b), and YRD (c). (d) EVI of different city categories. (e) EVI of different urban and rural gradients. The black solid line in the figure represents the mean value connection line across different city sizes or urban-rural gradients.
Remotesensing 17 02449 g003
Figure 4. Annual EVI changes in the YRD and different city categories from 1990 to 2020. Colored dashed lines represent the linear trends of EVI over time for the YRD and each city type. Asterisks denote the significance levels of the linear trends: p < 0.01 (**), p < 0.001 (***).
Remotesensing 17 02449 g004
Figure 5. EVI trend changes in the YRD from 1990 to 2020. (a) Vegetation trend derived from the MK-Sen method. (be) Evolution details around the urban cores of representative cities in different city categories (only showing regions with significant test results). (f) EVI slope for different urban-rural gradients across various city categories (calculated only for regions with significant test results). The black solid line in the figure represents the mean value connection line across different urban-rural gradients. (g) Cities with evolving differences (only showing gradients with significant differences).
Remotesensing 17 02449 g005
Figure 6. Vegetation dynamics in the YRD from 1990 to 2020. (a,b) Proportional area of different vegetation dynamic changes in each city and the average statistical results across different city categories. (c) Relative Browning Area Ratio (RBR) of urban gradients in each city category. (d) Relative Greening Area Ratio (RGR) of urban gradients in each city category. The black solid line in the figure represents the mean value connection line across different urban-rural gradients.
Remotesensing 17 02449 g006
Figure 7. The Vegetation Green-Brown Balance Index (VBI) calculation results of urban gradients in the YRD from 1990 to 2020. (a) Overall VBI in the YRD. VBI in Shanghai (b), Changzhou (c), Lishui (d), and Fuyang (e).
Remotesensing 17 02449 g007
Figure 8. Analysis of the relative importance (RI) of socio-ecological drivers of EVI slope in the YRD from 1990 to 2020.
Remotesensing 17 02449 g008
Table 1. Descriptions of the datasets used in this study.
Data TypeData NameSpatial
Resolution
YearUnitReference
Vegetation index dataAnnual maximum EVI30 m1990–2020(Zeng et al., 2024) [26]
Land cover dataChina Land Cover Dataset (CLCD)30 m1990, 2020(Yang & Huang, 2021) [24]
Urban boundaryGlobal Urban Boundary (GUB)1990, 2000, 2010, 2020(Li et al., 2020) [25]
Urban populationUrbanization rate (UR)2021%China Statistical Yearbook (2021)
Natural ecological driversInitial EVI (EVI1990)30 m1990(Zeng et al., 2024) [26]
Digital Elevation
Model (DEM)
30 m2015mNational Earth System Science Data Center, National science & Technology Infrastructure of China (http://www.geodata.cn, accessed on 1 August 2024)
Precipitation (PRE)1 km1990–20200.1 mm(Peng et al., 2019) [27]
Temperature (TEM)1 km1990–20200.1 °C(Peng et al., 2019) [27]
Socioeconomic driversNight-time light (NTL)1 km1992–2020(Wu et al., 2022) [28]
Real Gross Domestic Product (GDP)1 km1992–2019millions of 2017 US dollars(Chen et al., 2022) [29]
Population density (POP)1 km1990–2020People/km2(Liu et al., 2024) [30]
Table 2. Vegetation evolution pattern recognition in 41 cities of the YRD.
ModesUCRACity Names
Dual Greening (26/41)VBI > 0VBI > 0Anqing, Bengbu, Chizhou, Chuzhou, Hangzhou, Huaian, Huainan, Huangshan, Huzhou, Jinhua, Lianyungang, Maanshan, Nanjing, Ningbo, Quzhou, Shanghai, Shaoxing, Suqian, Taizhou, Tongling, Wuhu, Wuxi, Xuancheng, Yancheng, Yangzhou, Zhoushan
Core Greening (5/41)VBI > 0VBI < 0Changzhou, Jiaxing, Nantong, Suzhou, Zhenjiang.
Rural greening (8/41)VBI < 0VBI > 0Bozhou, Hefei, Huaibei, Lishui, Luan, Suuzhou, Wenzhou, Xuzhou
Total Browning (2/41)VBI < 0VBI < 0Fuyang, Taiizhou
Disclaimer/Publisher’s Note: The statements, opinions and data contained in all publications are solely those of the individual author(s) and contributor(s) and not of MDPI and/or the editor(s). MDPI and/or the editor(s) disclaim responsibility for any injury to people or property resulting from any ideas, methods, instructions or products referred to in the content.

