Abstract
In a multi-point source system, increasing the jamming power can expand the distribution area of the equivalent radiation center, but significantly increases the system exposure risk. Therefore, in order to achieve an optimal balance between the two, this paper proposes a joint optimization method for jamming power and an array of multi-point source systems. First, based on determining the spatial geometric relationship between the triplet antenna and the target, the distribution law of the equivalent radiation center of the triplet antenna under the condition of the target echo is derived. Second, by introducing the angle factor, the jamming power and equivalent radiation center distribution area are combined to construct the joint optimization model of jamming power and array in omnidirectional and non-omnidirectional situations. Third, based on the non-dominated sorting whale optimization algorithm (NSWOA), an adaptive inertia weight based on the cosine function and logistic chaotic map is introduced to obtain the optimal arrangement. The experimental results show that in the omnidirectional case, when the average jamming-to-signal ratio is 13.83 dB, the equilateral triangle array can achieve the goal of protecting the target while avoiding the exposure of the triplet antenna position. In the non-omnidirectional case, when the average jamming-to-signal ratio is 13.90 dB, the equilateral triangle array can achieve the optimal balance between the jamming power and the area of the distribution area of the equivalent radiation center, and control the distribution of the equivalent radiation center to strictly meet the preset angular domain constraints. Furthermore, the optimal JSR value was reduced by an average of 1.14 dB compared with that of the conventional selection scheme.
1. Introduction
With the rapid development of modern radar technology, jamming technology in electronic countermeasure systems faces increasingly complex challenges [1,2,3,4,5,6,7,8,9,10,11]. As an effective means of electronic countermeasures, a multi-point source system can significantly improve the jamming effect on an enemy radar system through the synergy of multiple jamming sources [12,13,14,15,16,17,18,19,20,21]. At the same time, the jamming effect of the multi-point source system is related to the jamming power and layout of the jamming source. A reasonable layout and suitable jamming power can effectively expand the distribution area of the equivalent radiation center, thereby improving the target protection capability [22,23,24,25,26]. However, a jamming power that is too high will expose the multi-point source system. A lower jamming power will reduce the distribution area of the equivalent radiation center of the multi-point source, and the ability to protect the target is limited.
Therefore, with respect to the design of a multi-point source system, how to achieve the optimal trade-off between the jamming power and the area of the equivalent radiation center distribution area has become a key problem to be solved [27,28,29,30]. Existing research mainly focuses on optimizing jamming effectiveness but generally ignores the balance between power and protection area. Zhang et al. [31] constructed an array optimization model with a single objective of suppression effect, but did not consider the exposure risk caused by high-power radiation. Similarly, the coherent interference optimization method proposed by Gao et al. [32] only considers the maximization of the interference-to-signal ratio as the optimization objective. Wang et al. [33] pointed out that the optimization of a single performance index will lead to an increase in system exposure probability. Although Andrew Herschfelt et al. [34] considered the power constraint, they only used it as a constraint rather than an optimization objective. Suji Naduvilpattu et al. [35] use power as a hard constraint, resulting in a decrease in interference efficiency in complex environments. The distributed interference method proposed by Xi et al. [36] pursues the maximization of the interference area but ignores the power efficiency problem. Although the latest work of Shubham Acharya et al. [37] introduced the regional coverage index, it has not yet been associated with the power factor. Although the distributed interference method proposed by Zhao et al. [38] improved regional expansion, power efficiency decreased. These traditional methods mostly adopt a single-objective optimization strategy. Although jamming is realized, the multi-point source system is exposed at the same time, and it is difficult to achieve an optimal balance between the jamming power and the distribution area of the equivalent radiation center.
To address the above problems, this paper proposes a joint optimization method for the jamming power and array of a multi-point source system. The main work is divided into three parts: (1) The spatial geometric relationship between the triplet antenna and the target is determined, and the distribution law of the equivalent radiation center of the triplet antenna under the target echo condition is derived. (2) By introducing the angle factor, the jamming power and the equivalent radiation center distribution area are combined to construct a joint optimization model of jamming power and array in omnidirectional and non-omnidirectional situations. (3) Based on the non-dominated sorting whale optimization algorithm (NSWOA), a non-dominated sorting cosine mapping strategy whale optimization algorithm (NSCWOA) is proposed to obtain the optimal array and jamming power by introducing the adaptive inertia weight based on the cosine function and logistic chaotic mapping. The simulation results show that the equilateral triangle array is the best way to achieve the best balance between the jamming power and the area of the equivalent radiation center distribution area, and the corresponding optimal jamming signal ratio is 13.87 dB in the omnidirectional case. In the non-omnidirectional case, the corresponding optimal jamming signal ratio is 13.90 dB. The optimal JSR value was reduced by an average of 1.14 dB compared with that of the conventional selection scheme. Furthermore, the NSCWOA algorithm is compared with the NSWOA, MOMVO, NSGA-II, MOEDO, and MOPKO algorithms in two scenarios and evaluated using two indicators of distribution uniformity and convergence speed, verifying the excellent performance of the proposed algorithm in terms of solution set distribution and convergence performance.
To summarize, the paper’s contributions are outlined as follows:
- (1)
- Establishment of the spatial geometric relationship between the triplet antenna and the target and derivation of the distribution law of the equivalent radiation center of the triplet antenna under the condition of the target echo.
- (2)
- Construction of the angle factor and modeling of a joint optimization model of jamming power and array.
- (3)
- Incorporation of an adaptive inertia weight based on the cosine function and logistic chaos mapping, and proposition of a non-dominated sorting cosine mapping strategy, whale optimization algorithm.
The remainder of this paper is organized as follows. Section 2 first determines the spatial geometry of the triplet antenna and target, and then derives the distribution law of the equivalent radiation center of the triplet antenna under the condition of the target echo. Subsequently, a joint optimization model of jamming power and array is constructed, and the NSCWOA algorithm is introduced. In Section 3, the simulation results are presented, and the optimal arrays in omnidirectional and non-omnidirectional situations are obtained. In Section 4, the proposed algorithm is compared with five classical algorithms to verify its effectiveness of the proposed algorithm. Finally, this paper is summarized in Section 5.
2. Materials and Methods
In this section, the spatial geometry of the triplet antenna and target is first determined, and then the distribution law of the equivalent radiation center of the triplet antenna under the condition of the target echo is derived according to the principle of multivariate vector synthesis. Then, by introducing the angle factor, the jamming power and the area of the equivalent radiation center distribution are combined to construct a joint optimization model of jamming power and the array. Finally, by introducing the adaptive variable inertia weight based on the cosine function and logistic chaotic map, the NSCWOA algorithm was proposed.
2.1. The Geometry of Multi-Point Source System
First, the spatial geometric configuration of the triplet antenna and the target is determined [39], as shown in Figure 1. Without loss of generality, monopulse radar P is used as the origin of the coordinate system, and line OP between radar P and target O is defined as the X-axis. In the plane of the triplet antenna and the target, the vertical line of the OP is taken as the Y axis, and the direction of the Z axis is further determined according to the right-hand rule. The angle between the line OP and the target plane is denoted as . The triplet antenna A, B, and C form a triangular layout, and their spatial coordinates are expressed as , , and . The coordinates of the target are defined as .
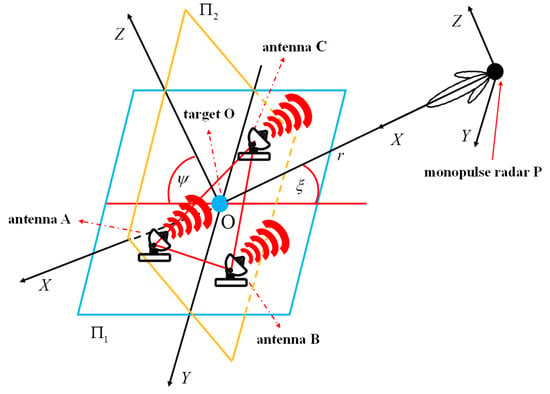
Figure 1.
The spatial geometry diagram of multi-point source system.
In order to facilitate the construction and analysis of the subsequent model, the triplet antenna needs to be projected onto the vertical plane of the connecting OP, that is, the plane . Specifically, the projection transformation can be realized by rotating the plane around the Y axis clockwise angle , . After the projection, the new coordinates of the triple antenna A, B and C on the plane can be calculated by Equation (1). In practical applications, if the angle between the line OP and the plane is known, the spatial arraying method on the plane can be restored to the original plane by using the inverse transformation of Equation (1).
In order to facilitate the derivation of the multivariate vector synthesis equation, a spherical coordinate system is established with the monopulse radar P as the center of the sphere. In this coordinate system, the definition of azimuth is based on the XOY plane, with P as the center, the distance between the plane and P as the radius, and the direction is determined along a directional circular arc. The definition of the pitch angle is based on the XOZ plane, with P as the center, the distance between the plane and P as the radius, and the direction is determined along a directed arc, as shown in Figure 2. Among them, A2, B2, and C2 are the projection points of the triple antenna A, B, and C on the plane , respectively, and the baseline lengths between A2, B2, and C2 are recorded as , and , respectively. Based on Equation (2), the rectangular coordinates of A2, B2, C2, and target O can be transformed into the representation in the spherical coordinate system.
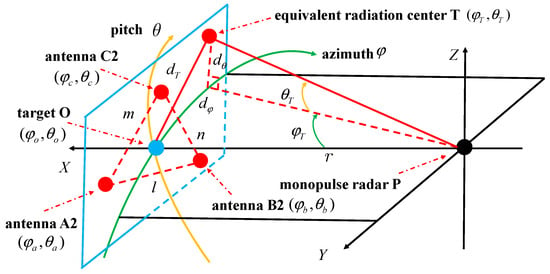
Figure 2.
The Spherical coordinate system of multi-point source system.
The equivalent radiation center in Figure 2 is the position of the target radiation source deduced by analyzing the normal direction of the distorted phase plane after the radar receives the triplet antenna and target echoes. However, since there is no actual radiation source at this position, the equivalent radiation center can be regarded as a radar apparent false target. In addition, since the distance between the monopulse radar and the target is much larger than the actual distance between the equivalent radiation center and the target, the azimuth component and the pitch component of the actual distance between the equivalent radiation center and the target can be calculated by Equation (3).
Next, the coordinates of the triple-equivalent radiation center are derived according to the principle of multivariate vector synthesis. The transformation relationship between the spherical and rectangular coordinate systems defined in this paper is as follows:
Thus, the expression of the vector can be written:
Then the unit vectors and expression are solved as follows:
Based on the transformation relationship between the spherical coordinate system and the rectangular coordinate system, the vectors and can be described by unit vectors , , . Therefore, the electric field [40] and magnetic field components at the center of sphere P can be expressed as
where is the signal amplitude reaching the center of the ball P, is the signal phase reaching the center of the ball; is the space wave impedance.
Because the distance between the radar and the plane is far, the following approximate relationship can be obtained:
The average energy flux density of the center of the sphere P in the three directions of vector , and can be obtained by combining Equations (7) and (8), and according to the average Poynting vector calculation equation:
Among them, ; i = 1, 2, 3, 4 respectively represent a, b, c, and o; , and are the phase differences of antenna B2, antenna C2, and target O relative to antenna A2, respectively.
Then, according to Equation (10), the components in the three directions in the rectangular coordinate system are converted back to the spherical coordinate system to obtain the position coordinates of the equivalent radiation center.
2.2. The Power-Array Joint Optimization Model
In practical application scenarios, the phase of the target echo is unpredictable, so it is assumed that the phase obeys a uniform distribution in the interval . Under these conditions, the coordinates of the equivalent radiation center described by Equations (9) and (10) are no longer fixed values but are determined by the specific value of the target echo phase. According to the simulation analysis results of the relevant reference [12], the median change trend of the equivalent radiation center is gentler than its maximum and minimum values, showing high stability. Therefore, this paper uses the median of the equivalent radiation center as the estimated value of its coordinates.
where , and are the amplitude ratio ; The jamming signal ratio (JSR) is defined as the square of the ratio of the signal amplitude from antenna A2 to the amplitude of the target echo signal: .
In order to combine the jamming power and the area of the equivalent radiation center distribution area, the angle factor is introduced in this section. The angle factor is defined as the ratio of the jamming deception angle of the equivalent radiation center to the maximum angle of the triplet antenna relative to the radar, as shown in Equation (12).
The trend of the angle factor change with JSR under different parameters is analyzed via simulation. The results are shown in Figure 3 without loss of generality. The triple array in Figure 3 is any triangle, and the coordinates of each antenna are taken as an example of Equation (13). Each curve in Figure 3a is the result of each parameter in the legend under the condition of = 0.5 dB and = 115°. The curves in Figure 3b are the results of each parameter in the legend under the condition of = 0.5 dB and = 115°.
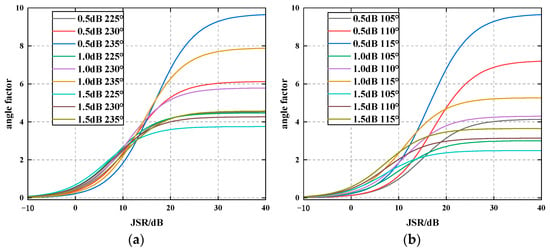
Figure 3.
The relationship between the angle factor of the triple and JSR under different parameters: (a) = 0.5 dB and = 115°; (b) = 0.5 dB and = 115°.
It can be seen from the simulation results that the angle factor of the triples increases monotonically with the increase of JSR. This phenomenon occurs because, with an increase in JSR, the proportion of the signal transmitted by the triplet antenna in the total echo gradually increases, which has a stronger jamming effect on the radar. When the JSR reaches 10 dB, the amplitude of the angle factor of the triple exceeds 1, indicating that the false target position generated by the triple exceeds the internal range of its triangle. In addition, when the JSR increases to 30 dB, the amplitude of the angle factor is close to saturation. Therefore, in order to achieve the effectiveness of triplet antenna jamming, the optimal value range of the JSR should be between 10 dB and 30 dB.
To better construct the mathematical expression of the joint optimization model, the distribution shape of the equivalent radiation center is illustrated in Figure 4a. Based on Equations (7) and (8), the amplitude of the triplet antenna is normalized to 1, with amplitude values ranging in the interval (0, 1) at 0.1 intervals and phase values in the interval (0, 2π) at fixed steps of 0.1π. The JSR is set to 30 dB, and the phase of target O is randomly generated within (0, 2π). Through 100 simulation experiments, the median distribution of the triplet antenna equivalent radiation center is calculated, yielding the complete plane distribution map shown in Figure 4a. The abscissa in the figure represents the ratio of the azimuth component of the equivalent radiation center to the actual distance of the target to the length of the triplet antenna baseline. The ordinate represents the ratio of the pitch component of the actual distance between the equivalent radiation center and the target to the length of the triplet antenna baseline.
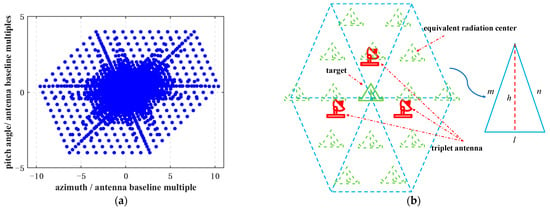
Figure 4.
The distribution of equivalent radiation center and the schematic diagram of the joint optimization model of jamming power and array in omnidirectional case: (a) The distribution of equivalent radiation center; (b) The schematic diagram of the joint optimization model of jamming power and array.
The simulation results show that when the JSR is 30 dB, the distribution of the equivalent radiation center presents a hexagonal geometric feature. The equivalent radiation center is distributed in the omnidirectional angle centered on the target; therefore, the equivalent radiation center in this case is distributed omnidirectionally. In addition, the ratio of the side length of each central triangle (a triangle formed by connecting the center point of the hexagon to each vertex) in the hexagon to the baseline length of the triple is highly consistent with the uppermost curve shown in Figure 3. This result verifies the accuracy of the theoretical equation and provides an intuitive explanation for the spatial distribution characteristics of the equivalent radiation center.
In an actual environment, enemy monopulse radars often attack from a specific direction; therefore, it is of great practical value to study the array under non-omnidirectional conditions. The amplitude of an antenna in the triplet antenna is controlled to be the maximum value, and the specific setting is the amplitude of antenna C2. At the same time, the remaining parameters are consistent with the omnidirectional case, and the plane distribution diagram of the equivalent radiation center of the triplet antenna in the non-omnidirectional case is obtained, as shown in Figure 5a. It should be noted that this paper takes antenna C2 as an example for analysis; however, if the amplitude of any antenna is fixed to be the largest (the amplitude is 1), the simulation effect is consistent with the setting result of antenna C2. This result shows that the influence of maximizing the amplitude of a single antenna on the distribution of equivalent radiation centers is universal and is not related to the specific selected antenna.
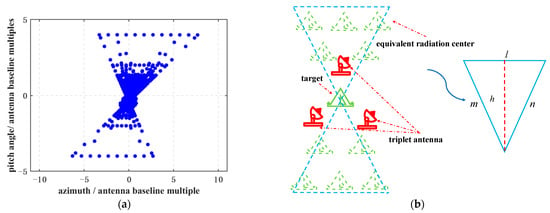
Figure 5.
The distribution of equivalent radiation center and the schematic diagram of the joint optimization model of jamming power and array in non-omnidirectional case: (a) The distribution of equivalent radiation center; (b) The schematic diagram of the joint optimization model of jamming power and array.
The simulation results show that when the JSR is 30 dB, the distribution of the equivalent radiation center exhibits a triangular geometric feature. The equivalent radiation center is distributed at a partial angle centered on the target; therefore, the equivalent radiation center in this case is a non-omnidirectional distribution. In addition, the proportional relationship between the side length of the triangle and the triple baseline length is highly consistent with the top curve shown in Figure 3.
- (a)
- The joint optimization model of jamming power and array in the omnidirectional case
Based on the above analysis, under the condition of a target echo, the optimization design of the triplet antenna space array model must comprehensively consider key parameters, such as the array mode (e.g., right triangle, isosceles triangle), baseline length, and JSR, to achieve the dual optimization goal. First, by optimizing the array parameters, the distribution area of the equivalent radiation center of the triplet antenna is maximized to improve the protection ability of the target. Second, by reasonably controlling the JSR, the intensity of the triplet antenna radiation signal is reduced to avoid exposing its own position due to a signal that is too strong. This optimization strategy effectively balances the trade-off between the jamming power and distribution area of the equivalent radiation center while ensuring the safety of the target. As shown in Figure 4b, a schematic of the joint optimization model indicates that the equivalent radiation center generated by the triplet antenna in the presence of the target echo is hexagonal. The shape of the hexagon is related to the array, and its size is related to the JSR. This is consistent with the result in Figure 4a, and the corresponding mathematical model is as follows:
where , , , are the trilateral lengths of the triples; is the maximum baseline length between the triples; is the jamming-to-signal ratio.
- (b)
- The joint optimization model of jamming power and array in the non-omnidirectional case
For the non-omnidirectional case, this section proposes an array model to realize the effective constraint of the equivalent radiation center distribution area within a specific angle range. Therefore, the spatial array model under non-omnidirectional conditions must introduce angle constraints based on the omnidirectional model to optimize the directivity of the jamming effect. As shown in Figure 5b (the meaning of Figure 5b is similar to that of Figure 4b, with the difference being that it is non-omnidirectional), the corresponding mathematical model is
where is the maximum angle of the distribution area of the equivalent radiation center in the non-omnidirectional case.
For the above-mentioned multiple objective functions with constraints, the multi-objective optimization algorithm can provide a good solution.
2.3. Non-Dominated Sorting Whale Optimization with Cosine Mapping Strategy
For the multi-objective optimization problems shown in Equations (14) and (15), there is no single optimal solution; only the optimal solution set, that is, the Pareto solution set. NSWOA is a classical multi-objective optimization algorithm that combines the search ability of WOA and the hierarchical strategy of multi-objective optimization [41]. The algorithm first initializes the parameters and generates the initial population, then calculates the objective function value of the individual and performs non-dominated sorting to assign a dominance level to each individual. Then, the offspring population was generated by simulating the predation behavior of whales (including surrounding prey, foam-net predation, and random search), and the offspring were merged with the existing population. Then, the merged population is subjected to non-dominated sorting and crowding distance calculation, and the top-ranked individuals are selected as the next-generation population. Finally, we check whether the algorithm satisfies the termination condition. If the maximum number of iterations is not reached, the above process is repeated until the optimal solution is found and the algorithm is terminated.
In the NSWOA, the population individuals are usually randomly initialized, resulting in an uneven distribution of individuals, thereby reducing the search efficiency of the algorithm and increasing the risk of falling into a local optimum. In the model used in this paper, the uneven distribution of individuals leads to the uneven distribution of the Pareto solution set output by the algorithm, so that the final selected JSR value is high. In order to solve this problem, this section introduces logistic mapping to initialize the population to ensure that the individual distribution is more uniform [42,43]. Its expression is as follows:
where , when , the Logistic chaotic map has chaotic characteristics. However, the pseudo-random sequence generated by logistic mapping is densely distributed at both ends, which affects the overall uniformity. In order to enhance the chaotic effect, this paper uses a dual logistic map for initialization: first, the whale position information is generated by the first logistic map, and then the second logistic map is performed on this basis, thereby significantly improving the uniformity of population distribution.
In the NSWOA algorithm, selecting the appropriate inertia weight can enhance the optimization ability and improve the optimization speed of the algorithm [44]. In this section, an adaptive inertia weight based on the cosine function is selected, as shown in Equation (17):
where denotes the current number of iterations; represents a random number uniformly distributed in (0, 1); represents the maximum number of iterations.
The adaptive weight increases with the number of iterations. The weight is small in the early stage of the algorithm, which has little effect on the location update, but the change speed is high. In the later stage of the algorithm, the value is larger, and the larger weight accelerates the speed of the whale position movement and guides the algorithm to quickly find the target solution, thereby improving the optimization performance of the algorithm.
Therefore, the NSCWOA algorithm is proposed by combining chaotic mapping and adaptive weights to solve the joint optimization model. The specific steps are as follows:
(1) Initialize the whale population parameters, set the population size to N, set the maximum number of iterations to , and use two Logistic chaotic maps to initialize the baseline length and JSR of the triples to obtain the initial population , and ;
(2) Calculate the objective function value for each whale individual under omni-directional or non-omni-directional conditions according to Equation (14) or Equation (15), respectively, which corresponds to the JSR value and the control area for each whale individual .
(3) Sort the population based on the non-dominated sorting principle to obtain the Pareto front set , where each front represents a cluster of relationship points between JSR values and control area sizes.
(4) Calculate the crowding distance for each individual in every front .
(5) Select the first N individuals from the front set as the parent population .
(6) Execute the three-stage operations of surrounding prey, bubble net feeding, and random searching for each whale individual in the parent population to generate the offspring population .
Generate a random probability and a distance adjustment parameter , and produce offspring populations under different circumstances.
- ✧
- If and , the offspring population is generated by the surrounding prey operation, as shown in Equation (18):
- ✧
- If and , the offspring population is generated by the random search operation, as shown in Equation (19):
- ✧
- If , the offspring population is generated by the bubble net feeding operation, as shown in Equation (20):
Add to the offspring population .
(7) Merge the offspring population with the parent population .
(8) Perform non-dominated sorting and crowding distance calculation on , and then select the top N individuals from as the next generation population .
(9) Determine the termination condition of the algorithm; if the maximum number of iterations has not been reached, proceed to step (3); otherwise, terminate the algorithm and output the relationship curve between JSR and the control area.
Among them, is the optimal position of the current whale; and are the distance adjustment parameters; the convergence factor decreases linearly from 2 to 0 with the increase of the number of iterations. is a constant in the restricted logarithmic spiral form; denotes the random number of (−1, 1); denotes the random number of (0, 1); represents a new offspring individual; denotes the randomly selected whale position vector.
Furthermore, to better demonstrate the solution approach for the balance problem between power and array, a specific schematic diagram is provided, as shown in Figure 6 (take the omnidirectional case as an example). And the pseudo-code of the NSCWOA algorithm is given in Algorithm 1.
| Algorithm 1: NSCWOA algorithm |
| Input: Objective function: , ; population size: ; maximum number of iterations: Output: Pareto optimal solution set: |
| 1. Logistic chaotic map initializes population: , and 2. Calculate the objective function value: 3. Initialize the iterative counter: 4. while do 5. Sort the population based on the non-dominated sorting principle to obtain the Pareto front set: 6. Calculate the crowding distance for each individual in every front 7. Select the first N individuals from the front set as the parent population 8. Generate offspring population: 9. for each in do 10. Execute the three-stage operations 11. Add to 12. end 13. Merged populations: 14. Non-dominated sorting and congestion calculation are performed on . 15. The first N individuals are selected from as the next generation population 16. Update the iterative counter: 17. end 18. return a Pareto optimal solution set |
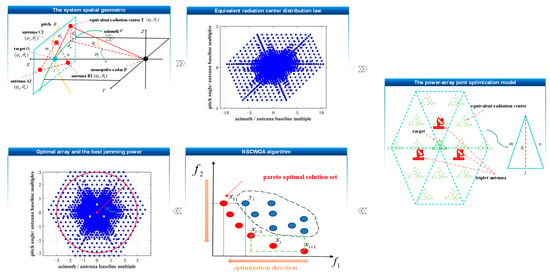
Figure 6.
The solution approach diagram for the balance problem between power and array.
3. Simulation Results and Analysis
3.1. Simulation Experiment Parameters
The parameters involved in all the simulation experiments in this paper are as follows: the maximum baseline length is 0.2 km; the upper boundaries of the algorithm inputs m, n, and l are all 0.2 km, and the lower boundaries are 0 km. The upper boundary of JSR is 30 dB, and the lower boundary is 10 dB; the maximum constraint angle is 90°. The population size of the optimization algorithm is 80, and the maximum number of iterations is 200.
In addition, in the absence of a target echo, a scenario is set in which a triple antenna system is used to deceive the adversary’s monopulse radar. Conversely, when the target echo is present, the scenario is configured such that both the triple antenna system and the target (positioned at the center of the triple antennas) collaborate to deceive the monopulse radar. The number of adversary monopulse radars is set to one, with its initial pointing direction aligned to the center of the triple antenna system.
3.2. Solution of Joint Optimization Model in Omnidirectional Case
From the perspective of triple parameter tolerance, this section finally chooses the relationship curve of = 0.5 dB, = 115°, = 0.5 dB, = 235° as the optimization basis. The NSCWOA algorithm is then used to solve the mathematical model in Equation (14). Through algorithm optimization, the relationship curve between the JSR and control area in the omnidirectional case is obtained, as shown in Figure 7a. It can be seen that as the JSR decreases, the protected area gradually reduces, indicating the contradictory relationship between the two.
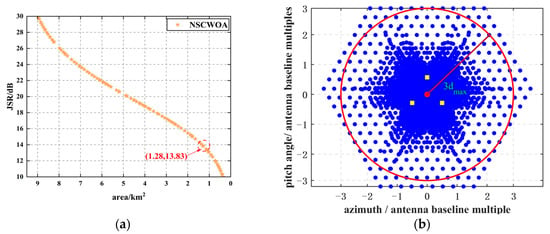
Figure 7.
The equivalent radiation center distribution corresponding to the relationship curve and the equilibrium point in the omnidirectional case: (a) The relationship curve between JSR and the area of control area; (b) The equivalent radiation center distribution corresponding to the key equilibrium point.
The curve is the Pareto optimal solution set solved by the NSCWOA algorithm, and the baseline length corresponding to each solution in the curve is [0.2, 0.2, 0.2]; that is, an equilateral triangle array is adopted. Based on the principle of the protection radius of the triple baseline length, this section selects a key equilibrium point from the Pareto curve. The area of the control area corresponding to this point is 1.28 km2, and the radius of the inscribed circle is 0.61 km, which is about three times the length of the triple baseline, as shown in Figure 7b. It can be observed that when the triplet antenna arrangement is an equilateral triangle and the JSR is 13.83 dB, the shape of the equivalent radiation center is a regular hexagram, and the radius of its inscribed circle is three times the baseline length of the triplet. In addition, the JSR value corresponding to the equilibrium point is 13.83 dB. This optimization result can not only effectively guarantee the full protection of the target, but also avoid the risk of exposure of the triplet antenna position due to the high JSR, and realize the optimal balance between the jamming power and the area of the equivalent radiation center distribution area.
3.3. Solution of Joint Optimization Model in Non-Omnidirectional Case
The NSCWOA algorithm is used to solve the mathematical model in Equation (15), and the relationship curve between JSR and the area of the control area in the non-omnidirectional case is obtained, as shown in Figure 8a. The meaning of Figure 8a is similar to that of Figure 8a. The curve shows the Pareto frontier solution set generated by this algorithm. All solutions adopt the baseline configuration parameters of [0.2, 0.2, 0.2], corresponding to an equilateral triangle array, and the equivalent radiation center distribution strictly satisfied the preset angular domain constraints. According to the protection radius criterion of three times the baseline length, the key equilibrium point is selected from the Pareto frontier using multi-objective decision analysis. The corresponding control area is 0.21 km2, and the radius of the inscribed circle is 0.60 km, which is exactly three times the baseline length, as shown in Figure 8b. The meaning of Figure 8b is similar to that of Figure 7b, with the difference that it is non-omnidirectional.
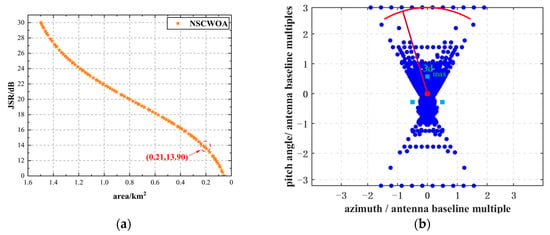
Figure 8.
The equivalent radiation center distribution corresponding to the relationship curve and the equilibrium point in the non-omnidirectional case: (a) The relationship curve between JSR and the area of control area; (b) The equivalent radiation center distribution corresponding to the key equilibrium point.
The equilibrium point synchronously realizes the optimal configuration with a JSR value of 13.90 dB, which not only ensures the safety of the target, but also effectively avoids the risk of radiation source location exposure caused by a high JSR, and achieves the optimal balance between the jamming power and the area of the equivalent radiation center distribution area.
4. Discussion
To further validate the performance advantages of the NSCWOA algorithm in terms of solution set distribution uniformity and convergence speed, it is compared with three classic multi-objective optimization algorithms: NSWOA, multi-objective metaverse optimization algorithm (MOMVO) [45], non-dominated sorting genetic algorithm II (NSGA-II) [46], multi-objective exponential distribution optimizer (MOEDO) [47], and multi-objective pied kingfisher optimizer (MOPKO) [48]. The evaluation is carried out using metrics such as spatial measurement, optimal JSR, and average running time. Each algorithm is run independently 100 times.
4.1. The Distribution Uniformity of Solution Set
In this section, the spatial metric and its standard deviation, and the best JSR under similar protection conditions, are used to evaluate the uniformity of the solution set distribution of each algorithm. The smaller the value of the spatial measure, the better the coverage completeness and distribution uniformity of the non-dominated solution in the target space [46]. The average performance comparison of each algorithm in the omnidirectional and non-omnidirectional cases is shown in Figure 9 and Figure 10, respectively. The detailed comparison results of the spatial metrics are shown in Figure 11. The specific experimental data are shown in Table 1.
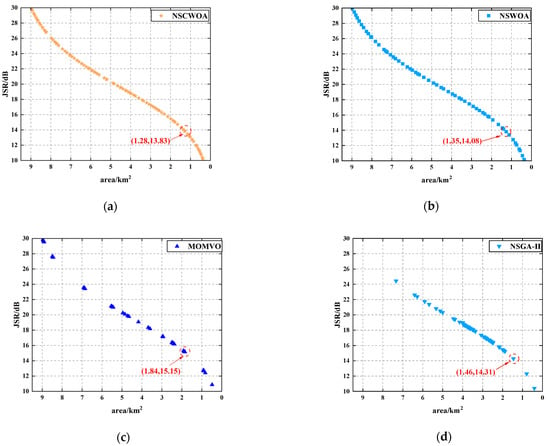
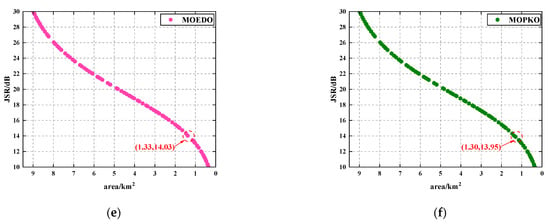
Figure 9.
The comparison of the relationship curves between JSR and control area solved by various algorithms in the omnidirectional case: (a) NSCWOA; (b) NSWOA; (c) MOMVO; (d) NSGA-II; (e) MOEDO; (f) MOPKO.
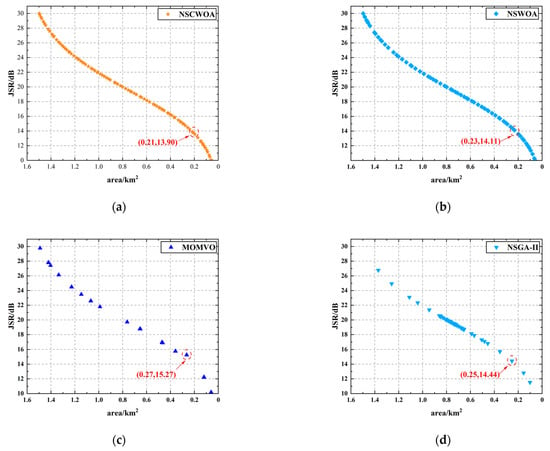
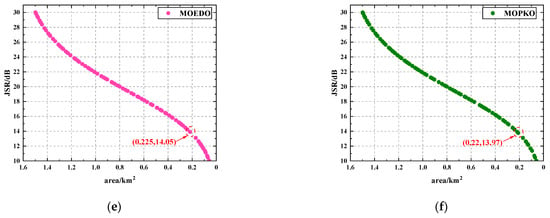
Figure 10.
The comparison of the relationship curves between JSR and control area solved by various algorithms in the non-omnidirectional case: (a) NSCWOA; (b) NSWOA; (c) MOMVO; (d) NSGA-II; (e) MOEDO; (f) MOPKO.
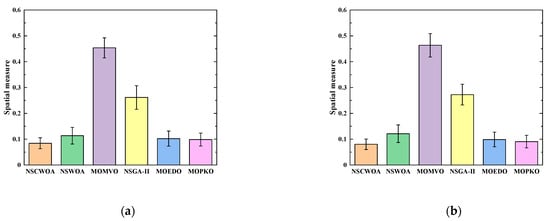
Figure 11.
The spatial measure of various algorithms: (a) In the omnidirectional case; (b) In the non-omnidirectional case.

Table 1.
The spatial measure and optimal JSR of various algorithms in two scenarios.
The experimental results show that the NSCWOA algorithm has significant advantages in multiple performance indicators, such as spatial metrics and their standard deviations, and the best JSR under similar protection conditions. As shown in Table 1, the spatial metric of the NSCWOA algorithm is significantly lower than that of the other algorithms, indicating that the non-dominated solutions generated by NSCWOA are more evenly and widely distributed in the target space, which can fully cover all regions of the Pareto front and provide a variety of optimal solution sets. In particular, under the constraint of the equivalent protection radius (the radius of the inscribed circle is three times the length of the baseline), the JSR value output by the NSCWOA algorithm is the smallest compared with the comparison algorithm, which shows that the NSCWOA algorithm can provide JSR selection with higher accuracy and better performance.
In general, the NSCWOA algorithm achieved a significant improvement in the uniformity of the solution set distribution. The specific performance is as follows: the distribution uniformity of the Pareto solution set increased by 41.41% in the omnidirectional case and 43.42% in the non-omnidirectional case, and the JSR value is the smallest under the condition of a similar control area. These experimental results fully verify the significant advantages of the NSCWOA in terms of the uniformity of the solution set distribution.
4.2. The Convergence Speed of Each Algorithm
In this section, the average running time and its standard deviation are used to evaluate the convergence speed of each algorithm. The detailed comparison results of the average running time are shown in Figure 12, and the specific experimental data are shown in Table 2. The simulation experiment uses the Windows 11 (64 bit) operating system. The hardware platform parameters are as follows: Intel (R) Core (TM) i9-13900 K CPU, 3.00 GHz main frequency, and 16 GB memory. The computing environment is MATLAB R2024 a.
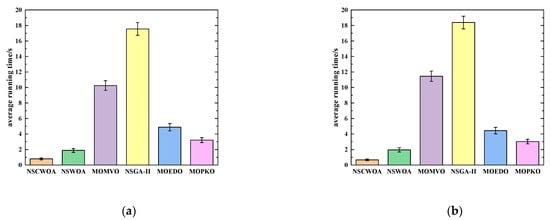
Figure 12.
The average running time comparison of various algorithms: (a) In the omnidirectional case; (b) In the non-omnidirectional case.

Table 2.
The average running time of various algorithms in two scenarios.
Experimental data analysis shows that the NSCWOA algorithm has significant performance advantages in terms of computational efficiency. As shown in Table 2, the average operating efficiency of the NSCWOA algorithm is 80.97% and 83.75% higher than that of the comparison algorithm in omnidirectional and non-omnidirectional situations, respectively, which fully verifies its applicability in real-time optimization scenarios.
Based on the in-depth analysis of the above experimental results, the following conclusions can be drawn: The NSCWOA algorithm can effectively determine the optimal equilibrium point between the jamming power and the area of the equivalent radiation center distribution under omnidirectional and non-omnidirectional conditions. In the omnidirectional scene, when the JSR is 13.83 dB, the equilateral triangle array can fully protect the target and avoid the risk of triplet antenna position exposure due to the high JSR. In the non-omnidirectional scenario, when the JSR is 13.90 dB, the equilateral triangle array also achieves the best balance between the jamming power and the area of the equivalent radiation center distribution area. In addition, by introducing logistic chaotic mapping and an adaptive inertia weight mechanism, the NSCWOA algorithm shows significant advantages in a number of key performance indicators: the distribution uniformity of the Pareto solution set is improved by 42.42% on average compared with the comparison algorithm, which provides a more diversified optimization solution set. The average running efficiency is 82.36% higher than that of the comparison algorithm, which fully reflects its high efficiency in real-time optimization tasks. At the same time, the algorithm can provide JSR selection with higher accuracy and better performance. These results fully verify the superiority of the GWOA in terms of overall performance.
4.3. The Influence of Power and Array Parameters
This section deeply explores the influence of power and array parameters on system performance in the form of tables and conducts a comprehensive assessment of system security and risks. First, the impact of power on the system is analyzed, as shown in Table 3. With an increase in power, the coverage area of the equivalent radiation center also increases, indicating that the protection area is correspondingly expanded, thereby enhancing the system’s protection capability for targets. However, an excessively high JSR causes the triple antenna to be too prominent in the monopulse radar, increasing the risk of system exposure. According to the research results in [13], when the JSR exceeds 15 dB, the risk of system exposure increases sharply. Therefore, in order to ensure that the system can effectively jam while avoiding unnecessary risks, the JSR result selected in this paper should be less than 15 dB.

Table 3.
The relationship between JSR and the angle factor.
Secondly, the influence of the array parameters on the system performance is analyzed in detail. Taking JSR equal to 13.83 dB as an example, the influence of different typical array configurations on the protection area radius is analyzed, and the results are shown in Table 4. When the equilateral triangle array configuration is adopted, the protection area radius is three times the maximum baseline length. According to the general protection law, a protection radius of three times the maximum baseline length can protect the target. Considering the maximum baseline length of 0.2 km in this paper as an example, three times the maximum baseline length is 0.6 km, which means that the monopulse radar is deflected to a position 0.6 km away from the center of the triple. This distance is sufficient to provide full protection to the target.

Table 4.
The relationship between array configuration and protection radius.
Based on the above analysis, both the power and array parameters exert significant influences on the system performance. Meanwhile, a contradictory relationship exists between the protection area and JSR: expanding the protection area typically requires a higher JSR, which increases the risk of system exposure; conversely, reducing the JSR can mitigate the exposure risk but may lead to an insufficient protection area. The algorithm proposed in this paper appropriately resolves this contradiction, achieving a balance between the protection area and JSR. This algorithm not only effectively safeguards the target but also significantly reduces the system’s exposure risk.
Furthermore, the optimal JSR value solved by the algorithm is 13.83 dB, which is lower than the 15 dB commonly seen in recent multi-point source research [13]. This indicates that, under the premise of achieving the same protection effect, the proposed algorithm can realize target protection with a lower JSR, thereby more effectively reducing the system’s exposure risk. This advantage not only enhances the overall system performance but also provides more flexible and reliable options for electronic countermeasure strategies in practical applications.
4.4. The Influence of Phase Error
In practical application environments, environmental noise and parameter variations exert significant impacts on the spatial positional accuracy of the equivalent radiation center, with such influences potentially causing jamming effects to deviate from the expected targets or even become completely ineffective in certain cases. The fundamental reason is that the vector synthesis process of multi-point source signals is highly sensitive to phase consistency, while phase inconsistencies between antenna channels in actual systems are often unavoidable. Therefore, we adopt the root mean square error (RMSE) between the theoretical and actual positions to quantitatively evaluate the impact of phase errors on the positional accuracy of the equivalent radiation center. The RMSE results obtained through 100 experiments are presented in Table 5, from which it can be observed that as phase errors increase, the RMSE (with its unit being the maximum baseline length) increases accordingly. This indicates that phase errors severely affect the positional accuracy of the equivalent radiation center, leading to deviations in the jamming effects from the expectations.

Table 5.
The influence of phase error on the position of equivalent radiation center.
4.5. The Computational Complexity of the NSCWOA Algorithm
The computational complexity of the NSCWOA algorithm is mainly determined by its core operations, especially non-dominated sorting. The following is a detailed analysis.
Main components and their complexities:
(1) Initialization:
Generate N individuals and initialize the position of each individual in the D-dimensional space. Therefore, the complexity of the initialization is O(N*D).
(2) Fitness evaluation:
For each individual, the complexity of calculating the values of its M objective functions is O(M*N*C). Among them, C is the computational cost of evaluating a single objective function of an individual. In this article, the objective function is calculated simply, and C could be regarded as a constant.
(3) Non-dominated Sorting:
For multi-objective optimization algorithms, the computational complexity of non-dominated sorting is typically O(M*N2). Here, M represents the number of objective functions, and N represents the number of individuals.
(4) Crowding Distance Calculation:
Similarly, in multi-objective optimization algorithms, the computational complexity of congestion calculation is typically O (M*N log N).
(5) Elitism selection:
Select N individuals from the parent generation and the offspring (or combined population) to enter the next generation. Sorting and selection are usually based on a non-dominant hierarchy and crowded distance. Therefore, the computational complexity of elite selection is O(M*N2).
(6) Three-stage operation
This operation involves N individuals in the population and D-dimensional positions; therefore, its computational complexity is O(N*D).
In summary, for the NSCWOA algorithm, the computational complexity of running Gen times is about O (Gen*M*N2), which is similar to the general multi-objective optimization algorithm, and the running time of the NSCWOA algorithm in this paper is less than 1 s. Therefore, the NSCWOA algorithm can be flexibly applied to practical scenarios.
5. Conclusions and Prospect
To address the contradiction between the jamming power and the area of the equivalent radiation center distribution area in the multi-point source system, this paper proposes a joint optimization method for the jamming power and the array of the multi-point source system to achieve an optimal balance between the jamming power and the equivalent radiation center distribution area. Based on the spatial geometric model of the triplet antenna and target, the distribution characteristics of the equivalent radiation center under the condition of the target echo are derived, and the joint optimization model of jamming power and array in omnidirectional and non-omnidirectional cases is constructed by introducing the angle factor. However, by introducing an adaptive variable inertia weight based on the cosine function and logistic chaotic mapping, an NSCWOA algorithm is proposed to solve the model, and the optimal array layout and optimal jamming power are obtained. The experimental results show that under the condition that the JSR value is about 13.90 dB, the equilateral triangle array can protect the target and avoid the exposure of the triplet antenna position in both omnidirectional and non-omnidirectional cases. Compared with NSWOA, MOMVO, NSGA-II, MOEDO, and MOPKO, it demonstrates excellent convergence speed and distribution uniformity in the two scenarios. The combination of chaotic mapping and a cosine-based weighting mechanism enhances robustness. We acknowledge the existing problem that the additional nonlinear mapping calculation lacks dedicated hardware acceleration. In the future, the optimal layout under the existence of antenna device errors will be considered in combination with the development demands or trends of multi-source systems and electronic warfare.
Author Contributions
Conceptualization, Z.C. and S.X.; methodology, Z.C. and S.X.; software, Z.C.; validation, Z.C., W.M. and J.W.; formal analysis, Z.C. and W.M.; investigation, Z.C. and X.S.; resources, S.X.; data curation, Z.C. and S.X.; writing—original draft preparation, Z.C.; writing—review and editing, S.X.; visualization, Z.C. and Z.X.; supervision, S.X.; project administration, S.X.; funding acquisition, S.X. All authors have read and agreed to the published version of the manuscript.
Funding
This research was funded by The National Natural Science Foundation of China, grant number 62471471. The funder: Sinong Quan.
Data Availability Statement
The raw data supporting the conclusions of this article will be made available by the authors on request.
Acknowledgments
We sincere thanks to the administrative support from College of Electronic Science and Technology.
Conflicts of Interest
The authors declare no conflicts of interest.
References
- Chen, L.; Wang, J.; Liu, X.; Feng, D.; Sun, G. A Flexible Range-Doppler Modulation Method for Pulse-Doppler Radar Using Phase-Switched Screen. IEEE Trans. Antennas Propag. 2025. early access. [Google Scholar] [CrossRef]
- Plessis, W.D. Cross-eye gain in multiloop retrodirective cross-eye jamming. IEEE Trans. Aerosp. Electron. Syst. 2016, 52, 875–882. [Google Scholar] [CrossRef]
- Huang, J.; Yin, J.; An, M.; Li, Y. Azimuth Pointing Calibration for Rotating Phased Array Radar Based on Ground Clutter Correlation. IEEE Trans. Geosci. Remote Sens. 2025, 63, 1000315. [Google Scholar] [CrossRef]
- Plessis, W.P.d. Path-Length Compensation in Multiloop Retrodirective Cross-Eye Jamming. IEEE Trans. Aerosp. Electron. Syst. 2019, 55, 397–406. [Google Scholar] [CrossRef]
- Chen, J.; Shi, Q.; Huang, Z.; Wang, Q.; Yuan, N. Performance Analysis of Multi-Group Three-Tuple Cross-Eye Jamming. J. Syst. Eng. Electron. 2022, 33, 80–90. [Google Scholar] [CrossRef]
- Liu, T.; Wei, X.; Liu, Z. Overview of cross-eye jamming research. J. Radars 2019, 8, 140–153. [Google Scholar] [CrossRef]
- Zhou, L.; Meng, J.; Liu, Y. Design and analysis of non-retrodirective cross-eye interference experiment based on non-pulse vector network analyzer. Syst. Eng. Electron. 2024, 46, 62–70. [Google Scholar]
- Cai, Z.; Xing, S.; Meng, W.; Wang, J.; Su, X.; Quan, S. Fusion Unbiased Pseudo-Linear Kalman Filter-Based Bearings-Only Target Tracking. Remote Sens. 2024, 16, 4536. [Google Scholar] [CrossRef]
- Li, D.; Meng, J.; Liu, Y. Effect of cross-eye jamming on the active-passive composite monopulse radar. J. Radars 2022, 11, 705–712. [Google Scholar] [CrossRef]
- Hu, Y.; Chen, B.; Wu, C. Anti-cross-eye jamming method based on monopulse radar 3-D imaging. Syst. Eng. Electron. 2022, 44, 1188–1194. [Google Scholar] [CrossRef]
- Lee, J.H.; Jo, J.; Ryu, H.-K. Experimental approach to estimate cross-eye gain for a nonretrodirective cross-eye jamming system. IEEE Antennas Wirel. Propag. Lett. 2022, 6, 1120–1123. [Google Scholar] [CrossRef]
- Chen, Z.; Ning, Y.; He, S.; Yu, M. Experimental Study on Multiantenna Interference Technology. IEEE Trans. Aerosp. Electron. Syst. 2023, 59, 7878–7889. [Google Scholar] [CrossRef]
- Ning, Y.; Yu, M. Performance Analysis of Multiple Antennas Synthetic False Target Jamming. IEEE Access 2022, 10, 16178–16187. [Google Scholar] [CrossRef]
- Ma, J.; Shi, L.; Xu, Z. Overview of multi-source parameter estimation and jamming mitigation for monopulse radars. J. Radars 2019, 8, 125–139. [Google Scholar] [CrossRef]
- Xing, S.; Song, S.; Quan, S.; Sun, D.; Wang, J.; Li, Y. Near-Field 3D Sparse SAR Direct Imaging with Irregular Samples. Remote Sens. 2022, 14, 6321. [Google Scholar] [CrossRef]
- Chen, J.; Wang, Q.; Ye, Y. Analysis on wave-front phase distortion characteristics based on NSGA-II. Syst. Eng. Electron. 2022, 44, 1439–1446. [Google Scholar] [CrossRef]
- Liu, S.; Dong, C.; Dong, Y. Analysis of rotating orthogonal multiple elements retrodirective cross-eye jamming. J. Electron. Inf. Technol. 2016, 38, 1424–1430. [Google Scholar] [CrossRef]
- Wang, H.; Liu, G.; Liu, Q. An implementation method of multiple-element retrodirective cross-eye jamming. Aerosp. Electron. Warf. 2023, 39, 48–53. [Google Scholar] [CrossRef]
- Song, S.; Dai, Y.; Sun, S.; Jin, T. Efficient Image Reconstruction Methods Based on Structured Sparsity for Short-Range Radar. IEEE Trans. Geosci. Remote Sens. 2024, 62, 5212615. [Google Scholar] [CrossRef]
- Liu, F.; Chen, J.; Lyu, H. Analysis of multi-loop reverse cross-eye jamming in new configuration. Chin. J. Radio Sci. 2020, 35, 603–613. [Google Scholar] [CrossRef]
- Liu, W.; Meng, J.; Zhou, L. Interference modeling of rectangular array retrodirective cross-eye method. Syst. Eng. Electron. 2019, 41, 2453–2459. [Google Scholar]
- Miao, X. A concealed Jamming Method Based on Radar Target Detection Mechanism. J. China Acad. Electron. 2022, 17, 972–976. [Google Scholar] [CrossRef]
- Wang, J.; Quan, S.; Xing, S. PSO-based Fine Polarimetric Decomposition for Ship Scattering Characterization. ISPRS J. Photogramm. Remote Sens. 2025, 220, 18–31. [Google Scholar] [CrossRef]
- Zhou, L.; Liu, Y.; Meng, J. Interference Performance Analysis of Two Source Retro-Directive Cross-Eye Jamming and Multi-Source Linear Array Retro- Directive Cross-Eye Jamming. Acta Electron. Sin. 2021, 49, 2289–2298. [Google Scholar] [CrossRef]
- Liu, D.; Wang, X.; Chen, Y. Adaptive scheduling method of joint multi-resource for cooperative interference of networked radar system. Syst. Eng. Electron. 2023, 45, 2744–2754. [Google Scholar]
- Zhou, C.; Lin, Q.; Ma, C. Intelligent Decision-making for Selection of Communication Jamming Channel and Power. J. Electron. Inf. Technol. 2024, 46, 3957–3965. [Google Scholar] [CrossRef]
- Li, C.; Li, P. Anti-Jamming Technology of Adaptive Nulling Antenna of Satellite Navigation. J. Electron. Inf. Technol. 2020, 35, 59–63. [Google Scholar]
- Chen, J.; Xu, Z.; Xiao, S. Optimal subarray design method for sidelobe cancellation of wideband irregular subarrayed array. IEEE Antennas Wirel. Propag. Lett. 2023, 22, 2793–2797. [Google Scholar] [CrossRef]
- Song, S.; Dai, Y.; Jin, T.; Wang, X.; Hua, Y.; Zhou, X. An Effective Image Reconstruction Enhancement Method with Convolutional Reweighting for Near-Field SAR. IEEE Antennas Wirel. Propag. Lett. 2024, 23, 2486–2490. [Google Scholar] [CrossRef]
- Su, X.; Quan, S.; Cai, Z.; Meng, W.; Xing, S. An Adversarial Sample Generation Method Based on the Balance Between Aggression and Concealment. In Proceedings of the 2025 IEEE 6th International Seminar on Artificial Intelligence, Networking and Information Technology (AINIT), Shenzhen, China, 2025; pp. 1–5. [Google Scholar] [CrossRef]
- Zhang, H.; Yang, R.; Wu, J. Research on multi-aircraft cooperative suppressing jamming embattling in electronic warfare planning. J. Syst. Eng. Electron. 2017, 39, 542–548. [Google Scholar] [CrossRef]
- Gao, S.; Shi, W.; Wang, Q. Research on ground-to-air radar jammer array and start-up timing control. J. Air Force Early Warn. Acad. 2020, 34, 346–350. [Google Scholar] [CrossRef]
- Nan, H.; Peng, S.; Liu, R. Research on the problem of high repetition frequency pulse interference array of passive seeker. J. Air Force Early Warn. Acad. 2018, 32, 430–434. [Google Scholar] [CrossRef]
- Herschfelt, A.; Chiriyath, A.; Molnar, A.C.; Landon, D.G.; Bliss, D.W. In-Band, Full-Duplex Self-Interference Mitigation Using Sparse Tap-Delay Models with Quantized and Power Constrained Weights. In Proceedings of the 2020 54th Asilomar Conference on Signals, Systems, and Computers, Pacific Grove, CA, USA, 1–4 November 2020; pp. 1260–1264. [Google Scholar] [CrossRef]
- Naduvilpattu, S.; Mehta, N.B. Optimal Energy-Efficient Antenna Selection and Power Adaptation for Interference-Outage Constrained Underlay Spectrum Sharing. IEEE Trans. Commun. 2022, 70, 6341–6354. [Google Scholar] [CrossRef]
- Xi, X.; Liu, G.; Liu, Q. Distributed jamming optimal array method for sidelobe cancellation. J. Syst. Eng. Electron. 2024, 46, 2623–2628. [Google Scholar]
- Acharya, S.; Ghosh, S.; Gangopadhyaya, M. Performance Analysis of Interference Constrained NOMA in 5G Communication. In Proceedings of the 2025 8th International Conference on Electronics, Materials Engineering & Nano-Technology (IEMENTech), Kolkata, India, 31 January–2 February 2025; pp. 1–5. [Google Scholar] [CrossRef]
- Zhao, K.; Song, H.; Liu, R. Distributed radar main-lobe interference suppression method via joint optimization of array configuration and subarray element number. J. Radars 2024, 13, 1355–1369. [Google Scholar] [CrossRef]
- Huang, Q.; Guo, Z.; Wang, H. A method of cross-eye robust angle deception with three-tuple antenna. Electron. Opt. Control 2024, 31, 94–98. [Google Scholar] [CrossRef]
- Sui, R.; Wang, J.; Sun, G.; Xu, Z.; Feng, D. A Dual-Polarimetric High Range Resolution Profile Modulation Method Based on Time-Modulated APCM. IEEE Trans. Antennas Propag. 2025, 73, 1007–1017. [Google Scholar] [CrossRef]
- Zheng, Y.; You, C.; Zhang, N. Wide-angle scanning thinned phased array synthesis based on improved multiobjective beluga whale optimization algorithm. IEEE Antennas Wirel. Propag. Lett. 2024, 23, 3511–3515. [Google Scholar] [CrossRef]
- Chai, Y.; Zhu, Y.; Ren, S. An improved whale optimization algorithm based on multi-strategy coordination. Comput. Eng. Sci. 2023, 45, 1308–1319. [Google Scholar] [CrossRef]
- Zdiri, S.; Chrouta, J.; Zaafouri, A. Cooperative multi-swarm particle swarm optimization based on adaptive and time-varying inertia weights. In Proceedings of the 2021 IEEE 2nd International Conference on Signal, Control and Communication (SCC), Tunis, Tunisia, 20–22 December 2021; pp. 200–207. [Google Scholar] [CrossRef]
- Li, C.; Feng, B.; Li, S.; Kurths, J.; Chen, G. Dynamic Analysis of Digital Chaotic Maps via State-Mapping Networks. IEEE Trans. Circuits Syst. I Regul. Pap. 2019, 66, 2322–2335. [Google Scholar] [CrossRef]
- Zhang, X.; Lin, S.; Chen, C.; Chen, X. MODA: Model Ownership Deprivation Attack in Asynchronous Federated Learning. IEEE Trans. Dependable Secur. Comput. 2024, 21, 4220–4235. [Google Scholar] [CrossRef]
- Bahrami, B.; Khayyambashi, M.R.; Mirjalili, S. Multiobjective Placement of Edge Servers in MEC Environment Using a Hybrid Algorithm Based on NSGA-II and MOPSO. IEEE Internet Things J. 2024, 11, 29819–29837. [Google Scholar] [CrossRef]
- Zhang, S.; Nie, Y.; Wang, S.; Zhang, X.; Wu, Q.; Wang, T. 3-D Path Planning for AUVs Based on Improved Exponential Distribution Optimizer. IEEE Internet Things J. 2024, 11, 28667–28679. [Google Scholar] [CrossRef]
- Yi, L.; Tan, J.; Wang, Y. Multi-objective pied kingfisher optimizer for optimal PV array reconfiguration under partial shading conditions. Opt. Laser Technol. 2025, 186, 112755. [Google Scholar] [CrossRef]
Disclaimer/Publisher’s Note: The statements, opinions and data contained in all publications are solely those of the individual author(s) and contributor(s) and not of MDPI and/or the editor(s). MDPI and/or the editor(s) disclaim responsibility for any injury to people or property resulting from any ideas, methods, instructions or products referred to in the content. |
© 2025 by the authors. Licensee MDPI, Basel, Switzerland. This article is an open access article distributed under the terms and conditions of the Creative Commons Attribution (CC BY) license (https://creativecommons.org/licenses/by/4.0/).