Article

SR-YOLO: Spatial-to-Depth Enhanced Multi-Scale Attention Network for Small Target Detection in UAV Aerial Imagery

1
College of Internet of Things, Nanjing University of Posts and Telecommunications, Nanjing 210003, China
2
Jiangsu Key Laboratory of Broadband Wireless Communication and Internet of Things, Nanjing University of Posts and Telecommunications, Nanjing 210003, China
3
Tongding Interconnection Information Co., Ltd., Suzhou 215000, China
*
Author to whom correspondence should be addressed.
Remote Sens. 2025, 17(14), 2441; https://doi.org/10.3390/rs17142441 (registering DOI)
Submission received: 24 May 2025 / Revised: 7 July 2025 / Accepted: 11 July 2025 / Published: 14 July 2025

Abstract

The detection of aerial imagery captured by Unmanned Aerial Vehicles (UAVs) is widely employed across various domains, including engineering construction, traffic regulation, and precision agriculture. However, aerial images are typically characterized by numerous small targets, significant occlusion issues, and densely clustered targets, rendering traditional detection algorithms largely ineffective for such imagery. This work proposes a small target detection algorithm, SR-YOLO. It is specifically tailored to address these challenges in UAV-captured aerial images. First, the Space-to-Depth layer and Receptive Field Attention Convolution are combined, and the SR-Conv module is designed to replace the Conv module within the original backbone network. This hybrid module extracts more fine-grained information about small target features by converting image spatial information into depth information and the attention of the network to targets of different scales. Second, a small target detection layer and a bidirectional feature pyramid network mechanism are introduced to enhance the neck network, thereby strengthening the feature extraction and fusion capabilities for small targets. Finally, the model’s detection performance for small targets is improved by utilizing the Normalized Wasserstein Distance loss function to optimize the Complete Intersection over Union loss function. Empirical results demonstrate that the SR-YOLO algorithm significantly enhances the precision of small target detection in UAV aerial images. Ablation experiments and comparative experiments are conducted on the VisDrone2019 and RSOD datasets. Compared to the baseline algorithm YOLOv8s, our SR-YOLO algorithm has improved mAP@0.5 by 6.3% and 3.5% and mAP@0.5:0.95 by 3.8% and 2.3% on the datasets VisDrone2019 and RSOD, respectively. It also achieves superior detection results compared to other mainstream target detection methods.

1. Introduction

In recent years, the rapid development of drone technology has led to a continuous decrease in drone development and manufacturing costs and their rapid expanded ap-plication, including engineering construction, traffic management, electric power inspections, and smart agriculture. Unmanned Aerial Vehicles (UAVs) equipped with high-definition cameras need to collect a lot of image and video data. By combining artificial intelligence and related technologies, they are required to automatically identify targets from the aerial images. Additionally, target detection plays a key role in the field of computer vision. It needs to extract features from images or videos with an algorithm that identifies and locates specific objects, providing the location and category information of the target. Recently, following the deep learning theory, the target detection method based on Convolutional Neural Networks (CNNs), like You Only Look Once (YOLO) [1,2,3], has gradually become one of the mainstream technologies in this field. They can learn generic features of targets across various environments, appearances, and scales via training with large-scale, high-quality labeled image data. Consequently, it significantly enhances the generalization ability and robustness of the model and further enables the target detection model to perform target recognition and localization tasks efficiently in complex and changing environments, laying a solid foundation for computer vision. As a result, it enables some current target detection algorithms to detect targets from UAV aerial images, to a certain extent. However, due to the high shooting altitude, wide viewing angle, and complex background of UAVs, there is a high percentage of small targets and significant target scale changes in the aerial images, which usually drastically reduces their target detection effect. The reasons for poor target detection in UAV aerial images are as follows:
1.
Small targets with inconspicuous features
Targets in aerial images are typically small and occupy fewer pixels, leading to sparse feature information, which is hard for traditional target detection algorithms. The limitations of the sensing field and feature resolution can cause the loss of detailed information, resulting in missed and false detections.
2.
Complex background with many interferences
Aerial images usually contain complex background information, such as buildings, roads, vegetation, etc. The high similarity between this background information and the target easily causes interference to the detection algorithm.
3.
Insufficient multi-scale target detection capability
The scale of targets in aerial images varies greatly, ranging from a few meters to several hundred meters. Feature extraction and fusion for different-scale targets becomes difficult, leading to suboptimal detection performance for small targets with the traditional target detection algorithms. Thus, multi-scale, accurate, and effective small target recognition algorithms will be beneficial for the development of UAV target detection applications.
This work proposes an aerial image small target detection algorithm, SR-YOLO, which may improve the YOLOv8s algorithm. The primary improvements are as follows:
  • The SR-Conv module is designed to integrate the Space-to-Depth (SPD) layer and Receptive Field Attention Convolution (RFAConv), replacing the Conv module in the original backbone network. It enables the extraction of more fine-grained information about small target features by transforming spatial dimension information into the depth dimension and adaptively adjusting the network’s attention to targets of varying scales.
  • A small target detection layer and a bidirectional feature pyramid network (BiFPN) network are introduced to enhance the neck network. This dual enhancement optimizes multi-scale feature fusion across hierarchical levels, enabling robust aggregation of fine-grained spatial details and semantic context, which significantly improves the capability of the network to localize and distinguish small, occluded targets in complex aerial scenes.
  • The normalized Wasserstein distance (NWD) loss function is proposed. By integrating the NWD metric with the original Complete Intersection over Union (CIoU) loss through a weighted fusion strategy, this hybrid loss function significantly enhances the model’s sensitivity to small targets, particularly under dense occlusion and low-resolution conditions, thereby improving detection accuracy.
The remainder of this paper is structured as follows: Section 2 reviews current research on the techniques of general-purpose object detection and the method of small-target detection. Section 3 presents a detailed exposition of the SR-YOLO algorithm. The section begins with an elaboration of the overall network architecture of the SR-YOLO small-target detection algorithm, followed by a systematic explanation of the underlying principles of its four core improvement modules: the SR-Conv feature extraction module, the BiFPN multi-scale feature fusion network, the small-target detection layer, and the NWD loss function. Section 4 conducts extensive experimental validation, including loss function experiments, ablation studies, comparative model evaluations, and visual analysis of the SR-YOLO algorithm on public datasets. These experiments demonstrate the efficacy of the SR-YOLO algorithm in detecting small targets in aerial imagery. Section 5 summarizes the key findings of this study and discusses potential directions for future research.

2. Related Work

2.1. Generic Target Detection Methods

Deep learning-based target detection algorithms can be categorized into convolutional neural network (CNN)-based approaches and Transformer-based methods. CNN-based methods are further divided into two-stage detection algorithms and one-stage detection algorithms.
The two-stage detection paradigm operates through a region proposal mechanism that first generates object proposals, followed by feature extraction from these candidate regions for final classification. Region-based CNN (R-CNN) established the seminal two-stage detection framework, utilizing a pre-trained CNN for feature extraction and Support Vector Machines for classification [4]. Nevertheless, this algorithm requires independent feature extraction of the generated candidate regions, resulting in a slow detection speed. In 2015, He et al. proposed SPPNet that utilized a spatial pyramid structure with multi-level pooling operations to normalize feature dimensions across variably-sized inputs [5]. Based on R-CNN, researchers proposed Fast R-CNN [6], which incorporates a Region of Interest pooling layer and Region Proposal Network to enable shared feature computation and end-to-end training. After that, improved CNN models based on region proposal have been proposed, like Faster R-CNN [7,8], Fully Convolutional Network (R-FCN) [9], Mask R-CNN [10], Feature Pyramid Network (FPN) [11], Cascade R-CNN [12], Libra R-CNN [13], DetectoRS [14], and AquaSketch [15].
Although the two-stage target detection model significantly reduces the background interference through the region suggestion mechanism, it also introduces additional computational overhead. To strike a balance between inference efficiency and detection accuracy, Redmon et al. proposed the single-stage detection model YOLO in 2015 [16], which streamlines object detection by unifying feature extraction, bounding box regression, and classification within a single CNN framework. To overcome the shortcomings of the YOLO algorithm in multi-scale target detection, Liu W et al. in 2016 designed the Single Shot MultiBox Detector (SSD) [17] detection model that efficiently handles objects with significant size differences by using convolutional feature maps at different levels for target detection. Lin et al. subsequently introduced RetinaNet, incorporating ResNet’s residual connections, FPN, and the Focal Loss function to resolve class imbalance issues [18]. To address the shortcomings of YOLO’s initial model in terms of detection accuracy, Redmon et al. introduced YOLOv2 [19], followed by successive improvements through YOLOv3 [20], YOLOv4 [21], YOLOv5 [22], and YOLOv7 [23] have been proposed. In 2018, Law et al. proposed CornerNet, employing a keypoint-based detection approach through bounding box corner prediction [24]. Duan K et al. proposed CenterNet in 2019, which utilizes centroid prediction combined with offset regression for precise localization [25]. Tian Z et al. proposed the FCOS target detection architecture, which achieves multiscale by introducing feature pyramid scale fusion and combines the centrality prediction mechanism to reduce the probability of repeated predictions in the detection results [26]. YOLOX [27] and YOLOv8 are representatives of high-performance detection models using the anchorless frame mechanism in the YOLO family. YOLOX improves training dynamics through decoupled heads and SimOTA matching, while YOLOv8 enhances performance via optimized backbone gradient flow and advanced head architecture. The YOLO family of algorithms continues to evolve with the release of YOLOv9 [28], YOLOv10 [29], and YOLOv11 [2] in 2024.
Deep learning-based target detection methods output detection results directly from the original images through end-to-end training, which effectively avoids the cumbersome manual feature extraction process in traditional methods. Furthermore, the deep learning-based neural network is also able to automatically extract deeper, detailed features, which are suitable for the target detection task applied to UAV aerial images.

2.2. UAV Small Object Detection

Small target detection in UAV aerial images presents significant challenges. Due to the limited pixel coverage of small targets and their susceptibility to interference from complex backgrounds, conventional object detection methods exhibit high false negative and false positive rates when applied to small target detection scenarios. To improve the ability of general-purpose target detection algorithms to capture the feature information of small targets in aerial images, existing research mainly focuses on enhancing the algorithm’s ability to extract detailed features, optimizing the feature fusion mechanism of the network, designing the attention mechanism, optimizing the loss function, and improving the architecture of the detection head.
The integration of attention mechanisms into detection architectures enables autonomous focus on salient regions while suppressing non-critical background areas, thereby enhancing detailed feature representation for small targets and significantly improving detection accuracy. Wang et al. [30] introduced the global attention in the neck of YOLOv8, which significantly enhances the model to pay more attention to the small targets’ features, but this also leads to an increase in the number of model parameters. Liu et al. [31] constructed a new spatial coordinate self-attention module, which improves the model’s ability to perceive the location information of small target objects and capture the detailed feature information by optimizing and fusing the spatial attention and coordinate attention. Li et al. [32] employed the Receptive Field Convolutional Block Attention module to alleviate the sparse spatial information problem caused by downsampling and then improve the model’s ability to extract small target features. Liu et al. [33] used a spatial extraction attention module to enhance the ability of capturing and fusing semantic information, and then improve the performance of the model for small target detection. Zheng et al. [34] proposed a Local Attention Pyramid architecture that suppresses background interference and amplifies small-target signatures through hierarchical noise suppression.
Multi-scale feature fusion mechanisms enhance model performance by simultaneously capturing local detail features and global contextual information of targets, thereby improving both accuracy and robustness in small target detection. Jiang et al. [35] proposed a Bidirectional Dense Feature Pyramid Network that expands the conventional feature pyramid architecture through skip connections, enabling deep fusion of cross-scale features from shallow to deep layers to better extract fine-grained small target features. Min et al. [36] proposed a feature pyramid network, E-FPN, which enhances the model’s ability to extract small-target features from aerial images by introducing additional F2-level feature pyramids, residual network branches, and Convolutional Block Attention modules.
In terms of improving the loss function and adding small target detection heads, Wang et al. [37] designed an ELAN-SW target detection head and introduced the WIoU loss function to further improve the detection accuracy of the model for tiny targets. Bi et al. [38] proposed a new detection head, Dyhead-DCNv4, and adopted EIoU as the loss function to further improve the detection accuracy of the model. Hsu et al. [39] proposed a tiny-target-based localization method, YOLO-SPD, with four detection heads, which significantly improves the detection accuracy of tiny targets in remote sensing images.
In conclusion, the deep learning-based small target detection algorithm for aerial photography is still in the primary exploration stage. Due to the diversity of small targets in aerial photography images, traditional general target detection methods are prone to the loss of key features of small targets, which in turn makes it difficult to meet the practical application requirements in the field of aerial photography. Furthermore, with the improvement of the accuracy of the aerial photography target detection model, the number of model parameters and computational volume will also increase to a certain extent. Therefore, achieving improved small target detection accuracy while maintaining lightweight network architectures presents a compelling research challenge worthy of further investigation.

3. Proposed Method

3.1. Overview of YOLOv8

YOLOv8 is a YOLO series model released in January 2023 by Ultralytics. This architecture incorporates several advanced technical improvements over YOLOv5, including a Path Aggregation Feature Pyramid Network structure, an anchor-free detection paradigm, and a decoupled head design. The framework offers five distinct model variants (n, s, m, l, and x) with progressively increasing parameter counts and computational requirements. Architecturally, YOLOv8 maintains the conventional three-component structure comprising backbone, neck, and head modules, as illustrated in Figure 1.
The backbone network of YOLOv8 is used to extract features from the input image, which consists of three modules: Conv, C2f, and Spatial Pyramid Pooling Fast (SPPF). The Conv module implements convolutional operations through a sequential structure containing a convolutional layer, batch normalization, and activation function, primarily capturing local image features. The C2f module integrates two convolutional layers with multiple bottleneck layers, enabling adaptive channel adjustment for different model scales. This architecture facilitates the acquisition of multi-scale high-level semantic representations while simultaneously increasing network depth and receptive field size, thereby enhancing feature extraction capability. The SPPF module performs multi-scale feature pooling, enabling effective fusion of features across different spatial resolutions.
The neck network of YOLOv8 mainly consists of FPN and Path Aggregation Network (PAN). FPN conveys the deep feature semantics by a top-down approach, and PAN conveys the deep target localization by a bottom-up approach. The integration of Feature Pyramid Network and Path Aggregation Network enables comprehensive fusion of multi-level features, facilitates multi-scale feature learning, enriches contextual semantic representations, and ultimately enhances the network’s target detection performance.
The detection head of YOLOv8 employs a Decoupled Head architecture that separates classification and regression tasks, while adopting an anchor-free paradigm to directly predict target coordinates and dimensions, thereby enhancing detection accuracy. In terms of the loss function, the combination of the DFL function and CIoU function is used as the regression loss function, which helps to quickly focus on the neighborhood of the target localization, thus predicting the location of the bounding box more accurately. Variant Focal Loss serves as the classification loss, effectively balancing foreground-background weights during small target detection to improve category prediction confidence. In the matching strategy, the positive sample assignment strategy (Task Aligned Assigner) is used to select positive samples by weighting the classification and regression scores to strengthen the feature fusion ability of the convolutional network.

3.2. The Proposed Method

Aiming at the problem of missed detection and misdetection caused by the many instances of small targets in aerial images and the large target sizing, we propose SR-YOLO, an improved algorithm for detecting small targets in aerial images based on YOLOv8s as the baseline architecture. The network structure of SR-YOLO is illustrated in Figure 2.
The specific improvement points include:
  • The backbone network of the original YOLOv8 suffers from a loss of fine-grained information when performing convolution and pooling operations. To reduce the model’s misdetection and omission rate of small targets in aerial images, the SR-Conv module is designed to replace the standard SR-Conv module in the original backbone network by combining the SPD layer with the RFAConv. The SR-Conv module is designed to replace the standard convolution module in the original backbone network by combining the SPD layer, which retains all the information in the channel dimension, and the RFAConv, which adaptively adjusts the network’s attention to targets at different scales.
  • The neck layer of the original YOLOv8 borrows from PANet and adopts the FPN+PAN dual feature pyramid structure for fusion of multi-scale features. This structure is prone to the loss of original features, which in turn leads to the inefficiency of feature fusion. With the aim of making better use of the original feature information, the feature fusion mechanism of the neck network is improved by introducing a BiFPN, which enhances the feature extraction capability of the model for small-scale targets.
  • The original YOLOv8 network introduces three feature maps at different scales into the neck network for fusion and forms three prediction heads. With a view to improving the model’s ability to detect small targets, a small target detection layer is added to the model, and the features extracted from the second layer are fused into the network. By constructing prediction heads for four targets, more shallow semantic information can be retained, which in turn improves the model’s focus on small targets.
  • The original YOLOv8 uses the CIoU bounding box as the regression loss function. As a result, the sensitivity to targets at different scales varies greatly. To enhance the network’s detection capability for extremely small targets, a modified CIoU loss function incorporating NWD is introduced for optimization. By employing a weighted fusion of the NWD loss and the CIoU loss functions, more detailed information can be captured, which in turn improves the performance of a small target detection algorithm for aerial images.

3.3. SR-Conv Module Design

The backbone network of the baseline model YOLOv8s is prone to losing some of the fine-grained information during the convolution and pooling operations. To reduce the loss of small target information in aerial images by the detection model, the SR-Conv module is designed by combining the SPD and the sensory field attentional convolution (RFAConv), which is used to replace the standard convolutional modules of the original backbone network in layers 1, 3, 5, and 7.
The SPD layer is designed to preserve the information within the channel by mapping the spatial dimension of the input feature map to the channel dimension, effectively avoiding the loss of detailed information. The structure of the SPD layer is illustrated in Figure 3. The SPD layer avoids information loss in traditional methods by mapping the spatial dimension of the input feature map to the channel dimension while preserving the information within the channel. Suppose there is a generic input image X of size S × S × C 1 . When downsampling with a step size of 2 is used, four sub-feature maps can be generated, and the size of each sub-feature map is ( S 2 , S 2 , C 1 ) . Subsequently, these sub-feature maps are concatenated along the channel dimension to form the aggregated feature representation. The SPD layer transforms the feature map from dimensions of X ( S , S , C 1 ) to X ( S s c a l e , S s c a l e , s c a l e 2 C 1 ) , where the spatial resolution is halved while the channel dimension is quadrupled. This spatial-to-depth conversion effectively redistributes spatial information into channel dimensions, thereby mitigating the information loss inherent in conventional convolution and pooling operations. The spatial dimension of the input image is converted into the depth dimension, avoiding the information loss phenomenon that occurs in the traditional convolution and pooling operations.
The RFAConv introduces an innovative Receptive Field Attention (RFA) mechanism that addresses the parameter-sharing limitation inherent in conventional convolution operations [40]. Furthermore, this mechanism explicitly accounts for the relative importance of each feature within the receptive field across the global feature space, while adaptively modulating network attention to multi-scale targets. These properties collectively enhance small target detection performance.
The structure of RFAConv is shown in Figure 4. Assuming a generic input image of size C × H × W, the proposed architecture employs interactive receptive field feature fusion to enhance detection performance while maintaining computational efficiency. The primary processing branch aggregates global receptive field characteristics through average pooling operations, followed by 1 × 1 group convolution processing, ultimately generating an attention map via Softmax normalization. For the secondary branch, feature normalization is implemented using 3 × 3 group convolution, with ReLU activation introducing nonlinear transformations to produce spatial features of specified dimensions. Through element-wise multiplication of both branches’ outputs, the network achieves three key objectives: adaptive feature reweighting, cross-channel correlation aggregation, and generation of non-overlapping receptive field representations with adjusted spatial dimensions. This multiplicative fusion enables the preservation of fine-grained spatial information while dynamically weighting cross-scale feature interactions. Finally, the length and width of the feature map are shaped by convolution to keep the same size as the input. The specific calculation process is shown as
R F A = S o f t m a x ( g 1 × 1 A v g p o o l X × R e L U N o r m g s × s X = A r f a × F r f a
where s represents the convolution kernel size, g ( 1 × 1 ) represents the group convolution of size 1 × 1, N o r m is the normalization, A v g P o o l is the average pooling operation, R e L U and S o f t m a x are the activation functions, X is the input feature maps, and RFA is the obtained by multiplying the transformed sensory field space feature F r f a with the attention map A r f a .
Inspired by the ideas of SPD and RFAConv, the SR-Conv module is designed by combining the two to replace the standard convolution module in the original model backbone network. The structure of the SR-Conv module is shown in Figure 5. The input image is mapped to the channel dimension through the SPD layer to map the spatial dimension information to the channel dimension, and then RFAConv is used for further feature extraction. The SR-Conv module can use the SPD layer to retain all the feature information in the channel dimension, while simultaneously maintaining RFAConv’s capability for adaptive attention allocation across multi-scale targets. By using the SR-Conv module in place of the standard convolution in the backbone network of the baseline model, the model can extract more fine-grained information about small target features, which in turn improves the model’s detection performance for small targets.

3.4. Feature Fusion Network and Detection Head Design

Traditional Feature Pyramid Networks is a top-down feature transfer mechanism, which enhances the feature-expression ability for each layer through transferring strong semantic features from the upper layer to the lower layer. However, when the semantic information transfer is strengthened, the high-resolution detail information in the underlying feature map may be ignored with such a unidirectional information-transfer mechanism. As a result, the accuracy of locating the target for the network is decreased.
The YOLOv8 architecture enhances the conventional FPN by integrating a PAN structure, forming a combined PAN-FPN framework. This improvement introduces bottom-up feature propagation pathways to complement the top-down FPN hierarchy. Although this architecture effectively mitigates the feature transfer limitation of traditional FPN due to unidirectional information flow, there is still an obvious feature information loss problem when dealing with a small target detection task. To effectively solve the above problems, the weighted BiFPN architecture is used to optimize and improve the neck network of the YOLOv8 model. The comparison of FPN, PAN-FPN, and BiFPN is shown in Figure 6.
BiFPN is a novel feature fusion method proposed by the Google team in the EfficientDet detection algorithm, which enhances the semantic information of features through cross-scale connectivity and a weighted feature fusion mechanism [41]. Compared with PANet, the BiFPN network adopts a bi-directional feature delivery strategy, which combines down-sampling and up-sampling paths to achieve feature information delivery in both directions, thus retaining more contextual information. At the same time, the BiFPN architecture further optimizes cross-scale feature interaction by pruning redundant connections with minimal contribution to feature fusion. This selective pathway refinement enhances the network’s capability for small-scale target detection while maintaining computational efficiency.
Different features in the aerial image have different resolutions, and their output contributions are not the same. The BiFPN architecture employs weighted feature fusion by assigning learnable weights to each input feature. These weights are dynamically adjusted during training and normalized to the range [0, 1] through division by the sum of all weight values. This normalization scheme enhances computational efficiency while enabling precise control over multi-scale feature contributions. The mathematical formulation of the weighted feature fusion is expressed as
O = i w i × I i ε + j w j
where ω i and ω j denote the weights of the feature maps of layer i and j, respectively, which determine the degree of contribution of the feature maps of layer i and j, respectively, in the fusion process. I i denotes the input feature, ε = 10 4 , which is used to avoid numerical instability.
In the baseline model YOLOv8 network architecture, three detection heads are formed by feeding three feature maps of different scales into the neck network for feature fusion. When the input image size is 640 × 640, the YOLOv8 architecture employs spatial downsampling operations with scaling factors of 8-fold, 16-fold, and 32-fold, subsequently generating multi-scale feature maps with dimensions of 80 × 80, 40 × 40, and 20 × 20, respectively. These feature maps are responsible for detecting target instances of sizes 8 × 8, 16 × 16, 32 × 32, and above, respectively. However, in aerial imagery, small target instances occupy minimal spatial regions, and their salient features are progressively diminished through successive downsampling operations in the detection pipeline. This degradation leads to information loss that manifests as both missed detections and false positives in the model’s output. To improve the detection performance of the model for small targets, a 160 × 160 P2 small target detection layer is introduced on top of the three detection layers of the baseline model while keeping the other feature map scales unchanged to form four detection heads, which are used to better acquire the category and location information of small targets.
The architectural configuration incorporating the small target detection layer is illustrated in Figure 7. Firstly, the feature map of 80 × 80 output from the seventh layer in the backbone network is up-stacked with the up-sampled feature layer in the neck network. Then the stacked features are processed by the C2f module and the up-sampling module to obtain more small target feature information. Finally, the processed stacked features are feature-fused with the shallow feature map output from the third layer in the backbone network. This feature fusion method adopts the weighted feature fusion of the BiFPN network, which can better control the contribution of different scale features and thus improve the model’s focus on small targets. The added small target detection header can extract the feature information of small targets at a deeper level of the network, thus significantly reducing the probability of false and missed detection of small targets.

3.5. Loss Function Design

In the YOLOv8 algorithm, the regression loss of the bounding box uses a combination of the CIoU loss function and the DFL loss function. Specifically, the DFL loss function first calculates the distribution probability of the bounding box with the distribution probability of the labels through the form of cross-entropy. Then, the bounding box distribution probability is reduced to the prediction box, and the CIoU loss function optimizes the prediction box as a whole by calculating the loss between the prediction box and the true box. The formula for CIoU is given as
L CIoU = 1 IoU + ρ 2 ( b , b gt ) ( c w ) 2 + ( c h ) 2 + 4 π 2 ( tan 1 w gt h gt tan 1 w h )
where the intersection-union ratio, IoU, is a commonly used metric to evaluate the performance of target detection algorithms, and is used to measure the degree of overlap between the detection results and the true annotations, ρ 2 b , b g t is the Euclidean distance between the prediction frame and the true frame, h and w are the height and the prediction frame, respectively, w g t   and h g t are the width and height of the true frame, c w and c h are the width and height of the smallest enclosing box composed of the prediction frame and the width and height of the minimum enclosing frame composed of the true frame, respectively.
The CIoU bounding box regression loss function is based on the traditional intersection and concurrency ratio metric, where the balance of difficulty is not taken into account when dealing with samples. Specifically, for small targets, smaller positional offsets result in a sharp decrease in the IoU value, whereas the same positional offsets produce a large change in the IoU value for large targets. In addition, the CIoU calculation involves inverse trigonometric functions, which will consume the model’s computing power. To solve the above problems, an NWD-based positional regression loss function is introduced, which is combined with the CIoU loss function to optimize the loss function. The NWD calculates the similarity between the predicted frame and the labelled frame through a 2D Gaussian distribution. The bounding box representation is modeled using a 2D Gaussian distribution, where the similarity between the predicted and ground-truth boxes is computed through their corresponding Gaussian distribution matching. The similarity metric quantifies the distributional alignment between predicted and ground-truth targets, enabling measurement of their correspondence regardless of bounding box overlap conditions through probabilistic distribution matching. Meanwhile, NWD is insensitive to different scale targets and is more suitable for measuring the similarity between predicted and labelled frames in small target images. The calculation of NWD is described as
NWD ( N a , N b ) = exp ( w 2 2 ( N a , N b ) C )
where C is a constant closely related to the dataset, and W 2 2 N a , N b is a distance measure computed as
w 2 2 ( N a , N b ) = | | ( [ c x a , c y a , w a 2 , h a 2 ] T , [ cx b , cy b , w b 2 , h b 2 ] T | | 2 2
where N a and N b are Gaussian distributions modelled by the real frame A = c x a , c y a , w a , h a and the predicted frame B = c x b , c y b , w b , h b , c x is the horizontal coordinate of the centroid, c y is the vertical coordinate of the centroid, w is the width, h is the height, and T is the transpose, c x a and c x b are the real frame A and the real frame B, respectively, the horizontal coordinates of the centre point, c y a and c y b are the vertical coordinates of the center point of the real frame A and real frame B, respectively, w a and w b are respective the widths of the real frame A and real frame, and h a and h b are separate the heights of the real frame A and real frame B.
Compared with CIoU, NWD demonstrates superior capability in capturing fine-grained details and spatial relationships, making it particularly effective for measuring similarity between small targets. However, replacing NWD directly with CIoU will significantly reduce the convergence speed of the network and bring great time cost, despite its potential to enhance detection accuracy for tiny targets. To address this trade-off, we propose a weighted combination of CIoU and NWD, with the complete position loss function, Loss, formulated as
Loss = ( 1 α ) × CIoU + α × NWD
where C I o U is the CIoU loss function, N W D is the NWD loss function, and α is the weight parameter of NWD. Different similarity calculations are obtained by adjusting α to adapt to different application scenarios and task requirements.

4. Experiment

4.1. Dataset Introduction

As for target detection, datasets are the basis for training, validating, and testing models. Larger datasets that cover multiple scenarios can adapt the model to a wider range of application scenarios. In this paper, both the VisDrone2019 [42] and the RSOD [43] datasets are mainly chosen to train, validate, and test the target detection model.
The RSOD dataset, developed by Wuhan University in 2017 for aerial remote sensing applications, comprises 976 high-resolution images encompassing four categories of typical ground objects: aircraft, oil tanks, overpasses, and playgrounds. The dataset contains a total of 6950 annotated instances. The dataset is divided into the training set, validation set, and test set according to the ratio of 7:2:1. An example of the ROSD dataset image is shown in Figure 8. It can be seen that the images in this dataset have high resolution and include diverse targets, which is suitable for the research of small target detection algorithms for UAV aerial images.
The VisDrone2019 dataset is a large-scale public benchmark dataset for UAV platforms constructed by a team from Tianjin University. The dataset covers five mainstream computer vision task subsets: image target detection, video target detection, single target tracking, multi-target tracking, and crowd counting. The dataset consists of 288 video clips (261,908 frames in total) and 10,209 still images labelled with the bounding boxes of over 2.6 million targets. Furthermore, the dataset encompasses diverse geographical scenarios spanning urban to rural environments, incorporates target distributions varying from sparse to high-density clusters, and integrates a comprehensive range of meteorological conditions and illumination variations. These characteristics establish it as a comprehensive, diverse, and challenging benchmark dataset for UAV vision applications. For the target detection task of images, the VisDrone2019 public dataset used in this paper consists of 8629 UAV aerial images. The dataset is divided into three subsets: training set, validation set, and test set. The dataset partition comprises 6471 training images, 548 validation images, and 1610 test images. The dataset covers 10 categories of representative targets, such as pedestrians, cars, and bicycles. As shown in Figure 9, it contains a large number of small targets with inconspicuous features, so the dataset is very suitable for the research of a small target detection algorithm for UAV aerial photography.
The distribution of sample sizes within the VisDrone2019 training set is illustrated in Figure 10. The first row shows the distribution of target height on the x-axis, y-axis, and overall height from left to right. The second row shows the distribution of target width on the x-axis and y-axis. The third row shows the overall distribution of the target in the image. Figure 10 analysis reveals a distinct distribution pattern of target sizes in the dataset, where the majority of targets (over 80%) fall into the small-size category, while medium and large targets are relatively scarce. This distribution indicates that targets in the VisDrone2019 dataset are predominantly concentrated in small image regions.

4.2. Implementation Details

The hardware parameters for the experiments in this paper are shown in Table 1, which are based on a Windows 11 operating system with compilers PyTorch 2.2.0, Python 3.10, and CUDA 12.1. The CPU is Intel(R) Core(TM) i7-14650HX 2.20 GHz, and the GPU is NVIDIA GeForce RTX 4060 with 24G video memory.
The parameter settings during the experimental training process are summarized in Table 2. The model processes input images at a resolution of 640 × 640 pixels, utilizing Stochastic Gradient Descent optimization with a batch size of 16. Key hyperparameters include: an initial learning rate of 0.01, a cosine annealing cycle (T_max) of 0.01, L2 regularization weight decay of 0.0005, and a momentum coefficient of 0.937. The training procedure completes 200 epochs to ensure convergence.

4.3. Evaluation Metrics

Evaluation metrics of target detection algorithms are important tools to measure their performance, and assessing the algorithms through specific values is instructive for researchers to improve and optimize the algorithms. In this paper, precision (P), recall (R), mean of average precision (mAP@0.5, mAP@0.5:0.95), parameters, F1, and FLOPs are selected as the indicators to evaluate the performance of the target detection model in the experiments, and the indicators are introduced as follows:
1.
The precision rate P denotes the proportion of true cases in all samples predicted by the model to be positive cases. The formula for P is defined as
P = TP TP + FP
where T P indicates correct classification and F P indicates predicting negative samples as positive examples.
2.
Recall denotes the proportion of all actual samples of positive cases that are successfully predicted as positive by the model. The formula for R is defined as
R = TP TN + FN
where F N denotes the prediction of a positive sample as a negative example, and T N denotes the prediction of a negative sample as a negative example.
3.
The value of average precision AP is the area of the region enclosed by the precision–recall (PR) curve. mAP denotes the average value of AP for each target category in the dataset. mAP is calculated by the equation
mAP = 0 1 P × Rdr
where r is the rth target category detected. mAP@0.5 is the average mAP of all target categories when the IoU threshold is 0.5, mAP@0.5:0.95 is the average mAP of all target categories with a step size of 0.05 and an IoU threshold between 0.5 and 0.95.
4.
The number of parameters (Params) represents the total number of model parameters and reflects the complexity of the model.
5.
Floating-point operations per second (FLOPs) represent the computational complexity of an algorithm or model, quantified by the total number of floating-point operations required. Lower FLOPs values indicate faster model execution speed. Taking the convolutional layer as an example, the formula for FLOPs may be deduced as
FLOPs = 2 × H × W × ( C in × K 2 ) × C out
where H × W is the image size, C i n is the number of input channels, K is the convolutional kernel size, and C o u t is the number of output channels. Since FLOPs can be large, model complexity is usually expressed in terms of MFLOPs (106 FLOPs), GFLOPs (109 FLOPs), and TFLOPs (1012 FLOPs).
6.
The F1 score represents the harmonic mean of precision and recall, quantifying the alignment between the model’s detections and ground-truth annotations, which is calculated by the equation
F 1 = 2 × Precision × Recall Precision + Recall
where P r e c i s i o n is the precision rate and R e c a l l is the recall rate.
7.
Frames Per Second (FPS) serves as a crucial metric for evaluating a model’s real-time processing capability, representing the number of images processed per second, which is calculated by the equation
FPS = FrameNum Elapaedtime
where FrameNum denotes the total number of input images and ElapsedTime represents the total time consumed for detection.

4.4. Analysis of Results

4.4.1. Loss Function Experiments

To verify the effect of various weighting parameters within the NWD-CIoU loss function on the detection performance of small targets in YOLOv8s, as illustrated in Equation (6), comparative experiments were conducted on the VisDrone2019 dataset by adjusting different values of α . To evaluate the detection efficacy, the metrics of mAP@0.5, mAP@0.5:0.95, and F1 were chosen, aiming to identify the optimal weighting coefficients. The detailed experimental outcomes are listed in Table 3. It can be seen that the setting value of α plays a key role in the detection performance of the model. Specifically, as the value of α increases, the proportion of the NWD function rises, leading to a decrease in detection accuracy. When α = 0 , the loss function of the model is CIoU, whereas when α is set to 1.0, the loss function becomes NWD. At α = 0.2 , the improved model achieves the highest values for mAP@0.5, mAP@0.5:0.95, and F1. This indicates that setting α to 0.2 optimizes the detection performance of the improved model. Experimental results suggest that, compared to the CIoU loss function, the NWD loss function more effectively balances the variability among samples. Consequently, combining NWD with CIoU enhances the detection performance of the mode for small targets. Hence, in subsequent experiments, α was set to 0.2.
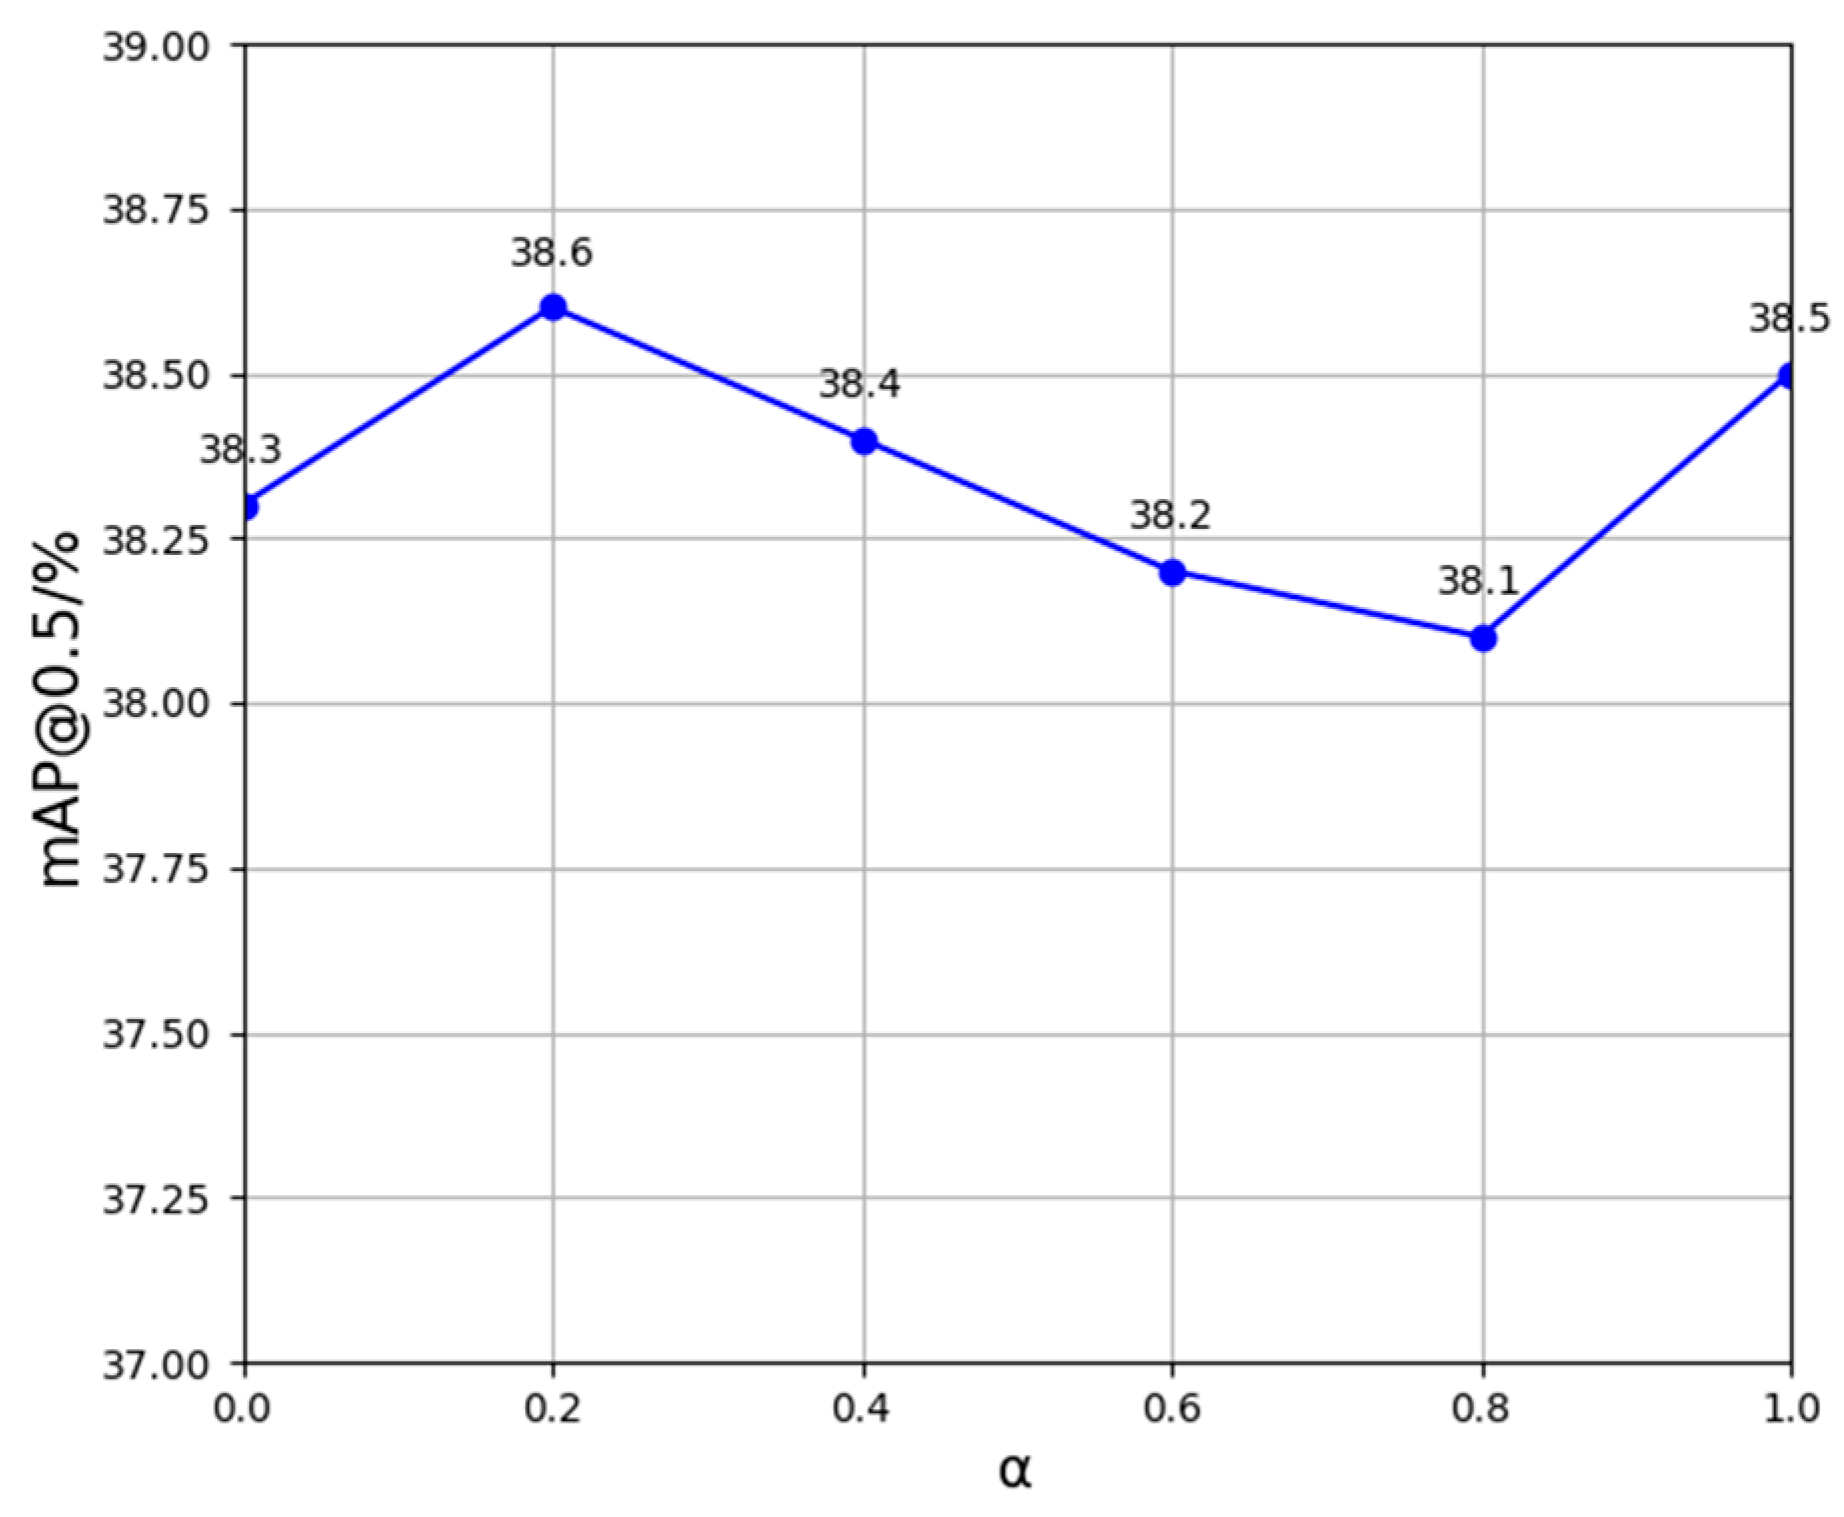
To more intuitively discover the impact of various weighting parameters used in the NWD-CIoU loss function on the small target detection capabilities of YOLOv8s, a line graph illustrating the effect of different α values on mAP@0.5 is presented in Figure 11. As depicted in Figure 11, detection accuracy diminishes with an increase in the value of α , indicating a higher proportion of the NWD function. When α equals 0.2, YOLOv8s achieves its optimal detection performance, thereby confirming the influence of varying α values on the detection capabilities of the model.
To verify the superiority of the combined method of NWD and CIoU for small target detection, experiments were conducted on the VisDrone2019 dataset. The NWD-CIoU approach was compared against several contemporary loss functions, including CIoU, SIoU, GIoU, WIoU, and EIoU, using YOLOv8s. Three key metrics, mAP@0.5, mAP@0.5:0.95, and F1 score, were selected to evaluate detection performance. The comparative results of these loss functions are presented in Table 4. It reveals that the detection performance of the model is influenced to varying extents by substituting different loss functions for the original YOLOv8s loss function. Notably, by combining the NWD loss function with the CIoU loss function to form a new loss function for the model, the highest values of mAP@0.5, mAP@0.5:0.95, and F1 score were achieved. This indicates that the model exhibits the best detection performance when the loss function is improved using the NWD-CIoU method, thereby further validating the effectiveness of the NWD-CIoU loss function for small target detection.

4.4.2. Ablation Experiments

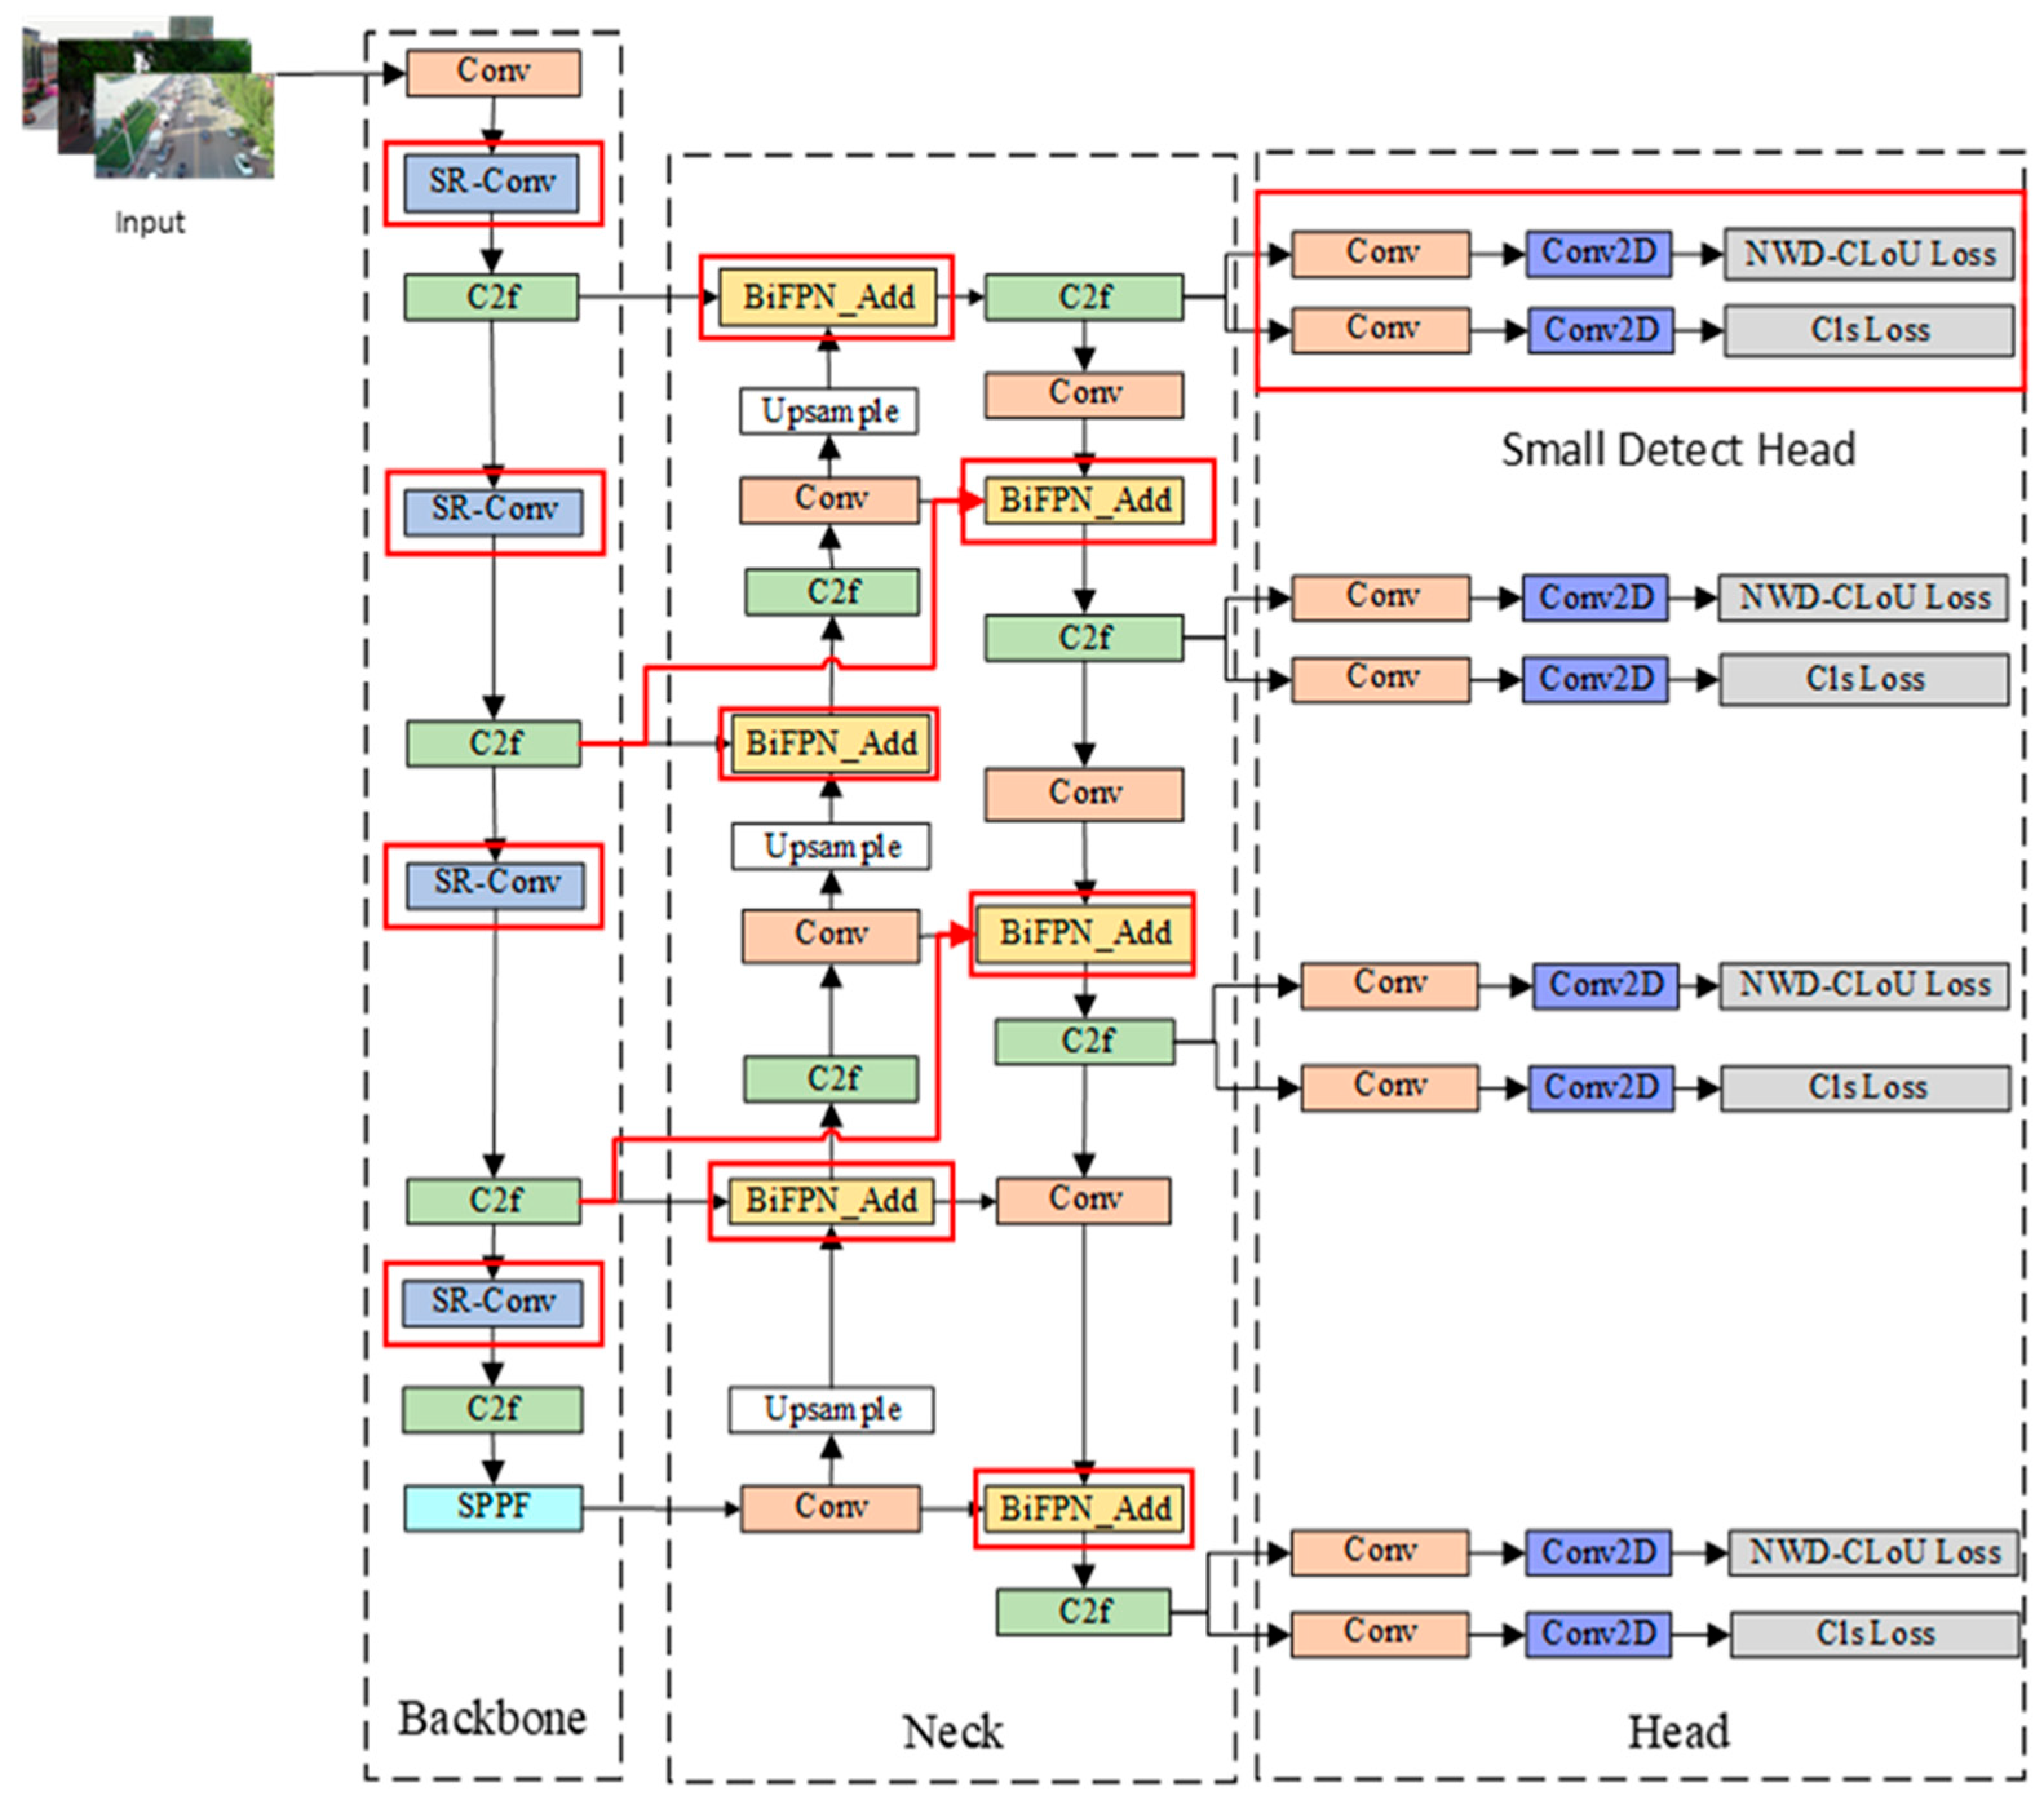
To validate the effectiveness of the improved method proposed in this paper for small target detection, YOLOv8s is employed as the baseline model. Metrics, such as mAP, precision, and recall, are selected for the ablation experiments. Eight sets of experiments are conducted on the public dataset VisDrone2019 to assess the detection efficacy of each enhanced method. The experimental results are detailed in Table 5.
As evident from Table 5, the baseline model is YOLOv8s. Initially, the improvement of YOLOv8s was made through a single module. In the first step, the loss function combining NWD and CIoU was used instead of the original loss function. This resulted in slight improvements to mAP@0.5, mAP@0.5:0.95, as well as recall, while precision experienced a minor decrease. This indicates that the combined loss function of NWD and CIoU can enhance the detection performance of the model for small targets, albeit to a limited extent. In the second step, the SR-Conv module was designed to replace the standard convolutional module in the original backbone network. Consequently, the mAP@0.5, mAP@0.5:0.95, and recall of the model were improved by 1%, 0.5%, and 1%, respectively. The detection performance of the model has been optimized. This suggests that the SR-Conv module enhances the model’s ability to extract target features. In the third step, BiFPN and a small target detection layer were introduced into the neck network, leading to significant increases in mAP, precision, and recall. This demonstrates that BiFPN effectively boosts the feature fusion capability of the model, and the introduction of the small target detection layer compensates for the model’s previous oversight of small target features. Secondly, the multi-module combination was improved for YOLOv8s, resulting in significant enhancements to mAP@0.5, mAP@0.5:0.95, precision, and recall compared to the improvements from using a single module. Finally, SR-Conv, BiFPN, the small target detection layer, and the NWD-CIoU loss function were simultaneously introduced to improve the baseline model, resulting in SR-YOLO. This model achieved 44.6%, 26.6%, 55.2%, and 43.3% for mAP@0.5, mAP@0.5:0.95, precision, and recall, respectively, which is significantly higher than YOLOv8s’ corresponding metrics by 6.3%, 3.8%, 3.2%, and 5.1%, respectively.
In summary, SR-YOLO, along with the simultaneous introduction of SR-Conv, BiFPN, the small target detection layer, and the NWD-CIoU loss function, achieves the best detection results. This further confirms that SR-YOLO enhances the detection accuracy of small targets in aerial images and reduces misdetections and missed detections of small targets compared to YOLOv8s.
To make a more intuitive comparison of the detection performance between YOLOv8s and the improved model, the variations in the four metrics—mAP@0.5, mAP@0.5:0.95, precision, and recall—on the VisDrone2019 dataset are depicted in Figure 12. It is evident that the improved model, SR-YOLO, significantly enhances the values of mAP@0.5, mAP@0.5:0.95, precision, and recall metrics compared to YOLOv8s. Consequently, SR-YOLO demonstrates superior small target detection capabilities compared to YOLOv8s.
For the purpose of demonstrating the enhanced detection capability of the improved module, we conducted eight experimental trials on the publicly available RSOD dataset using four evaluation metrics: mAP@0.5, mAP@0.5:0.95, Params, and GFLOPs, with the comprehensive results documented in Table 6.
Table 6 presents the performance change of YOLOv8s through module optimization. The initial modification employs the NWD-CIoU loss function, which demonstrates significant improvements in both mAP@0.5 and mAP@0.5:0.95 metrics while maintaining identical parameter counts and computational requirements. These results confirm the effectiveness of NWD-CIoU for small target detection. The subsequent integration of the SR-Conv module into the backbone network results in increased Params and GFLOPs, while achieving performance improvements of 1.3% in mAP@0.5 and 1.6% in mAP@0.5:0.95. This enhancement validates the module’s capability for improved feature extraction, particularly for small targets. Implementation of the BiFPN architecture with dedicated small-target detection layers in the neck network achieves a parameter reduction of 1.2 M with only a marginal computational increase of 0.7 GFLOPs, while demonstrating statistically significant enhancements in detection accuracy, with mAP@0.5 increasing by 2.4%. These findings indicate superior multi-scale feature fusion capabilities. Subsequently, we implemented a multi-module optimization approach for YOLOv8s, which resulted in modest increases in both Params and GFLOPs, while achieving significantly greater improvements in mAP@0.5 and mAP@0.5:0.95 compared to single-module enhancements. The proposed SR-YOLO architecture integrates four key components: SR-Conv modules, BiFPN feature pyramid network, a specialized small target detection layer, and NWD-CIoU loss function. Compared to the baseline YOLOv8s model, SR-YOLO demonstrates a Params increase of 2.2 M and computational overhead of 7.4 GFLOPs, while achieving significant performance gains of 3.3% in mAP@0.5 and 2.3% in mAP@0.5:0.95. Consequently, although the number of parameters and the computation amount are increased, the detection accuracy of SR-YOLO is improved. It indicates that the algorithm can effectively reduce the misdetection and omission of small targets in aerial images.
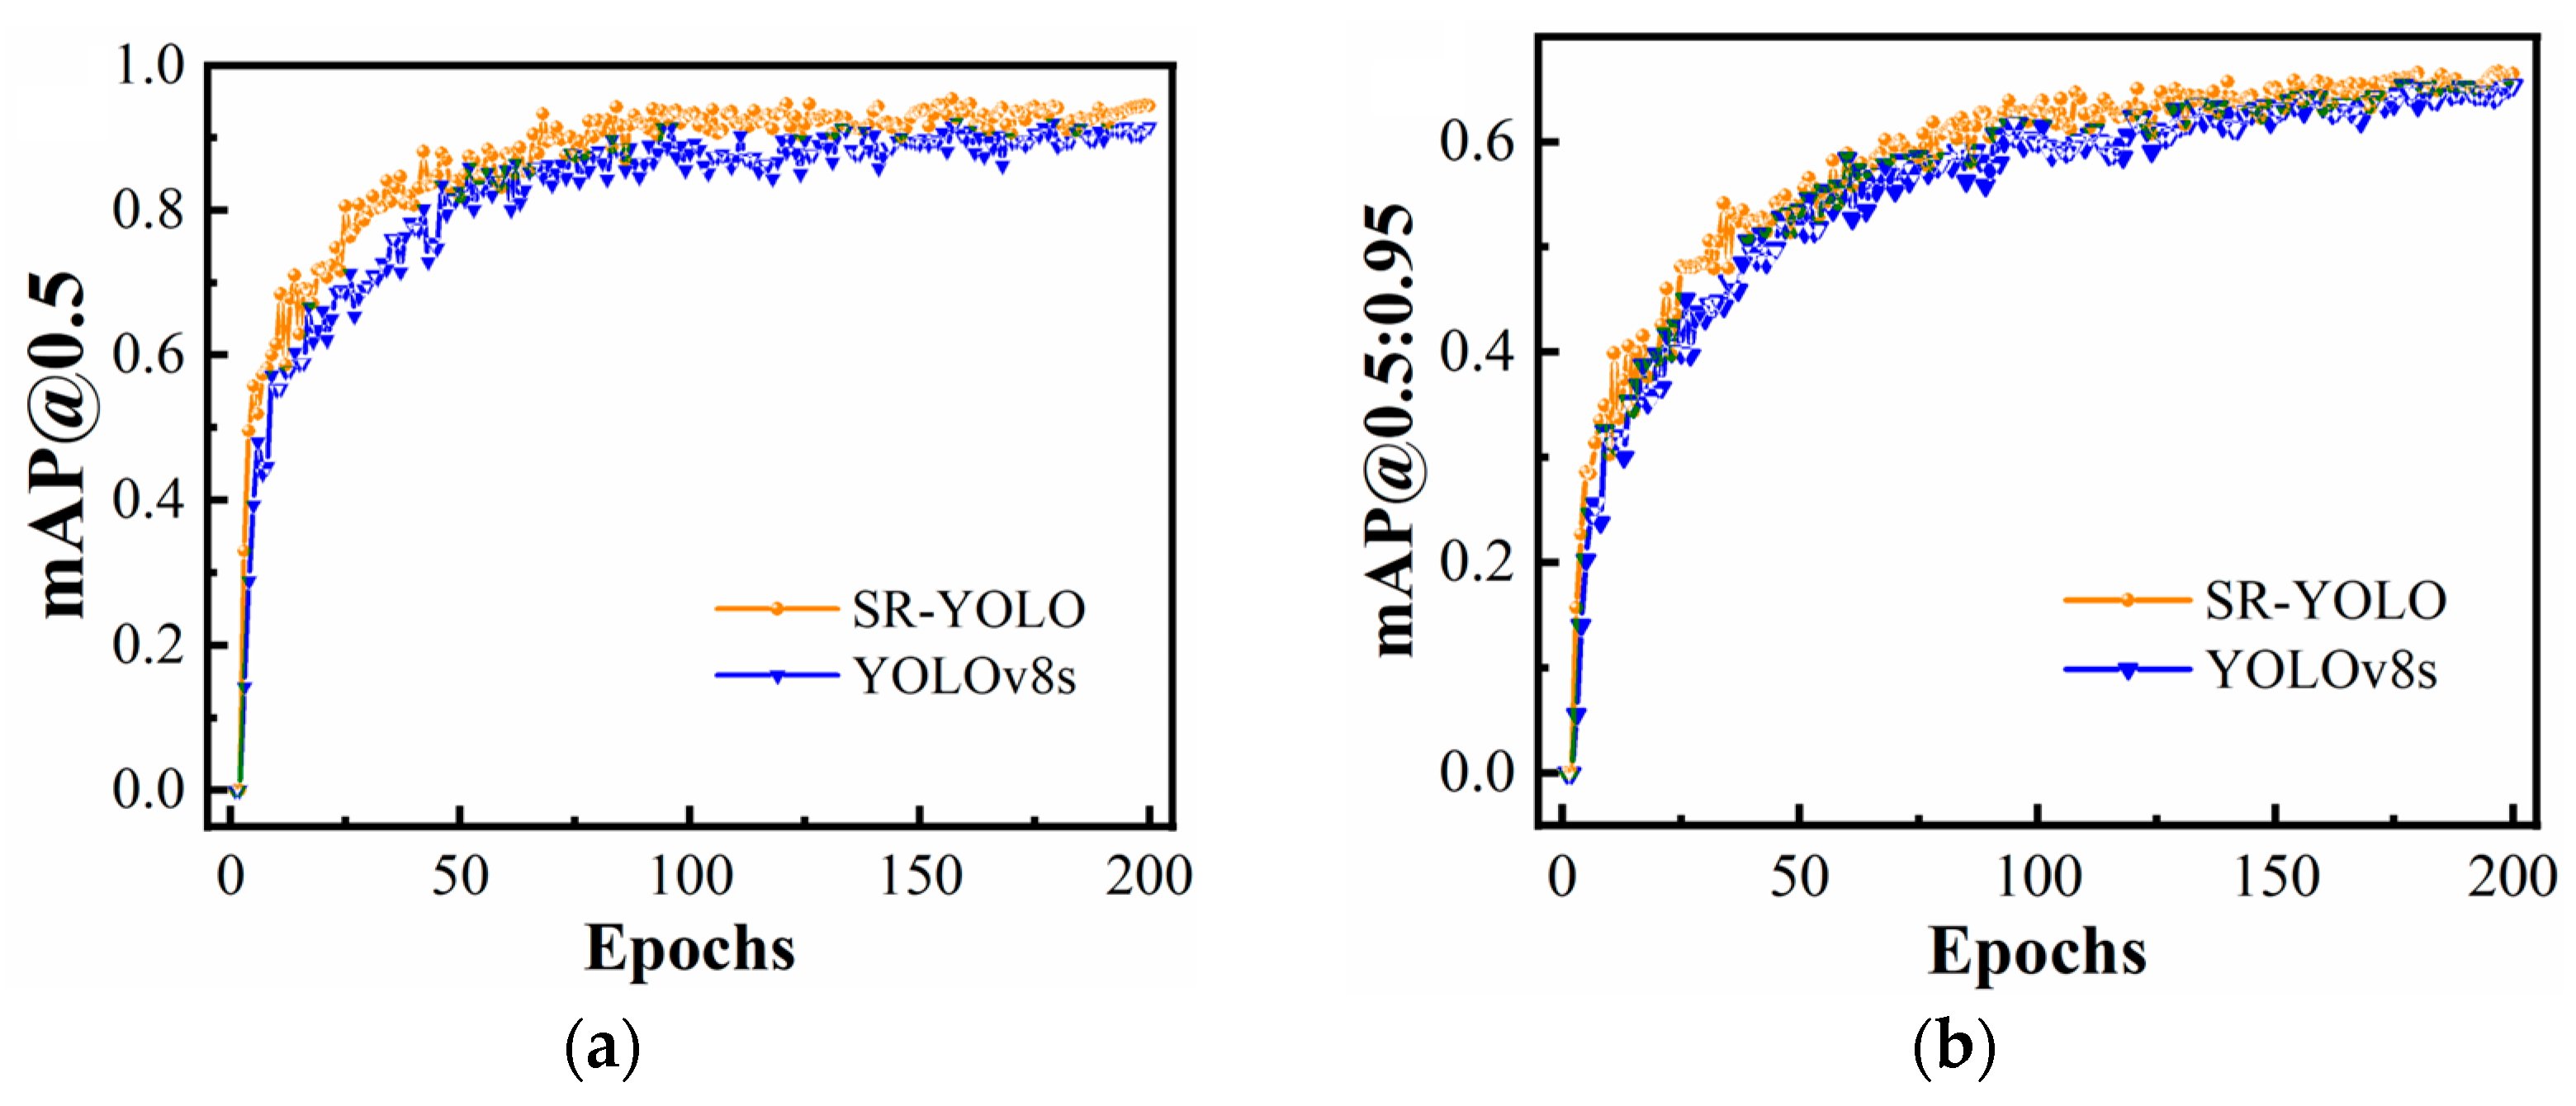
Figure 13 illustrates the evolution of mAP@0.5 and mAP@0.5:0.95 throughout the training epochs on the publicly available RSOD dataset for both YOLOv8s and SR-YOLO. The comparative results in Figure 13 reveal that SR-YOLO exhibits enhanced performance across both evaluation metrics when compared to YOLOv8s. Owing to the prevalence of small-scale targets within the RSOD dataset, these findings substantiate the superior detection performance of the SR-YOLO algorithm for small object identification.

4.4.3. Comparative Experiments

To evaluate the performance improvements of the proposed SR-YOLO algorithm, we conducted comparative experiments using the VisDrone2019 benchmark dataset. The assessment employed four standard evaluation metrics: mAP@0.5, F1 score, Params, FPS, and GFLOPs. The analysis compared SR-YOLO against twelve state-of-the-art object detection architectures, including Faster R-CNN, SSD, RT-DETR [44], YOLOv3s, YOLOv5s, YOLOv6s, YOLOv7, YOLOv8s, YOLOv8m, YOLOv8l, YOLOv9s, YOLOv12s [45], and SOD-YOLO [32], with detailed performance comparisons presented in Table 7.
As demonstrated in Table 7, the proposed SR-YOLO algorithm achieves superior performance on key detection metrics, attaining 44.6% mAP@0.5 and 48.5% F1 score. These results represent significant improvements over current state-of-the-art object detection methods. Compared to YOLOv5s, YOLOv8s, SOD-YOLO, YOLOv9s, and YOLOv12s, SR-YOLO achieves higher detection accuracy despite moderate increases in parameter count and computational requirements. Relative to Faster-RCNN, SSD, RT-DETR, YOLOv3s, YOLOv6s, YOLOv7, YOLOv8m, YOLOv10m, and YOLOv11m, SR-YOLO achieves superior detection accuracy while maintaining computational efficiency. Regarding real-time capability, SR-YOLO achieves significantly higher FPS while maintaining superior detection accuracy compared to Faster-RCNN, YOLOv3s, YOLOv5s, YOLOv6s, and YOLOv7. This demonstrates that the SR-YOLO model delivers both high precision and excellent real-time performance, making it well-suited for time-sensitive applications, such as UAV-based detection. In summary, comparative evaluations demonstrate that SR-YOLO achieves superior inference speed while maintaining competitive detection accuracy. This balance of computational efficiency and precision makes the proposed architecture particularly well-suited for small object detection tasks in aerial imagery applications.
For rigorous assessment of the detection performance improvements in the SR-YOLO framework, we evaluated SR-YOLO against seven contemporary object detection algorithms YOLOv5s, YOLOv5m, YOLOv5l, YOLOv7, YOLOv8n, YOLOv8s, and YOLOv11s on the RSOD benchmark dataset, employing three principal evaluation metrics: mAP@0.5, precision, and recall, with detailed performance comparisons presented in Table 8.
Experimental results presented in Table 8 demonstrate that SR-YOLO attains a mAP@0.5 of 95.4% on the RSOD dataset, representing a statistically significant improvement over existing YOLO-series architecture. Furthermore, SR-YOLO exhibits superior performance in both precision and recall metrics compared to baseline YOLO variants. These findings substantiate the algorithm’s enhanced capability to mitigate both false negatives and false positives in aerial image target detection applications.
To conclude, relative to the baseline YOLOv8s model, the proposed SR-YOLO algorithm exhibits a modest increment in both parameter count and computational load, while remaining within practical operational limits. Furthermore, comparative evaluations on two publicly available datasets demonstrate SR-YOLO’s superior performance in small target detection compared to state-of-the-art detection methods, confirming its enhanced suitability for aerial image target detection applications.

4.4.4. Visualization Analysis

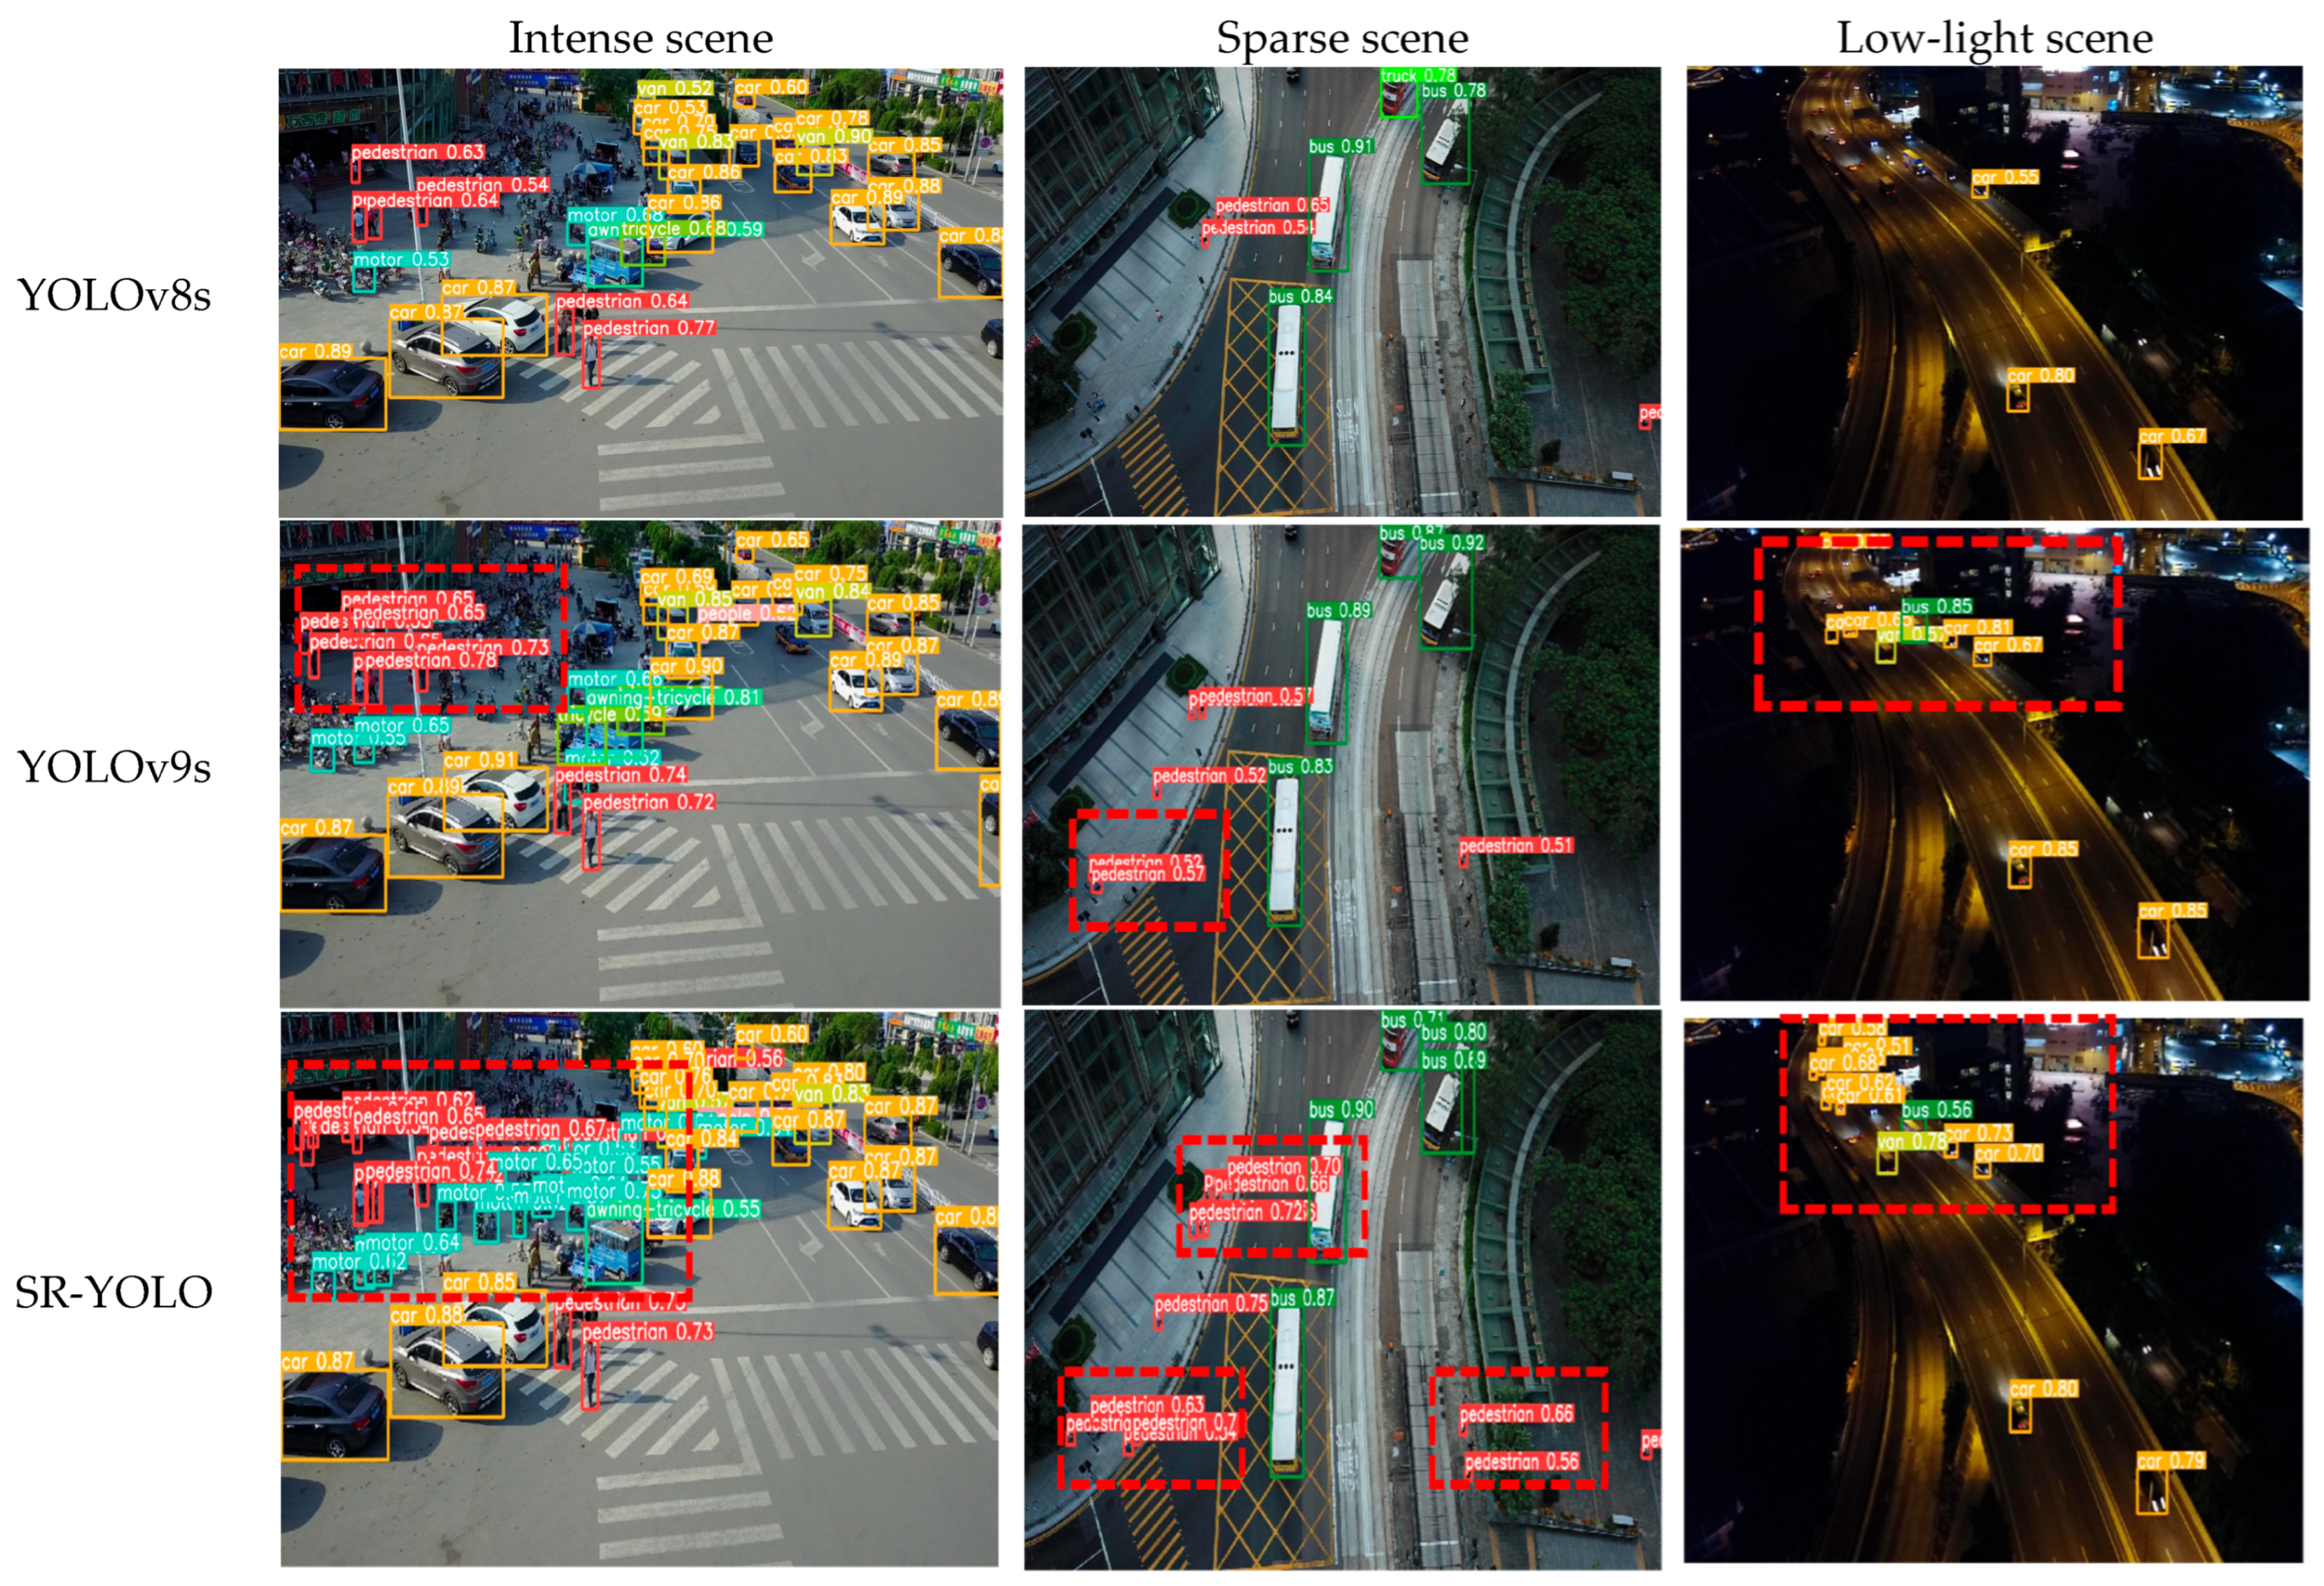
To validate the effectiveness of the SR-YOLO algorithm in real-world conditions, we conducted comprehensive evaluations using the VisDrone2019 dataset, systematically sampling images across three challenging scenarios: intense scene, sparse scene, and low-light scene. Figure 14 presents a comparative visualization of detection results from YOLOv8s, YOLOv9s, and SR-YOLO under identical training conditions and parameter configurations.
As illustrated in Figure 14, the SR-YOLO algorithm achieves robust detection performance for small targets in aerial imagery. Specifically, the model demonstrates reliable identification capabilities for both dense urban scenarios and sparse environments. Under low-light conditions, SR-YOLO maintains effective detection of distant vehicles on highways. Comparative evaluations with YOLOv8s and YOLOv9s confirm that the proposed SR-YOLO architecture significantly reduces both false negatives and false positives across diverse imaging scenarios.
To comprehensively evaluate SR-YOLO’s effectiveness in real-world applications, we randomly selected small target images from aircraft and oil tank scenarios in the RSOD dataset for detection tasks. Figure 15 presents a comparative visualization of the detection results obtained by YOLOv5s, YOLOv8s, and SR-YOLO algorithms under identical training conditions and parameter configurations.
Figure 15 demonstrates the enhanced small-target detection capability of SR-YOLO across diverse scenarios. In aerial imagery applications, the proposed model achieves accurate localization of small aircraft targets. For industrial inspection tasks, SR-YOLO effectively identifies small oil tank objects, showing superior performance compared to baseline approaches. Comparative evaluations with YOLOv5s and YOLOv8s confirm that SR-YOLO reduces both false negatives and false positives in aerial image analysis, demonstrating improved detection performance for small targets.
To summarize, the enhanced SR-YOLO architecture demonstrates improved small-target detection performance across diverse scenarios, effectively reducing both false positives and false negatives in aerial imagery analysis.

5. Discussion

In UAV aerial image object detection tasks, the prevalence of small object instances and significant variations in target sizes often lead to the missed detections and the false positives. To address these issues, the SR-YOLO algorithm builds upon the YOLOv8s framework by introducing several key enhancements. First, the SR-Conv module is designed to replace the standard Conv modules in the backbone network, transforming spatial information into depth-wise features while adaptively adjusting the network’s focus on multi-scale targets, thereby enhancing the model’s ability to extract small object features. Second, a dedicated small-object detection layer and a BiFPN mechanism are incorporated into the neck network to strengthen feature extraction and fusion for tiny targets. Finally, the NWD loss function is introduced to improve the model’s sensitivity to minuscule objects.
Experimental results in Table 3 and Table 4 demonstrate that the proposed NWD-CIoU loss function, which combines NWD with the original CIoU loss, outperforms existing mainstream loss functions. Ablation studies in Table 5 and Table 6 further confirm that the SR-Conv module, BiFPN, small-object detection layer, and NWD-CIoU loss function each contribute to improved detection performance for small targets. Data from Table 7 and Table 8 reveal that SR-YOLO surpasses both traditional models and YOLO variants in detection accuracy, exhibiting significant advantages in small object detection. Additionally, SR-YOLO maintains a favorable balance in terms of parameter count, computational complexity, and FPS. Figure 14 and Figure 15 visually demonstrate SR-YOLO’s detection performance in real-world scenarios. Compared to other mainstream object detection models, SR-YOLO achieves superior results across dense-object scenes, sparse-object scenes, and low-light conditions, highlighting its strong potential for deployment in complex and challenging environments.

6. Conclusions

Aiming at the problem of missed detection and misdetection caused by many small target instances and large variation of target size in aerial images, this study proposes SR-YOLO, an enhanced small target detection algorithm based on YOLOv8s. The proposed architecture implements several critical modifications to improve detection performance. The backbone network incorporates an SR-Conv module designed to convert spatial information into depth features while adaptively adjusting attention across multiple scales, thereby enhancing the model’s ability to extract small target features. Within the neck network, a dedicated small target detection layer is introduced alongside a BiFPN architecture to reinforce multi-scale feature fusion specifically for small objects. Furthermore, the original loss function is refined through integration of the NWD metric to increase sensitivity toward small targets. Experimental results on the VisDrone2019 and RSOD datasets confirm that SR-YOLO outperforms current state-of-the-art object detection methods, demonstrating particular efficacy in small target detection scenarios.
Although the SR-YOLO algorithm demonstrates remarkable effectiveness in detecting small objects in UAV aerial imagery, it incurs slightly higher computational costs and parameter counts compared to YOLOv8s and has not yet incorporated model pruning or knowledge distillation techniques for lightweight optimization. Future work will focus on real-time deployment enhancements by employing lightweight network compression methods, such as pruning and knowledge distillation, or integrating the algorithm with edge computing frameworks to enable real-time detection tasks on UAV platforms.

Author Contributions

Conceptualization, methodology, investigation, S.Z. and H.C.; validation, H.C., D.Z. (Di Zhang), Y.T., and X.F.; writing—original draft preparation, S.Z., H.C., and D.Z. (Di Zhang); writing—review and editing S.Z., H.C., and Y.T.; funding acquisition, D.Z. (Dengyin Zhang). All authors have read and agreed to the published version of the manuscript.

Funding

This research was funded by the National Natural Science Foundation (NNSF) of China under Grant No. 62471241.

Data Availability Statement

The original contributions presented in this study are included in the article. Further inquiries can be directed to the corresponding author.

Acknowledgments

We would like to thank the authors of the comparative methods, including YOLOv5, YOLOv8, and YOLOv11, and our deepest gratitude goes to the reviewers and editors for their careful work and thoughtful suggestions that have helped improve this paper substantially.

Conflicts of Interest

Author Shasha Zhao was employed by the company Tongding Interconnection Information Co., Ltd. The remaining authors declare that the research was conducted in the absence of any commercial or financial relationships that could be construed as a potential conflict of interest.

References

  1. Peng, X.; Zeng, L.; Zhu, W.; Zeng, Z. A small object detection model for improved YOLOv8 for UAV aerial photography scenarios. In Proceedings of the 2024 5th International Seminar on Artificial Intelligence, Networking and Information Technology (AINIT), Nanjing, China, 29–31 March 2024; pp. 2099–2104. [Google Scholar]
  2. Dewangan; Srinivas, M. LIGHT-YOLOv11: An efficient small object detection model for UAV images. In Proceedings of the 2025 IEEE 14th International Conference on Communication Systems and Network Technologies (CSNT), Bhopal, India, 7–9 March 2025; pp. 557–563. [Google Scholar]
  3. Li, H.; Wang, H.; Zhang, Y.; Li, L.; Ren, P. Underwater image captioning: Challenges, models, and datasets. ISPRS J. Photogramm. Remote Sens. 2025, 220, 440–453. [Google Scholar] [CrossRef]
  4. Girshick, R.; Donahue, J.; Darrell, T.; Malik, J. Region-based convolutional networks for accurate object detection and segmentation. IEEE Trans. Pattern Anal. Mach. Intell. 2016, 38, 142–158. [Google Scholar] [CrossRef] [PubMed]
  5. He, K.; Zhang, X.; Ren, S.; Sun, J. Spatial pyramid pooling in deep convolutional networks for visual recognition. IEEE Trans. Pattern Anal. Mach. Intell. 2015, 37, 1904–1916. [Google Scholar] [CrossRef]
  6. Girshick, R. Fast R-CNN. In Proceedings of the 2015 IEEE International Conference on Computer Vision (ICCV), Santiago, Chile, 11–18 December 2015; pp. 1440–1448. [Google Scholar]
  7. Ren, S.; He, K.; Girshick, R.; Sun, J. Faster R-CNN: Towards real-time object detection with region proposal networks. IEEE Trans. Pattern Anal. Mach. Intell. 2017, 39, 1137–1149. [Google Scholar] [CrossRef]
  8. Li, L.; Li, H.; Ren, P. Underwater image captioning via attention mechanism based fusion of visual and textual information. Inf. Fusion 2025, 123, 103269. [Google Scholar] [CrossRef]
  9. Dai, J.; Li, Y.; He, K.; Sun, J. R-FCN: Object detection via region-based fully convolutional networks. In Proceedings of the 30th International Conference on Neural Information Processing Systems (NIPS’16), Red Hook, NY, USA, 5–10 December 2016; pp. 379–387. [Google Scholar]
  10. He, K.; Gkioxari, G.; Dollár, P.; Girshick, R. Mask R-CNN. In Proceedings of the 2017 IEEE International Conference on Computer Vision (ICCV), Venice, Italy, 22–29 October 2017; pp. 2980–2988. [Google Scholar]
  11. Lin, T.-Y.; Dollár, P.; Girshick, R.; He, K.; Hariharan, B.; Belongie, S. Feature pyramid networks for object detection. In Proceedings of the 2017 IEEE Conference on Computer Vision and Pattern Recognition (CVPR), Honolulu, HI, USA, 21–26 July 2017; pp. 936–944. [Google Scholar]
  12. Cai, Z.; Vasconcelos, N. Cascade R-CNN: High quality object detection and instance segmentation. IEEE Trans. Pattern Anal. Mach. Intell. 2021, 43, 1483–1498. [Google Scholar] [CrossRef]
  13. Pang, J.; Chen, K.; Shi, J.; Feng, H.; Ouyang, W.; Lin, D. Libra R-CNN: Towards balanced learning for object detection. In Proceedings of the 2019 IEEE/CVF Conference on Computer Vision and Pattern Recognition (CVPR), Long Beach, CA, USA, 16–20 June 2019; pp. 821–830. [Google Scholar]
  14. Qiao, S.; Chen, L.-C.; Yuille, A. DetectoRS: Detecting objects with recursive feature pyramid and switchable atrous convolution. In Proceedings of the 2021 IEEE/CVF Conference on Computer Vision and Pattern Recognition (CVPR), Nashville, TN, USA, 20–25 June 2021; pp. 10208–10219. [Google Scholar]
  15. Li, H.; Li, L.; Wang, H.; Zhang, W.; Ren, P. Underwater Image Captioning with AquaSketch-Enhanced Cross-Scale Information Fusion. IEEE Trans. Geosci. Remote Sens. 2025. Early Access. [Google Scholar] [CrossRef]
  16. Redmon, J.; Divvala, S.; Girshick, R.; Farhadi, A. You only look once: Unified, real-time object detection. In Proceedings of the 2016 IEEE Conference on Computer Vision and Pattern Recognition (CVPR), Las Vegas, NV, USA, 27–30 June 2016; pp. 779–788. [Google Scholar]
  17. Liu, W.; Anguelov, D.; Erhan, D.; Szegedy, C.; Reed, S.; Fu, C.-Y.; Berg, A.C. SSD: Single shot MultiBox detector. In Proceedings of the 14th European Conference on Computer Vision (ECCV 2016), Amsterdam, The Netherlands, 11–14 October 2016; pp. 21–37. [Google Scholar]
  18. Lin, T.-Y.; Goyal, P.; Girshick, R.; He, K.; Dollár, P. Focal loss for dense object detection. In Proceedings of the 2017 IEEE International Conference on Computer Vision (ICCV), Venice, Italy, 22–29 October 2017; pp. 2999–3007. [Google Scholar]
  19. Redmon, J.; Farhadi, A. YOLO9000: Better, Faster, Stronger. In Proceedings of the IEEE Conference on Computer Vision and Pattern Recognition (CVPR), Honolulu, HI, USA, 21–26 July 2017; pp. 6517–6525. [Google Scholar]
  20. Redmon, J.; Farhadi, A. Yolov3: An incremental improvement. arXiv 2018, arXiv:1804.02767. [Google Scholar]
  21. Bochkovskiy, A.; Wang, C.-Y.; Liao, H.-Y.M. YOLOv4: Optimal Speed and Accuracy of Object Detection. arXiv 2020, arXiv:2004.10934. [Google Scholar]
  22. Jocher, G.; Stoken, A.; Chaurasia, A.; Borovec, J.; Kwon, Y.; Michael, K.; Changyu, L.; Fang, J.; Skalski, P.; Hogan, A.; et al. Ultralytics/YOLOv5: v6.0—YOLOv5n ‘Nano’ Models, Roboflow Integration, TensorFlow Export, OpenCV DNN Support. 2021. Available online: https://zenodo.org/record/5563715 (accessed on 15 December 2023).
  23. Wang, C.-Y.; Bochkovskiy, A.; Liao, H.-Y.M. YOLOv7: Trainable Bag-of-Freebies Sets New State-of-the-Art for Real-Time Object Detectors. In Proceedings of the IEEE/CVF Conference on Computer Vision and Pattern Recognition (CVPR), Vancouver, BC, Canada, 17–24 June 2023; pp. 7464–7475. [Google Scholar]
  24. Law, H.; Deng, J. CornerNet: Detecting Objects as Paired Keypoints. In Computer Vision—ECCV 2018; Ferrari, V., Hebert, M., Sminchisescu, C., Weiss, Y., Eds.; Lecture Notes in Computer Science; Springer: Cham, Switzerland, 2018; Volume 11218, pp. 765–781. [Google Scholar]
  25. Duan, K.; Bai, S.; Xie, L.; Qi, H.; Huang, Q.; Tian, Q. CenterNet: Keypoint Triplets for Object Detection. In Proceedings of the IEEE/CVF International Conference on Computer Vision (ICCV), Seoul, Republic of Korea, 27 October–2 November 2019; pp. 6568–6577. [Google Scholar]
  26. Tian, Z.; Shen, C.; Chen, H.; He, T. FCOS: Fully Convolutional One-Stage Object Detection. In Proceedings of the IEEE/CVF International Conference on Computer Vision (ICCV), Seoul, Republic of Korea, 27 October–2 November 2019; pp. 9626–9635. [Google Scholar]
  27. Ge, Z.; Liu, S.; Wang, F.; Li, Z.; Sun, J. Yolox: Exceeding yolo series in 2021. arXiv 2021, arXiv:2107.08430. [Google Scholar]
  28. Wang, C.-Y.; Yeh, I.-H.; Liao, H.-Y.M. YOLOv9: Learning What You Want to Learn Using Programmable Gradient Information. In Proceedings of the Computer Vision—ECCV 2024, Milan, Italy, 29 September–4 October 2024; Springer: Berlin/Heidelberg, Germany, 2024; pp. 1–21. [Google Scholar]
  29. Wang, A.; Chen, H.; Liu, L.; Chen, K.; Lin, Z.; Han, J. YOLOv10: Real-Time End-to-End Object Detection. Adv. Neural Inf. Process. Syst. 2025, 37, 107984–108011. [Google Scholar]
  30. Wang, F.; Wang, H.; Qin, Z.; Tang, J. UAV Target Detection Algorithm Based on Improved YOLOv8. IEEE Access 2023, 11, 116534–116544. [Google Scholar] [CrossRef]
  31. Liu, C.; Yang, D.; Tang, L.; Zhou, X.; Deng, Y. A Lightweight Object Detector Based on Spatial-Coordinate Self-Attention for UAV Aerial Images. Remote Sens. 2023, 15, 83. [Google Scholar] [CrossRef]
  32. Li, Y.; Li, Q.; Pan, J.; Zhou, Y.; Zhu, H.; Wei, H.; Liu, C. SOD-YOLO: Small-Object-Detection Algorithm Based on Improved YOLOv8 for UAV Images. Remote Sens. 2024, 16, 3057. [Google Scholar] [CrossRef]
  33. Liu, B.; Mo, P.; Wang, S.; Cui, Y.; Wu, Z. A Refined and Efficient CNN Algorithm for Remote Sensing Object Detection. Sensors 2024, 24, 7166. [Google Scholar] [CrossRef]
  34. Zheng, X.; Qiu, Y.; Zhang, G.; Lei, T.; Jiang, P. ESL-YOLO: Small Object Detection with Effective Feature Enhancement and Spatial-Context-Guided Fusion Network for Remote Sensing. Remote Sens. 2024, 16, 4374. [Google Scholar] [CrossRef]
  35. Jiang, L.; Yuan, B.; Du, J.; Chen, B.; Xie, H.; Tian, J.; Yuan, Z. MFFSODNet: Multiscale Feature Fusion Small Object Detection Network for UAV Aerial Images. IEEE Trans. Instrum. Meas. 2024, 73, 5015214. [Google Scholar] [CrossRef]
  36. Min, X.; Zhou, W.; Hu, R.; Wu, Y.; Pang, Y.; Yi, J. LWUAVDet: A Lightweight UAV Object Detection Network on Edge Devices. IEEE Internet Things J. 2024, 11, 24013–24023. [Google Scholar] [CrossRef]
  37. Wang, Y.; Zou, H.; Yin, M.; Zhang, X. SMFF-YOLO: A Scale-Adaptive YOLO Algorithm with Multi-Level Feature Fusion for Object Detection in UAV Scenes. Remote Sens. 2023, 15, 4580. [Google Scholar] [CrossRef]
  38. Bi, J.; Li, K.; Zheng, X.; Zhang, G.; Lei, T. SPDC-YOLO: An Efficient Small Target Detection Network Based on Improved YOLOv8 for Drone Aerial Image. Remote Sens. 2025, 17, 685. [Google Scholar] [CrossRef]
  39. Hsu, P.-H.; Lee, P.-J.; Bui, T.-A.; Chou, Y.-S. YOLO-SPD: Tiny Objects Localization on Remote Sensing Based on You Only Look Once and Space-to-Depth Convolution. In Proceedings of the IEEE International Conference on Consumer Electronics (ICCE), Las Vegas, NV, USA, 6–9 January 2024; pp. 1–3. [Google Scholar]
  40. Zhang, X.; Liu, C.; Yang, D.; Song, T.; Ye, Y.; Li, K.; Song, Y. Rfaconv: Innovating spatial attention and standard convolutional operation. arXiv 2023, arXiv:2304.03198. [Google Scholar]
  41. Tan, M.; Pang, R.; Le, Q.V. EfficientDet: Scalable and Efficient Object Detection. In Proceedings of the IEEE/CVF Conference on Computer Vision and Pattern Recognition (CVPR), Seattle, WA, USA, 13–19 June 2020; pp. 10778–10787. [Google Scholar]
  42. Du, D.; Zhu, P.; Wen, L.; Bian, X.; Lin, H.; Hu, Q.; Peng, T.; Zheng, J.; Wang, X.; Zhang, Y.; et al. VisDrone-DET2019: The Vision Meets Drone Object Detection in Image Challenge Results. In Proceedings of the IEEE/CVF International Conference on Computer Vision Workshop (ICCVW), Seoul, Republic of Korea, 27–28 October 2019; pp. 213–226. [Google Scholar]
  43. Long, Y.; Gong, Y.; Xiao, Z.; Liu, Q. Accurate Object Localization in Remote Sensing Images Based on Convolutional Neural Networks. IEEE Trans. Geosci. Remote Sens. 2017, 55, 2486–2498. [Google Scholar] [CrossRef]
  44. Lv, W.; Zhao, Y.; Xu, S.; Wei, J.; Wang, G.; Cui, C.; Du, Y.; Dang, Q.; Liu, Y. DETRs Beat YOLOs on Real-time Object Detection. arXiv 2023, arXiv:2304.08069. [Google Scholar]
  45. Dipo, M.H.; Farid, F.A.; Mahmud, M.S.A.; Momtaz, M.; Rahman, S.; Uddin, J.; Karim, H.A. Real-Time Waste Detection and Classification Using YOLOv12-Based Deep Learning Model. Digital 2025, 5, 19. [Google Scholar] [CrossRef]
Figure 1. YOLOv8 network structure diagram, n denotes the number of Bottleneck model.
Remotesensing 17 02441 g001
Figure 2. SR-YOLOv8 network structure diagram.
Remotesensing 17 02441 g002
Figure 3. Structure of the SPD layer.
Remotesensing 17 02441 g003
Figure 4. Structure of RFAConv.
Remotesensing 17 02441 g004
Figure 5. Structure of SR-Conv.
Remotesensing 17 02441 g005
Figure 6. Comparison of (a) FPN, (b) PAN-FPN, and (c) BiFPN. P3–P7 denote feature maps from low-level to high-level.
Remotesensing 17 02441 g006
Figure 7. Structure after adding a small target detection layer.
Remotesensing 17 02441 g007
Figure 8. Example of a picture of the (a) aircraft target, (b) oil drum target, (c) overpass target, and (d) playground target in the RSOD dataset.
Remotesensing 17 02441 g008
Figure 9. Example image of the VisDrone2019 dataset.
Remotesensing 17 02441 g009
Figure 10. Sample size distribution of the training set for the Visdrone2019 dataset.
Remotesensing 17 02441 g010
Figure 11. Effect of different values of α on mAP@0.5.
Remotesensing 17 02441 g011
Figure 12. Comparison of mAP, precision, and recall on the VisDrone2019 dataset. (a) Comparison of mAP@0.5, (b) Comparison of mAP@0.5:0.95, (c) Comparison of precision, and (d) Comparison of recall.
Remotesensing 17 02441 g012
Figure 13. Comparison of mAP on the RSOD dataset. (a) Comparison of mAP@0.5 on the RSOD dataset, and (b) Comparison of mAP@0.5:0.95 on the RSOD dataset.
Remotesensing 17 02441 g013
Figure 14. Comparison of visualizations under the VisDrone2019 dataset. Red dashed boxes are used to mark regions with the most significant differences in detection results among different object detection models in the same complex scene (e.g., areas with dense vehicles/pedestrians).
Remotesensing 17 02441 g014
Figure 15. Comparison of visualizations under the RSOD dataset. Red dashed boxes are used to mark regions with the most significant differences in detection results among different object detection models in the same complex scene (e.g., areas with dense aircraft/oil tank).
Remotesensing 17 02441 g015
Table 1. Experimental hardware parameters.
Hardware NameRelevant Parameters
CPUIntel(R) Core(TM) i7-14650HX 2.20 GHz
GPURTX 4060, 8G
Operating systemWindows 11
Programming languagePython 3.10
CUDA12.2
Deep learning frameworksPyTorch 2.2.0
Table 2. Training process parameter settings.
Parameter NameParameter Information
Image size (imgsz)640 × 640
Optimiser (optimize)SGD
Batch size (batchsize)16
Initial learning rate (lr0)0.01
Cosine annealing parameter (lrf)0.01
Weight decay (weight_decay)0.0005
Momentum of learning rate (momentum)0.937
Training number (epoch)200
Table 3. Comparative experiments with different values of α. The best results are highlighted in bold.
α mAP@0.5/%mAP@0.5:0.95/%F1
α = 0 38.322.844.0
α = 0.2 38.623.144.1
α = 0.4 38.422.843.9
α = 0.6 38.222.743.8
α = 0.8 38.122.543.5
α = 1.0 38.523.044.0
Table 4. Comparison of different loss functions on the dataset VisDrone2019. The best results are highlighted in bold.
Loss FunctionmAP@0.5/%mAP@0.5:0.95/%F1
CIoU38.322.844.0
NWD38.523.044.0
SIoU37.922.343.2
GIoU38.122.643.6
WIoU37.522.242.7
EIoU38.422.943.8
NWD-CIoU38.623.144.1
Table 5. Ablation experiments on the dataset VisDrone2019. The best results are highlighted in bold.
MethodmAP@0.5/%mAP@0.5:0.95/%Precision/%Recall/%
Yolov8s38.322.852.038.2
+NWD38.623.151.538.6
+SR-Conv39.323.351.739.2
+BiFPN + P243.225.753.541.8
+NWD + SR-Conv39.923.551.939.7
+NWD + BiFPN + P243.326.253.642.1
+SR-Conv + BiFPN+ P243.926.554.842.6
+SR-Conv + BiFPN + P2 + NWD44.626.655.243.3
Table 6. Ablation experiments on the publicly available dataset RSOD.
MethodmAP@0.5/%mAP@0.5:0.95/%Param/MGFLOPs
Yolov8s0.9210.64611.128.7
+NWD0.9410.64911.128.7
+SR-Conv0.9340.66213.930.6
+BiFPN + P20.9350.64810.033.7
+NWD + SR-Conv0.9510.66713.930.6
+NWD + BiFPN + P20.9480.65110.033.7
+SR-Conv + BiFPN + P20.9450.66413.336.1
+SR-Conv + BiFPN + P2 + NWD0.9540.66913.336.1
Table 7. Comparison experiments on the dataset VisDrone2019. The best results are highlighted in bold.
MethodmAP@0.5/%F1Param/MGFLOPsFPS
Faster-RCNN34.141.043.3201.450
SSD23.631.426.185.6253
RT-DETR36.240.919.957.0/
YOLOv3s39.844.8123.661.571
YOLOv5s36.141.59.124.186
YOLOv6s37.541.832.944.095
YOLOv743.146.337.2105.395
YOLOv8s38.344.011.128.7167
YOLOv8m42.445.952.178.7122
YOLOv9s41.645.39.6138.8113
YOLOv10m41.445.216.4663.5126
YOLOv11m43.948.320.0467.7130
YOLOv12s42.646.19.321.4136
SOD-YOLO42.0/1.75//
SR-YOLO44.648.513.336.1107
Table 8. Comparison experiments on the dataset RSOD. The best results are highlighted in bold.
MethodmAP@0.5/%Precision/%Recall/%
YOLOv5s88.189.589.2
YOLOv5m89.787.188.9
YOLOv5l90.186.988.6
YOLOv790.584.292.3
YOLOv8n85.390.291.1
YOLOv8s92.194.591.5
YOLOv11s90.192.187.7
SR-YOLO95.497.393.3
Disclaimer/Publisher’s Note: The statements, opinions and data contained in all publications are solely those of the individual author(s) and contributor(s) and not of MDPI and/or the editor(s). MDPI and/or the editor(s) disclaim responsibility for any injury to people or property resulting from any ideas, methods, instructions or products referred to in the content.

