Abstract
Ningxia has emerged as a strategic hub for China’s photovoltaic (PV) industry by leveraging abundant solar energy resources and geoclimatic advantages. This study analyzed the spatiotemporal expansion trends and microclimatic impacts of PV installations (2015–2024) using Gaofen-1 (GF-1) and Landsat8 satellite imagery with deep learning algorithms and multidimensional environmental metrics. Among semantic segmentation models, DeepLabV3+ had the best performance in PV extraction, and the Mean Intersection over Union, precision, and F1-score were 91.97%, 89.02%, 89.2%, and 89.11%, respectively, with accuracies close to 100% after manual correction. Subsequent land surface temperature inversion and spatial buffer analysis quantified the thermal environmental effects of PV installation. Localized cooling patterns may be influenced by albedo and vegetation dynamics, though further validation is needed. The total PV site area in Ningxia expanded from 59.62 km2 to 410.06 km2 between 2015 and 2024. Yinchuan and Wuzhong cities were primary growth hubs; Yinchuan alone added 99.98 km2 (2022–2023) through localized policy incentives. PV installations induced significant daytime cooling effects within 0–100 m buffers, reducing ambient temperatures by 0.19–1.35 °C on average. The most pronounced cooling occurred in western desert regions during winter (maximum temperature differential = 1.97 °C). Agricultural zones in central Ningxia exhibited weaker thermal modulation due to coupled vegetation–PV interactions. Policy-driven land use optimization was the dominant catalyst for PV proliferation. This study validates “remote sensing + deep learning” framework efficacy in renewable energy monitoring and provides empirical insights into eco-environmental impacts under “PV + ecological restoration” paradigms, offering critical data support for energy–ecology synergy planning in arid regions.
1. Introduction
The global transition toward sustainable energy systems has led governments and research institutions to prioritize the development and utilization of renewable energy sources [1]. Among these, solar energy has seen widespread adoption due to its cleanliness, renewability, abundant availability, broad geographic distribution, and significant development potential. Since 2012, policy-driven initiatives in China have accelerated the expansion of photovoltaic (PV) infrastructure, resulting in a sharp increase in newly installed PV sites [2]. However, ecological concerns have emerged regarding large-scale PV installations, as PV arrays alter patterns of solar radiation absorption and may induce localized climatic changes [3,4,5].
Uncertainties remain as to whether PV systems significantly modify the surrounding surface thermal environment, which can, in turn, affect wildlife habitats and ecosystem functioning [6]. The rapid expansion of large-scale PV development has posed new scientific challenges. On one hand, existing monitoring techniques struggle to efficiently and accurately capture the spatial and temporal dynamics of PV installations. On the other hand, the mechanisms by which PV systems influence regional ecological conditions—particularly thermal environmental effects in areas with complex topography—remain inadequately understood. Therefore, systematic monitoring of PV spatial distribution and in-depth analysis of associated thermal impacts are essential for informing sustainable deployment strategies, optimizing regional development models, and mitigating potential ecological risks.
Traditional methods for monitoring PV sites have primarily relied on manual sampling and statistical data analysis. These approaches often fall short of meeting the demands of the rapidly growing PV industry due to inefficiencies, challenges in data collection, limited accuracy, and long monitoring cycles [7,8]. In contrast, remote sensing enables near-real-time detection of land use changes, and recent advances in computational algorithms have enhanced the capacity of machine learning to solve complex practical problems across various fields [9]. As a result, algorithms such as Random Forest (RF) and Support Vector Machine (SVM), along with their improved variants, have been applied to extract PV power plants for solar energy analysis [10,11,12,13,14]. Mapping algorithms integrated into the RF framework have further enhanced solar farm detection accuracy. While traditional machine learning methods offer computational efficiency, their high false detection rates in complex environments limit their effectiveness in diverse geographical settings. The development of deep learning has facilitated the use of advanced semantic segmentation models for PV site extraction. In 2018, a classical U-Net model was used to identify PV installations across various regions [15]. This was followed by the development of the SolarNet deep learning framework, which revealed the spatial distribution and scale of solar farms in China [16]. More recently, the TransUNet model was applied to determine the installation timelines of PV systems in the country [17].
The rapid global expansion of PV installations has raised concerns about potential environmental and ecological impacts. In 2011, it was shown that utility-scale solar power plants had positive or neutral effects on 26 out of 32 environmental indicators, performing better than conventional power generation technologies [18]. At the same time, differing thermal effects were reported: PV systems lowered ambient temperatures in urban areas but increased them in desert regions [19]. Previous research found little to no thermal effect from rooftop PV systems in cities [20,21]. A land surface temperature decrease of 0.049 °C was linked to large-scale PV deployment, attributed to reduced absorption of solar radiation [22]. In contrast, higher daytime air temperatures—up to 1.3 °C above surrounding levels—were recorded within PV arrays, with no significant nighttime change [23]. More recent data indicated no clear effect of PV systems on nearby air temperatures [24]. Using the single-window algorithm on Google Earth Engine (GEE) with multitemporal Landsat 8 imagery, consistently lower temperatures were detected at PV sites compared to surrounding buffer zones [25]. This cooling island effect ranged from 0.28 °C to 2.82 °C. As a new type of human-made land cover, PV installations cause energy redistribution that may disturb regional climate balance [26]. This impact is especially significant in the arid regions of Northwest China, where fragile ecosystems are vulnerable to chain reactions—such as vegetation loss and soil carbon decline—caused by temperature changes [27]. Under the framework of China’s “Dual Carbon” policy, evaluating the thermal effects of PV systems helps define scientific limits for land use planning. Such evidence-based assessment plays a key role in balancing renewable energy development with ecological protection.
Although recent advances in deep learning have significantly improved PV extraction capabilities, most existing studies rely on a single-model architecture and lack comprehensive comparisons across different deep learning models, particularly under complex geographical conditions. Research efforts have predominantly focused on typical desert environments, often overlooking the unique characteristics of composite terrains such as “desert–agricultural transition zones” and “urban–ecological intertwined zones”. Additionally, thermal environmental studies have generally focused on urban settings without incorporating the coupled effects of seasonal variation, topographic diversity, and vegetation cover. To address these limitations and research gaps, the present study introduces the following methodological innovations:
- (1)
- A unified validation platform for PV extraction was developed, enabling systematic evaluation of nine mainstream deep learning semantic segmentation models across complex geomorphic regions, including “desert–agricultural transition zones” and “urban–ecological intertwined zones”. The platform standardizes data preprocessing, supports randomized sample selection, facilitates model adaptation and optimization, and incorporates a multi-indicator performance evaluation framework.
- (2)
- A comprehensive analytical framework was constructed by integrating Gaofen-1 (GF-1) multispectral imagery with Landsat-derived land surface temperature products to investigate PV–thermal environmental interactions in arid regions. The approach combines spatial buffer analysis, morphological metrics of PV patches, and seasonal and regional dimensions, thereby achieving deep coupling of multi-source remote sensing data, spatial structure characteristics, and temporal–seasonal factors.
- (3)
- A long-term PV database covering the period from 2015 to 2024 was compiled to quantitatively assess the dual-driven expansion mechanism characterized by “land resource optimization–policy incentive” dynamics. This database enables in-depth analysis of PV development across individual cities and the broader Ningxia Hui Autonomous Region, providing an empirical foundation for evaluating the effectiveness of related policy interventions.
As a pivotal transmission hub for PV power, Ningxia offers an ideal landscape for PV industry development [3]. Compared with the different regions such as Qinghai and Xinjiang, Ningxia’s terrain is characterized by a “desert–agricultural transition zone”, an “urban–ecological interlacing zone”, and other composite terrain. Furthermore, recent local policies, exemplified by the Ningxia High-Quality PV Industry Development Action Plan, have accelerated regional PV expansion. Therefore, this study will take Ningxia as a typical study area, whose “desert–agriculture” transition zone characteristics provide an ideal scenario for validating the framework. This study provides critical references for Ningxia’s PV site construction while enabling policymakers to monitor development progress and forecast future potential. Furthermore, it establishes a transferable framework for synergistic new energy deployment–ecological protection planning in arid regions.
2. Materials and Methods
2.1. Study Area
Situated in the upper-middle reaches of the Yellow River in northwestern China, the Ningxia Hui Autonomous Region covers a total area of 66,400 km2 and features a temperate continental arid to semiarid climate [28]. Elevation ranges from 1000 to 3600 m above sea level, with latitudes and longitudes spanning 35–40°N and 104–108°E, respectively. The complex topography includes mountains, plateaus, plains, hills, and river valleys. Ningxia has exceptional solar energy potential, with an annual sunshine duration exceeding 3000 h and solar radiation intensity reaching 5500 MJ/m2, ranking among the highest in China [3]. Leveraging the national West-to-East Power Transmission Program, Ningxia has emerged as a pivotal transmission hub for PV power in northwestern China, supported by the most extensive ultra-high-voltage grid infrastructure in the country.
Figure 1 illustrates the geographical location of the Ningxia Hui Autonomous Region.
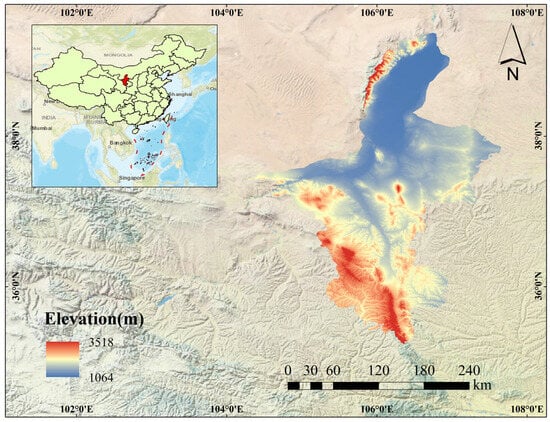
Figure 1.
Geographic location map of the Ningxia Hui Autonomous Region (Review No. GS (2024)0650).
Utility-scale PV installations typically occupy larger areas with simpler surrounding elements, whereas rooftop and greenhouse-integrated PV systems have smaller footprints and complex heterogeneous surroundings. Given the 16 m spatial resolution of GF-1 wide-swath satellite imagery, rooftop and greenhouse PV arrays often fall below the detection threshold. Consequently, this study focused exclusively on utility-scale solar PV installations in Ningxia, excluding distributed PV systems integrated with buildings or agricultural infrastructure.
2.2. Data Acquisition and Preprocessing
The GF-1 wide-swath satellite integrated four cameras with a spatial resolution of 16 m and revisit cycle of four days. The following four multispectral bands were used to enable high-precision, high-frequency observations, and effectively distinguish PV panels from bare soil and vegetation: blue (450–520 nm), green (520–590 nm), red (630–690 nm), and near-infrared (770–890 nm). The four cameras were combined to extend the swath width to 800 km. This significantly enhanced large-scale surface monitoring and detection capabilities [29], while minimizing temporal inconsistencies caused by the revisit cycle. This study utilized GF-1 imagery acquired from the China Land Observation Satellite Data Service Platform (https://data.cresda.cn, accessed on 11 July 2025) to analyze the PV development in Ningxia. Data were collected annually (2015–2024) from September to October to mitigate seasonal variability, with cloud cover constrained to <2%. Given seasonal aerosol optical thickness variations and atmospheric scattering effects compromising surface reflectance in Ningxia’s arid zone [30], all satellite images underwent essential preprocessing. Atmospheric correction and radiometric calibration were systematically applied to enhance image quality and ensure analytical accuracy. The resulting processed GF-1 dataset for Ningxia served as the foundation for subsequent analysis. The surface temperature retrieval utilized Landsat L2 data products [31]: specifically, the STB10 thermal infrared band was processed through the single-channel algorithm co-developed by the Rochester Institute of Technology and the NASA Jet Propulsion Laboratory [32]. Temperature inversion was performed using Landsat 8 L2 level surface temperature products, where the STB10 band, with a spatial resolution of 100 m, was generated by preprocessing with a single-channel algorithm as shown in Equation (1) [33]. It is used to quantify the thermal environmental effects of the PV site.
where γ and δ are the two parameters of the Planck function, which can be obtained from Equations (2)–(4).
In the above equation, is the radiation value, is the surface specific emissivity, is the bright temperature value at the sensor, and are the calibration constants for the thermal infrared band, is the center wavelength or effective wavelength of the thermal infrared band, and and are Planck’s radiation constants. In this paper, the details of the GF-1 images and Landsat 8 images used are shown in Table 1.

Table 1.
Details of data used.
2.3. Research Methodology
The methodological workflow is illustrated in Figure 2. This study first acquired and preprocessed GF-1 WFV and Landsat imagery (2015–2024) using the Section 2.2 methodology to ensure data accuracy. We constructed a representative PV site dataset by uniformly sampling images across Ningxia’s municipalities and diverse terrain types. Nine semantic segmentation algorithms underwent comprehensive accuracy assessment, with the optimal-performing model subsequently applied for decade-long PV extraction throughout Ningxia. Extracted PV patches underwent manual verification and error rectification to ensure extraction precision. Finally, we integrated Landsat-derived temperature inversions to analyze spatiotemporal PV expansion patterns and thermal effects, enabling evidence-based decision analysis.
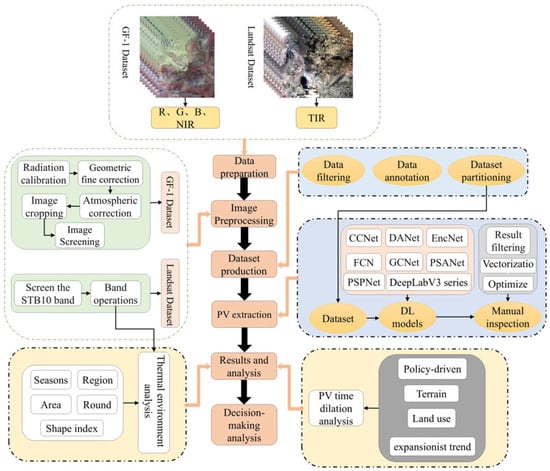
Figure 2.
Technical line of research.
In this study, images within 10 years (2015–2024) of Ningxia Hui Autonomous Region were used to establish a unified PV extraction accuracy validation platform, and the validated algorithms included the following nine: CCNet [34], DANet [35], EncNet [36], FCN [37], GCNet [38], PSANet [39], PSPNet [40], DeepLabV3 [41], and DeepLabV3+ [42]. The nine selected semantic segmentation models represent core paradigms within the field. FCN serves as the foundational end-to-end semantic segmentation network, providing the structural basis for subsequent models. The DeepLab series effectively mitigates resolution loss through atrous convolution, while PSPNet and PSANet enhance multiscale recognition via pyramid pooling modules. CCNet and DANet employ attention mechanisms to improve feature discrimination, with CCNet demonstrating particular effectiveness in road extraction tasks [43]. EncNet incorporates contextual encoding through global contextual information integration, and GCNet and EncNet advance global context modeling. Collectively, these nine models enable comprehensive assessment of PV feature extraction capabilities across diverse structural approaches.
We divide the dataset into a training set, a validation set, and a test set at an 8:1:1 ratio to ensure a balanced distribution of samples in different regions and backgrounds. The model is trained based on the Pytorch framework, and the detailed environmental parameters are shown in Table 2. In order to fully explore the potential of the models and ensure fair comparison, the Stochastic Gradient Descent (SGD) optimizer, the Polynomial Attenuation Learning Rate (PolyLR) strategy, and the initial learning rate were all set to 0.01 for all 9 models.

Table 2.
Environmental parameters.
2.3.1. PV Site
A hybrid methodology combining manual verification with deep learning techniques was employed to facilitate automated PV installation extraction in Ningxia. Previous studies have developed PV datasets using manual visual interpretation in conjunction with remote sensing imagery [44]. In the present study, a dedicated PV dataset was constructed based on preprocessed GF-1 satellite imagery, comprising 1316 annotated samples.
The geographic distribution of these samples was designed to reflect both global coverage principles and regional representativeness. Data collection systematically encompassed key PV industry development zones within Ningxia. The majority of samples were derived from Yinchuan, Wuzhong, and Zhongwei, with supplementary selections from Shizuishan and Guyuan to ensure full coverage across all five prefecture-level cities. Spatial sampling captured the characteristics of PV sites across Ningxia’s dominant landforms, including western desert areas, central agricultural–grassland transition zones, northern plains and urban peripheries, and southern hilly and mountainous regions. This strategy enabled the detection of spectral and morphological variations across distinct geographical contexts.
Sample selection focused exclusively on operational utility-scale, ground-mounted PV plants, deliberately excluding rooftop and greenhouse installations. Environmental diversity was incorporated through the inclusion of sites situated in various terrain types such as deserts, farmlands, grasslands, and hills. To ensure high data quality, only GF-1 imagery with less than 2% cloud cover and optimal radiometric quality was utilized. All imagery was acquired uniformly during the September–October period to minimize seasonal spectral variation and atmospheric interference, thereby enhancing dataset consistency, as illustrated in Figure 3.
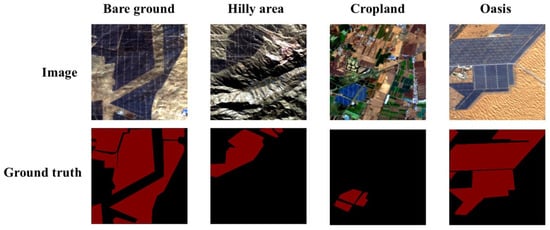
Figure 3.
Typical site for PV.
The optimal deep learning algorithm was subsequently applied for PV extraction. Manual refinement was then conducted to achieve near-perfect segmentation accuracy.
We input nine different semantic segmentation algorithms into the homemade PV dataset, compared the performance of different algorithms in PV extraction, filtered the algorithm with the highest accuracy, utilized the algorithm for PV extraction, and used MIoU, precision, recall, and F1-scores to evaluate the performance of the algorithms before manually checking to ensure the accuracy of the segmentation.
MIoU, precision, recall, and F1-score are critical evaluation metrics in semantic segmentation tasks. MIoU quantifies the overlap ratio between the predicted and ground-truth segmentation masks across all classes. Precision indicates the proportion of correctly predicted positive instances among all samples classified as positive by the model. Recall represents a model’s ability to identify true-positive instances within an actual positive class. F1-score evaluates the binary classification accuracy by harmonizing the precision and recall through their harmonic mean. The four metrics were calculated using Equations (5)–(8):
In this formulation, represents the total class count in the multiclass segmentation, corresponds to correctly identified target pixels, indicates undetected target pixels, and FP denotes non-target pixels misclassified as targets.
2.3.2. Thermal Environment
Given the predominant distribution of PV installations across northern, eastern, western, and central Ningxia [45], this study systematically assessed the ecological impact of PV expansion by examining the thermal environmental variations under diverse geographical, ecological, and seasonal conditions. PV sites distant from water bodies, vegetation, and infrastructure were selected in these four subregions, and buffer zones were established to evaluate the spatiotemporal impacts on the local and surrounding environments. Aligning with Ningxia’s climatic regime, spring (March–May), summer (June–August), autumn (September–November), and winter (December–February), representative dates were sampled in April (spring), July (summer), October (autumn), and January (winter) in 2024. This temporal stratification enabled a comparative analysis of seasonal and regional thermal dynamics across PV clusters.
The STB10 band of Landsat’s L2 surface temperature product was used for temperature inversion [32]. Geospatial analysis integrated these thermal datasets with vectorized PV site boundaries to quantify localized thermal perturbations. Sampling prioritized isolated PV clusters to mitigate confounding thermal influences from adjacent land cover types (Figure 4). The transit time of this satellite in China is approximately 12:00 p.m. Beijing time; therefore, a study was conducted of the impact of the thermal environment at noon during the day.
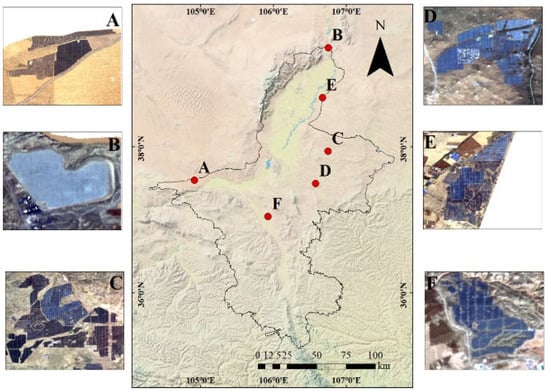
Figure 4.
Cluster of PV sites in the constituency. (A–F) are typical PV origins and locations.
The spatial extent of thermal environmental impacts associated with PV installations was assessed through the delineation of three concentric buffer zones (0–100 m, 100–200 m, and 200–300 m) extending outward from the boundaries of PV cluster vector polygons. Within each buffer zone, as well as within the PV sites themselves, mean land surface temperatures were extracted and subjected to statistical analysis to quantify thermal influence gradients [46]. In this study, the defined buffer zone represents the physical transition zone between the PV array and the natural ground surface, and its temperature gradient reflects the microclimatic characteristics of the temporal junction zone rather than the modifying effect of the PV on the land cover within the buffer zone. The heterogeneous shapes of PV installations modulated their thermal interactions with the surrounding environment [47,48], which prompted us to evaluate correlations between the buffer zone thermal dynamics and three geometric metrics: area, perimeter, and shape index (Equation (9)). The shape index, a dimensionless parameter reflecting structural complexity and compactness for all PV clusters was calculated. The vector polygon statistics are summarized in Table 3.

Table 3.
Statistical information on vector polygons of PV sites.
The shape index quantifies the morphological complexity of the PV site vector polygons, where denotes the perimeter and represents the surface area.
The analyzed PV site vector polygons exhibited significant variations in area, perimeter, and shape index. The largest and smallest PV sites covered 23.670 km2 and 0.194 km2, respectively. Perimeter measurements ranged from 0.54 km to 29.589 km, with the longest perimeter corresponding to the largest site and shortest to the smallest. The shape indices varied between 16.036 and 62.068, exhibiting minimal correlation with area and perimeter. Surface temperatures across PV clusters ranged from 23.38 °C to 29.52 °C, with an average of 26.02 °C and near-normal distributions.
3. Results
3.1. PV Site Extraction

Table 4.
Algorithm accuracies.
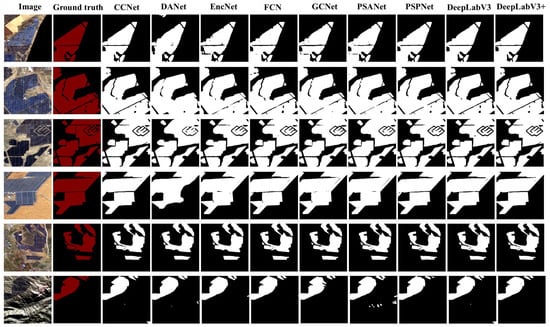
Figure 5.
Forecast result comparison.
Table 4 demonstrates the superior performance of the DeepLabV3+ algorithm, achieving MIoU, precision, recall, and F1-score values of 91.97%, 89.02%, 89.20%, and 89.11%, respectively.
The results in Figure 5 provide further support for the enhanced capability of DeepLabV3+ to preserve fine-grained details and improve extraction accuracy. Consequently, the DeepLabV3+ model was employed for subsequent processing and analysis. As an improved iteration of DeepLabV3, this model integrates an encoder–decoder architecture with multiscale feature fusion mechanisms, significantly advancing segmentation precision and detail recovery [42]. The core design of the model combines atrous convolution and depth-wise separable convolution to optimize computational efficiency while strengthening multiscale feature extraction. Figure 6 illustrates the network structure of the DeepLabV3+ model.
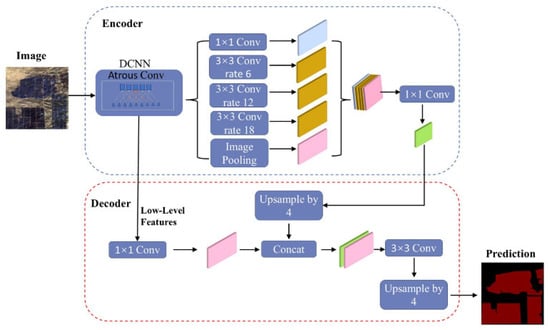
Figure 6.
DeepLabV3+ network structure diagram.
Following PV extraction using the DeepLabV3+ algorithm, predictions with significant errors were manually corrected to ensure extraction accuracy and analytical reliability. First, a coordinate system was defined, and the prediction results were reclassified to facilitate subsequent vectorization. Subsequently, vectorization was implemented using the ArcScan extension in ArcMap 10.8, and the vectorized PV boundaries were manually refined to achieve near-100% spatial accuracy. In the optimization process, focus on PV sites with large segmentation errors, merging PV sites that have been misclassified into multiple small patches, segmenting large misdirected areas that have been confused with bare ground or sandy spectra, eliminating misdirected portions, and supplementing identified areas to ensure post-check accuracy.
Figure 7 illustrates the postprocessing workflow.

Figure 7.
Manual correction flowchart.
3.2. Spatial and Temporal Expansion Patterns of PV Sites
3.2.1. Spatial and Temporal Expansion of PV Sites in Municipalities
Applying the aforementioned methodology, the spatial distribution of PV installations was quantified across municipalities in the Ningxia Hui Autonomous Region. The detailed area statistics are summarized in Table 5.

Table 5.
Area of PV sites per year (2015–2024).
Table 5 shows that PV installations in Ningxia are relatively limited in 2015, covering a total area of 59.6196 km2. Zhongwei City dominates the regional distribution, hosting 24.4614 km2 (44.3% of the total), followed by Wuzhong City at 13.6265 km2 (22.8%). Shizuishan, Yinchuan, and Guyuan exhibit minimal PV development during this period, indicating a spatial concentration in central-western Ningxia. By 2024, the total PV area is expected to surge to 410.0630 km2, with Yinchuan City emerging as the primary hub at 171.2072 km2 (41.7%), followed by Wuzhong City at 104.7697 km2 (25.5%). This expansion reflects a pronounced eastward and central shift in regional PV development.
3.2.2. Time Dilation Patterns of PV Sites
Based on Table 5, decadal PV area change curves and growth rate charts were generated for each municipality (Figure 8).
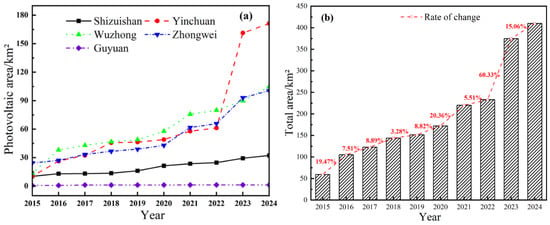
Figure 8.
Change curve of PV site area by city (2015–2024). (a) Change in PV site area by city. (b) Total PV area and rate of change in Ningxia region.
Figure 8a shows the distinct decadal PV expansion patterns among the Ningxia municipalities. Guyuan exhibits minimal growth over the 2015–2024 period, due to rugged terrain in the region characterized by rolling hills and complex gullies. Shizuishan experienced gradual PV expansion from 2015 to 2019, followed by accelerated growth from 2019 to 2024. Yinchuan maintains steady growth between 2015 and 2022 and then shows a dramatic surge between 2022 and 2023 with 99.9845 km2 of new PV installations—61% of its total decadal increase—before returning to baseline growth rates between 2023 and 2024. By 2024, Yinchuan is expected to dominate regional PV development at 171.2072 km2, marking a 160.7656 km2 increase from the 2015 baseline of 10.4416 km2. Wuzhong sustains consistent growth throughout the decade, whereas Zhongwei transitions from slow expansion (2015–2020) to rapid development (2020–2024). Collectively, the four municipalities demonstrate sustained growth trajectories, with Yinchuan emerging as the primary growth driver after 2022, whereas Guyuan’s contributions remain negligible except during brief prominence in 2022.
Integrated analysis of Figure 8b and Table 5 reveals a total PV expansion of 350.4434 km2 in Ningxia (2015–2024) and annual growth rate of 22.6%. During 2015–2016, the area increased by 19.47%, followed by stable annual growth averaging 8% from 2016 to 2020, excluding a minor 3.28% increase during 2018–2019. The 2020–2021 period witnesses accelerated growth (20.36%), driven primarily by expansions in Wuzhong and Zhongwei. The most dramatic surge occurs in 2022–2023 (60.33%), with Yinchuan contributing 141.6695 km2—40.42% of the decade’s total growth during this single year. The subsequent years (2021–2022 and 2023–2024) exhibit moderate growth rates of 5.51% and 15.06%, respectively, reflecting shifting regional development priorities.
3.2.3. Spatial Expansion Patterns of PV Sites
Figure 9 illustrates the spatiotemporal evolution of PV installations in Ningxia across distinct phases. During 2015–2016, PV development primarily occurs in the desert regions of Zhongwei and western Wuzhong, exhibiting a decentralized distribution pattern. Zhongwei dominates early-stage deployment, accounting for 46.3% of the total PV area, owing to its abundant barren land and low development costs. During 2017–2018, PV clusters are concentrated in Yinchuan’s eastern agro-desert transition zone and northern Zhongwei, achieving an annual growth of 28.9% and forming a linear belt pattern along the eastern foothills of the Helan Mountains. Simultaneously, western Wuzhong expands PV installations along the Yellow River irrigation zone margins, balancing agricultural and desert land uses. Between 2019 and 2020, Yinchuan’s eastern sector undergoes large-scale contiguous development, driving a 48.9% increase in area, whereas Wuzhong prioritized southern expansion. From 2021 to 2022, PV deployment in Yinchuan surged exponentially, forming a large-scale PV matrix that expanded by 99.98 km2 within a single year. Spatial analysis (Figure 9d,e) reveals over 90% of new installations concentrated in desert areas along the Yellow River’s eastern bank, specifically at the Yinchuan–Wuzhong administrative boundary. This distinctive belt-shaped expansion pattern significantly exceeded development rates observed elsewhere in Ningxia. Meanwhile, Wuzhong and Zhongwei adopted agricultural–PV complementary models, strategically positioning installations within desert–farmland transition zones to balance power generation efficiency with land conservation priorities. From 2023 to 2024, the regional PV expansion transitions into a balanced spatial allocation phase.
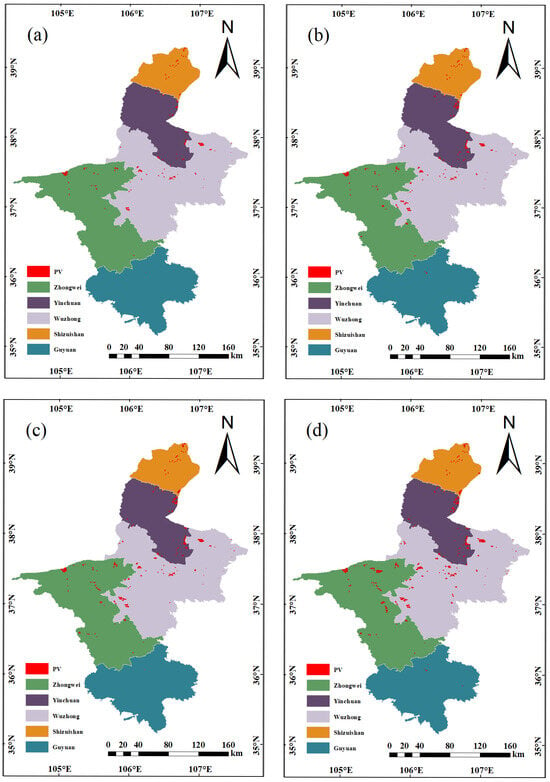
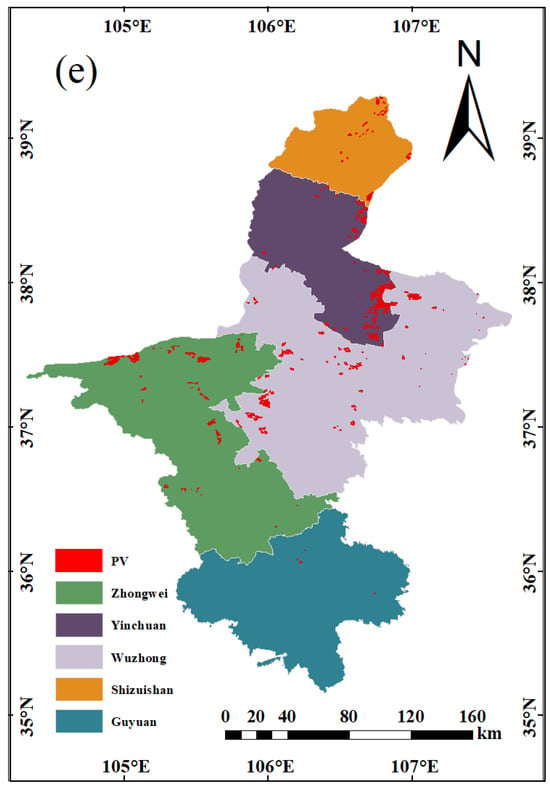
Figure 9.
Spatial distribution of PV sites (2015–2024): (a) 2015–2016, (b) 2017–2018, (c) 2019–2020, (d) 2021–2022, (e) 2023–2024.
3.3. PV Site Impact on the Thermal Environment
3.3.1. Impact of Distance on the Surrounding Thermal Environment
PV installations typically alter soil temperature dynamics by modifying the direct shortwave radiation input and outgoing longwave radiation fluxes at the surface [49]. The convective heat exchange and reflected radiation from PV panels extend 20–40 times their module height. Given typical PV module heights of 3–4 m, this exchange process influences distances of 60–160 m. The 100 m scale proves particularly consequential as it represents the key spatial unit for desert microclimate regulation and farmland shelterbelt function—effectively capturing vegetation–PV interactions. This 100 m scale also aligns with the native resolution of Landsat Thermal Infrared (TIR) imagery, ensuring observational compatibility for temperature inversion analysis [32]. Therefore, to quantify the distance-dependent thermal impacts of PV clusters, the mean temperatures within three concentric buffer zones (0–100 m, 100–200 m, and 200–300 m) were calculated, and the temperature gradients were derived by comparing adjacent zones: 0–100 m vs. PV core areas, 100–200 m vs. 0–100 m, and 200–300 m vs. 100–200 m. Table 6 summarizes these thermal differentials, revealing spatially stratified cooling/heating patterns across buffer distances.

Table 6.
Average temperature statistics within the PV and buffer zones.
Analysis of thermal gradients across PV sites, based on Figure 10 and Table 6, reveals three key patterns. First, a progressive attenuation of cooling effects with increasing distance from PV installations is observed. Temperature differentials between adjacent buffer zones follow a descending hierarchy—(D − C) < (C − B) < (B − A)—as reflected in the majority of entries in Table 6. This trend indicates that differences in average temperatures between neighboring buffer zones diminish with increasing distance from the PV site, suggesting a gradual decline in the cooling influence exerted by the PV installations.
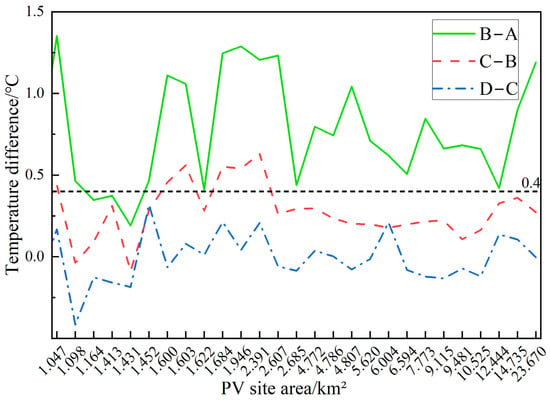
Figure 10.
Temperature difference between neighboring buffers.
Second, more than 92% of the 0–100 m buffer zones exhibit temperature differentials exceeding 0.4 °C relative to PV surfaces. In the 100–200 m buffer zones, this threshold is met in nine instances, whereas no such exceedance is observed in the 200–300 m zones. These findings demonstrate a rapid reduction in thermal effects beyond the immediate vicinity of the PV installations.
Third, PV installations with an area greater than 1.452 km2 consistently produce temperature differentials exceeding 0.4 °C within the 0–100 m buffers and maintain positive thermal gradients in the 100–200 m zones. This indicates enhanced thermal modulation capacity associated with larger-scale PV systems.
The surface temperature of the PV panels is significantly lower than that of the neighboring homogeneous subsurface, and its temperature gradient with respect to the 0–100 m transition zone suggests that the cooling effect decays rapidly at the edge of the PV arrays.
3.3.2. Factors Affecting the Surrounding Thermal Environment of PV Site Patches
Significant thermal impacts of PV installations within 100 m buffer zones were established in Section 3.3.1. As the construction of PV power plants is accompanied by physical shading, the conversion of radiant energy into electrical energy will lead to an impact on the thermal environment. The PV site’s own characteristics directly affect its shading size. Therefore, in order to analyze whether the PV site’s own characteristics will have an impact on the thermal environment, the area, perimeter, and shape index of the PV site are, respectively, correlated with B-A in Table 4 to show the size of the impact of the area, perimeter, and shape index on the average temperature of the buffer zone. Figure 11a–c present scatterplots of the respective correlations, revealing distinct relationships between each morphological feature and localized cooling efficacy.
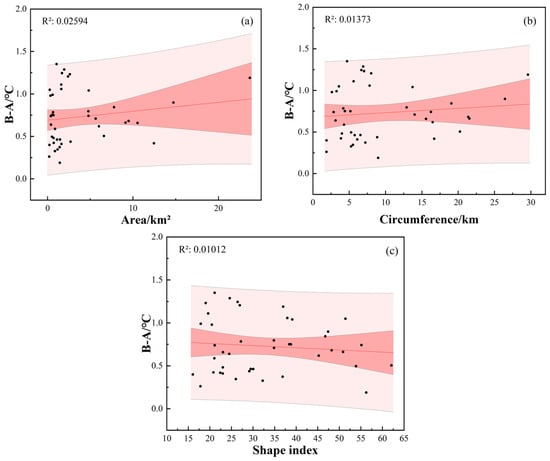
Figure 11.
Correlation between different factors and buffer temperatures. (a) Area vs. temperature of 0–100 m buffer. (b) Perimeter vs. temperature of 0–100 m buffer. (c) Morphological index vs. temperature of 0–100 m buffer.
As can be seen from Figure 11, area, the perimeter and shape indices do not have significant statistical PV site correlation with the surrounding thermal environment, indicating that the geometrical characteristics of PV sites do not affect their thermal effect, confirming that the physical nature of the PV thermal effect depends on the efficiency of the solar radiation–electrical energy conversion rather than on the site morphology design.
4. Discussion
4.1. Drivers and Policy Factors for PV Expansion
The results demonstrate substantial decadal expansion of PV installations across Ningxia, with the total area increasing from 59.62 km2 to 410.06 km2 between 2015 and 2024. Yinchuan emerged as the dominant hub, where PV installations expanded from 10.44 km2 to 171.21 km2 during this period. Factors of the terrain can limit PV development [50]. Western desert regions prioritized large-scale development owing to low land costs and contiguous terrain suitability, whereas central agricultural zones faced growth constraints from ecological conservation redlines. Guyuan experienced prolonged stagnation due to topographical fragmentation, while Shizuishan exhibited slower growth rates constrained by competition from industrial land use.
The rapid expansion of PV installations in Ningxia is closely aligned with robust policy support at national and regional levels. The post-2015 policy frameworks, including China’s 13th and 14th Five-Year Plans prioritizing renewable energy, designated Ningxia as the national clean energy base [51,52,53] (Figure 12). Provincial land use policies favoring the desert and Gobi terrain, coupled with feed-in tariffs and tax incentives, have attracted substantial investments. The 2020 Ningxia High-Quality Clean Energy Industry Development Plan failed to accelerate PV growth, which is likely attributable to COVID-19 disruptions [51]. Yinchuan’s exponential 2022–2023 expansion directly correlates with the Ningxia PV Industry High-Quality Development Action Plan (2022–2025), which established Yinchuan as a “PV–hydrogen synergy” innovation hub and funded “PV-storage integration” pilot projects, the implementation of a “modular desert unutilized land utilization” policy concentrated new PV developments across fragmented desert terrains within Yinchuan City. Due to this policy’s introduction, PV deployment accelerated significantly while effectively preventing cropland encroachment conflicts. Furthermore, the upgraded ultra-high-voltage transmission infrastructure under the West-East Power Transmission Project enhanced the grid export capacity and alleviated local curtailment pressures. These synergistic policies provide economic incentives and an infrastructural foundation for scaled PV deployment.
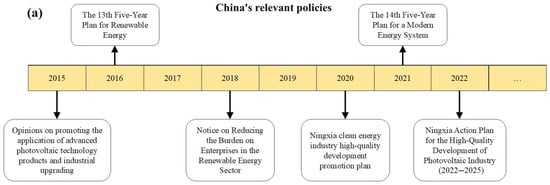
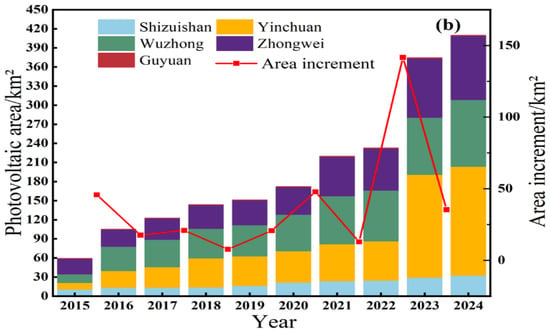
Figure 12.
Main relevant policies and impacts (2015–2024). (a) Relevant national policies. (b) PV area and annual changes by municipality.
4.2. Mechanisms for PV Site Impacts on the Thermal Environment
This study demonstrated that PV installations induced significant cooling effects within 0–100 m buffer zones, with mean temperature differentials ranging from 0.4 °C to 1.97 °C. This thermal mitigation primarily stems from the low reflectivity of PV panels, which convert incoming solar radiation into electricity to reduce surface heat accumulation, whereas shading accelerates ground temperature decline [49]. Cooling efficacy diminishes with distance due to convective airflows and thermal diffusion [54]. The synergistic effect of high albedo and PV panels on the desert surface exacerbates the cooling effect of PV [55], while the cooling effect of PV is weakened in the central region due to the seasonal change in vegetation cover and the transpiration of vegetation in spring and summer. These findings are consistent with those of Lu [22], who reported PV-induced surface cooling. Furthermore, no statistically significant correlation exists between the geometric characteristics of PV sites and local thermal environments. The observed thermal effect fundamentally represents an energy redistribution process: solar panels convert radiant energy into electricity without generating excess thermal impact relative to buffer zones. While geometric configurations alter the spatial distribution of energy, they do not affect the total energy balance [19]. This thermodynamic principle explains the weak correlation between PV site geometry and observed surface temperature differentials.
4.3. Ecological and Geographical Causes of Regional Differences
Figure 13 illustrates the regional and seasonal variations in mean temperatures across the PV installations and their buffer zones in Ningxia, providing quantitative insights into the spatiotemporal thermal dynamics under diverse climatic and geographic conditions.
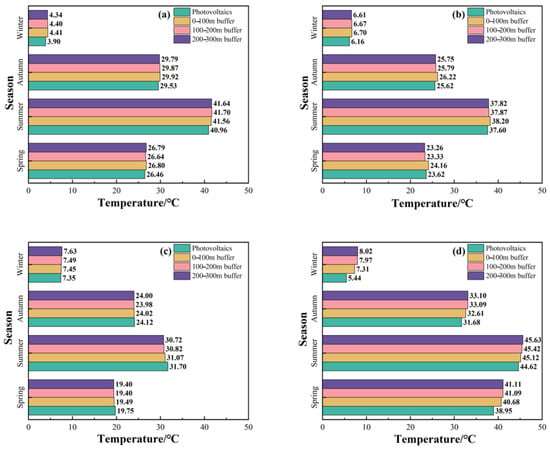
Figure 13.
Temperature map of PV sites and surrounding buffer zones among different regions and seasons. Impact of PV on the surrounding thermal environment in (a) Ningbei, (b) Ningdong, (c) Ningzhong, and (d) Ningxi.
Figure 13a,b demonstrate that PV installations in northern and eastern Ningxia exhibit thermal impacts consistent with the conclusions of Section 3.3.1, primarily influencing their immediate footprint and adjacent 0–100 m buffer zones. However, there is no significant impact in northern Ningxia in the spring and the fall; this is due to the fact that northern Ningxia is an urban agglomeration, with a large number of buildings and vehicles, which makes the temperature, to a certain degree, be affected by the warming effect, weakened with the increase in the distance from the building facade [56]. Fassbender’s study similarly identified summertime thermal microclimate warming around urban PV installations, reducing outdoor thermal comfort [57]. Further analysis of northern Ningxia’s thermal profiles revealed that PV clusters achieved their most pronounced self-cooling effects during summer and winter, with seasonal variations in temperature mitigation aligned closely with regional climatic extremes. Meanwhile, Cortesde’s research demonstrates that solar PV deployments facilitate daytime and nocturnal building cooling—a finding consistent with our observed cooling effects within 100 m buffer zones [58].
Figure 13c reveals the different heat influence patterns of PV installations in central Ningxia compared to those in northern and eastern regions. Evapotranspiration (ET) can change surface temperatures through surface energy partitioning, and precipitation vegetation conditions are key determinants of localized ET [59]. PV installations in central Ningxia heat themselves in spring and summer, and they have a cooling effect in winter. This divergence stems from the dominant grassland and cropland land cover in central Ningxia. Spring and summer are the critical growth seasons for vegetation, in which plant evapotranspiration drives thermal elevation and counteracts PV cooling effects. The vegetation cover is negatively correlated with cooling [60]. As vegetation diminishes in late autumn, surface heat dissipation increases and enables a gradual temperature decline. In winter, dormant vegetation exerts a minimal thermal influence and PV clusters exhibit pronounced cooling effects. These dynamics indicate that grassland and cropland thermal regulation dominates the microclimate of central Ningxia during spring, summer, and autumn, whereas PV installations become the primary thermal drivers in winter.
Figure 13d demonstrates the enhanced cooling efficacy of PV installations in western Ningxia’s desert regions, with maximum thermal mitigation observed during winter (1.97 °C differential between PV cores and 0–100 m buffers) and spring (1.85 °C), followed by autumn (1.73 °C). Summer exhibits the lowest yet significant cooling (0.49 °C). At the same time, this finding is consistent with Chang’s research that large-scale PV sites in desert deserts cause surface temperatures to drop during the day, and that the magnitude of the change is positively correlated with the installed capacity of the PV plant [61]. Most of western Ningxia is desert area. This enhanced mitigation stems from intense solar irradiance in desert environments, where PV arrays divert solar energy into electricity generation [62]. This substantially reduces ground-level radiation, thereby forcing and amplifying surface cooling effects.
Some studies have shown that different types of PV power plants may experience different temperatures due to different climatic environments during the same season [63]. Significant variations in PV-induced thermal effects across the Ningxia subregions reflect the complex interplay between geographical settings and ecosystem dynamics. In the western desert–steppe transition zones, sparse vegetation allows PV panels to directly shade exposed surfaces, inducing pronounced cooling through unattenuated radiative modulation. Central agricultural grassland ecosystems exhibit weaker thermal mitigation owing to latent heat release from vegetation evapotranspiration during spring and summer, which counteracts the PV cooling mechanisms [64]. Northern urban clusters, characterized by high building density and anthropogenic heat emissions, may further disrupt the localized thermal regulation by PV installations. At this time, the thermal environmental effect of the PV site on the city is not significant [20]. These regional disparities underscore the necessity for spatially adaptive PV deployment strategies. To minimize unintended microclimate impacts, future strategies should prioritize decertified lands for the dual benefits of PV-driven desertification control and ecological restoration while avoiding ecologically sensitive areas, such as wetlands and prime croplands.
4.4. Policy Implications for Urban Planning
Drawing on the observed localized cooling effects and the spatial heterogeneity of PV-induced LST patterns, several policy-oriented strategies are recommended to mitigate potential heat stress risks in arid urban environments. First, the establishment of green buffer zones is suggested to reduce waste heat accumulation and enhance local microclimate regulation. Second, the implementation of high-albedo or reflective surface materials in adjacent urban infrastructure can help offset the thermal impact of large-scale PV installations, thereby lowering urban heat loads. Third, adjustments to land use classifications are proposed to ensure that high-density PV developments are sited away from residential areas and ecologically sensitive zones, minimizing potential heat exposure and ecological disruption. These strategies offer practical measures to align renewable energy deployment with climate-adaptive urban design, ultimately contributing to the sustainability and resilience of built environments in arid regions.
4.5. Study Strengths and Limitations
This study leveraged the DeepLabV3+ algorithm and GF-1 wide-format camera-captured imagery to achieve high-precision PV installation extraction, which demonstrated marked efficiency improvements over traditional manual interpretations. However, three key limitations persist: (1) The GF-1 wide-format camera captured images with a spatial resolution of 16 m, limiting the detection capacity for rooftops and small-scale distributed PV systems, potentially under sampling fragmented installations. Homogeneous texture features are also crucial for PV extraction, which we have overlooked [65,66]. (2) Thermal impact analysis relies on Landsat-derived surface temperature products with a 16-day temporal resolution, which cannot resolve diurnal thermal dynamics and exclusively evaluate daytime effects. This omits nocturnal interactions. And (3) meteorological confounders, including cloud cover and atmospheric humidity, remain unaccounted for in temperature inversion models. Future studies should integrate higher-resolution imagery with synoptic meteorological data to enhance model generalizability across spatial scales and environmental conditions.
5. Conclusions
The present study combines multi-source remote sensing data with deep learning technology to reveal the complex mechanisms of mutual feedback between new energy development and ecological environment in arid areas. DeepLabV3+ was identified as the most effective model for PV extraction in composite terrains through a systematic comparison of nine deep learning semantic segmentation architectures. Although the overall performance of these models was relatively similar, notable differences emerged under specific geographic conditions and evaluation metrics. Models based on atrous convolution structures, such as the DeepLab series, demonstrated superior stability and accuracy in complex environments, particularly in desert–agriculture transition zones. In contrast, models incorporating context-encoding modules, such as EncNet and GCNet, exhibited comparatively lower extraction accuracy in these settings (Table 4 and Figure 5). These findings support the value of the proposed model validation platform in selecting task-specific models for PV extraction. Moreover, the framework’s design allows for potential transferability across arid regions with similar landform and spectral conditions, offering practical guidance for model deployment in real-world scenarios. Future work may focus on improving the generalization ability of selected models using cross-regional training samples. In addition, the unified validation framework and standardized preprocessing procedures were designed to facilitate model generalization, suggesting potential applicability of the trained models to other geographic regions with comparable environmental characteristics.
The developed “GF-1 imagery +manual correction” engineering workflow provides a replicable technical paradigm for global arid zone renewable energy monitoring, providing an important scientific basis for the development of energy and ecology under the “dual carbon” goal. Empirical analysis shows that the PV industry in Ningxia presents a typical development characteristic of a “policy-driven spatial agglomeration ecological response”. From 2022 to 2023, Yinchuan City’s single-year growth rate achieved an explosive growth of 99.98 km2, confirming the significant effectiveness of unique policies such as the “Ningxia Photovoltaic Industry High Quality Development Action Plan”. However, the uneven regional development highlights the spatial heterogeneity of land resource constraints and ecological carrying capacity.
The geothermal environmental effects of PV fields revealed by research have important ecological management value: We quantify for the first time the cooling effect of PV in the 0–300 m buffer gradient. We analyze the coupling effect of “region–season” and show that the intensity of winter cooling in the western desert region is four times that in the agricultural region, which subverts the traditional perception of homogeneity, and we show that the geometric characteristics of PV sites do not dominate the effect of the thermal environment. Notably, the rapid decay of the PV cooling effect at 200 m provides a quantitative basis for the development of ecological isolation zone standards for PV projects. The multidimensional analysis framework of “spatiotemporal expansion thermal environment response policy drive” established in the present study can be extended to the ecological environment impact assessment of “wind–solar storage” integrated energy bases.
Author Contributions
Conceptualization, H.X., P.L. and C.H.; Methodology, H.X. and C.H.; Validation, H.X., C.H. and X.C.; Formal analysis, P.L., F.S. and Y.Z.; Investigation, H.X.; Data curation, F.S.; Writing—original draft, H.X.; Writing—review & editing, P.L.; Visualization, H.X., F.S., X.C. and Y.Z.; Supervision, P.L. and X.C.; Project administration, P.L.; Funding acquisition, P.L. All authors have read and agreed to the published version of the manuscript.
Funding
This work was supported in part by the Natural Science Foundation of China (Grant No. 52274169), 2023 Science and Technology Support Project for the Construction of Ordos City’s Innovation Demonstration Zone under the Sustainable Development Agenda (Grand No. ZD20232304), and open funds from the State Key Laboratory of Coal Mining and Clean Utilization (Granted No. 2021-CMCU-KF014), as well as the Open Fund of Key Laboratory of Mine Ecological Effects and Systematic Restoration Ministry of Natural Resources (Granted No. MEER-2023-06).
Data Availability Statement
The data that support the findings of this study are available on request from the corresponding author.
Conflicts of Interest
The authors declare no conflicts of interest.
References
- Tan, Z.; Zhang, H.; Xu, J.; Wang, J.; Yu, C.; Zhang, J. Photovoltaic Power Generation in China: Development Potential, Benefits of Energy Conservation and Emission Reduction. J. Energy Eng. 2012, 138, 73–86. [Google Scholar] [CrossRef]
- Lu, Q.; Yu, H.; Zhao, K.; Leng, Y.; Hou, J.; Xie, P. Residential demand response considering distributed PV consumption: A model based on China’s PV policy. Energy 2019, 172, 443–456. [Google Scholar] [CrossRef]
- Mu, L.; Gu, Y.; Guo, Y.; Liu, P. The LCOE Evolution and Grid Parity Analysis of Centralized Solar Photovoltaic: A Case Study of Ningxia, China. Front. Energy Res. 2021, 9, 711864. [Google Scholar] [CrossRef]
- Stamford, L.; Azapagic, A. Environmental Impacts of Photovoltaics: The Effects of Technological Improvements and Transfer of Manufacturing from Europe to China. Energy Technol. 2018, 6, 1148–1160. [Google Scholar] [CrossRef]
- Wang, X.; Xiao, X.; Zhang, X.; Ye, H.; Dong, J.; He, Q.; Wang, X.; Liu, J.; Li, B.; Wu, J. Characterization and mapping of photovoltaic solar power plants by Landsat imagery and random forest: A case study in Gansu Province, China. J. Clean. Prod. 2023, 417, 138015. [Google Scholar] [CrossRef]
- Hastik, R.; Basso, S.; Geitner, C.; Haida, C.; Poljanec, A.; Portaccio, A.; Vrščaj, B.; Walzer, C. Renewable energies and ecosystem service impacts. Renew. Sustain. Energy Rev. 2015, 48, 608–623. [Google Scholar] [CrossRef]
- Jiang, H.; Yao, L.; Lu, N.; Qin, J.; Liu, T.; Liu, Y.; Zhou, C. Multi-resolution dataset for photovoltaic panel segmentation from satellite and aerial imagery. Earth Syst. Sci. Data 2021, 13, 5389–5401. [Google Scholar] [CrossRef]
- Wang, X.; Xiao, X.; Zou, Z.; Chen, B.; Ma, J.; Dong, J.; Doughty, R.B.; Zhong, Q.; Qin, Y.; Dai, S.; et al. Tracking annual changes of coastal tidal flats in China during 1986-2016 through analyses of Landsat images with Google Earth Engine. Remote Sens. Environ. 2020, 238, 110987. [Google Scholar] [CrossRef]
- Hou, T.; Sun, W.; Chen, C.; Yang, G.; Meng, X.; Peng, J. Marine floating raft aquaculture extraction of hyperspectral remote sensing images based decision tree algorithm. Int. J. Appl. Earth Obs. Geoinf. 2022, 111, 102846. [Google Scholar] [CrossRef]
- Malof, J.M.; Bradbury, K.; Collins, L.M.; Newell, R.G. Automatic detection of solar photovoltaic arrays in high resolution aerial imagery. Appl. Energy 2016, 183, 229–240. [Google Scholar] [CrossRef]
- Jie, Y.; Ji, X.; Yue, A.; Chen, J.; Deng, Y.; Chen, J.; Zhang, Y. Combined Multi-Layer Feature Fusion and Edge Detection Method for Distributed Photovoltaic Power Station Identification. Energies 2020, 13, 6742. [Google Scholar] [CrossRef]
- Bradbury, K.; Saboo, R.; Johnson, T.L.; Malof, J.M.; Devarajan, A.; Zhang, W.; Collins, L.M.; Newell, R.G. Distributed solar photovoltaic array location and extent dataset for remote sensing object identification. Sci. Data 2016, 3, 160106. [Google Scholar] [CrossRef]
- Chen, Z.; Kang, Y.; Sun, Z.; Wu, F.; Zhang, Q. Extraction of Photovoltaic Plants Using Machine Learning Methods: A Case Study of the Pilot Energy City of Golmud, China. Remote Sens. 2022, 14, 2697. [Google Scholar] [CrossRef]
- da Costa, M.V.C.V.; de Carvalho, O.L.F.; Orlandi, A.G.; Hirata, I.; de Albuquerque, A.O.; e Silva, F.V.; Guimarães, R.F.; Gomes, R.A.T.; Júnior, O.A.d.C. Remote Sensing for Monitoring Photovoltaic Solar Plants in Brazil Using Deep Semantic Segmentation. Energies 2021, 14, 2960. [Google Scholar] [CrossRef]
- Kruitwagen, L.; Story, K.T.; Friedrich, J.; Byers, L.; Skillman, S.; Hepburn, C. A global inventory of photovoltaic solar energy generating units. Nature 2021, 598, 604–610. [Google Scholar] [CrossRef] [PubMed]
- Hou, X.; Wang, B.; Hu, W.; Yin, L.; Wu, H. SolarNet: A Deep Learning Framework to Map Solar Power Plants In China From Satellite Imagery. arXiv 2019. [Google Scholar] [CrossRef]
- Chen, Y.; Zhou, J.; Ge, Y.; Dong, J. Uncovering the rapid expansion of photovoltaic power plants in China from 2010 to 2022 using satellite data and deep learning. Remote Sens. Environ. 2024, 305, 114100. [Google Scholar] [CrossRef]
- Turney, D.; Fthenakis, V. Environmental impacts from the installation and operation of large-scale solar power plants. Renew. Sustain. Energy Rev. 2011, 15, 3261–3270. [Google Scholar] [CrossRef]
- Millstein, D.; Menon, S. Regional climate consequences of large-scale cool roof and photovoltaic array deployment. Environ. Res. Lett. 2011, 6, 034001. [Google Scholar] [CrossRef]
- Genchi, Y.; Ishisaki, M.; Ohashi, Y.; Takahashi, H.; Inaba, A. Impacts of large-scale photovoltaic panel installation on the heat island effect in Tokyo. In Proceedings of the Fifth Conference on the Urban Climate, Łódź, Poland, 1–5 September 2003. [Google Scholar]
- Tian, W.; Wang, Y.; Xie, Y.; Wu, D.; Zhu, L.; Ren, J. Effect of building integrated photovoltaics on microclimate of urban canopy layer. Build. Environ. 2007, 42, 1891–1901. [Google Scholar] [CrossRef]
- Lu, X. The Environment Effect Analysis of PV Power Plant Construction in Desert Gobbi-Take Dongdongtan Million Kilowatt Soler Power Demonstration Base, Jiuquan City as An Example. Master’s Thesis, Lanzhou University, Lanzhou, China, 2013. (In Chinese). [Google Scholar]
- Broadbent, A.M.; Krayenhoff, E.S.; Georgescu, M.; Sailor, D.J. The Observed Effects of Utility-Scale Photovoltaics on Near-Surface Air Temperature and Energy Balance. J. Appl. Meteorol. Climatol. 2019, 58, 989–1006. [Google Scholar] [CrossRef]
- Li, P.; Luo, Y.; He, Z.; Zheng, J.; Xia, X.; Liao, Z.; Gao, X. A comparative study of the effects of photovoltaic power plants in desert and lake on the microclimate. Energy Rep. 2023, 10, 2128–2137. [Google Scholar] [CrossRef]
- Yang, H.; Li, Z.; Zhao, J.; Liu, Y.; Bai, J.; Yang, X. Impact of photovoltaic power field construction on surfacetemperature in desert and gobi regions: A case study of Junma Power Field. Sci. Soil Water Conserv. 2025, 23, 148–156. (In Chinese) [Google Scholar] [CrossRef]
- Liu, Y.; Zhang, R.-Q.; Huang, Z.; Cheng, Z.; Lopez-Vicente, M.; Ma, X.-R.; Wu, G.-L. Solar photovoltaic panels significantly promote vegetation recovery by modifying the soil surface microhabitats in an arid sandy ecosystem. Land. Degrad. Dev. 2019, 30, 2177–2186. [Google Scholar] [CrossRef]
- Luo, D.; Jin, H.; Marchenko, S.S.; Romanovsky, V.E. Difference between near-surface air, land surface and ground surface temperatures and their influences on the frozen ground on the Qinghai-Tibet Plateau. Geoderma 2018, 312, 74–85. [Google Scholar] [CrossRef]
- Yang, P.; Zhai, X.; Huang, H.; Zhang, Y.; Zhu, Y.; Shi, X.; Zhou, L.; Fu, C. Association and driving factors of meteorological drought and agricultural drought in Ningxia, Northwest China. Atmos. Res. 2023, 289, 106753. [Google Scholar] [CrossRef]
- Li, Z.; Shen, H.; Li, H.; Xia, G.; Gamba, P.; Zhang, L. Multi-feature combined cloud and cloud shadow detection in GaoFen-1 wide field of view imagery. Remote Sens. Environ. 2017, 191, 342–358. [Google Scholar] [CrossRef]
- Pflug, B.; Main-Knorn, M. Validation of atmospheric correction algorithm ATCOR. In Proceedings of the Conference on Remote Sensing of Clouds and the Atmosphere XIX and Optics in Atmospheric Propagation and Adaptive Systems XVII, Amsterdam, The Netherlands, 22–25 September 2014. [Google Scholar] [CrossRef]
- Roy, D.P.; Wulder, M.A.; Loveland, T.R.; Woodcock, C.E.; Allen, R.G.; Anderson, M.C.; Helder, D.; Irons, J.R.; Johnson, D.M.; Kennedy, R.; et al. Landsat-8: Science and product vision for terrestrial global change research. Remote Sens. Environ. 2014, 145, 154–172. [Google Scholar] [CrossRef]
- Cook, M.; Schott, J.R.; Mandel, J.; Raqueno, N. Development of an Operational Calibration Methodology for the Landsat Thermal Data Archive and Initial Testing of the Atmospheric Compensation Component of a Land Surface Temperature (LST) Product from the Archive. Remote Sens. 2014, 6, 11244–11266. [Google Scholar] [CrossRef]
- Jiménez-Muñoz, J.C.; Sobrino, J.A. A generalized single-channel method for retrieving land surface temperature from remote sensing data: Art. no. D08112. J. Geophys. Res. Atmos. 2004, 109, D08112. [Google Scholar] [CrossRef]
- Huang, Z.; Wang, X.; Wei, Y.; Huang, L.; Shi, H.; Liu, W.; Huang, T.S. CCNet: Criss-Cross Attention for Semantic Segmentation. Ieee Trans. Pattern Anal. Mach. Intell. 2023, 45, 6896–6908. [Google Scholar] [CrossRef]
- Fu, J.; Liu, J.; Tian, H.; Li, Y.; Bao, Y.; Fang, Z.; Lu, H.; Soc, I.C. Dual Attention Network for Scene Segmentation. In Proceedings of the 32nd IEEE/CVF Conference on Computer Vision and Pattern Recognition (CVPR), Long Beach, CA, USA, 16–20 June 2019; pp. 3141–3149. [Google Scholar]
- Zhang, H.; Dana, K.; Shi, J.; Zhang, Z.; Wang, X.; Tyagi, A.; Agrawal, A. Context Encoding for Semantic Segmentation. In Proceedings of the 31st IEEE/CVF Conference on Computer Vision and Pattern Recognition (CVPR), Salt Lake City, UT, USA, 18–23 June 2018; pp. 7151–7160. [Google Scholar] [CrossRef]
- Shelhamer, E.; Long, J.; Darrell, T. Fully Convolutional Networks for Semantic Segmentation. IEEE Trans. Pattern Anal. Mach. Intell. 2017, 39, 640–651. [Google Scholar] [CrossRef] [PubMed]
- Cao, Y.; Xu, J.; Lin, S.; Wei, F.; Hu, H. GCNet: Non-local Networks Meet Squeeze-Excitation Networks and Beyond. In Proceedings of the IEEE/CVF International Conference on Computer Vision (ICCV), Seoul, Republic of Korea, 2 November 2019; pp. 1971–1980. [Google Scholar] [CrossRef]
- Zhao, H.; Zhang, Y.; Liu, S.; Shi, J.; Loy, C.C.; Lin, D.; Jia, J. PSANet: Point-wise Spatial Attention Network for Scene Parsing. In Proceedings of the 15th European Conference on Computer Vision (ECCV), Munich, Germany, 8–14 September 2018; pp. 270–286. [Google Scholar] [CrossRef]
- Zhao, H.; Shi, J.; Qi, X.; Wang, X.; Jia, J. Pyramid Scene Parsing Network. In Proceedings of the 30th IEEE/CVF Conference on Computer Vision and Pattern Recognition (CVPR), Honolulu, HI, USA, 21–26 July 2017; pp. 6230–6239. [Google Scholar] [CrossRef]
- Chen, L.-C.; Papandreou, G.; Schroff, F.; Adam, H. Rethinking Atrous Convolution for Semantic Image Segmentation. Computer Vision and Pattern Recognition. arXiv 2017. [Google Scholar] [CrossRef]
- Chen, L.-C.; Zhu, Y.; Papandreou, G.; Schroff, F.; Adam, H. Encoder-Decoder with Atrous Separable Convolution for Semantic Image Segmentation. In Proceedings of the 15th European Conference on Computer Vision (ECCV), Munich, Germany, 8–14 September 2018; pp. 833–851. [Google Scholar] [CrossRef]
- Chen, C.; Zhao, H.; Cui, W.; He, X. Dual Crisscross Attention Module for Road Extraction from Remote Sensing Images. Sensors 2021, 21, 6873. [Google Scholar] [CrossRef] [PubMed]
- Czirjak, D. Detecting photovoltaic solar panels using hyperspectral imagery and estimating solar power production. J. Appl. Remote Sens. 2017, 11, 026007. [Google Scholar] [CrossRef]
- Xia, Z.; Li, Y.; Chen, R.; Sengupta, D.; Guo, X.; Xiong, B.; Niu, Y. Mapping the rapid development of photovoltaic power stations in northwestern China using remote sensing. Energy Rep. 2022, 8, 4117–4127. [Google Scholar] [CrossRef]
- Luan, Q.; Ye, C.; Liu, Y.; Li, S.; Gao, Y. Effect of urban green land on thermal environment of surroundings based on remote sensing: A case study in Beijing, China. Ecol. Environ. Sci. 2014, 23, 252–261. (In Chinese) [Google Scholar] [CrossRef]
- Liu, A.J.; Cameron, G.N. Analysis of landscape patterns in coastal wetlands of Galveston Bay, Texas (USA). Landsc. Ecol. 2001, 16, 581–595. [Google Scholar] [CrossRef]
- Hulshoff, R.M. Landscape indices describing a Dutch landscape. Landsc. Ecol. 1995, 10, 101–111. [Google Scholar] [CrossRef]
- Zhu, S.K.; Wang, S.; Zhang, J.T.; Gao, D.D.; Sheng, H.Y. Microclimate characteristics of photovoltaic arrays and their effects on plant growth in a solar power station area. Chin. J. Ecol. 2021, 40, 3078–3087. (In Chinese) [Google Scholar] [CrossRef]
- Zhao, Y.; Li, S.; Yang, D.; Yahaya, I.I.; Pan, H. Assessment of site suitability for centralized photovoltaic power stations in Northwest China’s six provinces. J. Environ. Manag. 2024, 366, 121820. [Google Scholar] [CrossRef]
- Hu, Y.-Y.; Lee, Y.-K.; Fu, W.-L. Analysis of China’s Solar Power Industry Development Strategy and Current Issues in the Post-Corona Era. J. Asian Stud. 2022, 25, 115–136. [Google Scholar] [CrossRef]
- Li, Q.; Yu, X.; Li, H. Batteries: From China’s 13th to 14th Five-Year Plan. eTransportation 2022, 14, 100201. [Google Scholar] [CrossRef]
- Wei, Y.; Zhao, T.; Wang, J.; Zhang, X.; Li, Z. Two-level allocation and its future change of CO2 reduction responsibility in China’s power sector. Environ. Impact Assess. Rev. 2023, 99, 107031. [Google Scholar] [CrossRef]
- Taha, H. The potential for air-temperature impact from large-scale deployment of solar photovoltaic arrays in urban areas. Sol. Energy 2013, 91, 358–367. [Google Scholar] [CrossRef]
- Yang, L.; Gao, X.; Lv, F.; Hui, X.; Ma, L.; Hou, X. Study on the local climatic effects of large photovoltaic solar farms in desert areas. Sol. Energy 2017, 144, 244–253. [Google Scholar] [CrossRef]
- Santamouris, M.; Synnefa, A.; Karlessi, T. Using advanced cool materials in the urban built environment to mitigate heat islands and improve thermal comfort conditions. Sol. Energy 2011, 85, 3085–3102. [Google Scholar] [CrossRef]
- Fassbender, E.; Rott, J.; Hemmerle, C. Impacts of Photovoltaic Façades on the Urban Thermal Microclimate and Outdoor Thermal Comfort: Simulation-Based Analysis. Buildings 2024, 14, 923. [Google Scholar] [CrossRef]
- Cortes, A.; Murashita, Y.; Matsuo, T.; Kondo, A.; Shimadera, H.; Inoue, Y. Numerical evaluation of the effect of photovoltaic cell installation on urban thermal environment. Sustain. Cities Soc. 2015, 19, 250–258. [Google Scholar] [CrossRef]
- Zhang, X.; Xu, M. Assessing the Effects of Photovoltaic Powerplants on Surface Temperature Using Remote Sensing Techniques. Remote Sens. 2020, 12, 1825. [Google Scholar] [CrossRef]
- Li, H.; Wang, G.; Tian, G.; Jombach, S. Mapping and Analyzing the Park Cooling Effect on Urban Heat Island in an Expanding City: A Case Study in Zhengzhou City, China. Land 2020, 9, 57. [Google Scholar] [CrossRef]
- Chang, R.; Luo, Y.; Zhu, R. Simulated local climatic impacts of large-scale photovoltaics over the barren area of Qinghai, China. Renew. Energy 2020, 145, 478–489. [Google Scholar] [CrossRef]
- Parida, B.; Iniyan, S.; Goic, R. A review of solar photovoltaic technologies. Renew. Sustain. Energy Rev. 2011, 15, 1625–1636. [Google Scholar] [CrossRef]
- Li, P.; Gao, X. The Impact of Photovoltaic Power Plants on Ecological Environment and Climate: A Literature Review. Plateau Meteorol. 2021, 40, 702–710. [Google Scholar] [CrossRef]
- Weng, Q.H.; Lu, D.S.; Schubring, J. Estimation of land surface temperature-vegetation abundance relationship for urban heat island studies. Remote Sens. Environ. 2004, 89, 467–483. [Google Scholar] [CrossRef]
- Wulder, M.; Boots, B. Local spatial autocorrelation characteristics of remotely sensed imagery assessed with the Getis statistic. Int. J. Remote Sens. 2010, 19, 2223–2231. [Google Scholar] [CrossRef]
- Zhang, X.; Zeraatpisheh, M.; Rahman, M.M.; Wang, S.; Xu, M. Texture Is Important in Improving the Accuracy of Mapping Photovoltaic Power Plants: A Case Study of Ningxia Autonomous Region, China. Remote Sens. 2021, 13, 3909. [Google Scholar] [CrossRef]
Disclaimer/Publisher’s Note: The statements, opinions and data contained in all publications are solely those of the individual author(s) and contributor(s) and not of MDPI and/or the editor(s). MDPI and/or the editor(s) disclaim responsibility for any injury to people or property resulting from any ideas, methods, instructions or products referred to in the content. |
© 2025 by the authors. Licensee MDPI, Basel, Switzerland. This article is an open access article distributed under the terms and conditions of the Creative Commons Attribution (CC BY) license (https://creativecommons.org/licenses/by/4.0/).