Article

Methodology for Evaluating Collision Avoidance Maneuvers Using Aerodynamic Control

by
Desiree González Rodríguez
1,
Pedro Orgeira-Crespo
2,*,
Jose M. Nuñez-Ortuño
3 and
Fernando Aguado-Agelet
4
1
School of Telecommunications, Doctoral Program in Aerospace Technology: Electromagnetic, Electronic, Computer and Mechanical Engineering, University of Vigo, 36310 Vigo, Spain
2
Department of Mechanical Engineering, Heat Engines and Machines and Fluids, Aerospace Engineering School, University of Vigo, Campus Orense, 32004 Orense, Spain
3
Defense University Center in the Spanish Naval Academy, Plaza de España s/n, 36920 Marin, Spain
4
Telecommunication Engineering School, University of Vigo, 36310 Vigo, Spain
*
Author to whom correspondence should be addressed.
Remote Sens. 2025, 17(14), 2437; https://doi.org/10.3390/rs17142437
Submission received: 5 June 2025 / Revised: 7 July 2025 / Accepted: 11 July 2025 / Published: 14 July 2025
(This article belongs to the Special Issue Advances in CubeSat Missions and Applications in Remote Sensing)

Abstract

The increasing congestion of low Earth orbit (LEO) has raised the need for efficient collision avoidance strategies, especially for CubeSats without propulsion systems. This study proposes a methodology for evaluating passive collision avoidance maneuvers using aerodynamic control via a satellite’s Attitude Determination and Control System (ADCS). By adjusting orientation, the satellite modifies its exposed surface area, altering atmospheric drag and lift forces to shift its orbit. This new approach integrates atmospheric modeling (NRLMSISE-00), aerodynamic coefficient estimation using the ADBSat panel method, and orbital simulations in Systems Tool Kit (STK). The LUME-1 CubeSat mission is used as a reference case, with simulations at three altitudes (500, 460, and 420 km). Results show that attitude-induced drag modulation can generate significant orbital displacements—measured by Horizontal and Vertical Distance Differences (HDD and VDD)—sufficient to reduce collision risk. Compared to constant-drag models, the panel method offers more accurate, orientation-dependent predictions. While lift forces are minor, their inclusion enhances modeling fidelity. This methodology supports the development of low-resource, autonomous collision avoidance systems for future CubeSat missions, particularly in remote sensing applications where orbital precision is essential.

1. Introduction

The growing number of satellites in low Earth orbit (LEO), particularly due to the expansion of commercial constellations and Earth observation platforms, has significantly increased the risk of in-orbit collisions. For remote sensing missions, which rely on precise orbital positioning to ensure consistent imaging and data acquisition, even minor trajectory deviations can compromise mission objectives. Collision avoidance strategies are therefore essential not only to protect spacecraft from damage but also to maintain the continuity and quality of remote sensing operations. As the orbital environment becomes more congested, especially with the proliferation of CubeSats and small satellites, the development of autonomous and efficient collision avoidance methods becomes increasingly critical to ensure the long-term sustainability and reliability of remote sensing systems [1].

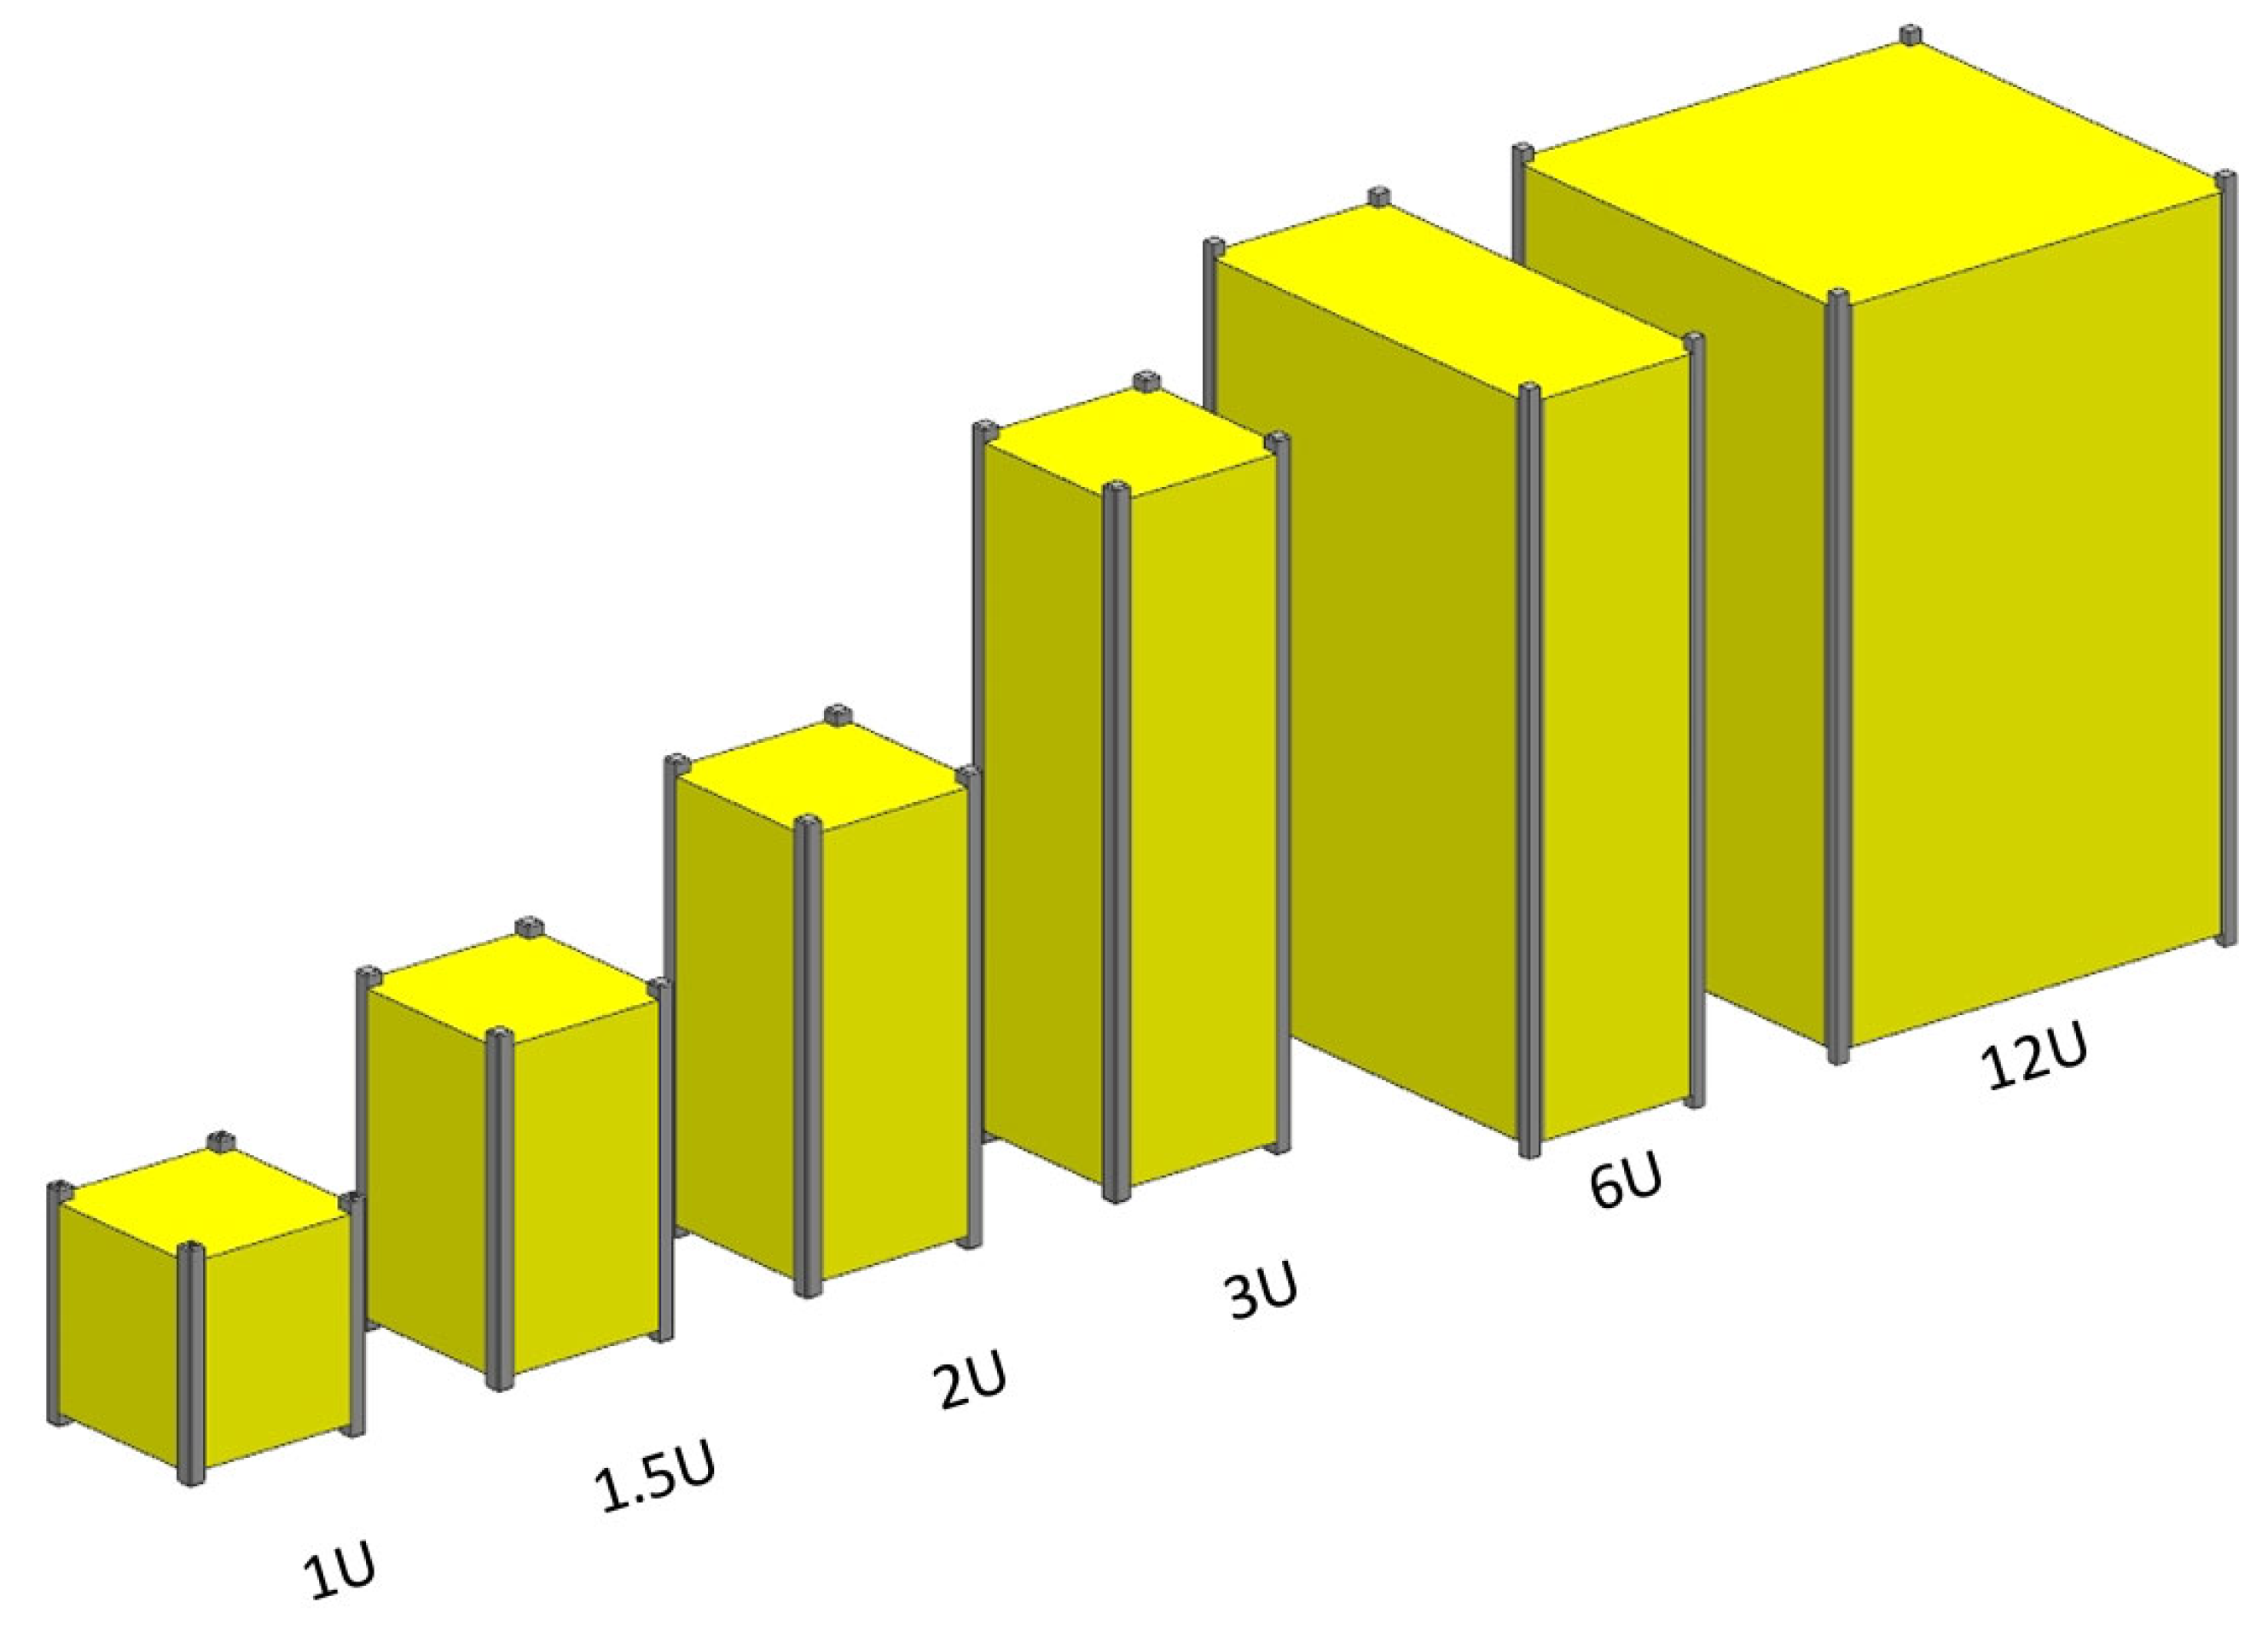
1.1. Nanosatellites and CubeSats

Satellites with a mass of less than 10 kg are classified as nanosatellites, a category that includes CubeSats [2]. CubeSats are a specific type of nanosatellite defined not only by their weight but also by standardized dimensions and structural criteria. Each CubeSat is constructed from one or more basic cube-shaped units, where a single unit—referred to as 1U—measures 10 cm × 10 cm × 10 cm and typically weighs less than 1.33 kg [3].
The CubeSat standard was first introduced in 1999 by California Polytechnic State University (Cal Poly). The primary goal was to democratize access to space by offering a low-cost platform for academic institutions and researchers [4]. Since then, CubeSats have become a cornerstone of small satellite missions due to their modularity, affordability, and ease of deployment.
The current design and development of CubeSats are governed by the CubeSat Design Specification (CDS) REV 14.1 [5]. This standard outlines the specifications for CubeSats ranging from 1U to 12U as seen in Figure 1, and also provides guidelines for dispensers and interface compatibility. According to the CDS, there are six recognized CubeSat formats: 1U, 1.5U, 2U, 3U, 6U, and 12U. These configurations allow for flexibility in mission design while maintaining compatibility with standardized deployment systems.
Despite their advantages, CubeSats face several operational limitations. Their low orbital altitudes and high area-to-mass ratios result in relatively short orbital lifetimes. Moreover, their small size and mass (<10 kg) make them difficult to track, posing challenges for collision avoidance. This is particularly concerning because CubeSats are rarely equipped with propulsion systems, rendering them incapable of performing evasive maneuvers.

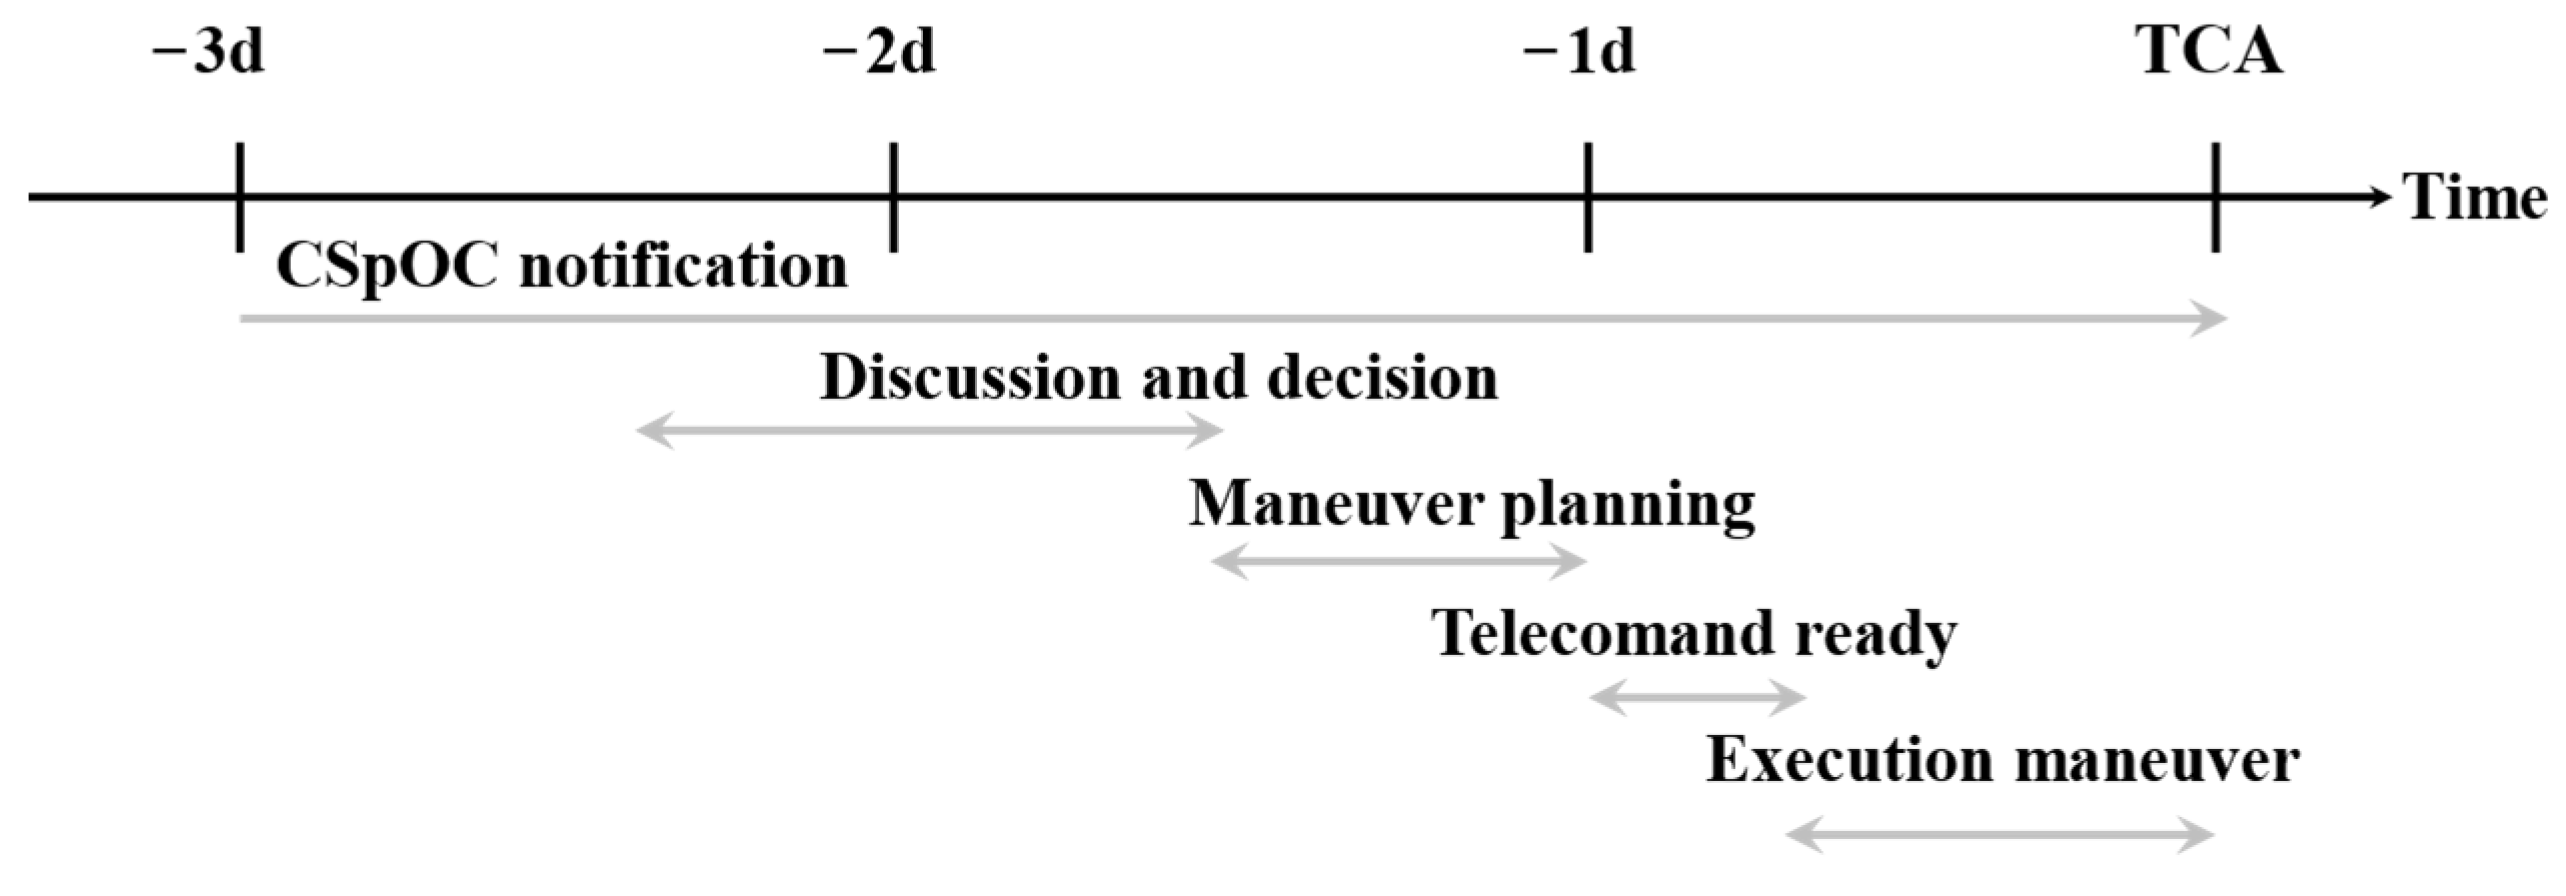
1.2. Space Debris, Collision Avoidance, and CDMs

The exponential growth of space activity has led to an increasingly congested low Earth orbit (LEO), where thousands of operational satellites now coexist with a vast and growing population of space debris. This debris includes defunct satellites, spent rocket stages, fragments from explosions or collisions, and even components intentionally released during mission operations. These objects, though inactive, continue to orbit Earth and pose a significant threat to active spacecraft.
The danger is not limited to large debris. Even fragments just a few centimeters in size can cause catastrophic damage due to the extreme velocities involved—up to 14 km/s in some orbital conjunctions. Each collision or explosion generates more debris, increasing the likelihood of further collisions in a self-sustaining cascade known as the Kessler Syndrome. First proposed by Kessler and Cour-Palais in 1978 [6], this scenario describes a chain reaction in which each collision produces fragments that raise the probability of subsequent collisions, potentially rendering certain orbital regions unusable.
The persistence of debris in orbit depends heavily on altitude. Objects below 500 km typically re-enter the atmosphere within 25 years, but at 800 km, orbital decay can take over a century, and above 1200 km, debris may remain in orbit for thousands of years. This long-term presence exacerbates the risk of collision and underscores the urgency of effective debris management strategies.
To address this growing threat, the space community has developed a three-pronged approach: mitigation, to prevent the creation of new debris; remediation, to actively remove existing debris; and space situational awareness, to monitor and predict potential collisions. International guidelines such as the IADC Space Debris Mitigation Guidelines, the United Nations COPUOS Mitigation Guidelines, and ISO standards have been established to support these efforts. According to a 2009 NASA study, maintaining a stable debris population in LEO over the next 200 years would require the active removal of at least five high-risk objects annually [7].
Figure 1. CubeSat family (1U–12U) [8].
Remotesensing 17 02437 g001
The urgency of these measures is amplified by the rapid deployment of commercial satellite constellations, such as those by SpaceX, OneWeb, and Telesat. These megaconstellations could double or triple the number of operational satellites in orbit within just a few years, further increasing the risk of collisions.
Collision avoidance has thus become a routine and essential part of satellite operations. The U.S. Joint Space Operations Center (JSpOC) plays a central role in this process by conducting daily conjunction assessments using data from the Space Surveillance Network (SSN). When a potential close approach is detected, satellite operators receive a Conjunction Data Message (CDM). These standardized messages include critical information such as the Time of Closest Approach (TCA), miss distance, collision probability, and relative velocity and position [9].
If the predicted miss distance is less than 1 km in the cross-track and along-track directions or less than 200 m in the radial direction—and if the collision probability exceeds 10−4—an avoidance maneuver is typically executed within 24 h of the TCA [10]. The International Space Station (ISS), for example, has performed 29 such maneuvers since 1999, including three in 2020 alone [9].
The effectiveness of these maneuvers depends on timely and accurate risk assessment. CDMs are exchanged between conjunction assessment providers and satellite operators using a standardized format to ensure consistency and clarity. Figure 2 illustrates a typical timeline of collision avoidance operations, as implemented by the Geo-Informatics and Space Technology Development Agency (GISTDA) since 2008.

1.3. ADCS and Collision Avoidance

Recent Advancements in Collision Avoidance and Relative Motion Control Have Introduced a Variety of Strategies Aimed at Improving the Safety and Coordination of Satellite Operations in Low Earth Orbit. For Example, Sun et al. [11] Proposed a Method for Relative Orbit Transfer Using Constant-Vector Thrust Acceleration, Offering a Continuous Control Approach for Formation Reconfiguration. Smith et al. [12] Applied Model Predictive Control Based on D’Amico’s Relative Orbital Elements to Enable Precise and Fuel-Efficient Formation Flying, While Zhou et al. [13] Developed a Parametric Formation Control Framework for Coordinating Multiple Nanosatellites in Cooperative Observation Missions Around the China Space Station. These Studies Represent Significant Progress in Active Control Techniques, Often Relying on Propulsion Systems or Advanced Onboard Computation.
CubeSats typically do not have propulsion systems, making traditional collision avoidance maneuvers impossible. However, active ADCS can be used to perform non-propulsive collision avoidance by changing satellite orientation, instead of performing traditional orbital maneuvers [14]. This method involves changing the satellite’s orientation to alter its cross-sectional area exposed to atmospheric drag. This change in orientation modifies the drag force acting on the satellite, which in turn slightly adjusts its orbital altitude and velocity over time. These small adjustments can shift the satellite’s position enough to avoid a predicted collision with space debris. Simulations demonstrated that such maneuvers, executed two days before the time of closest approach, can produce significant Horizontal and Vertical Difference (HDD and VDD) displacements—well beyond the thresholds used in standard collision warnings—thus validating the feasibility of this technique. The control of these orientation changes is achieved using a reaction wheel guided by an Extended Kalman Filter, ensuring precise, efficient, and low-power execution suitable for the limited resources of CubeSats.
This collision avoidance approach is highly dependent on the drag coefficient, a parameter that plays a critical role in determining the magnitude of atmospheric drag acting on the satellite. The drag coefficient, however, is notoriously difficult to estimate accurately in low Earth orbit (LEO) due to the complex and variable nature of the upper atmosphere. Factors such as solar activity, geomagnetic conditions, and atmospheric composition can cause significant fluctuations in atmospheric density, which directly affects drag force calculations. Additionally, the drag coefficient itself is influenced by the satellite’s shape, surface materials, and orientation, all of which can vary during a mission.
Because the proposed methodology relies on precise predictions of how changes in orientation affect orbital decay through drag modulation, any uncertainty in the drag coefficient introduces potential errors in estimating the resulting orbital displacement. This sensitivity makes the effectiveness of the maneuver highly contingent on accurate modeling and real-time estimation of drag-related parameters, which remains a significant challenge in LEO operations.

1.4. Satellite Drag Modeling

In low Earth orbit, atmospheric drag is a major perturbing force affecting satellite trajectories, second only to Earth’s gravitational irregularities. Accurate modeling of this force is essential for orbit prediction, re-entry analysis, and mission planning. However, estimating drag is complex due to uncertainties in three key parameters: atmospheric density, relative velocity, and the drag coefficient.
Atmospheric density in the thermosphere is highly variable, influenced by solar activity, geomagnetic storms, and atmospheric tides. Relative velocity is typically assumed to follow Earth’s rotation, but high-altitude winds can introduce deviations of several hundred meters per second. Drag coefficients are often simplified as constants (e.g., 2.2), but they vary with spacecraft geometry, surface properties, and environmental conditions.
In the rarefied upper atmosphere, flow is best described as free molecular, where gas molecules interact directly with spacecraft surfaces rather than with each other. This regime requires specialized aerodynamic models based on gas–surface interaction (GSI) theories. Common models include the Maxwell model, which combines specular and diffuse reflection; the Schamberg model, which introduces a conical scattering pattern; and the Schaaf and Chambre model, which uses momentum accommodation coefficients to describe energy and momentum exchange [15].
Analytical methods based on these models are suitable for simple shapes and flow conditions but are limited by assumptions about surface contamination and flow uniformity. For more complex geometries, numerical methods are used. These include the following:
  • Panel methods for convex shapes;
  • Ray-Tracing Panel methods (RTP) for shadowed surfaces;
  • Test-Particle Monte Carlo (TPMC) for modeling multiple reflections;
  • Direct Simulation Monte Carlo (DSMC) for simulating intermolecular collisions in transitional regimes.
Each method balances accuracy and computational cost. As satellite traffic increases and missions become more precise, improving drag modeling remains a critical area of research for ensuring the safety and efficiency of space operations.

1.5. Aerodynamic Control

Aerodynamic control has emerged as a promising strategy for passive collision avoidance in low Earth orbit (LEO), particularly for small satellites lacking propulsion systems. By altering the satellite’s orientation, the exposed surface area to the atmospheric flow can be modulated, thereby adjusting the aerodynamic drag and, to a lesser extent, lift forces. This technique enables gradual orbital changes that can be used to mitigate collision risks without the need for onboard thrusters.
Recent studies have explored various implementations and enhancements of this concept. Aranda et al. [16] investigated drag augmentation techniques for collision avoidance, demonstrating that deployable structures can significantly increase the effective cross-sectional area and improve maneuverability in LEO. Traub et al. [17] presented in-flight results from the BEESAT-4 CubeSat, highlighting the operational constraints and real-world performance of aerodynamic maneuvers. Their findings underscore the importance of accurate modeling and control authority in achieving meaningful orbital displacements. Gaglio et al. [18] introduced a quasi-optimal guidance and control framework using deep learning for drag-based collision avoidance in very low Earth orbit (VLEO), showing that data-driven approaches can enhance the responsiveness and efficiency of aerodynamic control strategies.
These advancements collectively reinforce the viability of aerodynamic control as a low-resource alternative for collision avoidance, especially in the context of increasing orbital congestion.

1.6. Atmospheric Models

Accurate atmospheric models are fundamental to the computation of drag coefficients in LEO, as they provide the necessary estimates of atmospheric density and composition that directly influence drag force calculations. One of the most widely used models for this purpose is NRLMSISE-00 [19], which offers empirical predictions of atmospheric properties from the Earth’s surface to the exosphere. This model outputs neutral temperature and the number densities of key atmospheric species including helium, oxygen, nitrogen, and argon, based on inputs such as altitude, latitude, longitude, and solar and geomagnetic activity indices (F10.7 and Ap). A notable feature of NRLMSISE-00 is its inclusion of an “anomalous oxygen” component, which accounts for the presence of non-thermal species like O+ and hot oxygen atoms that significantly affect drag at higher altitudes [20].
Figure 3 presents the atmospheric properties on 1 June 2025, at a geographic latitude of 0° and longitude of 0°. They were computed using the Python library nrlmsise00 0.1.2, which provides an up-to-date implementation of the NRLMSISE-00 atmospheric model [21].
The model is particularly effective in the thermosphere, where density variations due to solar and geomagnetic activity can span nearly two orders of magnitude. These variations are driven primarily by the 11-year solar cycle and short-term geomagnetic disturbances, which influence the energy absorbed in the upper atmosphere and thus its density. According to the ECSS-E-10-04A standard on space environment modeling, NRLMSISE-00 is recommended for calculating neutral temperature, detailed composition, and total density below 120 km altitude [22]. For altitudes above 120 km, it is often used in conjunction with the JB2006 model, which incorporates additional solar indices (S10 and Mg10) and semiannual density variation models to improve correlation with UV radiation [23].
Despite its strengths, NRLMSISE-00, like all empirical models, is limited in its ability to resolve short-term and localized density fluctuations, especially during geomagnetic storms. Its accuracy under mean activity conditions is typically within 10–15%, but deviations can reach up to 100% during extreme events [24]. Nevertheless, its comprehensive coverage, empirical foundation, and integration into international standards make it a cornerstone in spacecraft drag modeling and mission planning.

1.7. Objectives of the Research

The primary objective of this research is to define a methodology for analyzing collision avoidance maneuvers in low Earth orbit using a spacecraft’s Attitude Determination and Control System (ADCS). The approach focuses on leveraging the ADCS to modify the satellite’s orientation, thereby altering its aerodynamic profile and influencing the drag force it experiences. To support this, accurate drag models are employed to predict the drag coefficient under varying atmospheric and geometric conditions, enabling precise estimation of the resulting orbital perturbations. This study extends previous work by incorporating a panel-method-based aerodynamic model that accounts for satellite orientation, and by validating the methodology across multiple altitudes and atmospheric conditions, including diurnal and latitudinal density variations.
As a secondary objective, the study also aims to investigate the influence of lift forces generated during these maneuvers. Although drag is the dominant aerodynamic force in LEO, lift can contribute to lateral displacement and may enhance the effectiveness of avoidance strategies. By incorporating both drag and lift effects into the analysis, the research seeks to provide a more comprehensive understanding of how passive aerodynamic control can be used for collision risk mitigation in the absence of propulsion systems.

2. Materials and Methods

First, a scenario of analysis must be defined. The analysis in this study adopts the LUME-1 mission scenario as the reference framework, using the cases’ analyses proposed in [14]. LUME-1 is a CubeSat developed by the University of Vigo and launched in December 2018 into a Sun-synchronous orbit with a semi-major axis of approximately 6878 km. This satellite serves as a representative case for evaluating collision avoidance strategies using attitude control.
LUME-1′s orbital parameters and physical characteristics are used to simulate the effects of modifying its orientation to alter the cross-sectional area exposed to atmospheric drag. This change in orientation, controlled via the satellite’s ADCS, enables passive maneuvering by exploiting differential drag. The study considers various satellite configurations and altitudes, including the nominal orbit of LUME-1 and two lower altitudes (40 km and 80 km below nominal), to assess the effectiveness of such maneuvers in terms of horizontal and vertical displacement at the time of closest approach (TCA).
By adopting this scenario, the present research ensures consistency with a validated and realistic operational context, allowing for direct comparison of results and further exploration of the influence of aerodynamic forces—particularly drag and lift—on collision avoidance performance in CubeSats.
Although the LUME-1 satellite has already completed its mission and deorbited, we will retain the original analysis date and orbital parameters used in [14] for the purposes of this research, as shown in Figure 4. This decision allows for consistency with the validated simulation framework presented in that work and facilitates direct comparison of results. By maintaining the same scenario, we can focus the discussion on the methodology and its implications for collision avoidance using aerodynamic control, rather than on the current operational status of the satellite.
For the purposes of this study, only the 3U CubeSat configuration will be considered. This decision is based on the specific capability of 3U CubeSats to modify their attitude between two distinct orientations: one with the 1U face and another with the 3U face aligned in the direction of motion. This change in orientation significantly alters the exposed cross-sectional area, thereby enabling effective modulation of the aerodynamic drag force. This characteristic makes the 3U configuration particularly suitable for evaluating passive collision avoidance maneuvers based on attitude control.
The proposed methodology for evaluating collision avoidance maneuvers using aerodynamic control is structured into four main steps:
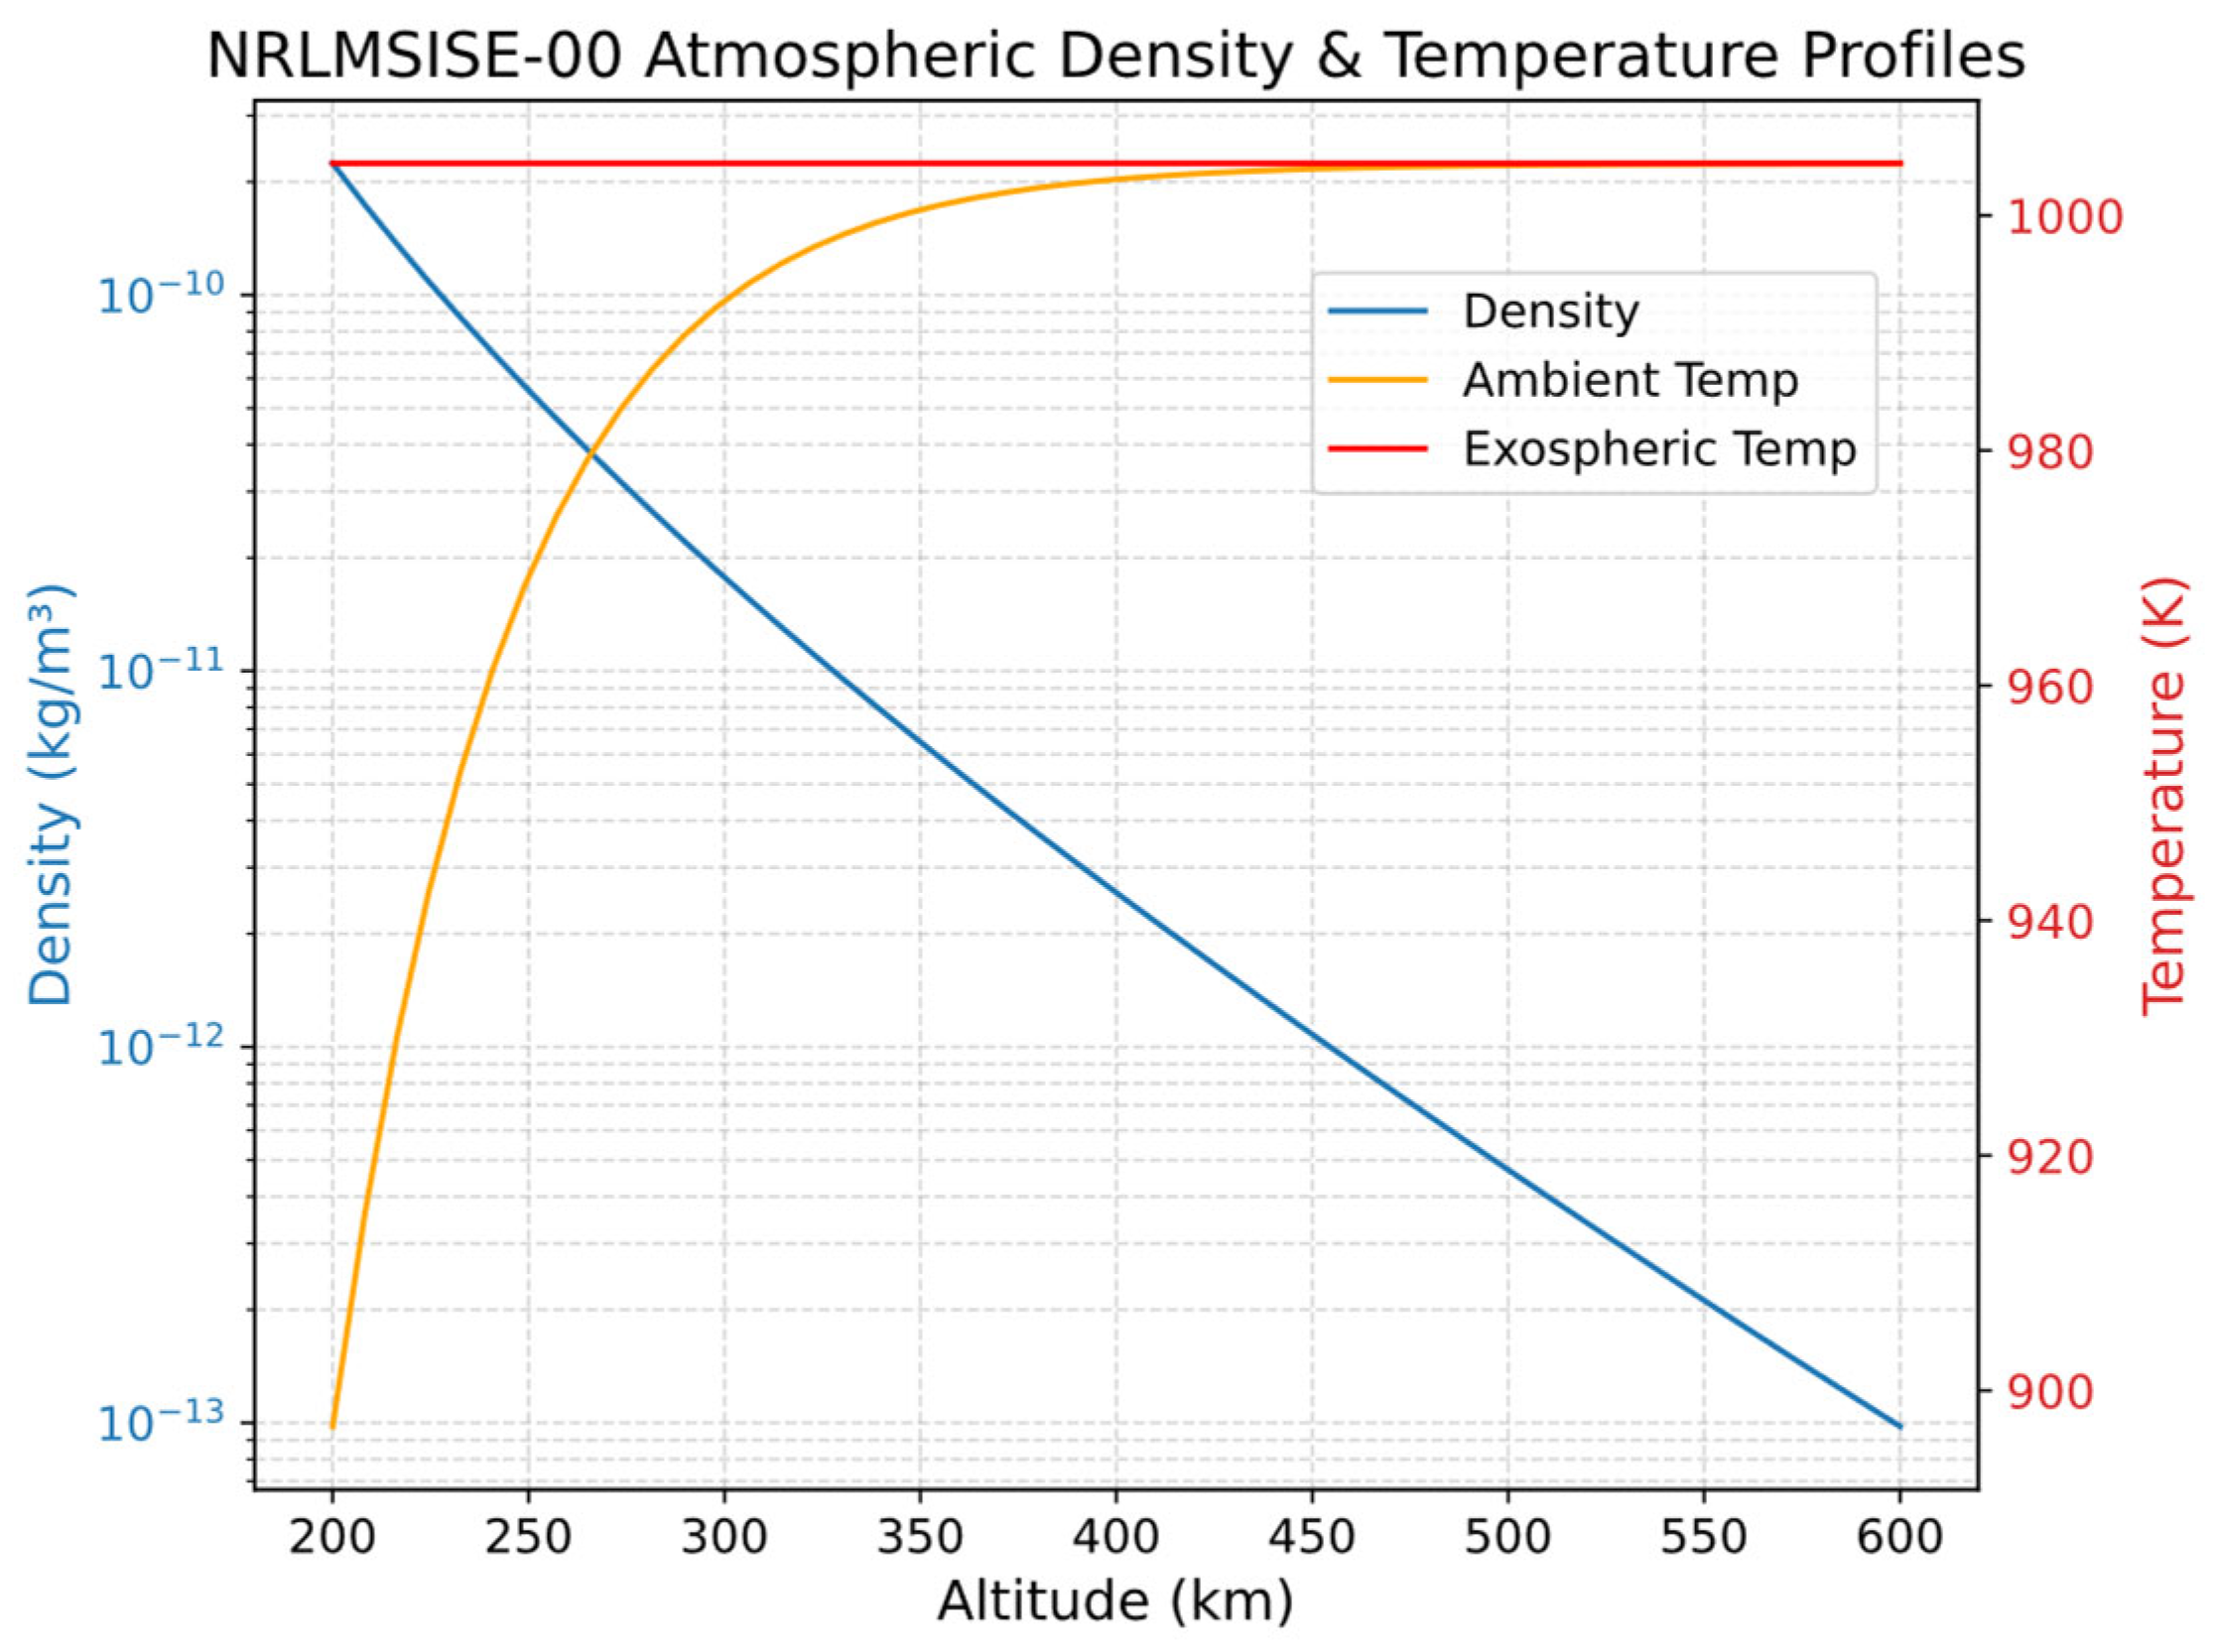
  • Atmospheric Characterization: The first step involves retrieving atmospheric properties using the NRLMSISE-00 model. This model provides essential environmental parameters such as neutral temperature, total mass density, and the number densities of major atmospheric species. These values are computed based on inputs including altitude, geographic coordinates, and solar and geomagnetic activity indices (F10.7 and Ap), and are fundamental for subsequent aerodynamic calculations.
  • Aerodynamic Coefficient Estimation: In the second step, the panel method is employed to compute the drag and lift coefficients. This method is chosen for its simplicity and efficiency, and it uses the atmospheric parameters obtained in step one as inputs. The panel method models the spacecraft surface as a collection of flat panels, allowing for the estimation of aerodynamic forces acting on each panel and, by extension, on the entire spacecraft.
  • Maneuver Simulation: The third step consists of simulating a collision avoidance maneuver using mission analysis software such as Systems Tool Kit (STK) [25]. Different satellite orientations are considered to evaluate how changes in attitude affect the aerodynamic response and the resulting orbital displacement.
  • Effect Evaluation: Finally, the fourth step involves computing the net effect of the collision avoidance maneuver. This is performed by combining the aerodynamic coefficients (Cd and Cl) obtained in step two with the maneuver parameters derived from the STK simulation in step three. The result is a quantitative assessment of how the maneuver alters the satellite’s trajectory, enabling evaluation of its effectiveness in reducing collision risk.

2.1. Atmospheric Characterization

To characterize the atmospheric environment for the collision avoidance analysis, we use the Python implementation of the NRLMSISE-00 model. This model provides empirical estimates of key atmospheric parameters such as neutral density, temperature, and species composition based on inputs including altitude, geographic coordinates, and solar and geomagnetic activity indices.
However, the Python code for NRLMSISE-00 computes atmospheric properties at a single point in space and time. Since atmospheric conditions in low Earth orbit vary significantly with latitude, local solar time, and illumination, a single-point evaluation is insufficient to represent the full orbital environment, as shown in Figure 5. To address this, we adopt an averaging approach over a representative set of orbital positions.
Specifically, we sample atmospheric parameters at latitudes ranging from 0° to ±90°, in 10° increments, for two longitudes: one corresponding to the Local Time of Ascending Node (LTAN), a parameter of Sun-synchronous orbits that represents the longitude of the subsatellite point when crossing the equator from South to North, and the other at its antipode (180° apart in longitude). These points represent the atmospheric composition in the trajectory of the orbit at the beginning of the simulations. This sampling strategy captures the latitudinal and diurnal variations in atmospheric density and temperature, which are critical for accurate drag modeling.
The values obtained from these points will be averaged to produce a representative atmospheric profile for the initial orbit. This averaged profile will then be used as input for the aerodynamic calculations in the subsequent steps of the methodology.
The atmospheric dataset used in this study is generated for three different orbital altitudes to evaluate the sensitivity of aerodynamic behavior to changes in atmospheric density. Specifically, the dataset is computed for a nominal altitude of 500 km, as well as for two lower altitudes: 460 km (40 km below nominal) and 420 km (80 km below nominal). These altitudes correspond to the orbital configurations analyzed in the reference scenario based on the LUME-1 mission.

2.2. Coefficients Estimation

The panel method is used to estimate aerodynamic coefficients—specifically drag and lift—in the free molecular flow (FMF) regime, which is typical of low Earth orbit (LEO) conditions.
In this method, the spacecraft is idealized as a collection of discrete flat surface elements or “panels”. Each panel is treated as a flat plate exposed to the incident atmospheric flow. The aerodynamic forces acting on each panel are computed individually using established expressions for pressure and shear stress coefficients, which depend on the angle of incidence, surface properties, and the local flow regime (e.g., hyperthermal or hypothermal).
For each panel, the pressure coefficient, C P , and shear stress coefficient, C τ , are calculated based on the gas–surface interaction model (GSIM) assumed. These coefficients are then projected onto the direction of motion to determine the contribution of each panel to the total drag and lift forces.
The total aerodynamic force coefficient, C F , for the body is obtained by summing the contributions of all panels, as shown in Equation (1).
C F = i = 1 n C P i · n i + C τ i n i · V V · A i A r e f
where
  • n i is the normal vector of panel i;
  • V is the velocity vector of the spacecraft relative to the atmosphere;
  • Ai is the area of panel i;
  • Aref is the reference area for normalization.
In hyperthermal flow, only forward-facing panels (with incidence angles between 0° and 90°) contribute significantly to the aerodynamic forces. In hypothermal flow, due to the high thermal motion of atmospheric particles, even aft-facing panels may receive molecular impacts, although their contribution is typically smaller.
This method is particularly suitable for convex geometries and allows for the inclusion of different surface materials by assigning distinct accommodation coefficients to different panel groups. It is widely used due to its balance between computational efficiency and physical fidelity, especially in early-stage design and analysis of small satellites such as CubeSats [19].
The Sentman gas–surface interaction model (GSIM), used in this research, is commonly used for computing aerodynamic coefficients of CubeSats in low Earth orbit (LEO) due to its simplicity, physical relevance, and suitability for the free molecular flow (FMF) regime. In this regime, which dominates at altitudes above approximately 150 km, the mean free path of atmospheric particles is much larger than the characteristic dimensions of the spacecraft, meaning that gas molecules interact with the spacecraft surface without colliding with each other. Sentman’s model assumes diffuse reflection with complete thermal accommodation, meaning that incident gas molecules are fully absorbed by the surface and re-emitted with a velocity distribution corresponding to the surface temperature [26].
To rapidly and accurately estimate the aerodynamic properties of satellites in free molecular flow, ADBSat v3.0 tool is used [27]. It implements an advanced panel method that models a spacecraft as a mesh of flat triangular plates derived from CAD geometry files. ADBSat calculates the aerodynamic forces and moments by summing the contributions of each panel, using a selection of gas–surface interaction models (GSIMs), including the widely used Sentman model. It features a novel shading algorithm to account for flow shadowing effects and supports multiple materials and orientations, making it especially useful for early mission design, aerodynamic database generation, and post-mission analysis.
The verification and validation of ADBSat is presented in [28], by comparing its results against direct simulation Monte Carlo (DSMC) simulations and published literature, demonstrating that ADBSat offers accurate and significantly faster estimations of aerodynamic coefficients for most satellite geometries, with a recommended error margin of up to 3%.
To apply the panel method to a 3U CubeSat using ADBSat, you begin by obtaining the atmospheric parameters from the Python implementation of the NRLMSISE-00 model. These parameters include atmospheric density, temperature, and molecular composition, and are calculated at the desired orbital altitude and location. Once these values are extracted, they are used as inputs for the aerodynamic simulation in ADBSat.
The CubeSat geometry must be modeled in a CAD program and exported as a Wavefront.obj file composed of triangular panels, as shown in Figure 6. This file is then imported into ADBSat, which processes the geometry and applies the selected gas–surface interaction model, typically the Sentman model for LEO conditions.
To introduce the atmospheric parameters obtained from the Python NRLMSISE-00 model into ADBSat, a MATLAB 2024script has been developed. This script acts as an interface between the Python-generated data and the ADBSat environment, allowing users to input key parameters such as atmospheric density, temperature, and the energy accommodation coefficient.
In this study, an energy accommodation coefficient (α) of 0.9 is used as a representative value for the aerodynamic modeling of a 3U CubeSat, considering that all external surfaces are solar panels that are typically covered with glass. This choice is supported by experimental and theoretical studies which show that smooth, coated surfaces tend to exhibit high energy accommodation due to efficient thermalization of incident gas molecules. Values near 0.9 for glass and coated materials in space environments are reported in [29], while in [30] α values between 0.85 and 0.95 for glass-covered solar cells exposed to atomic oxygen are measured. These findings are consistent with the assumption that solar panel surfaces, being smooth and often protected, maintain high accommodation even in the harsh conditions of LEO. Therefore, using α = 0.9 provides a realistic and conservative estimate for drag modeling in free molecular flow, aligning with the physical behavior of typical CubeSat surface materials [30].
In addition to computing aerodynamic coefficients, ADBSat is also capable of calculating the contribution of solar radiation pressure (SRP) on satellite surfaces. This functionality allows users to estimate the forces and torques generated by incident solar photons, which is particularly relevant for attitude dynamics and long-term orbital evolution in higher altitudes or low-drag regimes. To perform this analysis, ADBSat uses the same CAD-based triangular mesh model as for aerodynamic calculations, ensuring consistency across simulations. The required inputs for SRP analysis include the orientation of the spacecraft relative to the Sun (defined by angles of incidence) and the solar radiation pressure coefficients. These parameters allow ADBSat to compute the pressure distribution across the satellite’s surfaces and derive the resulting force and moment coefficients.
For the purposes of this study, the selected values for the solar radiation pressure coefficients are c R = 0.3 for specular reflection and c D = 0.7 for diffuse reflection. These values are chosen based on the typical optical properties of solar panel surfaces used on satellites, which are usually covered with glass. Such surfaces exhibit a combination of specular and diffuse reflection, with the majority of incident solar radiation being scattered diffusely due to surface microstructure and partial absorption. The selected coefficients are consistent with values reported in the literature by [29,30], who found that glass-covered solar cells exposed to atomic oxygen environments exhibit reflection characteristics that support this distribution.
ADBSat then computes the aerodynamic and solar pressure coefficients by summing the contributions of each panel, accounting for their orientation and exposure to the flow. The software can simulate different attitudes by varying the angle of attack and sideslip, and it uses a shading algorithm to exclude panels shielded from the flow. The results are saved in MATLAB format and can be used to estimate the aerodynamic and solar radiation pressure forces acting on the CubeSat in orbit.

2.3. Maneuver Simulation

The Systems Tool Kit (STK) software is used as a key tool for simulating and analyzing the orbital behavior of CubeSats under different attitude configurations. STK provides a physics-based modeling environment that allows for high-fidelity orbit propagation using various propagators, including SGP4 and the High-Precision Orbit Propagator (HPOP) [25].
The drag force acting on the CubeSat is introduced in the STK simulation environment using the Astrogator module by modeling it as a thrust force, similar to that produced by a rocket engine, in the VNC reference frame (Figure 7). Although the CubeSat does not possess a propulsion system, this approach allows the simulation to replicate the effect of atmospheric drag resulting from changes in the satellite’s orientation. By adjusting the satellite’s cross-sectional area through its Attitude Determination and Control System (ADCS), the effective drag force changes, which in turn alters the satellite’s orbital parameters. In Astrogator, this is implemented by defining a thrust vector that mimics the decelerating effect of drag, enabling precise control over the simulated orbital decay and maneuver outcomes.
To compute aerodynamic forces from coefficients, Equation (2) is used.
F a e r o = 1 2 ρ V 2 C a e r o A r e f
where
  • ρ is the atmospheric density (kg/m3);
  • V is the satellite orbital velocity (m/s);
  • Caero is the aerodynamic coefficient of lift or drag (-);
  • Aref is the reference area (m2).
On the other hand, to compute the solar pressure forces, Equation (3) must be used.
F s o l a r = P S R P S S R P A r e f
where
  • PSRP is solar radiation pressure at 1 AU (approximately 4.56 × 10⁻⁶ Pa);
  • SSRP is the solar pressure coefficient (-);
  • Aref is the reference area (m2).
The reference area, A r e f , used for computing aerodynamic and solar radiation pressure forces, is provided by ADBSat and is defined as half of the total surface area of the satellite.
The CubeSat’s attitude is initially set to a base orientation of 0°, meaning that the satellite’s 1U face is aligned directly into the velocity vector—effectively facing the direction of motion through the atmosphere. From this baseline configuration, we simulate attitude maneuvers to six additional orientations by incrementally increasing the angle of attack (AoA) of the satellite in 15-degree steps, up to a maximum of 90 degrees (3U face in the direction of motion). Additionally, to fully capture the aerodynamic behavior and symmetry of the drag response, the same set of maneuvers is mirrored for negative angles of attack, ranging from −15 degrees to −90 degrees. These maneuvers are designed to progressively increase the effective cross-sectional area exposed to atmospheric drag, thereby enhancing the drag force experienced by the satellite. In the STK simulations, only the initial and final attitude states are modeled, and the transition between them is assumed to be instantaneous, neglecting the intermediate dynamics of the maneuver.
Collision avoidance maneuvers are evaluated by analyzing the satellite’s positional deviations in the VNC reference frame. The STK 2023 software, specifically through its Astrogator tool, is used to simulate the orbital evolution resulting from attitude-induced drag variations. This setup enables precise modeling of the satellite’s trajectory under different orientation scenarios, supporting a robust assessment of the feasibility and effectiveness of the proposed ADCS-based collision avoidance strategy.

2.4. Effect Evaluation

Collision avoidance maneuvers effects are evaluated by analyzing the satellite’s positional deviations in the VNC reference frame. The effectiveness of each maneuver is determined by comparing the satellite’s position two days after the maneuver to its baseline trajectory (the position it would have maintained without any attitude change). These deviations are quantified and presented as Vertical Distance Difference (VDD) and Horizontal Distance Difference (HDD), which respectively represent the displacement in the radial and along-track directions. This method provides a clear and measurable way to assess how attitude-induced drag modulation can alter the satellite’s orbit and contribute to reducing collision risk.

3. Results

The results are presented following the same sequence as the methodology, ensuring clear and logical progression from the definition of the maneuver scenarios to the evaluation of their outcomes. Each maneuver is simulated and analyzed in the order it was introduced, and the corresponding effects on the satellite’s trajectory are quantified using the Vertical Distance Difference (VDD) and Horizontal Distance Difference (HDD) metrics. This structured presentation allows for a direct correlation between the maneuver setup and its impact, facilitating a comprehensive understanding of how each attitude change influences the satellite’s position relative to its baseline trajectory.
Three different orbits are analyzed: SAT-H, for Lume altitude of 500 km; SAT-M, for an altitude of 460 km; and SAT-L, for 420 km.

3.1. Atmospheric Parameters

Table 1 presents the atmospheric parameters that were obtained using the Python implementation of the NRLMSISE-00 atmospheric model. These parameters include key environmental variables such as atmospheric density and temperature, which are essential for accurately modeling the drag force acting on the CubeSat.
To ensure representative conditions, the values were computed as mean values across two fixed longitudes and a range of latitudes. This averaging approach provides a balanced and realistic atmospheric profile for the simulation scenarios, allowing ADBSat to generate reliable aerodynamic coefficients for different CubeSat orientations and altitudes.

3.2. Aerodynamic and Solar Pressure Coefficients

Aerodynamic and solar pressure coefficients are computed with respect to the satellite’s direction of flight, which represents the velocity vector in the orbital frame. This directional consideration ensures that the computed forces accurately reflect the satellite’s orientation relative to the incoming atmospheric flow and solar radiation. For each orbit under study, both aerodynamic coefficients (such as drag and lift) and solar radiation pressure coefficients (including specular and diffuse reflection components) are calculated. Coefficients are already converted to the VNC reference system.
Table 2 presents the solar pressure coefficients for the three orbits, as similar solar pressure conditions were considered for all of them.

3.2.1. SAT-H

Table 3 presents the aerodynamic coefficients specifically computed for the SAT-H configuration, which corresponds to the highest of the three orbital altitudes analyzed.

3.2.2. SAT-M

Table 4 presents the aerodynamic coefficients specifically computed for the SAT-M configuration, which corresponds to the medium orbital altitude among the three cases analyzed.

3.2.3. SAT-L

Table 5 presents the aerodynamic coefficients specifically computed for the SAT-L configuration, which corresponds to the lowest of the three orbital altitudes analyzed.

3.3. Maneuver Configuration

The lift and drag forces acting on the CubeSat are computed based on the combined effects of aerodynamic and solar pressure forces. These forces are determined for each satellite configuration (SAT-H, SAT-M, and SAT-L) and for a range of angles of attack, both positive and negative. By integrating these two sources of external force, the study calculates the net lift and drag experienced by the satellite in each scenario.
Table 6 presents the solar pressure forces for the three orbits, as similar solar pressure conditions were considered for all of them.

3.3.1. SAT-H

Table 7 presents the aerodynamic forces specifically computed for the SAT-H configuration, which corresponds to the highest of the three orbital altitudes analyzed.

3.3.2. SAT-M

Table 8 presents the aerodynamic forces specifically computed for the SAT-M configuration, which corresponds to the medium orbital altitude among the three cases analyzed.

3.3.3. SAT-L

Table 9 presents the aerodynamic forces specifically computed for the SAT-L configuration, which corresponds to the lowest of the three orbital altitudes analyzed.

3.4. Efects of Maneuvers
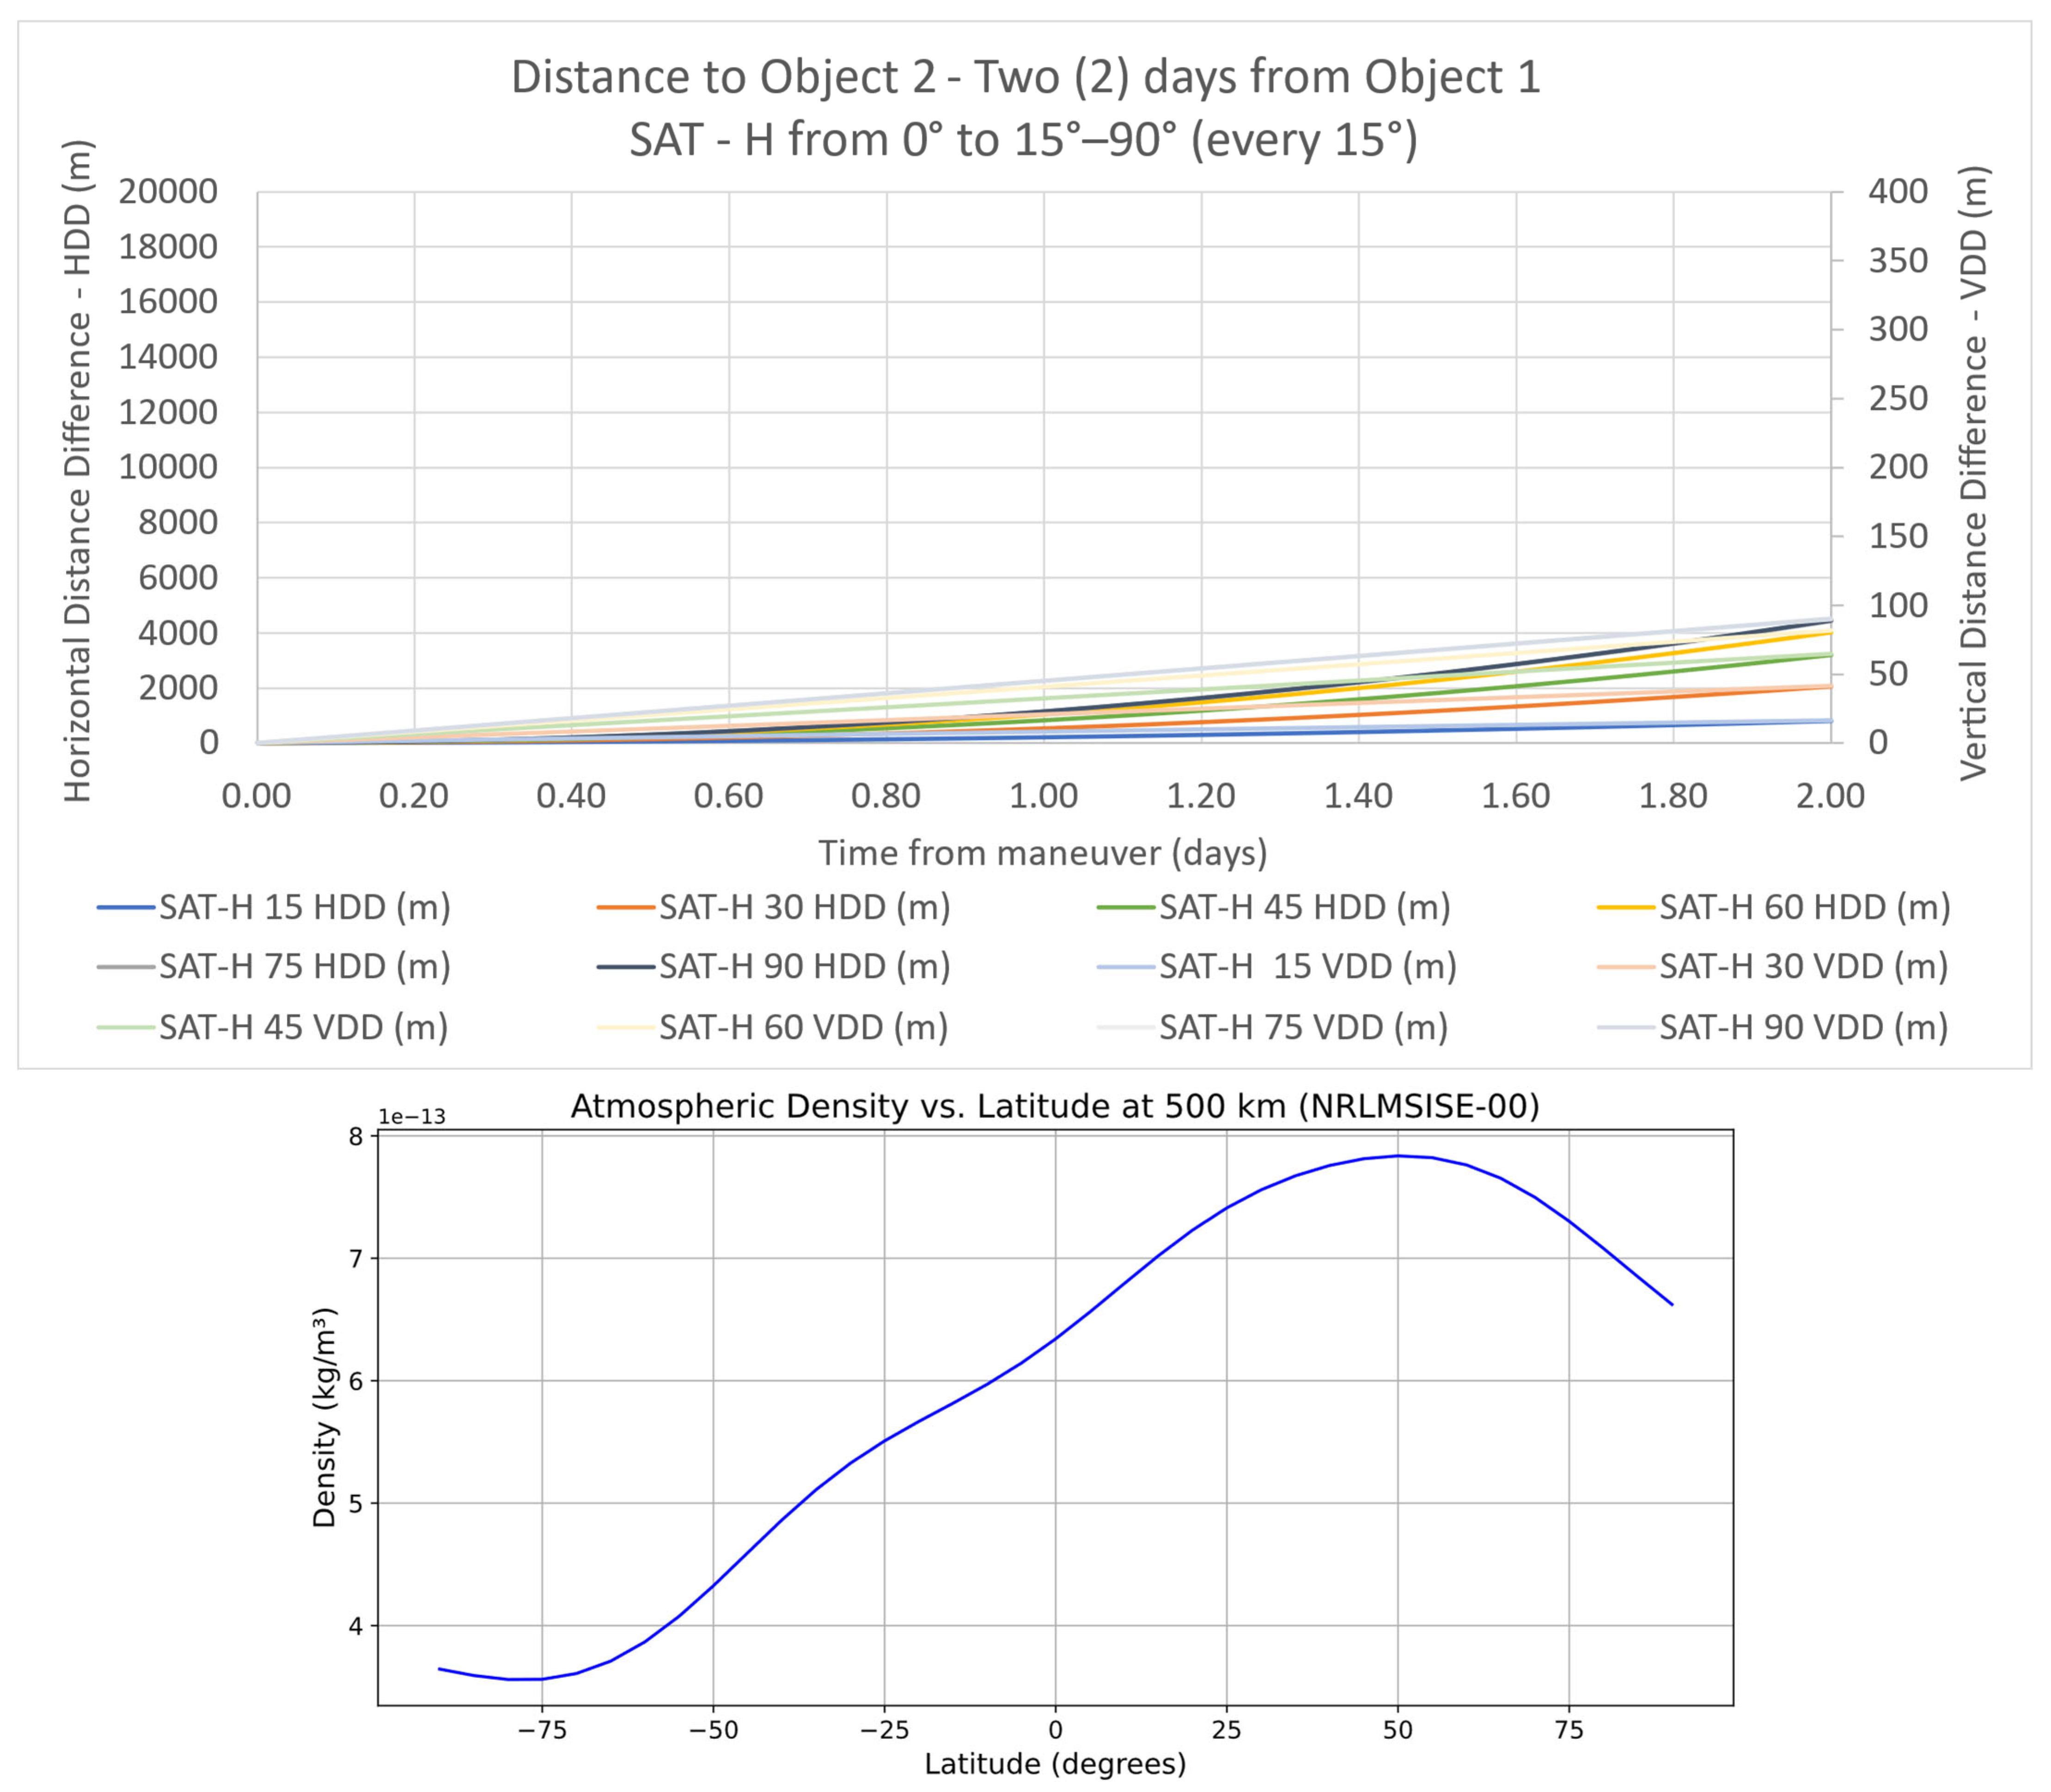
The computation of the Vertical Distance Difference (VDD) and Horizontal Distance Difference (HDD) is presented for all combinations of angles of attack and satellite configurations (SAT-H, SAT-M, and SAT-L). The same scale range has been maintained across all plots of results. This consistent scaling allows for a direct and meaningful visual comparison between different maneuver scenarios, satellite configurations, and angles of attack. These results correspond to a two-day maneuver period, during which the CubeSat’s attitude is altered to modify its aerodynamic profile and, consequently, its orbital trajectory.

3.4.1. SAT-H

Figure 8 presents the distances (HDD and VDD) from Object 1 (AoA = 0) to Object 2 (specific AoA), for SAT-H.

3.4.2. SAT-M

Figure 9 presents the distances (HDD and VDD) from Object 1 (AoA = 0) to Object 2 (specific AoA), for SAT-M.

3.4.3. SAT-L

Figure 10 presents the distances (HDD and VDD) from Object 1 (AoA = 0) to Object 2 (specific AoA), for SAT-L.

4. Discussion

This section opens the discussion of results, which will be explored in detail in the following paragraphs. It will be briefly introduced to the analysis of the aerodynamic and solar pressure coefficients obtained for each satellite and angle of attack, the resulting lift and drag forces, and the computed Vertical and Horizontal Distance Differences (VDD and HDD) after two-day maneuvers. Additionally, we will compare these VDD and HDD values with those from a previous study that used a constant drag coefficient, to assess the impact of using orientation-dependent coefficients.
The aerodynamic coefficients computed using the panel method in this study tend to be lower than the typical values commonly used in drag simulations. It is also worth noting that the aerodynamic coefficients show a slight increase with altitude. This trend can be attributed to changes in the flow regime and atmospheric composition at higher altitudes, which affect how the satellite’s surface interacts with the surrounding environment. Although the atmosphere becomes less dense, the molecular mean free path increases, and the flow tends to become more rarefied, which can lead to subtle variations in the effective aerodynamic behavior of the satellite. These effects are captured in the panel method calculations and reflected in the results for the different orbital configurations [27,28].
The lift forces, acting along the Z-axis, are found to be between 5% and 15% of the corresponding drag forces, which act along the X-axis. This proportion reflects the expected behavior in low Earth orbit, where the satellite’s orientation and geometry produce significantly more resistance in the direction of motion than perpendicular to it. This is represented as global lift and drag coefficients comparison in Figure 11.
The HDD and VDD distances observed in this study follow the expected behavior based on the aerodynamic and solar radiation pressure forces involved. The Horizontal Distance Differences (HDD) are significantly larger than the Vertical Distance Differences (VDD) due to the cumulative effect of tangential displacements over the two-day maneuver period. In contrast, the VDD values are primarily caused by the gradual reduction in the semi-major axis of the orbit, resulting from increased drag. When comparing different altitudes, the VDD and HDD values nearly double with every 40 km decrease in orbital height, due to the increase in air density. Regarding the analysis by angle of attack, the VDD and HDD values after two days exhibit an approximately sinusoidal pattern, consistent with the variation in projected area and force components as the satellite rotates relative to the flow.
When comparing the results of this study with [14] that used a constant drag coefficient, we observe that the VDD and HDD values remain within the same order of magnitude and exhibit similar overall trends. This consistency validates the general behavior of the satellite under drag-based maneuvers.
The magnitude of the simulated displacements (HDD and VDD) is consistent with real-world conjunction data, such as the CDM received for LUME-1, which reported a miss distance of 990 m; this supports the practical relevance of the proposed maneuver strategy in reducing collision risk. However, it is important to note that uncertainties in atmospheric density modeling and ADCS performance could affect the accuracy of the predicted orbital shifts, and should be considered in operational implementations.
While the maneuver simulations demonstrate effective orbital displacement, it is important to consider the influence of modeling uncertainties. Atmospheric density in low Earth orbit is highly variable due to solar activity, geomagnetic conditions, and local time effects, which can lead to deviations of up to 100% from model predictions during extreme events. Additionally, the accuracy of the Attitude Determination and Control System (ADCS) in executing precise orientation changes is critical, as even small errors in attitude can alter the projected cross-sectional area and thus the resulting drag force. These factors introduce variability in the maneuver outcome and should be accounted for in operational risk assessments and real-time decision-making.
The panel method used in the current study offers a more accurate and physically representative approach, as it accounts for the variation in aerodynamic coefficients with satellite orientation. Unlike the constant-coefficient model, the panel method captures the influence of geometry and angle of attack on the pressure distribution over the satellite’s surface. This leads to a more realistic estimation of drag and lift forces, especially important in low Earth orbit where the interaction between the satellite and the rarefied atmosphere is highly sensitive to surface orientation. Therefore, although both methods yield comparable results in magnitude, the panel method provides greater fidelity and adaptability, making it a more robust tool for precise collision avoidance modeling.
The difference between positive and negative angles of attack is found to be negligible in this study. This is likely due to the very small magnitude of the lift forces involved, which in all cases are in the order of 0.1 to 0.7 μN. Given that lift acts perpendicular to the direction of motion and is significantly weaker than drag, its influence on the satellite’s trajectory over the two-day maneuver period is minimal. As a result, the symmetry in the aerodynamic response leads to nearly identical outcomes for positive and negative angles of attack, particularly in terms of VDD and HDD values, as it is shown in Figure 12.
For lift to become a significant factor in orbital maneuvering, the satellite would need to have either larger reference surfaces or operate at lower orbital altitudes, where both atmospheric density and orbital velocity are higher. These conditions would increase the magnitude of the lift force. However, operating at lower altitudes comes with a major drawback: the satellite’s lifetime is drastically reduced due to accelerated orbital decay caused by increased drag.
Although lift forces were found to be only 5–15% of the corresponding drag forces in this study, future research could explore their potential impact in lower orbits or in CubeSat designs with deployable panels, where increased surface area and atmospheric density may amplify lift contributions to orbital maneuvering.
Future work is planned to explore the use of CubeSats equipped with deployable solar panels, which would increase the effective surface area and potentially enhance the aerodynamic forces, including lift. If the lift force becomes sufficiently significant, it could even be considered for modifying orbital parameters such as the Right Ascension of the Ascending Node (RAAN) or orbital inclination, opening new possibilities for passive or semi-passive orbit control strategies.

5. Conclusions

The proposed methodology offers a practical and resource-efficient framework for enabling passive collision avoidance in non-propulsive CubeSats, enhancing mission safety and sustainability in increasingly congested low Earth orbit environments.
The results confirm that attitude-based collision avoidance using ADCS is effective for CubeSats, with VDD and HDD values showing expected trends based on altitude, angle of attack, and force accumulation. The panel method provides more realistic aerodynamic modeling than constant-coefficient approaches, especially in low Earth orbit.
Compared to earlier approaches using constant drag coefficients, the panel method employed here offers improved accuracy by capturing the influence of satellite orientation and atmospheric variability, thereby enhancing the reliability of passive collision avoidance strategies in diverse orbital environments.
Although lift forces are minor, future designs with deployable surfaces could enhance their impact. This is particularly relevant for remote sensing applications, where maintaining precise orbital positioning and avoiding collisions is critical for ensuring continuous Earth observation and data quality.
Although this study focuses on CubeSats, the proposed methodology is applicable to any satellite equipped with an active ADCS and operating in low Earth orbit. The effectiveness of aerodynamic control for collision avoidance depends primarily on the ratio between the maximum and minimum cross-sectional areas achievable through attitude maneuvers. Satellites with larger surface area variability can induce greater drag modulation and, consequently, more significant orbital displacement. In contrast, smaller platforms such as 1U CubeSats, which have limited geometric asymmetry, exhibit reduced maneuver effectiveness due to minimal variation in exposed area. Therefore, while the technique is broadly applicable, its performance scales with satellite geometry and should be evaluated accordingly for different spacecraft configurations.

Author Contributions

Conceptualization, P.O.-C.; Data curation, J.M.N.-O.; Formal analysis, J.M.N.-O.; Funding acquisition, F.A.-A.; Investigation, D.G.R.; Project administration, F.A.-A.; Software, P.O.-C.; Supervision, P.O.-C.; Visualization, D.G.R.; Writing—original draft, D.G.R. All authors have read and agreed to the published version of the manuscript.

Funding

This research received no external funding.

Data Availability Statement

The scripts and a data are available online in https://github.com/porgeira/pprSI, accessed on 8 July 2025.

Conflicts of Interest

The authors declare no conflict of interest.

Abbreviations

The following abbreviations are used in this manuscript:
LEOLow Earth Orbit
ADCSAttitude Determination and Control System
UUnit
STKSystem Tool Kit
CDMConjunction Data Message
ESAEuropean Space Agency
IADCInter-Agency Space Debris Coordination Committee
COPUOSCommittee on the Peaceful Uses of Outer Space
ISOInternational Organisation for Standardisation
NASANational Aeronautics and Space Administration
JSpOCJoint Space Operations Center
SSNSpace Surveillance Network
ISSInternational Space Station
CDSCubeSat Design Specification
UAVUnmanned Aerial Vehicle
SGP4Standard General Perturbations Satellite Orbit Model 4
HPOPHigh-Precision Orbit Propagator
CAConjunction Assessment
TCATime of Closest Approach
LVLHLocal Vertical, Local Horizontal
TLETwo-Line Element
VDDVertical Distance Difference
HDDHorizontal Distance Difference
VNCVelocity Normal Co-Normal

References

  1. Li, Z.; Li, H.; Li, C. ELVO-Based Autonomous Satellite Collision Avoidance with Multiple Debris. Aerospace 2025, 12, 402. [Google Scholar] [CrossRef]
  2. Alén Space. A Basic Guide to Nanosatellites. Available online: https://alen.space/basic-guide-nanosatellites/ (accessed on 22 January 2025).
  3. NASA CubeSats Overview. Available online: https://www.nasa.gov/what-are-smallsats-and-cubesats/ (accessed on 22 January 2025).
  4. CubeSat Program. The CubeSat Standard. Available online: https://www.cubesat.org/about/ (accessed on 22 January 2025).
  5. CubeSat Program. CubeSat Design Specification Rev. 14.1. Available online: https://www.cubesat.org/s/CDS-REV14_1-2022-02-09.pdf (accessed on 22 January 2025).
  6. CCSDS. CCSDS 508.0-B-1: Conjunction Data Message (CDM); CCSDS: Washington, WA, USA, 2013. [Google Scholar]
  7. Kessler, D.; Cour-Palais, B. Collision Frequency of Artificial Satellites: The Creation of a Debris Belt. J. Geophys. Res. Space Phys. 1978, 83, 2637–2646. [Google Scholar] [CrossRef]
  8. Liou, J.-C. Active Debris Removal and the Challenges for Environment Remediation. NASA Orbital Debris Quarterly News 2009. Available online: https://ntrs.nasa.gov/citations/20120013266 (accessed on 8 July 2025).
  9. NASA. Space Debris and Human Spacecraft. Available online: https://www.nasa.gov/mission_pages/station/news/orbital_debris.html (accessed on 25 January 2025).
  10. GISTDA. Collision Avoidance Strategies Conjunction Risk Assessment Analysis Tool; GISTDA: Bangkok, Thailand, 2019. [Google Scholar]
  11. Sun, X.; Wang, Y.; Su, J.; Li, J.; Xu, M.; Bai, S. Relative orbit transfer using constant-vector thrust acceleration. Acta Astronaut. 2025, 229, 715–735. [Google Scholar] [CrossRef]
  12. Smith, T.K.; Akagi, J.; Droge, G. Model predictive control for formation flying based on D’Amico relative orbital elements. Astrodynamics 2025, 9, 143–163. [Google Scholar] [CrossRef]
  13. Zhou, H.; Jiao, B.; Dang, Z.; Yuan, J. Parametric formation control of multiple nanosatellites for cooperative observation of China Space Station. Astrodynamics 2024, 8, 77–95. [Google Scholar] [CrossRef]
  14. González-Rodríguez, D.; Orgeira-Crespo, P.; Cappelletti, C.; Aguado-Agelet, F. Methodology for CubeSat Debris Collision Avoidance Based on Its Active ADCS System. Appl. Sci. 2023, 13, 12388. [Google Scholar] [CrossRef]
  15. Prieto, D.M.; Graziano, B.P.; Roberts, P.C.E. Spacecraft Drag Modelling. Prog. Aerosp. Sci. 2014, 64, 56–65. [Google Scholar] [CrossRef]
  16. Aranda, D.; Gago, P.; Pastor, A.; Escobar, D. Drag augmentation for collision avoidance in LEO. Adv. Space Res. 2025, 75, 6882–6895. [Google Scholar] [CrossRef]
  17. Traub, C.; Ben-Larbi, M.K.; Turco, F.; Siestrup, A.J.G.; Harbeck, J.; Stoll, E.; Lück, D. Revealing the impact of operational constraints on aerodynamic collision avoidance maneuvers: In-flight results from the BEESAT-4 CubeSat. Acta Astronaut. 2025, 234, 296–313. [Google Scholar] [CrossRef]
  18. Gaglio, E.; Traub, C.; Sannino, A.; Mungiguerra, S.; Turco, F.; Fasoulas, S.; Savino, R.; Bevilacqua, R. Quasi-optimal Guidance and Control in Very Low Earth Orbit via Deep Learning for Drag-Based Collision Avoidance. NASA/GSFC CCMC, NRLMSISE-00 Atmospheric Model. Available online: https://ccmc.gsfc.nasa.gov/modelweb/models/nrlmsise00.php (accessed on 22 January 2025).
  19. Picone, J.M.; Hedin, A.E.; Drob, D.P.; Aikin, A.C. NRLMSISE-00 empirical model of the atmosphere: Statistical comparisons and scientific issues. J. Geophys. Res. A Space Phys. 2002, 107, SIA 15-1–SIA 15-16. [Google Scholar] [CrossRef]
  20. St-Bender, S. Pynrlmsise00: Python Interface for the NRLMSISE-00 Empirical Atmosphere Model. Version 0.1.2. 2023. Available online: https://github.com/st-bender/pynrlmsise00 (accessed on 25 September 2024).
  21. ECSS-E-10-04A; Space Engineering: Space Environment. ESA-ESTEC: Noordwijk, The Netherlands, 2008.
  22. Bowman, B.R.; Tobiska, W.K.; Marcos, F.A.; Valladares, C. The JB2006 empirical thermospheric density model. J. Atmos. Sol.-Terr. Phys. 2008, 70, 774–793. [Google Scholar] [CrossRef]
  23. Vallado, D.A.; Finkleman, D. A critical assessment of satellite drag and atmospheric density modeling. In Proceedings of the AIAA/AAS Astrodynamics Specialist Conference, Honolulu, HI, USA, 18–21 August 2008. [Google Scholar]
  24. Ansys. Systems Tool Kit (STK). Available online: https://www.agi.com/products/stk (accessed on 22 July 2024).
  25. Crisp, N.H.; Roberts, P.C.E.; Hanessian, V.; Sulliotti-Linner, V.; Herdrich, G.H.; García-Almiñana, D.; Kataria, D.; Seminari, S. A method for the experimental characterisation of novel drag-reducing materials for very low Earth orbits using the Satellite for Orbital Aerodynamics Research (SOAR) mission. CEAS Space J. 2022, 14, 655–674. [Google Scholar] [CrossRef]
  26. Marianowski, C.; Traub, C.; Pfeiffer, M.; Fasoulas, S. ADBSat: Methodology of a Novel Panel Method Tool for Aerodynamic Analysis of Satellites. Comput. Phys. Commun. 2022, 272, 108244. [Google Scholar]
  27. Marianowski, C.; Traub, C.; Pfeiffer, M.; Fasoulas, S. ADBSat: Verification and Validation of a Novel Panel Method for Quick Aerodynamic Analysis of Satellites. Comput. Phys. Commun. 2023, 287, 108327. [Google Scholar]
  28. Verniani, F. The energy accommodation coefficient of satellite surfaces and its effects on drag. Planet. Space Sci. 1965, 13, 929–941. [Google Scholar]
  29. Zhao, H.; Levin, D.A. Drag and thermal accommodation coefficients of space materials measured in atomic oxygen environment. J. Spacecr. Rocket. 2015, 52, 876–883. [Google Scholar]
  30. Sutton, K.; Graves, R.A., Jr. A General Stagnation-Point Convective Heating Equation for Arbitrary Gas Mixtures; NASA Technical Report R-376; NASA: Washington, DC, USA, 1971.
Figure 2. Timeline of collision avoidance operational activities [10].
Remotesensing 17 02437 g002
Figure 3. NRLMSISE-00 atmospheric density and temperature profiles.
Remotesensing 17 02437 g003
Figure 4. LUME-1 TLE data used in the research and LUME-1 satellite model.
Remotesensing 17 02437 g004
Figure 5. Atmospheric density variation at 500 km altitude for different latitudes at LUME-1 LTAN longitude.
Remotesensing 17 02437 g005
Figure 6. Wavefront object representation with 2 triangular panels in each face.
Remotesensing 17 02437 g006
Figure 7. Velocity normal co-normal axes align the X axis along the inertial velocity vector and the Z axis toward the position vector; these are dependent on the object [19].
Remotesensing 17 02437 g007
Figure 8. HDD and VDD for SAT-H.
Remotesensing 17 02437 g008
Figure 9. HDD and VDD for SAT-M.
Remotesensing 17 02437 g009
Figure 10. HDD and VDD for SAT-L (time from maneuver).
Remotesensing 17 02437 g010
Figure 11. Global lift and drag coefficients comparison.
Remotesensing 17 02437 g011
Figure 12. HDD and VDD for SAT-L (angle of attack).
Remotesensing 17 02437 g012
Table 1. Atmospheric parameters for SAT-H, SAT-M, and SAT-L.
OrbitMean Density
(kg/m3)
Mean Temperature
(K)
Mean Molecular Mass
(g/mol)
SAT-H5.155 × 10−131001.453.96
SAT-M9.924 × 10−131001.344.23
SAT-L1.967 × 10−121001.074.56
Table 2. Solar pressure (Cfs) coefficients for SAT-H, SAT-M, and SAT-L.
Angle of Attack
(°)
C f s X
(−)
C f s Y
(−)
C f s Z
(−)
−90−0.70000
−75−0.6980−0.067
−60−0.6430−0.115
−45−0.5500−0.133
−30−0.4370−0.115
−15−0.3250−0.067
0−0.23300.000
15−0.32500.067
30−0.43700.115
45−0.55000.133
60−0.64300.115
75−0.69800.067
90−0.70000
Table 3. Aerodynamic (Cfw) coefficients for SAT-H.
Angle of Attack
(°)
C f w X
(−)
C f w Y
(−)
C f w Z
(−)
−90−1.26200
−75−1.2600−0.033
−60−1.2150−0.064
−45−1.1010−0.081
−30−0.9310−0.079
−15−0.7340−0.056
0−0.62300.000
15−0.73400.056
30−0.93100.079
45−1.10100.081
60−1.21500.064
75−1.26000.033
90−1.26200
Table 4. Aerodynamic (Cfw) coefficients for SAT-M.
Angle of Attack
(°)
C f w X
(−)
C f w Y
(−)
C f w Z
(−)
−90−1.25200
−75−1.2510−0.033
−60−1.2060−0.063
−45−1.0930−0.080
−30−0.9240−0.077
−15−0.7250−0.054
0−0.61300.000
15−0.72500.054
30−0.92400.077
45−1.09300.080
60−1.20600.063
75−1.25100.033
90−1.25200
Table 5. Aerodynamic (Cfw) coefficients for SAT-L.
Angle of Attack
(°)
C f w X
(−)
C f w Y
(−)
C f w Z
(−)
−90−1.24100
−75−1.2410−0.032
−60−1.1970−0.062
−45−1.0850−0.078
−30−0.9160−0.075
−15−0.7170−0.053
0−0.60100.000
15−0.71700.053
30−0.91600.075
45−1.08500.078
60−1.19700.062
75−1.24100.032
90−1.24100
Table 6. Solar pressure (FS) forces for SAT-H, SAT-M, and SAT-L.
Angle of Attack
(°)
F s X
(N)
F s Y
(N)
F s Z
(N)
−90−2.23 × 10−700
−75−2.23 × 10−70−2.13 × 10⁻⁸
−60−2.05 × 10−70−3.69 × 10⁻⁸
−45−1.75 × 10−70−4.26 × 10⁻⁸
−30−1.39 × 10−70−3.69 × 10⁻⁸
−15−1.04 × 10−702.13 × 10⁻⁸
0−7.45 × 10−800.00 × 100
15−1.04 × 10−702.13 × 10⁻⁸
30−1.39 × 10−703.69 × 10⁻⁸
45−1.75 × 10−704.26 × 10⁻⁸
60−2.05 × 10−703.69 × 10⁻⁸
75−2.23 × 10−702.13 × 10⁻⁸
90−2.23 × 10−700
Table 7. Aerodynamic (Fw) forces for SAT-H.
Angle of Attack
(°)
F w X
(N)
F w Y
(N)
F w Z
(N)
−90−2.05 × 10−60−8.40 × 10⁻²³
−75−2.05 × 10−60−1.04 × 10⁻⁷
−60−1.94 × 10−60−1.88 × 10⁻⁷
−45−1.73 × 10−60−2.25 × 10⁻⁷
−30−1.43 × 10−60−2.04 × 10⁻⁷
−15−1.11 × 10−60−1.28 × 10⁻⁷
0−8.96 × 10−600.00 × 100
15−1.11 × 10−601.28 × 10⁻⁷
30−1.43 × 10−602.04 × 10⁻⁷
45−1.73 × 10−602.25 × 10⁻⁷
60−1.94 × 10−601.88 × 10⁻⁷
75−2.05 × 10−601.04 × 10⁻⁷
90−2.05 × 10−608.40 × 10⁻²³
Table 8. Aerodynamic (Fw) forces for SAT-M.
Angle of Attack
(°)
F w X
(N)
F w Y
(N)
F w Z
(N)
−90−3.95 × 10−60−1.65 × 10⁻²²
−75−3.95 × 10−60−2.01 × 10⁻⁷
−60−3.74 × 10−60−3.62 × 10⁻⁷
−45−3.33 × 10−60−4.31 × 10⁻⁷
−30−2.75 × 10−60−3.90 × 10⁻⁷
−15−2.13 × 10−60−2.44 × 10⁻⁷
0−1.71 × 10−600.00 × 100
15−2.13 × 10−602.44 × 10⁻⁷
30−2.75 × 10−603.90 × 10⁻⁷
45−3.33 × 10−604.31 × 10⁻⁷
60−3.74 × 10−603.62 × 10⁻⁷
75−3.95 × 10−602.01 × 10⁻⁷
90−3.95 × 10−601.65 × 10⁻²²
Table 9. Aerodynamic (Fw) forces for SAT-L.
Angle of Attack
(°)
F w X
(N)
F w Y
(N)
F w Z
(N)
−90−7.84 × 10−60−3.28 × 10⁻²²
−75−7.83 × 10−60−3.99 × 10⁻⁷
−60−7.43 × 10−60−7.18 × 10⁻⁷
−45−6.60 × 10−60−8.53 × 10⁻⁷
−30−5.46 × 10−60−7.70 × 10⁻⁷
−15−4.21 × 10−60−4.81 × 10⁻⁷
0−3.37 × 10−600.00 × 100
15−4.21 × 10−604.81 × 10⁻⁷
30−5.46 × 10−607.70 × 10⁻⁷
45−6.60 × 10−608.53 × 10⁻⁷
60−7.43 × 10−607.18 × 10⁻⁷
75−7.83 × 10−603.99 × 10⁻⁷
90−7.84 × 10−603.28 × 10⁻²²
Disclaimer/Publisher’s Note: The statements, opinions and data contained in all publications are solely those of the individual author(s) and contributor(s) and not of MDPI and/or the editor(s). MDPI and/or the editor(s) disclaim responsibility for any injury to people or property resulting from any ideas, methods, instructions or products referred to in the content.

