1. Introduction
A canopy gap [
1] refers to a medium- to small-scale opening in the forest canopy resulting from human-related actions or natural disturbances (e.g., the decay, death, and lodging of trees). According to Brokaw [
2], the “canopy gap” is the region enveloped by the vertical projection of the surrounding tree crowns, and many scholars have used this definition in their research. As a common disturbance type in forest ecosystems, canopy gaps profoundly influence species composition, community succession, and carbon storage dynamics by altering the understory microenvironment (e.g., light, temperature, and moisture distribution) [
3,
4,
5]. A reasonable and accurate delineation of canopy gaps and their spatial distribution is not only an important foundation for analyzing forest structural heterogeneity and assessing ecosystem service functions but also a core prerequisite for enabling detailed forest land research and sustainable management [
6,
7].
Traditionally, ground investigation was a primary means for monitoring canopy gaps. The emergence of small aircraft, aerial walkways, and tower cranes advanced the study of canopy gaps to a certain degree [
8]. Nevertheless, these observation methods are limited by issues such as high labor costs, small coverage areas, and poor terrain adaptability, making it difficult to meet the needs of long-term dynamic observation in complex mountainous forest areas [
9,
10]. As a new platform, unmanned aerial vehicles (UAVs) have the advantages of a long battery life, strong timeliness, high data accuracy, and low cost. At the same time, UAVs can avoid the influence of the atmosphere on imaging due to the low flying altitude [
11,
12], and they have been prevalently applied in monitoring small-scale forest ecosystems [
13].
Methods for canopy gap extraction from UAV imagery have undergone a technological evolution from traditional classification approaches to deep learning-based techniques [
14,
15,
16,
17]. Pixel-wise classification methods rely solely on spectral features, tending to generate “salt-and-pepper” noise and failing to effectively capture the spatial structural features of canopy gaps. Object-based classification, by integrating multi-dimensional features such as spectral, textural, and shape characteristics, has improved the segmentation accuracy to some extent. However, it relies on manually designed feature parameters and struggles to characterize the irregular boundaries of canopy gaps in complex terrains, often resulting in excessive edge smoothing or fragmentation. These methods are fundamentally constrained by the expressiveness of handcrafted features, performing poorly in scenarios with understory shadow interference and uneven vegetation cover. Nowadays, deep learning, leveraging its powerful capability for automatic feature learning, has become a research hotspot in the field of remote-sensing information recognition and extraction [
18,
19,
20], and numerous breakthroughs have been made in forest monitoring. For example, EdgeFormer optimizes the feature capture of complex scenes through Transformer global attention [
21]; foundation models combined with Sentinel-2 time-series data enable forest change monitoring [
22]; knowledge-guided deep learning enhances the adaptability of multi-temporal monitoring in high-altitude mountainous areas [
23]; and Siamese networks optimize the extraction accuracy of forest cover changes based on Landsat 8 data [
24]. These advancements have provided a new paradigm for efficiently extracting complex semantic information of canopy gaps but still require further optimization for the unique attributes of canopy gaps.
Attention mechanisms and edge detection techniques have brought new ideas to remote-sensing information extraction [
20,
25,
26], while they face the core challenge of “insufficient semantic–geometric collaborative modeling” in canopy gap extraction. Channel attention modules (e.g., SENet [
27]) dynamically enhance spectral responses related to canopy gap-sensitive features by modeling non-linear dependencies between feature channels, effectively improving the discriminative ability for similar land objects in hyperspectral imagery classification. Edge detection networks (e.g., RCF [
28], BDCN [
29]) capture pixel value mutation information through multi-scale feature fusion, achieving high-precision boundary localization in the extraction of regular ground objects such as farmland [
30], roads [
31], and buildings [
32]. Nevertheless, canopy gap boundaries exhibit non-rigid, multi-scale variability due to interference from canopy shadows and understory vegetation cover. In existing methods, Transformer-based models (such as EdgeFormer) model long-range dependencies through global self-attention mechanisms, but their limited ability to characterize local geometric features leads to blurred segmentation contours when extracting targets with irregular boundaries like canopy gaps. Multi-task segmentation models (such as DeepLabv3+), although attempting to integrate semantic segmentation and edge detection tasks, lack special optimization for the “spectral heterogeneity + topographic interference” characteristics of canopy gaps. When facing spectral confusion between understory shadows and bare soil, they often suffer from missed segmentation due to insufficient semantic discrimination. This synergistic lack of “semantic feature enhancement” and “edge detail capture” means existing methods commonly encounter issues of omission, misclassification, and boundary discontinuity in canopy gap extraction within complex mountain forest areas. Therefore, a new deep learning framework needs to be constructed to combine spectral semantics and geometric priors.
To address the heterogeneity characteristics of canopy gaps and the technical bottlenecks of existing methods, we propose a multi-task deep learning network integrating edge features and semantic information (ES-Net). The architecture achieves three critical contributions: (1) The EDM’s multi-scale gradient fusion enables pixel-level boundary localization, reducing the Hausdorff Distance by 38.6% compared to U-Net; (2) the cross-layer attention in SSM enhances spectral discrimination for “same-spectrum” regions; and (3) the lightweight framework (23.99 M params) balances accuracy and efficiency, meeting UAV real-time processing requirements. When tested in Yunnan’s typical forests, ES-Net provides a robust solution for canopy gap extraction, advancing intelligent forest disturbance monitoring.
2. Material and Methods
2.1. Study Area
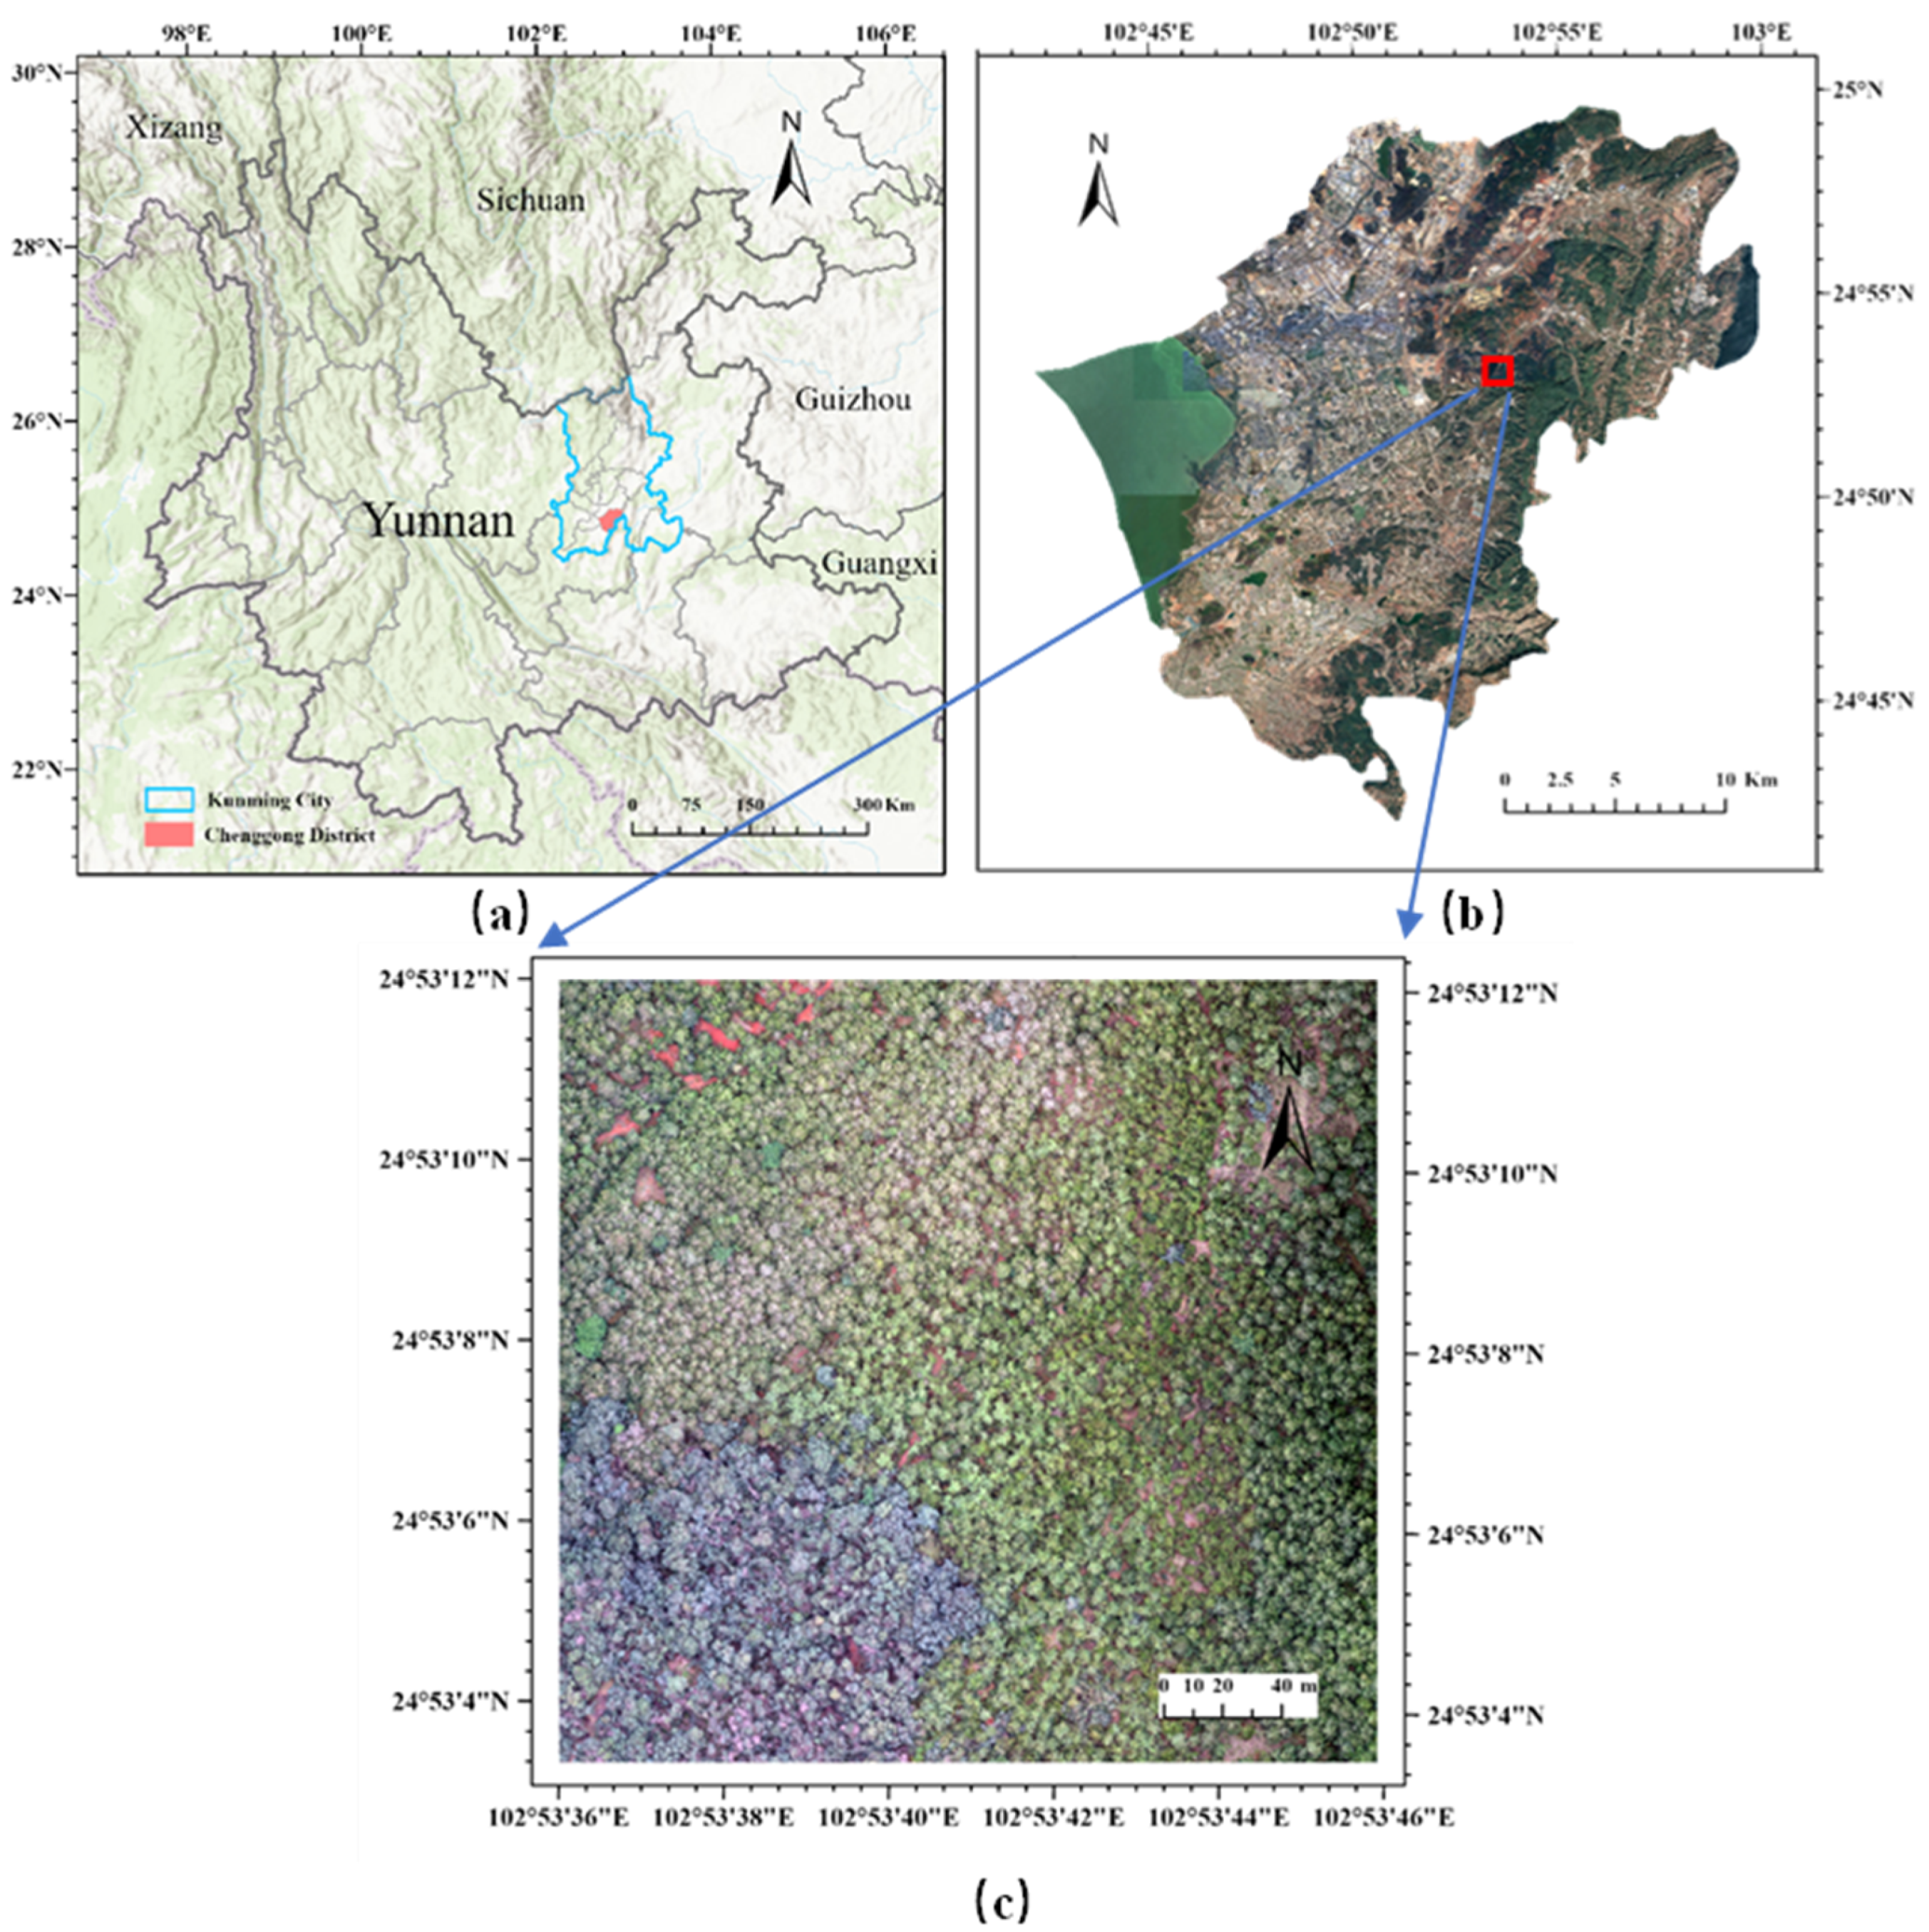
This study was conducted in a representative forest region within Yunnan Province, China, situated adjacent to Songmao Reservoir in Chenggong District, Kunming (
Figure 1). Nestled within the northeastern Dianchi Lake Basin at an average elevation of 2016.75 m, the area exhibits typical subtropical plateau monsoon climate characteristics. It has an average annual temperature of 14.9 degrees Celsius and receives an annual precipitation ranging from 900 to 1000 mm. The vegetation communities are dominated by coniferous forests composed primarily of
Pinus yunnanensis and
Podocarpus macrophyllus, with distinctive canopy gap structures. However, the complex terrain and significant topographic variations within the study area present substantial challenges for systematic monitoring of canopy gap dynamics and related ecological research.
2.2. Data Acquisition
A DJI Phantom 4 RTK UAV (SZ DJI Technology Co., Ltd., Shenzhen, China), featuring a 20-megapixel sensor, was utilized to acquire the image data of the study area on 13 July 2020. To ensure data integrity, flight operations were conducted under cloudless weather conditions with wind speeds below 3 m/s. Given the alpine terrain, a low-altitude flight plan at 180 m above ground level (AGL) was implemented to minimize atmospheric distortion. A dual-crossing flight pattern with 80% both course and side overlaps achieved full coverage, yielding 1268 photos. Post-processing using Agisoft PhotoScan generated an orthophoto (DOM) with a 0.039 m/pixel resolution, measuring 7132 × 6838 pixels. Georeferencing was performed using the WGS84 coordinate system with Universal Transverse Mercator (UTM) projection.
2.3. Canopy Gaps Dataset
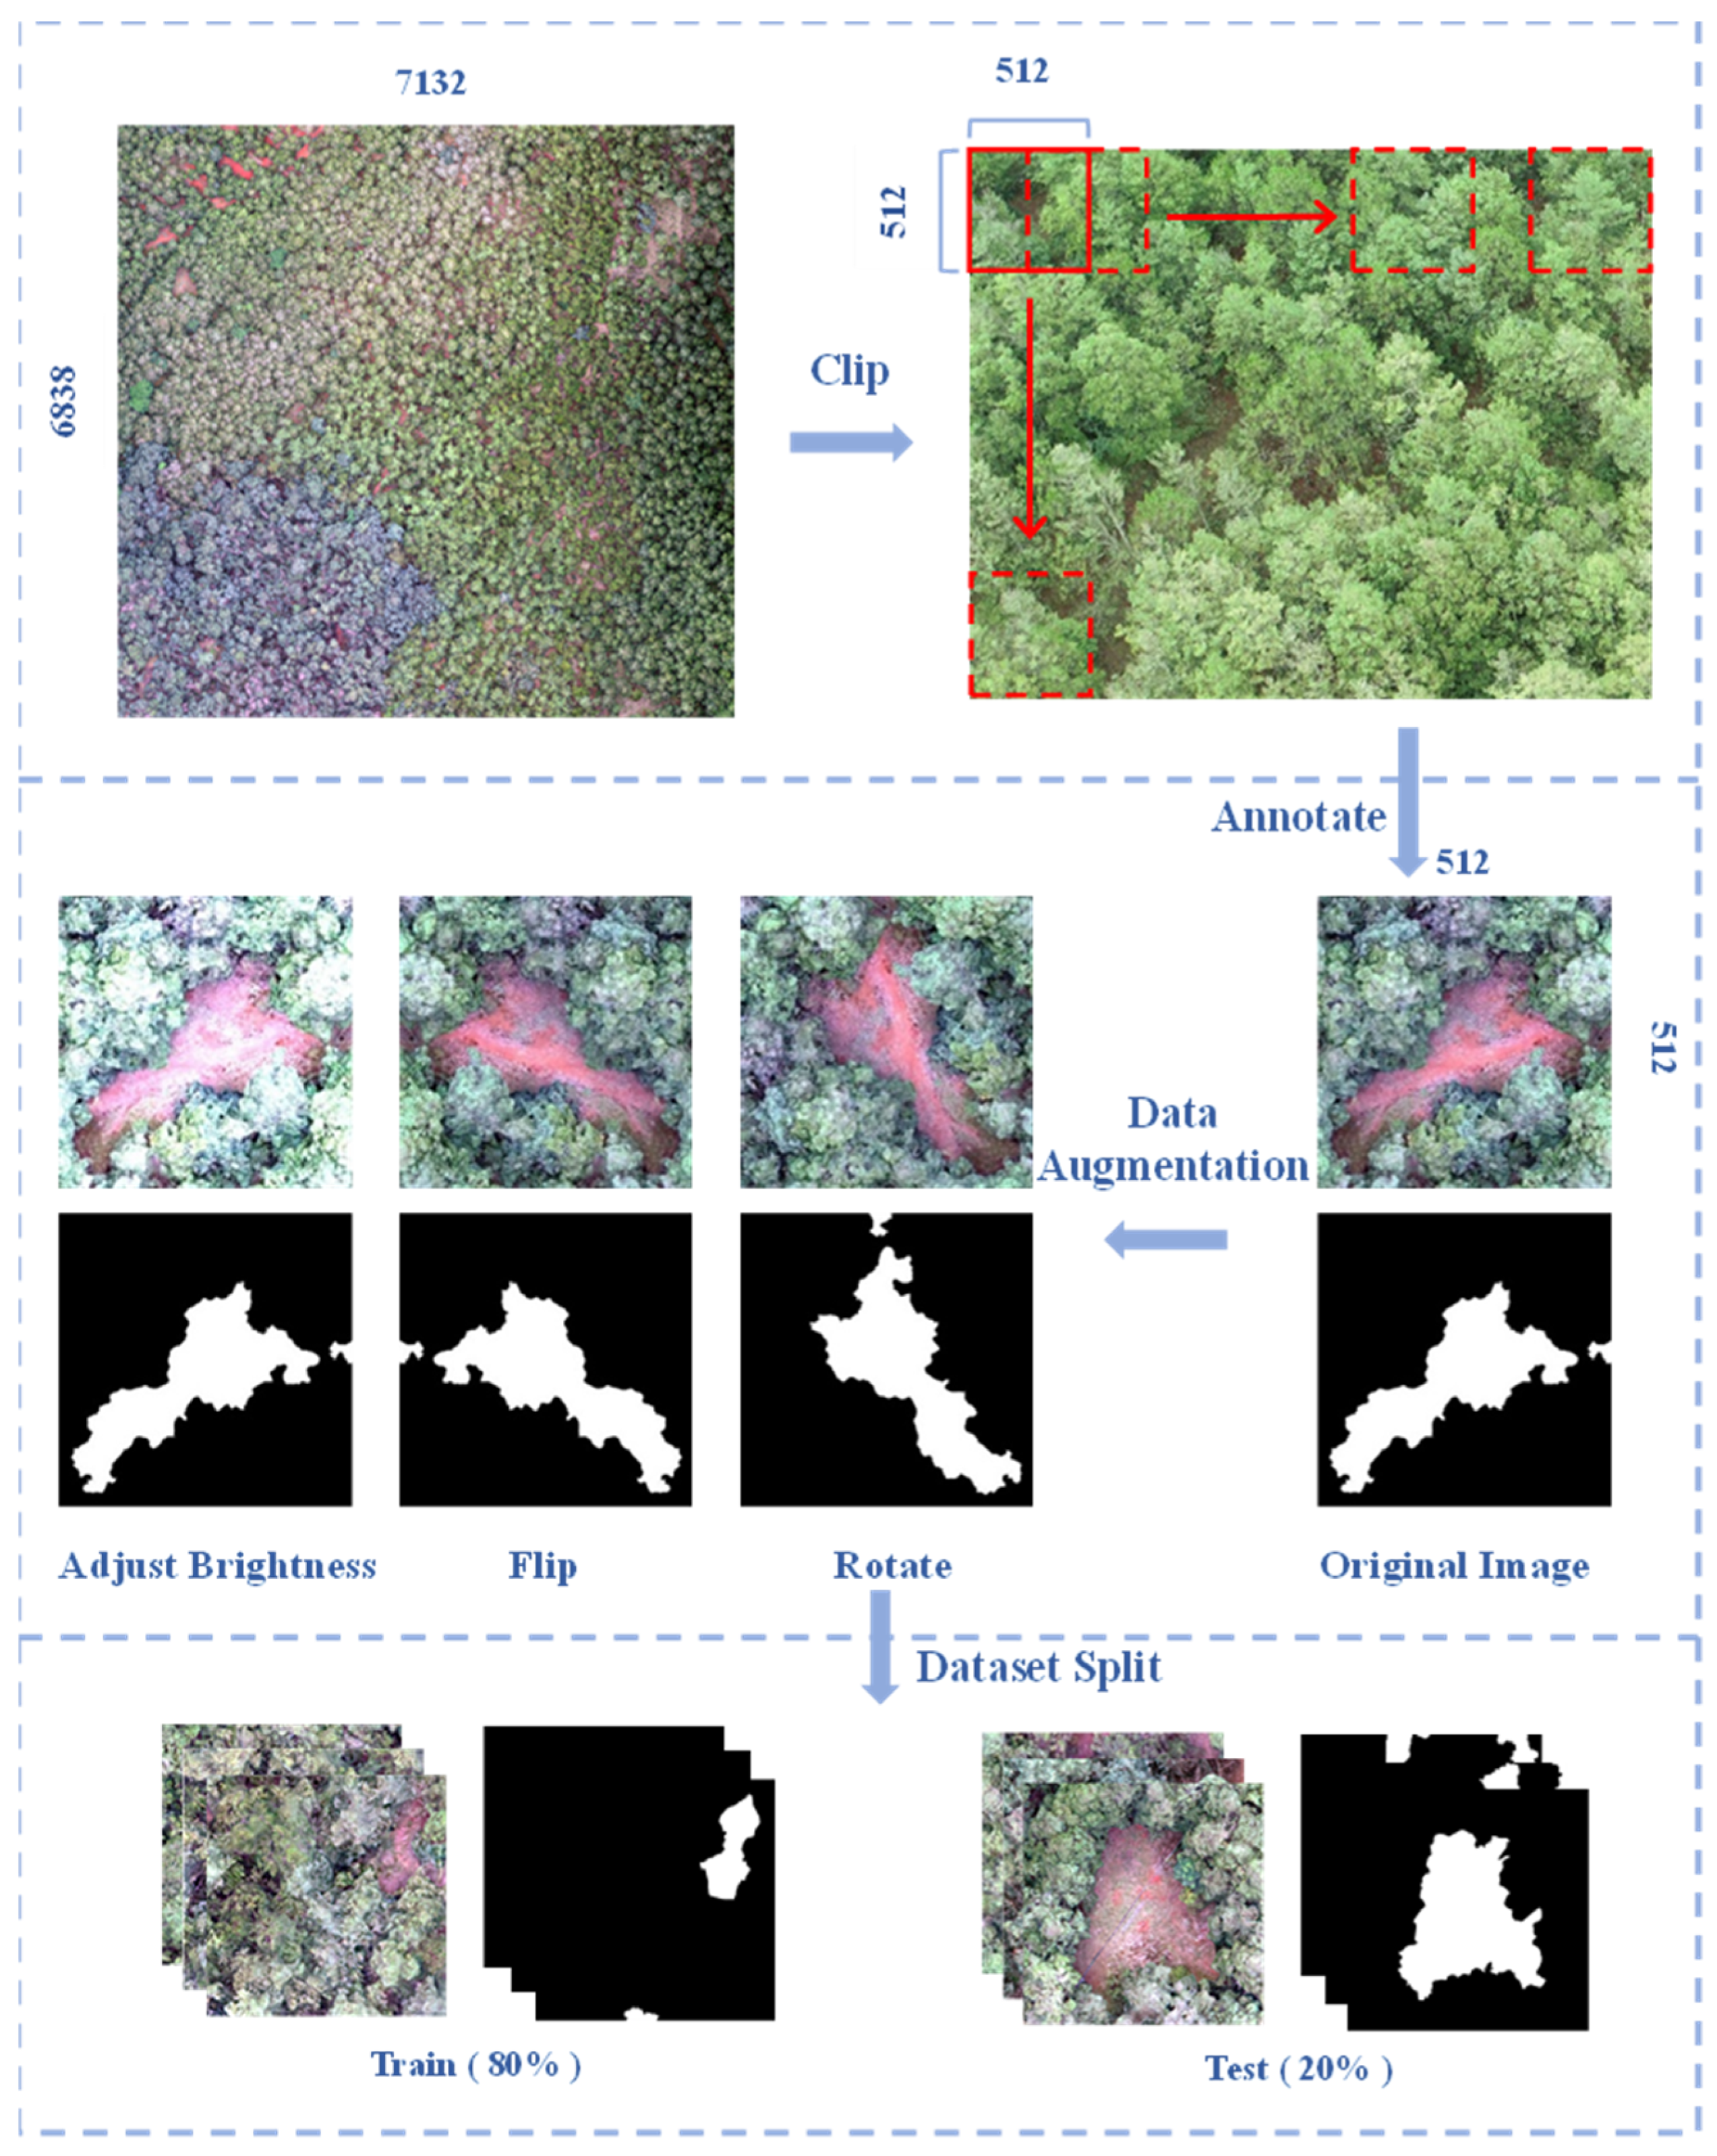
As illustrated in
Figure 2, this study generated a canopy gap dataset for the purpose of training the deep learning network. Firstly, the data were cropped to a size of 512 × 512 pixels by the sliding window method. Then, the canopy gaps were annotated in LabelMe [
33], and the labels were generated in combination with ArcGIS10.4. Subsequently, the data were augmented through horizontal flipping, 90-degree counterclockwise rotation, and a 20% brightness increase. Finally, the dataset was randomly split into a training set and a testing set, where the ratio between them was 8:2.
The following steps were specifically carried out:
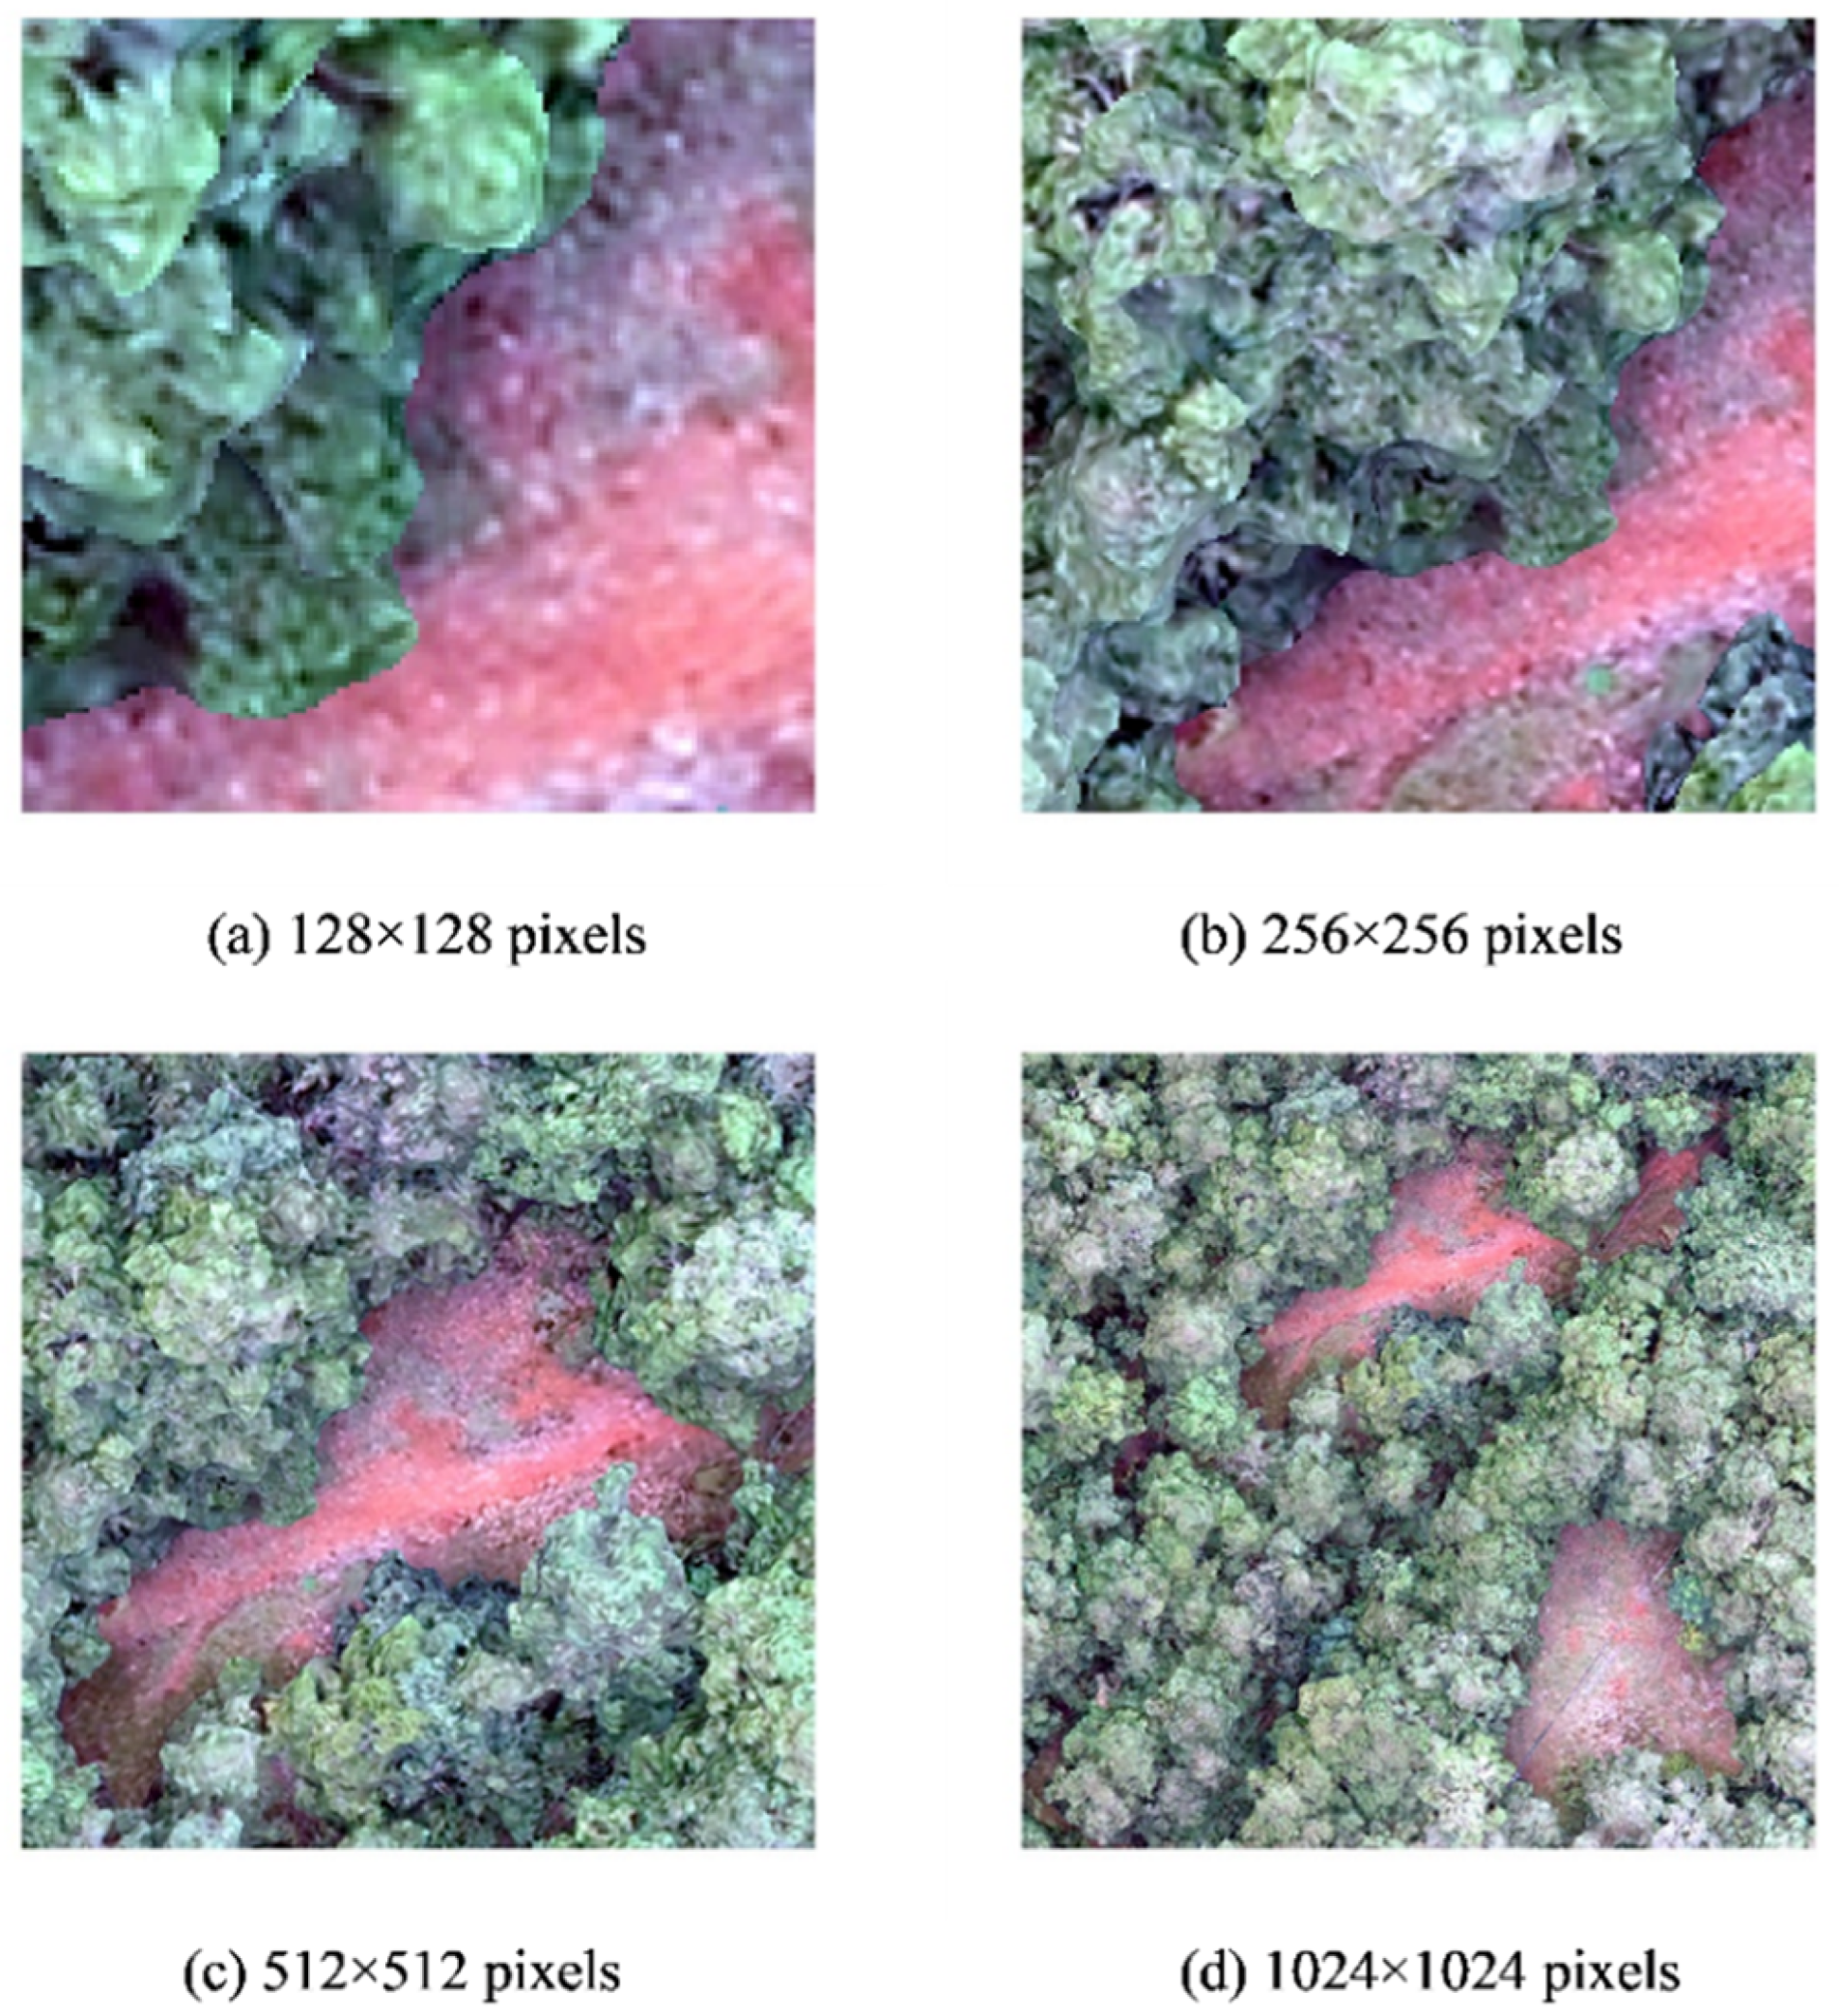
(1) Image segmentation. The large original image may cause long training, poor results, or even memory overflow when directly input into the network model, so pixel-level segmentation is needed. In
Figure 3, the local segmentation results for diverse resolutions are presented. Considering the actual situation, the DOM and labels were cropped in a sequential manner, with a window size of 512 × 512 and a sliding step of 256. After data cleaning, 702 sub-images were obtained.
(2) Canopy gap annotation. Use the online software LabelMe 3.16.2 based on Anaconda to delineate the boundaries of the canopy gaps, thus generating “.json” files with information like the category and coordinate position of labeled objects. Finally, the files were converted into the “.png” format required for the experiment.
(3) Data augmentation and division. Insufficient training samples may render the neural network vulnerable to overfitting. Thus, it is necessary to expand the sample data by increasing the quantity and diversity to enhance the model’s performances and robustness. In this study, a total of 2808 images were eventually generated via techniques including horizontal flipping, 90-degree clockwise rotation, and brightness adjustment. For the purpose of ensuring the trustworthiness of the model, cross-validation was utilized to randomly divide the dataset, and the ratio between the training set and the test set was 8:2.
2.4. ES-Net Model
Canopy gaps exhibit significant heterogeneous characteristics in remote-sensing images, specifically manifested as follows: (1) Spectral heterogeneity: Different land covers (e.g., bare soil or grassland) show reflectance differences across multispectral bands; (2) Geometric heterogeneity: Irregular morphologies with varying sizes and shapes. The dual heterogeneity leads to challenges in traditional methods for addressing “same-object, different-spectrum” and “different-object, same-spectrum” phenomena. In view of this, the study proposes an improved U-Net [
34] architecture that retains the symmetric structure and skip-connection mechanism while systematically enhancing feature representation capabilities through a two-level feature fusion strategy and an attention-guided semantic segmentation module (SSM). Additionally, an edge detection module (EDM) is integrated to reinforce boundary constraints. With this design, the network is capable of capturing the global semantic details and the local edge features of canopy gaps at the same time, significantly improving segmentation robustness in complex scenarios.
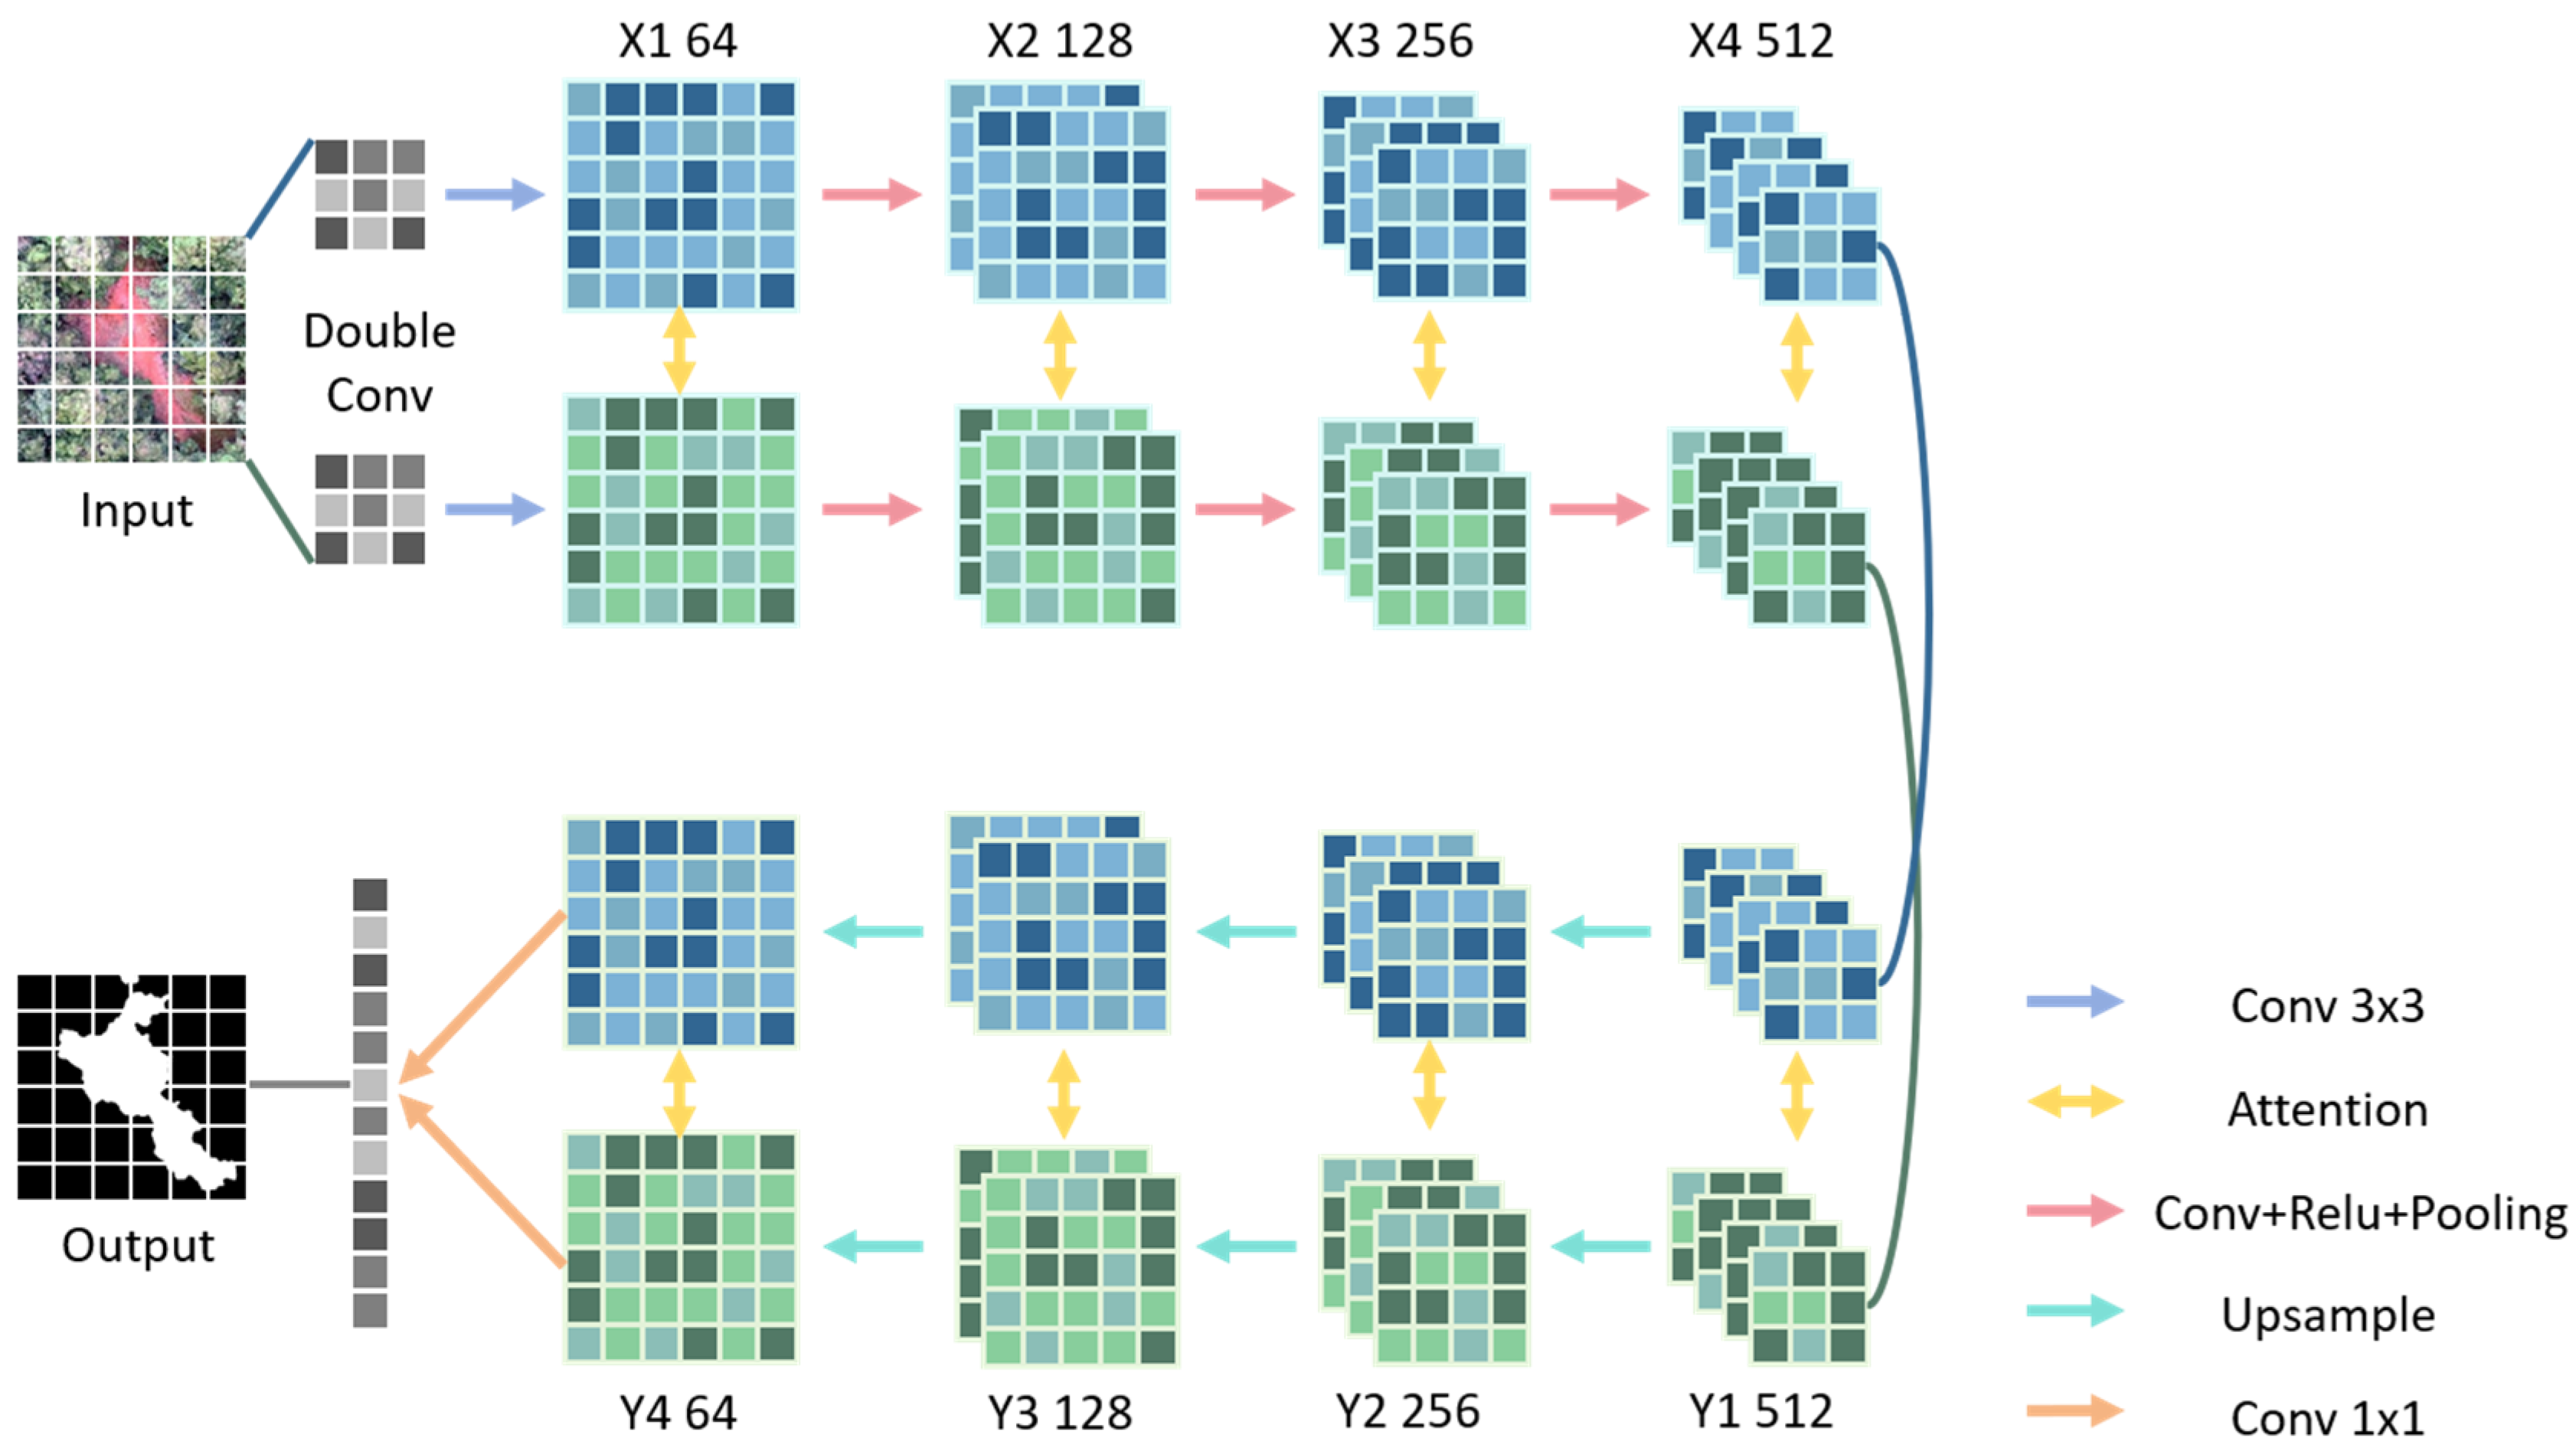
2.4.1. Semantic Segmentation Module (SSM)
The encoder of the SSM (
Figure 4) captures multi-scale contextual information through a hierarchical structure: Each downsampling unit consists of two 3 × 3 convolutional blocks (incorporating batch normalization and ReLU activation) and a max-pooling layer. At each downsampling stage, features outputted by the current layer are combined with the previous layer along the channel dimension, and then a 3 × 3 convolution operation is applied to enable cross-level feature interaction, which effectively mitigates the problem of detailed information attenuation due to the deep network.
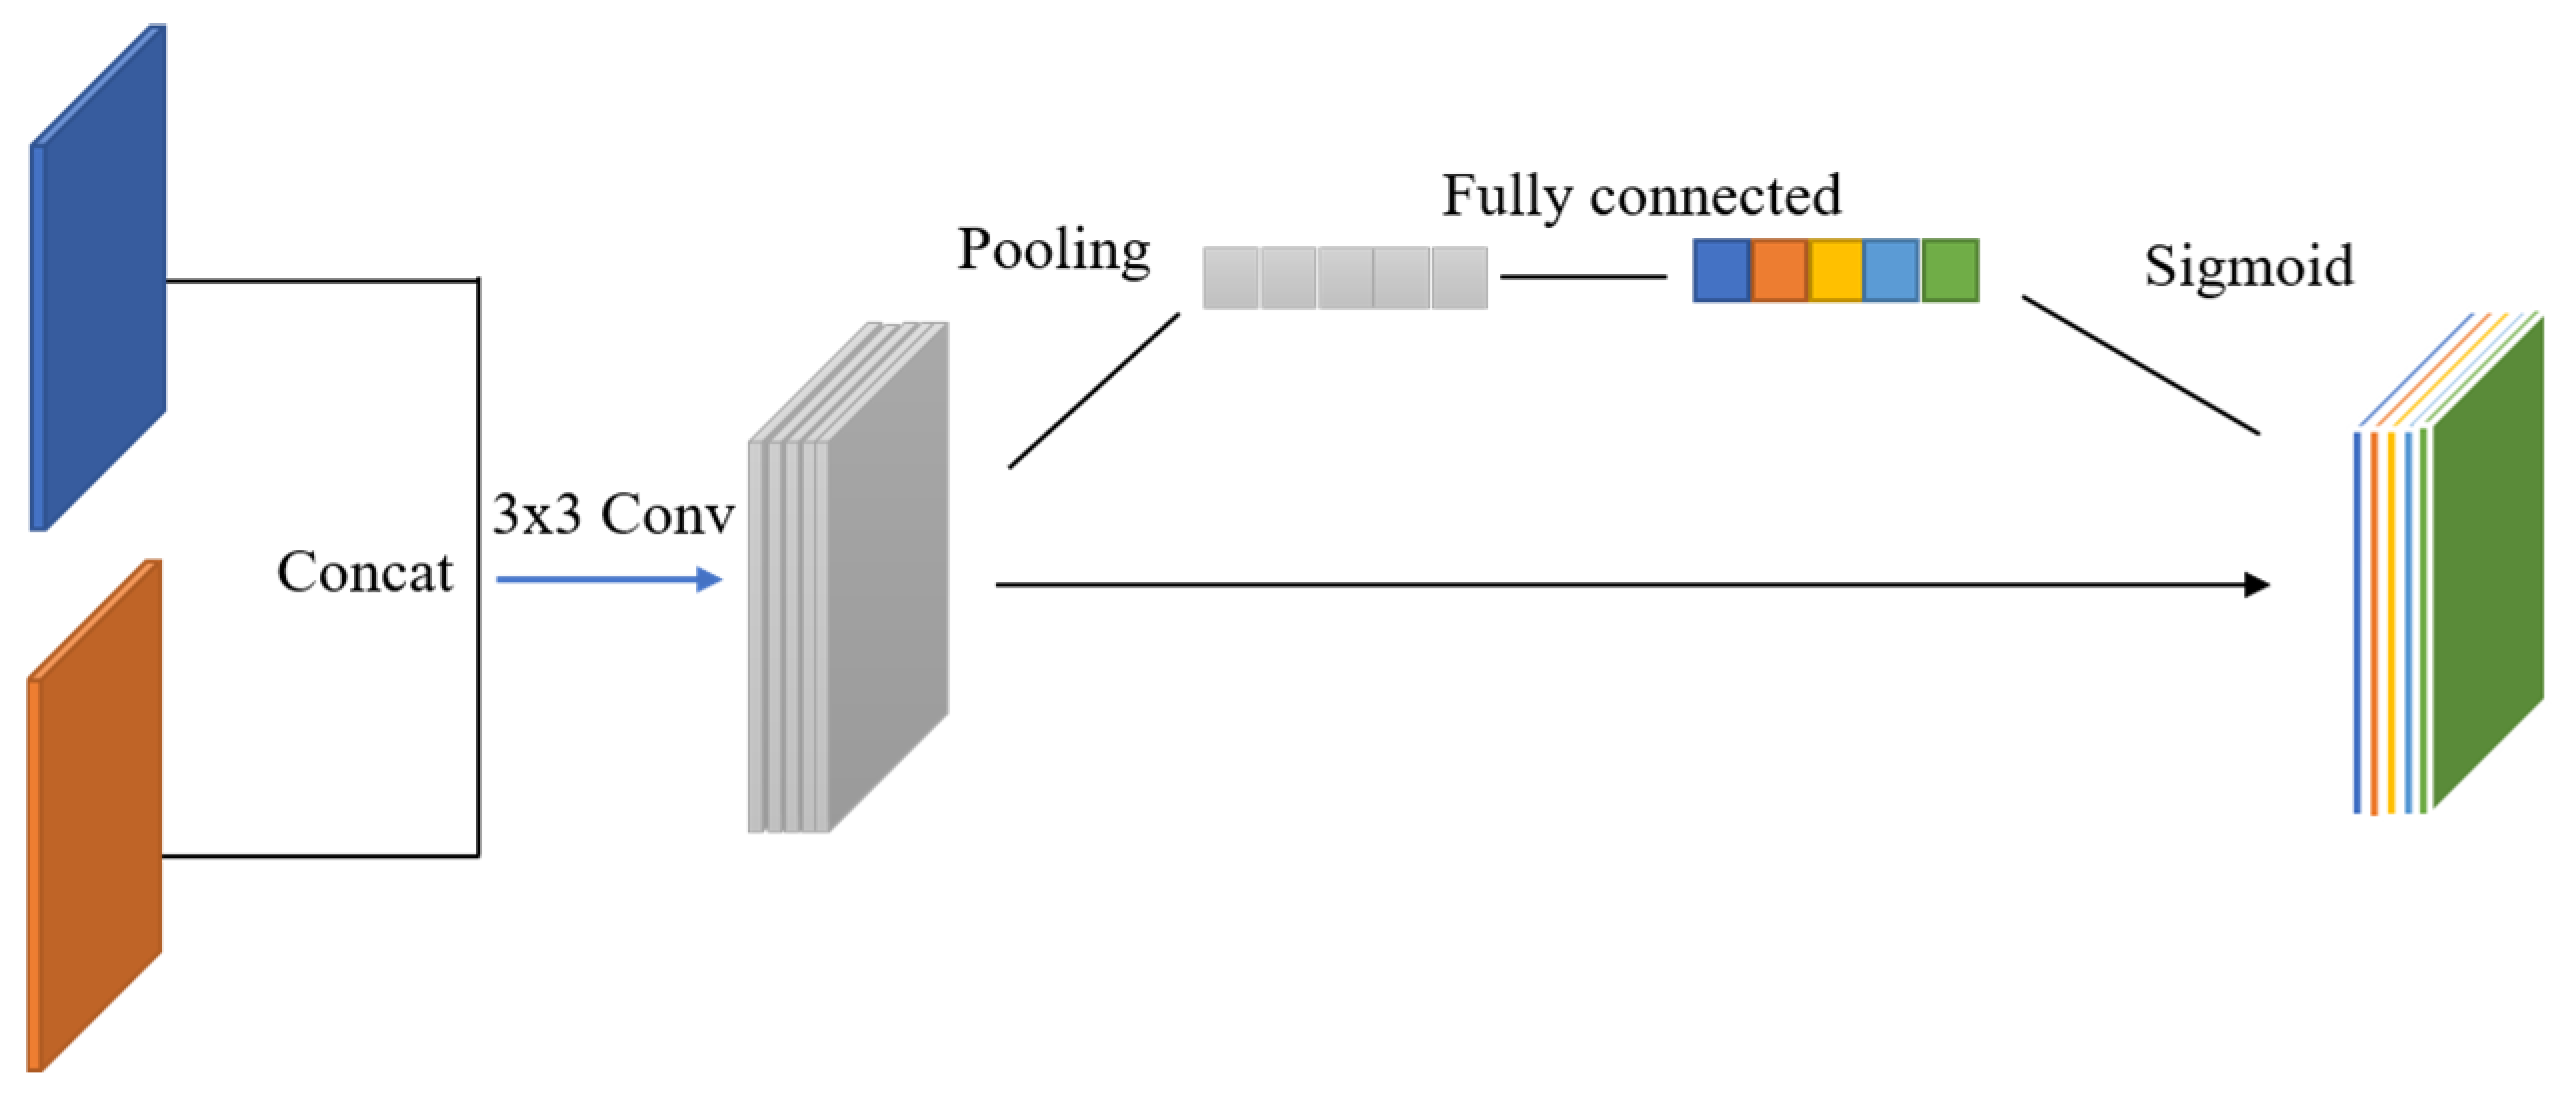
To strengthen the model’s ability in representing key features, a channel attention module (
Figure 5) is embedded before skip connections. This module compresses spatial dimensional information via global average pooling to generate channel-wise statistical descriptors, models non-linear dependencies among channels using two-layer fully connected layers, and finally produces channel weight vectors through the sigmoid function. Mathematically, the channel attention module computes weights
for each feature channel c as
where
is the channel feature,
is global average pooling, and
is a two-layer MLP. This mechanism dynamically amplifies channel responses related to canopy gap-sensitive features while suppressing irrelevant background interference.
The decoder employs a symmetric topological structure with the encoder, which restores spatial resolution via transposed convolutions. At each decoding stage, the upsampled features are concatenated with attention-enhanced features from the corresponding encoder layer along the channel dimension, followed by spatial–semantic refinement through two 3 × 3 convolutional layers.
2.4.2. Edge Detection Module (EDM)
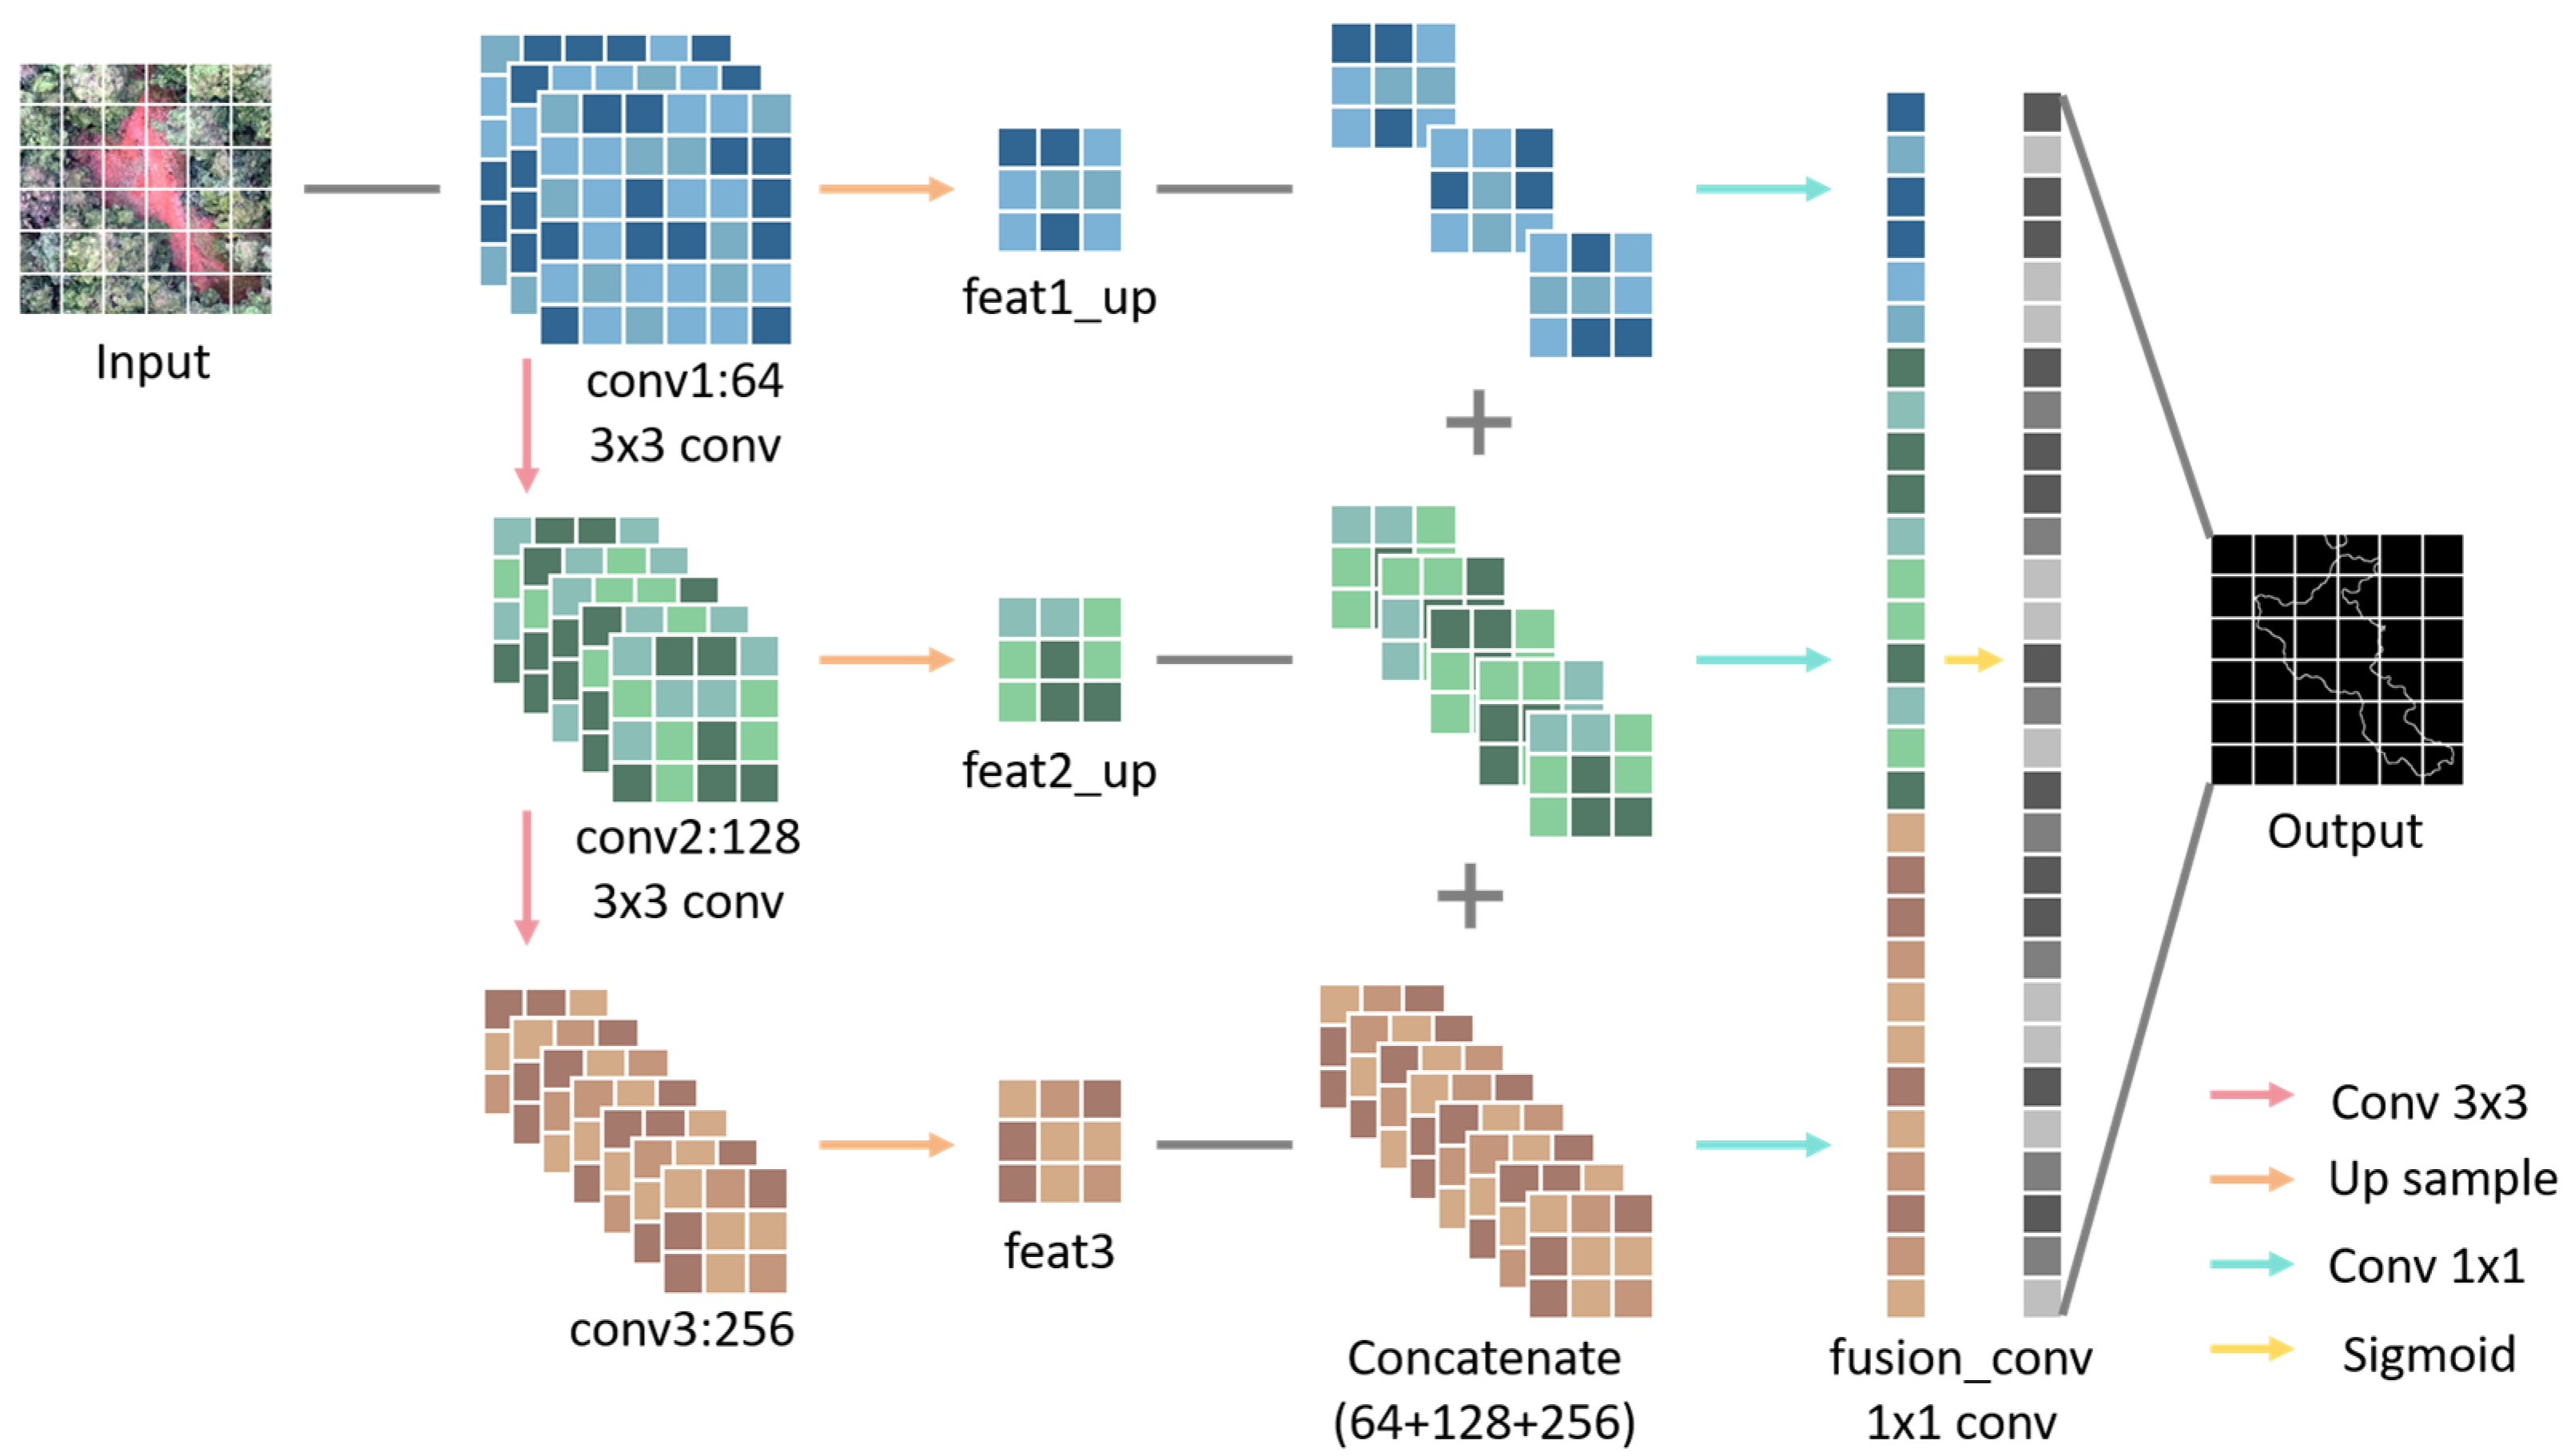
Downsampling in SSM inevitably causes a loss of detail information, thereby reducing the edge extraction accuracy—a phenomenon particularly evident in canopy gap extraction. Thus, an EDM (
Figure 6) is incorporated into the model, which captures abrupt pixel value changes to precisely localize canopy gap boundaries. Inspired by mainstream edge detection frameworks (e.g., RCF, BDCN), this module extracts multi-level edge features through convolutional layers and fuses them across scales. Meanwhile, to enhance computational efficiency and model performance, the EDM shares convolutional layers with the SSM, enabling joint training during the learning process.
The EDM operates through three stages: First, three layers of feature maps are extracted from the semantic segmentation encoder, and edge response features are derived through 3 × 3 convolutional layers with ReLU activation to enhance non-linear representation. Second, the feature maps from the first two convolutional outputs are bilinearly upsampled to maintain spatial consistency with the third layer’s features, followed by channel concatenation for feature fusion. Ultimately, a convolutional layer with a kernel size of 1 × 1 compresses the fused multi-channel feature maps into a single-channel representation, which is converted into an edge probability map (0–1 range) using the sigmoid function to precisely characterize the irregular boundaries of canopy gaps.
2.5. Loss Function
Aiming at addressing the problems of class imbalance and the challenge of semantic–geometry collaboration in canopy gap extraction, this study designed a joint loss function that fuses Focal Loss and Binary Cross-Entropy (BCE), and adopted a fixed weight strategy to balance multi-task optimization. The total loss function is defined as
Among them,
adopted Focal Loss [
35] to address the problem of an imbalanced sample distribution, which is a dynamically scaled version of the standard Cross-Entropy (CE) loss. It is formulated in the following way:
Here, acts as the modulation factor, which is used to reduce the impact that easily classifiable samples have on the loss function, thus increasing the proportion of the loss attributed to difficult-to-classify samples; serves the purpose of regulating the ratio between negative and positive samples in the context of the loss function, and to control the quantitative imbalance; and (ranging from [0, 5]) can change the influence of the modulation factor—when is 0, that is the CE loss function.
For
, Binary Cross-Entropy (BCE) loss was employed to compel the model to learn spectral gradient mutation features, thereby enhancing its ability to depict irregular boundaries.
where
is the ground-truth edge mask and
is the predicted edge probability.
Semantic segmentation and edge detection complement each other in canopy gap extraction: semantic segmentation provides region-level classification, but boundary localization is susceptible to spectral noise interference; and edge detection strengthens geometric constraints, but the lack of semantic information easily generates pseudo-edges. The equal-weight (λ = 1.0) strategy ensures a balanced contribution of the two tasks in gradient updates, promoting collaborative learning of semantic–geometric features.
2.6. Evaluation Index
In this study, seven indicators spanning two categories—semantic segmentation accuracy and edge accuracy—were used to analyze and evaluate how well the canopy gap extraction model performed, as detailed in
Table 1. Specifically, the semantic segmentation accuracy emphasized the model’s capability at identifying canopy gaps and preserving spatial consistency, while edge accuracy quantified the geometric congruence between predicted results and ground-truth edges.
Acc (Equation (5)) reflects how well the model performs in making overall predictions, yet it is prone to overestimation in scenarios where canopy gaps account for a minor class. R (Equation (6)) measures the proficiency of the model in identifying all the actual canopy gaps, while P (Equation (7)) evaluates the accuracy of the prediction outcomes. To address the contradiction between R and P under class imbalance, the F1 score (Equation (8)) provides a harmonized evaluation through their harmonic mean. IoU (Equation (9)) quantifies segmentation accuracy by measuring spatial overlap between predictions and ground truth, with values ranging from 0 to 1, where a higher score indicates a better performance.
In Equation (5), (True Positives) corresponds to correctly identified canopy gap pixels, (False Negatives) represents canopy gap pixels misclassified as background, (False Positives) indicates background pixels erroneously assigned to canopy gaps, and (True Negatives) denotes accurately classified background pixels.
HD (Equation (10)) quantifies the spatial coincidence of canopy gap boundaries by calculating the maximum distance between predicted and ground truth edge point sets. ECR (Equation (11)) evaluates the completeness of edge extraction through the proportion of matched edge pixels.
where
and
are the predicted edge point sets and the true edge point sets, respectively, and
is the Euclidean distance between point
and point
.
Here, PE is the count of predicted edge pixels, and TE represents the count of real edge pixels.
3. Results
3.1. Experimental Environment and Training Parameter Configuration
The ES-Net model was constructed by leveraging the PyTorch 1.13.1 deep-learning framework, and the experiment was executed on a high-performance workstation outfitted with a CPU of the 13th Gen Intel® Core™ i7-13700KF and a GPU of the NVIDIA GeForce RTX 4080. Taking into account the hardware configuration and sample characteristics, the training parameters were configured as described below: an initial learning rate of 0.0001, a total of 50 training epochs, and a batch size of 4, and the Stochastic Gradient Descent (SGD) algorithm was selected as the optimizer to achieve an efficient update of the model parameters.
Taking the test loss as the monitoring index, the training loss curve of ES-Net (
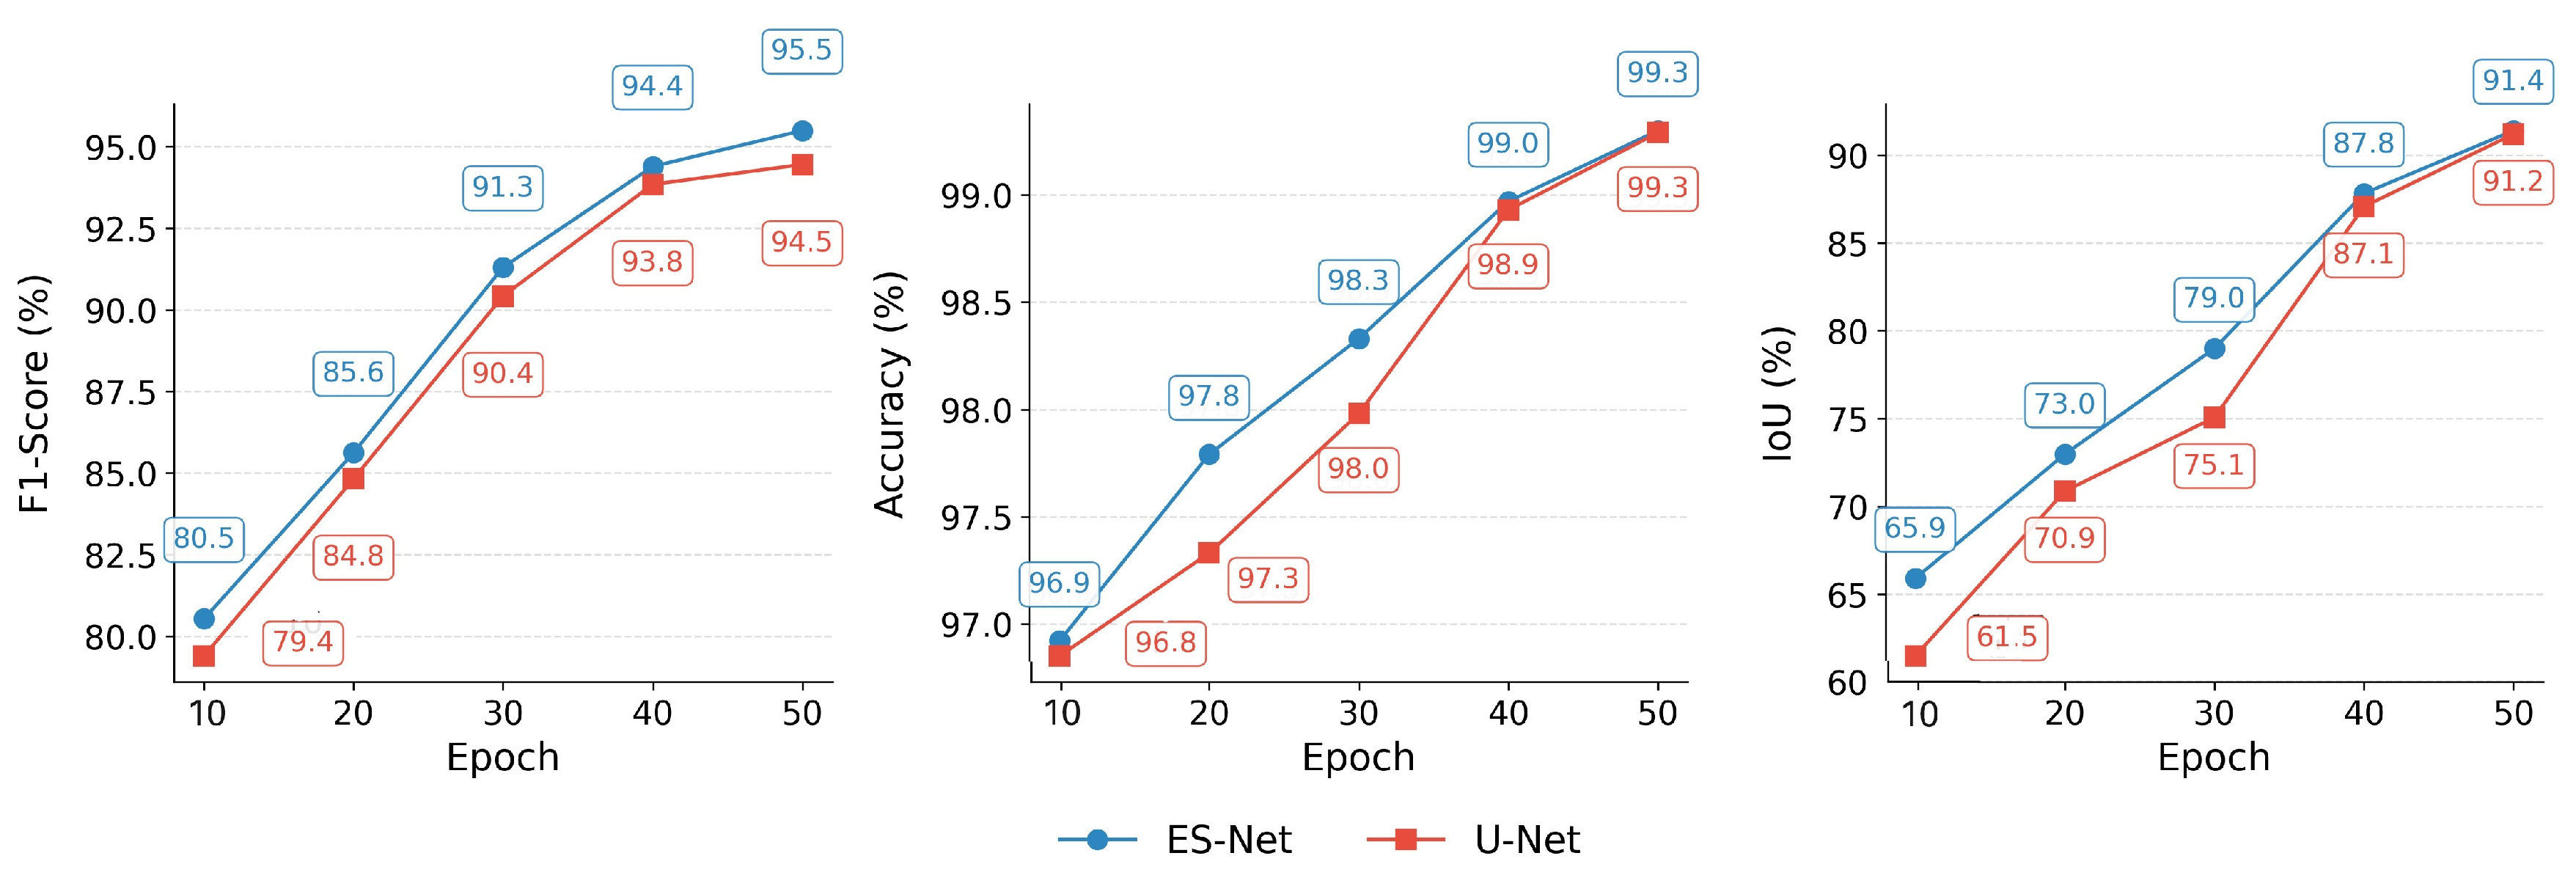
Figure 7) demonstrates a continuous decline in both training loss and validation loss, asymptotically approaching near-zero values. In terms of key performance (
Figure 8), both ES-Net and U-Net exceed 90%, exhibiting good training gains. Notably, ES-Net achieves more efficient feature utilization through the EDM and SSM.
3.2. Extraction Effects and Comprehensive Performance Analysis in Multiple Scenarios
ES-Net and U-Net were deployed across three representative test scenarios, and the robustness of both models was systematically validated through the visualization of edge precision and multi-dimensional metrics.
3.2.1. Comparison of Extraction Effect in Complex Scenarios
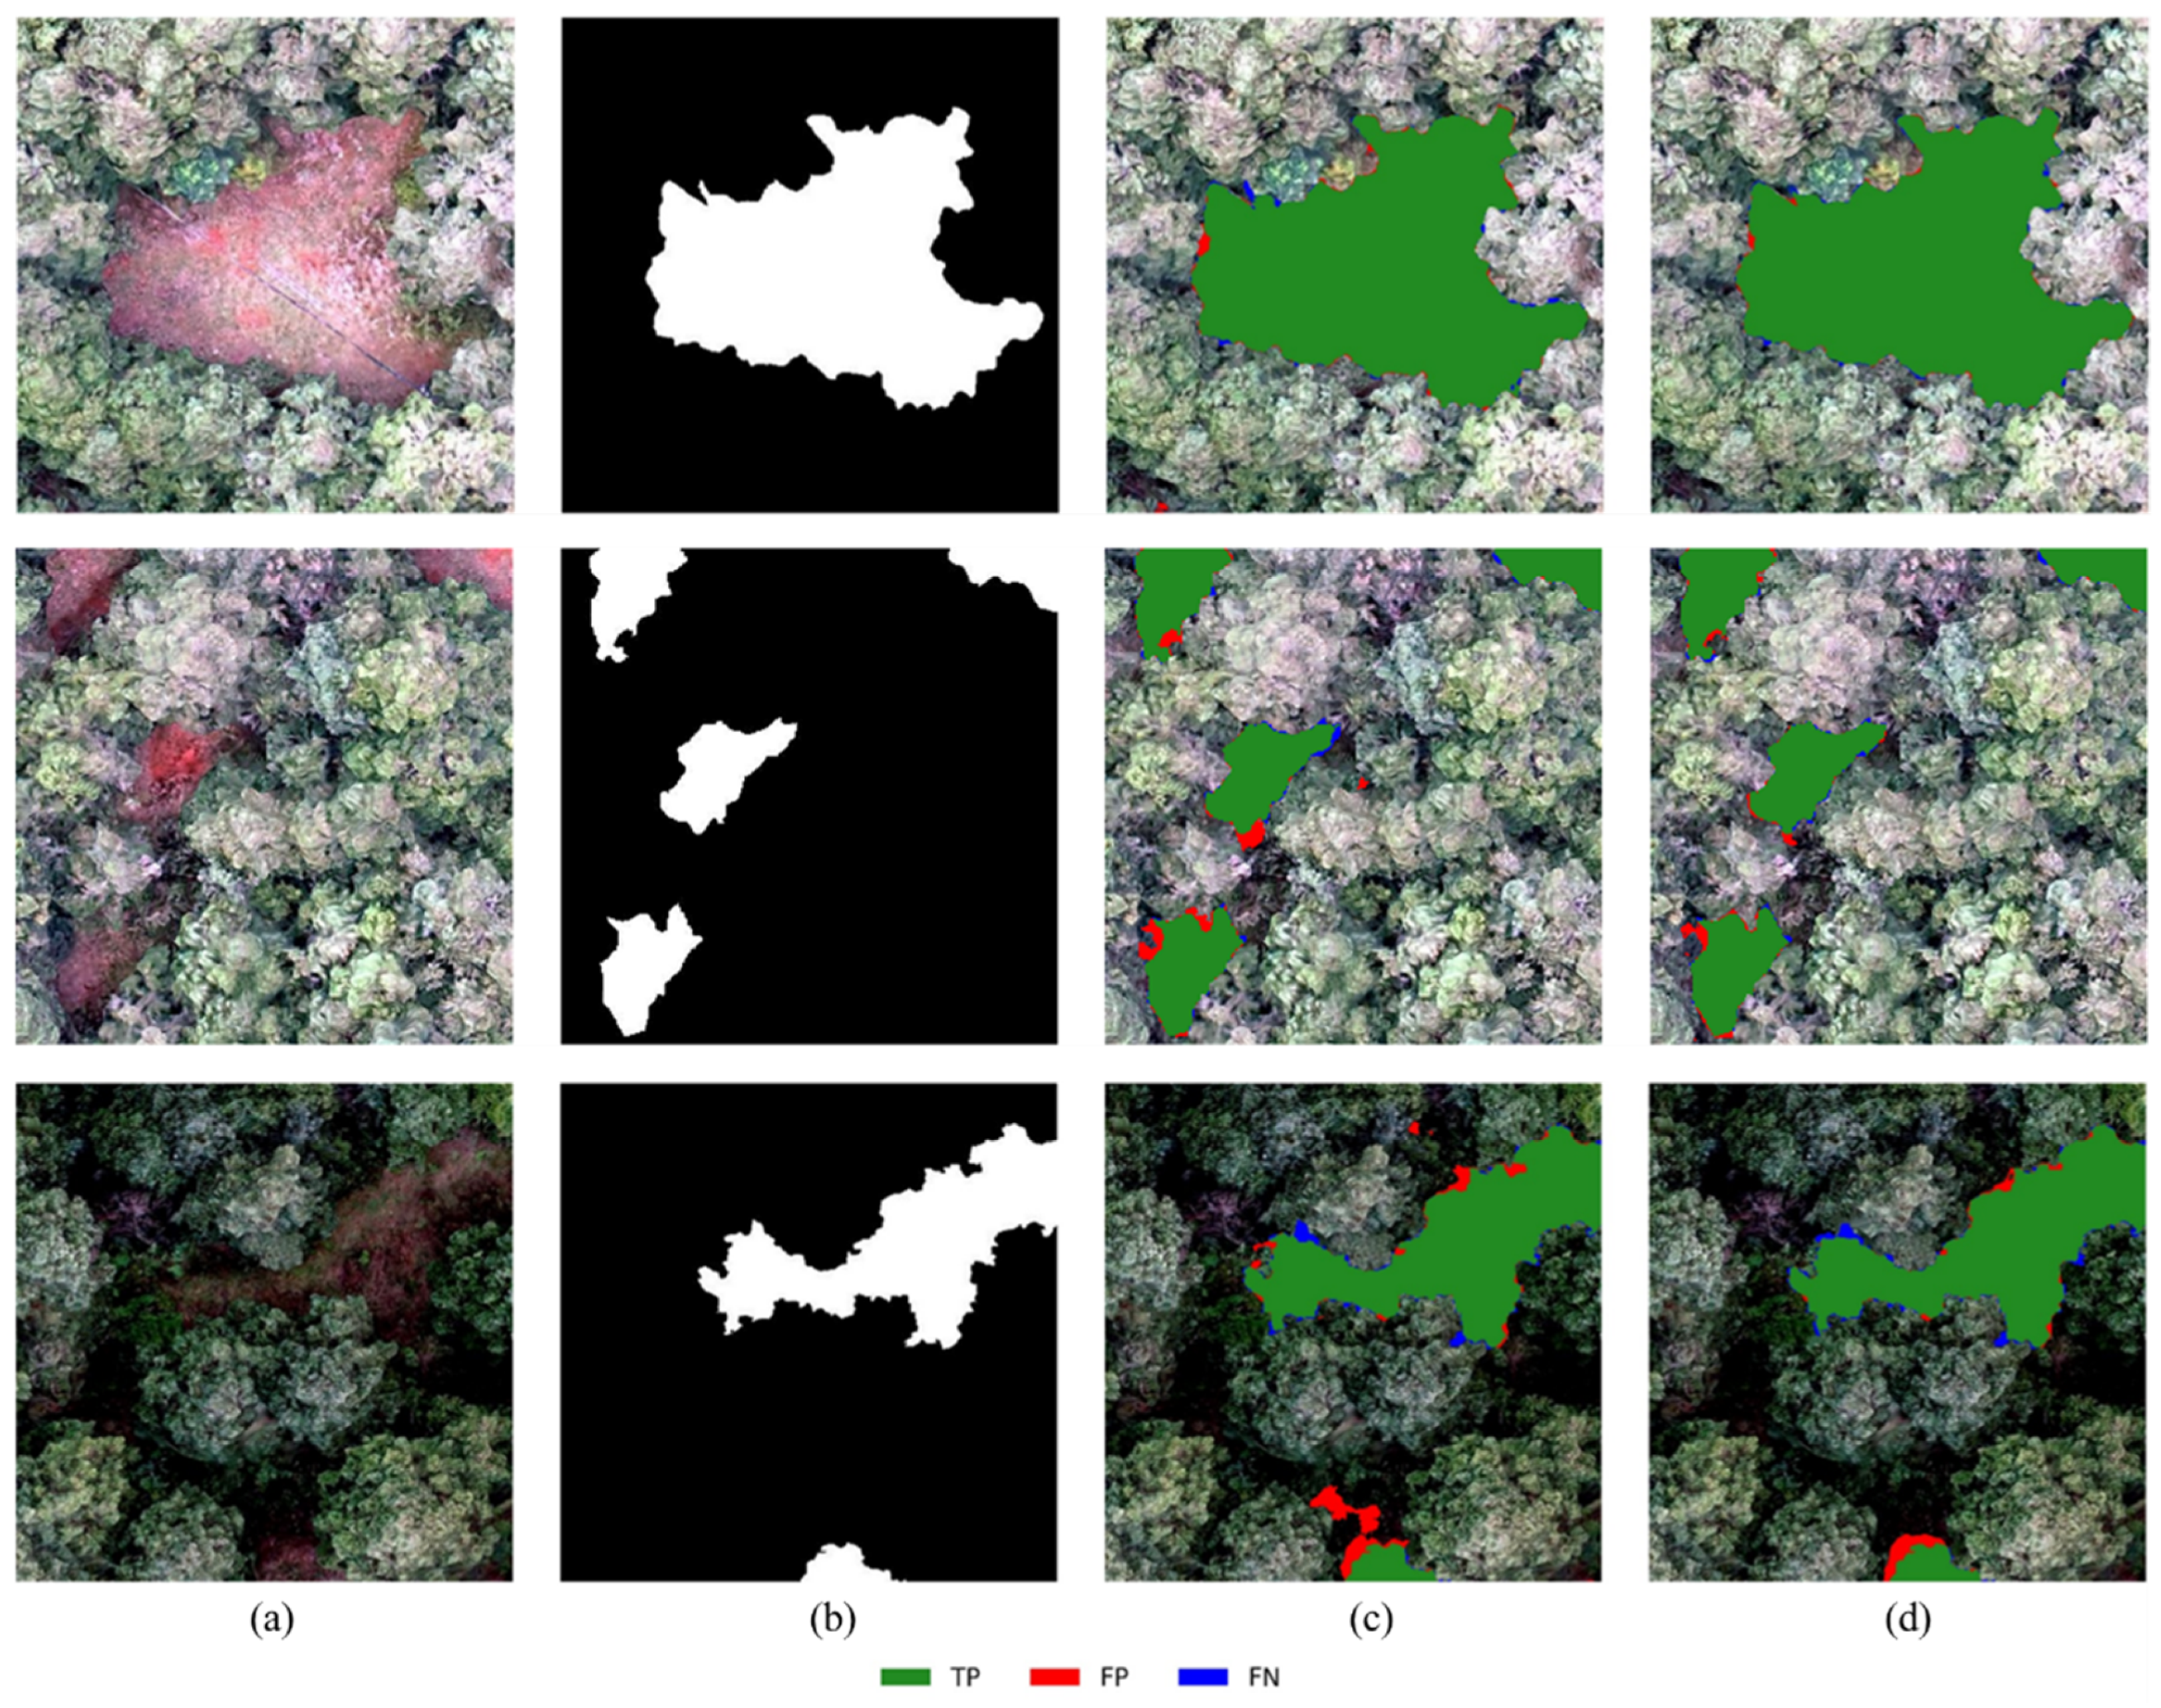
Figure 9 shows the extraction results under three different scenarios:
General Scenario: Both models nearly achieved a complete extraction of canopy gaps. However, ES-Net demonstrated a superior edge processing performance, with an edge integrity closer to the ground-truth label and a better edge localization capability compared to U-Net.
Spectral Confusion Scenario: When faced with similar spectra between understory shrubs and canopy vegetation in the canopy gaps, U-Net exhibited significant omission errors. In contrast, ES-Net enhanced the discriminative sensitivity to textural patterns through its semantic–edge joint constraint mechanism, which substantially mitigated such omissions.
Shadow Interference Scenario: While both architectures exhibited misclassification phenomena, U-Net’s error proved significantly greater. By leveraging EDM to capture the boundary between canopy gaps and shadows, ES-Net significantly improved the edge integrity and showed a superior robustness in the shadow interference environment.
3.2.2. Visual Analysis of Edge Precision
Figure 10 systematically compares the edge detection accuracy of ES-Net and U-Net in canopy gap extraction and reveals the differences in model performance in three parts. Sub-figures (a) and (b), respectively, show the overlay effects of the edges extracted by U-Net (yellow dashed line) and ES-Net (orange dashed line) with the ground-truth edges (blue solid line). The predicted edges of U-Net exhibit significant deviations from the ground-truth edges in complex regions such as acute turns and curved boundaries, reflecting an inadequate fitting capability for irregular boundaries. In contrast, the predicted edges of ES-Net demonstrate greater spatial overlap with ground-truth edges. Even in ambiguous regions where canopy shadows intersect with canopy gaps, ES-Net maintains continuous and relatively precise edge delineation, highlighting its effective capture of multi-scale edge features.
Sub-figure (c) uses a histogram to count the quantity distribution of the predicted edges of ES-Net (orange) and U-Net (yellow) within different pixel distance intervals from the ground-truth edges (0–5 pixels). Quantitative analyses of the error histograms reveal that ES-Net’s edge localization errors are significantly lower than those of U-Net across all scenarios. Specifically, ES-Net exhibits the highest density of edge points at the 0-pixel error bin, with errors concentrated within the 0–1-pixel interval, indicating an overall closer proximity to the ground-truth edge. Statistical results show that the average error distance of ES-Net is 1.8 ± 0.6 pixels (px), which is 75% lower than that of U-Net (7.2 ± 2.3 px). This high-precision edge localization capability is attributed to directional enhancement of gradient information by the EDM, and the global optimization of the contextual structure by the SSM.
3.3. Comparison of Multi-Dimensional Indicators
Table 2 presents a comparison between ES-Net and U-Net on multi-dimensional evaluation indexes, including accuracy and efficiency indexes. According to the statistical results, ES-Net outperforms U-Net in the core metrics. In terms of segmentation accuracy, its F1 score amounts to 97.64%, representing an increase of 0.49% over U-Net (97.15%); and its IoU is 95.41%, which is 0.86% higher than that of U-Net (94.55%), indicating that the model has a better overall segmentation integrity for the canopy gap region. Regarding edge accuracy, the ECR of ES-Net is 85.32%, outperforming U-Net (82.18%) by 3.14%, which reflects its stronger ability in capturing the boundaries of the canopy gaps; the HD is 28.26 px, marking a 38.6% decrease compared to U-Net (46.02 px), which verifies the accurate localization effect of EDM on complex boundaries.
To assess model deployability and application scenarios, the computational complexity and memory efficiency of U-Net and ES-Net were compared. Although ES-Net, due to the integration of the EDM and the channel attention mechanism, has a larger number of parameters (23.99 M) and FLOPs (65.94 g) than U-Net, through the sharing of convolutional layers and lightweight design, it has achieved controllable growth in memory occupation. Moreover, its memory occupation is still significantly lower than that of similar complex models, meeting the real-time processing requirements of the UAV remote sensing platform.
3.4. Ablation Study
To quantify the contributions of the EDM and Semantic Enhancement Component (SEC, cross-layer attention mechanism) to model performance, four ablation studies were designed. The experiments strictly adhered to the single-variable principle, verifying the independent roles and synergistic effects of core components through stepwise introduction under identical training parameters (an initial learning rate of 0.0001, a total of 50 training epochs, a batch size of 4) and the same dataset partitioning strategy. The ablation configurations are as follows:
Baseline: The original U-Net model, containing only the basic encoder–decoder structure and skip connections.
U-Net + SEC: Based on the baseline, a cross-layer attention mechanism (i.e., the channel attention mechanism in the SSM) was embedded to enhance spectral–semantic feature discrimination.
U-Net + EDM: Based on the baseline, an edge detection branch was added to enforce geometric edge constraints.
ES-Net: The full model integrating both SEC and EDM, fusing semantic and edge information synergistically.
The test set loss was used as the monitoring condition, and if there was no reduction in the loss for five successive epochs, it was terminated early to avoid overfitting.
Table 3 presents the core segmentation metrics (IoU) and model complexity (parameter count) under different configurations, with the results indicating the following: (1) Effectiveness of Semantic Enhancement Component: U-Net + SEC achieved an IoU of 84.0% (vs. Baseline’s 78.0%, + 6.0% improvement), demonstrating that the cross-layer attention mechanism mitigated misclassification caused by “same-spectrum heterogeneity” through reinforced feature responses in spectral-sensitive channels. This validates the role of semantic information in improving global segmentation accuracy. (2) Necessity of Edge Detection Module: U-Net + EDM’s IoU (82.0%, + 4.0% over baseline) confirmed that the edge detection branch provided geometric structural constraints for semantic segmentation by capturing pixel gradient mutations, reducing contour blurring and boundary fragmentation. (3) Synergistic Effect Verification: ES-Net’s IoU (91.0%), a striking 13.0% improvement over the baseline and surpassing single-component models, proved that semantic-guided edge feature filtering and edge-constrained semantic segmentation correction acted complementarily. Their joint optimization enhanced feature representation in complex scenarios.
3.5. Cross-Region Validation
To comprehensively validate the practicality of ES-Net, a forest area in Qinglong Town, Anning City, Yunnan Province, which is located outside the original research region, was selected as the cross-regional application test area. The geographical environment and vegetation types of this area are distinct from those of the study area, enabling an effective examination of the model’s adaptability under diverse ecological backgrounds. In
Figure 11, the experimental results demonstrate that the ES-Net can not only accurately extract the fine boundaries of typical canopy gaps and non-canopy gap regions (as shown in area a of
Figure 11) but also exhibit excellent noise suppression capabilities under complex lighting conditions. It effectively filters out interference factors such as crown shadows (as shown in area b of
Figure 11), ensuring the accuracy of canopy gap information extraction.
The ES-Net shows a good generalization ability in cross-regional canopy gap extraction tasks. Whether in the typical areas within the study area or in external heterogeneous environments, the model maintains a stable extraction accuracy, verifying its robustness in different geographical settings. It is worth noting that the spectral characteristics, spatial structures, and phenological cycles of ground objects exhibit significant spatial heterogeneity and temporal dynamics. Such differences may potentially affect the model’s performance. Therefore, in practical application scenarios, a strategy of “local samples as the main focus and remote models as auxiliary” is recommended. Specifically, multisource remote-sensing data and in situ observation samples from the target area should be preferentially collected as the primary training data. Meanwhile, pre-trained remote models should be loaded as the basic framework and then optimized through transfer learning with a small number of samples from the target area to maximize the model’s performance. This strategy not only makes full use of the prior knowledge of remote models but also enables rapid adaptation to the unique characteristics of ground objects in the target area, providing a scientific and feasible implementation path for the cross-regional promotion and application of forest gap extraction techniques.
5. Conclusions
This study successfully constructed a multi-task deep learning network (ES-Net) suitable for complex mountainous forest areas in Yunnan Province. Compared with Transformer-based models (e.g., EdgeFormer) and traditional multi-task models (e.g., DeepLabv3+), ES-Net achieves precise boundary mutation localization through the multi-scale gradient fusion of its edge detection module (EDM). Simultaneously, the cross-layer attention mechanism in its semantic segmentation module (SSM) enhances the discrimination of spectral–semantic features. Finally, a joint loss function is employed to collaboratively optimize semantic and geometric features. This design enables ES-Net to efficiently address challenges such as blurred contours, missing details, and discontinuous boundaries during canopy gap extraction while maintaining computational efficiency. Experimental results demonstrate that ES-Net exhibits significant advantages when dealing with spectral confusion and shadow interference scenarios, achieving simultaneous improvements in both canopy gap extraction accuracy and edge localization precision. The research outcomes provide a new and efficient technical approach for the precise extraction of canopy gap information in forest ecosystems. Subsequent studies will focus on multi-modal data fusion, lightweight model improvement, and cross-regional migration capability optimization, aiming to continuously advance the upgrading and refinement of canopy gap extraction technology, thereby better serving forest ecological research and related application requirements.


