1. Introduction
Recently, the rapid advancement of UAV technology has led to the emergence of various new UAVs. In contrast to manned aircraft, UAVs have garnered widespread attention due to their advantages of low cost, enhanced safety, flexibility, and convenience. As a result, they are now widely employed across diverse applications, ranging from agriculture to emergency response, and have become increasingly significant [
1]. With improvements in onboard computing power and lightweight algorithms, various visual algorithms—such as target tracking [
2], target detection [
3], and Simultaneous Localization and Mapping (SLAM) [
4]—have been extensively used in UAVs. A critical factor in achieving the multifunctionality of UAVs is precise positioning, typically provided by Global Navigation Satellite Systems (GNSS). However, GNSS signals are vulnerable to interference from environmental factors. Therefore, research into autonomous navigation and positioning technologies for UAVs holds considerable practical significance [
5]. Navigation and localization are inherently connected tasks, and many navigation systems rely on accurate localization as a foundation. Visual localization, as a passive and self-contained positioning method, is immune to electromagnetic interference and serves as a key alternative or complement to GNSS, especially in challenging scenarios [
6].
In the domain of autonomous navigation and localization, the use of visual information has emerged as a critical area of research. Visual localization systems can be broadly categorized into two types based on different prior information: relative visual localization methods and absolute visual localization methods. Common relative visual localization techniques include Visual Odometry (VO) [
7], Visual-Inertial Odometry (VIO) [
8,
9], and Simultaneous Localization and Mapping (SLAM) [
10]. VO estimates relative motion by analyzing the variation of image features between adjacent frames, while VIO [
11] further improves upon this by combining data from visual sensors and an Inertial Measurement Unit (IMU) to estimate device orientation and trajectory. These methods extract significant features solely from the observed visual images, without the need to generate geographic reference maps for simultaneous localization and mapping (SLAM), which has been widely adopted in the field of autonomous control. SLAM enables the generation of three-dimensional maps during operation to facilitate positioning [
12]. These relative localization techniques are also fundamental to many vision-based navigation systems, which use visual information to support autonomous path following, obstacle avoidance, and control in GPS-denied environments [
13]. Vision-based navigation typically integrates modules for localization, mapping, and planning to achieve real-time closed-loop control.
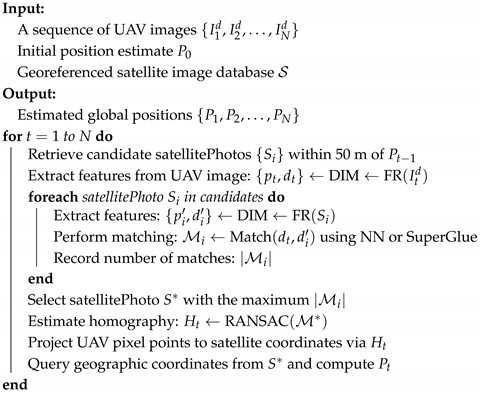
As shown in
Figure 1, scene matching visual localization is a system that maps UAV images onto satellite images to obtain absolute positional information [
14,
15]. Unlike relative visual localization methods, absolute visual positioning technology enables the precise determination of the geographic location of UAVs, thereby eliminating cumulative errors. As a result, absolute visual localization methods present a challenging yet valuable area of research.
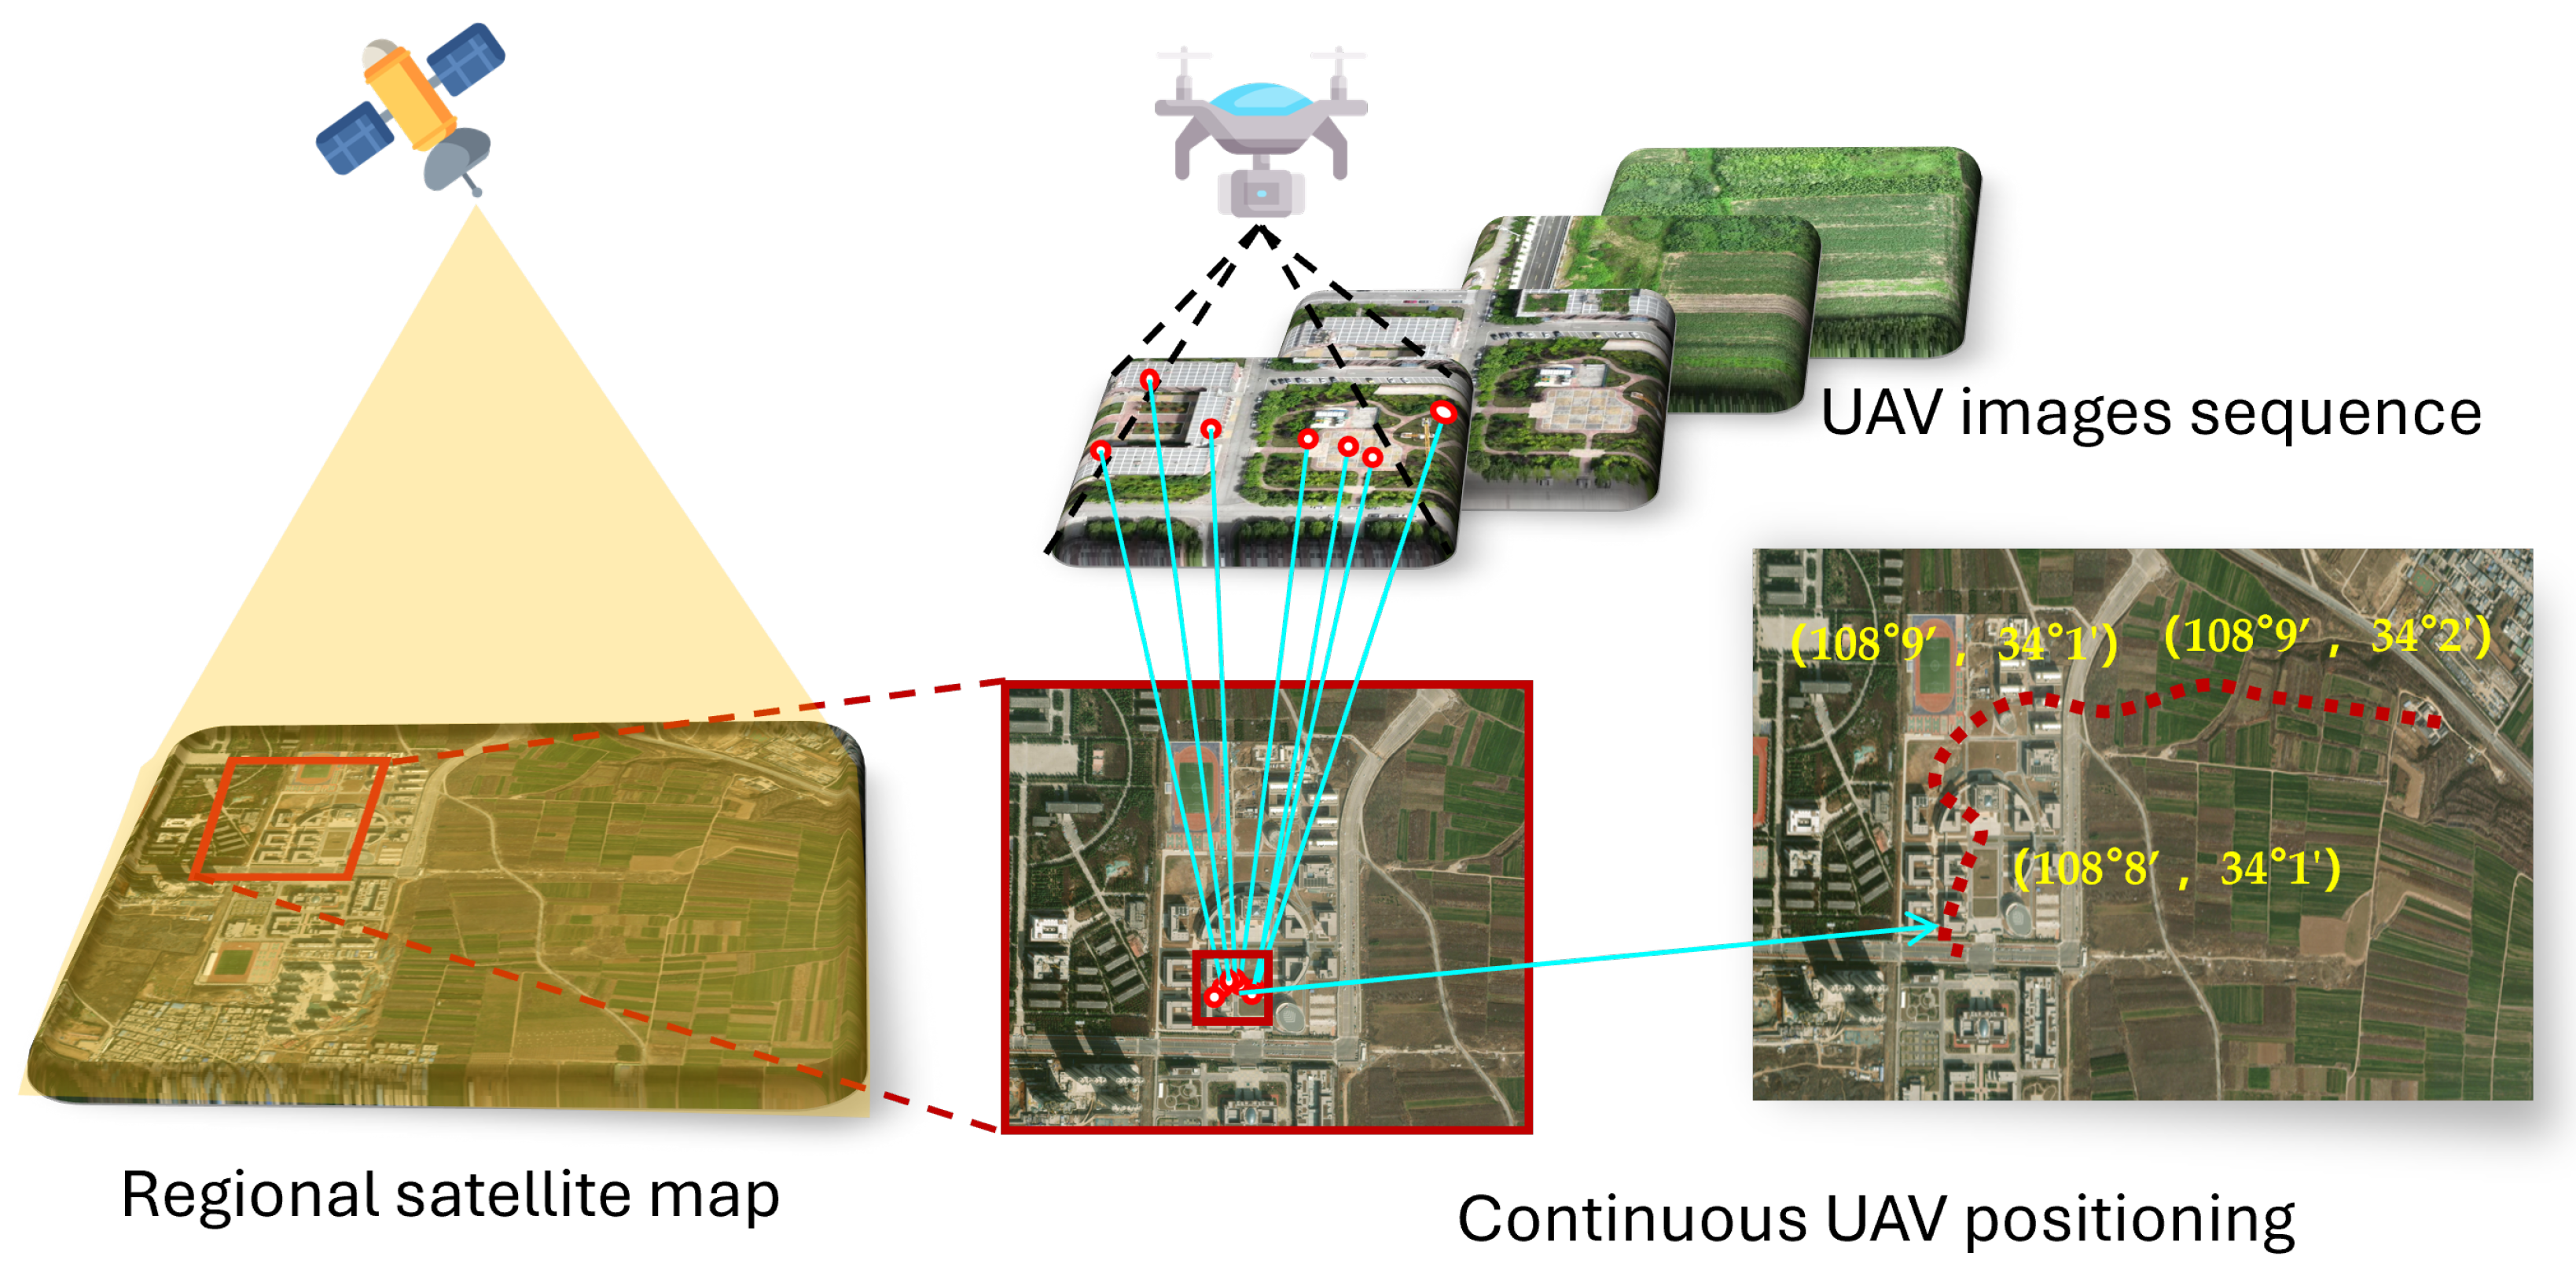
In image-matching-based visual localization systems, the images captured by UAVs and satellites often differ in platform, season, and scene, leading to inconsistencies in style and perspective. Furthermore, some images exhibit sparse textures that are difficult to describe. Examples of this are shown in
Figure 2. The heterogeneity of multi-source images [
16] presents significant challenges in image feature extraction and matching. This results in sparse feature representations and inaccurate scene localization, as well as weak generalization to unknown scenes. Moreover, the lack of labeled real-world scene datasets poses a considerable challenge for algorithm training and evaluation.
To address the above challenges, many researchers have conducted corresponding work. The image matching method based on manual feature descriptors has been applied in this field. Generally speaking, they detect specific keypoints from the image, such as lines/edges [
17] and corners [
18]. Then, patch descriptors are constructed around key points using local information and described in high-dimensional vectors. However, the design of manual descriptors relies on experience and specific application conditions and cannot extract stable matching descriptions in complex dynamic environments.
In recent years, feature extraction and matching methods based on deep learning have been applied in scene classification [
19], cross-modal retrieval [
20,
21,
22,
23], multi-source image matching [
24], and localization [
25,
26]. It has experienced rapid development. Some works attempt to extract global features from the entire image and use image retrieval methods to solve localization problems. In [
27], UAV views were introduced for cross-view geolocation, and tasks such as UAV field of view target localization and UAV navigation were proposed, expanding the application of UAV geolocation. DenseUAV [
28] uses dense sampling to fix the UAV’s perspective as a top–down view, enabling the UAV to obtain more accurate geographic locations. LPN [
29] proposes a square partitioning strategy that extracts useful information from edge and partitioning schemes, significantly improving performance. However, these methods focus on low-altitude multi-view issues and cannot obtain accurate geographic locations. The generalization ability of the scene is weak and cannot meet the working requirements of UAVs in various scenarios.
Unlike methods based on global feature extraction, keypoint matching can obtain pixel-level localization results. LIFT [
30] attempts to achieve keypoint detection, direction estimation, and feature description simultaneously through end-to-end convolutional neural networks. SuperPoint [
31] proposed a self-supervised framework to train interest point detectors and descriptors. Xfeat [
32] reduces the weight of the model by separating the descriptor and feature point encoder parts, greatly improving the running speed without sacrificing accuracy. However, these methods only consider scenes with rich textures and perform poorly in scenes with weaker textures.
This article proposes a multi-scale feature fusion visual localization framework, SAVL, to address the above issues. Firstly, to address the issue of poor performance in weakly textured scenes, SAVL has designed a feature reconstruction module that combines coarse and fine features to effectively capture low-texture features in complex scenes and obtain feature maps with richer semantic information. In addition, given the weak generalization ability of unknown scenes, SAVL designed a descriptor incremental mapping module that reduces multi-source image differences at the semantic level through UAV satellite image descriptor mapping, and constructs a confidence-based incremental strategy to dynamically adapt to the scene. Finally, a scene-rich UAV dataset (RealUAV) was constructed to study UAV visual localization in real-world environments.
In summary, our work makes the following contributions:
This article proposes a UAV adaptive visual localization framework, SAVL. In the proposed SAVL framework, a feature reconstruction module was designed that combines coarse and fine features, effectively capturing low-texture features in complex scenes and obtaining feature maps with richer semantic information.
A descriptor incremental mapping module was established based on incremental learning. This module dynamically focuses on salient features in different scenarios, reduces multi-source image differences at the semantic level, and dynamically adapts to different scenarios based on an incremental strategy of confidence.
Extensive real-world experiments were conducted to demonstrate the effectiveness of the algorithm proposed in this article in real-world scenarios. The dataset used for these experiments has been released and is called RealUAV.
The remainder of this article is structured as follows: relevant prior work is reviewed in
Section 2. The proposed model architecture is described in
Section 3, followed by an introduction to the dataset and the design of a novel evaluation metric in
Section 4. Experimental results and visualization analyses are presented in
Section 5. Finally, conclusions are drawn in
Section 6.
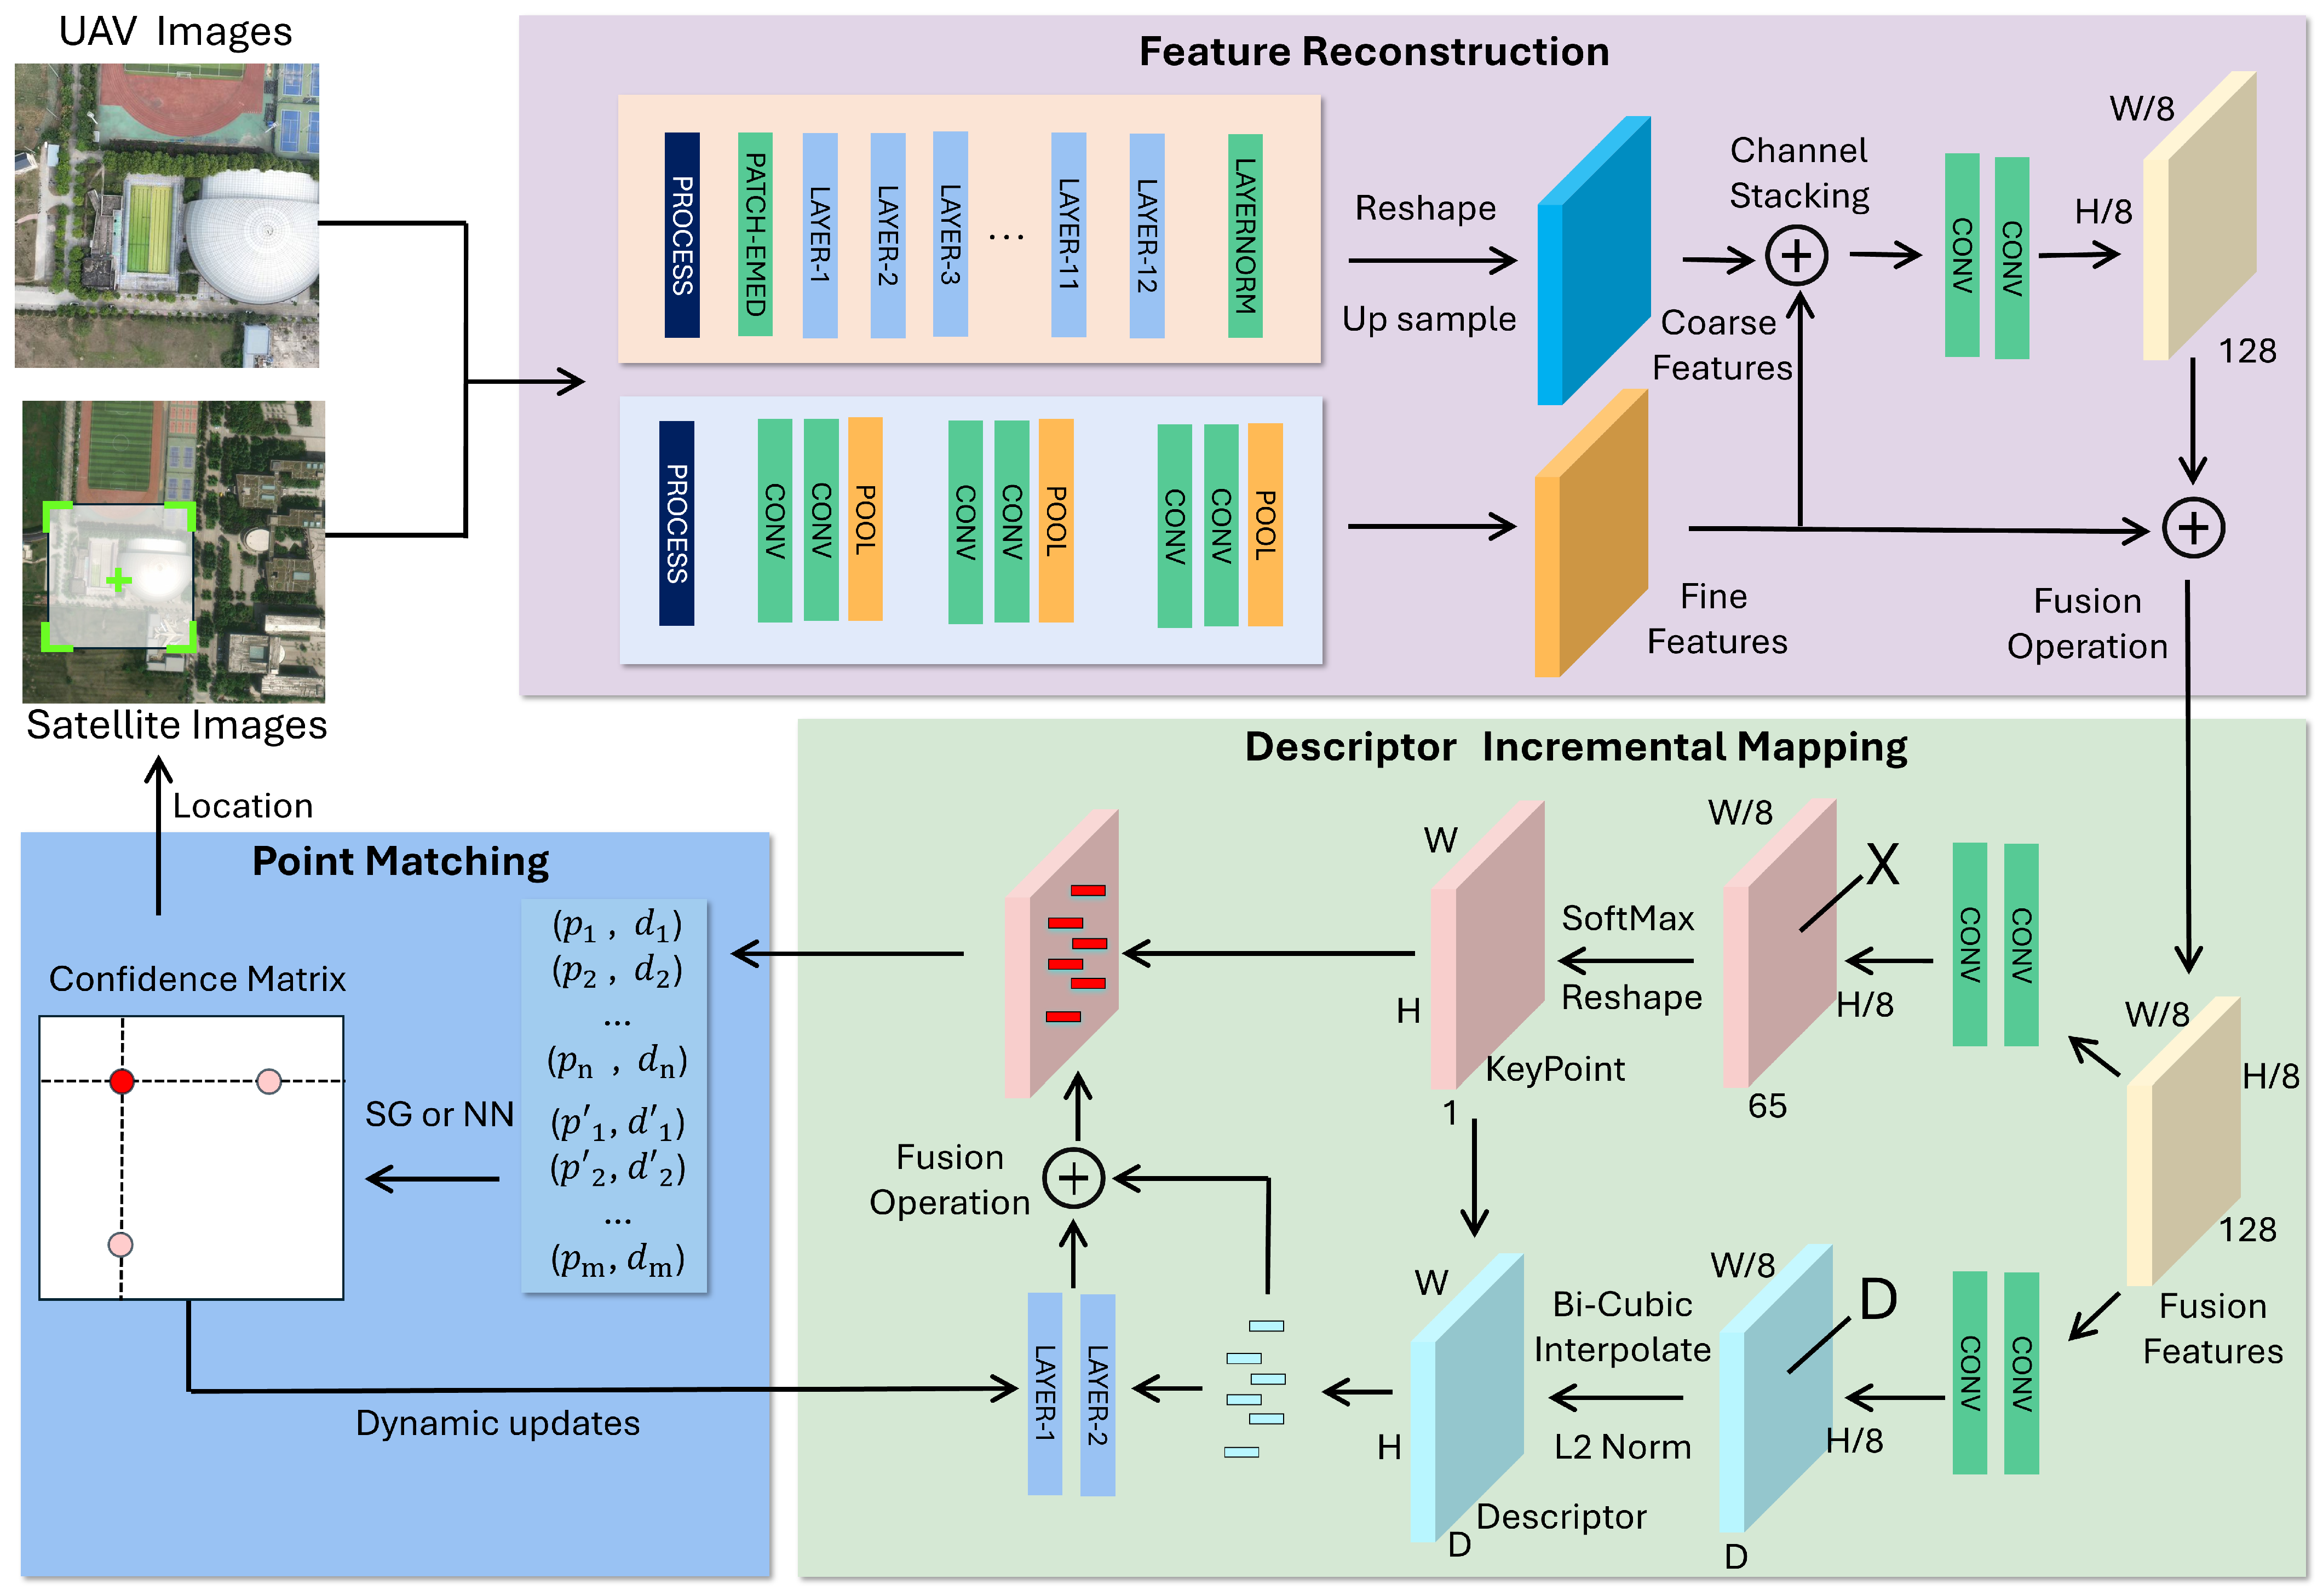
3. Method
In this section, we provide a detailed explanation of the proposed SAVL. The flowchart of the visual positioning framework is shown in
Figure 3. It primarily consists of two parts: multi-source image feature extraction and descriptor incremental mapping. The multi-source image feature extraction is performed using a feature extraction network that simultaneously extracts key points and descriptors from both UAV and satellite images. This process establishes a matching relationship between features from different sources. In descriptor incremental mapping, a confidence evaluation mechanism is employed to assess the reliability of the matching results. Based on the high-confidence matching results, the descriptors are dynamically adjusted to reduce the differences between the multi-source images. Below, this article provides a detailed introduction to the implementation principles and specifics of this method, focusing on three aspects: problem definition, feature reconstruction, descriptor incremental mapping, and localization inference.
3.1. Problem Definition
UAV visual positioning aims to determine the position of a UAV through image matching between satellite and UAV images. Given a set of n consecutive UAV images , the task can be expressed as finding their corresponding positions using a large-scale orthorectified satellite image M, where each pixel is annotated with longitude and latitude coordinates. These n UAV images are typically captured consecutively during the UAV’s flight, and the ground coordinates of each frame are represented as , which denotes the UAV’s current position. The satellite image includes GPS coordinates, LLcoords and URcoords, corresponding to the lower left and upper right corners of the map, respectively. By matching UAV images with satellite images and calculating the homography matrix, the geographic location of the UAV can be obtained.
3.2. Feature Reconstruction
Keypoint extraction is a critical issue, ranging from manually designed SIFT [
46] to current deep learning-based methods such as Xfeat [
32]. These methods perform well in indoor and architectural settings. However, due to limitations in high-quality, large-scale annotated datasets, model parameters, and model architecture, their performance is poor in low-texture scenarios. In addition to establishing additional feature extraction modules at key points, there may be another approach: Can we introduce a self-supervised feature extraction network trained on a large amount of data to solve the problem of sparse feature extraction?
Recently, general visual models such as self-supervised visual backbones [
47] and diffusion models [
48] have demonstrated powerful semantic understanding capabilities. By training on big data, these models demonstrate strong cross-domain generalization ability [
49], which enables them to obtain rough patch-level matching results. However, using the image features extracted by these models for matching has limited performance on regions/keypoints without strong semantic information. So, how to combine the extensive domain knowledge encoded in the model has become the key to the problem. To solve this problem, the FR module proposed in this work incorporates the coarse semantic features from general visual models into the generation of keypoints and descriptors. By fusing coarse (semantic-level) and fine (local texture) features, the FR module enhances the generalization capability of the network across different domains and improves feature extraction performance in low-texture or structurally sparse environments.
The input RGB image is processed by SAVL, which uses a pre-trained ViT/S as a coarse feature encoder to extract coarse patch feature maps with a height and width of 28, and a channel count of 384. This approach is effective because extensive knowledge helps guide the model to capture overall semantic information by identifying domain-specific features that were not seen during training. Next, a fine-grained encoder is employed to extract detailed features, resulting in a more accurate fine-grained feature map with a reduction in both length and width by a factor of 1/8, and a channel count of 128. This module focuses on texture features, such as corners and lines in the image, in order to capture local semantic information. In the feature reconstruction module, the coarse patches are first upsampled using bilinear interpolation. Then, the number of channels is adjusted using a convolution to align the feature maps. After channel concatenation and feature fusion, the fused feature map is obtained by performing weighted fusion with the fine-grained feature maps. This process enhances the robustness and richness of the feature representation.
Feature descriptors and feature points are generated through a dual-branch decoder. In the feature point branch, the network adjusts the number of feature map channels to 65. Here, 65 indicates that each pixel of the feature map represents a local area of in the original image, with an additional “garbage bin” channel for regions where no feature points are detected. Using Softmax and reshaping operations, the final features are restored to the size of the original image. In the feature descriptor generation branch, the dimensionality of the feature map channel is adjusted to M, where M represents the dimensionality of the output features. By employing channel normalization and bilinear interpolation based on feature point positions, feature vectors are generated, and descriptors are obtained.
The loss function comprises two components. The first part corresponds to the loss of the feature point decoder:
let
X be the output of the feature point decoder and
Y be the corresponding keypoint labels. Let
x represent an
pixel cell, and
y denote the entity corresponding to
x in
Y. The cross-entropy loss
for a cell
is defined as follows:
The descriptor loss is defined as follows:
here,
represents the labeled descriptors corresponding to
D.
S is an indicator matrix that specifies whether
d corresponds to
. The hinge loss
used to constrain descriptor consistency expression is defined as follows:
among them
is 250,
is 1,
is 0.2.
This article uses a homography adaptive self-monitoring strategy. This process generates new image pairs with self-labeled keypoints and trains the model using the aforementioned loss function, enabling the network to effectively focus on features in sparse scenes and enhancing the localization capability in low-texture areas.
3.3. Descriptor Increment Mapping
Due to the influence of land cover changes, seasonal variations, and imaging methods, there are differences between UAV images and satellite images, which lead to differences in descriptors. The descriptor increment module proposed in this paper aims to maintain a unified semantic space, capture invariant salient features, and enhance the invariant measurement capability of descriptors.
In UAV and satellite imagery, the update frequency of satellite images for a given area is relatively low. Therefore, this paper proposes a strategy to enhance the descriptors extracted from UAV images. Specifically, the descriptors from UAV images are processed through a multi-layer MLP network for feature mapping. Starting with 256-dimensional descriptors as input, the network first maps them to 512 dimensions, and then maps back to 256 dimensions to learn the residual differences between UAV and satellite image features. These residuals are then merged and added to the input to obtain descriptors in a unified semantic space.
Due to the lack of rich, labeled multi-source image matching data, this paper adopts a self-supervised training method to learn the residuals from the existing matching results. In a matching process, sort all feature point matching pairs based on the confidence score:
Select the top k matching pairs with the highest confidence and consider these feature points to be correctly matched.
Among them,
is the preset projection error threshold,
H is the homography matrix used for this matching calculation, and a loss function is then used to bridge the gaps in the feature space mapping. The loss function is defined as follows:
where
is the descriptor extracted from UAV images, and
is the descriptor extracted from satellite images. Through this loss function, the network learns the mapping relationship and constructs a unified metric space. During inference, high-confidence matching points are used to perform low-rate network updates, allowing dynamic adaptation to changes in scene content, lighting, and other environmental factors. This online adaptation serves as a lightweight form of incremental learning, achieved through a compact two-layer MLP with minimal computational cost. It enhances the network’s feature representation and improves localization accuracy, particularly in dynamic or previously unseen environments.
3.4. Localization Inference
To obtain end-to-end positioning results, this paper utilizes the algorithm flow shown in Algorithm 1, which can output accurate pixel-level geographic locations for the input UAV images. At the start of the mission, a coarse initial position is assumed to be available, providing sufficient prior information to guide the selection of the initial satellite image for localization. To balance real-time performance and localization accuracy, the localization radius is constrained to 50 m, achieving a trade-off between inference latency and positioning precision while ensuring compatibility with typical UAV motion speeds. During subsequent steps, the system continuously updates the satellite search region by selecting images centered on the previously estimated positions.
For a series of UAV images , each image is associated with the corresponding satellite image block . First, feature points and descriptors are extracted separately from the images, followed by the incremental updating of the descriptors of the UAV images, and finally, the images are matched. Feature points with the highest confidence are selected for matching to form a pair , which provides the key-point matching relationship between the UAV images and satellite image patches. The RANSAC algorithm is then used to estimate the homography matrix. After completing this positioning process, the descriptor incremental mapping network is dynamically updated by selecting high-quality descriptors based on matching confidence.
The per-frame computational complexity of the proposed UAV localization pipeline can be expressed as follows: Feature extraction for each image is denoted as
, representing the time to extract keypoints and descriptors. Feature matching using SuperGlue is denoted as
, where
n and
are the numbers of keypoints in the UAV and satellite images, respectively. Homography estimation has complexity
, where
is the number of matches for the selected satellite image. Coordinate transformation and satellite image selection are both constant-time operations:
. Assuming
K candidate satellite tiles per frame, the total time complexity per frame is as follows:
where
is the UAV image and
are the candidate satellite images.
As shown by the homography formula, the homography matrix
H is a
matrix, but it has 8 degrees of freedom, as it is typically normalized with
. Since Equation (
9) applies to all corresponding point sets in the same plane, if there are more than 4 corresponding point sets between the image pairs,
H can be robustly fitted in an optimal way. Given that the UAV image is orthorectified, the center of the image
represents the current UAV position, and the predicted point
in the satellite image can be obtained using the following:
| Algorithm 1: UAV Visual Localization for Image Sequence |
| | ![Remotesensing 17 02408 i001]() |
Subsequently, the coordinates in the satellite image can be calculated based on LLcoords and URcoords, yielding the predicted position , thereby enabling visual localization.
4. The RealUAV Dataset
In this section, this article introduces the key features and collection methods of the proposed RealUAV dataset. Then, the evaluation indicators of the dataset were introduced in detail.
4.1. Dataset Description
The proposed RealUAV dataset is designed to facilitate pixel-level self-localization for UAVs, addressing a gap in UAV visual localization within real-world scenarios, which has not been covered by prior datasets. Detailed information about RealUAV can be found in
Table 1. This includes a thorough analysis of various aspects, such as image sources, application platforms, sampling methods, data sources, and relevant evaluation metrics. The following section highlights some significant features of RealUAV at the data level.
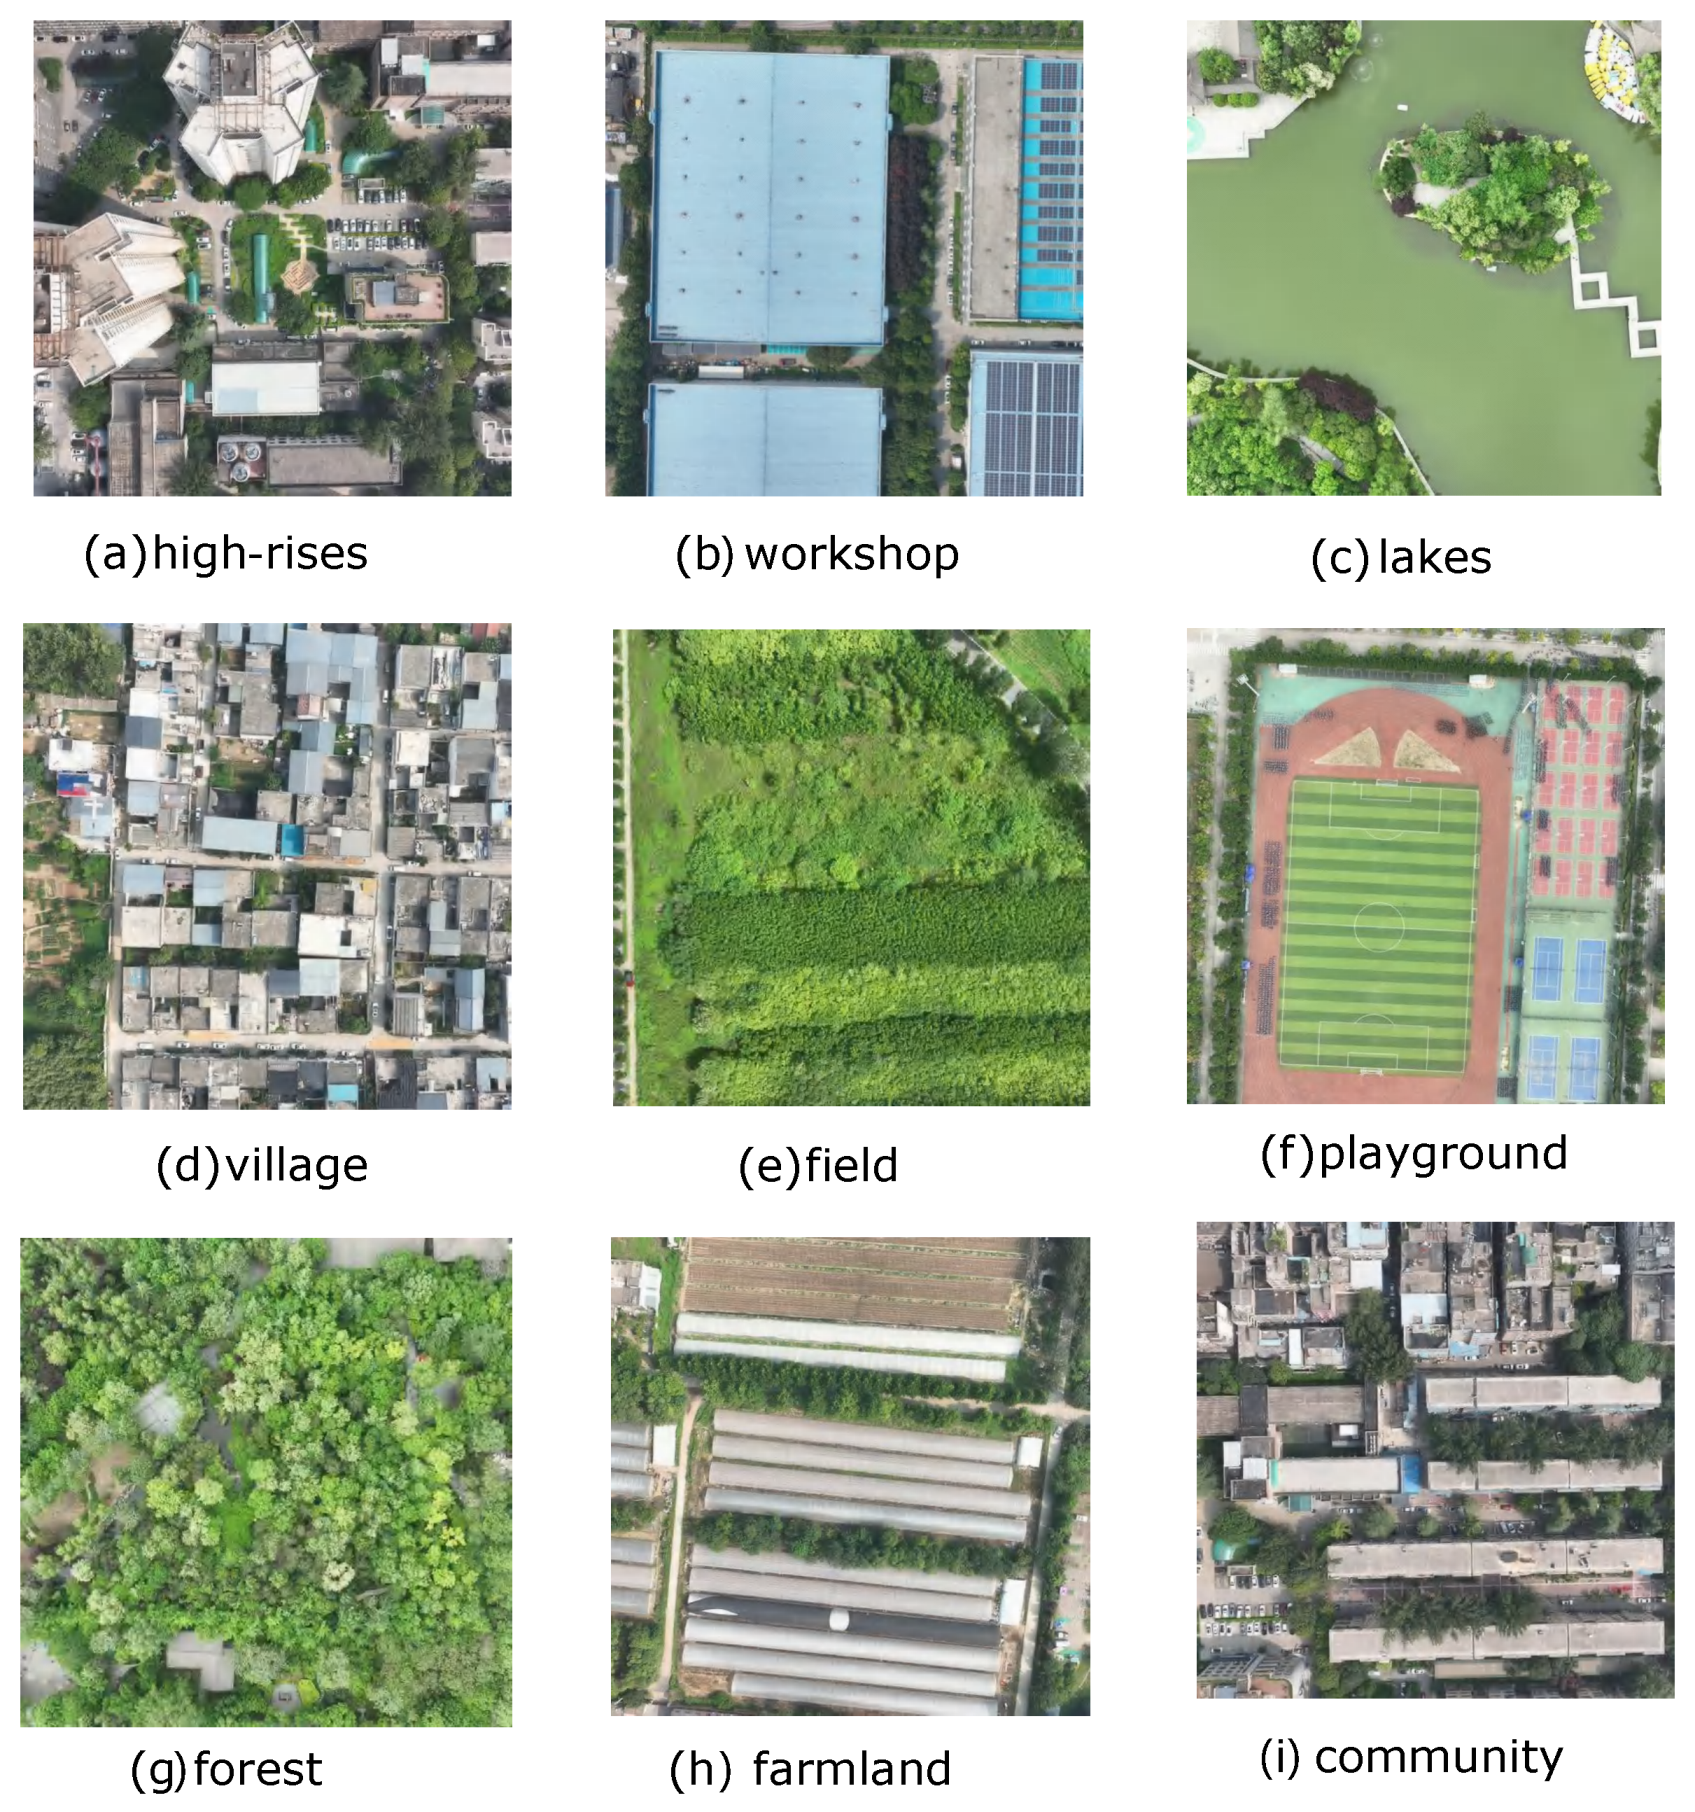
As shown in
Figure 4, RealUAV includes various scene types, including campus buildings, parks, schools, lakes, public buildings, grasslands, forests, etc. Rich scenes are closer to the working state of UAVs in real environments. The dataset is organized sequentially, with details on the number of localization instances and the flight distance for each sequence. Different sequences are tailored to various scenarios, with varying levels of localization difficulty. A total of 15 sequences are provided, covering 6044 localization instances and a total flight distance of 24,063 m.
Flying platform. The dataset was collected using a DJI Mavic 3 Classic UAV equipped with an integrated camera system. The camera is mounted on a three-axis mechanical gimbal, ensuring stable imaging with an angular jitter of ±0.007°. It features a 4/3 CMOS sensor capable of capturing 20-megapixel images. For ground-truth positioning, we use the onboard GNSS module, which integrates signals from GPS, Galileo, and BeiDou constellations. The positioning accuracy is approximately 0.5 m under open-sky conditions.
Dataset Collection. The UAV conducts flights at a constant altitude of 200 m above ground level, with a downward-facing camera (pitch angle −90°) and a fixed heading angle of 0°. It maintains a stable speed of 6 m/s. The onboard camera records video at 60 frames per second with a resolution of pixels. Frames are sampled every 15 frames (i.e., at 4 Hz), and each selected frame is center-cropped to pixels before being downsampled to pixels to reduce computational load.
The corresponding satellite imagery is retrieved from Google Maps with a zoom level of 19, corresponding to a ground sampling distance (GSD) of approximately 0.247 m per pixel. To facilitate matching, each satellite image is divided into overlapping patches of pixels using a sliding window with a stride of 100 pixels. Each UAV image is then paired with a candidate set of satellite patches located within a 50 m radius centered around its GNSS-based ground truth location.
During testing, pixel-level geographic location information is obtained by matching the UAV images with the satellite image blocks. Using a satellite map with real latitude and longitude data, the pixel coordinates are converted into latitude and longitude values, completing the UAV’s visual localization. This process mirrors real-world scenarios.
4.2. Evaluation Protocol
This section introduces a real UAV evaluation system. A new and more robust evaluation metric is proposed, which includes the success rate, position error (PE), and evaluation criteria for acceptable error standards across different systems, namely positioning distance measurement(PDM@K).
In UAV visual positioning, a positioning error greater than 50 m is considered a failure [
50,
51]. The positioning success rate is defined as follows:
here,
N denotes the number of correct matches, and
M the number of incorrect matches. A match is considered incorrect if the homography matrix cannot be computed (i.e., fewer than four matching feature points) or if the error exceeds 50 m, making the match unreliable.
represents the difference between the UAV’s real geographic location and the algorithmic location.
A and
are UAV visual positioning and GPS latitude and longitude. Calculate the actual distance between two points using the Haversine formula:
where
is half the latitude difference in radians, and
is half the longitude difference is calculated in radians, with the radius value set at 6378.137 km. Next, the PDM evaluation criteria are defined as follows:
S is a constant, set to 0.1, and
K is the threshold error. Positioning is considered successful if the error is less than
K. These indicators provide a comprehensive evaluation of the UAV’s positioning capability across multiple dimensions, bridging the gap with its actual operational environment. The new features of the Real-UAV dataset are summarized as follows:
Continuous frames: RealUAV is a continuous UAV visual dataset that closely resembles the real working environment of UAVs.
These indicators comprehensively evaluate the positioning capability of UAVs in various operational scenarios. Covering most scenarios of UAV operation.
Containing sequences of different difficulty levels, it can become a universal evaluation criterion.
5. Experiments
In this section, after introducing the implementation details in A, the superiority and generalization ability of the method on RealUAV are demonstrated in B. The analysis includes matching accuracy, average positioning error, PDM, and single positioning time, with a detailed discussion of the results. In C, ablation experiments are conducted to investigate the impact of the feature reconstruction module (FR) and descriptor incremental mapping module (DIM) on the final outcomes.
5.1. Implement Details
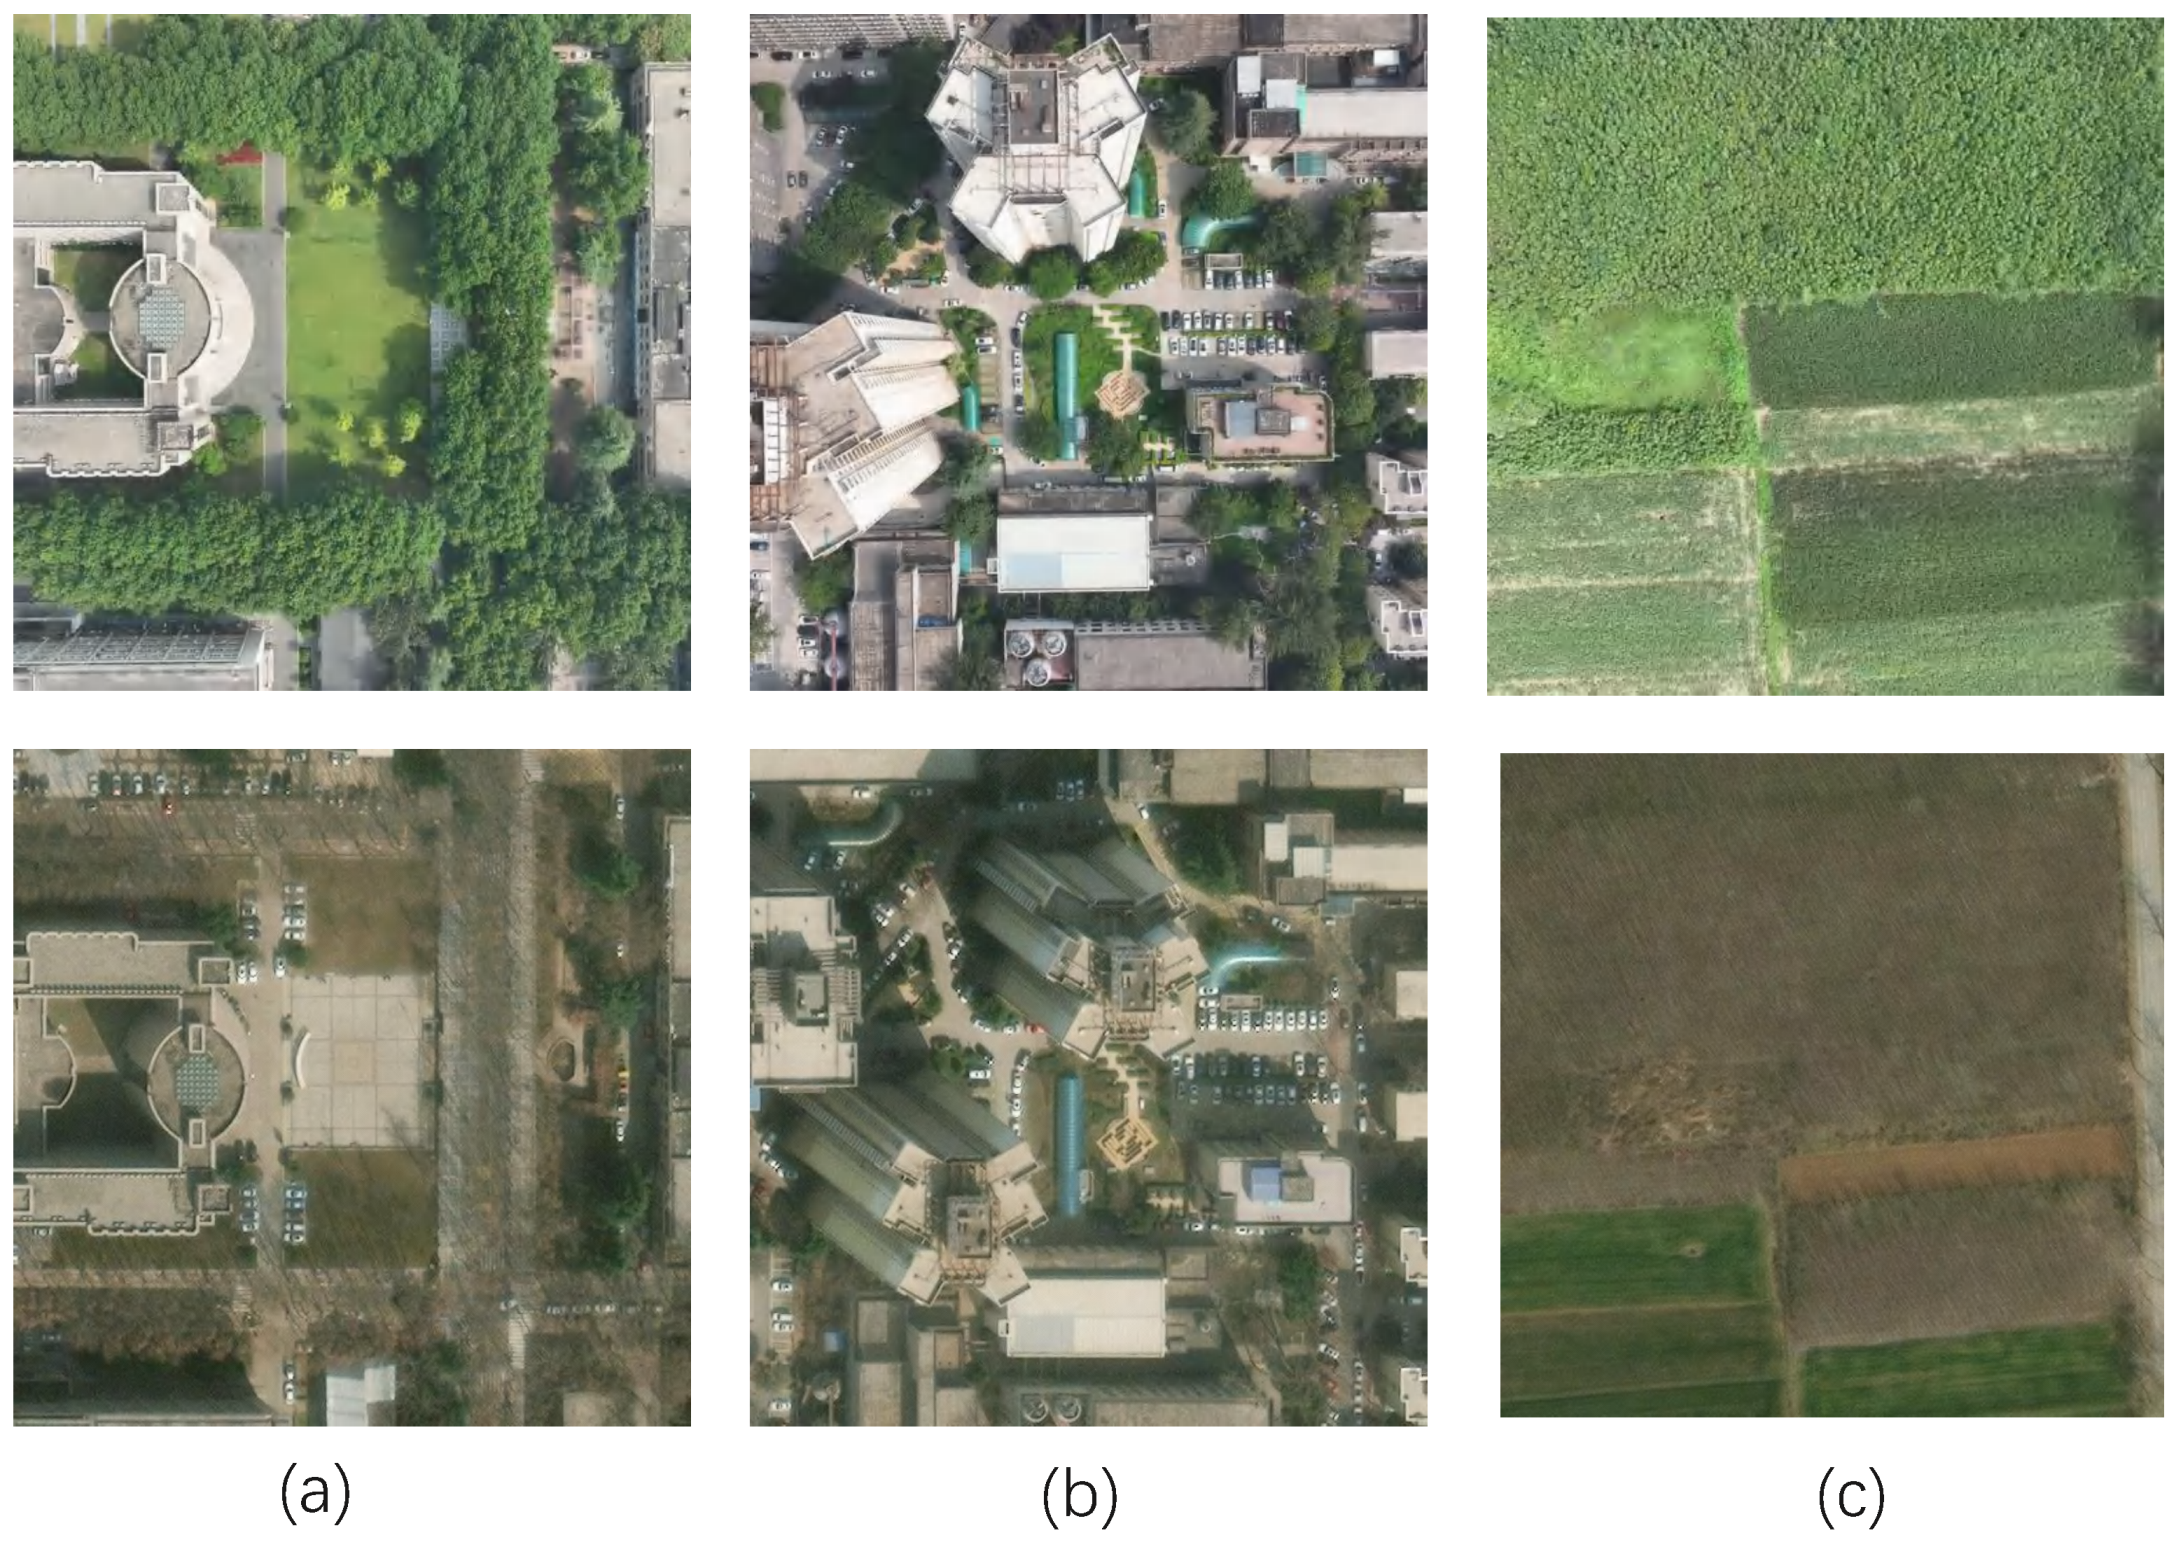
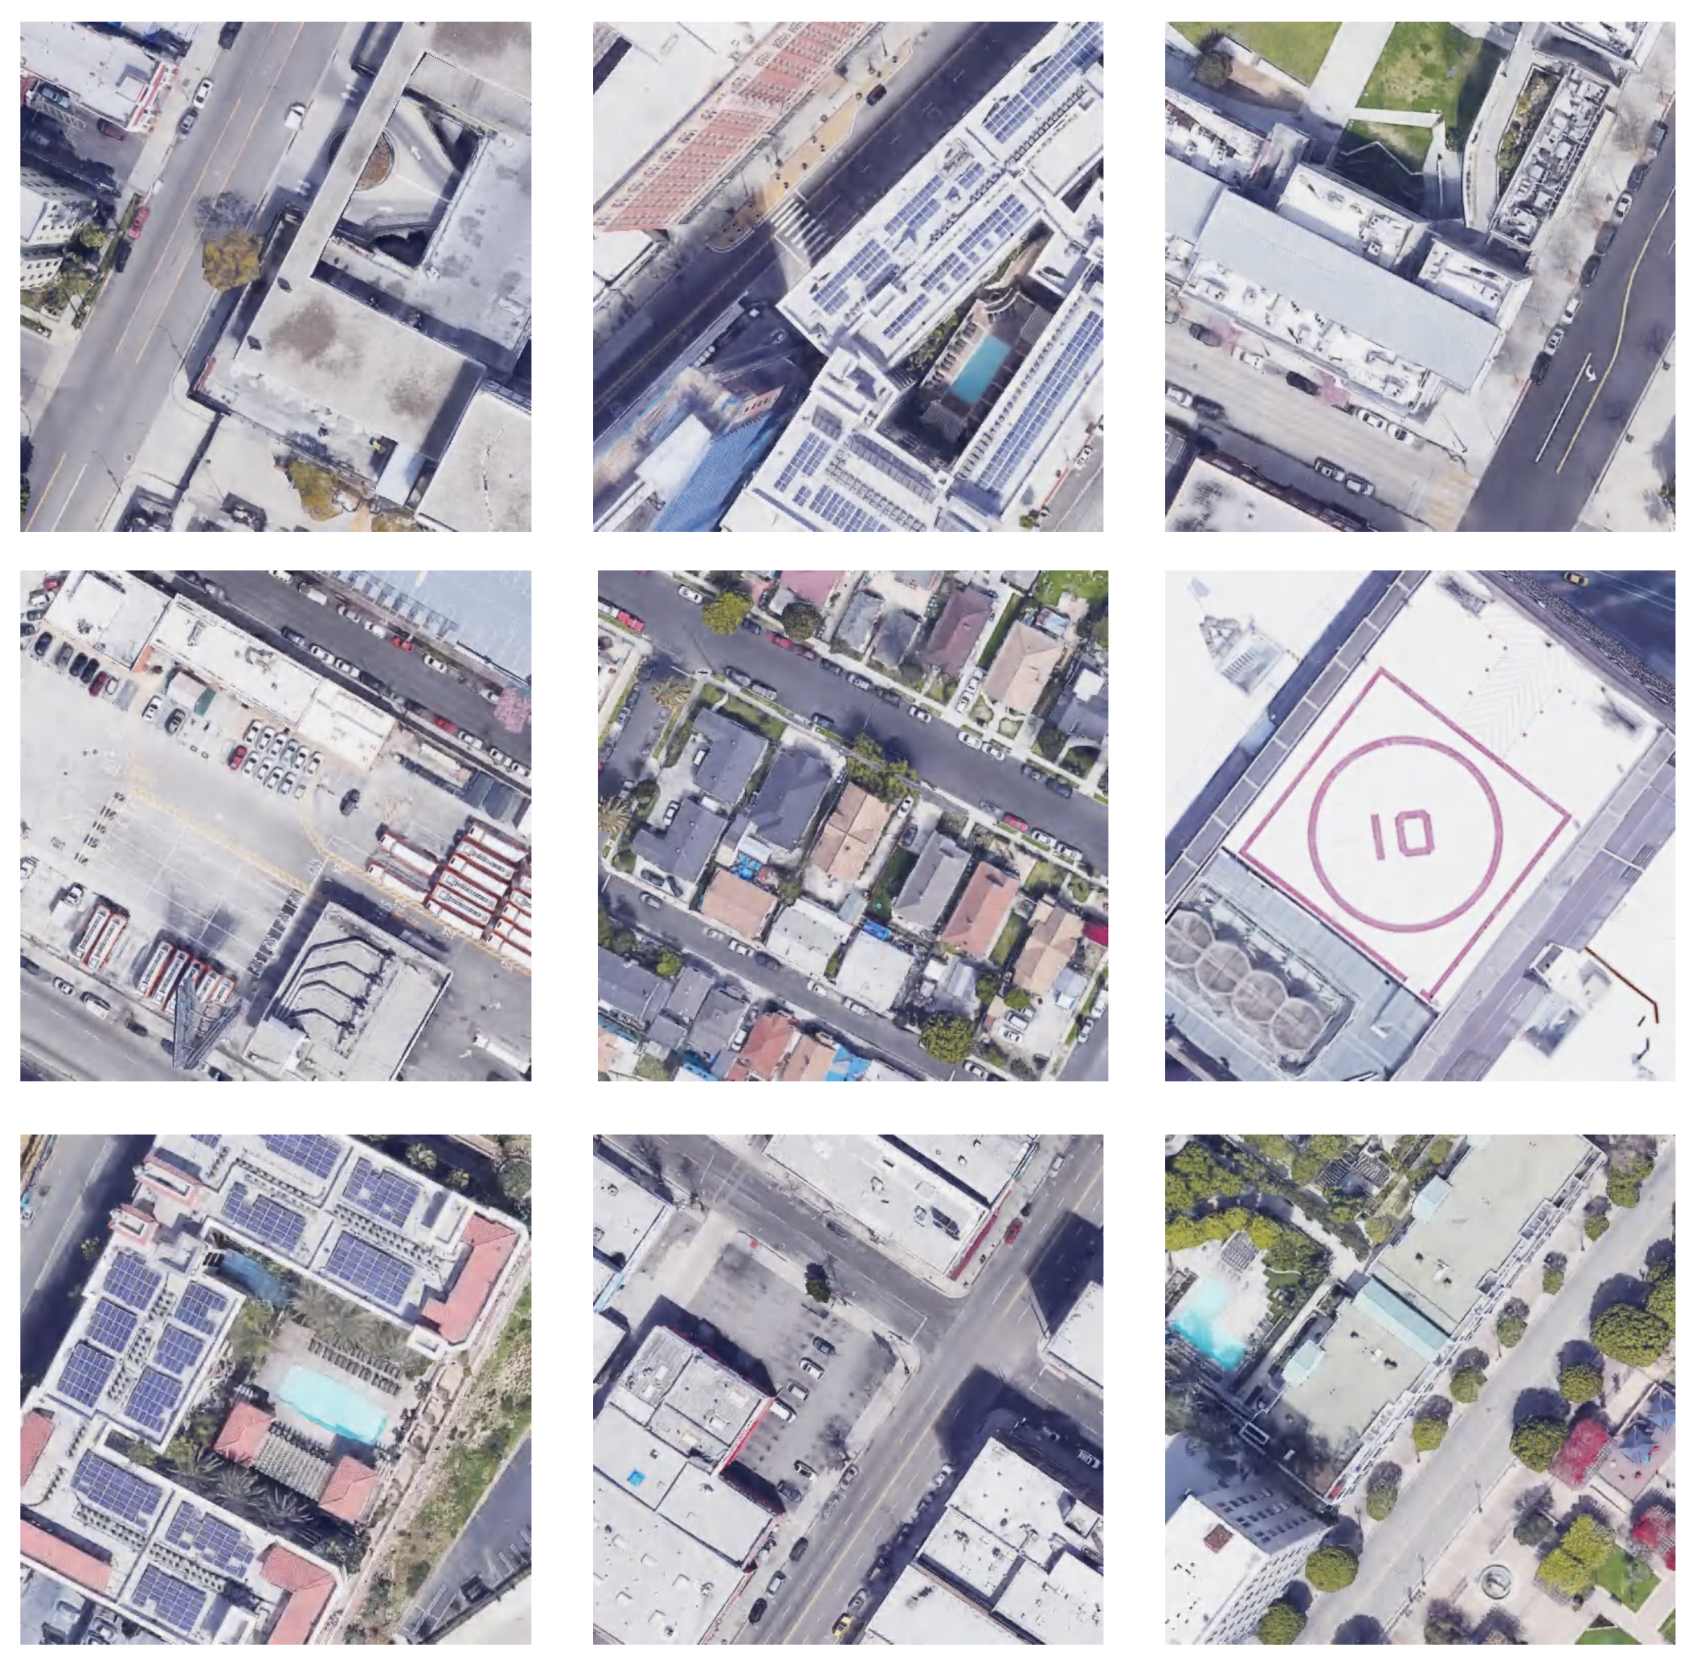
The proposed method uses the pre-trained DINO-ViT/S model with frozen weights to extract coarse features. Fine features are extracted using a 6-layer convolutional network with 3 layers of max pooling, where the kernel size is 3, and the number of channels is [64, 64, 64, 64, 128, 128]. The pooling layer has a stride of 2, and the pre-trained weights of SP are used for initialization. The training was conducted on the simulated LA-10000 dataset [
21], where satellite images were sourced from Google Maps, and UAV images were collected using the Google Earth simulator. Representative sample images are shown in
Figure 5.
The optimizer used for the neural network is SGD (momentum = 0.9), with the initial learning rates for the feature reconstruction network and descriptor mapping network set to 0.1 times and 1 times the base learning rate, respectively. During the training process, the DIM module is initially disregarded. After training the feature point extraction network, the network is frozen, and the DIM is trained by constructing self-supervised feature point pairs on the LA-10000 dataset. The model is built using the PyTorch v2.2.2 framework. The experiments in B and C were performed on an NVIDIA RTX 4090 GPU, while the experiment in D was conducted on an Nvidia Orin Nano.
5.2. Comparative Experiments with Mainstream Methods
The proposed method was compared with other methods, including SuperPoint [
31] (baseline), ORB [
52], Alike [
53], and Xfeat [
32], to evaluate its performance in terms of accuracy, efficiency, and other aspects. Nearest Neighbor (NN) and SuperGlue [
54] methods were used as matching tools, respectively. Due to the limited size of the training dataset, retraining the models could lead to poor performance due to overfitting. To ensure a fair comparison, the pre-trained weights of the models were used, as they were trained on larger datasets with better generalization ability.
The quantitative results are shown in
Table 2, where positioning error (PE) and positioning distance measurement (PDM) are used as evaluation metrics. The best results are highlighted in bold. When using SuperGlue as a matching tool, the proposed method outperforms all other methods across all metrics, with a localization error of only 8.71 m and most localization distances below 5 m. Compared to SuperPoint (the baseline method), the proposed method demonstrates significant improvement in sparse scenes. When using nearest neighbors for matching, the method proposed in this study also achieves the best results. This article proposes a method that effectively captures features in sparse scenes, greatly enhancing the ability to extract and describe feature points, thereby reducing localization errors.
To better highlight the differences in localization performance, the results of using SuperGlue as a matching tool are visualized.
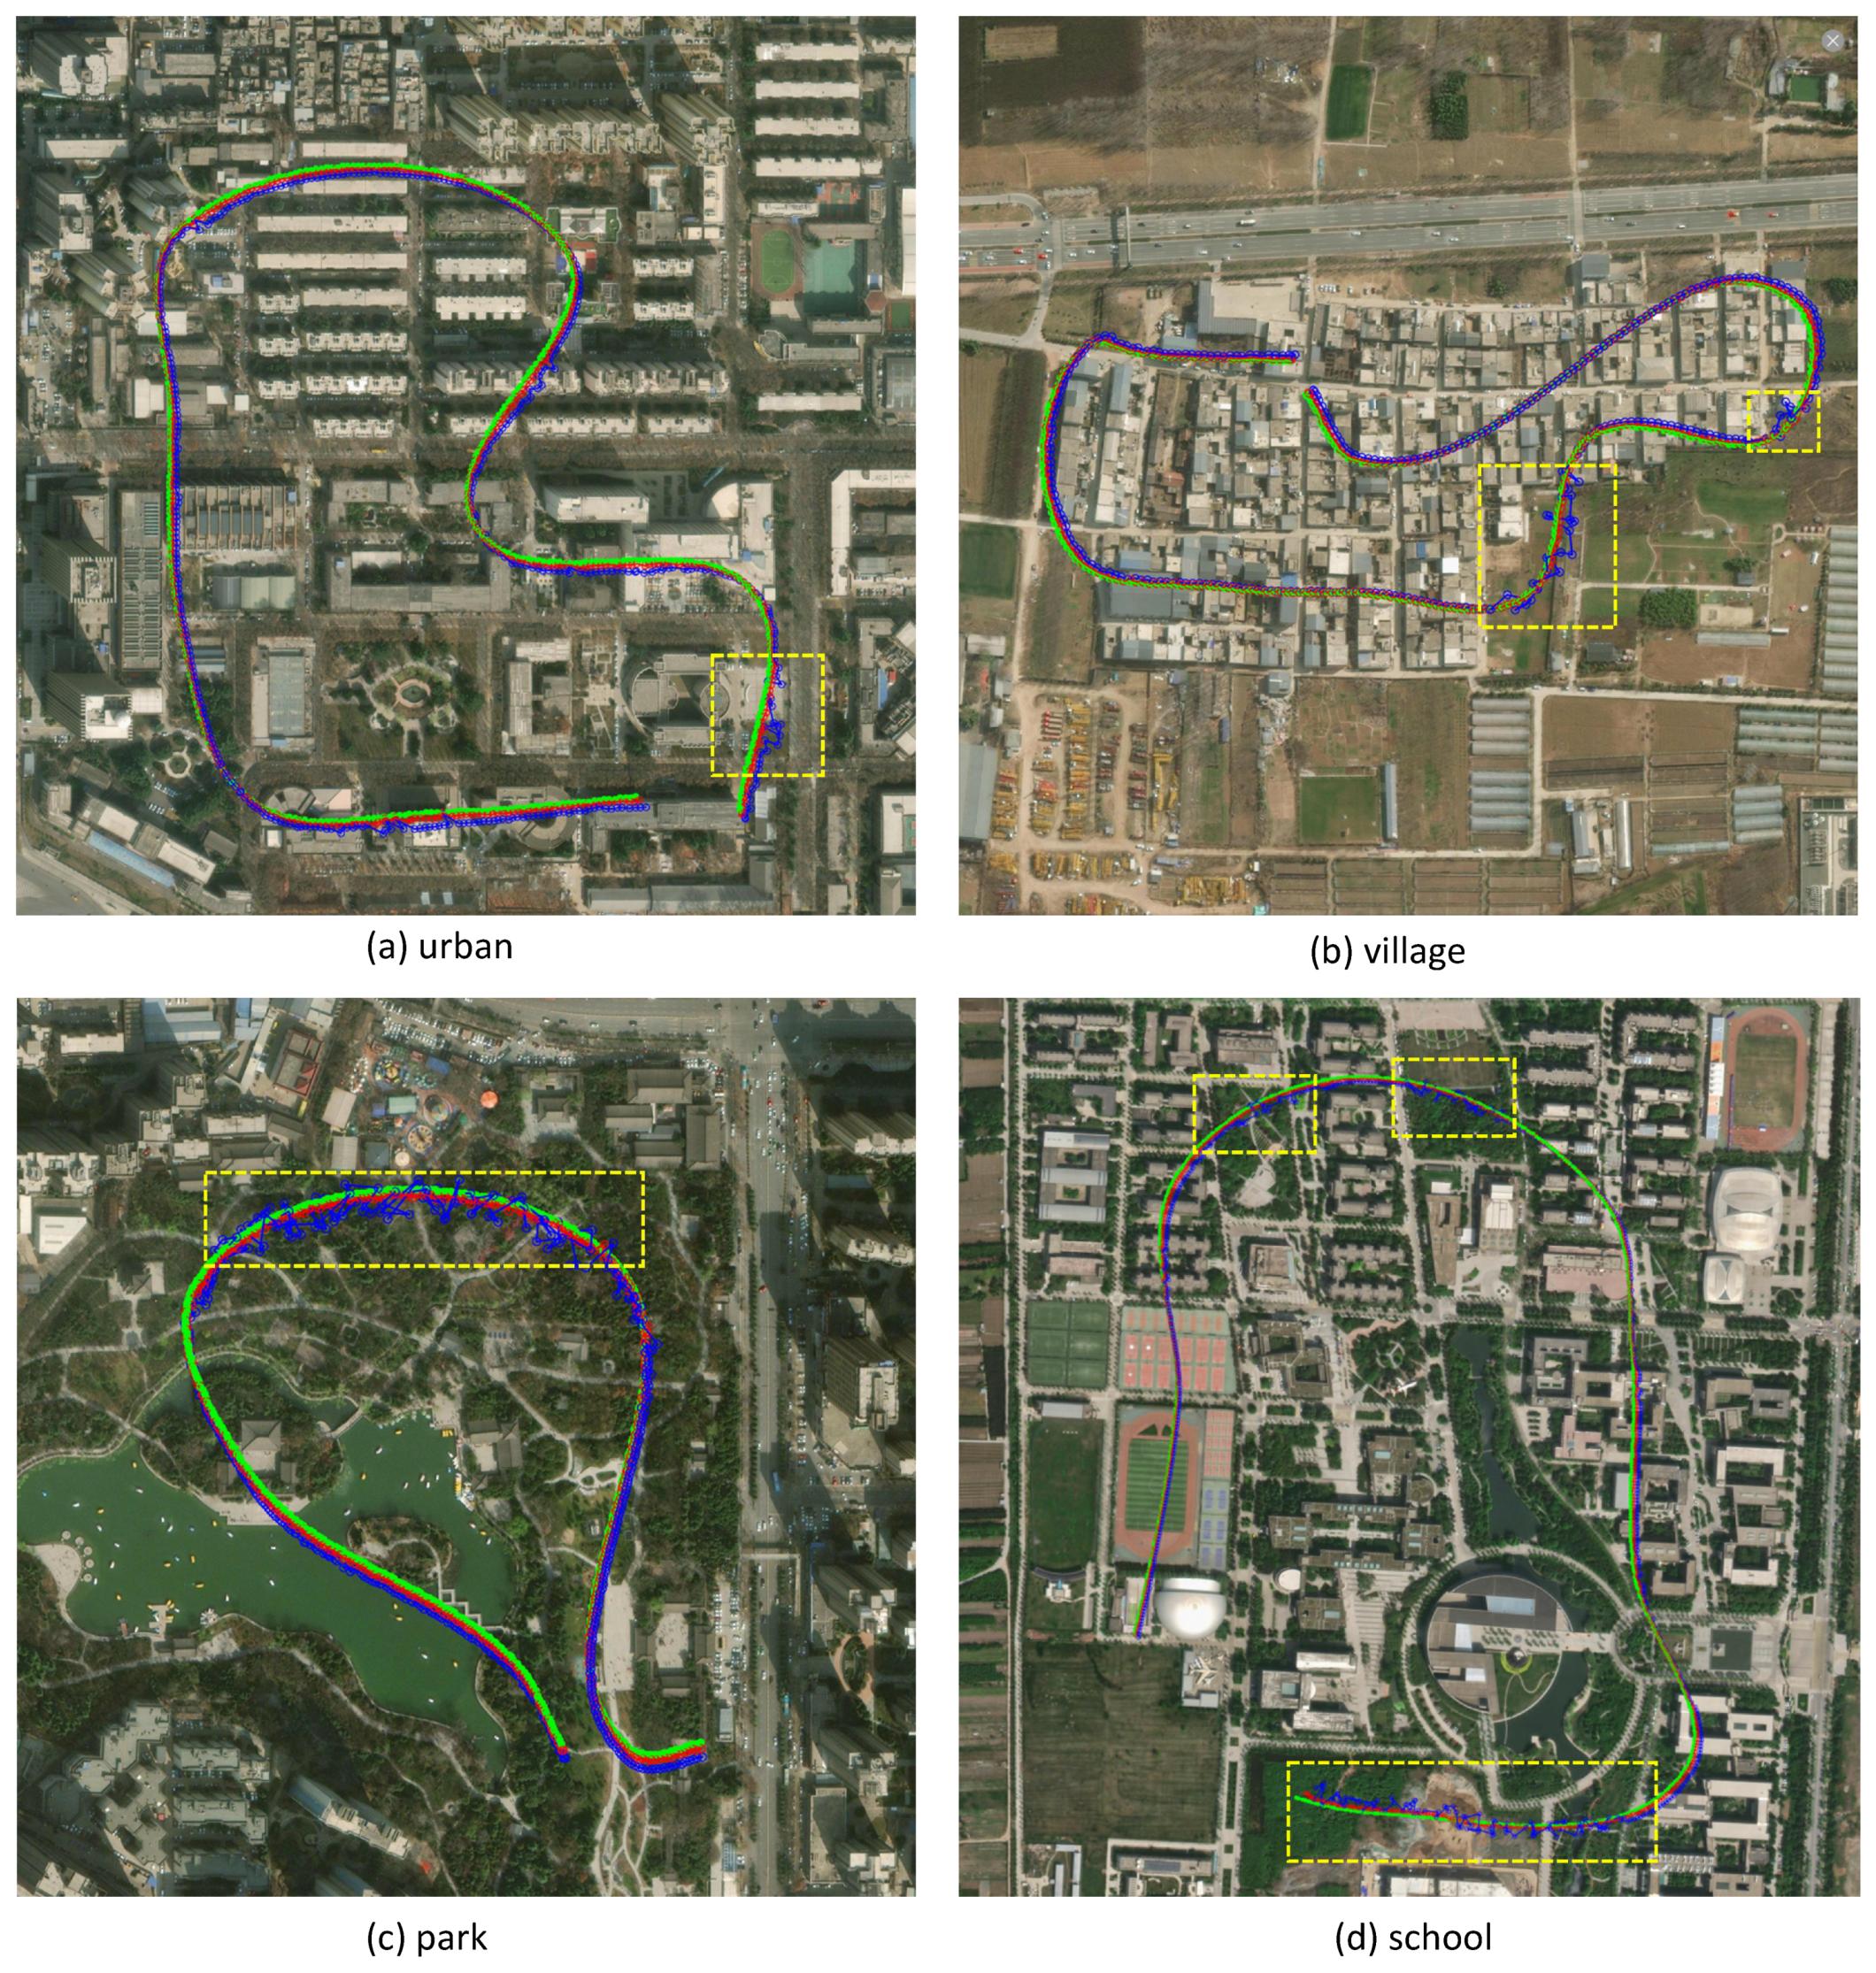
Figure 6 shows the localization trajectory of our method in urban, village, park, and school scenarios, covering areas such as teaching buildings, residential buildings, wastelands, squares, forests, lakes, and more. These scenarios represent the majority of environments encountered during UAV operations. In the figure, green represents the GPS location, red represents the location determined by our proposed method, blue represents the location determined by the SuperPoint method, and the highlighted area within the yellow dashed box corresponds to regions with sparse texture. In the dashed box area of (a), the terrain has changed due to seasonal influences. In the dashed box area of (b), there has been a significant change in the scene. The dashed box area in (c) and (d) is primarily composed of scenes such as trees and forests, where features are sparse and difficult to capture. It can be observed that our method effectively extracts low-texture features from these scenes through the feature reconstruction and descriptor increment modules, successfully addressing the challenge of inaccurate matching in sparse environments. The positioning error for urban scenes is 6.02 m, for village scenes is 3.07 m, for park scenes is 3.41 m, and for school scenes is 6.01 m, achieving strong localization results.
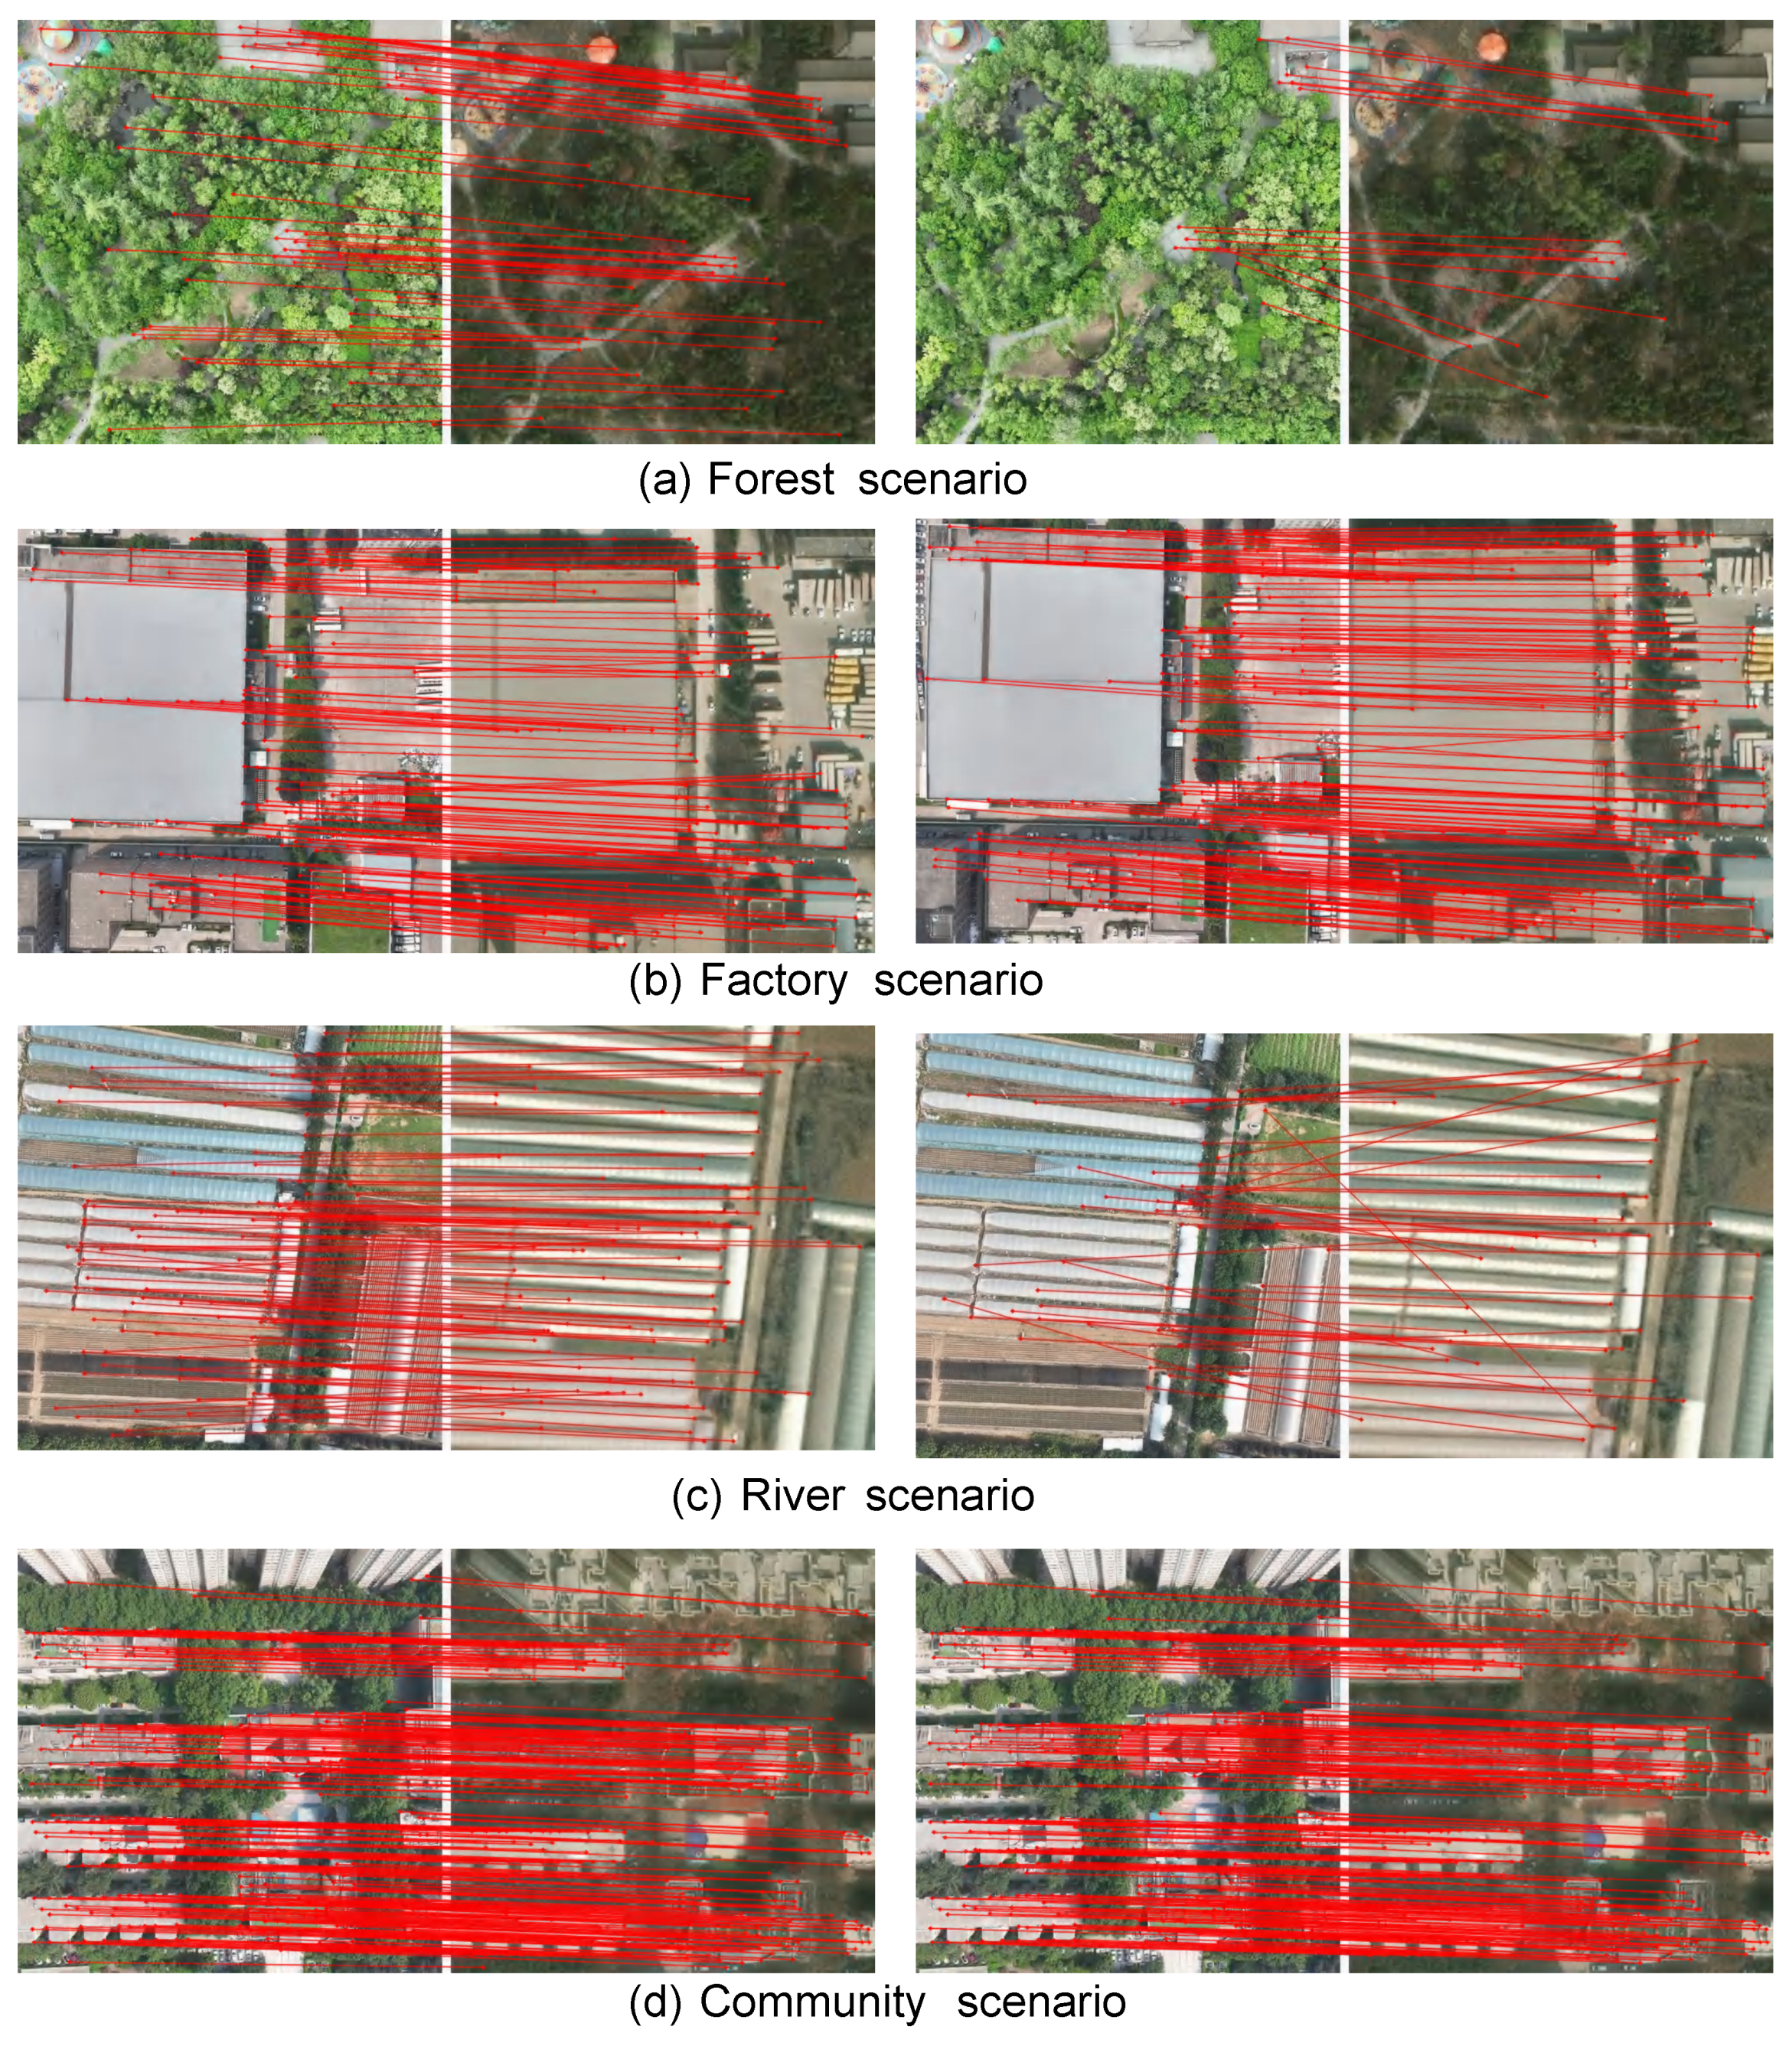
Figure 7 shows the results of the proposed method and the SuperPoint method when using SuperGlue to match feature points. The matching results for four scenes are displayed, including both richly textured and sparsely textured areas. The method proposed in this study constructs a feature map with rich semantics, capturing both coarse-grained and fine-grained features of the image. It is evident that, although the results are similar in areas with dense textures, more detailed features are effectively extracted in sparse scenes, resulting in more feature points and stronger metric descriptors, thereby achieving better matching results.
To evaluate the computational efficiency of the UAV and the reliability of the positioning algorithm, this paper measures the correct positioning frequency, FPS, and the time required for keypoint extraction. The experimental results are presented in
Table 3 and
Table 4, where the bolded values indicate the best results. The FPS calculation considers the total time required for multiple matches in a single positioning process of the UAV, including post-processing tasks such as I/O operations, keypoint extraction, and keypoint matching. The proposed method in this study achieved the highest positioning accuracy with a slight reduction in operating speed. Notably, the ORB method runs very fast; however, its positioning accuracy is poor, making it unsuitable for UAV localization.
Summary and Reflection. SuperPoint, Alike, and XFeat improve the generation of feature points and descriptors through architectural modifications to the network, yielding significant performance gains over traditional handcrafted operators such as ORB. However, these methods are mainly designed for structured environments like indoor and outdoor buildings, and they tend to underperform in regions with sparse features due to their limited texture representation capability. In contrast, the method proposed in this study leverages a general visual model to extract coarse-grained patch features and integrates them with fine-grained details, resulting in semantically enriched feature maps. This design enhances robustness in texture-sparse scenes and contributes to superior localization performance.
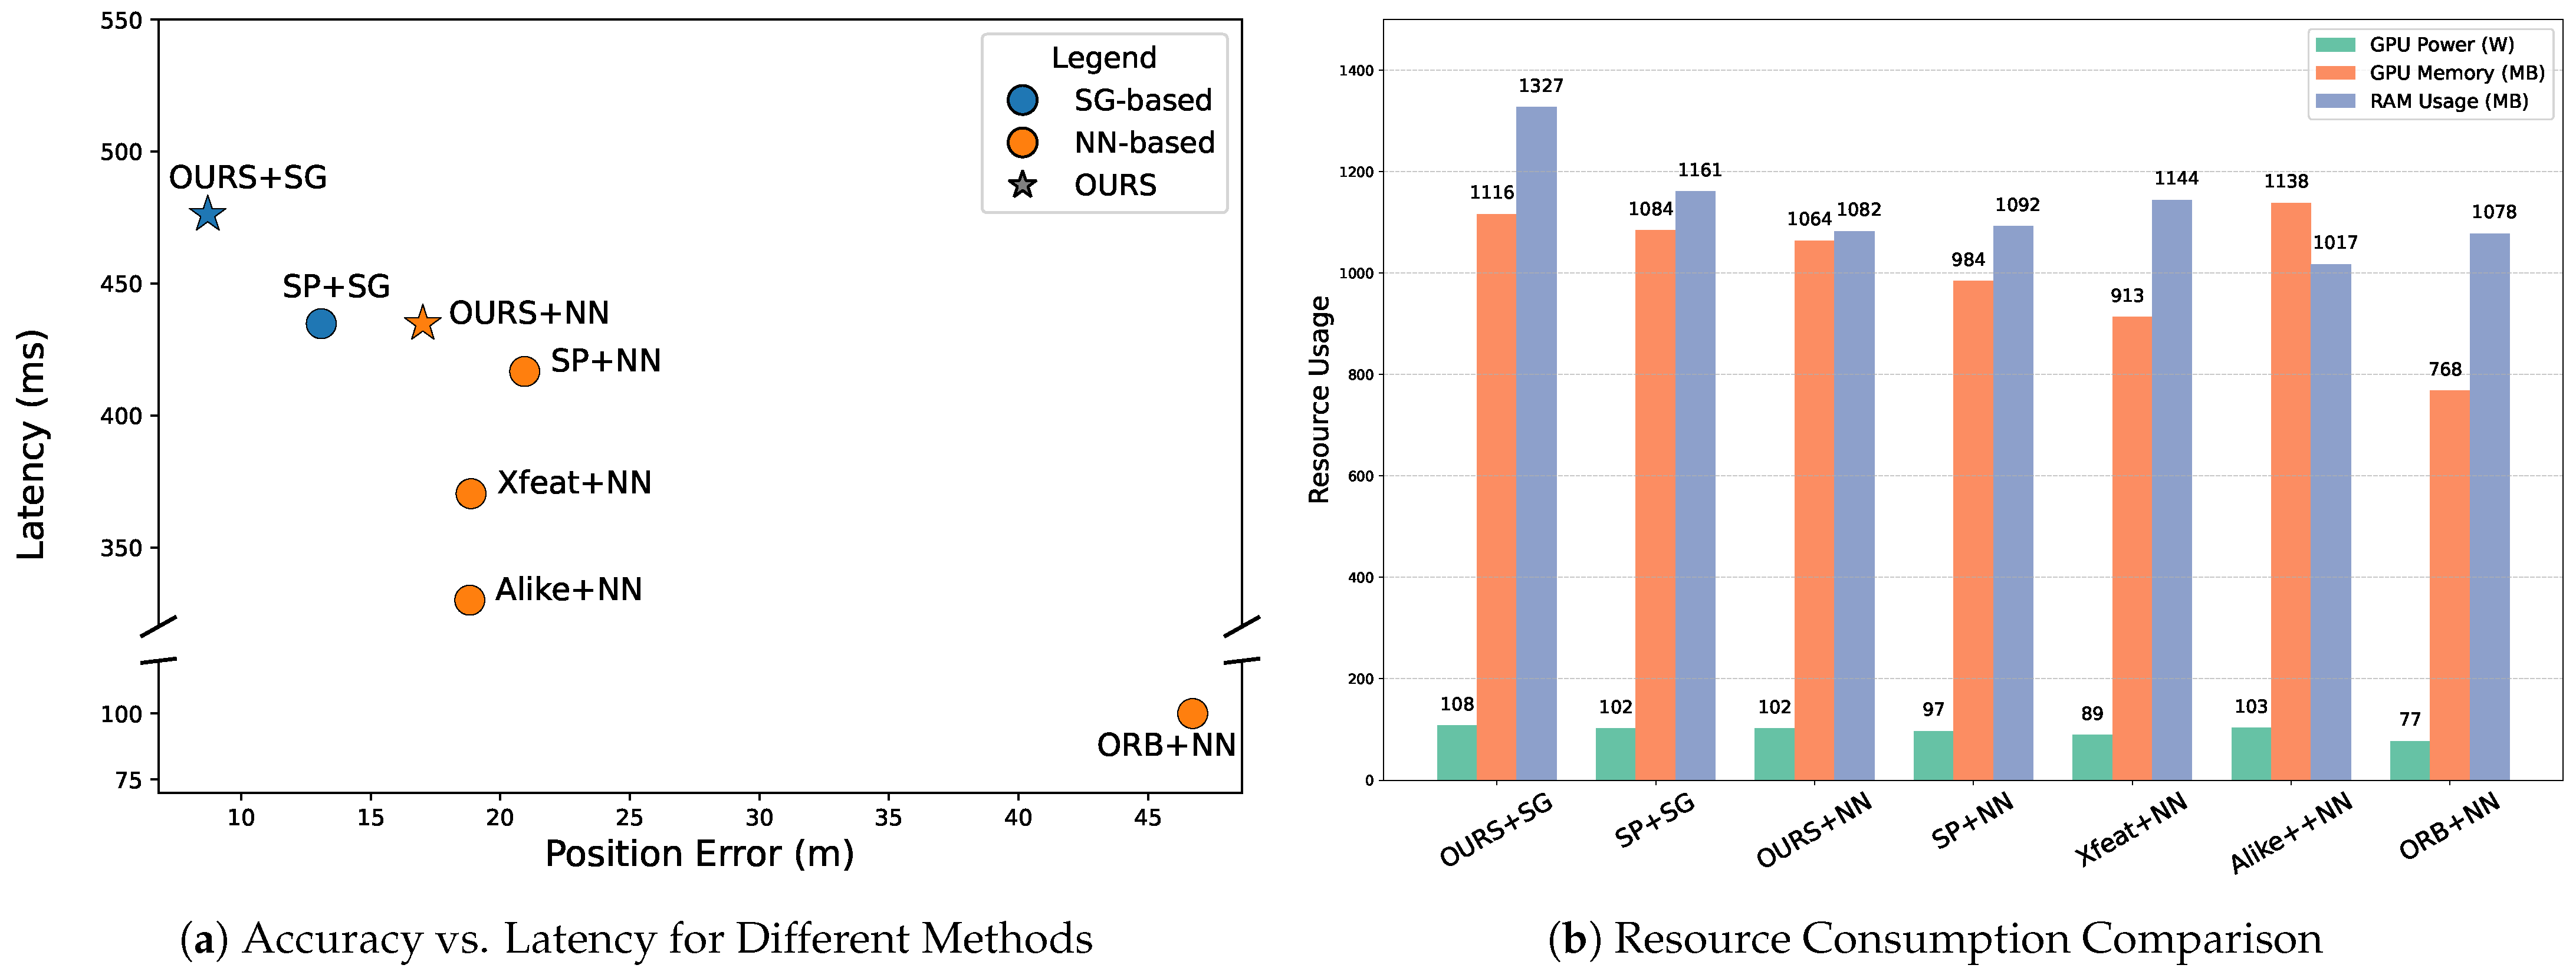
Comprehensive experimental results demonstrate that the proposed method consistently outperforms existing approaches across multiple evaluation metrics. Specifically, it achieves the lowest average positioning error (8.71 m), the highest localization reliability (R = 0.95), and maintains real-time performance with an average frame rate of 1.95 FPS. Although this reflects a slight decrease from the 2.15 FPS achieved by the SuperPoint baseline, it yields a substantial 33.46% improvement in localization accuracy. Compared to other methods such as ORB+NN, Alike+NN, and Xfeat+NN, our approach also demonstrates superior robustness and efficiency. As shown in
Figure 8, the proposed method maintains moderate GPU and memory consumption in addition to achieving high accuracy, demonstrating its practicality for drone localization in resource-limited or real-time scenarios.
5.3. Ablation Experiment
In this section, we explored the roles of the feature reconstruction (FR) module and the descriptor incremental mapping (DIM) module. Use superglue for matching, keep other experimental settings consistent with
Section 5.2.
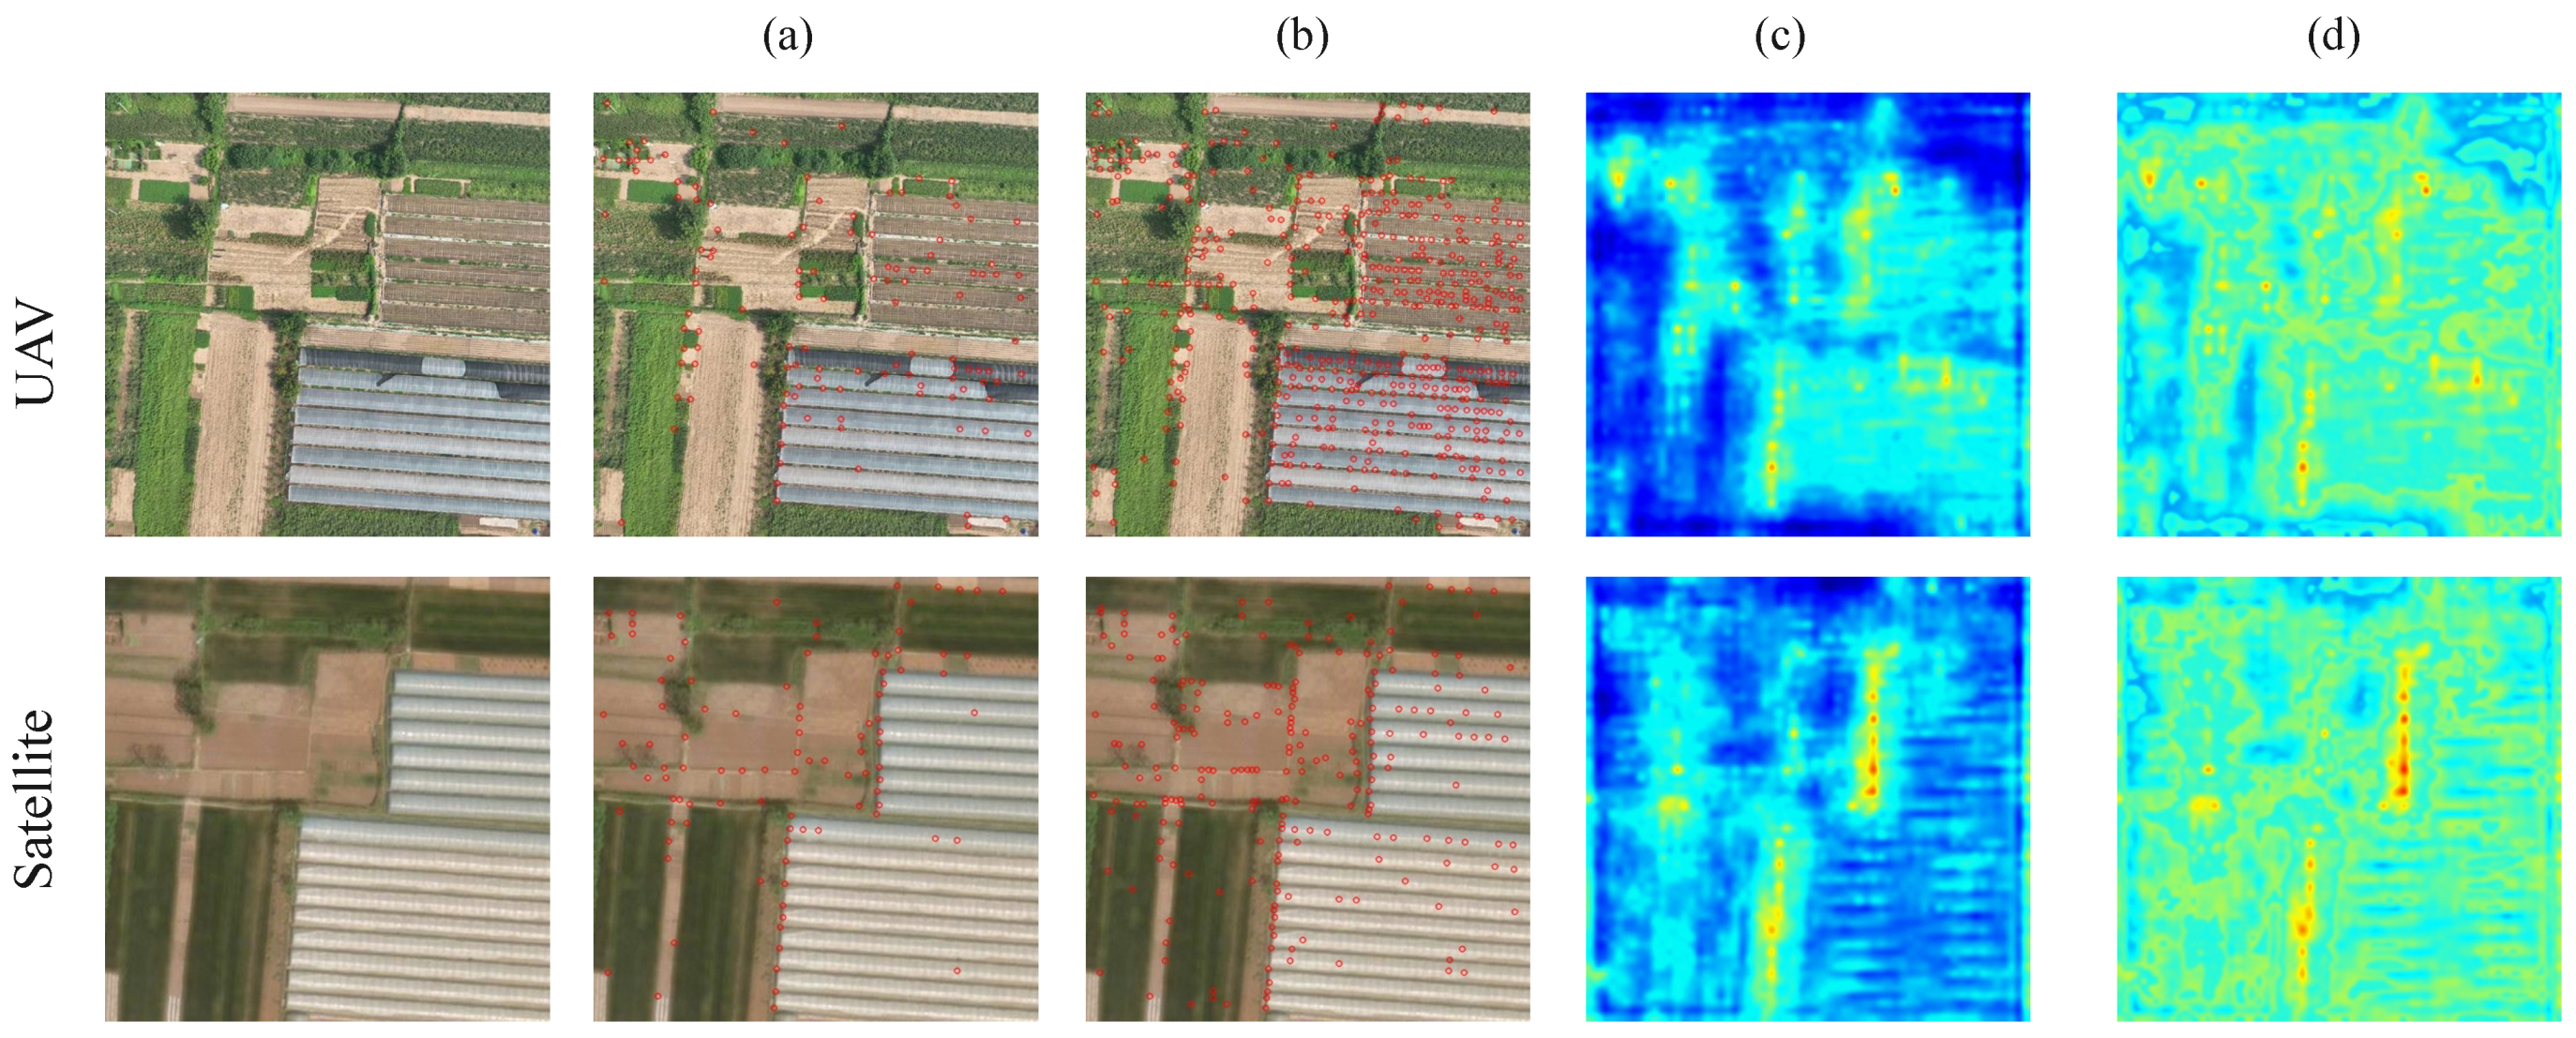
Role of the Feature Reconstruction. The feature point extraction network based on deep learning can effectively extract texture features from images, but it often overlooks sparse features. This issue is particularly prominent when there is a large number of repetitive features and similar semantic information in the image, which can result in significant errors in feature matching and localization. To address this, this paper proposes a feature reconstruction module that captures low-texture areas by integrating rough patch features from the general visual model. As shown in
Figure 9, the feature reconstruction module effectively identifies the features of areas such as lawns, farmland, and village roads, and extracted more keypoints.
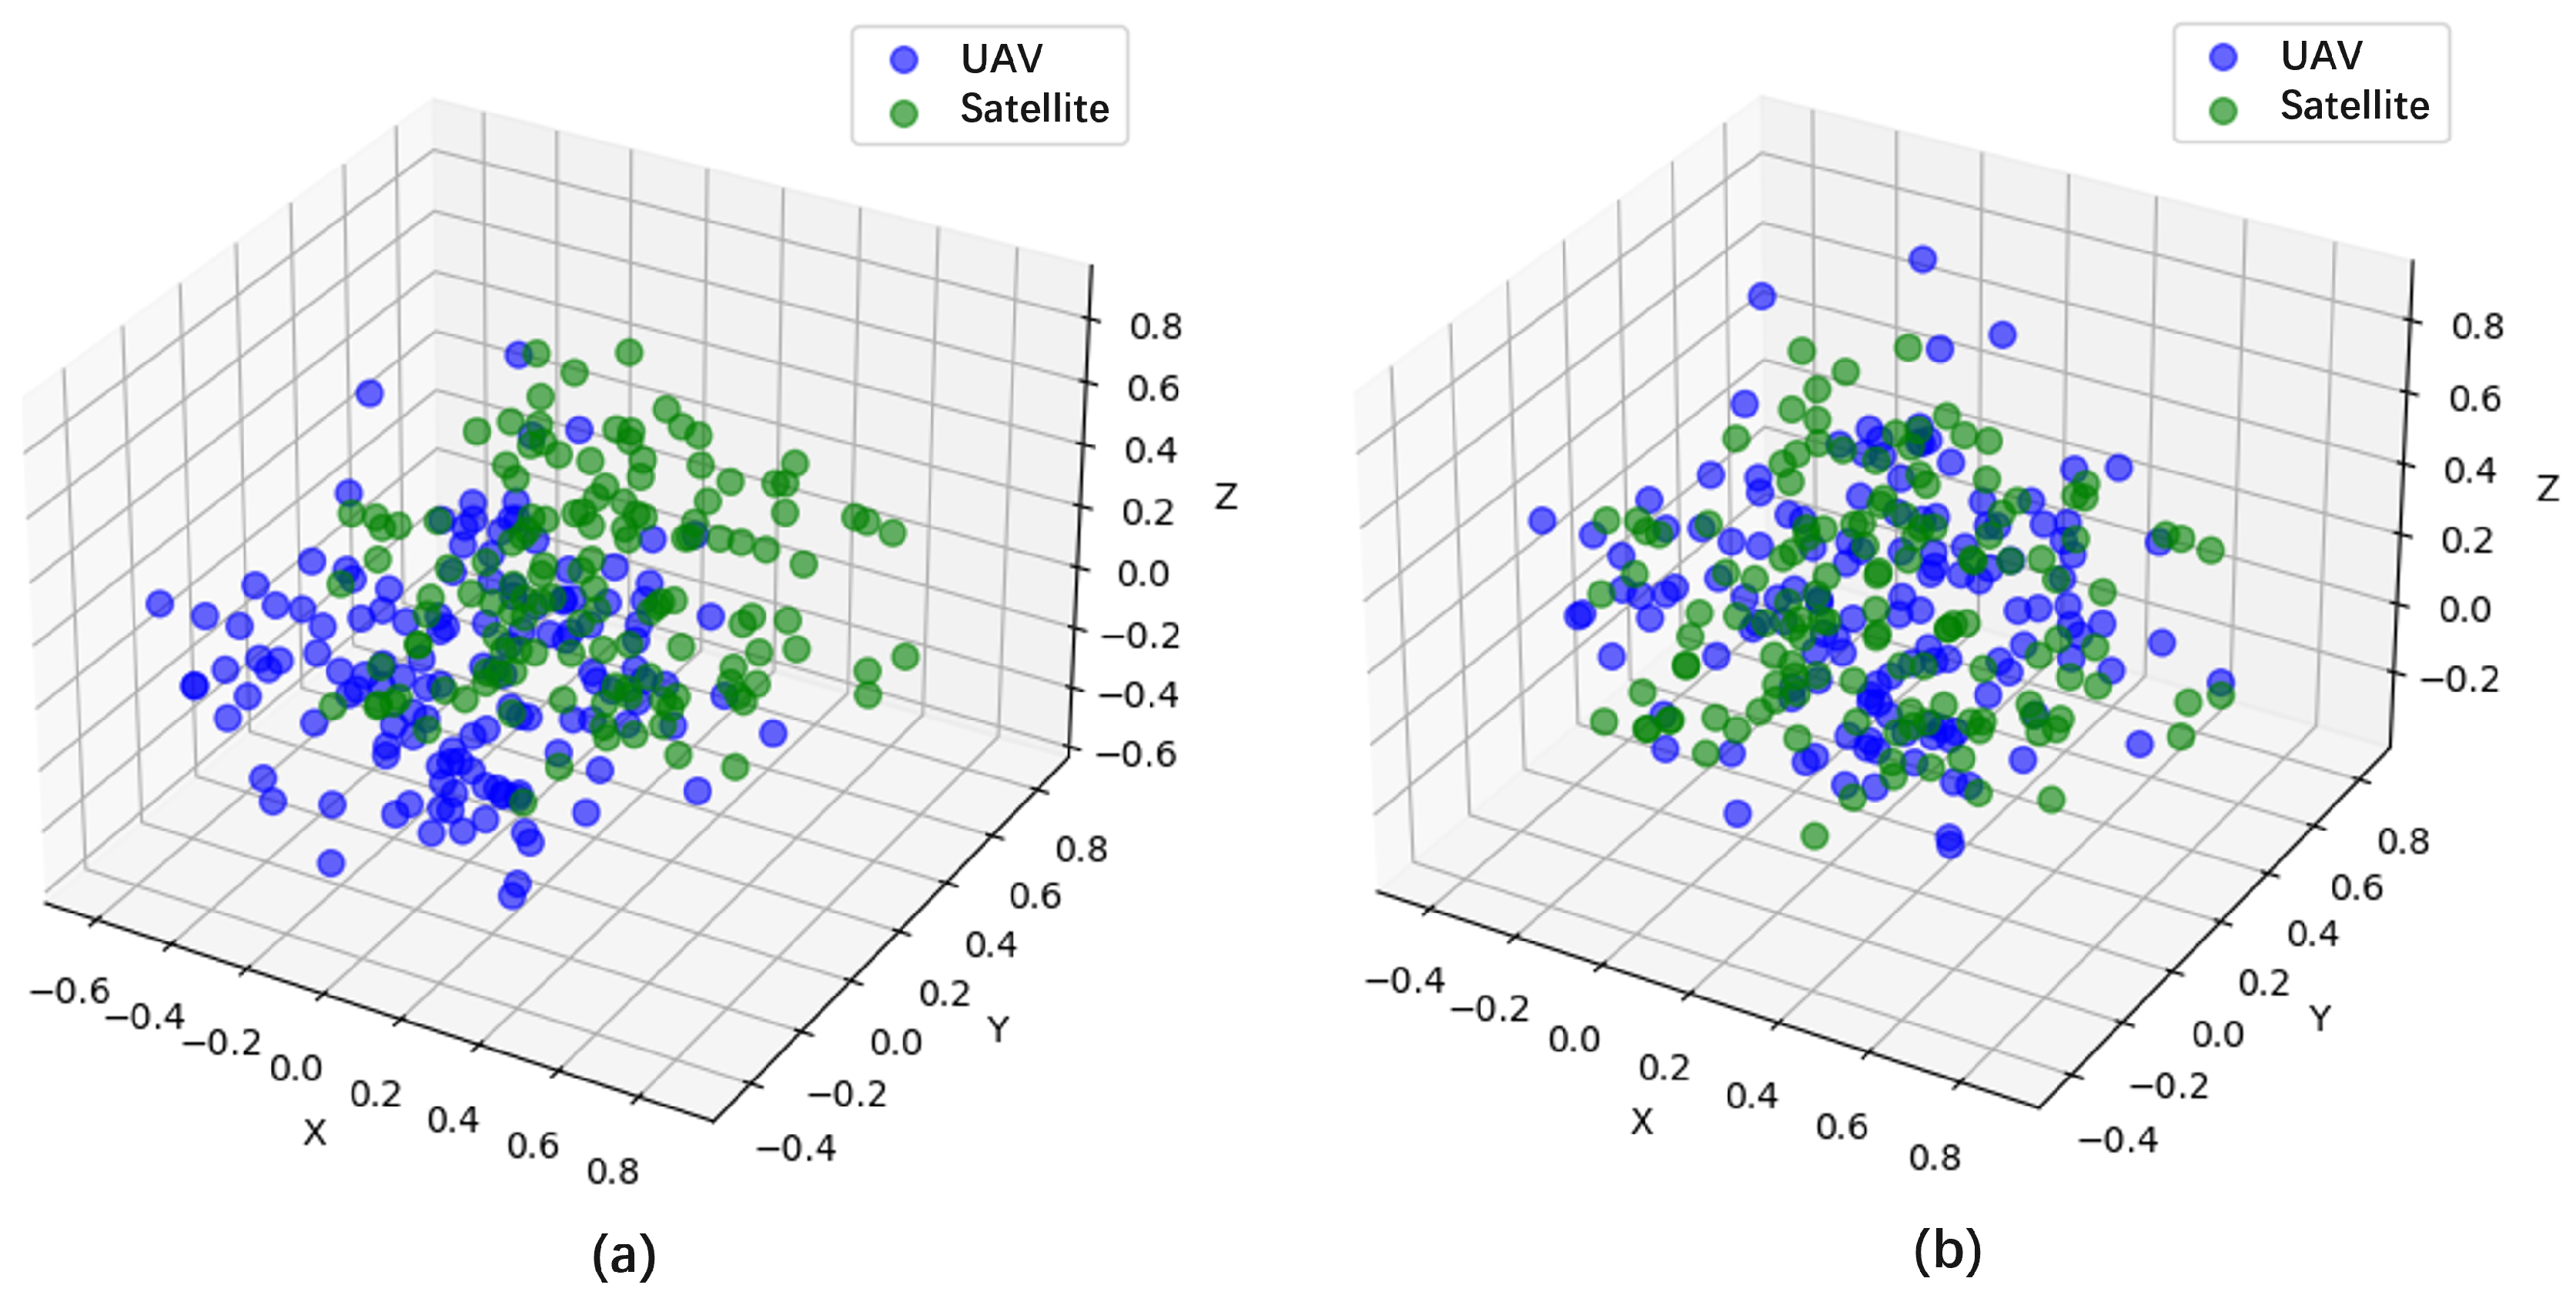
Role of the Descriptor Incremental Mapping. For multi-source images, factors such as imaging methods, lighting conditions, and seasonal changes often cause significant variations in ground objects, leading to measurement discrepancies. This study employs descriptor mapping technology to align UAV and satellite images within the same metric space, reducing these differences. PCA dimensionality reduction was used for visualization. As shown in
Figure 10, there was a difference in the descriptors between the UAV and satellite images before using the descriptor increment. After using the descriptor increment, this difference decreased. It is evident that the method proposed in this article effectively brings the descriptors generated from multiple sources of images closer to each other.
Experiments were conducted on all sequences, and the quantitative results are shown in
Table 5. This paper proposed a feature reconstruction module and a descriptor incremental mapping module for achieving improved results. Among them, the feature reconstruction module focuses on extracting sparse features, while the descriptor increment module focuses on reducing multi-source image differences.
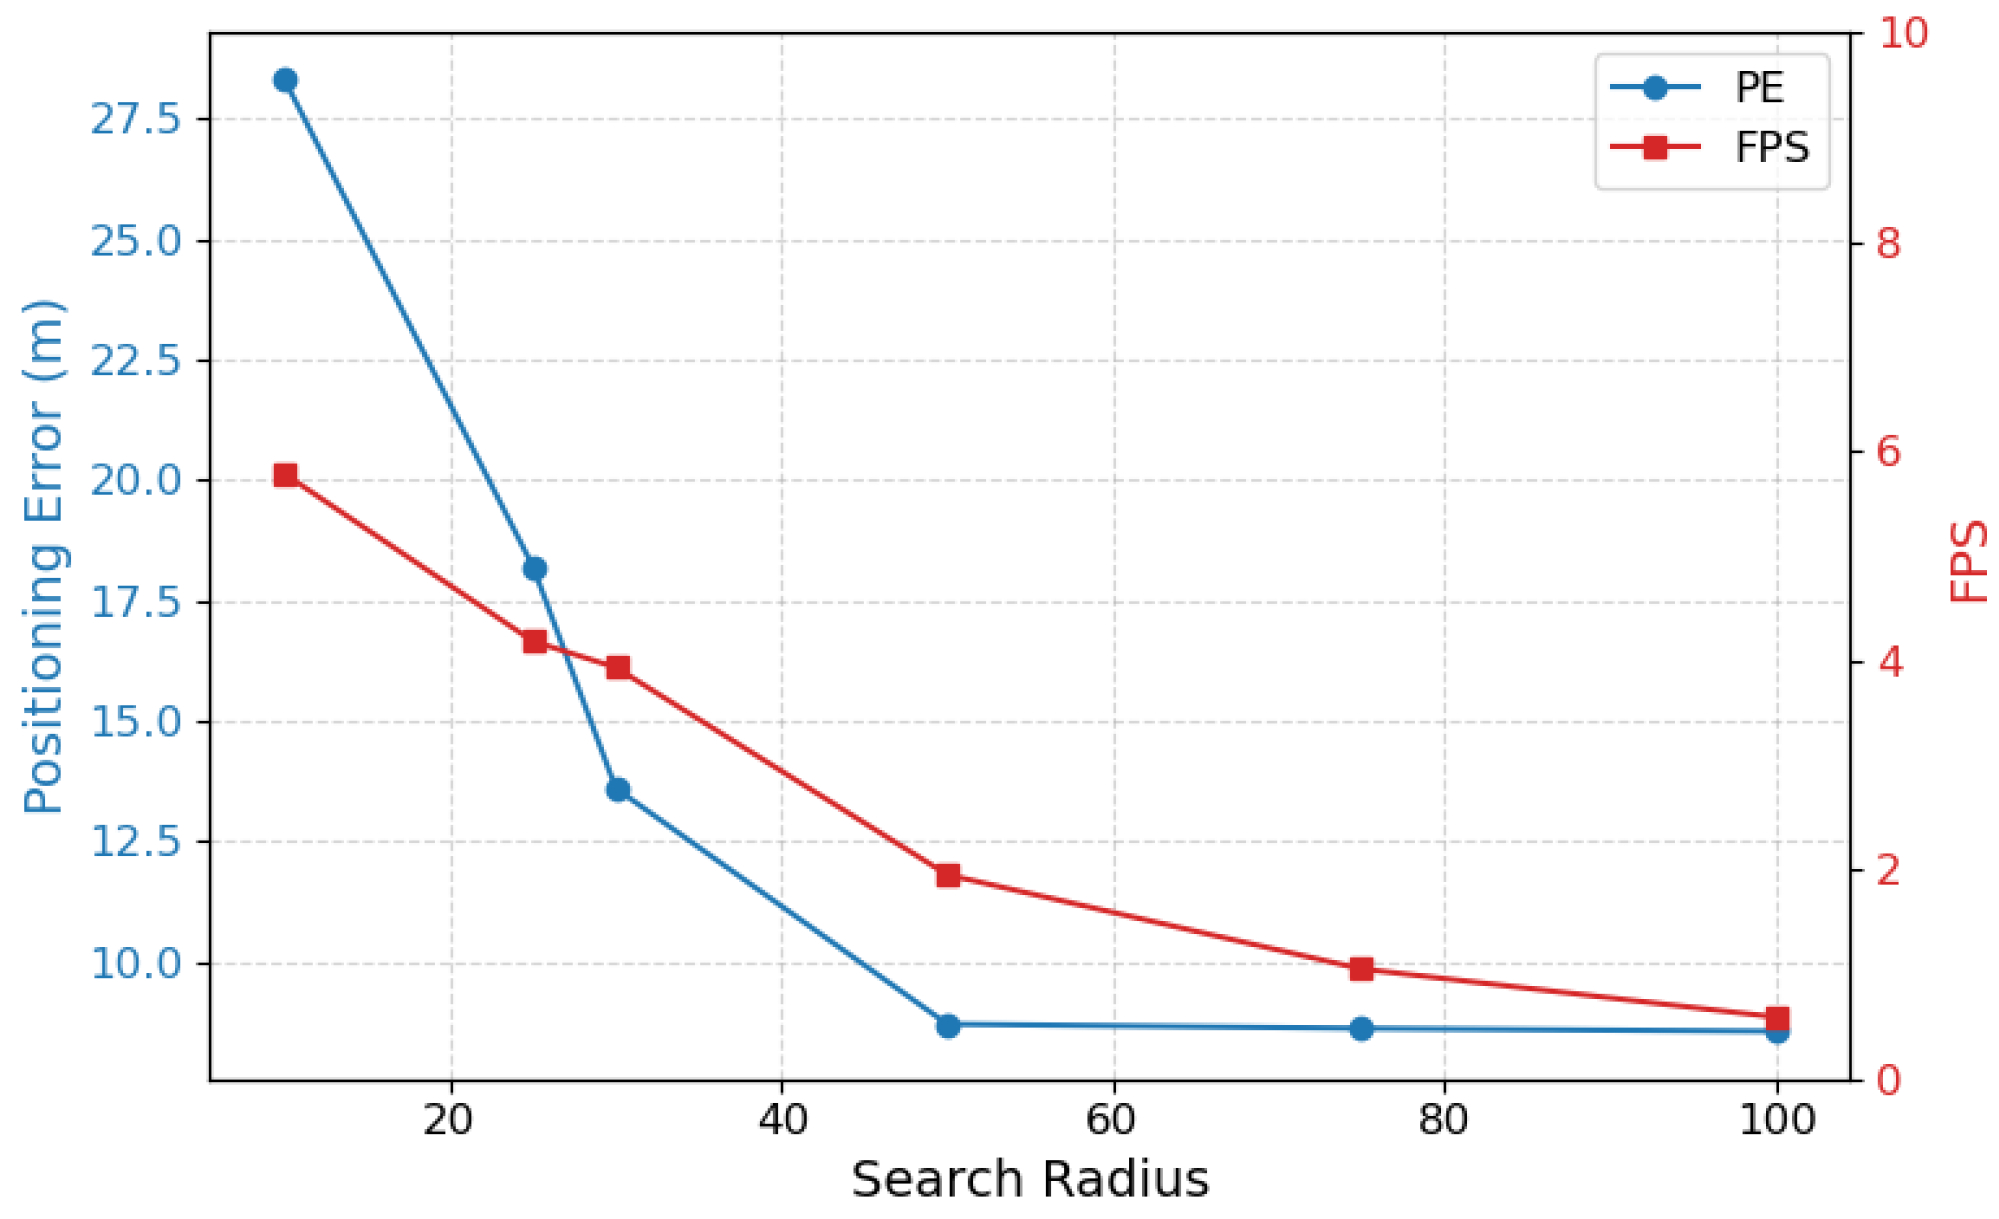
Role of the Search Radius. To analyze the effect of search radius on localization performance, we conducted experiments across a range of radii from 10 m to 100 m. As shown in
Table 6 and
Figure 11, increasing the search radius improves accuracy, thus reducing the average positioning error (PE), boosting PDM@K scores, and increasing reliability (R). However, this also leads to a notable drop in frame rate (FPS), reflecting higher computational cost. Among all settings, a radius of 50 achieves the best trade-off, with a low error (8.71 m), high reliability (R = 0.95), and real-time speed (1.95 FPS). Larger radii offer only marginal gains in accuracy while significantly reducing efficiency, making radius = 50 the optimal choice in our system. In future work, range estimation techniques will be investigated to reduce the localization radius without compromising accuracy. This is expected to improve real-time performance and better accommodate fast UAV motion.
5.4. Real-Time Edge Device Performance Evaluation
This section examines the performance of the proposed method and visual localization framework on edge devices, with a primary focus on power consumption and visual processing. The evaluation was conducted on the Nvidia Orin Nano, which provides robust computing power and efficient power management, making it well-suited for embedded system applications. Its real-time processing capability was assessed while running the visual localization framework to ensure stable operation in UAV localization and practical application scenarios.
As shown in
Table 7, the proposed method achieves nearly 1 FPS with a power consumption of 15W. Future work will explore optimizations through model quantization, model distillation, and the use of TensorRT during deployment and inference.
6. Conclusions
This paper proposes a scene adaptive UAV visual localization framework (SAVL). In the proposed framework, UAV images are mapped onto satellite images with geographic coordinates through pixel-level matching to locate UAVs. First, to address the issue of inaccurate localization caused by sparse terrain features in a scene, a feature extraction network based on a general visual model is introduced to extract sparse features from UAV and satellite images. Second, to overcome the problem of weak generalization ability in unknown scenarios, a descriptor incremental mapping module is designed to reduce multi-source image differences at the semantic level through UAV-satellite image descriptor mapping, and a confidence-based incremental strategy is constructed to dynamically adapt to different scenes. Finally, due to the lack of annotated public datasets, a scene-rich UAV dataset (RealUAV) is developed to study UAV visual localization in real-world environments.
Experimental results on real data demonstrate that, compared with other representative methods, this approach not only significantly reduces localization errors but also exhibits strong scene generalization ability, improving localization performance in sparse scenes. However, in some highly complex environments, such as areas with drastic land cover changes, the proposed method is not yet sufficiently stable. Fully utilizing limited visual information remains a challenge.
Future research will focus on refining feature extraction strategies and optimizing descriptor mapping algorithms by integrating environmental awareness and real-time feedback, thereby enhancing stability in extreme environments. The impact of perspective distortion, particularly in urban environments with high-rise buildings and lens distortion on positioning accuracy, will also be investigated. More comprehensive geometric models and correction mechanisms will be considered to mitigate these effects and further enhance positioning accuracy. Moreover, the feasibility of real-time localization under diverse UAV motion conditions will be further investigated, emphasizing the trade-off between accuracy and computational efficiency to enable practical deployment in dynamic environments. In addition, LiDAR, IMU, and other sensors will be integrated through multi-modal fusion techniques such as Visual Odometry (VO) and Visual-Inertial Odometry (VIO), enhancing system robustness and enabling autonomous navigation in complex scenarios. Further efforts will also focus on reducing localization latency by refining the range estimation process, aiming to improve responsiveness without compromising accuracy during dynamic flight.


