
Evaluation of the Accuracy and Applicability of Reanalysis Precipitation Products in the Lower Yarlung Zangbo Basin
 ,
,
Abstract
1. Introduction
2. Data and Methods
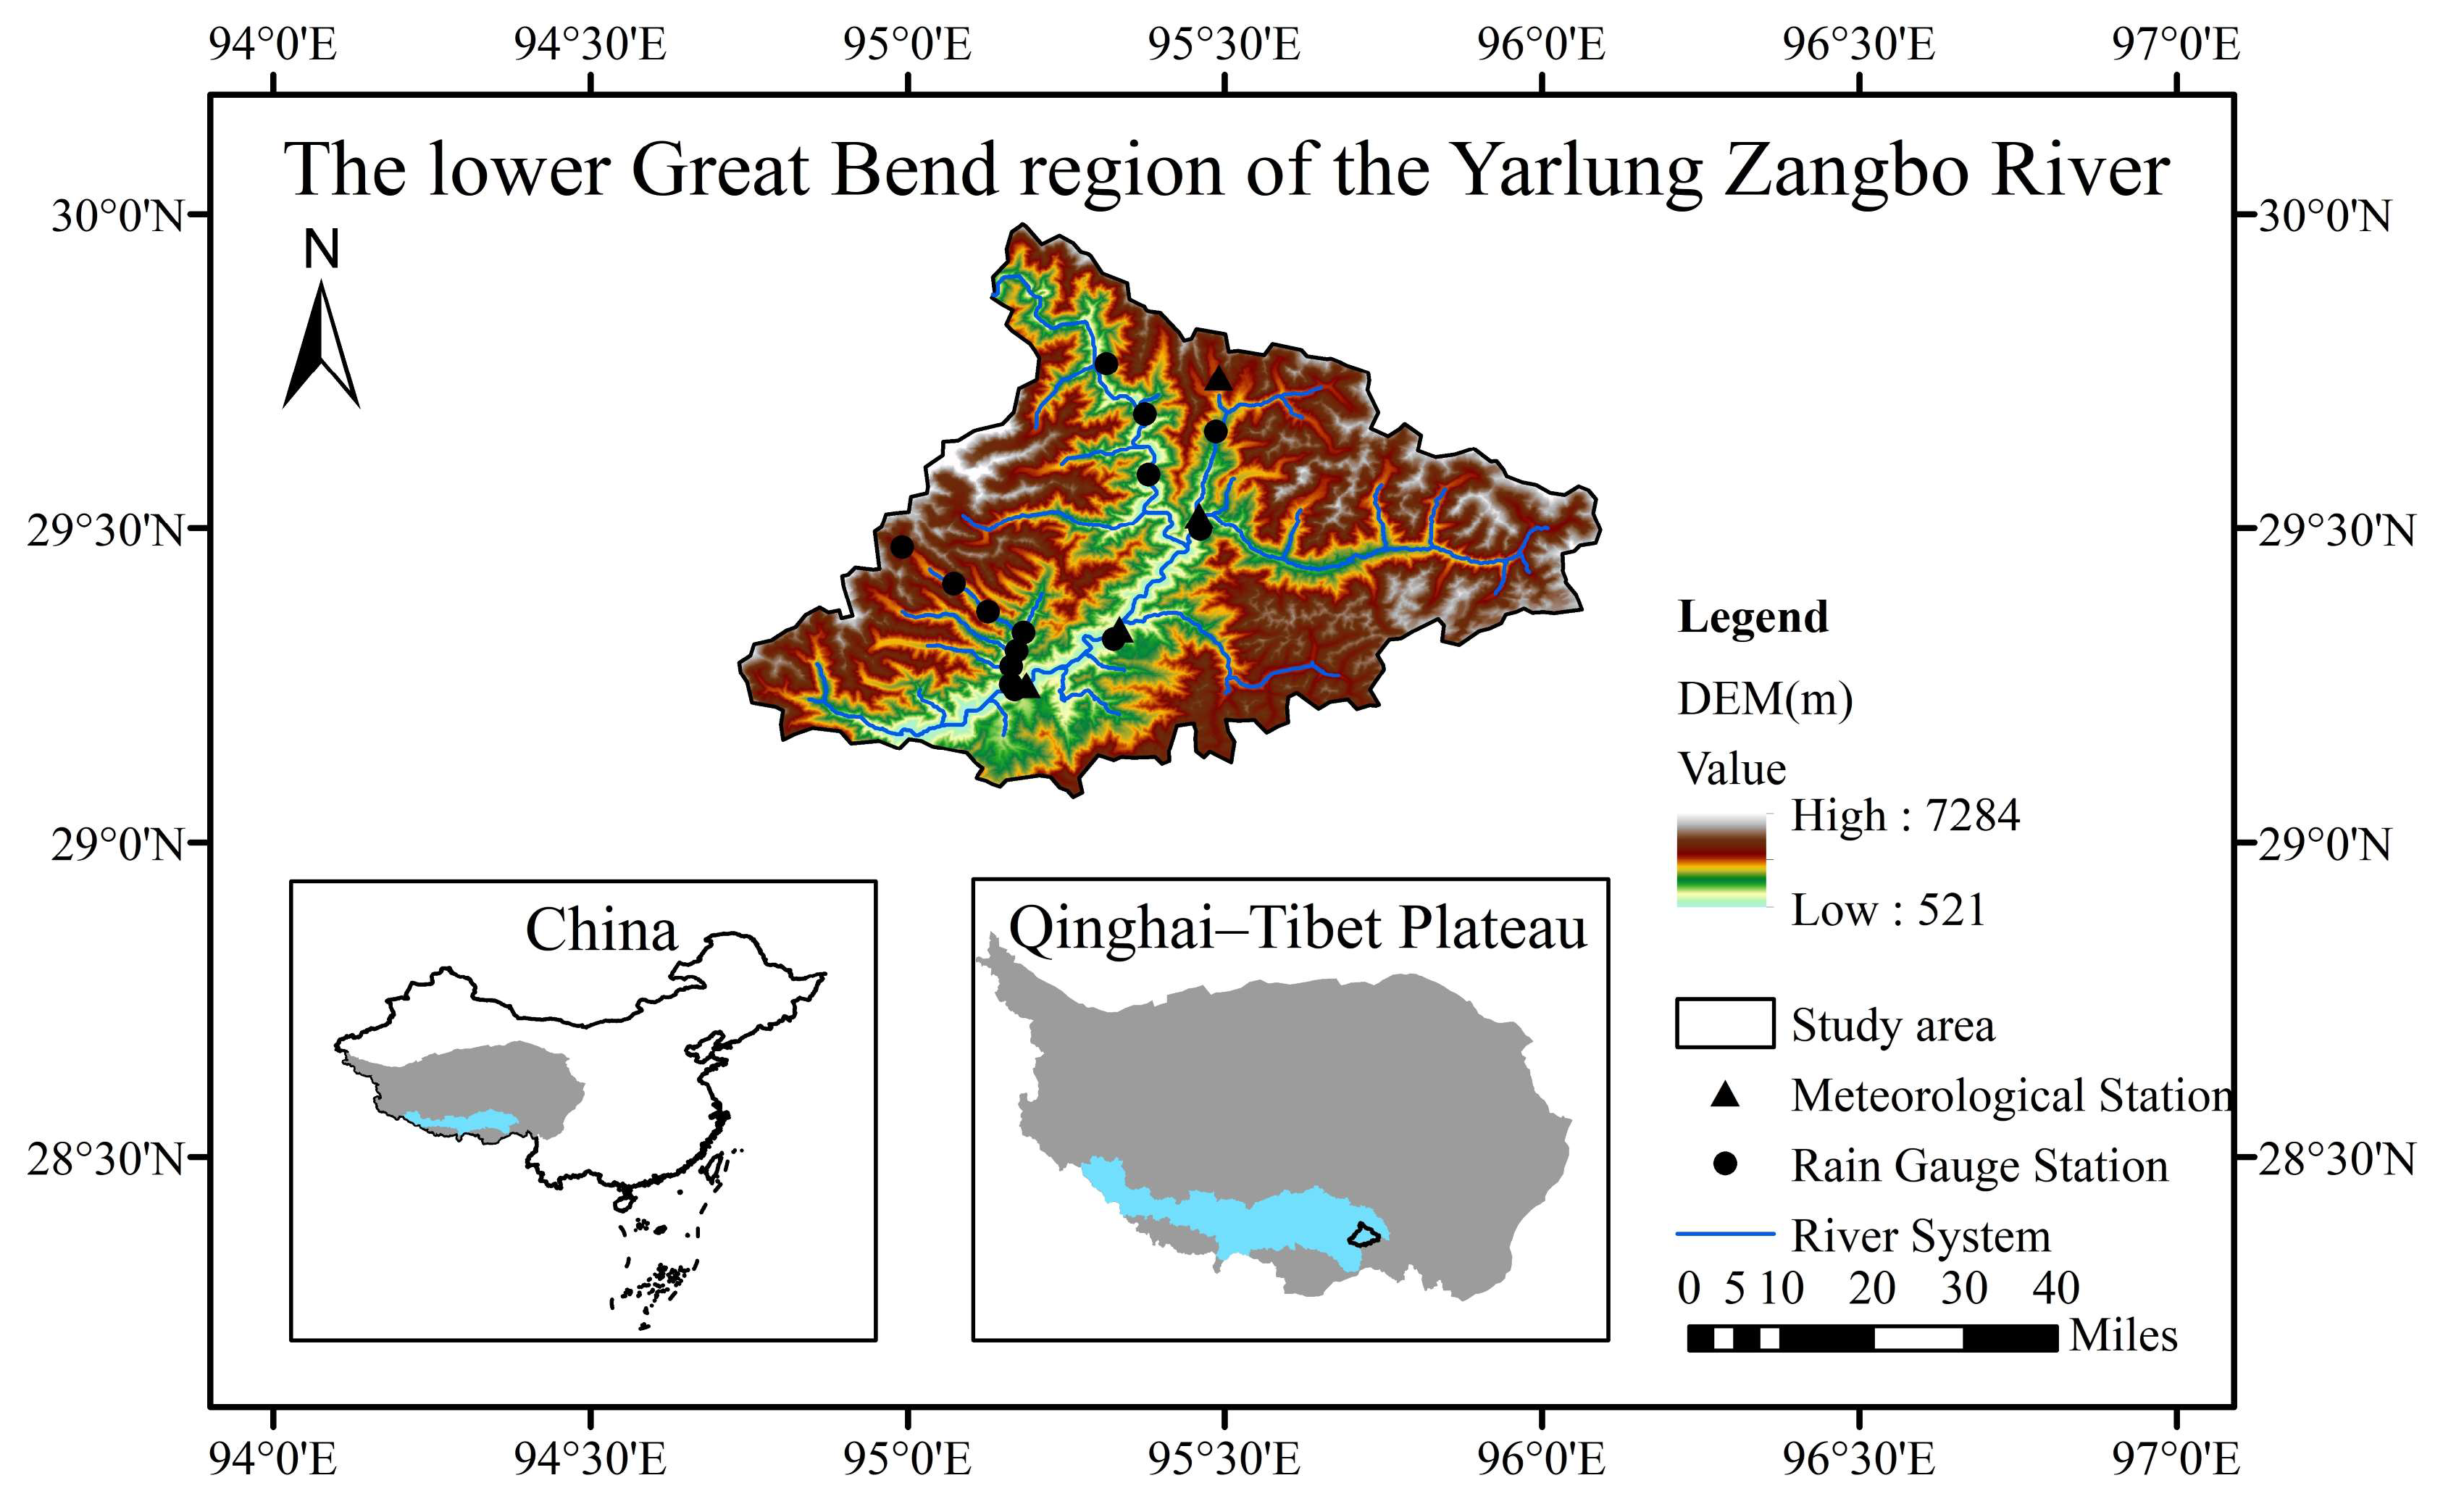
2.1. Study Area
2.2. Data
2.3. Evaluation Methods
3. Results
3.1. Overall Accuracy of Precipitation Dataset
3.2. Evaluation at Anunal Scale
3.3. Evaluation at Monthly Scale
3.4. Precipitation-Geography Correlations and Product Performance
3.4.1. Correlation Analysis Between Precipitation and Geographical Factors
3.4.2. Evaluation of Precipitation Products in Characterizing Spatial Heterogeneity
4. Discussion
4.1. Performance Assessment of Precipitation Products in Complex Terrain
4.2. Orographic Controls and Precipitation Mechanisms
4.3. Implications for Hydrological Applications and Water Resource Management
4.4. Future Research Directions and Recommendations
5. Conclusions
- (1)
- The lower Great Bend region of the Yarlung Zangbo River exhibits significant seasonal precipitation patterns, with the flood season accounting for 62.09% of annual precipitation. TPMFD consistently demonstrates superior performance, maintaining the lowest RMSE values (annual: 663.70 mm/yr; monthly: 113.62 mm/mon), balanced relative bias (annual: 8.80%; monthly: 2.62%), and stable correlation coefficients (annual: 0.77; monthly: 0.70). ERA5-Land exhibits systematic overestimation (annual: 101.40%; monthly: 80.01%), with larger northeastern errors. CMA shows good temporal correlation but significant systematic underestimation (annual: −54.51%; monthly: −57.64%). MSWEP performs moderately, with systematic underestimation, but shows negative annual temporal correlation with observations.
- (2)
- Monthly analysis reveals distinct seasonal variations in product performance. All products show larger estimation errors during the monsoon season (June–September), when precipitation is highest. Correlation coefficients peak during summer months for most products, with spatial errors typically larger in western regions, where complex terrain influences precipitation patterns.
- (3)
- Precipitation-geography analysis reveals that slope, aspect, and longitude significantly influence flood-season precipitation, with temporal variations throughout the season and different dominant factors across months. TPMFD best captures relationships between precipitation and geographical factors (monthly Spearman = 0.87), while CMA demonstrates better accuracy in overall spatial patterns (lowest OLS MSE) but poorer seasonal variation representation (Spearman = 0.35). ERA5-Land and MSWEP show limitations in accurately representing precipitation’s spatial heterogeneity.
Author Contributions
Funding
Data Availability Statement
Conflicts of Interest
References
- Yao, T.-D.; Bolch, T.; Chen, D.; Gao, J.; Immerzeel, W.W.; Piao, S.; Su, F.; Thompson, L.G.; Wada, Y.; Wang, L.; et al. The imbalance of the Asian water tower. Nat. Rev. Earth Environ. 2022, 3, 618–632. [Google Scholar] [CrossRef]
- Hagg, W.; Braun, L.N.; Kuhn, M.; Nesgaard, T.I. Modelling of hydrological response to climate change in glacierized Central Asian catchments. J. Hydrol. 2007, 332, 40–53. [Google Scholar] [CrossRef]
- Bolch, T.; Kulkarni, A.V.; Kb, A.; Huggel, C.; Stoffel, M.J.S. The State and Fate of Himalayan Glaciers. Science 2012, 336, 310–314. [Google Scholar] [CrossRef] [PubMed]
- Nepal, S.; Shrestha, A.B. Impact of climate change on the hydrological regime of the Indus, Ganges and Brahmaputra river basins: A review of the literature. Int. J. Water Resour. Dev. 2015, 31, 201–218. [Google Scholar] [CrossRef]
- Liu, Z.; Yao, Z.; Huang, H.; Wu, S.; Liu, G. Land use and climate changes and their impacts on runoff in the yarlung zangbo river basin, China. Land Degrad. Dev. 2014, 25, 203–215. [Google Scholar] [CrossRef]
- Yong, B.; Qi, W.; Lu, D.; Lyu, Y.; Liao, A.; Wang, G.; Ren, L.; Zhang, J. Streamflow change of major rivers over the Tibetan Plateau during the last half century and its possible causes. Hydrol. Process. 2024, 38, e15066. [Google Scholar] [CrossRef]
- Ma, Q.; Zhang, C.; Wang, D.; Pang, Z. Summer Atmospheric Water Cycle under the Transition Influence of the Westerly and Summer Monsoon over the Yarlung Zangbo River Basin in the Southern Tibetan Plateau. Adv. Atmos. Sci. 2024, 41, 830–846. [Google Scholar] [CrossRef]
- Li, C.; Hao, J.; Zhang, G.; Fang, H.; Wang, Y.; Lu, H. Runoff variations affected by climate change and human activities in Yarlung Zangbo River, southeastern Tibetan Plateau. Catena 2023, 230, 107184. [Google Scholar] [CrossRef]
- Yang, C.; Chi, Q.; Zhou, S.; Wu, P.; Danzeng, L.; Sun, Y. Interannual variation of midsummer precipitation in the middle reaches of Yarlung Zangbo River and its possible mechanisms. Int. J. Climatol. 2023, 43, 4619–4630. [Google Scholar] [CrossRef]
- Zhang, Y.; Zhang, Z.; Ma, P.; Pan, K.; Zha, D.; Chen, D.; Shen, C.; Liang, A. Wind regime features and their impacts on the middle reaches of the Yarlung Zangbo River on the Tibetan Plateau, China. J. Arid Land 2023, 15, 1174–1195. [Google Scholar] [CrossRef]
- Zhu, L.; Deng, Y.; Bai, G.; Tan, Y.; Tuo, Y.; An, R.; Wang, X.; Chen, M. Runoff Characteristics and Their Response to Meteorological Condition in the Yarlung Zangbo River Basin: Spatial Heterogeneity Due to the Glacier Coverage Difference. Remote Sens. 2024, 16, 4646. [Google Scholar] [CrossRef]
- Li, H.; Liu, L.; Shan, B.; Xu, Z.; Niu, Q.; Cheng, L.; Liu, X.; Xu, Z. Spatiotemporal Variation of Drought and Associated Multi-Scale Response to Climate Change over the Yarlung Zangbo River Basin of Qinghai-Tibet Plateau, China. Remote Sens. 2019, 11, 1596. [Google Scholar] [CrossRef]
- Li, J.J.; Lu, C.S.; Chen, J.H.; Zhou, X.; Yang, K.; Li, J.; Wu, X.Q.; Xu, X.Q.; Wu, S.Y.; Hu, R.; et al. The influence of complex terrain on cloud and precipitation on the foot and slope of the southeastern Tibetan Plateau. Clim. Dyn. 2024, 62, 3143–3163. [Google Scholar] [CrossRef]
- Maussion, F.; Scherer, D.; Mölg, T.; Collier, E.; Curio, J.; Finkelnburg, R. Precipitation Seasonality and Variability over the Tibetan Plateau as Resolved by the High Asia Reanalysis. J. Clim. 2014, 27, 1910–1927. [Google Scholar] [CrossRef]
- Zhang, T.; Yin, Y.; Li, B.; Gao, Y.; Wang, M. Characteristics and dynamic analysis of the October 2018 long-runout disaster chains in the Yarlung Zangbo River downstream, Tibet, China. Nat. Hazards 2022, 113, 1563–1582. [Google Scholar] [CrossRef]
- Zhang, T.; Li, B.; Gao, Y.; Gao, H.; Yin, Y. Massive glacier-related geohazard chains and dynamics analysis at the Yarlung Zangbo River downstream of southeastern Tibetan Plateau. Bull. Eng. Geol. Env. 2023, 82, 426. [Google Scholar] [CrossRef]
- An, B.S.; Wang, W.C.; Yang, W.; Wu, G.J.; Guo, Y.H.; Zhu, H.F.; Gao, Y.; Bai, L.; Zhang, F.; Zeng, C.; et al. Process, mechanisms, and early warning of glacier collapse-induced river blocking disasters in the Yarlung Tsangpo Grand Canyon, southeastern Tibetan Plateau. Sci. Total Environ. 2022, 816, 151652. [Google Scholar] [CrossRef]
- Zhang, M.Z.; Xing, A.G.; Li, K.Z.; Zhuang, Y.; Chang, W.B.; Liu, Y.W. Debris flows in Lebai gully along the Yarlung Tsangpo River in Tibet: Characterization, causes, and dynamic prediction of potential debris flows. Environ. Earth Sci. 2023, 82, 25. [Google Scholar] [CrossRef]
- Li, W.-l.; Zhao, B.; Xu, Q.; Scaringi, G.; Lu, H.; Huang, R.-q. More frequent glacier-rock avalanches in Sedongpu gully are blocking the Yarlung Zangbo River in eastern Tibet. Landslides 2022, 19, 589–601. [Google Scholar] [CrossRef]
- Bao, Y.; Su, L.-J.; Chen, J.; Zhang, C.; Zhao, B.; Zhang, W.; Zhang, J.; Hu, B.-l.; Zhang, X. Numerical investigation of debris flow–structure interactions in the Yarlung Zangbo River valley, north Himalaya, with a novel integrated approach considering structural damage. Acta Geotech. 2023, 18, 5859–5881. [Google Scholar] [CrossRef]
- Jia, H.; Chen, F.; Pan, D. Disaster Chain Analysis of Avalanche and Landslide and the River Blocking Dam of the Yarlung Zangbo River in Milin County of Tibet on 17 and 29 October 2018. Environ. Res. Public Health 2019, 16, 4707. [Google Scholar] [CrossRef] [PubMed]
- Chen, X.; Guan, T.S.; Zhang, J.Y.; Liu, Y.L.; Jin, J.L.; Liu, C.S.; Wang, G.Q.; Bao, Z.X. Identifying and Predicting the Responses of Multi-Altitude Vegetation to Climate Change in the Alpine Zone. Forests 2024, 15, 308. [Google Scholar] [CrossRef]
- Molnar, P.; England, P.; Martinod, J. Mantle dynamics, uplift of the tibetan plateau, and the indian monsoon. Rev. Geophys. 1993, 31, 357–396. [Google Scholar] [CrossRef]
- Zhou, J.H.; Lu, H.; Yang, K. Comparison of the Winter Precipitation Products over the Tibetan Plateau. Proceedings of 2019 Ieee International Geoscience and Remote Sensing Symposium (Igarss 2019), Yokohama, Japan, 28 July–2 August 2019; pp. 7571–7574. [Google Scholar]
- Yang, L.U.; Sheng-Tian, Y.; Ming-Yong, C.; Qiu-Wen, Z.; Guo-Tao, D. The Applicability Analysis of TRMM Precipitation Data in the Yarlung Zangbo River Basin. J. Nat. Resour. 2013, 28, 1414–1425. [Google Scholar]
- Liu, X.W.; Li, Y.L.; Wang, L.; Gong, J.F.; Sheng, Y.H.; Li, Z.J. The Analysis of Hydrometeorological Characteristics in the Yarlung Tsangpo River Basin. Water 2025, 17, 344. [Google Scholar] [CrossRef]
- Wu, Y.Y.; Fang, H.W.; He, G.J.; Huang, L.; Wang, J.Y. Climate-driven changes in hydrological and hydrodynamic responses in the Yarlung Tsangpo River. J. Hydrol. 2021, 598, 126267. [Google Scholar] [CrossRef]
- Tang, G.; Clark, M.P.; Newman, A.J.; Wood, A.W.; Whitfield, P.H. SCDNA: A serially complete precipitation and temperature dataset for North America from 1979 to 2018. Earth Syst. Sci. Data 2020, 12, 2381–2409. [Google Scholar] [CrossRef]
- Sun, H.; Su, F. Evaluation of multiple precipitation datasets and their potential utilities in hydrologic modeling over the Yarlung Zangbo River Basin. Prog. Geogr. 2020, 39, 1126–1139. [Google Scholar] [CrossRef]
- Huang, R.; Yong, B.; Huang, F.; Wu, H.; Shen, Z.; Qian, D. A comprehensive investigation of three long-term precipitation datasets: Which performs better in the Yellow River basin? Int. J. Climatol. 2024, 44, 1302–1325. [Google Scholar] [CrossRef]
- Du, J.; Yu, X.; Zhou, L.; Ren, Y.; Ao, T. Precipitation Characteristics across the Three River Headwaters Region of the Tibetan Plateau: A Comparison between Multiple Datasets. Remote Sens. 2023, 15, 2352. [Google Scholar] [CrossRef]
- Ma, Y.; Yang, Y.; Han, Z.; Tang, G.; Hong, Y. Comprehensive evaluation of Ensemble Multi-Satellite Precipitation Dataset using the Dynamic Bayesian Model Averaging scheme over the Tibetan plateau. J. Hydrol. 2018, 556, 634–644. [Google Scholar] [CrossRef]
- Wang, N.; Liu, W.; Sun, F.; Yao, Z.; Wang, H.; Liu, W. Evaluating satellite-based and reanalysis precipitation datasets with gauge-observed data and hydrological modeling in the Xihe River Basin, China. Atmos. Res. 2020, 234, 104746. [Google Scholar] [CrossRef]
- Beck, H.E.; Wood, E.F.; Pan, M.; Fisher, C.K.; Miralles, D.G.; Dijk, A.I.J.M.V.; Mcvicar, T.R.; Adler, R.F. MSWEP V2 Global 3-Hourly 0.1° Precipitation: Methodology and Quantitative Assessment. Bull. Amer. Meteor. Soc. 2019, 100, 473–500. [Google Scholar] [CrossRef]
- Wu, X.J.; Su, J.B.; Ren, W.W.; Lü, H.S.; Yuan, F. Statistical comparison and hydrological utility evaluation of ERA5-Land and IMERG precipitation products on the Tibetan Plateau. J. Hydrol. 2023, 620, 129384. [Google Scholar] [CrossRef]
- Ban, C.; Zuo, D.; Xu, Z.; Dong, Y.; Wang, J.; Da, W. Assessment on the Accuracy and Hydrological Simulation Effect of Multi-source Precipitation Products in the High Cold Alpine Region-Case Study in the Yarlung Zangbo River Basin and the Lhasa River Basin. J. Soil. Water Conserv. 2023, 37, 159–168.226. [Google Scholar] [CrossRef]
- Bianba, Z.; Yang, C.; Zhou, S.W.; Qian, Z.T.; Liu, S.S.; Li, K.; Yao, X.P. The Influence of the Eastern-Type and Western-Type Southern Branch Troughs on Precipitation in Winter and Its Structural Characteristics. Int. J. Clim. 2024, 45, e8720. [Google Scholar] [CrossRef]
- Liu, R.Y.; Su, J.B.; Zheng, D.H.; Lü, H.S.; Zhu, Y.H.; Pan, Y.; Shi, C.X.; Sun, S.; He, J. Comprehensive assessment of various meteorological forcing datasets on the Tibetan Plateau: Insights from independent observations and multivariate comparisons. J. Hydrol. 2025, 656, 133025. [Google Scholar] [CrossRef]
- Shaowei, N.; Jie, W.; Juliang, J.; Xiaoyan, X.; Yuliang, Z.; Fan, S.; Linlin, Z. Comprehensive evaluation of satellite-derived precipitation products considering spatial distribution difference of daily precipitation over eastern China. J. Hydrol. Reg. Stud. 2022, 44, 101242. [Google Scholar] [CrossRef]
- Wang, S.; Liu, J.; Wang, J.; Qiao, X.; Zhang, J.J. Evaluation of GPM IMERG V05B and TRMM 3B42V7 Precipitation Products over High Mountainous Tributaries in Lhasa with Dense Rain Gauges. Remote Sens. 2019, 11, 20. [Google Scholar] [CrossRef]
- Li, Y.Z.; Qin, X.; Liu, Y.S.; Jin, Z.Z.; Liu, J.; Wang, L.H.; Chen, J.Z. Evaluation of Long-Term and High-Resolution Gridded Precipitation and Temperature Products in the Qilian Mountains, Qinghai-Tibet Plateau. Front. Environ. Sci. 2022, 10, 906821. [Google Scholar] [CrossRef]
- Bai, L.; Wen, Y.Q.; Shi, C.X.; Yang, Y.F.; Zhang, F.; Wu, J.; Gu, J.X.; Pan, Y.; Sun, S.; Meng, J.Y. Which Precipitation Product Works Best in the Qinghai-Tibet Plateau, Multi-Source Blended Data, Global/Regional Reanalysis Data, or Satellite Retrieved Precipitation Data? Remote Sens. 2020, 12, 683. [Google Scholar] [CrossRef]
- Zhang, C.; Tang, Q.; Chen, D.; Li, L.; Cui, H.J. Tracing changes in atmospheric moisture supply to the drying Southwest China. Atmos. Chem. 2017, 17, 10383–10393. [Google Scholar] [CrossRef]
- Chen, L.; Ji, X.; Xu, Z.; Qin, P.; Yang, C.; Yan, S.; Sun, C.; Zheng, Y.; Zhang, Y. Comparison of CMIP5 and CMIP6 models for temperature and precipitation simulation over the Yarlung Tsangpo-Brahmaputra River Basin. J. Water Clim. Change 2024, 15, 3450–3471. [Google Scholar] [CrossRef]
- Rao, P.; Wang, F.; Yuan, X.; Liu, Y.; Jiao, Y. Evaluation and comparison of 11 sets of gridded precipitation products over the Qinghai-Tibet Plateau. Atmos. Res. 2024, 302, 107315. [Google Scholar] [CrossRef]
- Hao, D.; Bisht, G.; Gu, Y.; Leung, L.R. Regional and Teleconnected Impacts of Solar Radiation-Topography Interaction Over the Tibetan Plateau. Geophys. Res. Lett. 2023, 50, e2023GL106293. [Google Scholar] [CrossRef]
- Chen, B.; Zhang, W.; Yang, S.; Xu, X. Identifying and contrasting the sources of the water vapor reaching the subregions of the Tibetan Plateau during the wet season. Clim. Dyn. 2019, 53, 6891–6907. [Google Scholar] [CrossRef]
- Li, Y.; Su, F.; Tang, Q.; Gao, H.; Yan, D.; Peng, H.; Xiao, S. Contributions of moisture sources to precipitation in the major drainage basins in the Tibetan Plateau. Sci. China Earth Sci. 2022, 65, 1088–1103. [Google Scholar] [CrossRef]
- Huang, W.; Qiu, T.; Yang, Z.; Lin, D.; Wright, J.S.; Wang, B.; He, X. On the Formation Mechanism for Wintertime Extreme Precipitation Events Over the Southeastern Tibetan Plateau. J. Geophys. Res. Atmos. 2018, 123, 12692–12714. [Google Scholar] [CrossRef]
- Yuan, X.; Yang, K.; Lu, H.; Wang, Y.; Ma, X. Impacts of moisture transport through and over the Yarlung Tsangpo Grand Canyon on precipitation in the eastern Tibetan Plateau. Atmos. Res. 2023, 282, 106533. [Google Scholar] [CrossRef]
- Pan, C.; Zhu, B.; Gao, J.; Kang, H.; Zhu, T. Quantitative identification of moisture sources over the Tibetan Plateau and the relationship between thermal forcing and moisture transport. Clim. Dyn. 2019, 52, 181–196. [Google Scholar] [CrossRef]
- Xu, Y.; Gao, Y. Quantification of Evaporative Sources of Precipitation and Its Changes in the Southeastern Tibetan Plateau and Middle Yangtze River Basin. Atmosphere 2019, 10, 428. [Google Scholar] [CrossRef]
- Mazzoglio, P.; Ilaria, B.; Claps, P. A local regression approach to analyze the orographic effect on the spatial variability of sub-daily rainfall annual maxima. Geomat. Nat. Hazards Risk 2023, 14, 2205000. [Google Scholar] [CrossRef]
- Zhang, Y.; LIU, C.; LYU, J. Spatio-temporal variation of precipitation in the Yarlung Zangbo river basin. Acta Geogr. Sin. 2022, 77, 603–618. [Google Scholar] [CrossRef]
- Acosta, R.P.; Huber, M. Competing Topographic Mechanisms for the Summer Indo-Asian Monsoon. Geophys. Res. Lett. 2020, 47, e2019GL085112. [Google Scholar] [CrossRef]
- Xu, R.; Tian, F.Q.; Yang, L.; Hu, H.C.; Lu, H.; Hou, A.Z. Ground validation of GPM IMERG and TRMM 3B42V7 rainfall products over southern Tibetan Plateau based on a high-density rain gauge network. Geophys. Res. Atmos. 2017, 122, 910–924. [Google Scholar] [CrossRef]
- Chen, D.J. Assessment of past, present and future environmental changes on the Tibetan Plateau. Chin. Sci. Bull. 2015, 60, 3025–3035. [Google Scholar] [CrossRef]
- Zhang, W.; Zhou, T.; Zhang, L.; Zou, L. Future Intensification of the Water Cycle with an Enhanced Annual Cycle over Global Land Monsoon Regions. Climate 2019, 32, 5437–5452. [Google Scholar] [CrossRef]
- Immerzeel, W.W.; van Beek, L.P.H.; Bierkens, M.F.P. Climate Change Will Affect the Asian Water Towers. Science 2010, 328, 1382–1385. [Google Scholar] [CrossRef]
- Yang, K.; Wu, H.; Qin, J.; Lin, C.; Tang, W.; Chen, Y. Recent climate changes over the Tibetan Plateau and their impacts on energy and water cycle: A review. Glob. Planet. Change 2014, 112, 79–91. [Google Scholar] [CrossRef]
- Yao, T.; Thompson, L.G.; Mosbrugger, V.; Zhang, F.; Ma, Y.; Luo, T.; Xu, B.; Yang, X.; Joswiak, D.R.; Wang, W.; et al. Third Pole Environment (TPE). Environ. Dev. 2012, 3, 52–64. [Google Scholar] [CrossRef]
- Liu, X.; Chen, B. Climatic warming in the Tibetan Plateau during recent decades. Int. J. Climatol. 2000, 20, 1729–1742. [Google Scholar] [CrossRef]
- Su, F.; Zhang, L.; Ou, T.; Chen, D.; Yao, T.; Tong, K.; Qi, Y. Hydrological response to future climate changes for the major upstream river basins in the Tibetan Plateau. Glob. Planet. Change 2016, 136, 82–95. [Google Scholar] [CrossRef]
- Wang, B.; Bao, Q.; Hoskins, B.; Wu, G.; Liu, Y. Tibetan Plateau warming and precipitation changes in East Asia. Geophys. Res. Lett. 2008, 35, L14702. [Google Scholar] [CrossRef]
- Muñoz-Sabater, J.; Dutra, E.; Agustí-Panareda, A.; Albergel, C.; Arduini, G.; Balsamo, G.; Boussetta, S.; Choulga, M.; Harrigan, S.; Hersbach, H.; et al. ERA5-Land: A state-of-the-art global reanalysis dataset for land applications. Earth Syst. Sci. Data 2021, 13, 4349–4383. [Google Scholar] [CrossRef]
- CMA. China’s First Generation of Global Land Surface Reanalysis Product (CMA-RA/Land)-Monthly Product; National Institute of Metrology: Beijing, China, 2019. [Google Scholar] [CrossRef]
- He, J.; Yang, K.; Tang, W.; Lu, H.; Qin, J.; Chen, Y.; Li, X. The first high-resolution meteorological forcing dataset for land process studies over China. Sci. Data 2020, 7, 25. [Google Scholar] [CrossRef]
- Jiang, Y.; Tang, W.; Yang, K.; He, J.; Shao, C.; Zhou, X.; Lu, H.; Chen, Y.; Li, X.; Shi, J. Development of a high-resolution near-surface meteorological forcing dataset for the Third Pole region. Sci. China Earth Sci. 2025, 68, 1274–1290. [Google Scholar] [CrossRef]
- Jiang, Y.; Yang, K.; Qi, Y.; Zhou, X.; He, J.; Lu, H.; Li, X.; Chen, Y.; Li, X.; Zhou, B.-R.; et al. TPHiPr: A long-term (1979–2020) high-accuracy precipitation dataset (1∕30°, daily) for the Third Pole region based on high-resolution atmospheric modeling and dense observations. Earth Syst. Sci. Data 2023, 15, 621–638. [Google Scholar] [CrossRef]
- Yang, K.; Jiang, Y.; Tang, W.; He, J.; Shao, C.; Zhou, X.; Lu, H.; Chen, Y.; Li, X.; Shi, J. A High-Resolution Near-Surface Meteorological Forcing Dataset for the Third Pole Region (TPMFD, 1979–2023); National Tibetan Plateau Data Center: Beijing, China, 2025. [Google Scholar] [CrossRef]
- Farr, T.G.; Rosen, P.A.; Caro, E.; Crippen, R.; Duren, R.; Hensley, S.; Kobrick, M.; Paller, M.; Rodriguez, E.; Roth, L.; et al. The Shuttle Radar Topography Mission. Rev. Geophys. 2007, 45, RG2004. [Google Scholar] [CrossRef]
- Sun, Q.; Miao, C.; Duan, Q.; Ashouri, H.; Sorooshian, S.; Hsu, K.-L. A Review of Global Precipitation Data Sets: Data Sources, Estimation, and Intercomparisons. Rev. Geophys. 2017, 56, 79–107. [Google Scholar] [CrossRef]
- Derin, Y.; Yilmaz, K.K. Evaluation of Multiple Satellite-Based Precipitation Products over Complex Topography. J. Hydrometeorol. 2014, 15, 1498–1516. [Google Scholar] [CrossRef]
- Spreen, W.C. A determination of the effect of topography upon precipitation. Eos Trans. Am. Geophys. Union 1947, 28, 285–290. [Google Scholar] [CrossRef]
- Panday, P.K.; Frey, K.E.; Ghimire, B. Detection of the timing and duration of snowmelt in the Hindu Kush-Himalaya using QuikSCAT, 2000–2008. Environ. Res. Lett. 2011, 6, 024007. [Google Scholar] [CrossRef]
- Palash, W.; Bajracharya, S.R.; Shrestha, A.B.; Wahid, S.; Hossain, M.S.; Mogumder, T.K.; Mazumder, L.C. Climate Change Impacts on the Hydrology of the Brahmaputra River Basin. Climate 2023, 11, 18. [Google Scholar] [CrossRef]
- Beck, H.E.; Vergopolan, N.; Pan, M.; Levizzani, V.; Dijk, A.I.J.M.v.; Weedon, G.P.; Brocca, L.L.; Pappenberger, F.; Huffman, G.J.; Wood, E.F. Global-Scale Evaluation of 22 Precipitation Datasets Using Gauge Observations and Hydrological Modeling. Adv. Glob. Change Res. 2017, 21, 6201–6217. [Google Scholar] [CrossRef]
- Shen, Y.; Zhao, P.; Pan, Y.; Yu, J. A high spatiotemporal gauge-satellite merged precipitation analysis over China. J. Geophys. Res. Atmos. 2014, 119, 3068–3075. [Google Scholar] [CrossRef]
- Ma, Y.; Tang, G.; Long, D.; Yong, B.; Zhong, L.; Wan, W.; Hong, Y. Similarity and Error Intercomparison of the GPM and Its Predecessor-TRMM Multisatellite Precipitation Analysis Using the Best Available Hourly Gauge Network over the Tibetan Plateau. Remote. Sens. 2016, 8, 569. [Google Scholar] [CrossRef]
- Tang, G.; Clark, M.P.; Papalexiou, S.M.; Ma, Z.; Hong, Y. Have satellite precipitation products improved over last two decades? A comprehensive comparison of GPM IMERG with nine satellite and reanalysis datasets. Remote Sens. Environ. 2020, 240, 111697. [Google Scholar] [CrossRef]
- Lavers, D.A.; Simmons, A.; Vamborg, F.; Rodwell, M.J. An evaluation of ERA5 precipitation for climate monitoring. Q. J. R. Meteorol. Soc. 2022, 148, 3152–3165. [Google Scholar] [CrossRef]
- Fallah, A.; Rakhshandehroo, G.R.; Berg, P.O.S.; Orth, R. Evaluation of precipitation datasets against local observations in southwestern Iran. Int. J. Clim. 2020, 40, 4102–4116. [Google Scholar] [CrossRef]
- Tong, K.; Su, F.; Yang, D.; Hao, Z. Evaluation ofsatellite precipitation retrievals and their potential utilities in hydrologic modeling over the Tibetan Plateau. J. Hydrol. 2014, 519, 423–437. [Google Scholar] [CrossRef]
- Baez-Villanueva, O.M.; Zambrano-Bigiarini, M.; Beck, H.E.; McNamara, I.; Ribbe, L.; Nauditt, A.; Birkel, C.; Verbist, K.; Giraldo-Osorio, J.D.; Xuan Thinh, N. RF-MEP: A novel Random Forest method for merging gridded precipitation products and ground-based measurements. Remote Sens. Environ. 2020, 239, 111606. [Google Scholar] [CrossRef]
- Herrera, S.; Cardoso, R.M.; Soares, P.M.M.; Espírito-Santo, F.; Viterbo, P.; Gutiérrez, J.M. Iberia01: A new gridded dataset of daily precipitation and temperatures over Iberia. Earth Syst. Sci. Data 2019, 11, 1947–1956. [Google Scholar] [CrossRef]
- Houze, R. A, Jr. Orographic effects on precipitating clouds. Rev. Geophys. 2012, 50, RG1001. [Google Scholar] [CrossRef]
- Bookhagen, B.; Burbank, D.W. Towards a complete Himalayan hydrological budget: The spatiotemporal distribution of 1 snowmelt and rainfall and their impact on river discharge. J. Geophys. Res. 2010, 115, F03019. [Google Scholar] [CrossRef]
- Curio, J.; Maussion, F.; Scherer, D. A 12-year high-resolution climatology of atmospheric water transport over the Tibetan Plateau. Earth Syst. Dyn. 2014, 6, 109–124. [Google Scholar] [CrossRef]
- Immerzeel, W.W.; Wanders, N.; Lutz, A.F.; Shea, J.M.; Bierkens, M.F.P. Reconciling high-altitude precipitation in the upper Indus basin with glacier mass balances and runoff. Hydrol. Earth Syst. Sci. 2015, 19, 4673–4687. [Google Scholar] [CrossRef]
- Palazzi, E.; von Hardenberg, J.; Provenzale, A. Precipitation in the Hindu-Kush Karakoram Himalaya: Observations and future scenarios. Geophys. Res. Atmos. 2013, 118, 85–100. [Google Scholar] [CrossRef]
- Teutschbein, C.; Seibert, J. Bias correction of regional climate model simulations for hydrological climate-change impact studies: Review and evaluation of different methods. J. Hydrol. 2012, 456–457, 12–29. [Google Scholar] [CrossRef]
- Prein, A.F.; Langhans, W.; Fosser, G.; Ferrone, A.; Ban, N.; Goergen, K.; Keller, M.; Tölle, M.; Gutjahr, O.; Feser, F.; et al. A review on regional convection-permitting climate modeling: Demonstrations, prospects, and challenges. Rev. Geophys. 2015, 53, 323–361. [Google Scholar] [CrossRef]
- Fiddes, J.; Aalstad, K.; Lehning, M. TopoCLIM: Rapid topography-based downscaling of regional climate model output in complex terrain v1.1. Geosci. Model Dev. Discuss. 2022, 15, 1753–1768. [Google Scholar] [CrossRef]
- Volosciuk, C.; Maraun, D.; Vrac, M.; Widmann, M. A combined statistical bias correction and stochastic downscaling method for precipitation. Hydrol. Earth Syst. Sci. 2017, 21, 1693–1719. [Google Scholar] [CrossRef]
- Baño-Medina, J.; Manzanas, R.; Gutiérrez, J.M. Configuration and intercomparison of deep learning neural models for statistical downscaling. Geosci. Model Dev. 2020, 13, 2109–2124. [Google Scholar] [CrossRef]


| Products | Temporal Resolution | Spatial Resolution | Temporal Coverage | Domain | Download Website |
|---|---|---|---|---|---|
| ERA5-Land | monthly | 0.1° × 0.1° | 1940–present | Global | https://cds.climate.copernicus.eu/datasets (accessed on 18 February 2025) |
| MSWEP V2 | 3-hourly | 0.1° × 0.1° | 1979–present | Global | https://www.gloh2o.org/mswep/ (accessed on 29 November 2024) |
| CMA-RA/Land | 3-hourly | 0.25° × 0.25° | 1979–2020 | Global | http://data.cma.cn/ (accessed on 9 December 2024) |
| TPMFD | 1-hourly, daily, monthly | 0.01° × 0.01° | 1979–2023 | Third Pole | https://www.tpdc.ac.cn/home (accessed on 7 July 2024) |
| Geographical Factors | Coef | p > |t| |
|---|---|---|
| Const | 2.748 × 10¹⁵ | 1.000 |
| Altitude | 0.0856 | 0.131 |
| Slope | −0.1676 | 0.000 |
| Aspect | −0.1486 | 0.002 |
| Latitude | −0.0793 | 0.128 |
| Longitude | −0.1576 | 0.018 |
| Terrain Undulation | 0.0061 | 0.899 |
| Openness | −0.0389 | 0.414 |
| Geographical Factors | ERA5-Land | MSWEP | CMA | TPMFD | Obs |
|---|---|---|---|---|---|
| Altitude | −0.0132 | −0.0256 | −0.0008 | 0.0228 | 0.0856 |
| Slope | −0.3782 | 0.5422 | −0.1344 | −1.3451 | −0.1676 |
| Aspect | 0.0281 | 0.0297 | 0.1014 | −0.1830 | −0.1486 |
| Latitude | −454.8824 | 84.1474 | −128.5879 | −248.4819 | −0.0793 |
| Longitude | 26.4383 | −119.2298 | −40.0767 | 84.9056 | −0.1576 |
| Terrain Undulation | −0.0035 | 0.0101 | 0.0002 | −0.0184 | 0.0061 |
| Openness | 0.8779 | −3.5020 | −12.8327 | 13.7749 | −0.0389 |
| Products | OLS MSE | OLS Spearman | Monthly Mean MSE | Monthly Mean Spearman |
|---|---|---|---|---|
| ERA5-Land | 29,650.59 | −0.07 | 0.04 | 0.60 |
| MSWEP | 3040.70 | −0.21 | 0.11 | −0.45 |
| CMA | 2610.25 | 0.25 | 0.03 | 0.35 |
| TPMFD | 9875.97 | 0.21 | 0.02 | 0.87 |
Disclaimer/Publisher’s Note: The statements, opinions and data contained in all publications are solely those of the individual author(s) and contributor(s) and not of MDPI and/or the editor(s). MDPI and/or the editor(s) disclaim responsibility for any injury to people or property resulting from any ideas, methods, instructions or products referred to in the content. |
© 2025 by the authors. Licensee MDPI, Basel, Switzerland. This article is an open access article distributed under the terms and conditions of the Creative Commons Attribution (CC BY) license (https://creativecommons.org/licenses/by/4.0/).
Share and Cite
Tan, A.; Li, M.; Liu, H.; Chen, L.; Wang, T.; Yang, B.; Wan, M.; Shi, Y. Evaluation of the Accuracy and Applicability of Reanalysis Precipitation Products in the Lower Yarlung Zangbo Basin. Remote Sens. 2025, 17, 2396. https://doi.org/10.3390/rs17142396
Tan A, Li M, Liu H, Chen L, Wang T, Yang B, Wan M, Shi Y. Evaluation of the Accuracy and Applicability of Reanalysis Precipitation Products in the Lower Yarlung Zangbo Basin. Remote Sensing. 2025; 17(14):2396. https://doi.org/10.3390/rs17142396
Chicago/Turabian StyleTan, Anqi, Ming Li, Heng Liu, Liangang Chen, Tao Wang, Binghui Yang, Min Wan, and Yong Shi. 2025. "Evaluation of the Accuracy and Applicability of Reanalysis Precipitation Products in the Lower Yarlung Zangbo Basin" Remote Sensing 17, no. 14: 2396. https://doi.org/10.3390/rs17142396
APA StyleTan, A., Li, M., Liu, H., Chen, L., Wang, T., Yang, B., Wan, M., & Shi, Y. (2025). Evaluation of the Accuracy and Applicability of Reanalysis Precipitation Products in the Lower Yarlung Zangbo Basin. Remote Sensing, 17(14), 2396. https://doi.org/10.3390/rs17142396