Abstract
This study investigates the linkage between the radar reflectivity slope and raindrop size distribution (DSD) in precipitation with bright bands through coordinated C-band/Ka-band radar and disdrometer observations in southern China. Precipitation is classified into three types based on the reflectivity slope (K-value) below the freezing level, revealing distinct microphysical regimes: Type 1 (K = 0 to −0.9) shows coalescence-dominated growth; Type 2 (|K| > 0.9) shows the balance between coalescence and evaporation/size sorting; and Type 3 (K = 0.9 to 0) demonstrates evaporation/size-sorting effects. Surface DSD analysis demonstrates distinct precipitation characteristics across classification types. Type 3 has the highest frequency of occurrence. A gradual decrease in the mean rain rates is observed from Type 1 to Type 3, with Type 3 exhibiting significantly lower rainfall intensities compared to Type 1. At equivalent rainfall rates, Type 2 exhibits unique microphysical signatures with larger mass-weighted mean diameters (Dm) compared to other types. These differences are due to Type 2 maintaining a high relative humidity above the freezing level (influencing initial Dm at bottom of melting layer) but experiencing limited Dm growth due to a dry warm rain layer and downdrafts. Type 1 shows opposite characteristics—a low initial Dm from the dry upper layers but maximum growth through the moist warm rain layer and updrafts. Type 3 features intermediate humidity throughout the column with updrafts and downdrafts coexisting in the warm rain layer, producing moderate growth.
1. Introduction
Raindrop size distribution (DSD) is a fundamental microphysical characteristic of precipitation that plays a crucial role in understanding rainfall formation processes [1] and improving quantitative precipitation estimation (QPE) accuracy [2,3]. Weather radar measures reflectivity (Z), but converting it to rainfall rate (R) requires the assumption of the DSD, usually through the Z-R relationship (Z = aRb) [4,5]. In addition, the R-Dm relationship affects the retrieval of precipitation parameters in the Global Precipitation Measurement (GPM) mission [6]. Ignoring these DSD variations can introduce large errors in radar QPE [7]. The vertical profile of radar reflectivity, particularly its slope characteristics, contains important information about precipitation’s microphysical processes during raindrop descent [8]. Liu and Zipser [9] explored the reasons behind different reflectivity slopes with TRMM observations. However, the linkage between reflectivity slope and the DSD remains insufficiently understood, limiting our ability to fully exploit radar observations for precipitation microphysics studies and QPE improvements.
Previous studies have established that the vertical gradient of radar reflectivity below the melting layer reflects microphysical processes, including coalescence, breakup, evaporation, and size sorting [3,8,10,11]. However, these studies have primarily focused on qualitative descriptions of microphysical processes, with limited quantitative analysis of how different reflectivity slopes correspond to distinct DSD characteristics. This knowledge gap is particularly significant because different slopes may represent distinct precipitation microphysical regimes, each requiring specific treatment in radar rainfall algorithms [12]. Moreover, the environmental controls (e.g., humidity, vertical air motion) on the radar reflectivity slope–DSD relationship remain poorly understood.
Recent advances in disdrometer technology and radar observations have enabled more detailed investigations of DSD variations, leading to a better understanding of the variation in DSD in profile [13,14,15,16]. In this study, we use coordinated C/Ka-band radars and disdrometer observations in southern China to comprehensively analyze the DSD characteristics associated with different radar reflectivity slopes in precipitation with bright bands. We address two key scientific questions:
- (1)
- How do DSD parameters (mass-weighted mean diameter (Dm), normalized concentration parameter (Nw), shape parameter (μ), and slope (λ)) vary among precipitation with different reflectivity slopes?
- (2)
- How do the factors affect these slope–DSD relationships?
Our analysis employs a classification scheme based on reflectivity slopes combined with detailed DSD measurements and environmental data. The findings will advance the understanding of precipitation microphysics and provide practical insights for improving radar QPE algorithms.
2. Materials and Methods
2.1. Materials
The datasets utilized in this study were obtained from C/Ka-band radars and a disdrometer located at the Longmen Meteorological Observatory (114.25°E, 23.783°N), southern China, as shown in Figure 1a. The instruments were operated with a distance between each other of less than 5 m. The data collection spanned the flood season (April to September) from 2019 to 2020. Additionally, ERA5 reanalysis data covering the same timeframe was incorporated into the study.

Figure 1.
The instruments are located at Longmen. (a) Longmen Meteorological Observatory. (b) C-band vertically pointing radar. (c) Ku/Ka-band vertically pointing radar system.
The disdrometer used in this study is an optical instrument designed to measure raindrop size and fall velocity at a 1 min temporal resolution [17]. The sedimentation particles are classified into 32 levels based on the equivalent volume diameter and sedimentation rate. The measurement ranges of raindrop diameter and falling velocity are 0.062 mm~24.5 mm and 0.05 m/s~20.8 m/s, respectively. To ensure data quality, the first two measurement channels were excluded due to their low signal-to-noise ratio. Additionally, raindrops larger than 8 mm in diameter were omitted, as such large droplets are rarely observed in natural rainfall [13]. Further filtering was applied to remove raindrops with fall velocities deviating by more than ±50% from their theoretical terminal velocity [18,19].
The C-band radar operates at 5.5 GHz and represents China’s first frequency-modulated continuous wave (FMCW) vertically pointing radar dedicated to cloud and precipitation studies [20]. With a vertical resolution of 30 m and a temporal resolution of 2 s, it provides high-resolution atmospheric profiling. The products include radar reflectivity, Doppler velocity, and Doppler spectral width, with available data requiring a signal-to-noise ratio (SNR) threshold of −24 dB. To align with disdrometer datasets, the radar products are temporally averaged to a 1 min resolution.
The Ka-band radar employs a vertically oriented solid-state design, operating at 33.44 GHz with a vertical resolution of 30 m. It features four automated scanning modes: boundary layer mode (M1), cirrus cloud mode (M2), precipitation observation mode (M3), and medium cloud mode (M4) [21]. The four observation modes are specifically designed for different atmospheric targets: M1 specializes in detecting low-altitude phenomena; M2 is optimized for high-altitude cirrus clouds with low reflectivity; M3 focuses on precipitation systems exhibiting extensive vertical coverage, strong reflectivity, and high vertical velocity; while M4 primarily targets stratocumulus and mixed-phase clouds. Each scan cycle lasts 2~9 s, and the merged M1–M4 data including radar reflectivity, Doppler velocity, and Doppler spectral width are also averaged to a 1 min temporal resolution in a linear scale.
ERA5, the fifth-generation global atmospheric reanalysis product developed by the European Centre for Medium-Range Weather Forecasts (ECMWF), combines satellite remote sensing, surface stations, radiosondes, and other observation platforms using an advanced 4D-Var data assimilation system [22]. This study employs ERA5 data with 137 vertical pressure levels, a 0.25° × 0.25° horizontal resolution, and a 1 h temporal resolution, focusing on its temperature and relative humidity. We interpolate the temperature and humidity profile data and match it to the ground-based observations (C- and Ka-band radars and disdrometer) [23].
2.2. Methods
In this paper, two steps are required to determine the precipitation in bright bands with different radar reflectivity slopes: first, detecting precipitation containing bright bands, and then calculating the radar reflectivity slope.
Battan [24] reported that precipitation particles exhibit distinct size sorting below the melting layer and particularly emphasized the necessity of accounting for variations in prevailing wind direction with altitude when using vertically pointing radar observations. Additionally, the slant of a precipitation trail can influence bright band detection. Therefore, we compute the profile along the trail to circumvent the slant of the precipitation trail [25,26,27]. Takeda et al. [26] proposed a method where the local maximum points at each altitude level in the time–height cross-section were connected to form a ridge line, while the trough line was defined by connecting points corresponding to local minima. The data along these ridge and trough lines were considered to represent precipitation particles following the same trail, as shown in Figure 2a. This methodology is based on the premise that prevailing winds do not alter the variation trends of radar reflectivity at a given altitude level, but merely cause temporal offsets.
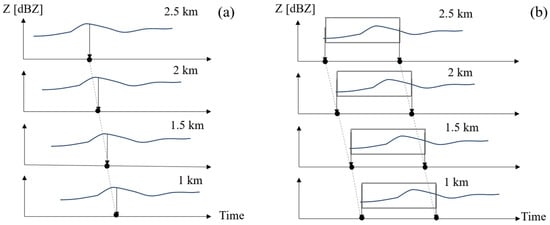
Figure 2.
The diagram shows the method for slant correction. (a) Ridge line is made by connecting points corresponding to maximum extreme values [26]. (b) Time shift and correction calculated using the correlation of radar reflectivity within 10 min.
Building upon this approach, we implemented a slant correction for the precipitation trail by using C-band radar reflectivity values over 10 min intervals near the surface, then temporally shifting this interval by ±5 min at altitude z, and finally, identifying the optimal match where the radar reflectivity at altitude z showed maximum correlation with the reflectivity near the surface. As shown in Figure 2b, after selecting the ground data interval, the black boxes at different heights represent the data most relevant to the near-ground data. The data in the boxes are considered to represent precipitation particles following the same trail, which allows for the slant correction of observations over the interval at different heights. This procedure effectively aligns the observed precipitation samples with their ground counterparts. An example is given in Figure 3. Figure 3a shows the original observations and Figure 3b shows the data after correcting the slant.
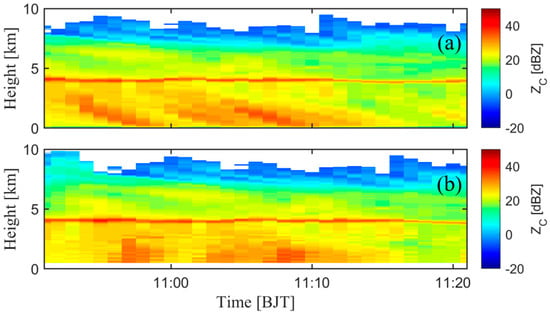
Figure 3.
An example of circumventing the slant of precipitation trail on 12 April 2019. (a) The original observations and (b) the result after correcting the slant.
After that, we use C-band radar reflectivity to identify the melting layer bright band when surface rainfall is detected by the disdrometer. During the flood season, the melting layer bright band of precipitation at Longmen ranges between 4~5.5 km. Within the melting layer height limits, the maximum radar reflectivity exhibits a difference greater than 4 dB compared to the reflectivity values at both 500 m above and below its corresponding height. The number of precipitation samples with bright bands is 11,545.
After identifying bright band, we classified different precipitation using the C-band reflectivity slope below the freezing level (K-value), which was derived from linear regression (H = KZ + b, H (km), Z (dBZ)) of the radar reflectivity profiles between 3.5 km in altitude and near-surface levels [9]. The variation in radar reflectivity below the melting layer does not always satisfy linear regression, so we only select samples where the correlation coefficient between the fitted curve and the original observation is greater than 0.8, numbering 3984. Based on the K-value, the precipitation with bright bands was categorized into three types: (1) K = 0~−0.9; (2) |K| > 0.9; and (3) K = 0.9~0, as shown in Figure 4. Figure 5 presents three typical cases of different precipitation types and the profile of mean reflectivity. This classification scheme effectively divides radar reflectivity into increasing, stabilizing, and decreasing types.
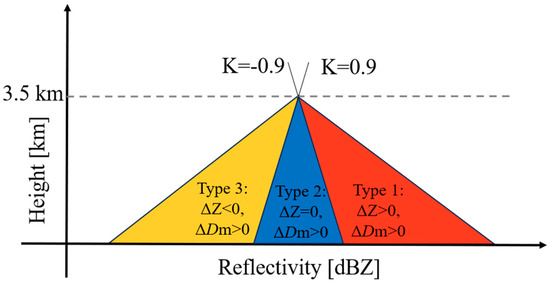
Figure 4.
Schematic showing the different reflectivity slopes and the precipitation type that would be assigned.
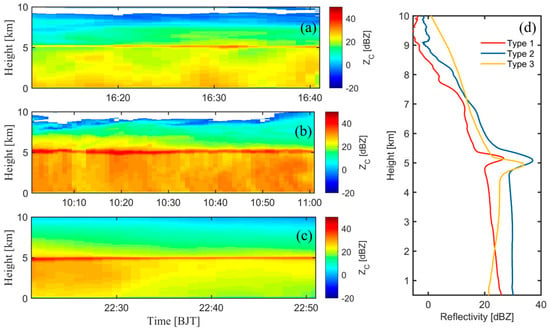
Figure 5.
Radar reflectivity observations of three types of precipitation cases: (a) Type 1 (2 August 2020); (b) Type 2 (2 August 2019); (c) Type 3 (16 August 2019). (d) The profile of average radar reflectivity.
DSD has often been described with a Gamma-normalized distribution [1], which can be expressed simultaneously as follows [28,29,30]:
where N0 is the intercept, Nw is the normalized concentration parameter, Dm is mass-weighted mean diameter, μ is shape parameter, and λ is the slope.
The nth order moment of the DSD is expressed as follows:
Dm, Nw, μ, and λ in surface can be calculated using the observations of the disdrometer as follows:
Building upon dual-frequency C-band and Ka-band radar observations, we implemented the Doppler velocity difference (DVD) technique to retrieve the profile of the DSD and vertical air motion velocity (Vair) [14]. The method operates under the assumption that the DSD follows a Gamma distribution, as shown in Equation (1). By presetting the parameter values, the corresponding radar observables can be calculated in advance. These precomputed values are organized into a lookup table. The actual measurement data can then be fed into this table to efficiently retrieve both DSD parameters and Vair.
Given Dm, μ, and Nw, the DSD radar reflectivity-weighted velocity spectral density SDSD(ν) can be calculated, as shown in Equation (4):
Here, |Kw|2 represents the dielectric constant of water droplets; σb(D) denotes the backscattering cross-section of raindrops; and νz is the terminal velocity of raindrops in still air, derived from empirical fits to Lhermitte’s observational data [31] (Equation (5)):
Since the terminal velocity of raindrops is influenced by air density, we implement a density correction term in which ρsurface and ρz are the air density at ground level and at altitude z, respectively. Consequently, radar reflectivity (ZDSD), mean Doppler velocity (), and velocity spectrum variance () can be quantitatively calculated using Equation (6).
The radar reflectivity is related to all three parameters of the Gamma distribution, while the mean Doppler velocity and velocity spectrum variance depend solely on Dm and μ. The Doppler velocity difference (DVD) between radar observations at wavelengths λ1 and λ2 (with λ1 > λ2) is given by:
Notably, the DVD is exclusively determined by Dm and μ. Figure 6a illustrates the estimated DVDC,Ka as a function of Dm, with the DSD shape parameter μ set to 0, 3, 6, and 9. For a fixed μ value, the magnitude of DVD increases with Dm. Once μ is determined, Dm can be derived from the DVD measurement. Figure 6b shows the as a function of DVDC,Ka, enabling μ to be determined. However, since a given DVDC,Ka value may correspond to two possible Dm values, Dm is retrieved only within the monotonic range of DVDC,Ka (for example, when μ = 0, the valid Dm range is 0.8 to 2.9 mm).
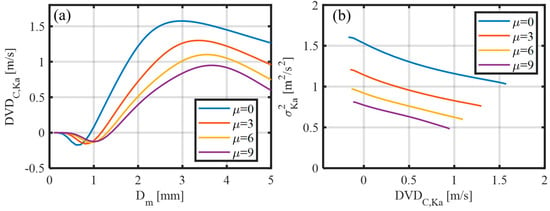
Figure 6.
(a) DVDC,Ka as a function of Dₘ and μ. (b) as a function of DVDC,Ka.
This characteristic enables the determination of Dm and μ through DVD and . Subsequently, the intercept parameter Nw can be derived, thereby completing the retrieval of the full raindrop size distribution. The specific procedure for using the lookup tables is as follows:
- (1).
- Retrieval of μ: Using the radar-measured DVD and Ka-band velocity spectrum variance , we first retrieve μ, as shown in Figure 6b.
- (2).
- (3).
- Calculation of Nw: With measured C-band radar reflectivity and known μ and Dm, Nw is computed using Equation (6).
- (4).
- Retrieval of Vair: For the vertically pointing radar, the measured mean Doppler velocity of the C-band radar () is the sum of and Vair. The is calculated using Equation (6) and subtracted from to isolate Vair.
3. Results
3.1. DSD Parameters in Surface
Figure 7 presents the cumulative distributions of rain rates and their occurrence frequencies for three precipitation types. Notably, Type 3 (characterized by decreasing radar reflectivity toward the surface) accounts for approximately 60% of cases, consistent with previous research findings [9,32]. There is a gradual decrease in mean rain rates from Type 1 to Type 3, with Type 3 exhibiting significantly lower rainfall intensities compared to Type 1. When radar reflectivity increases from the melting layer base to the surface (Type 1), both maximum and average rain rates are substantially enhanced. This analysis demonstrates that vertical reflectivity profiles serve as effective indicators of precipitation intensity characteristics.
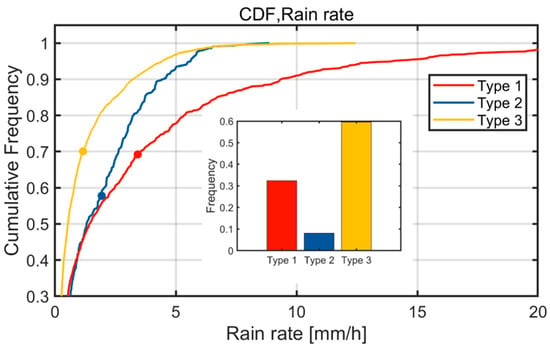
Figure 7.
Cumulative distribution of rain rate for the three types of precipitation and the mean rain rate. Where red, blue, and yellow represent Types 1–3, respectively. Points represent mean rain rate. The frequency of the three types of precipitation is also given.
Figure 8 compares Dm, Nw, and C-band radar reflectivity (Zc, simulated from DSD measurements) across the three types at equivalent rain rates. Because there are very few samples with a rain rate greater than 8 mm/h in Types 2–3, we only conduct a comparative study of precipitation below 8 mm/h. As can be seen from the figure, the samples of Type 2 present larger Dm for the same rain rate, and there are also some differences between Type 1 and Type 3. The differences among the three types are more pronounced when the rain rate is high. The simulated radar reflectivity variation with rain rate is consistent with Dm. Unlike Dm, Type 2 demonstrates minimal Nw under same rain rate.

Figure 8.
Variation in (a) Dm, (b) Nw, and (c) simulated C-band radar reflectivity (Zc) with rain rate.
The DSD in surface is governed by microphysical processes and the variability is determined not only by the climatic regime but also the specific precipitation type [33,34]. Many studies have thoroughly detailed why and how vertical motions and cloud microphysical processes differ during stratiform and convective precipitation, which lead to a characteristically different DSD in each precipitation type [35,36,37,38,39]. The retrieval of the DSD in GPM is also conducted based on the classification of stratiform and convective types. All of these studies only consider differences in the DSD by dividing precipitation into stratiform and convective. The results in Figure 8 demonstrate that varying radar reflectivity slopes lead to distinct differences in both the DSD and Z-R relationships.
Extensive observational studies [40,41] have demonstrated that the three parameters (N0, μ, and λ) of a Gamma DSD are not mutually independent. The μ–λ relationship reveals the intrinsic physical constraints among DSD parameters, which have been widely applied in polarimetric radar-based DSD retrieval. We present the scatter plots of μ–λ for three precipitation types and obtain the μ–λ relationship equation through least squares fitting, as shown in Figure 9. The results indicate that the μ–λ relationships exhibit significant differences among the three precipitation types. For a given λ value, Type 1 has the largest μ value than other types.
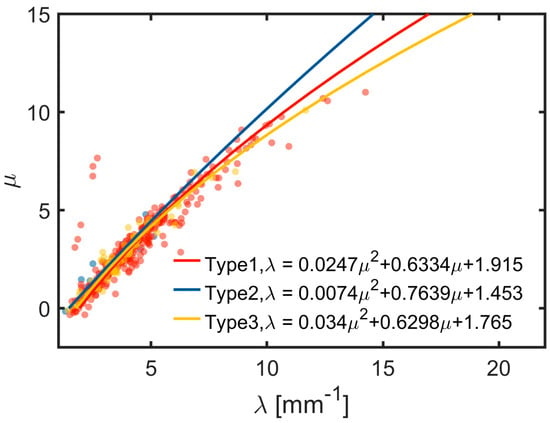
Figure 9.
The scatter plots of μ–λ relationships for the three precipitation types, with curves representing the fitted curves.
3.2. Profile of DSD Parameters and Vair
In Figure 10, the mean vertical profiles of Dm and Vair are presented for different precipitation types, with positive velocities indicating upward movement. The ΔDm is defined as the difference in Dm between the surface and the bottom of the melting layer (Dm at surface—Dm at bottom of melting layer (approximately 3.5 km)). The results show a consistent increase in Dm during raindrop descent across all precipitation types. Although Dm continues to increase throughout the fall for all three types of precipitation, Type 1 has the smallest Dm at the bottom of the melting layer but the largest growth. Type 2 precipitation has the largest Dm at all heights, with the smallest growth. Type 3’s Dm is intermediate at the bottom of the melting layer but has relatively small growth.
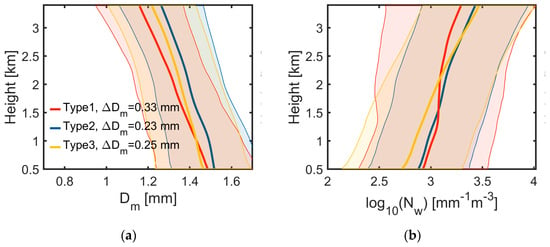
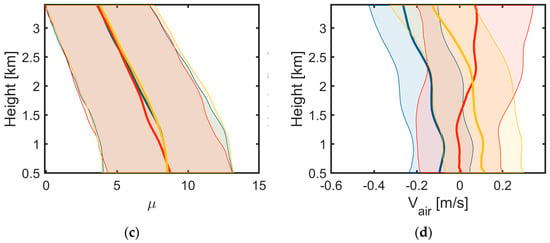
Figure 10.
Characteristic profiles of the mean (a) mass-weighted mean diameter (Dm, mm), (b) normalized concentration parameter (Nw, mm−1 m−3), (c) shape parameter (μ), and (d) vertical air motion velocity (Vair, m s−1). Velocity sign convention: positive = upward motion. The shaded regions indicate the standard deviation.
The variations in Dm (ΔDm) and radar reflectivity (ΔZ, Z at surface—Z at bottom of melting layer (approximately 3.5 km)) can reflect the microphysical processes of precipitation, such as coalescence, breakup, evaporation, and size sorting [11]. Coalescence processes produce positive trends in both Dm and Z (ΔDm > 0, ΔZ > 0), while evaporation and size sorting yield increasing Dm (ΔDm > 0) coupled with decreasing Z (ΔZ < 0). When breakup and coalescence reach equilibrium, the result shows decreasing Dm (ΔDm < 0) but increasing Z (ΔZ > 0). Pure breakup processes, however, lead to the simultaneous reduction in both parameters (ΔDm < 0, ΔZ < 0).
Table 1 summarizes ΔDm, ΔZ, and the dominant microphysical processes for the three types; the ΔDm and ΔZ are also shown in Figure 4. ΔDm is given by Figure 10, and ΔZ is determined by the precipitation type, as shown in Figure 4. Here, we indicate that ΔZ = 0 for Type 2 means that the radar reflectivity change for Type 2 is relatively small. The results demonstrate distinct microphysical signatures across precipitation types: Type 1 shows simultaneous increases in both Dm and Z, indicating coalescence-dominated processes; Type 2 displays a stable Z with markedly increasing Dm, characteristic of combined evaporation, size-sorting, and coalescence effects; while Type 3 exhibits increasing Dm coupled with decreasing Z, revealing dominant evaporation and size-sorting mechanisms.

Table 1.
ΔDm, ΔZ, and the dominant microphysical processes for the three types.
During precipitation descent, Nw decreases for all three precipitation types, with Type 3 exhibiting the most significant reduction and Type 1 the least. This evolution of Dm and Nw explains the different changes in radar reflectivity. The reflectivity variations are characterized as follows: Type 1 shows minimal Nw reduction but a maximum increase in Dm, resulting in reflectivity increasing toward the surface; Type 2 displays a moderate Nw decrease with the smallest Dm growth, maintaining stable reflectivity profiles; and Type 3 demonstrates the most substantial Nw reduction coupled with a moderate Dm increase, leading to reflectivity decreasing toward the surface. This systematic behavior highlights the competing effects between particle size growth (Dm) and concentration reduction (Nw) in determining the evolution of radar reflectivity during precipitation descent. The μ increases for all three precipitation types during raindrop descent, showing no significant differences.
The vertical air motion of the three types shows marked differences. Type 1 has a persistent updraft, which greatly extends the residence time of raindrops in the warm rain layer. Type 2 has a persistent downdraft, which considerably shortens the residence time of raindrops in the warm rain layer. Type 3 has the coexistence of an updraft near the ground and a downdraft for some distance in the air.
3.3. Difference in Environmental Conditions
Figure 11 displays the vertical profiles of temperature and relative humidity. The three types of precipitation show no significant temperature differences. Above the melting layer (approximately 4 km altitude), distinct relative humidity variations among precipitation types exhibit a consistent ranking with Dm at the bottom of the melting layer, suggesting a correlation between upper-level humidity conditions and hydrometeor size characteristics.
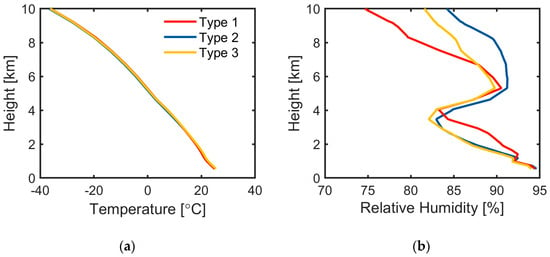
Figure 11.
(a) Temperature and (b) relative humidity profiles.
Below the melting layer, the relative humidity is highest in Type 1, with Types 2 and 3 showing comparable values. Combined with the air motion velocity, it can be seen that there is a weak updraft for Type 1 precipitation and that it has the largest relative humidity, and therefore a larger increase in its Dm. Type 3 has some subsidence airflow during the warm rain process and its relative humidity is smaller than Type 1, so its Dm growth is small. Type 2 has downdrafts during warm rain and has minimal relative humidity, so its Dm growth is minimal. However, the initial Dm is largest for Type 2, which results in a maximum Dm over the entire contour, which demonstrates the important influence of the initial DSD on DSD evolution. This is in agreement with a previous study [8].
4. Discussion
The analysis of radar reflectivity variations among different precipitation types demonstrates that Type 1, characterized by the highest relative humidity and strongest updrafts, shows radar reflectivity enhancement. Although Type 2 and Type 3 share comparable environmental temperature and relative humidity conditions (with Type 2 exhibiting more intense downdrafts), they display markedly different microphysical evolution patterns. Notably, while Type 3 experiences greater growth in its Dm compared to Type 2, their radar reflectivity responses differ substantially: Type 2 maintains relatively stable reflectivity values, whereas Type 3 shows a pronounced reflectivity reduction. This discrepancy likely originates from the initial DSD of Type 2 featuring larger Dm values. These findings further substantiate the crucial role of the initial DSD in governing precipitation evolution.
Based on the observations of precipitation radar reflectivity variations, we selected a threshold of ±0.9 to classify three types of precipitation. However, the threshold was not fixed. In addition to ±0.9, we also chose ±0.8 and ±1.0. The frequencies of the classified samples for these three threshold sets are shown in Table 2. The frequencies of different precipitation types vary with different thresholds. While the parameters for all three types change accordingly, the conclusions regarding the relationship between precipitation types and the DSD as well as the formation mechanisms remain consistent. Therefore, other thresholds can also be selected, as long as they can divide precipitation into three distinct categories based on the radar reflectivity profile (radar reflectivity increases significantly toward the ground, decreases significantly, or remains approximately stable).

Table 2.
Frequency of three types with different thresholds.
Liu and Zipser [9] also investigated the causes of different radar reflectivity slopes. However, our study focuses specifically on precipitation with bright bands, enabling us to obtain more comprehensive data including the profiles of the DSD parameters and the vertical air motion velocity. This approach provides a more complete understanding of the mechanisms behind various reflectivity slopes. While our single-point observations may limit the generalizability across different regions, they offer higher measurement accuracy. For instance, Liu and Zipser’s method of calculating radar reflectivity slopes [9] by fitting reflectivity data from a 4 km altitude to the ground may not be universally applicable to all geographic locations. In contrast, our targeted observations yield more precise characterizations of microphysical processes. Compared to TRMM, GPM observations demonstrate distinct advantages by providing comprehensive measurements of raindrop size distribution parameters and melting layer characteristics. These enhanced capabilities will enable us to systematically investigate the underlying mechanisms responsible for different radar reflectivity slopes in future studies.
5. Conclusions
This study demonstrates the relationship between the raindrop size distribution (DSD) in precipitation with bright bands and the radar reflectivity slope (K-value) below the freezing level through a comprehensive analysis of dual-frequency radar and disdrometer observations in Longmen, southern China, yielding the following results:
The three-category classification based on reflectivity slope effectively captures distinct microphysical regimes, with Type 1 showing coalescence-dominated growth, Type 2 exhibiting process equilibrium, and Type 3 demonstrating evaporation/size-sorting effects.
Type 3 has the highest frequency of occurrence. There is a gradual decrease in mean rain rates from Type 1 to Type 3, with Type 3 exhibiting significantly lower rainfall intensities compared to Type 1. At equivalent rainfall rates, Type 2 exhibits unique microphysical signatures with a larger mass-weighted mean diameter (Dm) compared to other types.
Relative humidity above freezing level may affect the initial Dm at the bottom of the melting layer. Type 1, characterized by the highest relative humidity and strongest updrafts, shows radar reflectivity enhancement. The growth and the initial Dm result in the Dm of Type 2 exhibiting the largest values at equivalent rain rates. While Type 3 experiences greater growth in its Dm compared to Type 2, Type 2 maintains relatively stable reflectivity values, whereas Type 3 shows a pronounced reflectivity reduction. This discrepancy likely originates from the initial DSD of Type 2 featuring a larger Dm.
The relationship between radar reflectivity slope and the DSD enables an advanced understanding of precipitation microphysics and provides actionable insights for improving radar rainfall estimation in operational meteorology. Although precipitation classification based on reflectivity slopes has been established, and distinct differences in the DSD among categories have been confirmed, existing research requires further refinement. Specifically, seasonal and regional variability needs to be systematically investigated. Moreover, while our current findings highlight statistical DSD disparities across different slopes, the extent to which these differences impact the retrieval accuracy of precipitation parameters (e.g., rainfall rate, DSD parameters) remains to be quantified and mechanistically elucidated.
In addition, since heavy precipitation can cause attenuation to the C-band radar, affecting the determination of the slope of radar reflectivity, we only focus on precipitation containing bright bands with weak rainfall intensity. For precipitation with stronger rainfall rates, further studies are still needed to determine the relationship between the slope and DSD.
Author Contributions
Conceptualization, Q.L. and H.L.; methodology, Q.L. and H.L.; software, Q.L.; validation, Q.L. and X.S.; formal analysis, Q.L. and X.S.; investigation, Q.L.; resources, Q.L.; data curation, Q.L. and H.L.; writing—original draft preparation, Q.L. and X.S.; writing—review and editing, Q.L., X.S. and X.L.; supervision, X.S. and X.L.; funding acquisition, X.L. All authors have read and agreed to the published version of the manuscript.
Funding
This research was funded by The National Natural Science Foundation of China, grant number 42222505; Open Grants of the State Key Laboratory of Severe Weather, grant number 2024LASW–B27.
Data Availability Statement
Data available on request due to restrictions.
Conflicts of Interest
The authors declare no conflicts of interest.
References
- Ulbrich, C.W. Natural variations in the analytical form of the raindrop size distribution. J. Clim. Appl. Meteorol. 1983, 22, 1764–1775. [Google Scholar] [CrossRef]
- Bringi, V.N.; Chandrasekar, V. Polarimetric Doppler Weather Radar: Principles and Applications; Cambridge University Press: Cambridge, UK, 2001. [Google Scholar]
- Pruppacher, H.R.; Klett, J.D. Microphysics of Clouds and Precipitation: Reprinted 1980; Springer Science & Business Media: Berlin/Heidelberg, Germany, 2012. [Google Scholar]
- Doviak, R.J.; Zrnic, D.S. Doppler Radar & Weather Observations; Academic Press: Cambridge, MA, USA, 2014. [Google Scholar]
- Zeng, Z.; Wang, D.; Chen, Y. An investigation of convective features and Z-R relationships for a local extreme precipitation event. Atmos. Res. 2020, 250, 105372. [Google Scholar] [CrossRef]
- Hou, Y.; Kakar, R.K.; Neeck, S.; Azarbarzin, A.A.; Kummerow, C.D.; Kojima, M.; Oki, R.; Nakamura, K.; Iguchi, T. The global precipitation measurement mission. Bull. Am. Meteorol. Soc. 2014, 95, 701–722. [Google Scholar] [CrossRef]
- Bringi, V.; Chandrasekar, V.; Hubbert, J.; Gorgucci, E.; Randeu, W.; Schoenhuber, M. Raindrop size distribution in different climatic regimes from disdrometer and dual-polarized radar analysis. J. Atmos. Sci. 2003, 60, 354–365. [Google Scholar] [CrossRef]
- Kumjian, M.R.; Prat, O.P. The impact of raindrop collisional processes on the polarimetric radar variables. J. Atmos. Sci. 2014, 71, 3052–3067. [Google Scholar] [CrossRef]
- Liu, C.; Zipser, E.J. Why does radar reflectivity tend to increase downward toward the ocean surface, but decrease downward toward the land surface? J. Geophys. Res. Atmos. 2013, 118, 135–148. [Google Scholar] [CrossRef]
- Beard, K.V.; Ochs, H.T. Warm-Rain Initiation: An Overview of Microphysical Mechanisms. J. Appl. Meteorol. Climatol. 1993, 32, 608–625. [Google Scholar] [CrossRef]
- Huang, H.; Chen, F. Precipitation Microphysics of Tropical Cyclones Over the Western North Pacific Based on GPM DPR Observations: A Preliminary Analysis. J. Geophys. Res. Atmos. 2019, 124, 3124–3142. [Google Scholar] [CrossRef]
- Villarini, G.; Krajewski, W.F. Review of the Different Sources of Uncertainty in Single Polarization Radar-Based Estimates of Rainfall. Surv. Geophys. 2009, 31, 107–129. [Google Scholar] [CrossRef]
- Tokay, A.; Wolff, D.B.; Petersen, W.A. Evaluation of the new version of the laser-optical disdrometer, OTT Parsivel 2. J. Atmos. Ocean. Technol. 2014, 31, 1276–1288. [Google Scholar] [CrossRef]
- Williams, C.R.; Beauchamp, R.M.; Chandrasekar, V. Vertical air motions and raindrop size distributions estimated using mean Doppler velocity difference from 3-and 35-GHz vertically pointing radars. IEEE Trans. Geosci. Remote Sens. 2016, 54, 6048–6060. [Google Scholar] [CrossRef]
- Tokay, A.; D’Adderio, L.P.; Porcù, F.; Wolff, D.B.; Petersen, W.A. A field study of footprint-scale variability of raindrop size distribution. J. Hydrometeorol. 2017, 18, 3165–3179. [Google Scholar] [CrossRef]
- Raupach, T.H.; Berne, A. Retrieval of the raindrop size distribution from polarimetric radar data using double-moment normalisation. Atmos. Meas. Tech. Discuss. 2016, 2016, 1–28. [Google Scholar] [CrossRef]
- Wu, Y.; Liu, L. Statistical characteristics of raindrop size distribution in the Tibetan Plateau and southern China. Adv. Atmos. Sci. 2017, 34, 727–736. [Google Scholar] [CrossRef]
- Atlas, D.; Srivastava, R.C.; Sekhon, R.S. Doppler radar characteristics of precipitation at vertical incidence. Rev. Geophys. 1973, 11, 1–35. [Google Scholar] [CrossRef]
- Jaffrain, J.L.; Berne, A. Experimental Quantification of the Sampling Uncertainty Associated with Measurements from PARSIVEL Disdrometers. J. Hydrometeorol. 2011, 12, 352–370. [Google Scholar] [CrossRef]
- Pang, S.; Ruan, Z.; Yang, L.; Liu, X.; Huo, Z.; Li, F.; Ge, R. Estimating Raindrop Size Distributions and Vertical Air Motions with Spectral Difference Using Vertically Pointing Radar. J. Atmos. Ocean. Technol. 2021, 38, 1697–1713. [Google Scholar] [CrossRef]
- Ding, H.; Li, H.; Liu, L. Improved spectral processing for a multi-mode pulse compression Ka-Ku-band cloud radar system. Atmos. Meas. Tech. 2022, 15, 6181–6200. [Google Scholar] [CrossRef]
- Hersbach, H.; Bell, B.; Berrisford, P.; Hirahara, S.; Horányi, A.; Muñoz-Sabater, J.; Nicolas, J.; Peubey, C.; Radu, R.; Schepers, D.; et al. The ERA5 global reanalysis. Q. J. R. Meteorol. Soc. 2020, 146, 1999–2049. [Google Scholar] [CrossRef]
- Li, Q.; Li, H.; Sun, X.; Ruan, Z.; Liu, L.; Gao, W.; Liao, C.; Ding, H. On the Quantification of Thermodynamic Phases of Raining Clouds: Insights From Multi-Year CloudSat and Ground-Based Radar Observations Over Longmen, Southern China. J. Geophys. Res. Atmos. 2025, 130, e2024JD041824. [Google Scholar] [CrossRef]
- Battan, L.J. Rain Resulting from Melting Ice Particles. J. Appl. Meteorol. 2010, 16, 595–604. [Google Scholar] [CrossRef]
- Fabry, F.; Zawadzki, I. Long-Term Radar Observations of the Melting Layer of Precipitation and Their Interpretation. J. Atmos. Sci. 1957, 52, 838–851. [Google Scholar] [CrossRef]
- Takeda, T.; Fujiyoshi, Y. Micro-Physical Processes around Melting Layer in Precipitating Clouds as Observed by Vertically Pointing Radar. J. Meteorol. Soc. Jpn. 1978, 56, 293–303. [Google Scholar] [CrossRef]
- Yokoyama, T.; Tanaka, H.; Akaeda, K.; Ohtani, T.; Yoshizawa, N.; Yamanaka, M.D.; Mita, A.; Ishizaka, Y.; Ono, A. Observation on Microphysical Processes in the Stratiform Precipitations Including Melting Layers at Mt. Fuji. J. Meteorol. Soc. Japan. Ser. II 1985, 63, 100–111. [Google Scholar] [CrossRef][Green Version]
- Sekhon, R.S.; Srivastava, R.C. Doppler Radar Observations of Drop-Size Distributions in a Thunderstorm. J. Atmos. Sci. 1971, 28, 983–994. [Google Scholar] [CrossRef]
- Willis, P.T. Functional Fits to Some Observed Drop Size Distributions and Parameterization of Rain. J. Atmos. Sci. 1984, 41, 1648–1661. [Google Scholar] [CrossRef]
- Testud, J.; Oury, S.; Black, R.A.; Amayenc, P.; Dou, X. The Concept of ‘Normalized’ Distribution to Describe Raindrop Spectra: A Tool for Cloud Physics and Cloud Remote Sensing. J. Appl. Meteorol. Climatol. 2001, 40, 1118–1140. [Google Scholar] [CrossRef]
- Liu, C.; Zipser, E.J.; Cecil, D.J.; Nesbitt, S.W.; Sherwood, S. A cloud and precipitation feature database from nine years of TRMM observations. J. Appl. Meteorol. Climatol. 2008, 47, 2712–2728. [Google Scholar] [CrossRef]
- Anthes, R.; Cotton, W. Storm and Cloud Dynamics; Academic Press: Cambridge, MA, USA, 2011. [Google Scholar]
- Nzeukou, A.; Sauvageot, H.; Ochou, A.D.; Kebe, C.M.F. Raindrop Size Distribution and Radar Parameters at Cape Verde. J. Appl. Meteorol. 2004, 43, 90–105. [Google Scholar] [CrossRef]
- Tokay, A.; Short, D.A. Evidence from Tropical Raindrop Spectra of the Origin of Rain from Stratiform versus Convective Clouds. J. Appl. Meteorol. Climatol. 1996, 35, 355–371. [Google Scholar] [CrossRef]
- Tokay, A.; Short, D.A.; Williams, C.R.; Ecklund, W.L.; Gage, K.S. Tropical Rainfall Associated with Convective and Stratiform Clouds: Intercomparison of Disdrometer and Profiler Measurements. J. Appl. Meteorol. 1999, 38, 302–320. [Google Scholar] [CrossRef]
- Atlas, D.; Ulbrich, C.W.; Marks, F.D.; Amitai, E.; Williams, C.R. Systematic variation of drop size and radar-rainfall relations. J. Geophys. Res. Atmos. 1999, 104, 6155–6169. [Google Scholar] [CrossRef]
- Atlas, D.; Ulbrich, C.W. An Observationally Based Conceptual Model of Warm Oceanic Convective Rain in the Tropics. J. Appl. Meteorol. 1942, 39, 2165–2181. [Google Scholar] [CrossRef]
- Zhu, S.; Guo, X.; Lu, G.; Guo, L. Ice Crystal Habits and Growth Processes in Stratiform Clouds with Embedded Convection Examined through Aircraft Observation in Northern China. J. Atmos. Sci. 2014, 72, 2011–2032. [Google Scholar] [CrossRef]
- Schumacher, C.; Stevenson, S.N.; Williams, C.R. Vertical motions of the tropical convective cloud spectrum over Darwin, Australia. Q. J. R. Meteorol. Soc. 2015, 141, 2277–2288. [Google Scholar] [CrossRef]
- Zhang, G.; Vivekanandau, J.; Brandes, E. A method for estimating rain rate and drop size distribution from polarimetric radar measurements. IEEE Trans. Geosci. Remote Sens. 2001, 39, 830–841. [Google Scholar] [CrossRef]
- Brandes, E.A.; Zhang, G.; Vivekanandan, J. Drop Size Distribution Retrieval with Polarimetric Radar: Model and Application. J. Appl. Meteorol. 2004, 43, 461–475. [Google Scholar] [CrossRef]
Disclaimer/Publisher’s Note: The statements, opinions and data contained in all publications are solely those of the individual author(s) and contributor(s) and not of MDPI and/or the editor(s). MDPI and/or the editor(s) disclaim responsibility for any injury to people or property resulting from any ideas, methods, instructions or products referred to in the content. |
© 2025 by the authors. Licensee MDPI, Basel, Switzerland. This article is an open access article distributed under the terms and conditions of the Creative Commons Attribution (CC BY) license (https://creativecommons.org/licenses/by/4.0/).