Article

A Terrain-Constrained Cross-Correlation Matching Method for Laser Footprint Geolocation

1
School of Electronic Information, Wuhan University, Wuhan 430072, China
2
GNSS Research Center, Wuhan University, Wuhan 430079, China
3
China Center for Resources Satellite Data and Application, Beijing 100094, China
*
Author to whom correspondence should be addressed.
Remote Sens. 2025, 17(14), 2381; https://doi.org/10.3390/rs17142381
Submission received: 21 May 2025 / Revised: 22 June 2025 / Accepted: 9 July 2025 / Published: 10 July 2025
(This article belongs to the Section Remote Sensing for Geospatial Science)

Abstract

The full-waveform spaceborne laser altimeter improves footprint geolocation accuracy through waveform matching, providing critical data for on-orbit calibration. However, in areas with significant topographic variations or complex surface characteristics, traditional waveform matching methods based on the Pearson correlation coefficient (PCC-Match) are susceptible to errors from laser ranging inaccuracies and discrepancies in surface structures, resulting in reduced footprint geolocation stability. This study proposes a terrain-constrained cross-correlation matching (TC-Match) method. By integrating the terrain characteristics of the laser footprint area with spaceborne altimetry data, a sliding “time-shift” constraint range is constructed. Within this constraint range, an optimal matching search based on waveform structural characteristics is conducted to enhance the robustness and accuracy of footprint geolocation. Using GaoFen-7 (GF-7) satellite laser footprint data, experiments were conducted in regions of Utah and Arizona, USA, for validation. The results show that TC-Match outperforms PCC-Match regarding footprint geolocation accuracy, stability, elevation correction, and systematic bias correction. This study demonstrates that TC-Match significantly improves the geolocation quality of spaceborne laser altimeters under complex terrain conditions, offering good practical engineering adaptability. It provides an effective technical pathway for subsequent on-orbit calibration and precision model optimization of spaceborne laser data.

1. Introduction

The spaceborne laser altimeter is an active Earth observation instrument that rapidly and accurately determines the three-dimensional coordinates of ground footprints worldwide by measuring the time of flight of laser pulses, combined with satellite attitude, orbital position, and laser pointing [1,2]. It has been widely employed in various geoscientific applications, including polar ice sheet monitoring [3,4], vegetation biomass estimation [5,6], and terrain mapping [7,8]. In China’s Earth observation framework, spaceborne laser altimeter footprints can function as elevation control points, assisting satellite stereo imagery in achieving large-scale mapping without requiring ground control points [9,10]. For instance, GaoFen-7 (GF-7), China’s first satellite equipped with a full-waveform laser altimeter, can acquire three-dimensional coordinates of ground footprints [11]. It is further integrated with a footprint camera to achieve precise co-registration between laser footprints and optical images [12], thereby enhancing the accuracy of stereo mapping.
During satellite launch and on-orbit operations, factors such as rocket thrust and fluctuations in environmental temperature can induce laser-pointing jitter [13], thereby causing geolocation errors in laser footprints [14]. At an orbital altitude of 500 km, a laser pointing error of 1 arcsecond can result in a footprint geolocation error of approximately 2.4 m [15]. Geolocation errors can significantly affect elevation accuracy in sloped terrains: a 2.4 m horizontal offset may introduce an elevation error of ~5 cm on an ~1° slope and as much as 1.1 m on an ~25° slope. This highlights that in rugged mountainous regions, even minor geolocation errors can lead to significantly amplified elevation inaccuracies [16]. Over bare and flat surfaces, spaceborne laser altimeters typically achieve elevation accuracies better than 1 m, with horizontal geolocation accuracies of approximately 10 m—which are sufficient for use as elevation control points only in relatively flat terrain [17]. Compared with the decimeter-level elevation accuracy, the horizontal geolocation accuracy remains relatively poor. With the deployment of missions such as the Global Ecosystem Dynamics Investigation (GEDI) [18] and the Terrestrial Ecosystem Carbon Monitoring (TECM) Satellite [19], improving the geolocation accuracy of laser footprints in complex terrain has become a key challenge. This, in turn, is essential for enhancing the on-orbit calibration accuracy of spaceborne laser altimeters and improving the usability of observational data—an issue that has drawn significant attention in both academic research and engineering practice [20,21,22].
The full-waveform spaceborne laser altimeter can record the complete return waveform within each footprint, capturing surface characteristics across the illuminated area. By decomposing the waveform, elevation information from various locations within the footprint can be extracted, which facilitates analysis of surface morphology and the vertical structural features of targets within the footprint area [23,24,25]. In complex mountainous regions, local topographic undulations may strongly correlate with the shape of the laser return waveform [26]. Based on this correlation, simulated waveforms are generated at various surface locations and matched with the received waveforms from spaceborne laser altimeters. The simulated waveform that best matches the observation is identified within a predefined spatial window. The three-dimensional geometric center of the corresponding simulated footprint is subsequently regarded as the estimated geolocation of the laser footprint associated with the received waveform. This process enables accurate footprint geolocation [27,28]. Waveform matching typically employs the Pearson correlation coefficient (PCC) as the criterion for evaluating the similarity between simulated and observed waveforms. As early as 1999, Blair and Hofton conducted pioneering research on waveform matching between LiDAR elevation data and laser altimeter returns [27]. By comparing simulated waveforms with observed data from the Laser Vegetation Imaging Sensor, they achieved correlations as high as 0.9.
In 2005, Harding et al. generated simulated waveforms using high-resolution Digital Elevation Models (DEMs) and matched them against return waveforms from the Geoscience Laser Altimeter System (GLAS), confirming that the horizontal geolocation accuracy of the GLAS in forested regions ranged from 10 m to 30 m [7]. Zhang et al. incorporated the spatiotemporal characteristics of laser pulses and surface features to optimize the waveform simulation model [24]. Through waveform matching, they achieved a footprint geolocation accuracy of 2 m for each GLAS footprint in the Songshan region of China. Wang et al. quantified the impact of the digital surface model (DSM) resolution on waveform matching performance and footprint geolocation accuracy [29]. Li S et al. performed geometric calibration of the GLAS using echo features from stepped terrain, improving the elevation control point accuracy from 2.85 m to 0.45 m [30]. This method was further applied to study the calibration approach for airborne large-footprint full-waveform laser altimeters, providing a reference for on-orbit validation of spaceborne laser altimeters [31]. Yang et al. proposed the DART-Lux model for GLAS waveform simulation and, through waveform matching, confirmed that the footprint geolocation accuracy of the GLAS in urban areas is 8.19 m [32]. Tang et al. optimized GEDI footprint geolocation through elevation residuals and optimal searching [21]. Xu Y. et al. performed joint terrain and waveform matching to correct the horizontal geolocation errors of the GEDI [33]. Xu Qi et al. optimized the multi-modal waveform matching process, improving the geolocation and ranging accuracy of single-modal waveforms of the GEDI [34].
Liu et al. employed iterative waveform matching to enhance the elevation accuracy of the GF-7 spaceborne laser altimeter in Zhaodong, Heilongjiang, China, reducing the error from 3.74 ± 0.55 m to 0.35 ± 0.50 m [28]. Li Guoyuan et al. integrated terrain and waveform matching techniques to achieve a GF-7 laser footprint geolocation accuracy of 11.6 m [35]. Furthermore, leveraging the geolocated laser footprints, they successfully conducted on-orbit calibration of the TECM satellite [19]. Wu Yu et al. applied multi-footprint joint geolocation based on waveform matching to enhance the elevation accuracy of GF-7 in Utah, where the average slope is approximately 20°, reducing the error from 2.45 ± 2.93 m to 0.27 ± 0.61 m [26]. Xu C. et al. proposed an optimized laser footprint geolocation model independent of satellite parameters, effectively reducing the GF-7 footprint geolocation error by 9.45 m in the Xinjiang region of China [36]. Zhang Hao et al. developed a two-step approach for on-orbit calibration of the Gaofen-14 satellite. This method achieved a root-mean-square error of elevation residuals below 0.3 m, outperforming results obtained via ground-based calibration [37].
Numerous studies have shown that waveform matching methods can achieve high-precision geolocation of laser footprints in complex terrain conditions. There are two main methods for implementing the PCC as a similarity criterion: The first involves alignment and matching based on fixed waveform structural features, such as the starting position, ending position, or maximum-energy position [17]; the second is based on absolute elevation information, where the elevation values obtained from the spaceborne laser altimeter are assigned to the time centroid position of the observed waveform. This enables the entire waveform’s elevation distribution (i.e., the horizontal axis elevation) to be derived from the known elevation value at the time centroid, thus allowing for alignment and matching of the waveforms [26]. The former method relies on the comparability of the structures between simulated and observed waveforms. After alignment based on characteristic positions, correlation is directly calculated. However, it inadequately accounts for differences in the elevation range. Although the latter method introduces elevation constraints, it does not sufficiently account for the errors inherent in spaceborne altimetry data. In rugged mountainous regions, where terrain varies dramatically, such errors can be further amplified, thereby degrading the accuracy of waveform matching and footprint geolocation. To mitigate the impact of ranging errors, researchers typically introduce error correction models. However, despite correction, significant differences in laser altimetry accuracy exist across different terrains. For example, before on-orbit calibration, the GF-7 spaceborne laser altimeter exhibited elevation accuracies of 3.74 ± 0.55 m in Zhaodong [28] and up to 10 m in areas with flat terrain [35]. Complex mountainous regions often include bare soil, low shrubs, and vegetation. In such settings, significant elevation variations amplify errors induced by laser pointing inaccuracies, which reduce waveform matching effectiveness and degrade footprint geolocation precision [38].
To address these issues, this study proposes a terrain-constrained cross-correlation matching (TC-Match) method for laser footprint geolocation. Unlike traditional approaches that rely on fixed alignment strategies, the TC-Match method integrates the terrain elevation range within the footprint area and spaceborne altimetry data to construct a dynamic “time-shift” constraint interval. Cross-correlation is then performed within this interval, guided by waveform structural features, to identify the optimal matching position. This method not only accounts for uncertainties in the observed waveform elevation data but also mitigates errors introduced by rigid alignment assumptions, thereby improving both the robustness and accuracy of footprint geolocation. This study used an experimental area in a complex mountainous region with varying elevations, measuring approximately 800 km across, in Utah and Arizona, USA. GF-7 satellite laser altimetry data were employed for waveform simulation and footprint geolocation. Experimental results demonstrate that TC-Match outperforms the conventional PCC-based waveform matching (PCC-Match) method in geolocation accuracy, elevation correction, and systematic bias mitigation, achieving more precise and stable footprint localization in complex terrain.

2. Materials and Methods

2.1. Simulation of Spaceborne Laser Echo

Based on research by Zhou et al., waveform simulation simplifies the atmospheric transmission process of laser pulses: It simulates a laser emission pulse as it undergoes atmospheric transmission and diffraction to reach the Earth’s surface. After being reflected by the surface, the laser undergoes secondary Fresnel diffraction during atmospheric transmission before being received by the altimeter [39]. The energy of the spaceborne laser pulse received on the ground, denoted as S 1 ( t ) , is expressed in Equation (1):
S 1 t = η 1 η atm λ h ν L Σ E x , y 2 F t T 2 d x d y
In Equation (1), η 1 represents the emission efficiency of the spaceborne laser altimeter, η a t m λ is the one-way atmospheric transmittance at wavelength λ , h v is the photon energy, and L is the distance of laser transmission. E ( x , y ) denotes the spatial cross-sectional energy distribution of the laser pulse, F ( t ) is its temporal waveform function, and T represents the time delay induced by terrain undulations within the footprint area. The time delay term ( T ) in Equation (1) can be further expressed as follows:
T = 2 D c x 2 + y 2 c D + 2 ξ x , y c
In Equation (2), ξ x , y denotes the elevation profile within the laser footprint, c is the speed of light in a vacuum, and D is the vertical distance from the target to the spaceborne laser altimeter.
After the spaceborne laser pulse undergoes atmospheric transmission, surface reflection, and re-transmission through the atmosphere to the receiver system, the received signal energy ( S 2 t ) can be modeled as the convolution of the emitted pulse with the surface target response function, and is given by the following equation:
S 2 t = η 2 A R η atm λ L R x , y S 1 t
In Equation (3), η 2 denotes the reception efficiency of the spaceborne laser altimeter, A R is the aperture area of the telescope’s field of view, and R ( x , y ) represents the effective reflectance distribution function modulated by the terrain.
To mitigate uncertainties arising from energy loss during atmospheric transmission and the instrument’s response, both simulated and observed waveforms are normalized prior to waveform matching. As a result, the overall scaling factor is excluded from the model formulation. The simulated echo energy ( S ( t ) ) is thus given by the following equation:
S t = η 1 η 2 A R η atm λ 2 h ν L 2 Σ R x , y E x , y 2 F t T 2 d x d y

2.2. TC-Match

TC-Match is a sliding cross-correlation matching method that introduces elevation information as an a priori constraint. It defines a lateral “time-shift” interval n 1 , n 2 for the spaceborne waveform, based on both the absolute elevation from the spaceborne altimetry and the elevation range within the footprint area. When there is an elevation discrepancy between the simulated waveform and the spaceborne return, it is necessary to unify their waveform lengths to enable effective matching. Δ h pre and h post represent the required elevation extensions on the left and right sides of the spaceborne waveform, respectively. Based on the principle of laser ranging, these elevation extensions can be converted into the boundaries of a time-domain sliding window as follows:
n 1 = 2 Δ h pre c , n 2 = 2 Δ h post c
where c is the speed of light in a vacuum. Within this interval, sliding cross-correlation is performed based on waveform structural features to identify the optimal alignment between the two waveforms. This approach is designed to suppress the influence of elevation inconsistencies and spaceborne ranging errors on waveform alignment, thereby enabling accurate geolocation of laser footprints. The received waveform from the spaceborne laser altimeter is denoted as W F r e a l , and the simulated waveform is denoted as S ( t ) ; their similarity is evaluated using the metric defined in Equation (6).
p = max n n 1 , n 2 t = 0 M 1 S t W F real t + n
Here, m a x n n 1 , n 2 denotes the search for the maximum cross-correlation value within the sliding range n 1 , n 2 , M is the total number of waveform samples, and n is the cross-correlation lag. The spaceborne received waveform is incrementally shifted within the constrained interval n 1 , n 2 , and the cross-correlation with the simulated waveform is computed for each shift, resulting in n 2 n 1 + 1 total calculations. Within this “time-shift” interval, there exists a lag ( n ) that yields the optimal alignment between the two waveforms, where the corresponding cross-correlation coefficient—denoted as p —is the highest among all evaluated values. A higher p indicates greater similarity at that alignment position.

2.3. Evaluation Strategy for TC-Match Geolocation Performance

Due to a lack of direct access to ground-truth geolocation data for spaceborne laser footprints, this study assessed the performance of the proposed TC-Match method from two complementary perspectives:
(1)
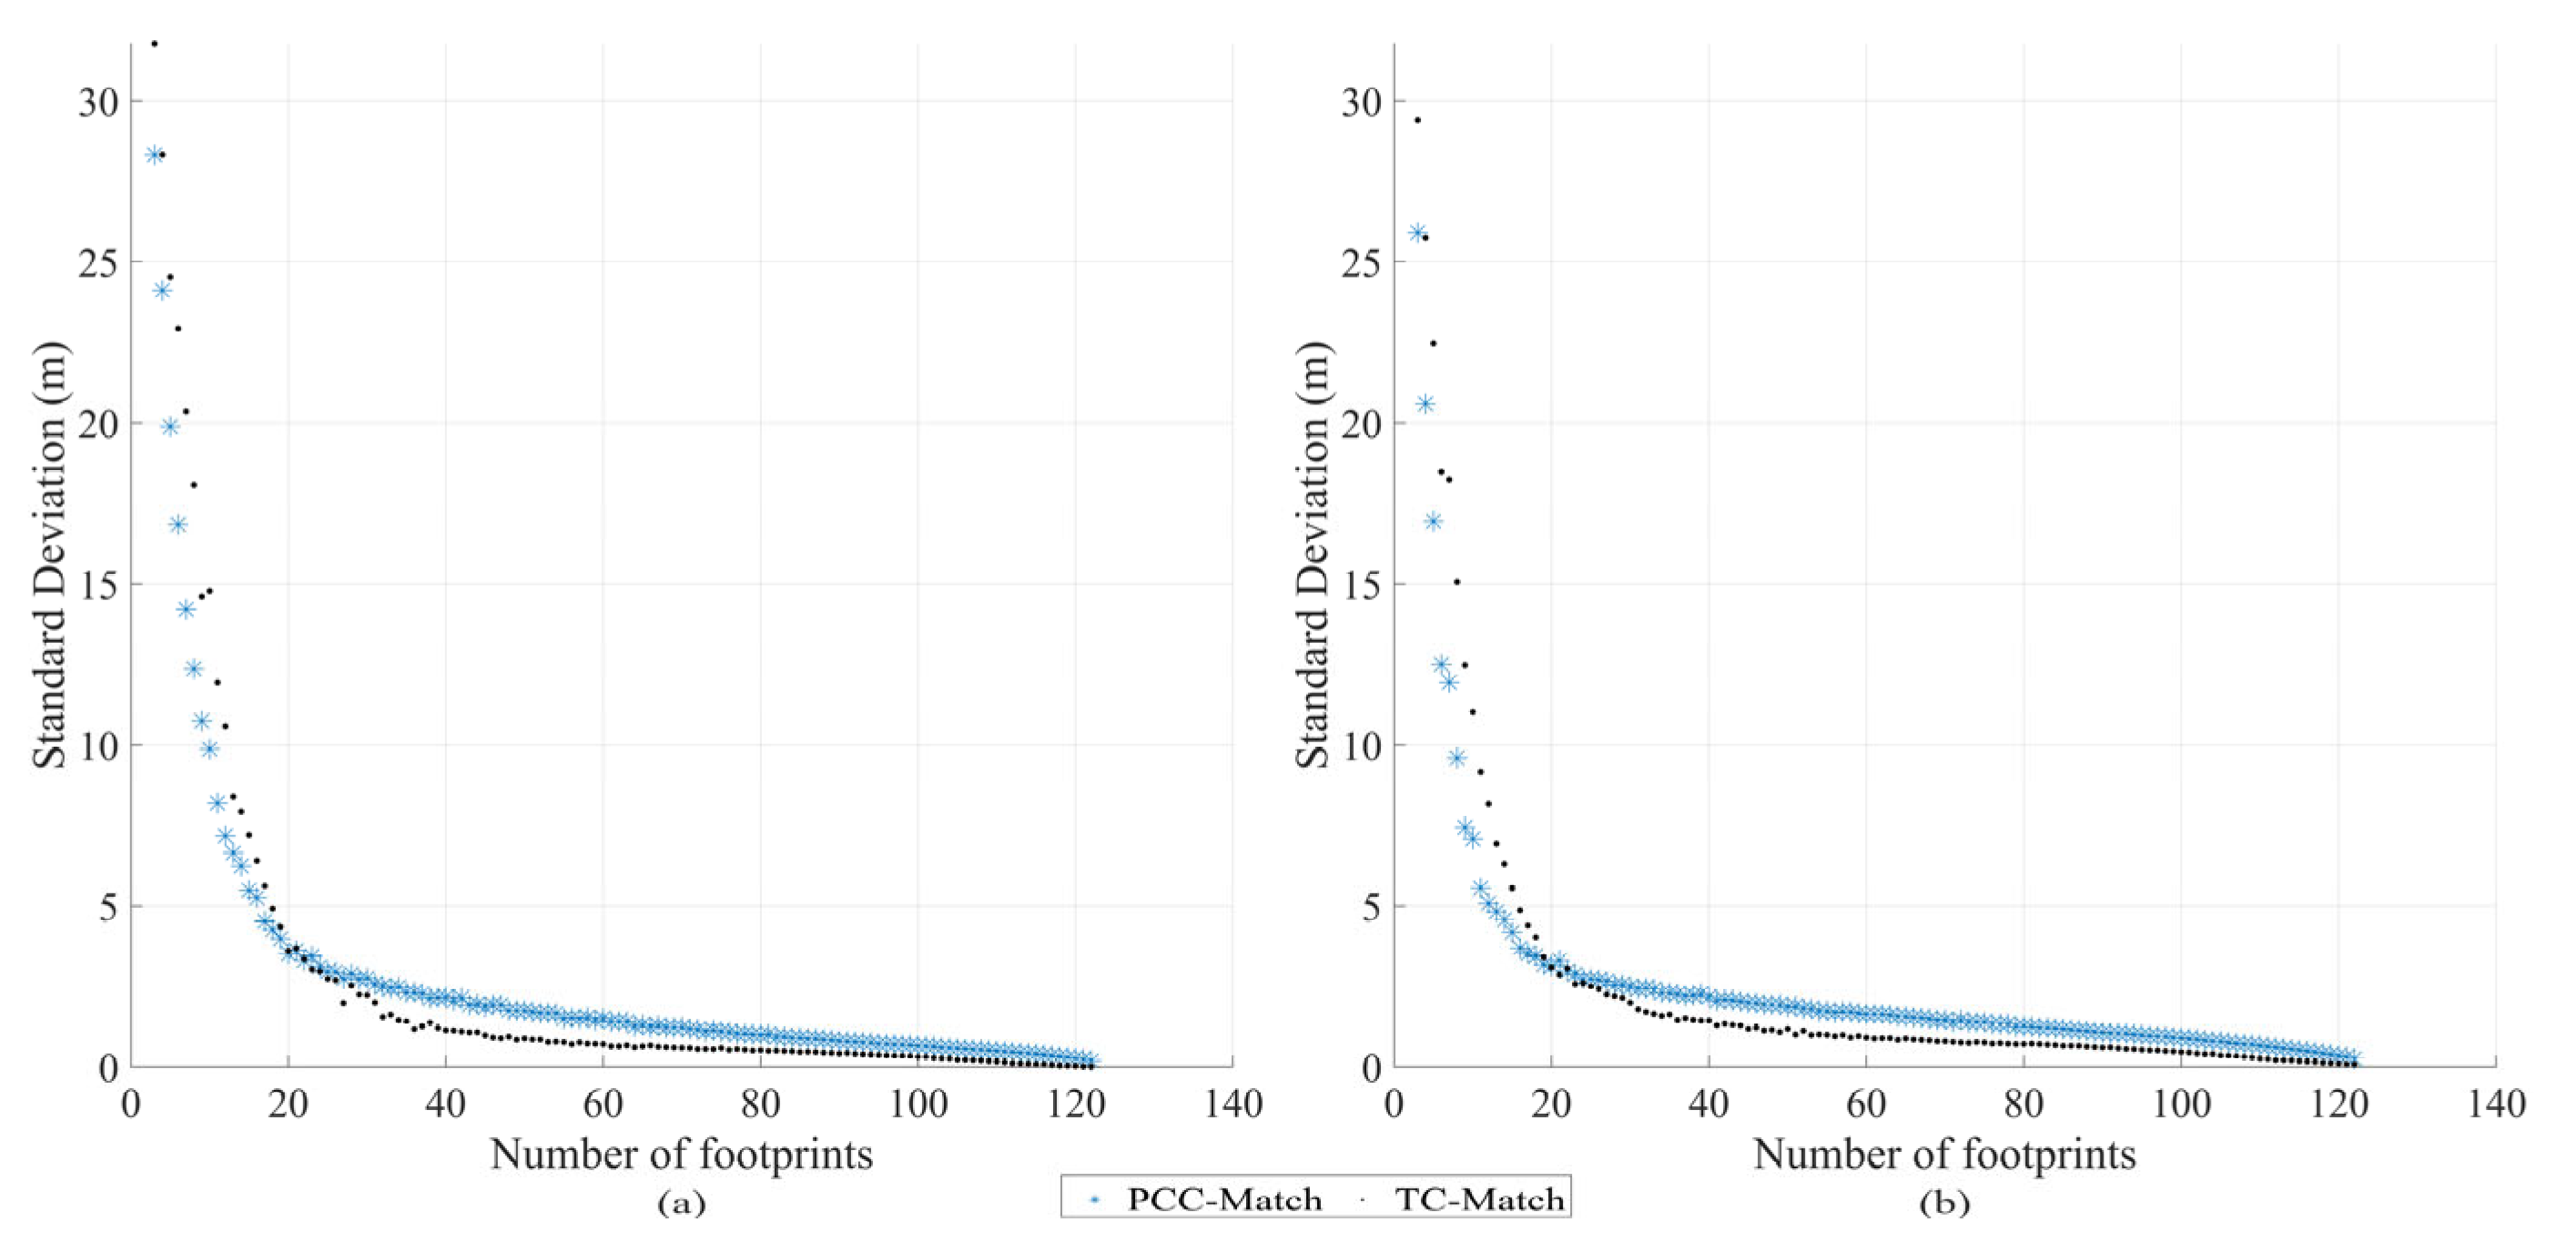
Section 3.2.1 introduces a random resampling strategy that assesses geolocation stability with varying sample sizes based on the number of available footprints. For each footprint count, 10,000 repeated trials were performed. The resulting offset distributions were analyzed in terms of their convergence behavior, means, and standard deviations and were compared with those obtained using the conventional PCC-Match method, thereby validating the improved robustness and consistency of TC-Match.
(2)
As presented in Section 3.2.2, coordinate correction was applied based on the estimated geolocation results, and the method’s capability to mitigate systematic error was evaluated. Key indicators included the mean absolute elevation residual, the standard deviation, and the distribution characteristics of the residuals, which were analyzed through Gaussian fitting. A comparison with PCC-Match was also conducted to highlight the advantages of TC-Match in reducing residual errors and suppressing systematic bias.
Together, these multi-angle evaluation strategies provide a solid foundation for the systematic validation of TC-Match presented in the subsequent sections.

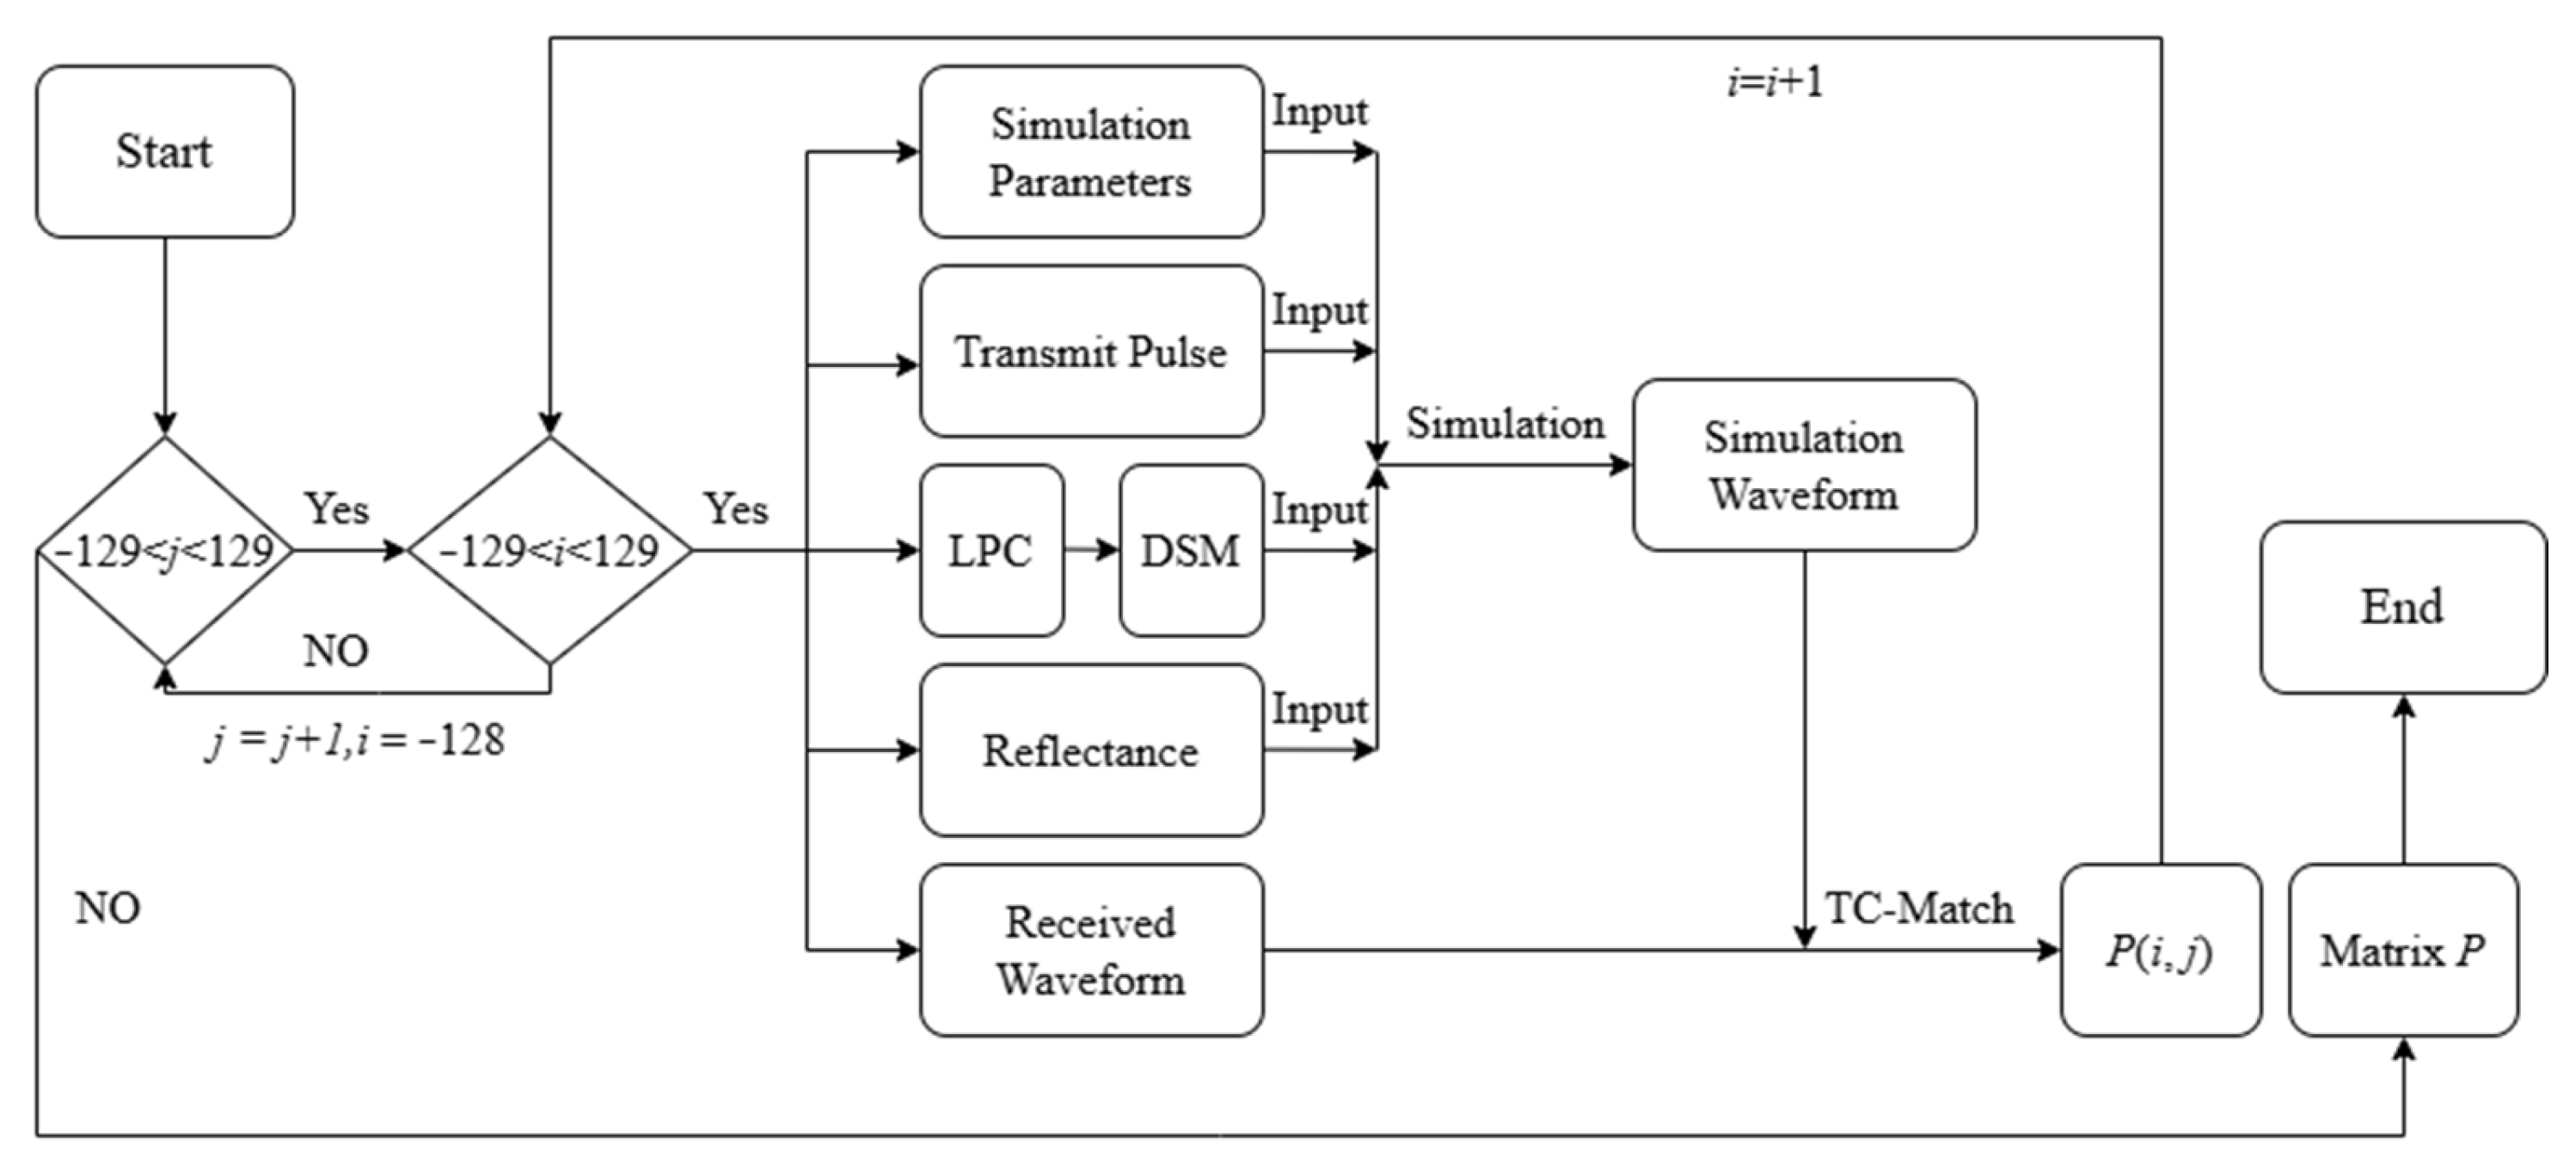
2.4. Procedure for Laser Footprint Geolocation

This study adopted the system parameters of the GF-7 satellite laser altimeter as inputs for waveform simulation. The GF-7 laser altimeter produces ground footprints with diameters of approximately 21.5 m that are spaced about 2.4 km apart along-track and 12 km apart across-track. Additional system specifications are listed in Table 1. The temporal waveform function ( F t ) used in the waveform simulation was based on GF-7 measurements, while the spatial energy distribution of the laser pulse ( E x , y ) was modeled using a Gaussian function.
Considering that the GF-7 spaceborne laser altimeter produces ground footprints approximately 21.5 m in diameter and typically has an initial geolocation error below 50 m [9], the initial latitude and longitude of each footprint were used as the center to define a 150 m square search region for spatial matching. The DSM within this region was derived from high-precision airborne LiDAR point clouds (LPCs). Multiple footprint simulation centers were generated at regular spatial intervals in this DSM. The simulated waveform at each center was compared to the spaceborne received waveform using TC-Match to compute the corresponding similarity value. Evaluating all simulation centers yielded a correlation coefficient matrix that characterized the similarity between the simulated and received waveforms across the search region. Ideally, the physical coordinates corresponding to the maximum correlation value indicated the true location of the laser footprint.
Figure 1 illustrates the process of constructing the footprint correlation coefficient matrix based on the GF-7 waveform. Taking the footprint’s latitude and longitude, as recorded by the spaceborne laser altimeter, as the coordinate origin ( 0 ,   0 ) , airborne LPCs were collected within a 75 m radius in each cardinal direction to generate a 150 m × 150 m DSM with a 0.5 m resolution. A total of 257 × 257 simulation center points were generated within the DSM at 0.5 m intervals, covering physical coordinate ranges from –64 m to 64 m in the east–west direction and from −64 m to 64 m in the north–south direction. In Figure 1, j denotes the northward direction and i denotes the eastward direction. The physical coordinates of the simulation centers were converted to matrix indices, where the first center corresponded to   ( 128 , 128 ) . During waveform simulation, a DSM patch matching the footprint size was extracted for use in the simulation. The similarity value ( p ) between the simulated waveform and the spaceborne received waveform was then calculated using TC-Match and was denoted as P ( i , j ) . This process was repeated for all simulation center points, resulting in a 257 × 257 correlation coefficient matrix, denoted as matrix P . The physical coordinates corresponding to the maximum value in matrix P were considered the true footprint location. The offset from the origin ( 0 ,   0 ) was interpreted as the systematic laser pointing bias.

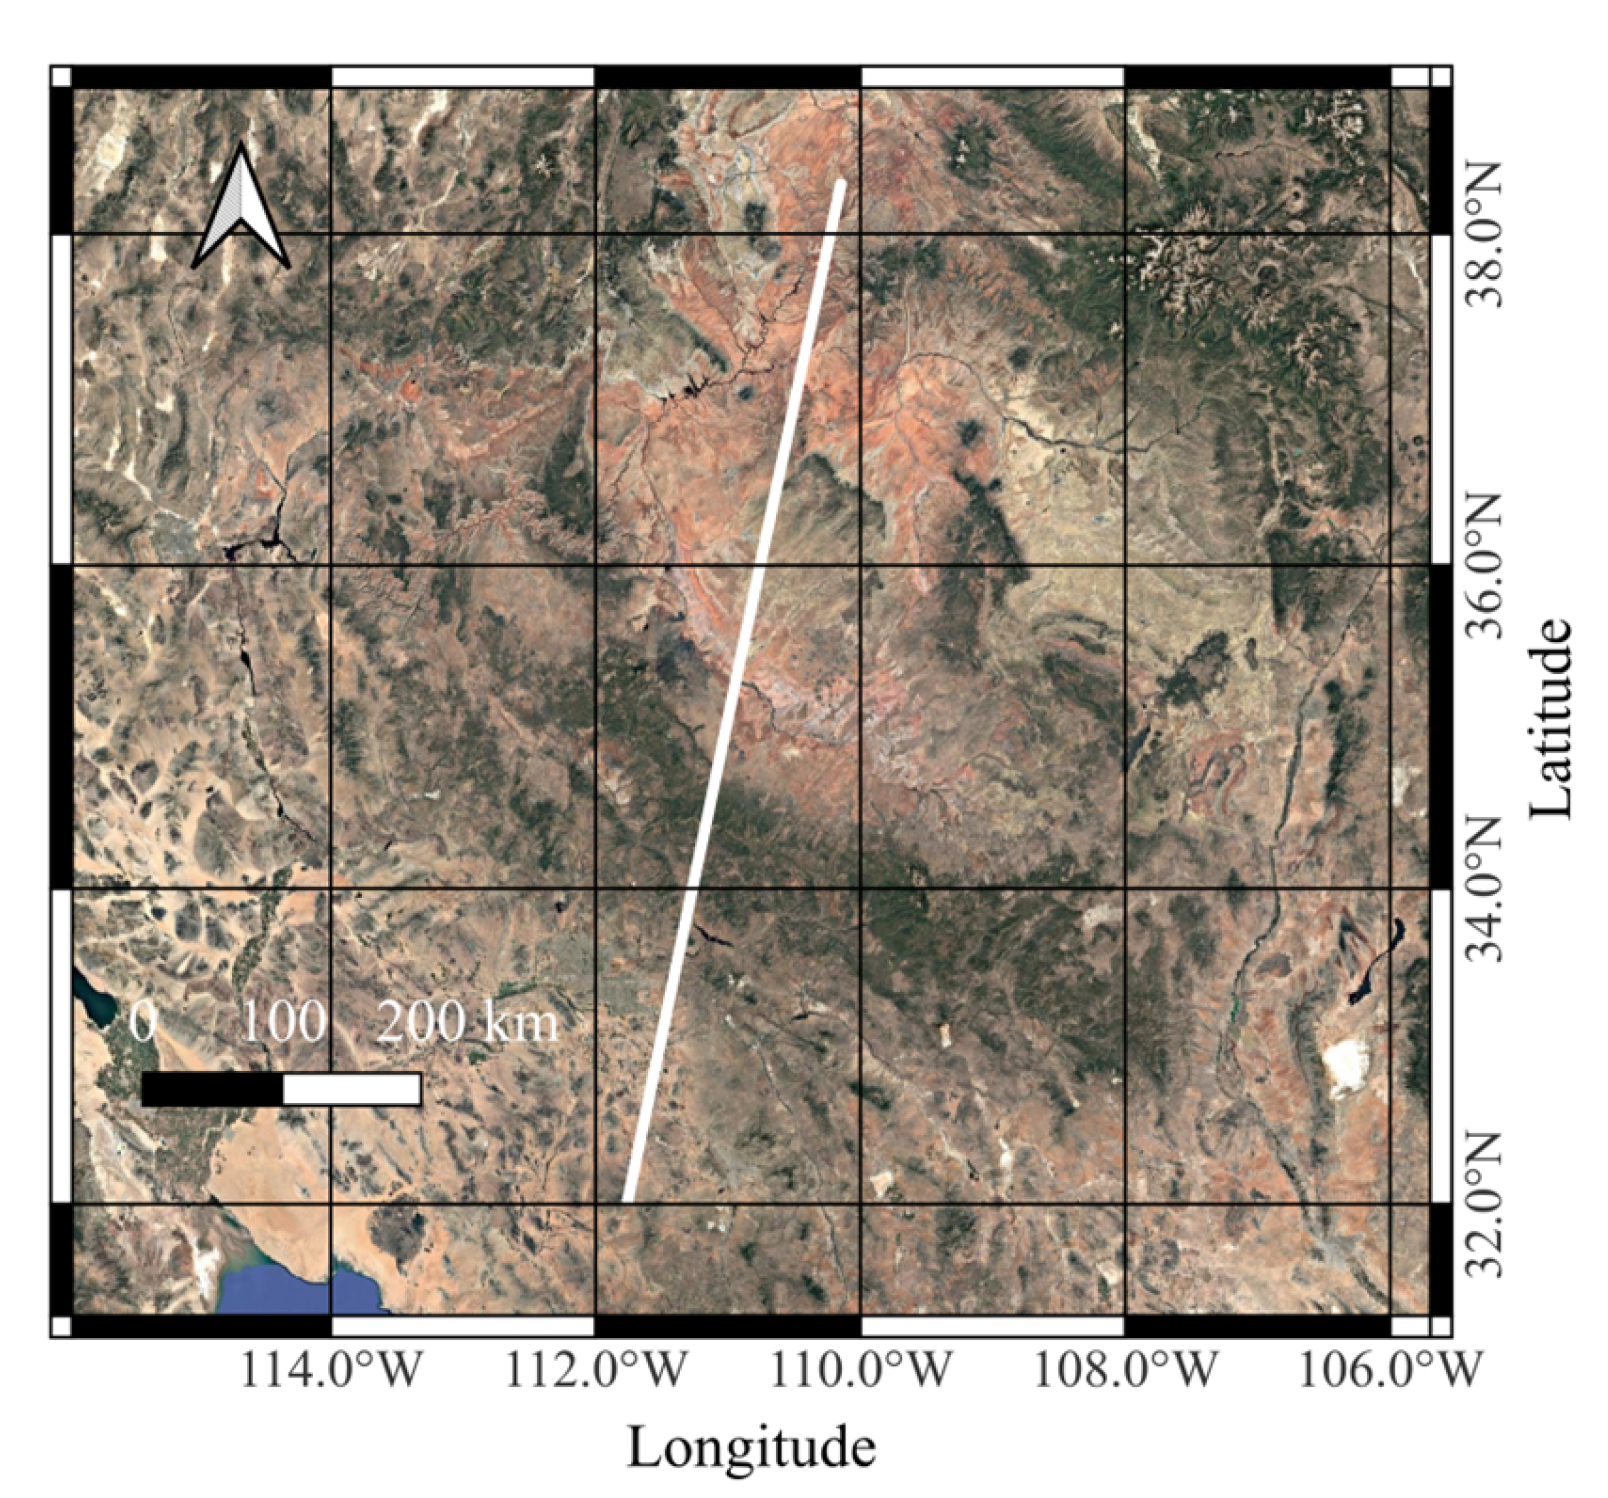
2.5. A Description of the Study Area

As shown in Figure 2, the study area spans southeastern Utah and stretches across the full north-to-south extent of Arizona. Elevations range from 1500 to 2500 m in southeastern Utah, from 1200 to 2500 m in northern Arizona, and from 400 to 2500 m in southern Arizona. Overall, this region exhibits considerable elevation variation and pronounced topographic relief, with landforms such as faults, erosional terraces, and canyons. The surface cover types are highly diverse, comprising exposed bedrock, low shrubs, sparse grasslands, scattered vegetation, and occasional man-made structures, making this region well-suited for studying heterogeneous and rugged terrain. This study utilized data from GF-7 satellite orbit 7434, which traversed the study region on 6 March 2021. Laser data acquired from Beam 2 of this orbit were employed for footprint geolocation analysis.
The terrain and surface data used in this study’s simulations were derived from airborne LPCs provided by the United States Geological Survey (USGS). Since airborne LiDAR operates at the same wavelength as the GF-7 satellite’s laser altimeter, its intensity information can be used as a substitute for the surface reflectance data collected during GF-7 overpasses. Accordingly, both the terrain data and the surface reflectance distribution ( R x , y ) used in the simulation were derived directly from airborne LPCs provided by the USGS. Both the transmitted waveform for the simulation and the received waveform for matching were obtained from actual satellite measurements. To ensure simulation accuracy, the resolution of the terrain and surface data was maximized within the physical limits of the original dataset. Airborne LPCs along the Beam 2 track were collected in June 2019; October and November 2020; January and June 2021; June and December 2022; and February and June 2023. Each LiDAR dataset covered an area of 0.699–2.25 km2, with a point density of 4.607–38.831 points/m2, a point spacing of 0.1605–0.4659 m, a planar accuracy of 0.06 m, and an elevation accuracy better than 0.1 m [26]. The density and spacing of the airborne LPCs in this region were sufficient to support the generation of a 0.5 m resolution DSM without introducing terrain distortion. Accordingly, a 0.5 m resolution DSM was adopted for the simulation.
Beam 2 recorded 300 sets of laser footprint coordinate data. However, due to environmental factors, some laser pulses did not yield return signals, making the corresponding footprint data unusable for subsequent processing and necessitating their exclusion [40]. In addition, laser footprints needed to be excluded if airborne point cloud data were missing within the footprint area or if the point cloud files lacked the 1064 nm surface reflectance intensity, as these parameters are essential for waveform simulation. After excluding all invalid data, 125 valid laser footprints were retained for Beam 2.

3. Results

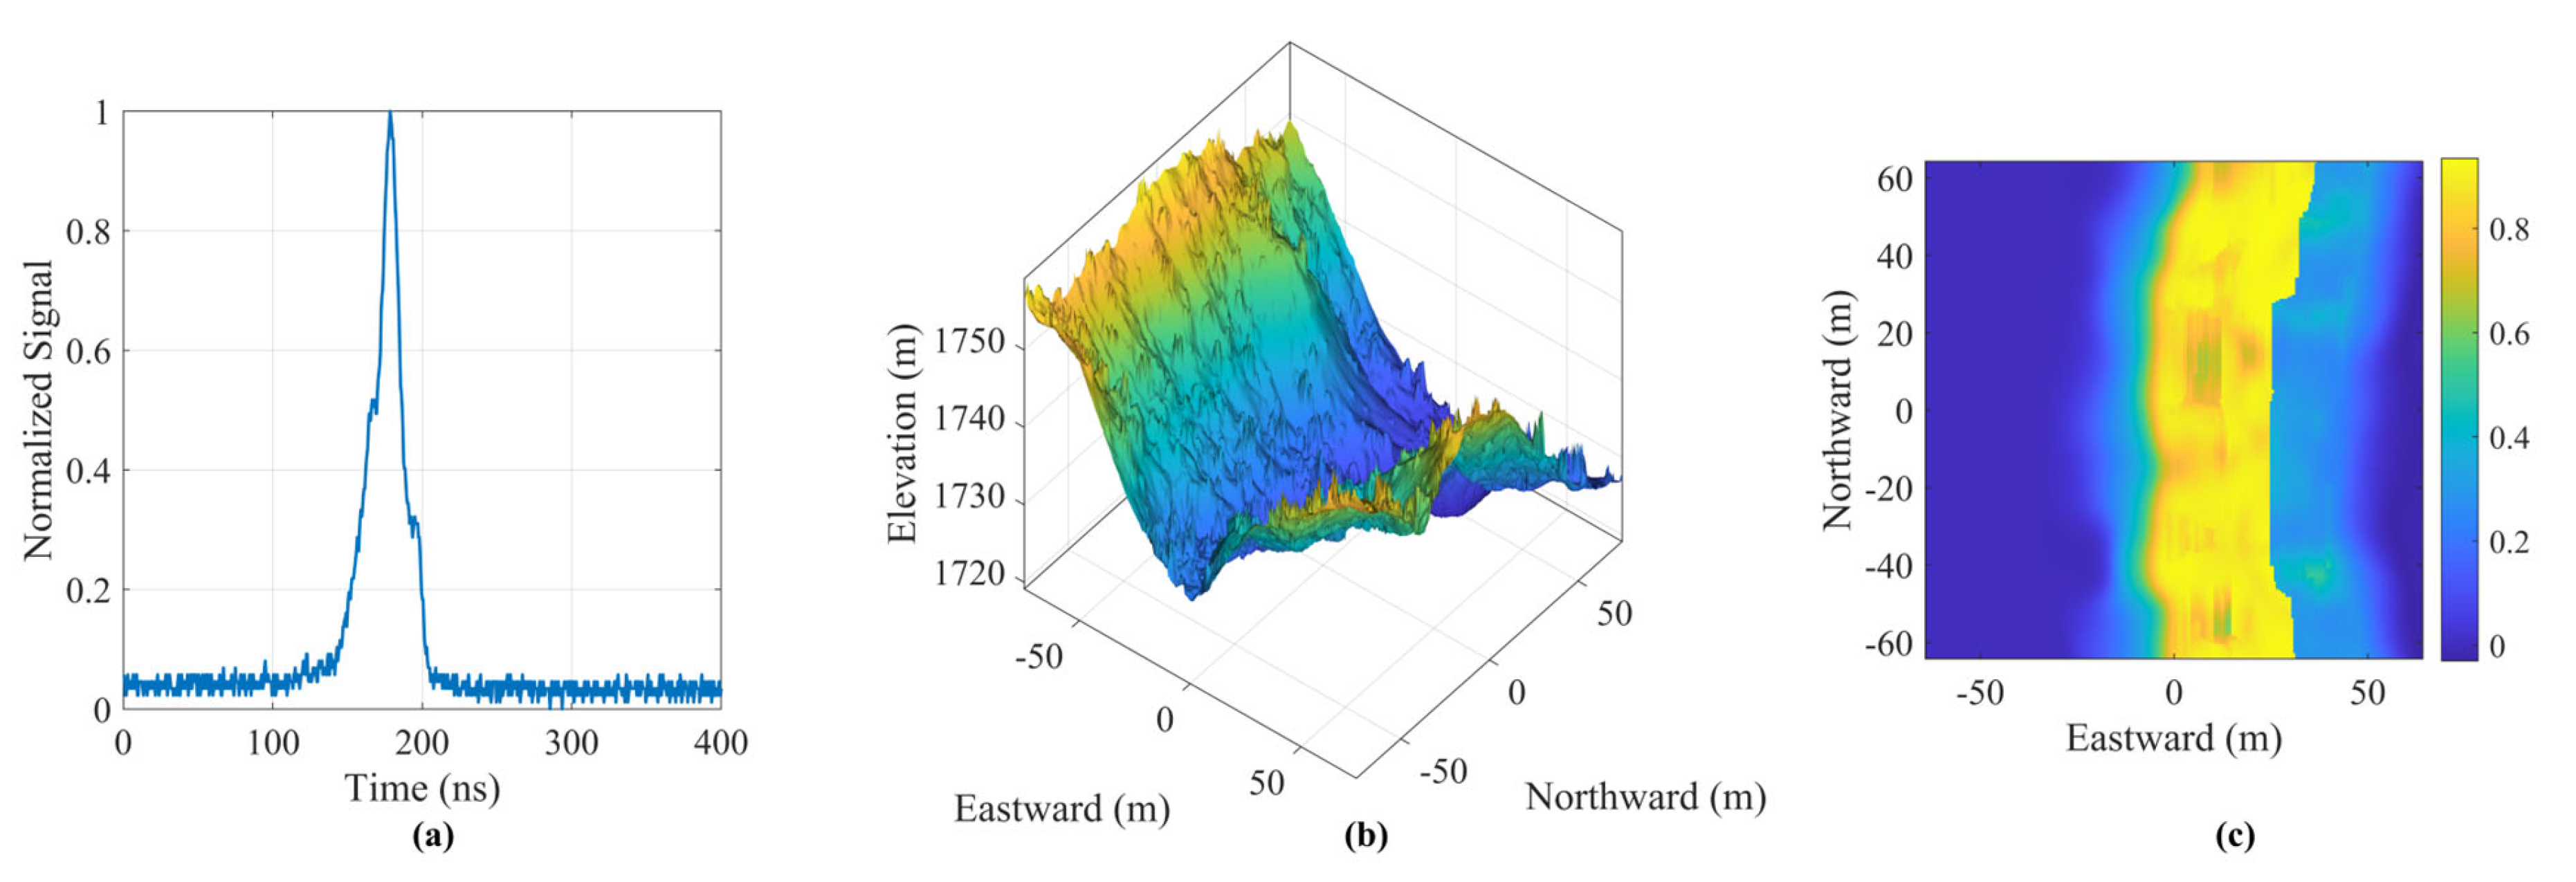
3.1. Single-Footprint Analysis

According to the workflow illustrated in Figure 1 in Section 2.4, waveform simulation and TC-Match calculations were performed for the 125 valid laser footprints from Beam 2. Footprint No. 10 was randomly selected for detailed analysis, and the results are shown in Figure 3. Figure 3a presents the normalized spaceborne return waveform of this footprint, which exhibits a distinct main peak, along with low-amplitude leading and trailing edges. The overall waveform is relatively narrow but shows noticeable broadening. Figure 3b shows the DSM simulation region associated with this footprint. The area exhibits significant slope variation and complex local surface undulations, which correspond well to the structural features of the return waveform. Figure 3c displays the correlation coefficient matrix obtained through TC-Match. The results indicate that the high-correlation region appears as a narrow yellow belt, suggesting a good spatial concentration of the matching outcome. However, the distribution is broad in the true north direction, suggesting directional uncertainty in the matching results and indicating that relying solely on this footprint for precise geolocation may lead to positioning errors. Overall, this case confirms the strong coupling between return waveform features and terrain structure while also highlighting the spatial uncertainty associated with single-footprint geolocation in complex terrain, thereby further underscoring the necessity of multi-footprint joint geolocation.

3.2. Multi-Footprint Joint Estimation

As stated in the Introduction, the PCC is widely employed in waveform matching for footprint geolocation. The PCC is computed as follows:
r = Cov S t , W F real t σ S t σ W F real t
According to the definition of the PCC, a higher coefficient value indicates greater similarity between the two waveforms. Waveform simulations were performed for the 125 laser footprints from Beam 2 in orbit 7434, using the method described in Section 2.1. Using PCC-Match as the waveform matching criterion, the procedure described in Section 2.4 was employed to derive a correlation coefficient matrix for each footprint. Finally, joint geolocation was performed using the correlation coefficient matrices derived from both PCC-Match and TC-Match. The resulting positioning accuracies were then compared and analyzed.

3.2.1. Comparison of Geolocation Result Stability Based on TC-Match and PCC-Match

Given the difficulty in obtaining the true coordinates of laser footprints, this study adopted a statistical evaluation strategy based on repeated group resampling to assess the stability and robustness of the proposed geolocation method across varying sample sizes. The 125 laser footprints from Beam 2 were treated as the full sample set. For each predefined sample size ( N ), N footprints were randomly selected to conduct 10,000 repeated trials. The geolocation results from each resampled group were then statistically analyzed. This experiment was conducted independently on the footprint correlation coefficient matrices derived from the TC-Match and PCC-Match strategies. Due to the limited number of unique combinations, when N < 3 or N > 122 , it became infeasible to generate 10,000 distinct resampling iterations from the 125 samples. Therefore, the sample size ( N ) was constrained to the range [ 3 ,   122 ] . It is worth noting that although joint geolocation using a small number of footprints (e.g., N = 3 ,   4 ,   5 ) may have limited practical relevance in real-world applications, these cases were retained in the experiment to ensure the completeness of the sampling interval and to better illustrate the relationship between the number of footprints and the convergence behavior of geolocation offsets.
As shown in Figure 4, the geolocation offsets obtained by TC-Match exhibited a more concentrated and less dispersed distribution across all footprint sample sizes. This advantage became increasingly pronounced as the number of footprints increased. These results indicate that introducing terrain-constrained waveform matching effectively improves the reliability of individual footprint geolocation estimates. As a result, the stability and consistency of multi-footprint joint estimation-based geolocation are enhanced, leading to faster convergence of positioning deviations.
Figure 5 compares the trends in the average geolocation offsets across different footprint counts. While both methods tended to stabilize as the sample size increased, TC-Match demonstrated a smoother convergence process. This suggests stronger suppression of offset variability induced by sampling differences, resulting in improved repeatability of geolocation results in both directions and a more stable and consistent positional baseline.
Figure 6 shows how the standard deviation of the geolocation results evolved with the number of footprints. Although both TC-Match and PCC-Match exhibited clear reductions in variability as the sample size increased, TC-Match achieved a faster decline in the early stage (particularly when N < 40 ), reflecting superior convergence performance. It subsequently maintained a lower and more stable range of fluctuations, indicating greater overall robustness. These findings confirm that terrain-constrained waveform matching improves both the accuracy of individual footprint positioning and the robustness of joint geolocation against random perturbations, leading to more consistent performance across varying sampling scales.
In summary, TC-Match outperforms PCC-Match in terms of the convergence range, the smoothness of convergence, and the overall statistical stability of the geolocation results. These advantages are particularly important for high-precision footprint positioning and the downstream task of spaceborne laser altimeter on-orbit calibration.

3.2.2. Evaluation of Elevation Corrections Based on TC-Match and PCC-Match

Due to the absence of complete attitude and orbital parameter information in the current GF-7 satellite data package, it is impossible to construct a precise spaceborne laser footprint geolocation model, which limits the application of rigorous geometric inversion methods in calibration tasks. To address this, an on-orbit calibration strategy based on coordinate correction was adopted. Footprint position vector offset corrections were performed under the PCC-Match and TC-Match methods, and the corresponding elevation residual distributions were analyzed. Because coordinate correction is a geometric approximation, it cannot explicitly distinguish laser pointing errors from ranging errors at the parameter level. Moreover, the ground-projected magnitude of the pointing error varies with the orbital latitude, and on terrains with different slopes, the same pointing error may result in different planimetric and ranging deviations. Therefore, applying a unified coordinate correction model to footprints from different orbits may introduce new systematic biases, affecting the stability and physical interpretability of the calibration results. To mitigate the impact of the aforementioned error propagation, this study utilized the commonly accepted assumption that systematic errors remain relatively stable over short intervals [14]. Based on this assumption, observations from the same laser beam across regions with varying terrain conditions were selected for validation and evaluation.
As shown in Table 2, the valid footprints of Beam 2 were divided into three sub-regions—A, B, and C—based on their geographic distribution. Region A features rugged terrain dominated by canyons and plateaus, with complex and diverse landforms and no significant presence of human-made structures. In contrast, region C exhibits clear spatial heterogeneity: its northern part is relatively flat and contains numerous artificial structures, while the southern part consists of hilly terrain with much less elevation variation than region A. The spatial separation between regions A and C exceeds 500 km, highlighting a typical geomorphological contrast. Region A was selected as the test site to evaluate the geolocation accuracy of the TC-Match method, with the systematic bias subsequently estimated based on the results. This estimated systematic bias was then applied as a correction factor to the footprint coordinates in region C to enable cross-region elevation correction.
Region A contained a total of 41 footprints. According to the analysis in Section 3.2.1, when the number of footprints was 41, TC-Match yielded mean geolocation coordinates of (4.42, 9.76) m with standard deviations of (1.13, 1.29) m based on 10,000 repeated trials. For PCC-Match, the corresponding values were (5.21, 9.84) m with standard deviations of (2.06, 2.06) m. The close spatial agreement between the results of both methods indicates that TC-Match offers comparable reliability to the conventional PCC-Match. Its smaller standard deviation further demonstrates superior stability and resistance to interference.
Upon completing the geolocation of the footprints in region A and estimating their average position, the systematic laser pointing bias for the current orbit was derived, denoted as Δ x , Δ y , Δ z . Assuming the original coordinates of a footprint in region C were x , y , z , the corresponding elevation in the DSM at location x , y was denoted as z DSM 0 , yielding an initial elevation residual of ( z DSM 0 z ). After applying the system bias, the corrected footprint coordinates became x + Δ x , y + Δ y , z + Δ z . The corresponding elevation at x + Δ x , y + Δ y in the DSM was z DSM 1 , and the corrected elevation residual was calculated as ( z DSM 1 z Δ z ). By comparing the residuals before and after correction, the effectiveness of the system bias estimated by different matching methods (TC-Match and PCC-Match) could be quantitatively evaluated.
Figure 7 presents elevation residuals for 55 footprints in region C, shown in their original state and after geolocation correction using PCC-Match and TC-Match. In the original state, the mean elevation residual was −1.51 m, with a standard deviation of 2.58 m and a mean absolute residual ( Δ h ) of 1.94 m. After correction using PCC-Match, the mean residual improved to 0.51 m, the standard deviation decreased to 1.70 m, and the mean absolute residual dropped to 1.37 m. With TC-Match correction, the mean residual became −0.99 m, the standard deviation further decreased to 1.34 m, and the mean absolute residual was reduced to 1.03 m. As shown in the figure, TC-Match significantly reduced the dispersion of the elevation residuals, with most of the corrected values clustering tightly around zero. TC-Match yielded lower mean absolute residuals and standard deviations than PCC-Match, demonstrating superior consistency and stability in elevation correction.
To further evaluate the performance of TC-Match in elevation correction, the proportions of the footprints falling within different absolute elevation residual intervals ( Δ h ) were computed for each method using the residual data from Figure 7. The results are summarized in Table 3. In the original dataset, no footprints fell within the Δ h < 0.3 m range. After correction, the proportion increased to 3.64% with PCC-Match and 9.09% with TC-Match. For the Δ h < 0.6 m interval, 7.27% of the original footprints fell within this range. After PCC-Match correction, the proportion increased to 12.73%, whereas TC-Match correction resulted in a substantial increase to 63.64%, representing a 56.37 percent improvement. Notably, for the Δ h < 0.9 m range, after PCC-Match correction the proportion of footprints dropped to 27.27%, whereas TC-Match correction increased it to 74.55%, marking a 41.82 percent improvement. Additionally, for the high residual range of Δ h 2.4 m , TC-Match reduced the footprint proportion from 21.82% to 10.91%, which was lower than the 14.55% achieved by PCC-Match. Overall, TC-Match demonstrates strong performance in coordinate correction, particularly in mitigating elevation deviations caused by geolocation errors. This improvement primarily stems from applying terrain constraints during waveform matching, which reduces alignment ambiguity between observed and simulated waveforms. As a result, the estimated offsets more accurately represent the systematic bias present in regions with complex terrain.
The distribution of elevation residuals can partially reveal the characteristics of systematic bias in laser footprint geolocation results. To further evaluate the ability of the TC-Match method to correct systematic bias, histograms of elevation residuals were constructed for 55 footprints in region C. Probability density fitting was then performed for the original data, as well as after correction using PCC-Match and TC-Match, as illustrated in Figure 8. In the figure, the x-axis represents elevation residuals and the y-axis indicates the proportion of the footprints within each residual interval. The fitted curves serve to evaluate the concentration and symmetry of the distributions. It can be observed that the original residuals are widely dispersed, with heavy tails, clearly deviating from a normal distribution. Following PCC-Match correction, the residuals are more concentrated, and the probability density has a bell-shaped form. However, the presence of outliers introduces noticeable deviation from the ideal Gaussian distribution. In contrast, the residuals corrected by TC-Match are more tightly clustered and exhibit higher symmetry. The fitted probability density curve aligns more closely with the standard normal distribution, indicating improved residual consistency and enhanced systematic bias correction capability. These results suggest that TC-Match not only improves the geolocation accuracy of individual footprints but also effectively mitigates systematic bias at the global level.
To further quantify the structural characteristics of the elevation residual distributions, skewness and kurtosis were calculated for the fitted curves of the three residual sets shown in Figure 8. The results are as follows: the fitted curve for the original residuals has a skewness of 0.35 and a kurtosis of 1.61; for PCC-Match, the values are 0.98 and 2.38; and for TC-Match, the values are 1.32 and 3.22. While all three distributions exhibit positive skewness, the TC-Match curve has the kurtosis value closest to the theoretical value of three for a normal distribution, indicating a more peaked and centrally concentrated shape. These results, from a distributional perspective, provide additional evidence of TC-Match’s effectiveness in suppressing systematic error and improving the consistency of geolocation results. They also complement the magnitude-based evaluation of the residuals presented in Figure 7.
In summary, the results demonstrate that TC-Match not only enhances the geolocation accuracy of individual footprints but also provides a more robust and transferable correction model for cross-regional calibration. By simultaneously mitigating both random noise and systematic bias, this method substantially improves footprint geolocation accuracy and the stability of on-orbit calibration outcomes for spaceborne laser altimetry in areas with complex terrain.

4. Discussion

This study introduced a terrain-constrained cross-correlation matching (TC-Match) method for the geolocation of full-waveform spaceborne laser altimeter footprints and systematically evaluated its performance using GF-7 satellite data collected over complex mountainous regions with significant elevation variations. Experiments comparing this method with the conventional PCC-Match method were conducted to evaluate its geolocation accuracy and stability, elevation correction effectiveness, and ability to correct systematic bias.
From the perspective of geolocation stability, Figure 4, Figure 5 and Figure 6 show that when the number of footprints exceeds 25, TC-Match exhibits faster convergence and lower variability in positional offsets. This improvement is primarily attributed to the incorporation of terrain elevation as an a priori constraint, which effectively mitigates mismatches between simulated and observed waveforms and enhances the reliability of individual footprint estimates. As a result, the overall geolocation becomes more consistent and robust.
In terms of elevation correction, Figure 7 and Table 3 indicate that TC-Match significantly reduces both the mean absolute elevation residual and the standard deviation while substantially increasing the proportion of footprints with low residuals. These results suggest that this method is not only suitable for providing accurate and stable footprint geolocation but also for performing on-orbit calibration in complex terrain conditions.
Moreover, Figure 8 further reveals the distributional characteristics of residuals across different methods. The residuals corrected by TC-Match are more concentrated and nearly symmetric, exhibiting a sharper peak and a stronger central tendency—closely approximating a standard Gaussian distribution. This indicates this method’s clear advantage in suppressing systematic errors, further supporting its effectiveness and reliability in precise geolocation applications.
Although TC-Match demonstrates significant improvements in footprint geolocation stability and accuracy, its applicability is still subject to several methodological assumptions:
(1)
Dependence on terrain data quality: Both TC-Match and PCC-Match rely on simulated waveforms generated from digital surface models (DSMs). Consequently, the accuracy and resolution of DSMs directly affect the reliability of waveform matching and geolocation performance. In regions with outdated or low-resolution terrain data, the effectiveness of both methods may be compromised.
(2)
Simplified simulation assumptions: The waveform simulation component in this study followed widely accepted modeling approaches from prior research, involving simplified modeling of atmospheric transmission processes for laser pulses without explicitly considering time-dependent atmospheric conditions or orbital perturbations. While this simplification met the simulation requirements of the current study, incorporating dynamic atmospheric models or refined orbit information in future research could further reduce residual geolocation uncertainty, especially in scenarios sensitive to temporal or environmental variability.
(3)
The use of coordinate correction as a substitute for geometric inversion: Due to the absence of complete attitude and orbit metadata in the current GF-7 data package, this study employed a simplified coordinate correction strategy rather than a rigorous geometric inversion. Although this approach effectively compensates for systematic biases in practice, it does not explicitly distinguish between different sources of error (e.g., pointing errors versus ranging errors), and its performance may vary depending on local terrain conditions and orbit geometry.
(4)
Computational efficiency considerations: TC-Match requires slightly more processing time than PCC-Match due to its use of a constrained sliding correlation window. Based on benchmark experiments conducted on a Windows 11 system equipped with a 13th-Gen Intel (R) Core (TM) i9-13900HX CPU (2.20 GHz) using MATLAB 2021b, the average processing times per footprint were approximately 34.17 s for TC-Match and 33.91 s for PCC-Match. While the difference of 0.26 s per footprint reflects the added complexity introduced by terrain constraints, the overall runtime remains acceptable for typical post-processing and calibration applications.
Despite these limitations, TC-Match exhibits strong robustness and adaptability un-der complex terrain conditions, demonstrating practical potential for operational calibration and validation of spaceborne laser altimeters, particularly in regions where traditional methods face challenges due to complex terrain or insufficient geolocation reliability.
Future work will aim to address the identified limitations by integrating dynamic atmospheric modeling, enabling full geometric inversion with complete metadata, and optimizing computational performance through algorithm refinement.

5. Conclusions

In mountainous regions with significant elevation variations, errors in spaceborne laser altimetry and elevation discrepancies between simulated and observed waveforms often lead to waveform mismatches, reducing the accuracy and stability of footprint geolocation. This study proposed a terrain-constrained cross-correlation matching method for laser footprint geolocation. Using GF-7 satellite data, the proposed method was systematically compared with the traditional PCC-Match approach in representative regions with complex terrain. The main conclusions are as follows:
  • Regarding geolocation stability, extensive random sampling experiments show that TC-Match exhibited faster convergence and reduced variability in geolocation outcomes across varying footprint sample sizes. When the number of footprints exceeded 40, the standard deviations of the geolocation offsets in both the east–west and north–south directions remained below 2 m. This performance notably surpassed PCC-Match, demonstrating enhanced stability and robustness.
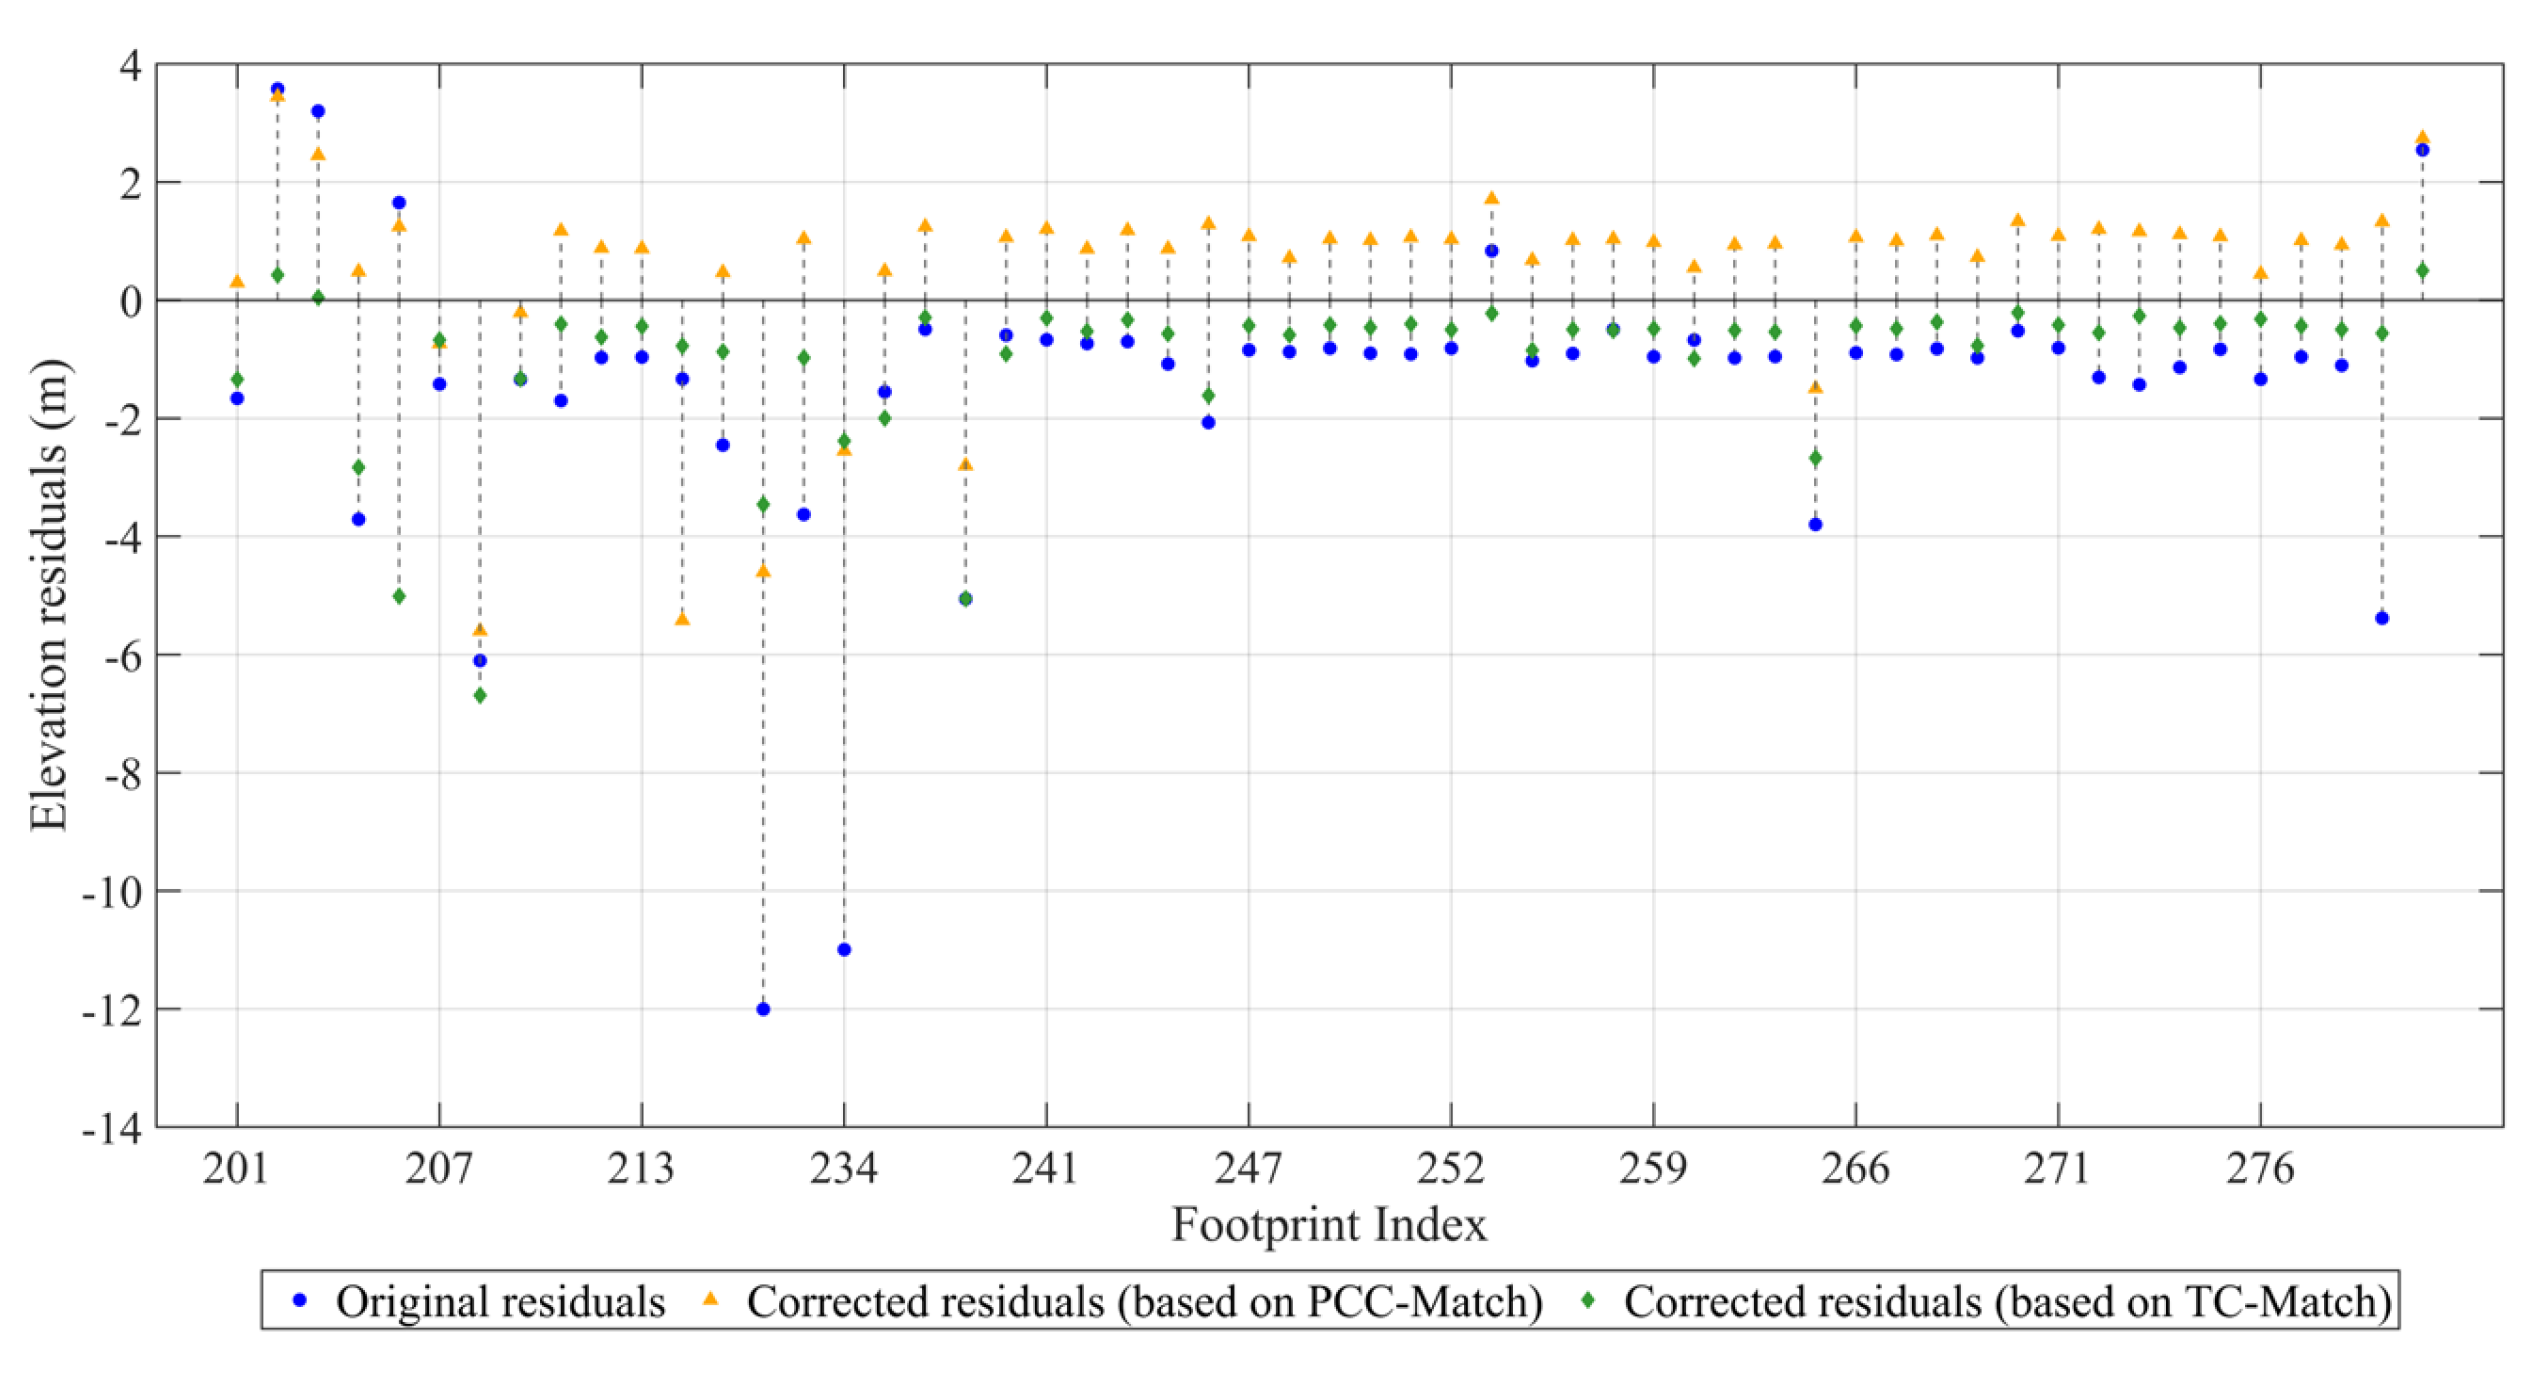
  • Regarding elevation residual correction, the experimental results indicate that TC-Match reduced the standard deviation of the elevation residuals for the region C footprints to 1.34 m, outperforming both PCC-Match (1.70 m) and the original data (2.58 m). Table 3, along with Figure 7 and Figure 8, further demonstrates that TC-Match surpassed traditional methods in terms of enhancing footprint elevation accuracy, reducing extreme errors, and correcting systematic biases. Consequently, it significantly improved the consistency and usability of the elevation products.
  • Regarding residual distribution characteristics, the probability density fitting results indicate that the elevation residual distribution after TC-Match correction was closer to a standard normal distribution, exhibiting stronger symmetry and concentration. This indicates that TC-Match possesses an enhanced ability to suppress systematic biases and improve the consistency of geolocation outcomes.
In summary, the TC-Match method comprehensively outperforms PCC-Match in geometric footprint geolocation accuracy, elevation correction, and systematic bias mitigation. It is especially effective in areas with substantial topographic variations and complex surface features. Future research should further integrate waveform quality assessment and pattern recognition strategies to optimize the matching process. Additionally, this method could be extended through collaboration with multi-source remote sensing data. This would enhance its adaptability and practicality in extreme terrain and complex surface conditions, providing robust technical support for on-orbit calibration and generation of high-precision spaceborne laser altimetry products.

Author Contributions

Conceptualization, S.Z.; Methodology, S.Z.; Software, S.Z. and J.Y.; Validation, S.Z. and J.Y.; Formal Analysis, S.Z., P.Z., and Y.M.; Investigation, S.Z. and S.L.; Resources, S.Z., P.Z., Q.H., Y.M., H.Z., and S.L.; Data Curation, S.Z.; Writing—Original Draft Preparation, S.Z.; Writing—Review and Editing, S.Z., P.Z., and S.L.; Visualization, S.Z.; Supervision, S.Z., P.Z., and S.L.; Funding Acquisition, Y.M., H.Z., and S.L. All authors have read and agreed to the published version of the manuscript.

Funding

This research was funded by the National Natural Science Foundation of China (Nos. 42371440 and 41971302).

Data Availability Statement

No new data were created or analyzed in this study. Data sharing is not applicable to this article.

Acknowledgments

The authors sincerely thank the Chinese GF-7 satellite mission for providing satellite data support and the United States Geological Survey (USGS) for providing the airborne LiDAR datasets.

Conflicts of Interest

The authors declare no conflicts of interest.

Abbreviations

The following abbreviations are used in this manuscript:
PCC-MatchPearson correlation coefficient matching
TC-MatchTerrain-constrained cross-correlation matching
GF-7GaoFen-7
GEDIGlobal Ecosystem Dynamics Investigation
TECMTerrestrial Ecosystem Carbon Monitoring
PCCPearson correlation coefficient
DEMDigital Elevation Model
GLASGeoscience Laser Altimeter System
DSMDigital surface model
LPCLiDAR point cloud
USGSUnited States Geological Survey

References

  1. Morshed, A.H. Laser Altimetry and Its Application in Geographic Scanning. In Proceedings of the Seventeenth National Radio Science Conference, Minufiya, Egypt, 22–24 February 2000; p. D4–1. [Google Scholar] [CrossRef]
  2. Xiao, H.; Stark, A.; Steinbrügge, G.; Hussmann, H.; Oberst, J. Processing of Laser Altimeter Time-of-Flight Measurements to Geodetic Coordinates. J. Geod. 2021, 95, 22. [Google Scholar] [CrossRef]
  3. Abshire, J.B.; Sun, X.; Riris, H.; Sirota, J.M.; McGarry, J.F.; Palm, S.; Yi, D.; Liiva, P. Geoscience Laser Altimeter System (GLAS) on the ICESat Mission: On-orbit Measurement Performance. Geophys. Res. Lett. 2005, 32, 2005GL024028. [Google Scholar] [CrossRef]
  4. Ewert, H.; Groh, A.; Dietrich, R. Volume and Mass Changes of the Greenland Ice Sheet Inferred from ICESat and GRACE. J. Geodyn. 2012, 59, 111–123. [Google Scholar] [CrossRef]
  5. Wang, C.; Tang, F.; Li, L.; Li, G.; Cheng, F.; Xi, X. Wavelet Analysis for ICESat/GLAS Waveform Decomposition and Its Application in Average Tree Height Estimation. IEEE Geosci. Remote Sens. Lett. 2013, 10, 115–119. [Google Scholar] [CrossRef]
  6. Duncanson, L.; Neuenschwander, A.; Hancock, S.; Thomas, N.; Fatoyinbo, T.; Simard, M.; Silva, C.A.; Armston, J.; Luthcke, S.B.; Hofton, M.; et al. Biomass Estimation from Simulated GEDI, ICESat-2 and NISAR across Environmental Gradients in Sonoma County, California. Remote Sens. Environ. 2020, 242, 111779. [Google Scholar] [CrossRef]
  7. Harding, D.J.; Carabajal, C.C. ICESat Waveform Measurements of Within-footprint Topographic Relief and Vegetation Vertical Structure. Geophys. Res. Lett. 2005, 32, 2005GL023471. [Google Scholar] [CrossRef]
  8. Peng, K.; Xie, H.; Xu, Q.; Huang, P.; Liu, Z. A Physics-Assisted Convolutional Neural Network for Bathymetric Mapping Using ICESat-2 and Sentinel-2 Data. IEEE Trans. Geosci. Remote Sens. 2022, 60, 4210513. [Google Scholar] [CrossRef]
  9. Tang, X.; Xie, J.; Liu, R.; Huang, G.; Zhao, C.; Zhen, Y.; Tang, H.; Dou, X. Overview of the GF-7 Laser Altimeter System Mission. Earth Space Sci. 2020, 7, e2019EA000777. [Google Scholar] [CrossRef]
  10. Xie, J.; Liu, R.; Tang, X.; Yang, X.; Zeng, J.; Mo, F.; Mei, Y. A Geometric Calibration Method without a Field Site of the GF-7 Satellite Laser Relying on a Surface Mathematical Model. IEEE Trans. Geosci. Remote Sens. 2023, 61, 5700214. [Google Scholar] [CrossRef]
  11. Li, G.; Guo, J.; Tang, X.; Ye, F.; Zuo, Z.; Liu, Z.; Chen, J.; Xue, Y. Preliminary Quality Analysis of Gf-7 Satellite Laser Altimeter Full Waveform Data. Int. Arch. Photogramm. Remote Sens. Spat. Inf. Sci. 2020, 43, 129–134. [Google Scholar] [CrossRef]
  12. Li, S.; Zhang, G.; Fan, X. Rigorous Sensor Model of Gaofen-7 Satellite Laser Altimeter Based on Coupled Footprint Camera. IEEE J. Sel. Top. Appl. Earth Obs. Remote Sens. 2023, 16, 1815–1826. [Google Scholar] [CrossRef]
  13. Gardner, C.S. Ranging Performance of Satellite Laser Altimeters. IEEE Trans. Geosci. Remote Sens. 1992, 30, 1061–1072. [Google Scholar] [CrossRef]
  14. Zhao, P.; Li, S.; Ma, Y.; Liu, X.; Yang, J.; Yu, D. A New Terrain Matching Method for Estimating Laser Pointing and Ranging Systematic Biases for Spaceborne Photon-Counting Laser Altimeters. ISPRS J. Photogramm. Remote Sens. 2022, 188, 220–236. [Google Scholar] [CrossRef]
  15. Yi, H.; Li, S.; Ma, Y.; Huang, K.; Zhou, H.; Shi, G. On-Orbit Calibration of Satellite Laser Altimeters Based on Footprint Detection. Acta Phys. Sin. 2017, 66, 134206. [Google Scholar] [CrossRef]
  16. Huang, J.; Li, G.; Gao, X.; Wang, J.; Fan, W.; Zhou, S. Ranging Error Analysis of Single Photon Satellite Laser Altimetry under Different Terrain Conditions. Proc. SPIE Fourth Semin. Nov. Optoelectron. Detect. Technol. Appl. 2018, 10697, 340–350. [Google Scholar] [CrossRef]
  17. Wang, C.; Yang, X.; Xi, X.; Zhang, H.; Chen, S.; Peng, S.; Zhu, X. Evaluation of Footprint Horizontal Geolocation Accuracy of Spaceborne Full-Waveform LiDAR Based on Digital Surface Model. IEEE J. Sel. Top. Appl. Earth Obs. Remote Sens. 2020, 13, 2135–2144. [Google Scholar] [CrossRef]
  18. Li, X.; Li, L.; Ni, W.; Mu, X.; Wu, X.; Vaglio Laurin, G.; Vangi, E.; Stereńczak, K.; Chirici, G.; Yu, S.; et al. Validating GEDI Tree Canopy Cover Product across Forest Types Using Co-Registered Aerial LiDAR Data. ISPRS J. Photogramm. Remote Sens. 2024, 207, 326–337. [Google Scholar] [CrossRef]
  19. Li, G.; Gao, X.; Hu, F.; Guo, A.; Liu, Z.; Chen, J.; Liu, C.; Nie, S.; Fu, A. Overview of the terrestrial ecosystem carbon monitoring satellite laser altimeter. Int. Arch. Photogramm. Remote Sens. Spat. Inf. Sci. 2022, 43, 53–58. [Google Scholar] [CrossRef]
  20. Li, B.; Xie, H.; Tong, X.; Zhang, Z.; Liu, S. Extracting Satellite Laser Altimetry Footprints with the Required Accuracy by Random Forest. IEEE Geosci. Remote Sens. Lett. 2021, 18, 1347–1351. [Google Scholar] [CrossRef]
  21. Tang, H.; Stoker, J.; Luthcke, S.; Armston, J.; Lee, K.; Blair, B.; Hofton, M. Evaluating and Mitigating the Impact of Systematic Geolocation Error on Canopy Height Measurement Performance of GEDI. Remote Sens. Environ. 2023, 291, 113571. [Google Scholar] [CrossRef]
  22. Tang, X.; Xie, J.; Gao, X.; Mo, F.; Feng, W.; Liu, R. The In-Orbit Calibration Method Based on Terrain Matching with Pyramid-Search for the Spaceborne Laser Altimeter. IEEE J. Sel. Top. Appl. Earth Obs. Remote Sens. 2019, 12, 1053–1062. [Google Scholar] [CrossRef]
  23. Liu, X.; Liu, X.; Wang, Z.; Huang, G.; Shu, R. Classification of Laser Footprint Based on Random Forest in Mountainous Area Using GLAS Full-Waveform Features. IEEE J. Sel. Top. Appl. Earth Obs. Remote Sens. 2022, 15, 2284–2297. [Google Scholar] [CrossRef]
  24. Zhang, W.; Li, S.; Zhang, Z.; Liu, R.; Ma, Y. Using waveform matching to precisely locate footprints of a satellite laser altimeter. Infrared Laser Eng. 2018, 47, 1117007. [Google Scholar] [CrossRef]
  25. Liu, Z.; Gao, X.; Li, G.; Chen, J. Decomposition Techniques for Icesat/Glas Full-Waveform Data. Int. Arch. Photogramm. Remote Sens. Spat. Inf. Sci. 2018, 42, 1179–1182. [Google Scholar] [CrossRef]
  26. Wu, Y.; Wang, H.; Han, Q.; Long, X.; Ma, Y.; Li, Q.; Zhao, P.; Li, S. A waveform matching-based method of improving laser footprint geolocation for GaoFen-7 spaceborne laser altimeter in mountainous areas. J. Infrared Millim. Waves 2022, 41, 1051–1061. [Google Scholar] [CrossRef]
  27. Blair, J.B.; Hofton, M.A. Modeling Laser Altimeter Return Waveforms over Complex Vegetation Using High-resolution Elevation Data. Geophys. Res. Lett. 1999, 26, 2509–2512. [Google Scholar] [CrossRef]
  28. Liu, R.; Xie, J. Calibration of the Laser Pointing Bias of the GaoFen-7 Satellite Based on Simulation Waveform Matching. Opt. Express 2021, 29, 21844. [Google Scholar] [CrossRef]
  29. Yang, X.; Wang, C.; Xi, X.; Wang, Y.; Zhang, Y.; Zhou, G. Footprint Size Design of Large-Footprint Full-Waveform LiDAR for Forest and Topography Applications: A Theoretical Study. IEEE Trans. Geosci. Remote Sens. 2021, 59, 9745–9757. [Google Scholar] [CrossRef]
  30. Li, S.; Li, C.; Zhang, G.; Wang, Y. Geometric Calibration of Satellite Laser Altimeters Based on Waveform Matching. Photogramm. Rec. 2021, 36, 104–123. [Google Scholar] [CrossRef]
  31. Li, S.; Yu, Q.; Fu, A.; Zhang, G. A Calibration Method for Large-Footprint Full-Waveform Airborne Laser Altimeter without a Calibration Field. Remote Sens. 2023, 15, 2789. [Google Scholar] [CrossRef]
  32. Yang, X.; Wang, Y.; Yin, T.; Wang, C.; Lauret, N.; Regaieg, O.; Xi, X.; Gastellu-Etchegorry, J.P. Comprehensive LiDAR Simulation with Efficient Physically-Based DART-Lux Model (I): Theory, Novelty, and Consistency Validation. Remote Sens. Environ. 2022, 272, 112952. [Google Scholar] [CrossRef]
  33. Xu, Y.; Ding, S.; Chen, P.; Tang, H.; Ren, H.; Huang, H. Horizontal Geolocation Error Evaluation and Correction on Full-Waveform LiDAR Footprints via Waveform Matching. Remote Sens. 2023, 15, 776. [Google Scholar] [CrossRef]
  34. Xu, Q.; Xie, H.; Huang, P.; Ji, M.; Wu, H.; Liu, C.; Liu, S.; Tong, X.; Jin, Y.; Sun, Y.; et al. An On-Orbit Calibration Model for Full-Waveform Laser Altimeters by Matching Single-Modal and Multi-Modal Waveforms. IEEE J. Sel. Top. Appl. Earth Obs. Remote Sens. 2025, 18, 8706–8728. [Google Scholar] [CrossRef]
  35. Li, G.; Tang, X.; Zhou, X.; Lu, G.; Chen, J.; Huang, G.; Gao, X.; Liu, Z.; Ou-Yang, S. The method of GF-7 satellite laser altimeter on-orbit geometric calibration without field site. Acta Geod. Cartogr. Sin. 2022, 51, 401–412. [Google Scholar] [CrossRef]
  36. Xu, C.; Xie, J.; Yang, X.; Lv, X. Positioning Improvement for Spaceborne Laser Footprint Based on Precisely Terrain Data. Int. Arch. Photogramm. Remote Sens. Spat. Inf. Sci. 2024, 48, 753–759. [Google Scholar] [CrossRef]
  37. Zhang, H.; Xu, Q.; Huang, P.; Chen, G.; Xie, H. High-precision terrain-based on-orbit geometric calibration method for laser altimeter. Bull Surv. Map. 2024, 7, 41–47. Available online: http://tb.chinasmp.com/CN/10.13474/j.cnki.11-2246.2024.0708 (accessed on 8 July 2025).
  38. Luthcke, S.B.; Thomas, T.C.; Pennington, T.A.; Rebold, T.W.; Nicholas, J.B.; Rowlands, D.D.; Gardner, A.S.; Bae, S. ICESat-2 Pointing Calibration and Geolocation Performance. Earth Space Sci. 2021, 8, e2020EA001494. [Google Scholar] [CrossRef]
  39. Zhou, S.; Zhao, P.; Han, Q.; Luan, C.; Yang, J.; Wang, H.; Ma, Y.; Zhou, H.; Li, S. Waveform frequency domain matching-based positioning method for satellite-borne LIDAR footprints. J. Infrared Millim. Waves 2025, 44, 412–423. [Google Scholar] [CrossRef]
  40. Li, G.; Tang, X.; Zhang, C.; Gao, X.; Chen, J. Multi-criteria constraint algorithm for selecting ICESat/GLAS data as elevation control points. J. Remote Sens. 2017, 21, 96–104. [Google Scholar] [CrossRef]
Figure 1. The workflow for obtaining the footprint correlation coefficient matrix based on TC-Match.
Remotesensing 17 02381 g001
Figure 2. Overpass region of GF-7 orbit 7434 (Beam 2).
Remotesensing 17 02381 g002
Figure 3. Feature visualization of Footprint 10. (a) The normalized spaceborne return waveform. (b) The DSM of the footprint area. (c) The correlation coefficient matrix of the footprint.
Remotesensing 17 02381 g003
Figure 4. Footprint geolocation distributions from 10,000 random sampling trials with different numbers of footprints ( N 3 ,   122 ). (a) The east–west direction. (b) The north–south direction. The positive directions are defined as due east and due north.
Remotesensing 17 02381 g004
Figure 5. Mean distributions of geolocation results from 10,000 random sampling trials with different numbers of footprints ( N 3 ,   122 ). (a) The east–west direction. (b) The north–south direction. The positive directions are defined as due east and due north.
Remotesensing 17 02381 g005
Figure 6. Standard deviation distributions of geolocation results from 10,000 random sampling trials with different numbers of footprints ( N 3 ,   122 ). (a) The east–west direction. (b) The north–south direction. The positive directions are defined as due east and due north.
Remotesensing 17 02381 g006
Figure 7. Elevation residuals of individual footprints before and after correction.
Remotesensing 17 02381 g007
Figure 8. Histogram of elevation residuals and Gaussian fitting curves.
Remotesensing 17 02381 g008
Table 1. Basic parameters of GF-7 satellite laser altimeter [9,11,35].
ParameterValue
Orbital altitude505.984 km
Wavelength1064 nm
Pulse width of emitted waveform4~8 ns
Laser beam divergence angle ( 30 ~ 35 )   μ rad
Telescope aperture600 mm
Sampling frequency2 GHz
Table 2. Grouping of footprints from GF-7 orbit 7434 (Beam 2).
GroupFootprint IndexNumber of FootprintsRegion
A1–6241Utah
B63–20029Northern Arizona
C201–30055Southern Arizona
Table 3. Percentages of footprints with different elevation residuals (%).
Δ h (m)OriginalCorrected by PCC-MatchCorrected by TC-Match
< 0.3 03.649.09
< 0.6 7.2712.7363.64
< 0.9 32.7327.2775.55
< 1.2 58.1869.0980.00
< 1.5 69.0983.6483.64
< 1.8 76.3685.4585.45
< 2.1 78.1885.4587.27
< 2.4 78.1885.4589.09
2.4 21.8214.5510.91
Disclaimer/Publisher’s Note: The statements, opinions and data contained in all publications are solely those of the individual author(s) and contributor(s) and not of MDPI and/or the editor(s). MDPI and/or the editor(s) disclaim responsibility for any injury to people or property resulting from any ideas, methods, instructions or products referred to in the content.

