

An Elevation-Coupled Multivariate Regression Model for GNSS-Based FY-4A Precipitable Water Vapor

Abstract

1. Introduction
2. Methods
2.1. GNSS PWV
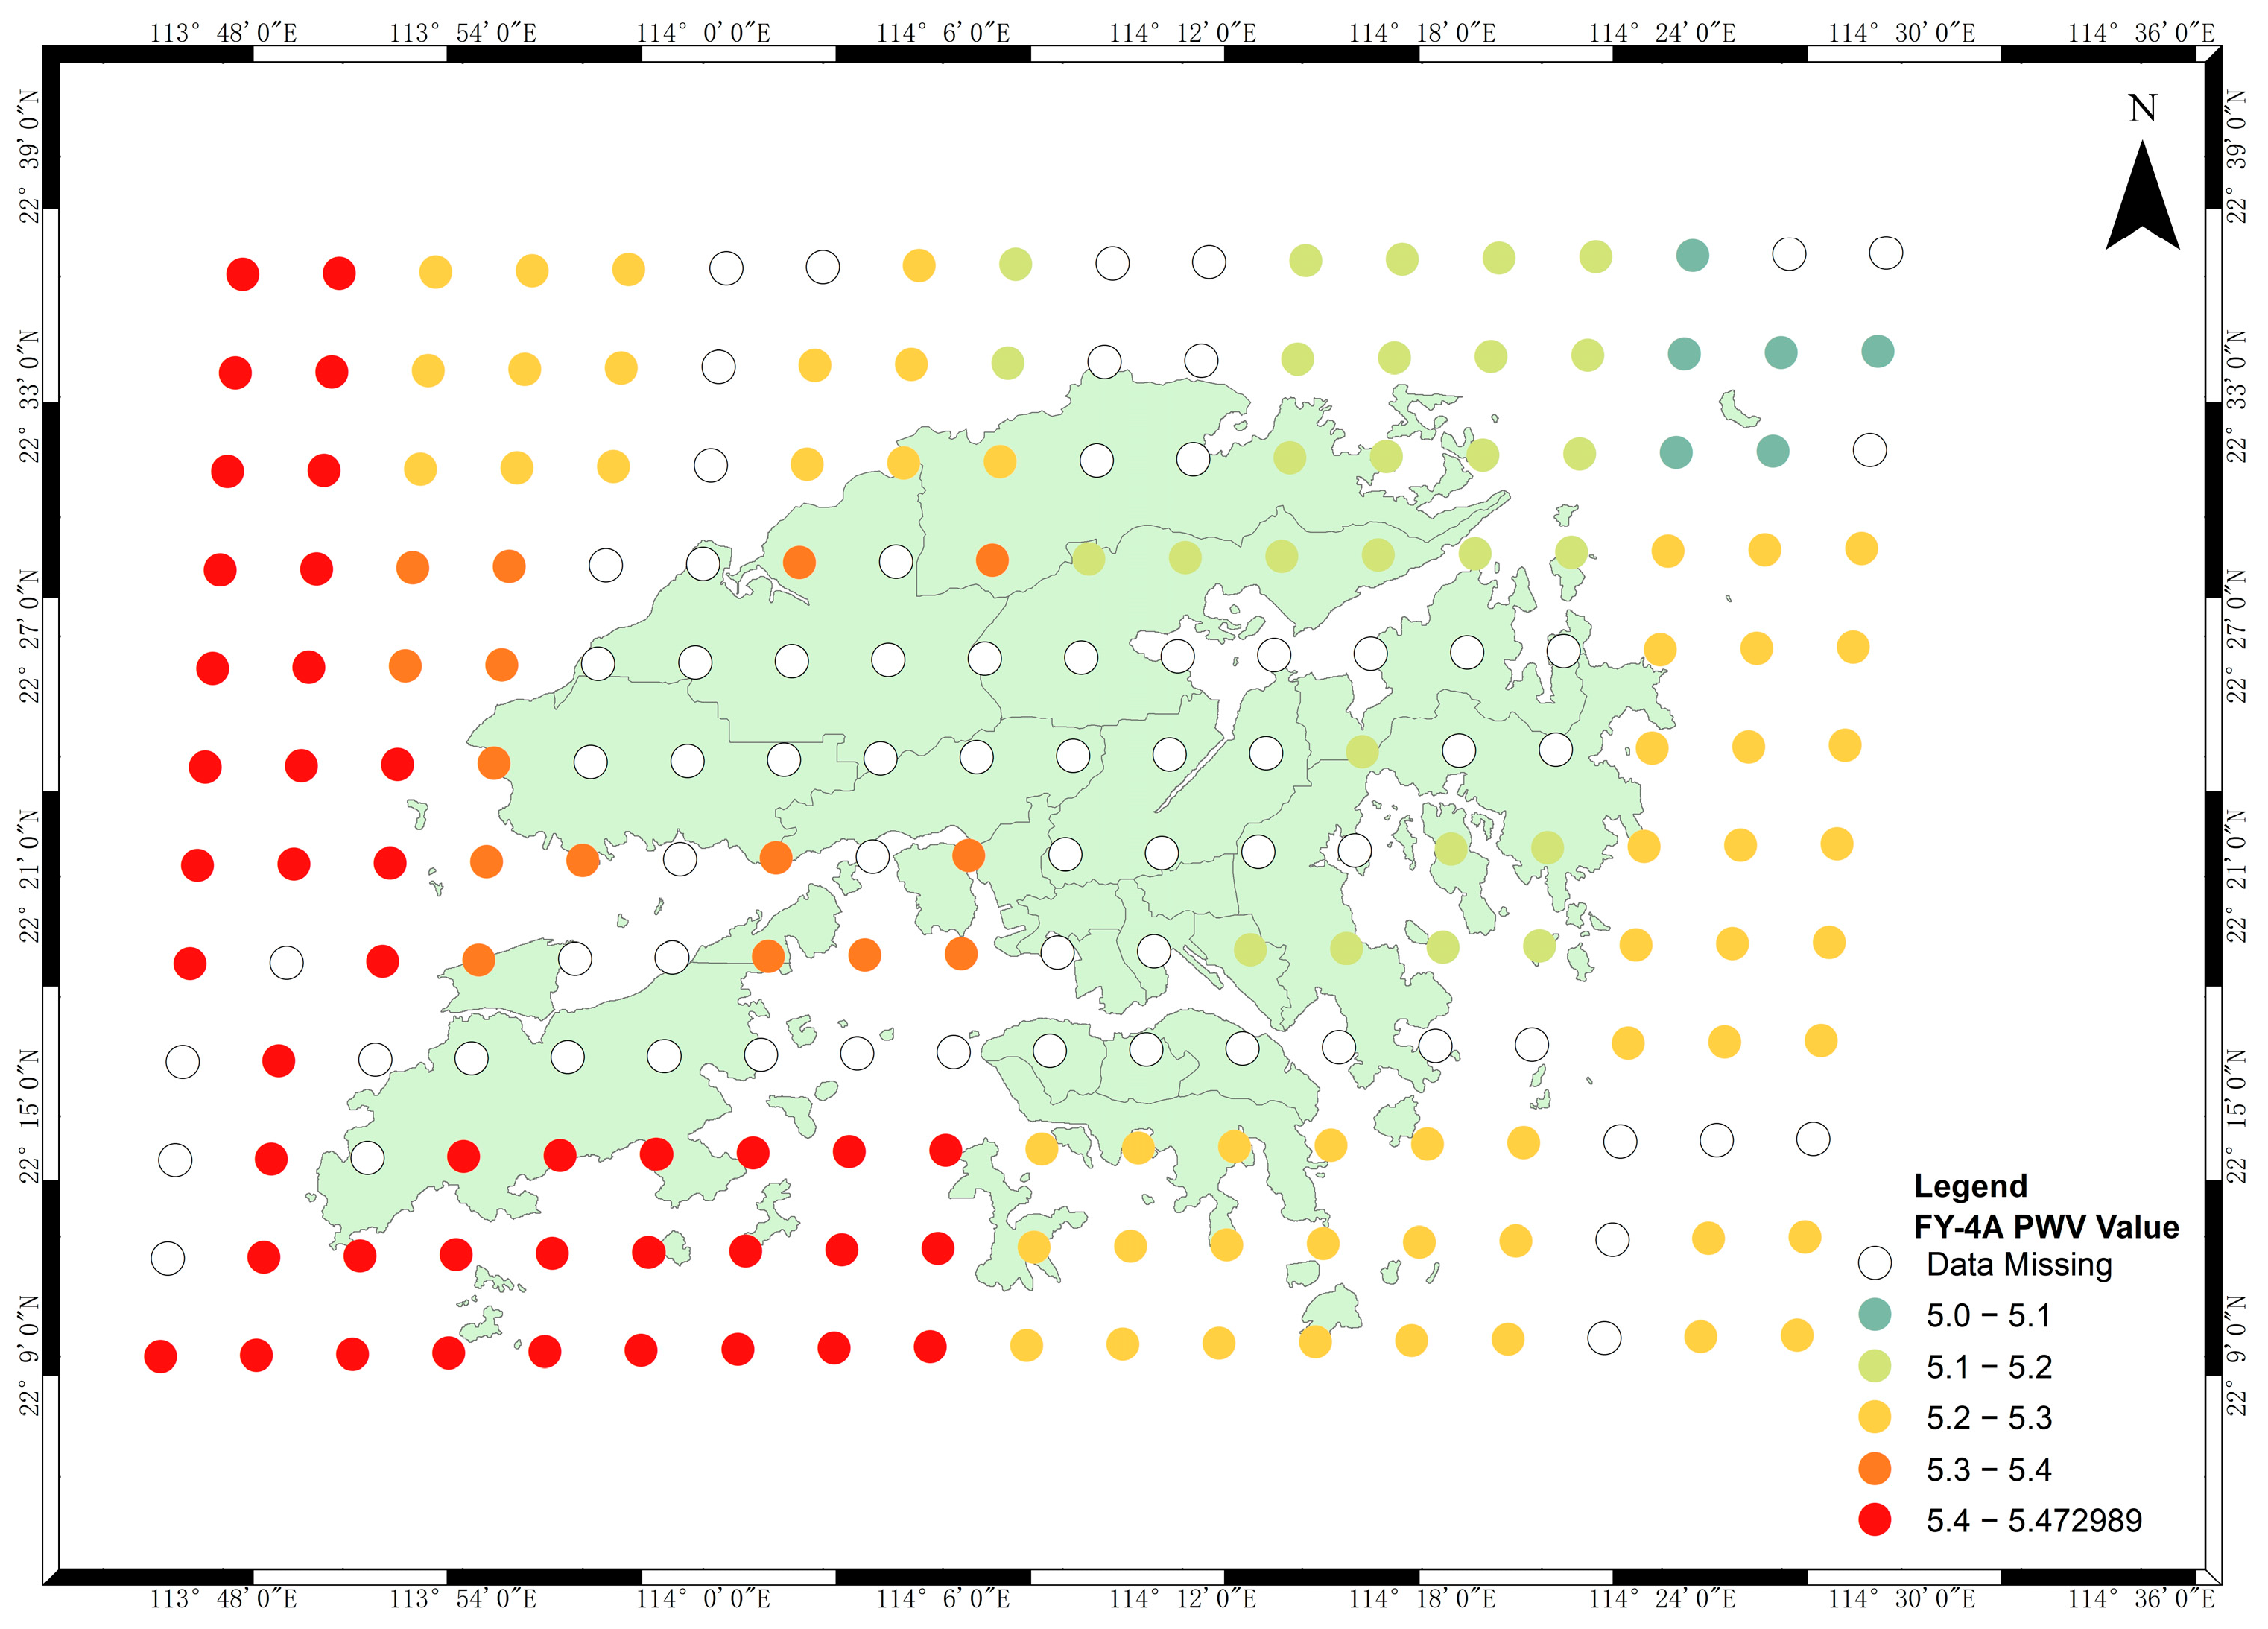
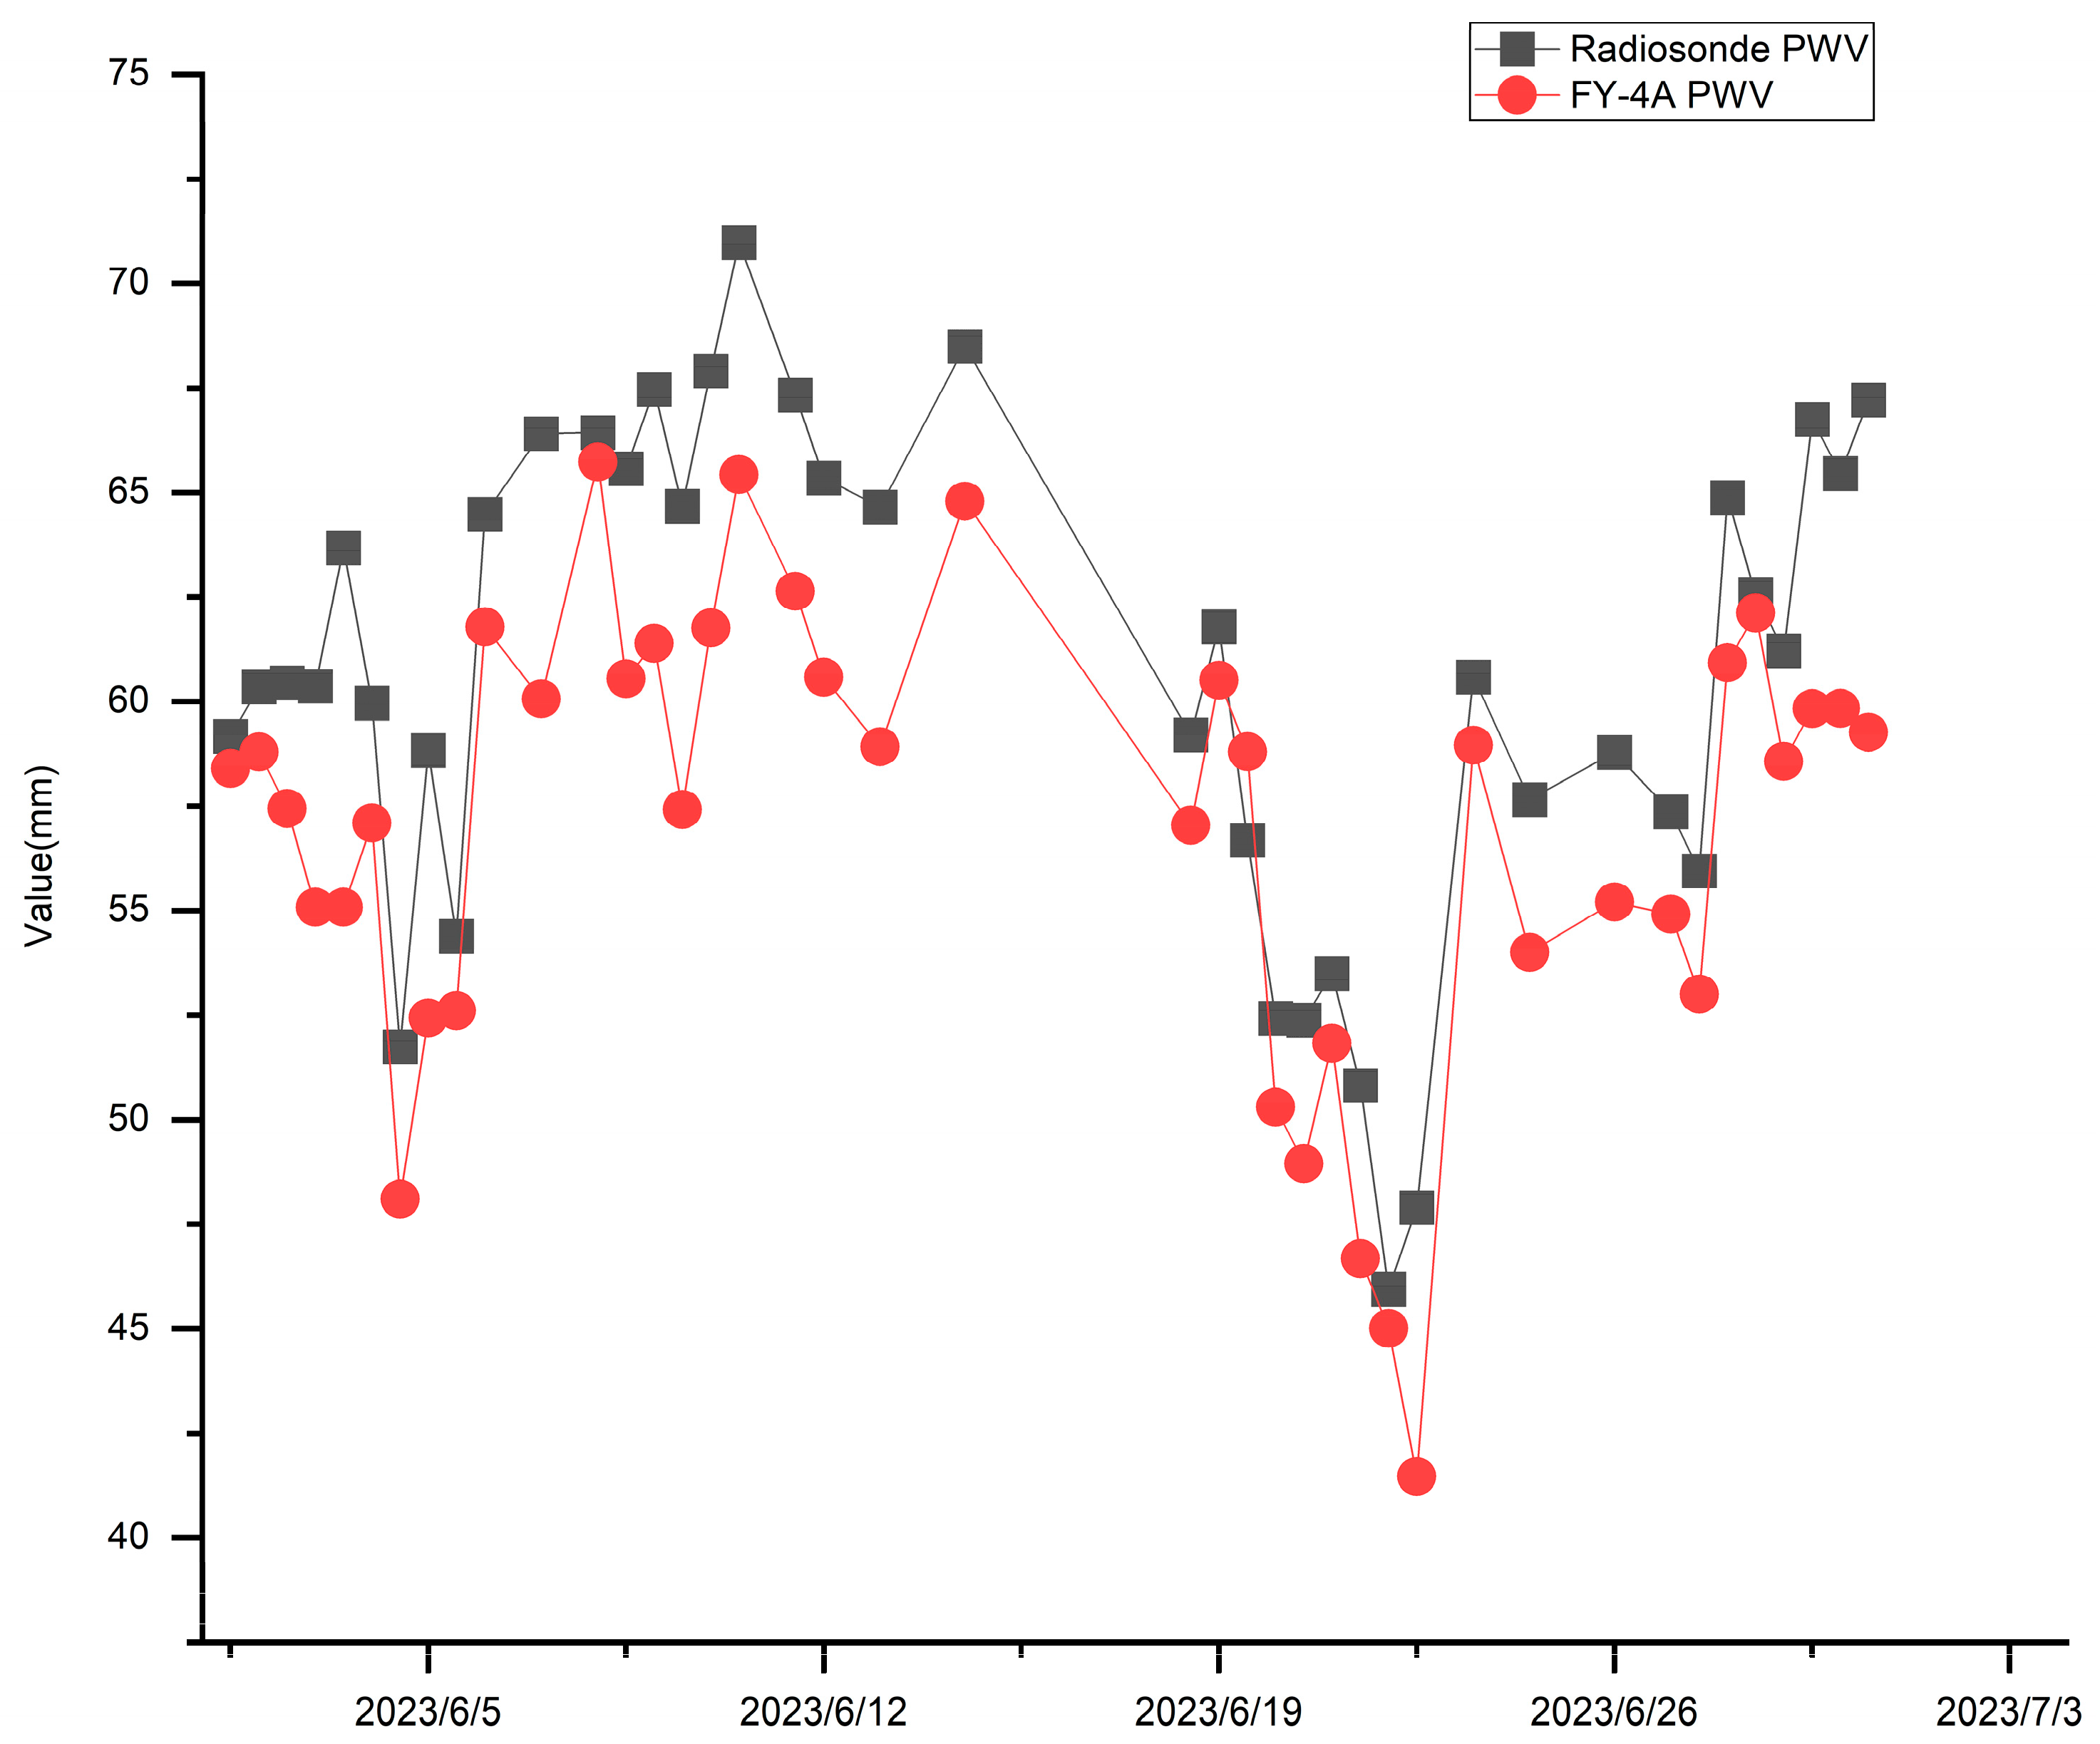
2.2. FY-4A PWV
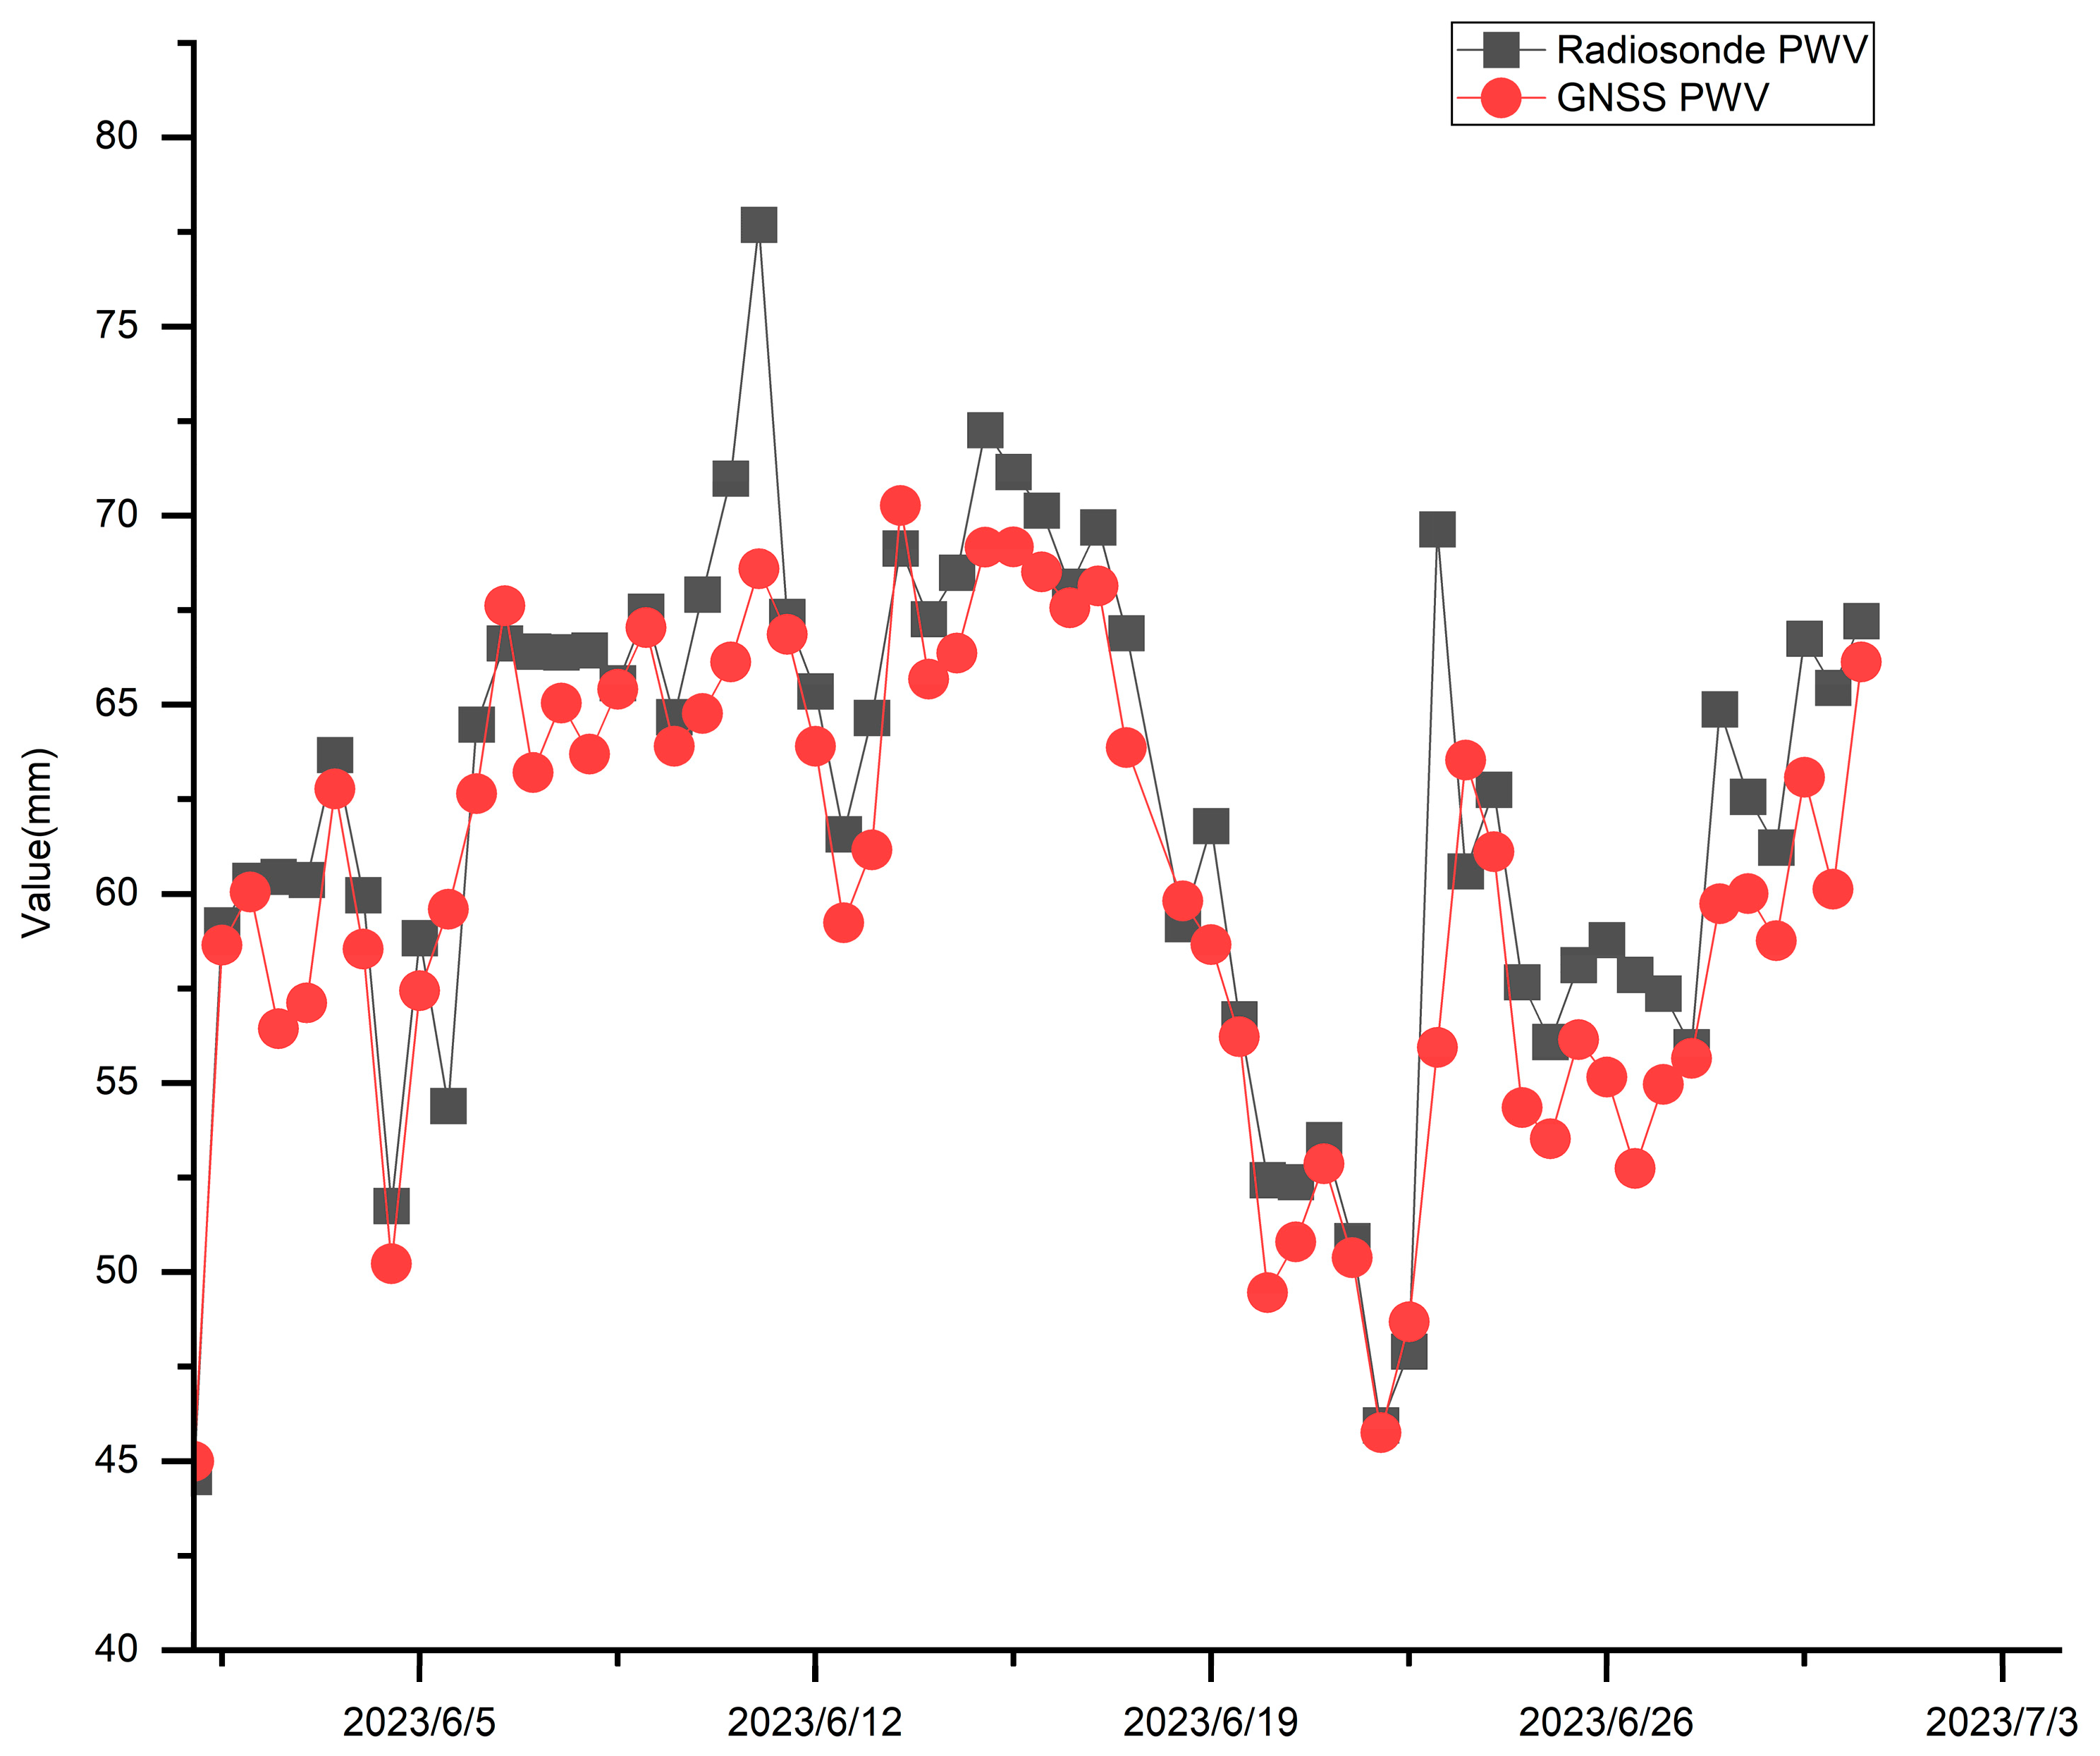
2.3. Radiosonde PWV
3. Data Processing
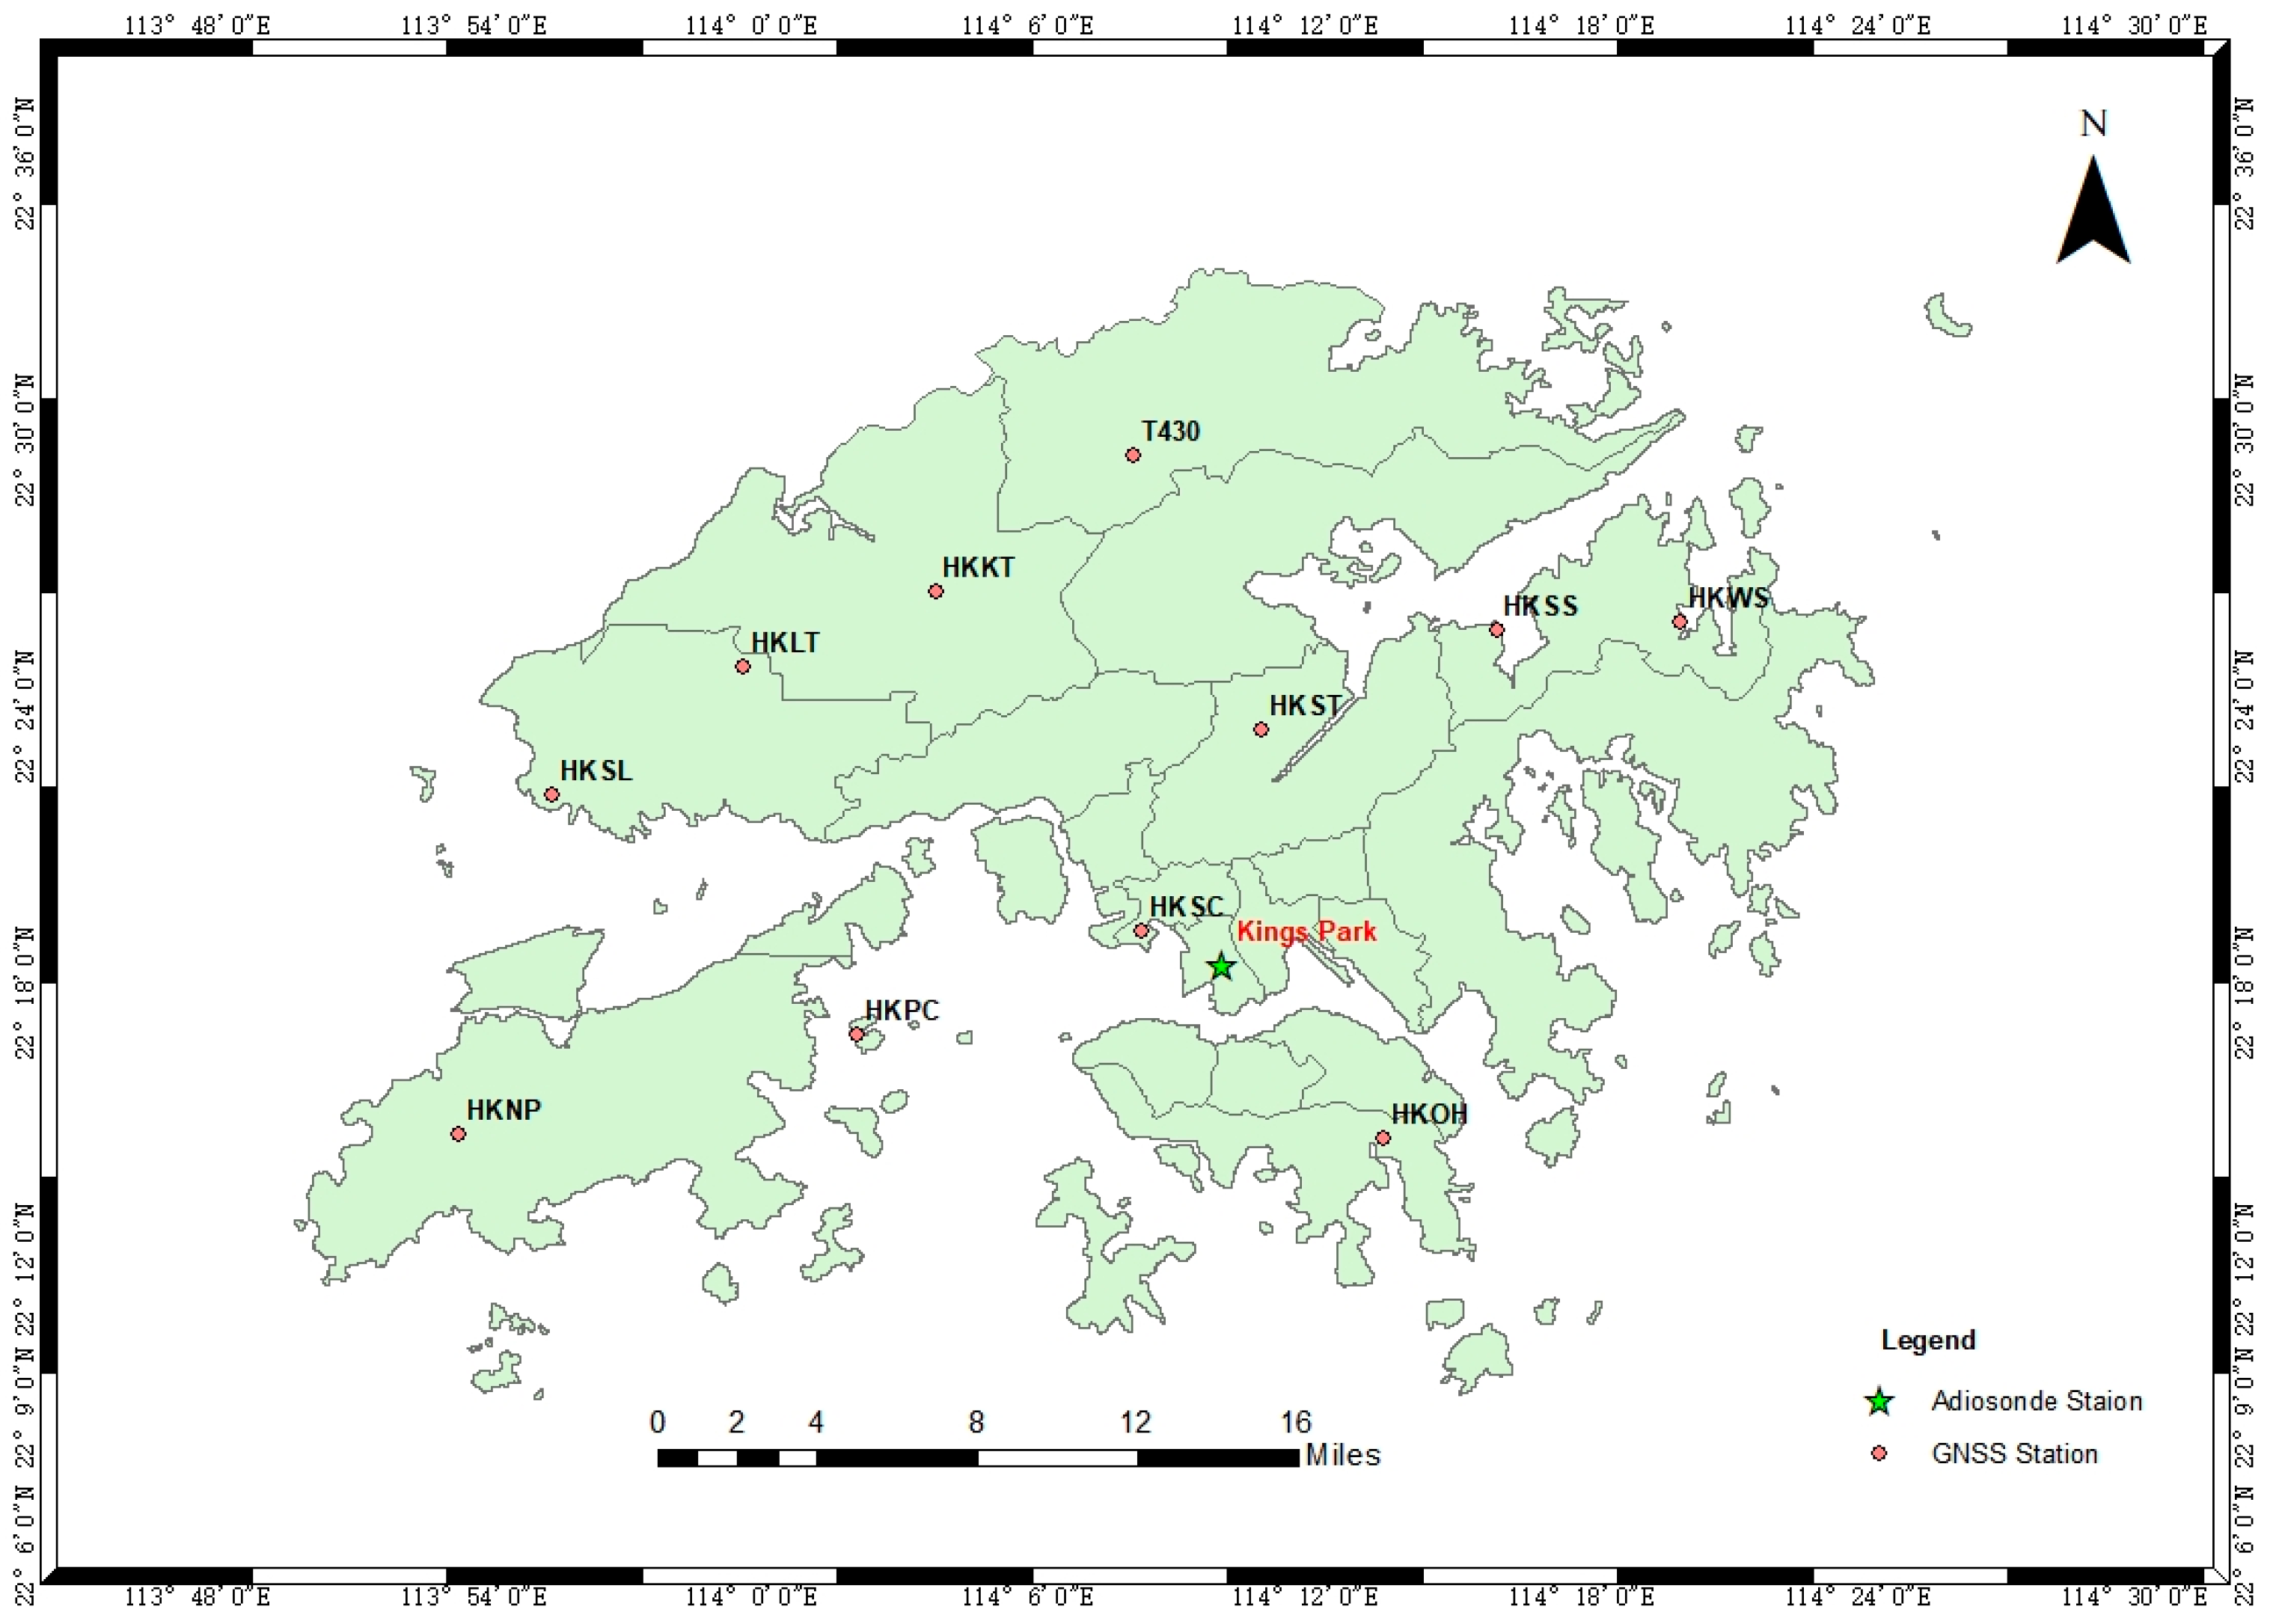
3.1. Experiment Location
3.2. Data Introduction
3.3. Data Preprocessing
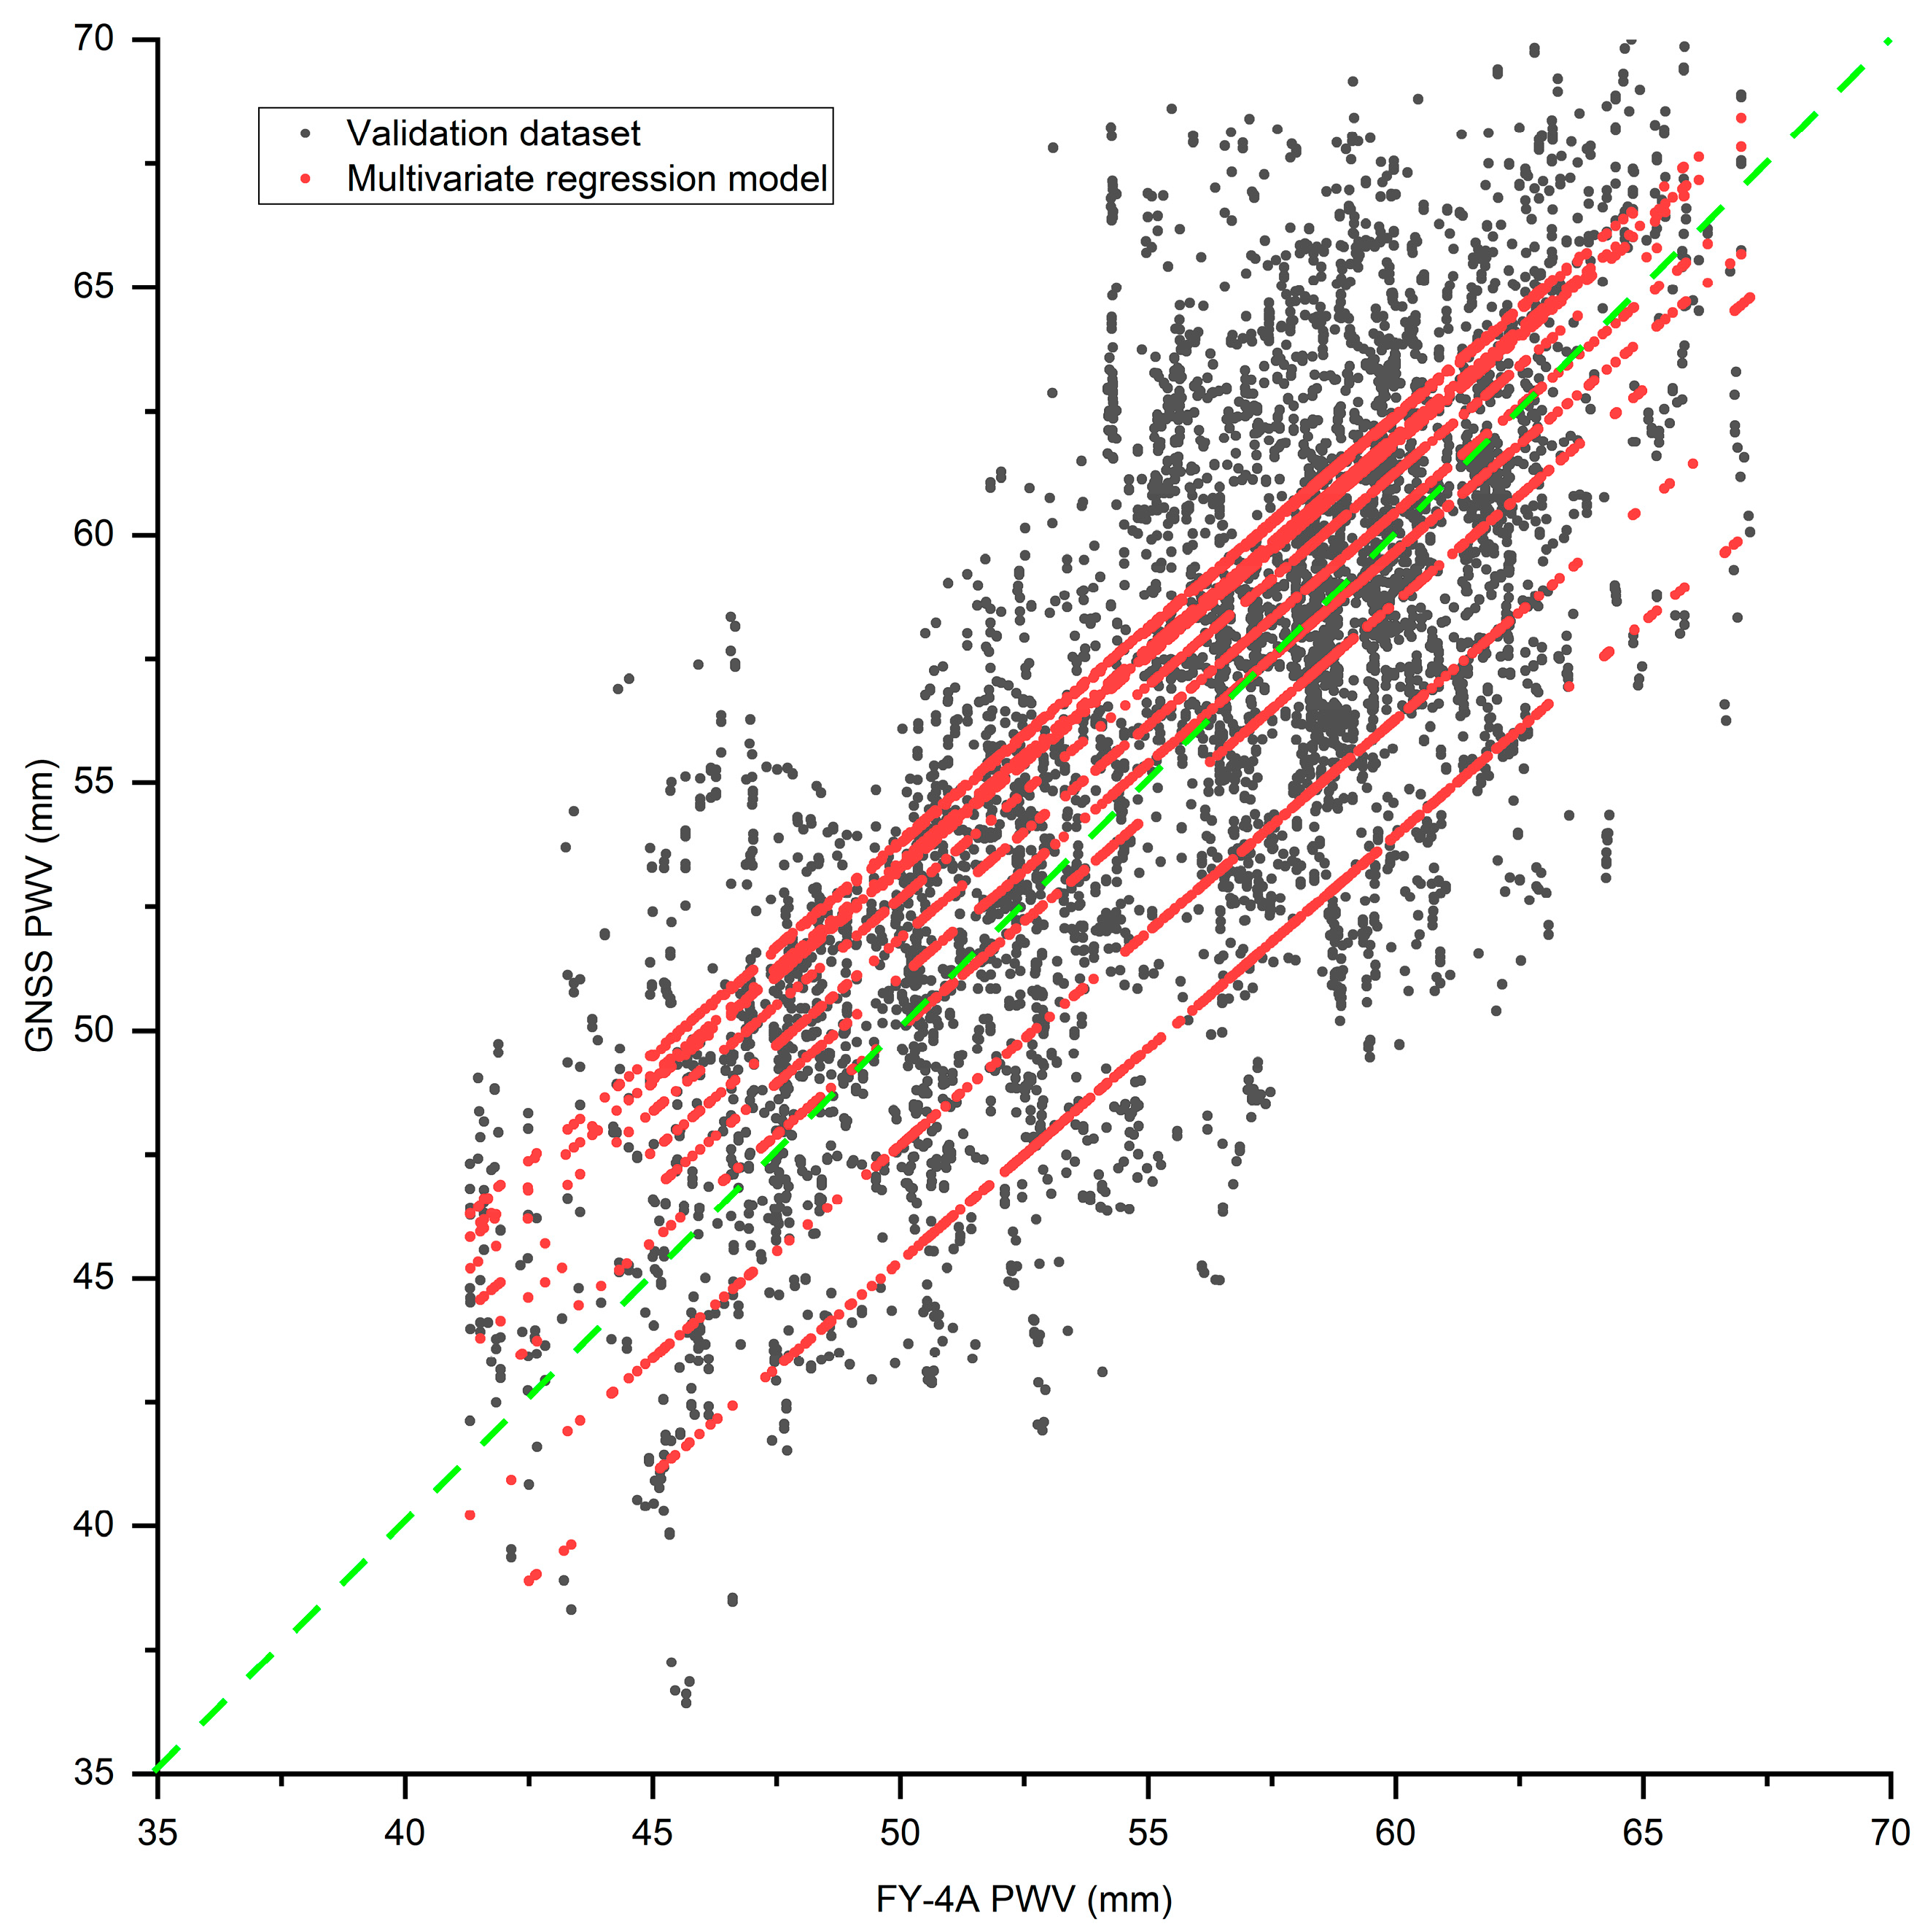
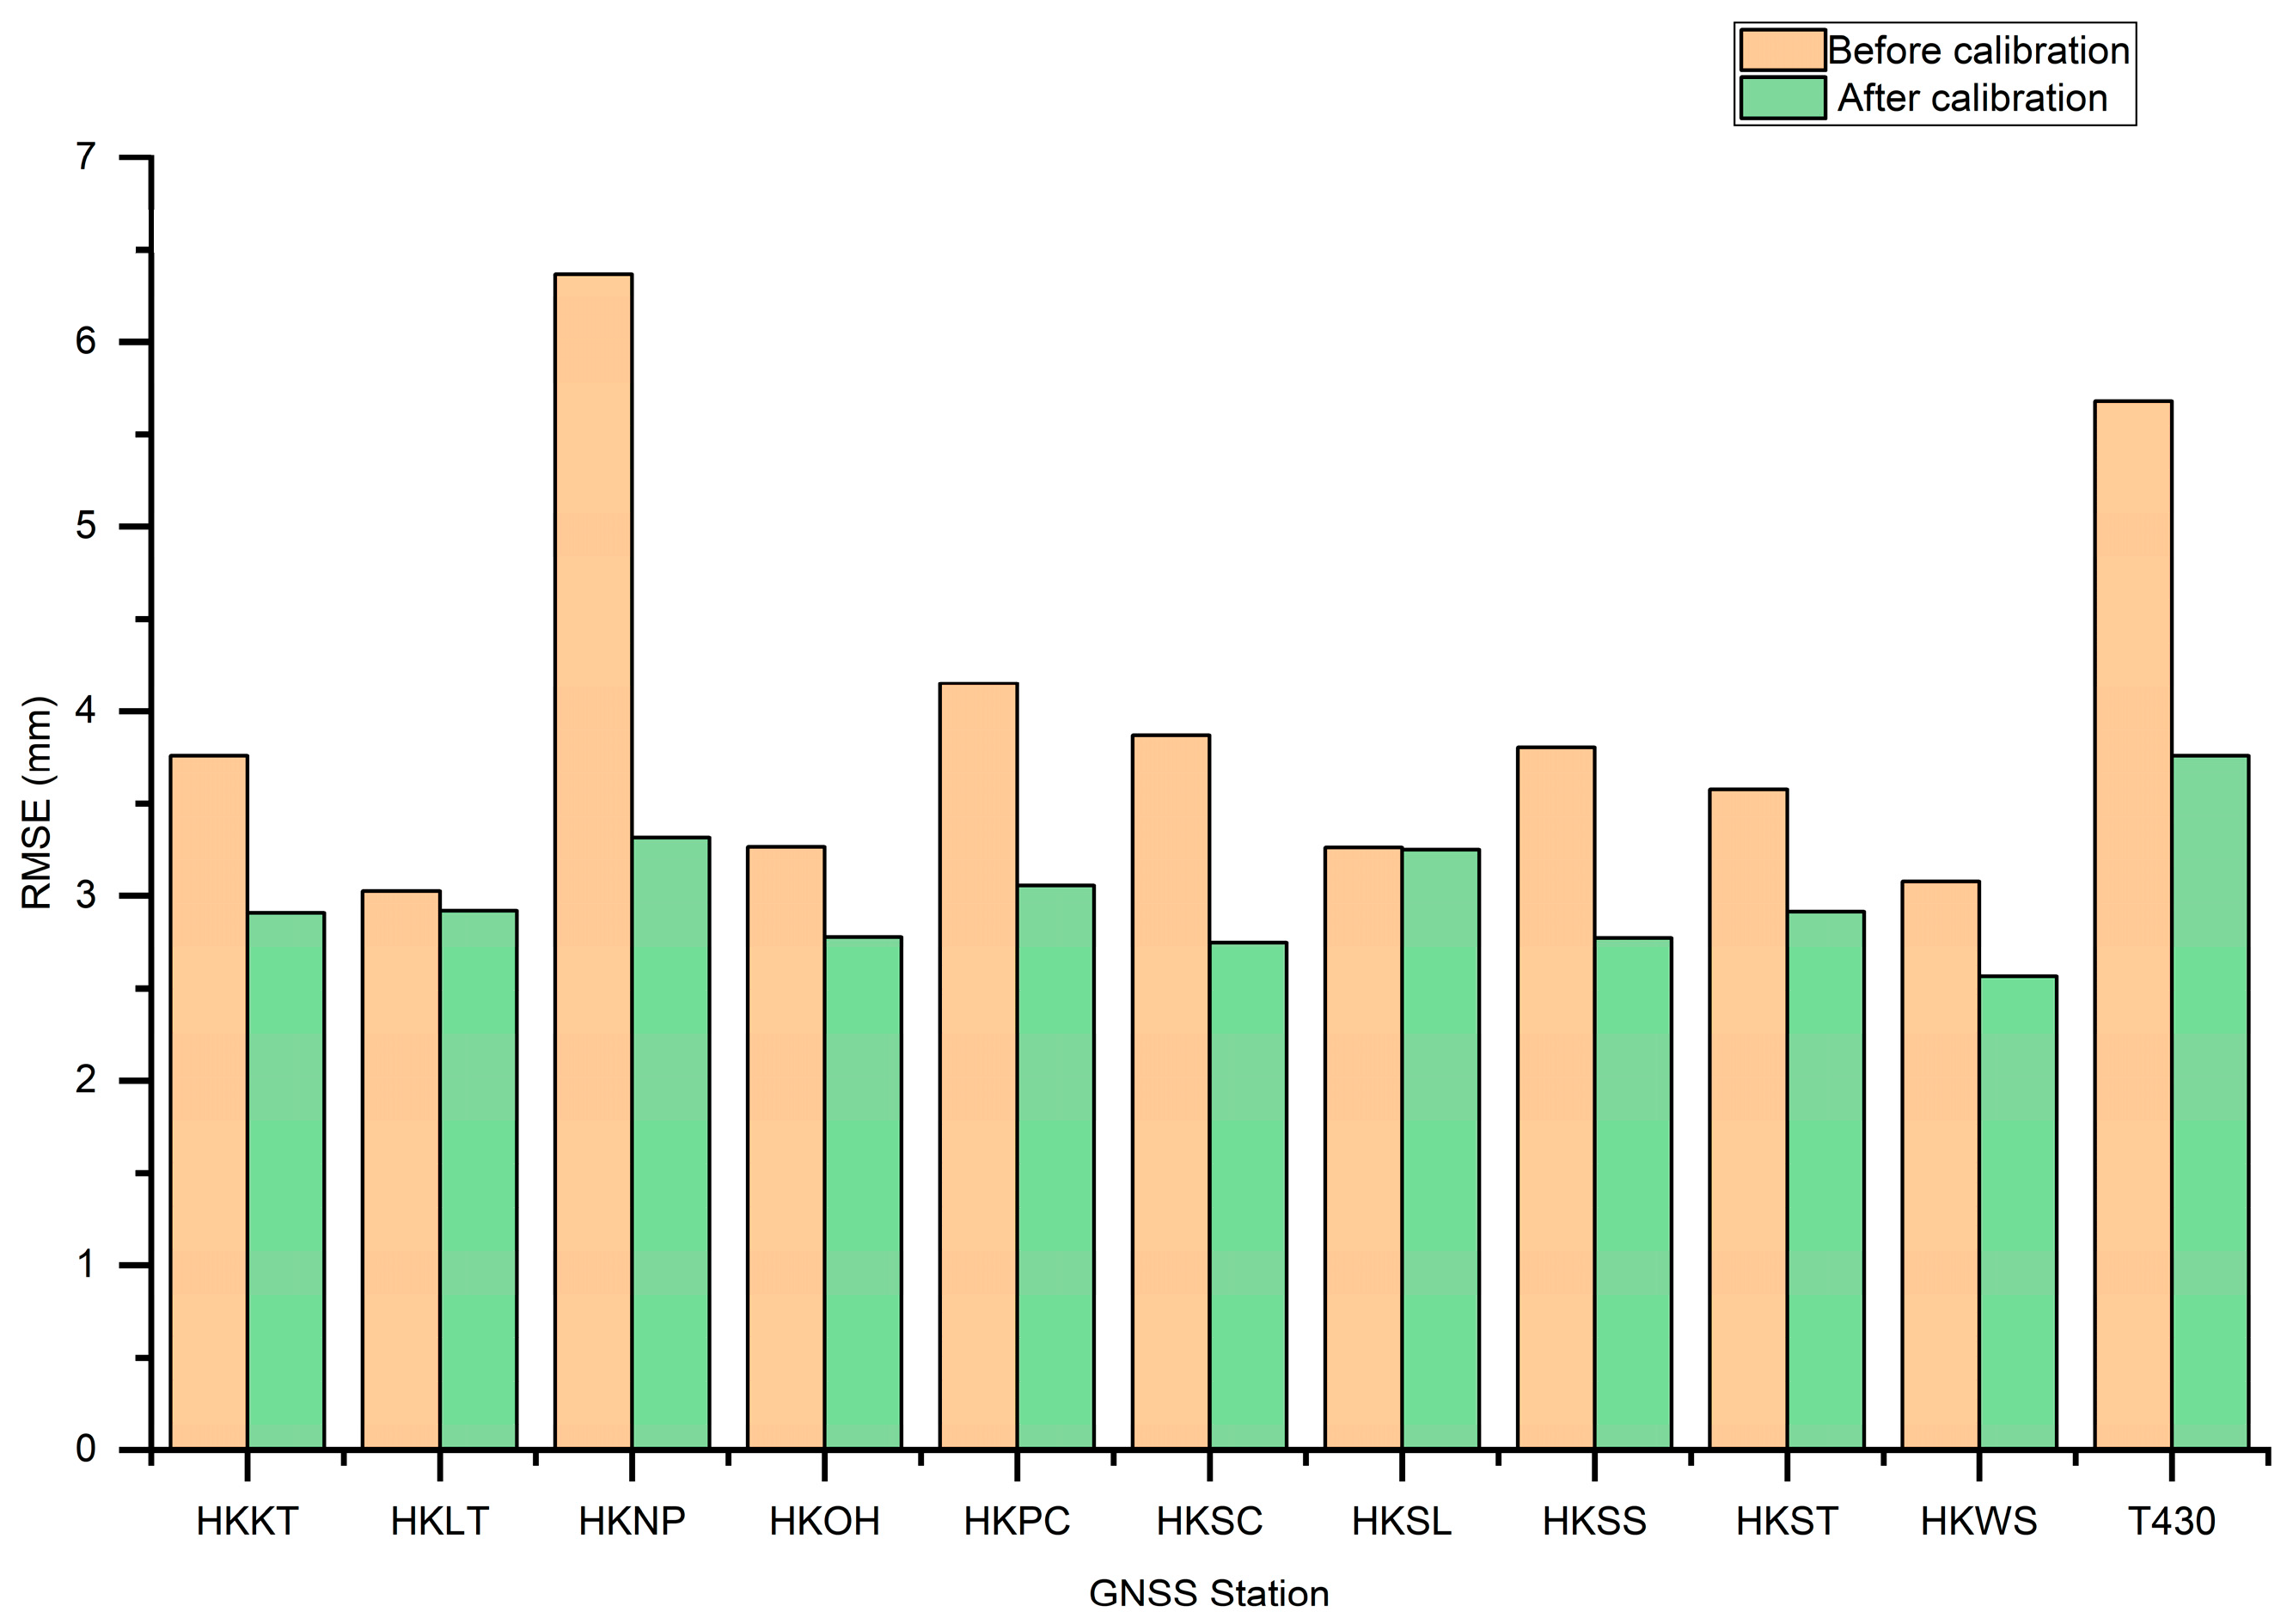
3.4. Model Development
4. Discussion
5. Conclusions
Author Contributions
Funding
Data Availability Statement
Conflicts of Interest
References
- Zheng, Z.; Zhang, K.; Shi, J.; Zhang, M. Analysis of GNSS water vapor detection accuracy and temporal sequence characteristics in different climate types in China. J. Geomat. Sci. Technol. 2023, 48, 68–77. [Google Scholar] [CrossRef]
- Yao, Y.; Sun, Z.; Xu, C. Applicability of Bevis Formula at different height levels and global weighted mean temperature model based on near-earth atmospheric temperature. J. Geod. Geoinf. Sci. 2020, 3, 1–11. [Google Scholar]
- Huang, L.; Peng, H.; Liu, L.; Li, C.; Kang, C.; Xie, S. A regional atmospheric weighted mean temperature model for China considering the vertical lapse rate function. Acta Geod. Cartogr. Sin. 2020, 49, 432–442. [Google Scholar]
- Zhao, Q.; Ma, Z.; Yao, Y.; Du, Z. A method for retrieving atmospheric precipitable water vapor using GNSS-assisted near-infrared channels of Fengyun-3 satellite MERSI. Acta Geod. Cartogr. Sin. 2024, 53, 306–320. [Google Scholar]
- Liu, M.; Zhang, W.; Zhang, Z.; Lou, Y.; Liang, H.; Cao, Y. Applicability assessment and analysis of CRA40 in GNSS water vapor inversion in the China region. J. Nanjing Univ. Inf. Sci. Technol. (Nat. Sci. Ed.) 2021, 13, 138–144. [Google Scholar] [CrossRef]
- Sleem, E.R.; Abdelfatah, A.M.; Mousa, K.E.A.; Gamal, S.E. A new Egyptian Grid Weighted Mean Temperature (EGWMT) model using hourly ERA5 reanalysis data in GNSS PWV retrieval. Sci. Rep. 2024, 14, 14608. [Google Scholar] [CrossRef] [PubMed]
- Huang, L.; Jiang, W.; Liu, L.; Chen, H.; Ye, S. A new global grid model for the determination of atmospheric weighted mean temperature in GPS precipitable water vapor. J. Geod. 2019, 93, 159–176. [Google Scholar] [CrossRef]
- Li, Z.; Pasquali, P.; Cantone, A.; Singleton, A.; Funning, G.; Forrest, D. MERIS Atmospheric Water Vapor Correction Model for Wide Swath Interferometric Synthetic Aperture Radar. IEEE Geosci. Remote Sens. Lett. 2012, 9, 257–261. [Google Scholar] [CrossRef]
- Liu, Y.; Feng, W.; Liu, Y.; Wang, Y.; Feng, M. Research on a water vapor correction model for the Beijing-Tianjin-Hebei region based on multi-source data fusion. Remote Sens. Inf. 2024, 39, 61–66. [Google Scholar] [CrossRef]
- Shilpa, M.; Hui, Y.L.; Song, Y.M.; Yuan, F.; Ong, J.T. GPS-derived PWV for rainfall nowcasting in tropical region. IEEE Trans. Geosci. Remote Sens. 2018, 56, 4835–4844. [Google Scholar] [CrossRef]
- Barbarosa, A.; Wijaya, D.D.; Tanuwijaya, Z.A.J.; Putri, N.S.; Kuntjoro, W. Correlation analysis of GNSS-derived precipitable water vapor with rainfall data in Indonesia. IOP Conf. Ser. Earth Environ. Sci. 2023, 1245, 012035. [Google Scholar] [CrossRef]
- Yao, Y.; Zhao, Q. Advances and prospects in GNSS tropospheric water vapor monitoring. Acta Geod. Cartogr. Sin. 2022, 51, 935–952. [Google Scholar]
- Cao, Y.; Chen, B.; Chen, X.; Xiao, H. A model for improving the accuracy of MODIS atmospheric precipitable water vapor retrieval based on GPS data. Remote Sens. Inf. 2014, 29, 23–27. [Google Scholar]
- Li, Z.; Muller, J.P.; Cross, P. Comparison of precipitable water vapor derived from radiosonde, GPS, and MODIS measurements. J. Geophys. Res. Atmos. 2003, 108, 4651. [Google Scholar] [CrossRef]
- Fang, S.; Bi, C.; Le, Y.; Pei, J. Calibration of MODIS near infrared vapor products using precipitable water vapor retrieved from GPS data. Geomat. Sci. Technol. 2016, 41, 38–41. [Google Scholar]
- Liu, B.; Wang, Y.; Lou, Z.; Zhan, W. Correction of MODIS precipitable water vapor over China using CMONOC observations. Acta Geod. Cartogr. Sin. 2019, 48, 1207–1215. [Google Scholar]
- Zhang, D.; Zhang, K.; Liu, Y.; Wu, S.; Li, L. Evaluation and Calibration of MODIS Near-Infrared Precipitable Water Vapor over China Using GNSS Observations and ERA-5 Reanalysis Dataset. Remote Sens. 2021, 13, 2761. [Google Scholar] [CrossRef]
- Wang, Y.; Liu, X.; Liu, Y.; Zhan, W. Correction of MODIS water vapor regional function model under the constraint of CMONOC. Geomat. Inf. Sci. Wuhan Univ. 2023, 48, 224–231. [Google Scholar] [CrossRef]
- Lu, C.; Zhang, Y.; Zheng, Y.; Wu, Z.; Wang, Q. Precipitable water vapor fusion of MODIS and ERA5 based on convolutional neural network. GPS Solut. 2022, 27, 15. [Google Scholar] [CrossRef]
- Yang, C.; Guan, L.; Sun, X. Comparison of FY-4A/AGRI SST with Himawari-8/AHI and In Situ SST. Remote Sens. 2023, 15, 4139. [Google Scholar] [CrossRef]
- Zhang, W.; Xiao, X.; Peng, J.; Zhang, S.; Shehaj, E.; Moeller, G. Evaluation and Analysis of Next-Generation FY-4A LPW Products over Various Climatic Regions in China. Atmosphere 2024, 15, 1545. [Google Scholar] [CrossRef]
- Zhang, P.; Zhu, L.; Tang, S.; Gao, L.; Chen, L.; Zheng, W.; Han, X.; Chen, J.; Shao, J. General Comparison of FY-4A/AGRI With Other GEO/LEO Instruments and Its Potential and Challenges in Non-meteorological Applications. Front. Earth Sci. 2019, 6, 224. [Google Scholar] [CrossRef]
- Zhou, Y.; Wang, X.; Xu, C. Comprehensive evaluation of the precipitable water vapor products of Fengyun satellites via GNSS data over mainland China. Atmos. Res. 2024, 300, 107235. [Google Scholar] [CrossRef]
- Wu, Q.; Tu, M. Analysis of GNSS Water Vapor Retrieval Based on PPP and Double-Difference Network Solution. J. Meteorol. Disaster Reduct. Res. 2023, 46, 296–303. [Google Scholar]
- Jin, S.; Wang, Q.; Shi, Q. Parameters estimation and applications from single- to five-frequency multi-GNSS precise point positioning. Acta Geod. Cartogr. Sin. 2022, 51, 1239–1248. [Google Scholar]
- Fan, Y.; Xia, F.; Ye, S.; Hu, F.; Luo, H.; Sha, Z. Analysis of GNSS-ZTD retrieval using dual-frequency raw observations. Measurement 2024, 231, 114597. [Google Scholar] [CrossRef]
- Wu, J.; Chen, Y.; Bo, L.; Wu, W. Tropospheric delay retrieval using cost-effective single-frequency GNSS receivers with established reference stations. Measurement 2025, 241, 115767. [Google Scholar] [CrossRef]
- Bevis, M.; Businger, S.; Herring, T.A.; Rocken, C.; Anthes, R.A.; Ware, R.H. GPS meteorology: Remote sensing of atmospheric water vapor using the Global Positioning System. J. Geophys. Res. Atmos. 1992, 97, 15787–15801. [Google Scholar] [CrossRef]
- Chen, Y. Back-calculating of atmospheric water vapor content using GPS observations. Mod. Surv. Mapp. 2005, 28, 3–5. [Google Scholar]
- Lin, M.; Xie, S.; Huang, L.; Liu, L.; Wang, Y.; Bi, H.; Huang, Q. A Segmented Grid Model for Vertical Adjustment of Precipitable Water Vapor in China. Adv. Space Res. 2025, 75, 1888–1901. [Google Scholar] [CrossRef]
- Wang, J.; Zhang, L.; Dai, A. Global estimates of water-vapor-weighted mean temperature for GPS applications. J. Geophys. Res. Atmos. 2005, 110, D21101. [Google Scholar] [CrossRef]
- Jiang, P. Retrieving 2D/3D Water Vapor Distribution Using Ground-Based GNSS Meteorology. Ph.D. Thesis, Wuhan University, Wuhan, China, 2014. [Google Scholar]
- Chen, X. GNSS-Based Tropospheric Water Vapor Retrieval Methods and Applications. Ph.D. Thesis, Guangzhou University, Guangzhou, China, 2023. [Google Scholar] [CrossRef]


| GNSS Station Name | R | RMSE (mm) | Bias (mm) | Sample Size | Elevation (m) |
|---|---|---|---|---|---|
| HKKT | 0.844 | 3.809 | −2.321 | 1474 | 34.576 |
| HKLT | 0.829 | 3.081 | 0.068 | 1764 | 125.922 |
| HKNP | 0.773 | 6.523 | 5.526 | 1809 | 350.672 |
| HKOH | 0.877 | 3.291 | 1.933 | 1364 | 166.401 |
| HKPC | 0.832 | 4.119 | −2.762 | 1791 | 18.130 |
| HKSC | 0.860 | 3.794 | −2.538 | 1399 | 20.239 |
| HKSL | 0.807 | 3.223 | −0.144 | 1712 | 95.297 |
| HKSS | 0.876 | 3.806 | −2.611 | 1511 | 38.713 |
| HKST | 0.871 | 3.470 | 2.062 | 1339 | 258.704 |
| HKWS | 0.876 | 3.205 | −1.703 | 1369 | 63.791 |
| T430 | 0.847 | 5.708 | −4.870 | 1586 | 41.323 |
| Model | RMSE (mm) | MAE (mm) | Bias (mm) |
|---|---|---|---|
| No correction | 4.182 | 3.303 | −0.592 |
| Linear | 4.051 | 3.172 | −0.019 |
| Quadratic | 4.055 | 3.176 | −0.214 |
| Exponential | 4.230 | 3.298 | −1.112 |
| Logarithmic | 4.050 | 3.173 | −0.043 |
| Power function | 4.052 | 3.175 | 0.087 |
| Multiple linear regression | 3.036 | 2.420 | −0.022 |
Disclaimer/Publisher’s Note: The statements, opinions and data contained in all publications are solely those of the individual author(s) and contributor(s) and not of MDPI and/or the editor(s). MDPI and/or the editor(s) disclaim responsibility for any injury to people or property resulting from any ideas, methods, instructions or products referred to in the content. |
© 2025 by the authors. Licensee MDPI, Basel, Switzerland. This article is an open access article distributed under the terms and conditions of the Creative Commons Attribution (CC BY) license (https://creativecommons.org/licenses/by/4.0/).
Share and Cite
Gao, Y.; Lin, J.; Han, J.; Luo, T.; Zhou, M.; Jiang, Z. An Elevation-Coupled Multivariate Regression Model for GNSS-Based FY-4A Precipitable Water Vapor. Remote Sens. 2025, 17, 2371. https://doi.org/10.3390/rs17142371
Gao Y, Lin J, Han J, Luo T, Zhou M, Jiang Z. An Elevation-Coupled Multivariate Regression Model for GNSS-Based FY-4A Precipitable Water Vapor. Remote Sensing. 2025; 17(14):2371. https://doi.org/10.3390/rs17142371
Chicago/Turabian StyleGao, Yaping, Jing Lin, Junqiang Han, Tong Luo, Min Zhou, and Zhen Jiang. 2025. "An Elevation-Coupled Multivariate Regression Model for GNSS-Based FY-4A Precipitable Water Vapor" Remote Sensing 17, no. 14: 2371. https://doi.org/10.3390/rs17142371
APA StyleGao, Y., Lin, J., Han, J., Luo, T., Zhou, M., & Jiang, Z. (2025). An Elevation-Coupled Multivariate Regression Model for GNSS-Based FY-4A Precipitable Water Vapor. Remote Sensing, 17(14), 2371. https://doi.org/10.3390/rs17142371