Article

A Diagnostic Analysis of the 2024 Beijing May 30 Gale Simulation Based on Satellite Observation Products

1
Chinese Academy of Meteorological Sciences, Beijing 100081, China
2
CMA Earth System Modeling and Prediction Centre (CEMC), China Meteorological Administration, Beijing 100081, China
3
State Key Laboratory of Severe Weather (LaSW), China Meteorological Administration, Beijing 100081, China
*
Author to whom correspondence should be addressed.
Remote Sens. 2025, 17(8), 1378; https://doi.org/10.3390/rs17081378
Submission received: 26 January 2025 / Revised: 2 April 2025 / Accepted: 10 April 2025 / Published: 12 April 2025

Abstract

:
A gale occurred in Beijing on 30 May 2024, which led to fallen trees and damaged infrastructure. This event was primarily driven by surface divergent winds induced by strong convective downdrafts. During the occurrence and development of this gale, solar shortwave radiation and cloud-related variables played a crucial role in triggering, sustaining, and organizing convection. This study proposes a new diagnostic analysis approach for this gale focusing on shortwave radiation and cloud-related variables involved in the physical processes of gale development, based on the FY-4B L2 products and simulations from the Mesoscale Weather Numerical Forecast System of the China Meteorological Administration (CMA-MESO). The diagnostic analysis results of this case show that before cloud formation, the CMA-MESO simulates stronger shortwave radiation heating in the initial stages, leading to an overestimation of surface temperature rise. Additionally, the simulated cloud formation occurs slightly later than observed, with reduced cloud coverage, shorter cloud duration, and lower cloud top heights, resulting in a weaker convective intensity compared to observations. Furthermore, the CMA-MESO underestimates the temperature gradient between the middle and lower troposphere and predicts lower convective instability, which leads to weaker forecasts of convection organization. Ultimately, this study provides a theoretical basis and technical support for enhancing the ability of the CMA-MESO to simulate this gale by using the FY-4B L2 data products for diagnostic analysis.

1. Introduction

China frequently experiences severe convective weather, with convectively induced gales causing significant damage [1]. Regarding theoretical research on gales, Fujita [2] was the first to identify strong downdrafts within convective storms, which lead to strong surface divergent winds. Since then, many scholars have explored the mechanisms triggering severe convection and gales. Several factors contributing to the formation of severe convection have been identified, including mesoscale updrafts, obvious potential instability, strong vertical wind shear, and the vertical distribution of moisture characterized by a dry upper layer and a moist lower layer [3,4,5]. Surface gales generated by convection often have the following features: high frequency, short duration, and strong destructiveness, thereby posing great challenges to weather forecasting and early warning. As a result, they have become a key focus in the study of severe convective weather, particularly in terms of their environmental conditions, triggering mechanisms and short-term warnings [6].
Currently, mesoscale numerical weather prediction (NWP) models serve as the primary tool for forecasting severe convective weather [7,8,9]. However, recent studies have revealed that the NWP models generally perform inadequately in forecasting moisture conditions and convective instability, which thereby leads to inaccurate forecasts of convective development and precipitation intensity [10]. Regarding the simulations from the Mesoscale Weather Numerical Forecast System of the China Meteorological Administration (CMA-MESO), Yang et al. [11] found that the radiation scheme of the CMA-MESO exhibits uncertainties in predicting downward longwave radiation under cold, dry, and cloud-free conditions. In simulations of surface gales induced by convection, an accurate representation of shortwave radiation plays a crucial role in the overall forecast accuracy. Some simulation studies have shown that when convective cloud development is weak, solar shortwave radiation influences thunderstorm-related gales primarily, through its impact on geopotential height and temperature fields. Specifically, solar radiation induces mesoscale convergence and an unstable layer in the lower troposphere by heating the surface, ultimately triggering severe convection and gales. It is also noteworthy that topography enhances convection primarily by altering the heating effect of solar radiation [12,13,14].
Surface shortwave radiation (SSR) is a crucial component of solar radiation and plays a pivotal role in the surface energy balance. Additionally, it is a fundamental driving force in the water, heat, and carbon cycles of the Earth’s surface system [15]. However, due to limitations in aspects such as observational equipment and costs, the number and distribution density of ground-based radiation observation stations are much lower than those of conventional meteorological observation stations, resulting in uneven station distribution. For instance, in the vast and sparsely populated regions of Northwest China, surface observations are particularly scarce [16]. In contrast, satellite remote sensing observations, featuring high continuity and spatiotemporal resolution, can provide large-scale continuous SSR data, thereby offering essential radiation data for the simulation and mechanism study of gales. Notably, the application of inversion data from the new generation of geostationary satellites has led to improvements in time resolution, spatial resolution, and accuracy [17,18,19]. Current forecasts of severe convection and gales mainly rely on radar data assimilation to improve the model’s forecast accuracy, while the application of satellite-based shortwave radiation data remains to be developed further [17,20,21,22].
The purpose of this study is to conduct a systematic diagnostic analysis of CMA-MESO simulations by using Fengyun-4B (FY-4B) Level-2 (L2) observation products, with the focus on the gale that occurred in Beijing on 30 May 2024. Specifically, this study integrates the shortwave radiation energy required for the outbreak of a gale with the physical processes underlying its formation. Additionally, the diagnostic analysis examines the radiation energy, surface temperature, cloud-related variables, and temperature–humidity profiles involved in this process. Finally, based on the systematic diagnostic analysis of radiation energy and cloud-related variables, this study identifies potential errors and issues in model simulations and explores their underlying causes, ultimately providing a theoretical basis for improving the gale forecast accuracy by the CMA-MESO.
The remainder of this paper is organized as follows: Section 2 outlines the main details of the gale process in Beijing on 30 May 2024, introduces the research principles based on solar shortwave radiation, and details the use of FY-4B L2 data and the simulation configuration of the CMA-MESO. Section 3 presents the design of the diagnostic analysis approach, the observation overview based on FY-4B AGRI L2 products and diagnostic result analysis from both spatial and station-specific aspects. Finally, Section 4 presents the discussion and conclusions.

2. Materials and Methods

2.1. Case Study

On 30 May 2024, gales swept through the Beijing–Tianjin–Hebei urban agglomeration and Liaoning Province, with wind speeds ranging from force 8 to 10 on the Beaufort scale. Notably, local gusts reached force 11–12, with a maximum of force 13. In the Beijing–Tianjin–Hebei urban agglomeration, a linear convective system progressed from west to east during 1200–1800 BJT (Beijing standard time, Coordinated Universal Time (UTC) + 8 h), causing this mixed convective gale. The main characteristics of this event are as follows:
(1) 
Widespread impact and strong intensity of the wind. A gale with a wind speed of force 13 (37.2 m s−1 at Qianling Mountain station) was observed in Beijing;
(2) 
Rapid convective development, a high wind speed, and fast-moving cloud systems. The system rapidly developed and moved eastward near Zhangjiakou City in Hebei Province around noon, with the linear convective system advancing at a speed of 70 km h−1;
Based on the temporal sequence of this gale’s impact on Beijing, 14 meteorological stations were selected successively as the specific research objects for subsequent analysis. The station locations are shown in Figure 1.
Figure 2a,b depict the 500 hPa geopotential height, temperature, and wind fields at 0800 and 1400 BJT on 30 May 2024. It can be seen that the center of the Northeast Cold Vortex was initially located over eastern Mongolia at 0800 BJT and shifted eastward by 1400 BJT. Meanwhile, a westward tilted trough extended from Northeast China to Inner Mongolia, indicating the southward intrusion of cold air at 500 hPa. The eastward movement of the cold vortex and the deepening of the trough jointly enhanced the upper-level cold air intrusion, intensifying the atmospheric instability over the Hebei–Beijing region. Additionally, the subtropical high represented by the 588 dagpm contour exhibited a slight northward shift at 1400 BJT, reinforcing the northward transport of warm and moist air and thus providing favorable moisture conditions for deep convection. Figure 2c,d illustrate the situation at 850 hPa. Over time, a low-level jet emerged over northern Hebei. This low-level jet enhanced vertical wind shear and promoted the accumulation of convective instability, further strengthening the transport of warm and moist air. Simultaneously, the strong horizontal wind shear at 850 hPa near 41°N, 117°E enhanced the development of strong lifting conditions. Therefore, the southward extension of the trough induced by the Northeast Cold Vortex, along with the strengthening of the 850 hPa low-level jet, provided a circulation situation conducive to the occurrence of the gale to a certain extent.
Figure 3 shows the CMA-MESO simulations of 10 m wind and surface temperature fields during the occurrence of the gale. At 1400 BJT, the simulated wind speed in the Beijing region by MESO generally reached level 1–2 on the Beaufort scale, while at 1500 BJT, it increased to level 2–4. In contrast, observations from the China National Observation Station indicated that from 1400 to 1500 BJT on 30 May 2024, the average wind speed in the Beijing region ranged from level 8 to 10, with localized gusts reaching level 11–12. The maximum wind speed recorded at Qianling Mountain (QLM) station, reached 37.2 m/s. Regarding wind direction, the CMA-MESO predominantly simulated southerly winds in the eastern Beijing area, whereas the actual gale event featured a northerly wind due to cold air intrusion. Therefore, it is evident that the CMA-MESO exhibits poor simulation performance for the surface wind field during this gale event, and thus a detailed diagnostic analysis is needed to offer potential improvements for optimizing this simulation.

2.2. Research Principles

According to the thermodynamic equation in the basic atmospheric equations set, the temperature is influenced by the temperature advection term ( V · T ), vertical motion term ( ω ( γ d γ ) ), and non-adiabatic heating term ( 1 C p d Q d t ) [23]. The non-adiabatic heating term mainly consists of radiative heating and latent heat release due to phase changes in water vapor. Solar shortwave radiation, as an energy source, can cause temperature changes in the atmosphere and thus plays a crucial role in the development and outbreak of convection.
T t = V · T ω ( γ d γ ) + 1 C p d Q d t
where T t (unit: K s−1) represents the rate of change of temperature T (unit: K) with respect to time t (unit: s). V (unit: m s−1) denotes the wind velocity and T (unit: K m−1) represents the temperature gradient. ω is the vertical velocity (unit: Pa s−1). The parameters γ d and γ refer to the dry adiabatic lapse rate and the moist adiabatic lapse rate (unit: K Pa−1), respectively. C p is the specific heat capacity at a constant pressure (unit: J kg−1 K−1), and d Q d t denotes the diabatic heating rate (unit: J kg−1 s−1).
Specifically, after sunrise, solar shortwave radiation continuously reaches the Earth’s surface through the atmosphere. The surface absorbs this radiation and warms up rapidly, while emitting longwave radiation back into the atmosphere [24,25,26]. The near surface atmosphere absorbs the longwave radiation emitted by the surface [27], leading to continuous warming, which causes instability in the lower atmosphere and triggers the ascending motion of air parcels. During the upward movement, the temperature of the air parcel decreases, leading to a reduction in the saturated vapor pressure. When the saturated vapor pressure equals the actual vapor pressure, the water air parcel begins to condense. The condensed droplets then undergo the process of collision coalescence and condensation growth, further forming cloud droplets [28]. When the buoyancy of the air parcel becomes less than its weight, it begins to descend. During the descent, if the surrounding dry air is entrained into the air parcel, the water vapor content will further reduce, which accelerates the evaporative cooling process [19]. The remaining liquid and solid water that does not fully evaporate before reaching the surface can cause precipitation and hail on the ground. Concurrently, the temperature decreases and strong surface wind divergence develops, resulting in the occurrence of a gale.
According to the basic physical equations of the Dudhia shortwave radiation scheme [29] used in the CMA-MESO, Equation (2) describes the downward shortwave radiation flux at the surface S d (unit: W m−2) and Equation (3) defines the radiative heating rate R T (unit: K s−1). It follows that the solar radiation reaching the Earth’s surface depends on the difference between the incident radiation reaching the top of the atmosphere and the portion absorbed by the atmosphere.
S d z = μ S 0 z t o p ( d S c s + d S c a + d S s + d S a )
where S d z is the downward shortwave radiation at height z, S 0 (unit: W m−2) represents the incident shortwave radiation at the top of the atmosphere, and μ is the atmospheric transmissivity. The integral accounts for the reduction in radiation due to cloud scattering ( d S c s ), cloud absorption ( d S c a ), atmospheric scattering ( d S s ), and water vapor absorption ( d S a ), each measured in W m−2.
R T = R T l o n g w a v e + 1 ρ c p z S a b s
where R T l o n g w a v e is the longwave radiative heating rate in K s−1 and 1 ρ c p z S a b s represents the heating contribution from absorbed shortwave radiation. Here, ρ is the air density (unit: kg m−3), c p is the specific heat capacity at a constant pressure (unit: J kg−1 K−1), and S a b s (unit: W m−2) is the absorbed shortwave radiation in S d .
Therefore, under clear and cloudless weather conditions, shortwave radiation is primarily affected by atmospheric scattering and water vapor absorption. As a result, the solar shortwave radiation continues to warm the surface. In the presence of clouds, cloud radiative effects lead to a reduction in shortwave radiation, which in turn impacts the radiative heating rate.

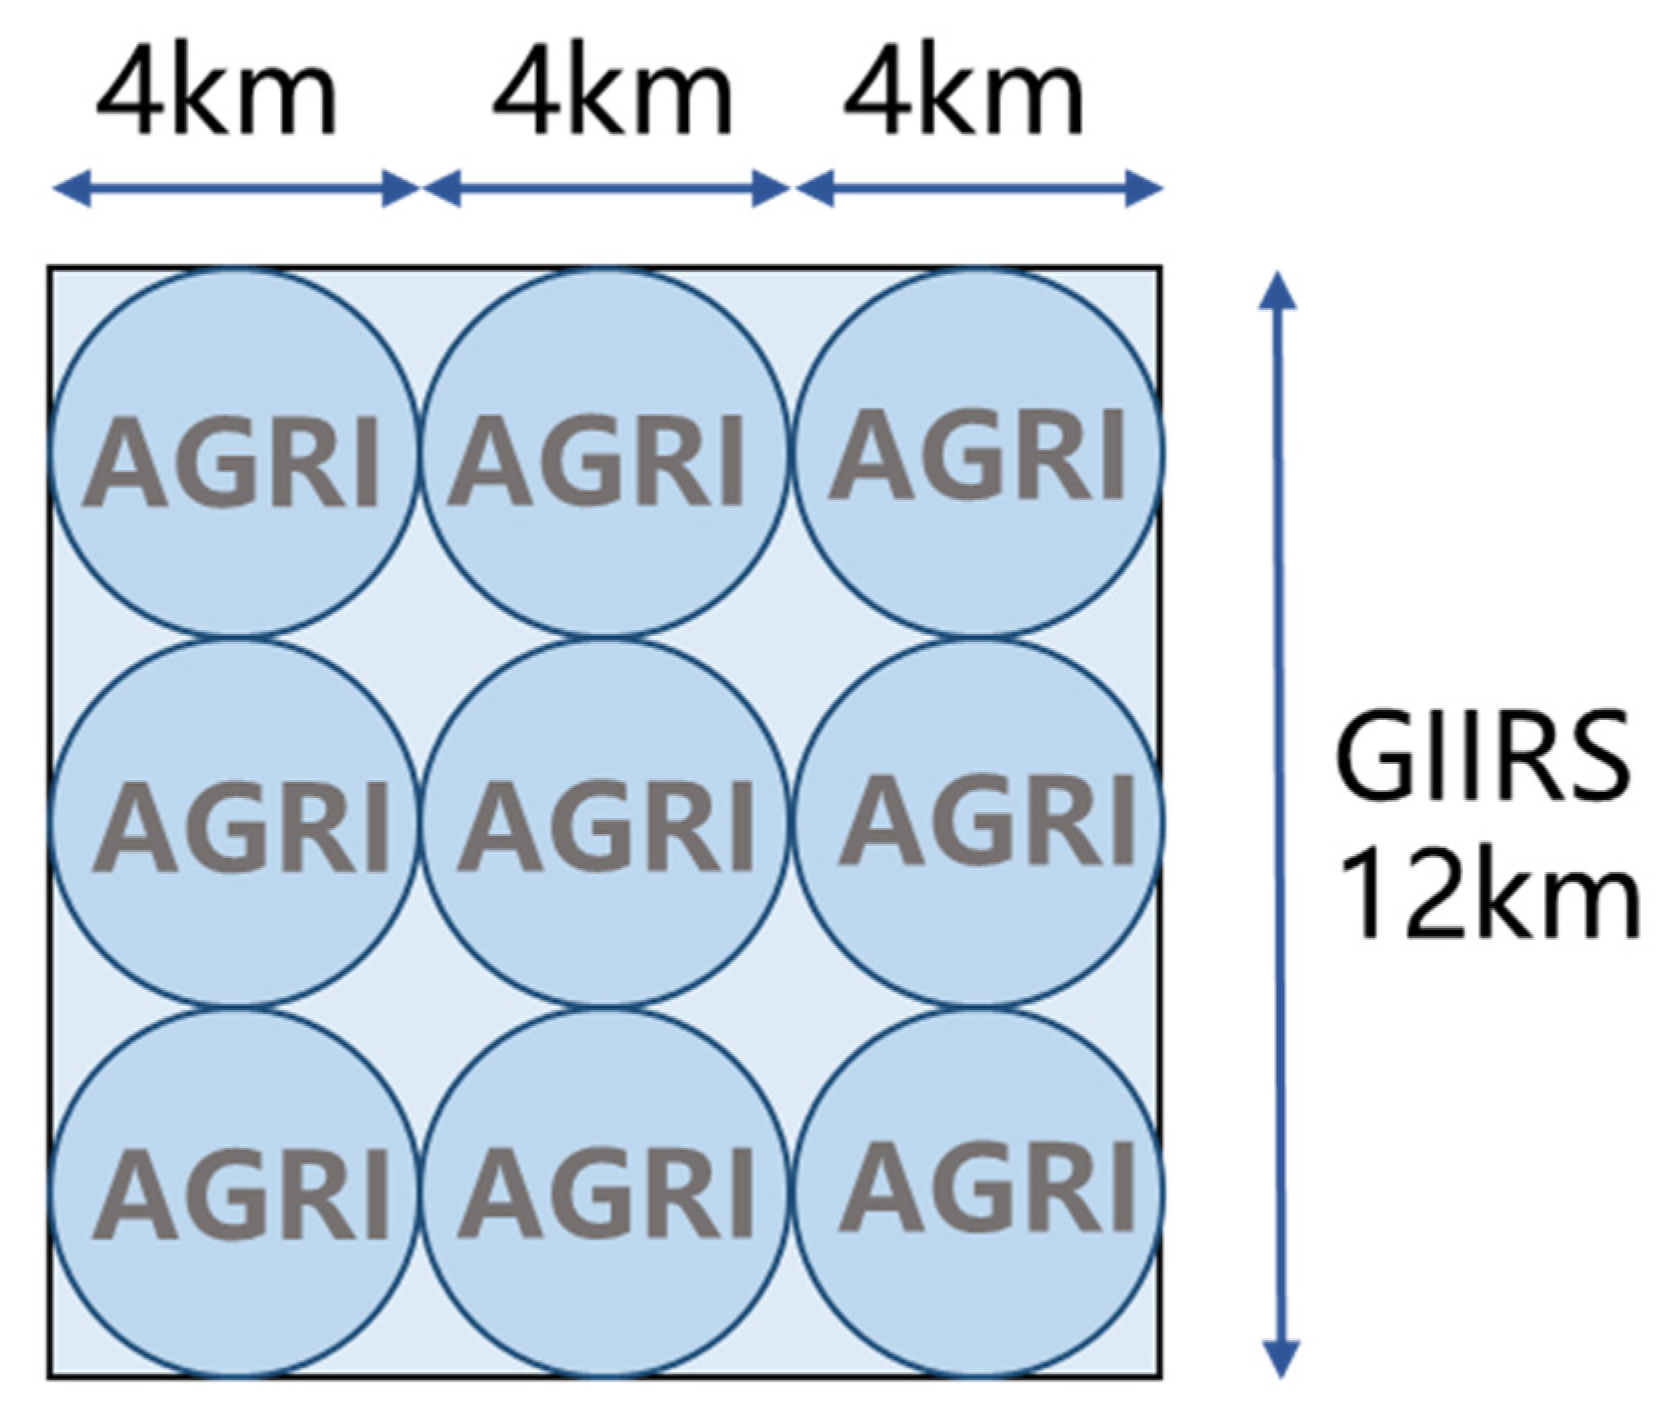
2.3. FY-4B L2 Products

The FY-4B satellite is the first operational satellite of China’s new generation of geostationary-orbit meteorological satellites in the Fengyun-4 series. The FY-4B satellite is equipped with several advanced payloads, including the Advanced Geostationary Radiation Imager (AGRI), the Geostationary Interferometric Infrared Sounder (GIIRS), the Geo High-speed Imager, and the Space Environment Monitoring Instrument Package. Specifically, the AGRI adopts full-disk scanning with a scanning interval of 15 min. The GIIRS employs a 16 × 8 array detector and observes infrared radiation in different spectral bands via a Michelson interferometer, enabling the retrieval of atmospheric temperature and humidity profiles [30].
The National Satellite Meteorological Center has developed various L2 data products based on FY-4B observations [31]. The L2 data products used in this study are categorized into five main types: the FY-4B AGRI L2 data products consist of shortwave radiation, longwave radiation, cloud-related variables, and land-surface-temperature data. The FY-4B GIIRS L2 data products are the Atmospheric Vertical Profiling products, which offer vertical profiles of temperature and humidity in the atmosphere. These data products jointly provide a complete chain of satellite observational products that are required for this study. The specific L2 data products and associated variables used in this study are listed in Table 1.

2.4. Simulation Configuration of the CMA-MESO

In July 2005, the CMA independently developed the regional mesoscale numerical prediction system GRAPES-MESO, a regional version of the Global/Regional Assimilation Prediction System, which initiated a 30 km operational trial run at the National Meteorological Center. In July 2006, the model passed operational acceptance and began regional forecasting operations [32,33,34]. In July 2014, the GRAPES-MESO V4.0 introduced a fourth order horizontal diffusion scheme and was officially adopted for operational use at the National Meteorological Center [35].
In this study, the model data used are derived from the high-resolution (3 km) CMA-MESO, with 1 h forecast data initialized at 2300 BJT on 29 May 2024, and at 0200 BJT, 0500 BJT, 0800 BJT, 1100 BJT, 1400 BJT, 1700 BJT, and 2000 BJT on 30 May 2024. The configuration of CMA-MESO is set up similarly to the operational forecasting system. The simulation domain covers the region of 70°E–145°E, 10°N–60.01°N, with a primary focus on the Beijing region (115°E–118°E, 39°N–42°N). The CMA-MESO model has a horizontal resolution of 0.03°×0.03° and 50 vertical levels. The assimilation data for CMA-MESO encompasses conventional observations, radar data, satellite data, and Global Positioning System precipitable water. The physical parameterization schemes employed in the CMA-MESO are as follows: the WRF Single-Moment 6-Class (WMS6) cloud microphysics scheme [36], the Rapid Radiative Transfer Model (RRTM) longwave radiation scheme, the Dudhia shortwave radiation scheme [29,37], the Monin–Obukhov near-surface-layer scheme [38]; the Noah land surface process scheme [39], and the New Medium-Range-Forecast (NMRF) boundary layer scheme. Specific model parameters for operational forecasts are detailed in Table 2.

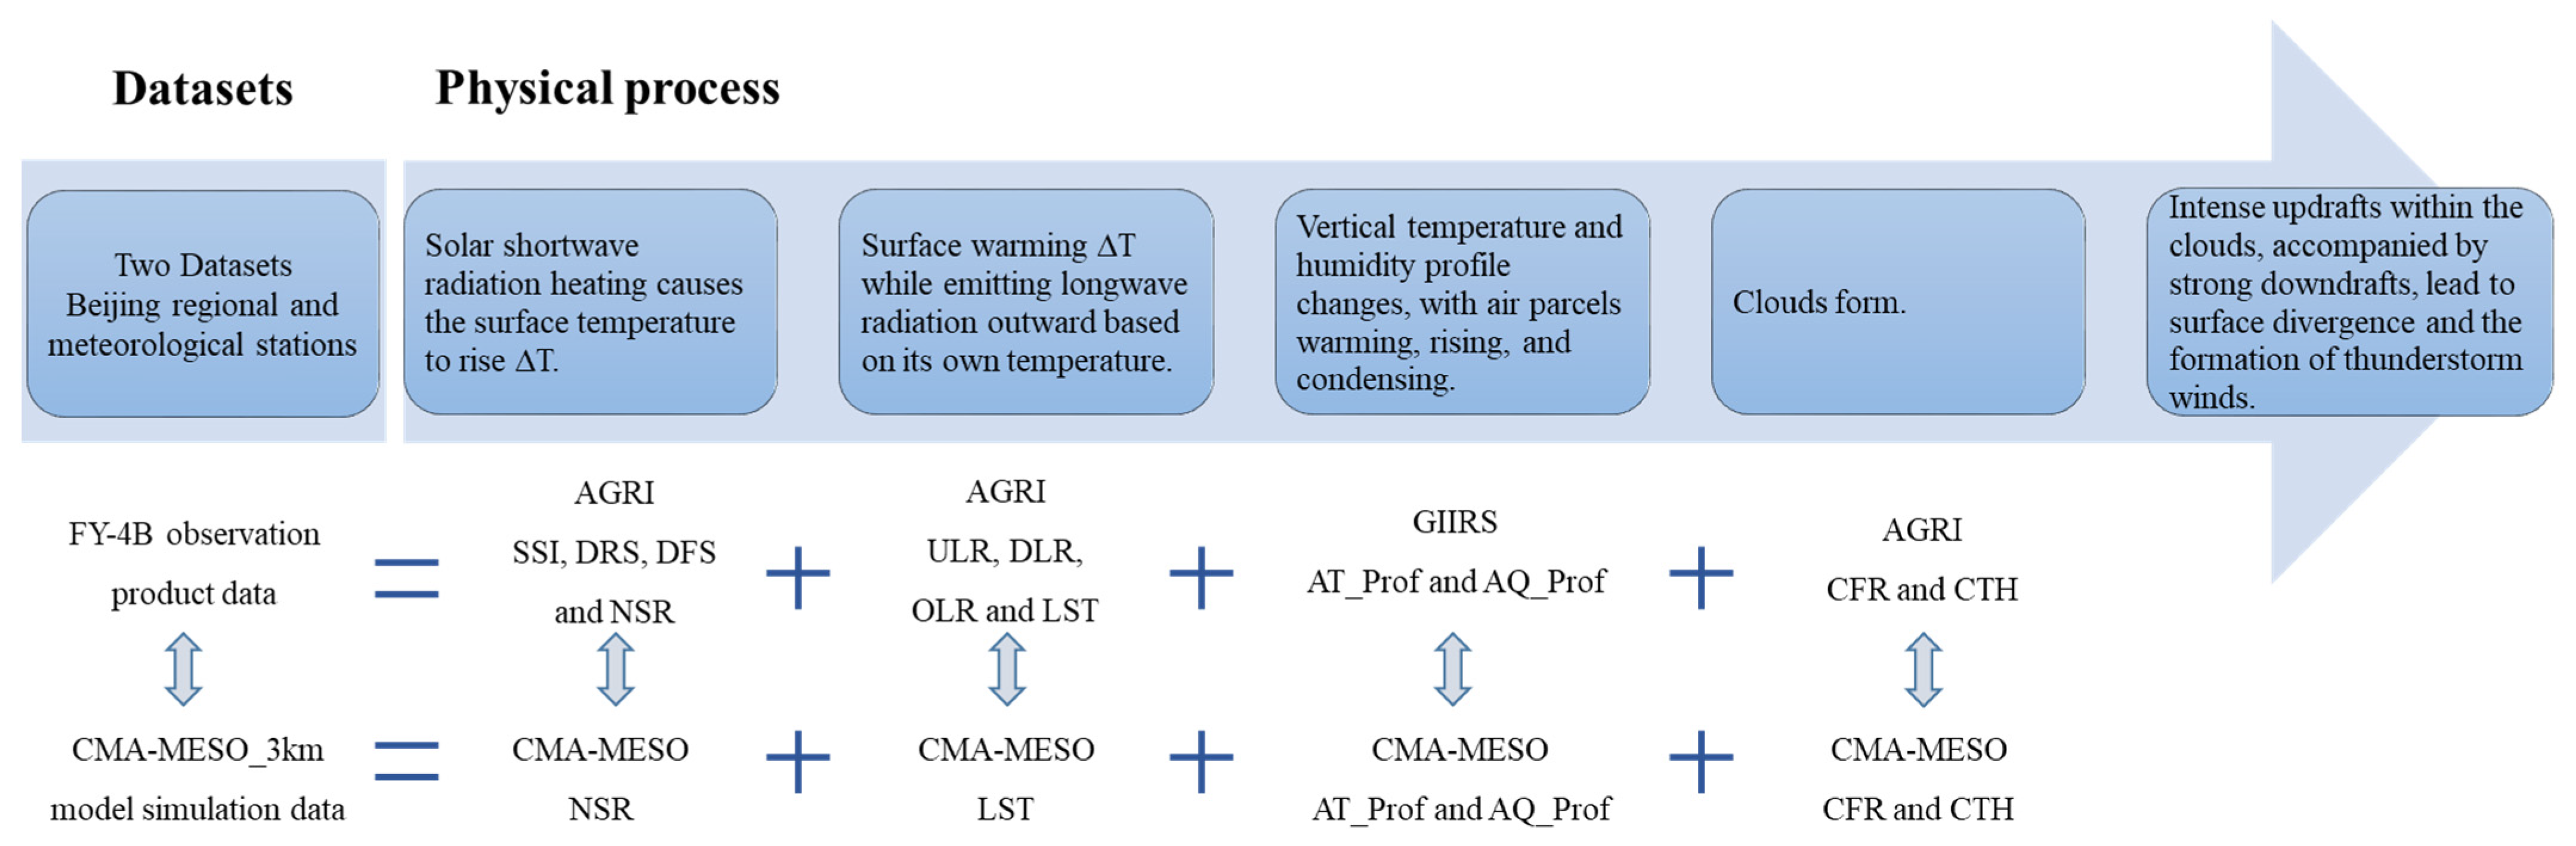
2.5. Data Processing for Diagnostic Analysis

According to the research principles, the sequence for using variables from FY-4B L2 data products during the gale process is first determined. Next, based on the detection ranges of the AGRI and GIIRS (Figure 4), a spatiotemporally matched dataset of FY-4B L2 products is generated. The observational and forecasted data are then filtered for the Beijing area, and furthermore, station-specific data matching is performed based on the 14 typical impacted meteorological stations during this gale. Ultimately, two datasets, one for the spatial region and the other for station-specific matching, are generated for the case study. The FY-4B L2 data and CMA-MESO forecasted data are subsequently utilized for multivariate diagnostic analysis to explore the deficiencies of model forecasts.

3. Results and Analysis

3.1. Specific Design of the Diagnostic Scheme

The FY-4B L2 products and the CMA-MESO simulations are spatiotemporally aligned and further matched to the station data, so as to complete the data preprocessing for diagnostic analysis. This process yields two datasets, one for regional data and the other for station data, both of which encompass the same variables for the case of this gale, as illustrated in Figure 5.
Based on the research principles, cloud formation is identified as a key time node for diagnostic analysis. As a result, a diagnostic scheme for this gale is designed as follows: Before cloud formation, the primary focus is on the heating effect of shortwave radiation. During this phase, shortwave radiation serves as the main influencing factor that warms up the atmosphere, which leads to instability and an ascending motion. The diagnostic variables in this phase include Surface Net Shortwave Radiation (NSR), Land Surface Temperature (LST), the Atmospheric Humidity Profile (AQ_Prof), and the Atmospheric Temperature Profile (At_Prof). After cloud formation, clouds scatter and absorb the solar radiation, resulting in a reduction in shortwave radiation. Consequently, clouds become the primary influencing factor, resulting in a decrease in both shortwave radiation and the land surface temperature. The main diagnostic variables during this phase are cloud coverage (CFR) and cloud top height (CTH).
The specific steps for diagnostic analysis are as follows:
(1) 
An overall analysis. Based on the FY-4B L2 products, an overall analysis is firstly conducted on the physical processes during the development of this gale.
(2) 
Spatial diagnostic analysis. The FY-4B L2 products in the diagnostic dataset for the Beijing region are used for diagnostic analysis of the CMA-MESO simulations, so as to gain a comprehensive understanding of the impact range of the gale and the model’s performance in spatial simulation.
(3) 
Station diagnostic analysis. This analysis is conducted by using the station-based diagnostic dataset from the 14 typical impacted stations, focusing on NSR, LST, CFR, CTH, AQ_Prof, and AT_Prof.
(4) 
Comprehensive analysis results integration. The spatiotemporal variations in the diagnostic analysis results for radiative energy, LST, cloud-related variables, AQ_Prof, and AT_Prof are obtained.

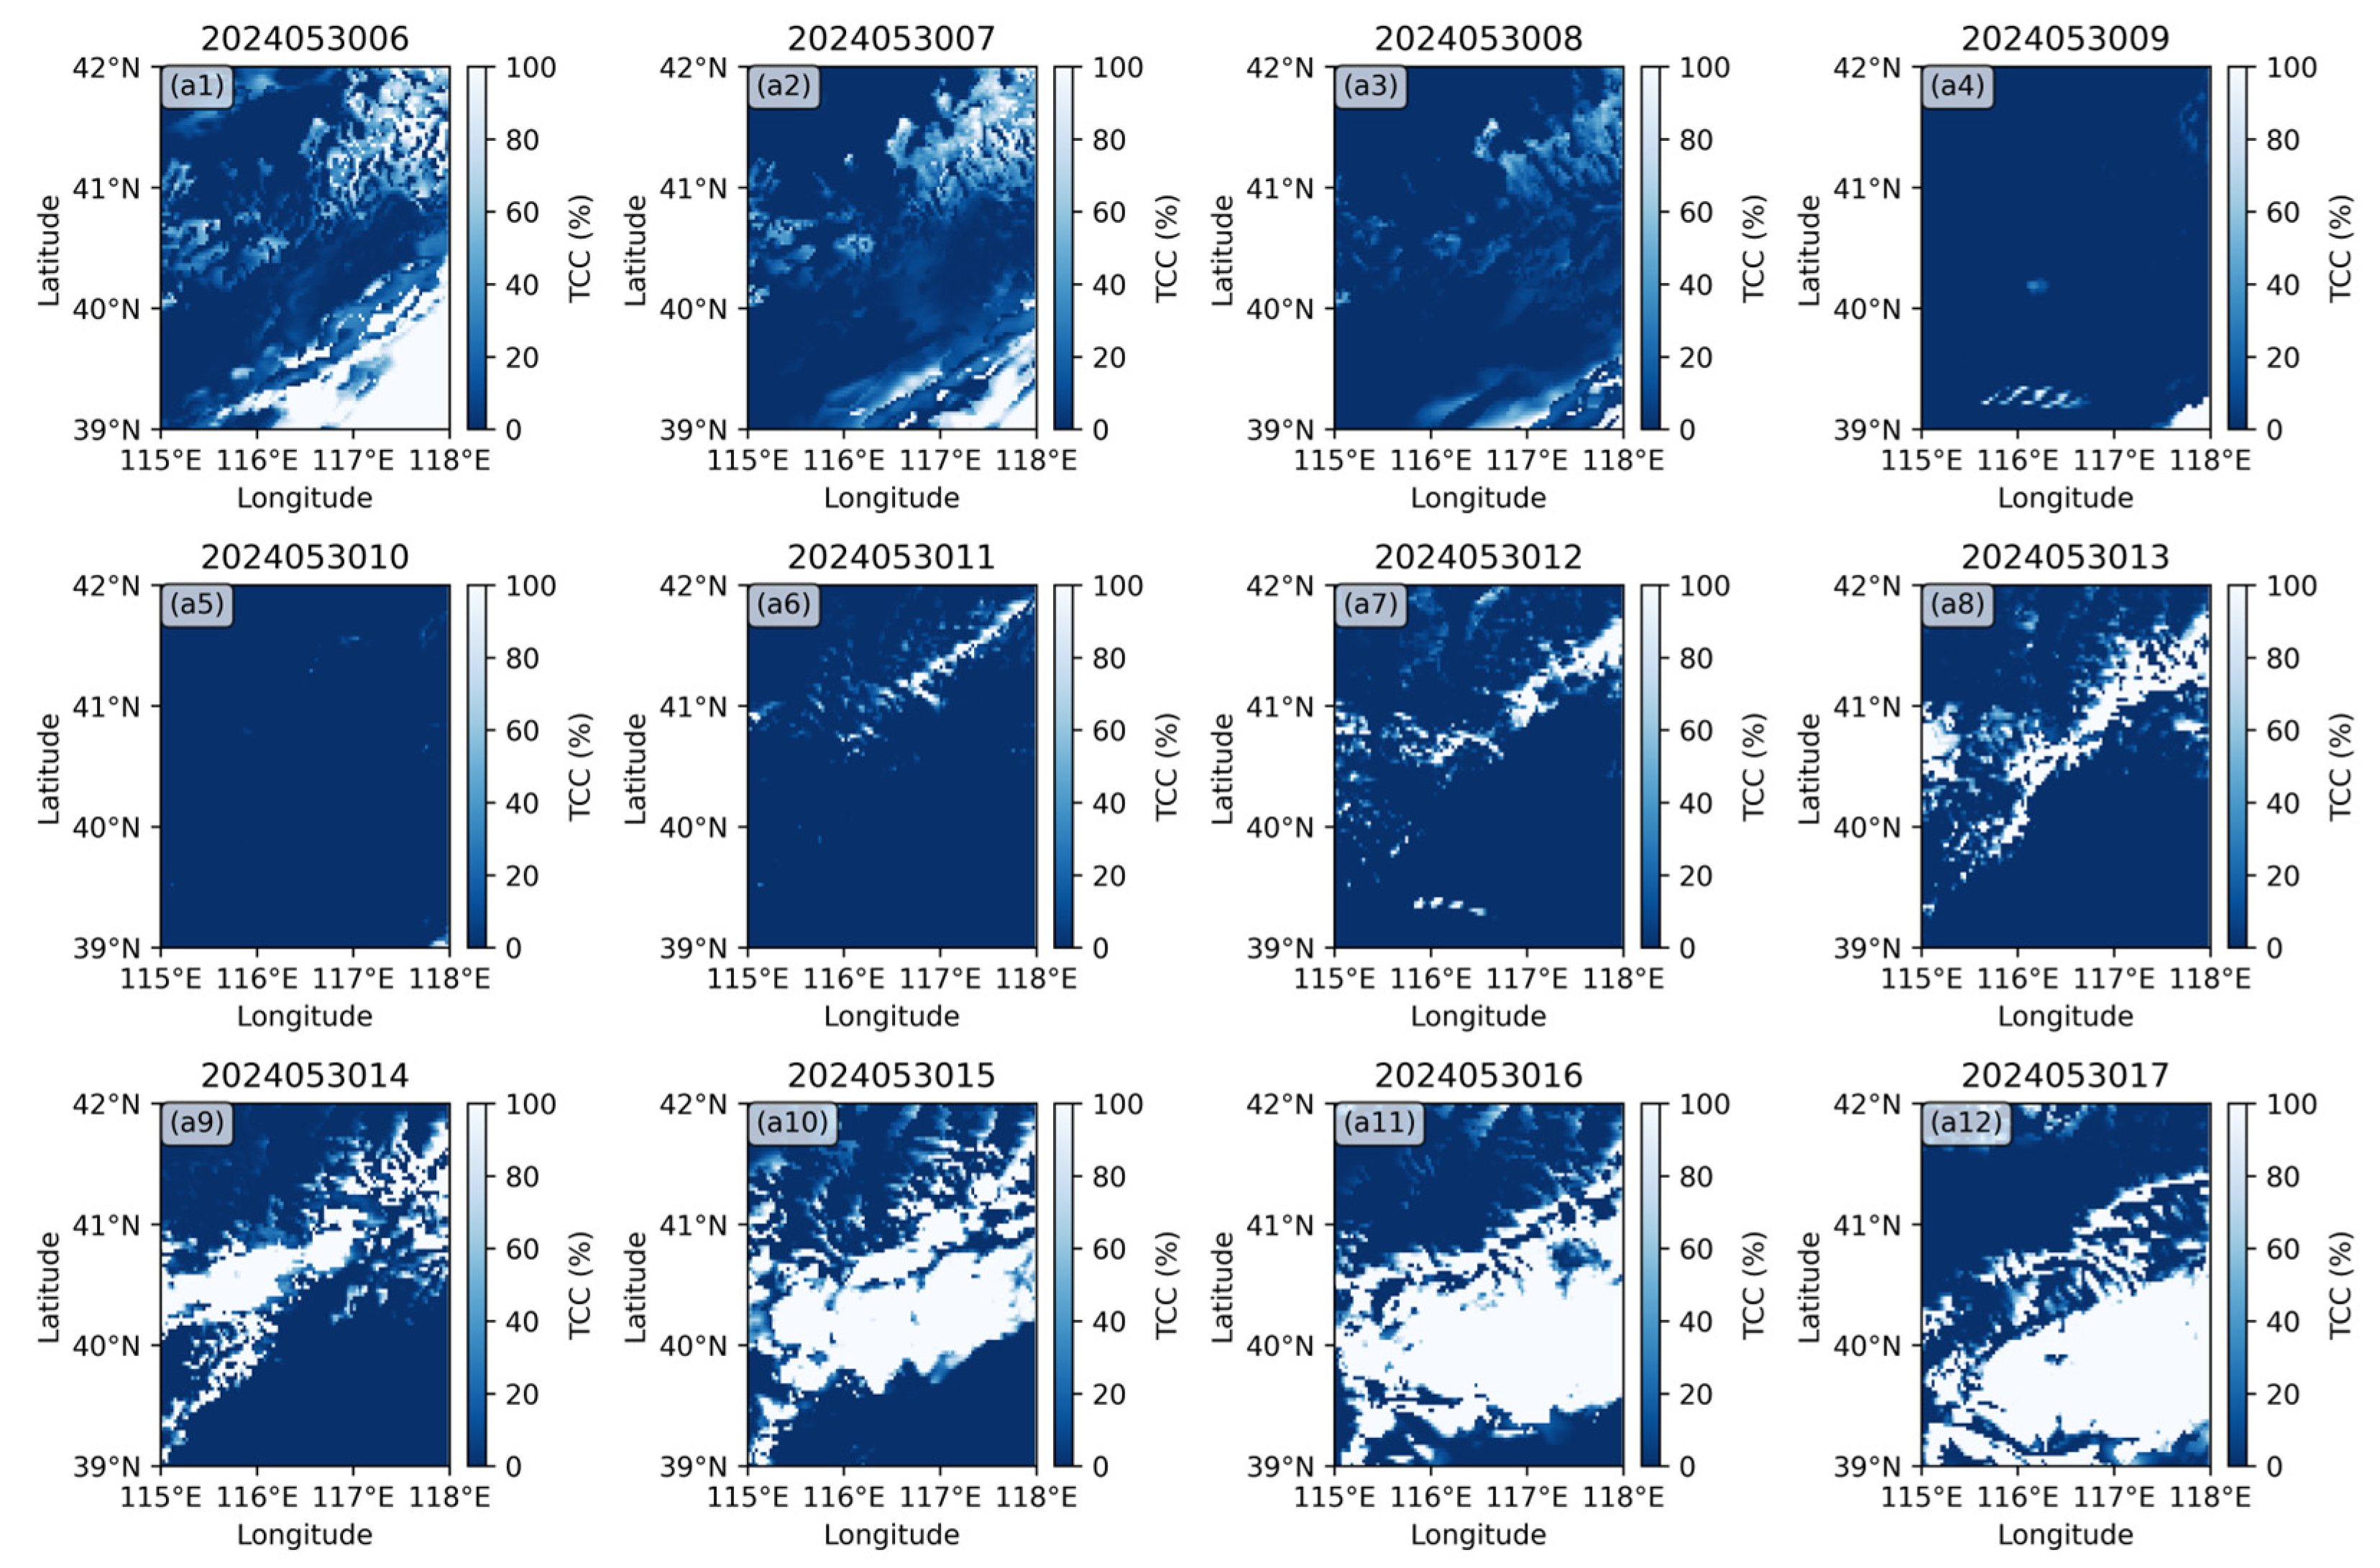
3.2. An Overall Analysis by the Observations from FY-4B AGRI

The AGRI observations of the gale on 30 May 2024 are shown in Figure 6. It is evident that at Yanqing station, the SSI increased to 400 W m−2 after 0800 BJT, leading to direct surface heating and a rapid rise in the surface temperature. Concurrently, the Upward Longwave Radiation (ULR) emitted by the surface at its own temperature also exhibited a continuously increasing trend, although the increase rate of the ULR lagged behind that of the SSI. During this heating process, the surface air parcel, heated by the increased solar radiation, began to rise rapidly. This ascending motion driven by strong uplifting forces led to cooling and condensation. As a result, the cloud coverage increased from 0 at 1200 BJT, suggesting the formation of cloud. Subsequently, the shortwave radiation decreased due to the shading effect of the clouds. Between 1300 and 1400 BJT, the clouds continued to develop and rise. During this period, liquid water began to appear within the clouds, as reflected by the change in cloud phase (a5 in Figure 6). The cloud development peaked at 1400 BJT, marking the onset of a strong convective wind over the Yanqing area. Similar patterns were also observed at the Huairou, Changping, and Mentougou stations, although the timing of the impacts varied. The specific order of impacts was as follows: 1330 BJT at Yanqing station, 1400 BJT at Huairou station, and 1420 BJT at Changping and Mentougou stations, which is consistent with the strong wind impacts observed at the ground-based automatic meteorological stations.

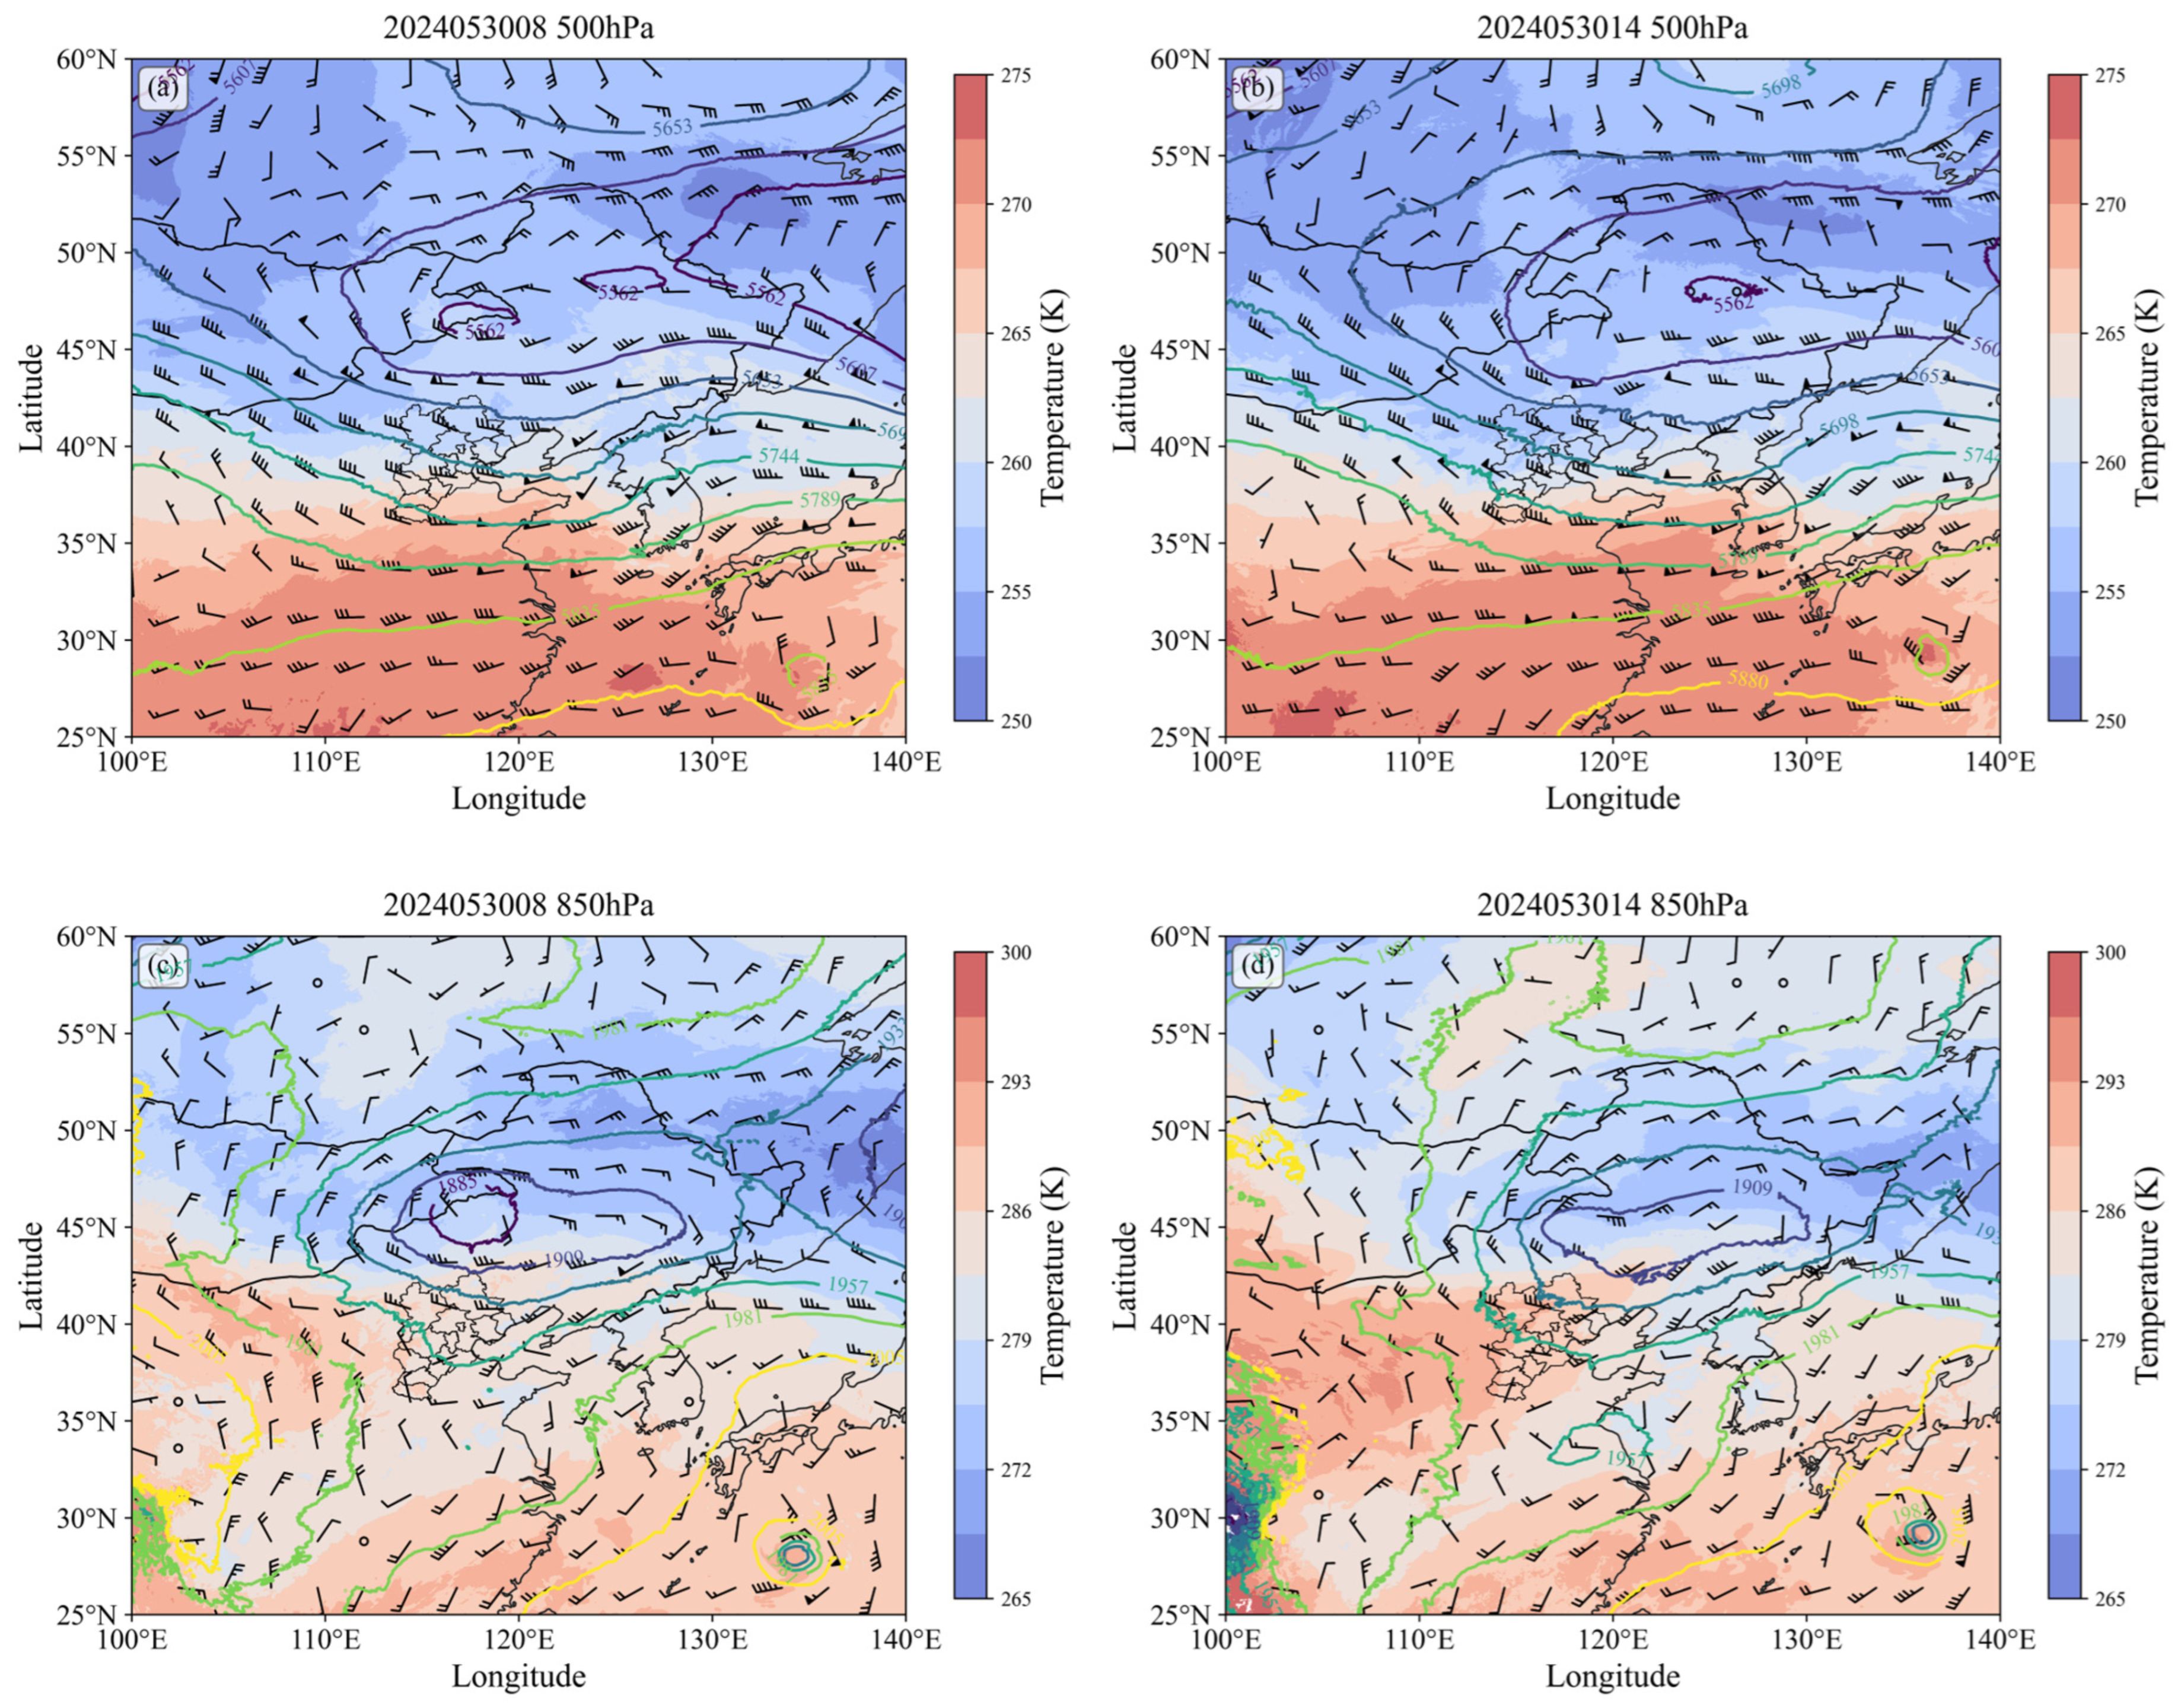
3.3. Spatial Diagnostic Analysis

In the spatial diagnostic analysis, it is important to note that when FY-4B observes surface temperature, the actual surface conditions will not be detectable if clouds are present in the region, thereby resulting in blank areas in the spatial distribution of the variables, such as temperature and humidity in the lower layers. Additionally, according to the research principles, prior to cloud formation, the heating effect of solar radiation promotes the formation of convection. After cloud formation, clouds scatter and absorb solar shortwave radiation, reducing the solar shortwave radiation reaching the surface. Therefore, the analysis process of each variable can be divided into two parts, where part 1 corresponds to the spatial diagnostic analysis before the formation of the cloud and part 2 corresponds to the spatial diagnostic analysis after the formation of the cloud.

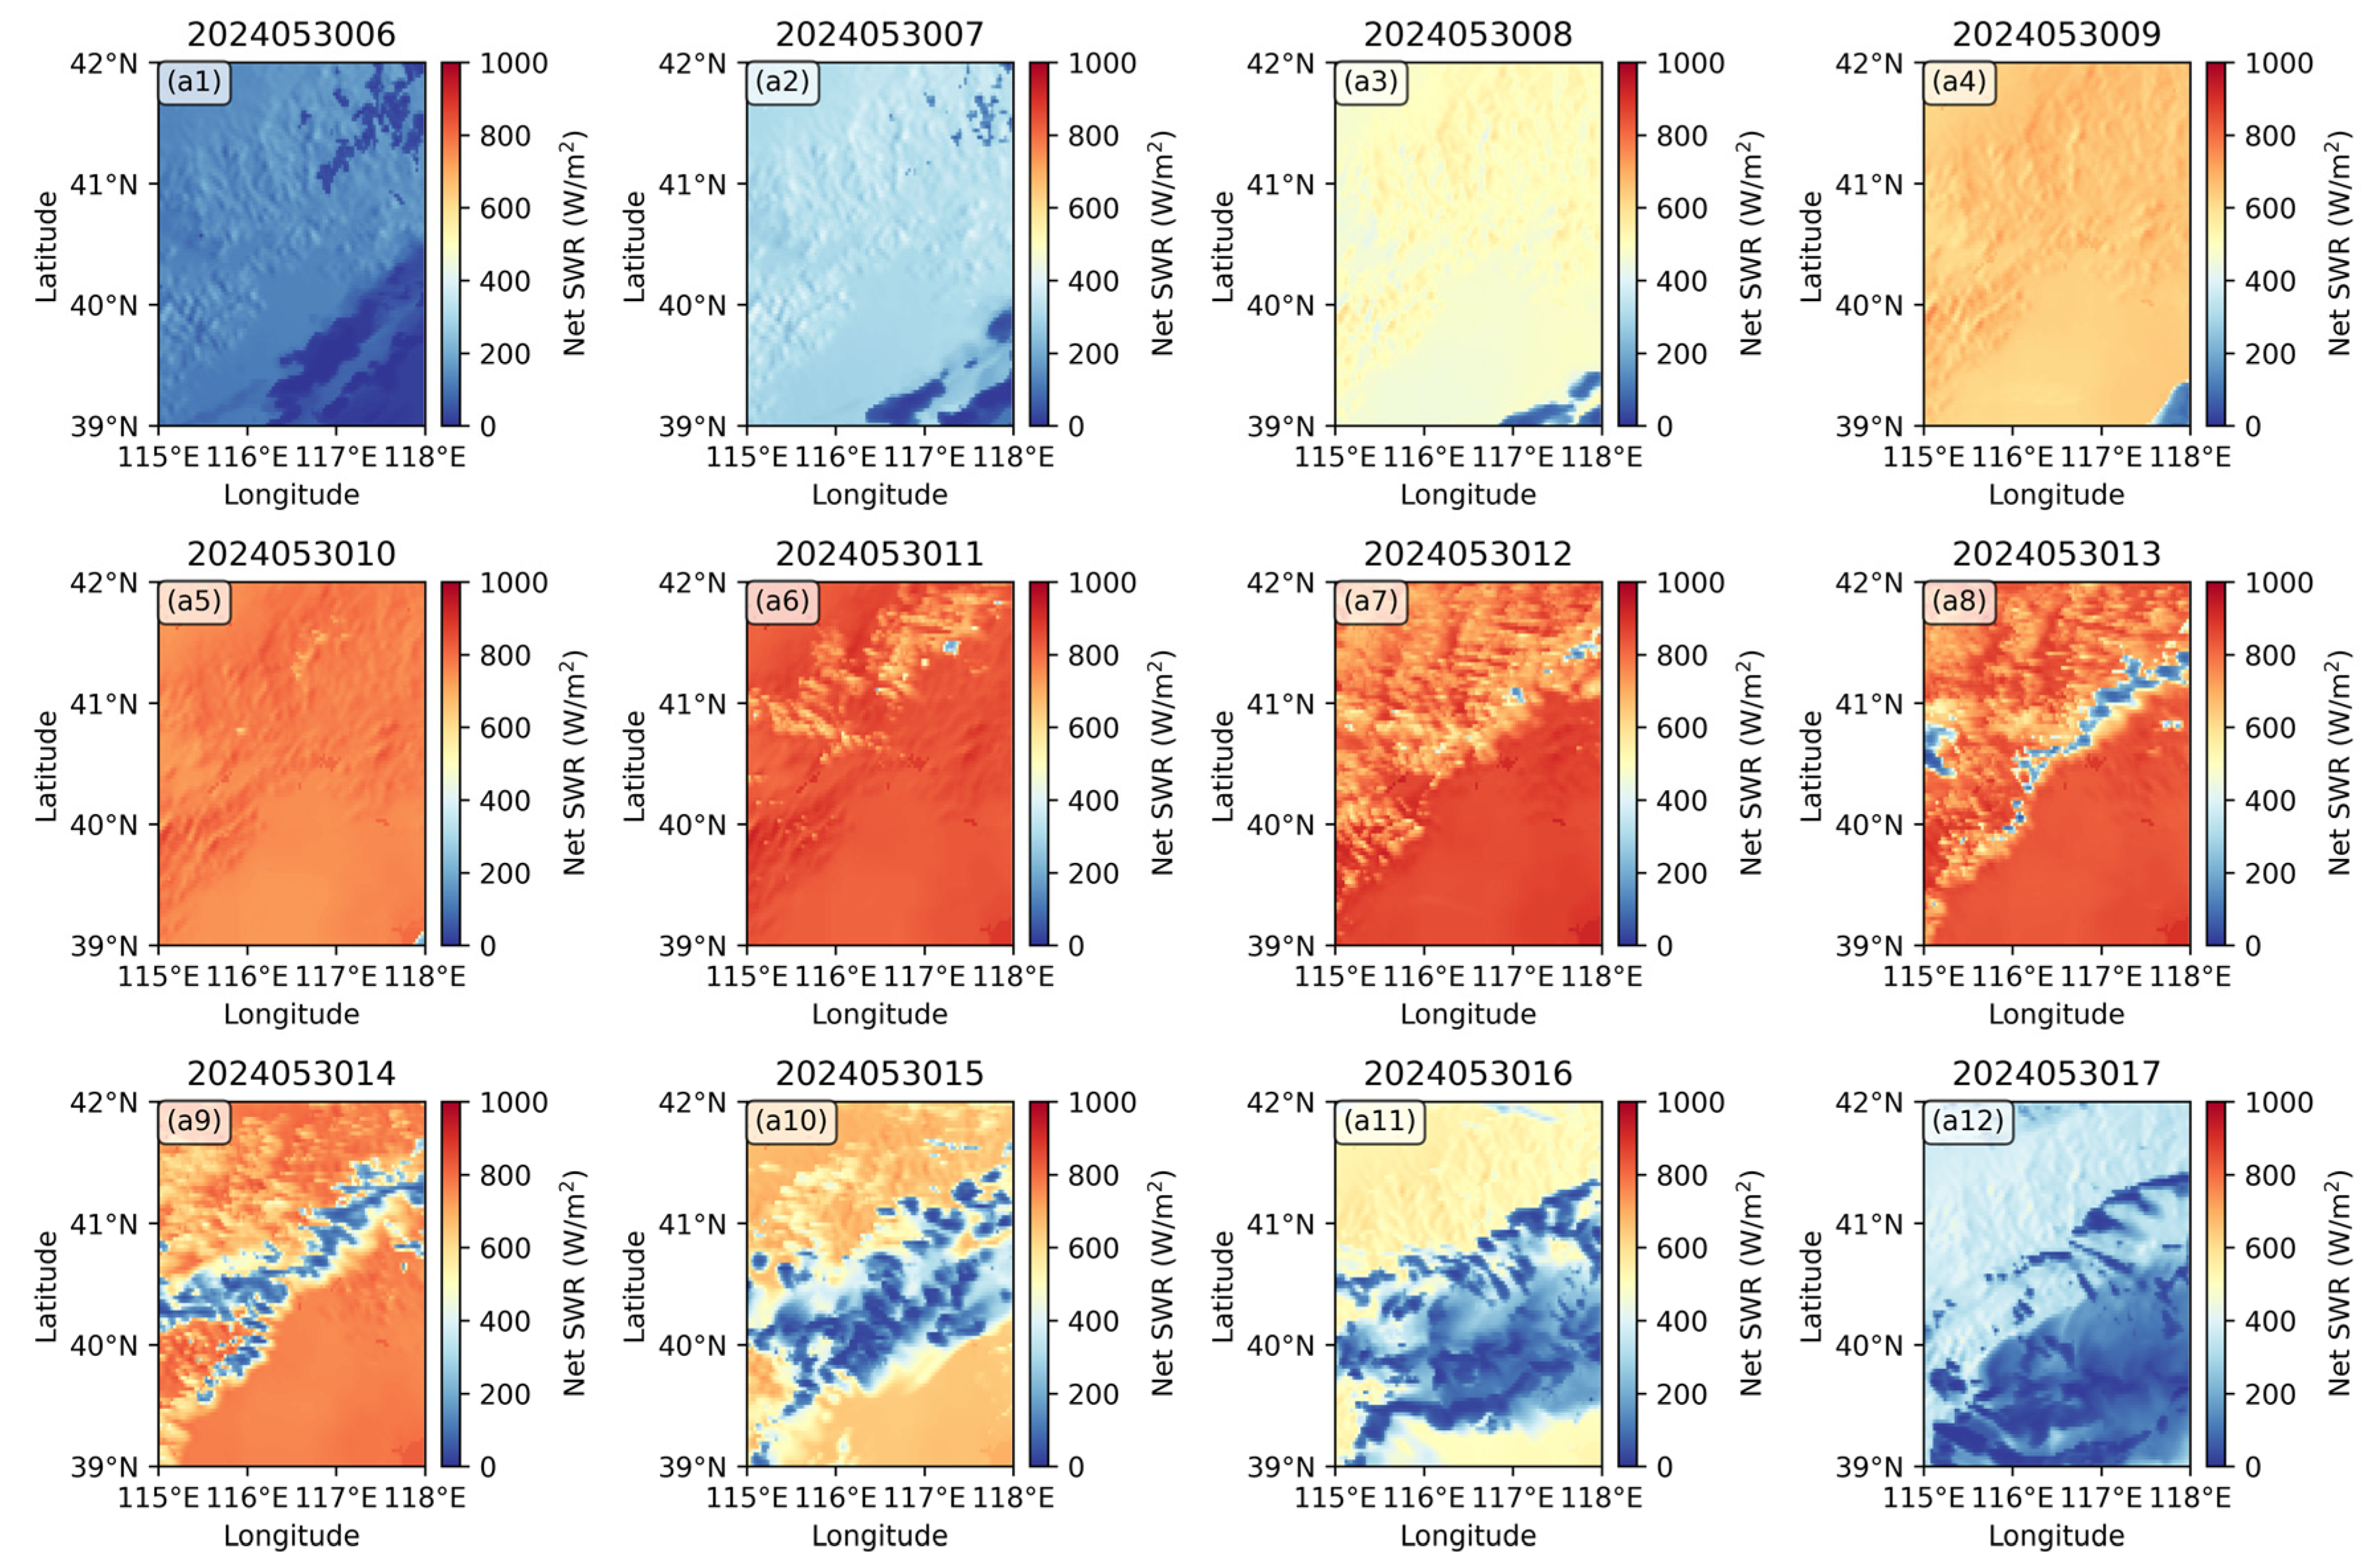
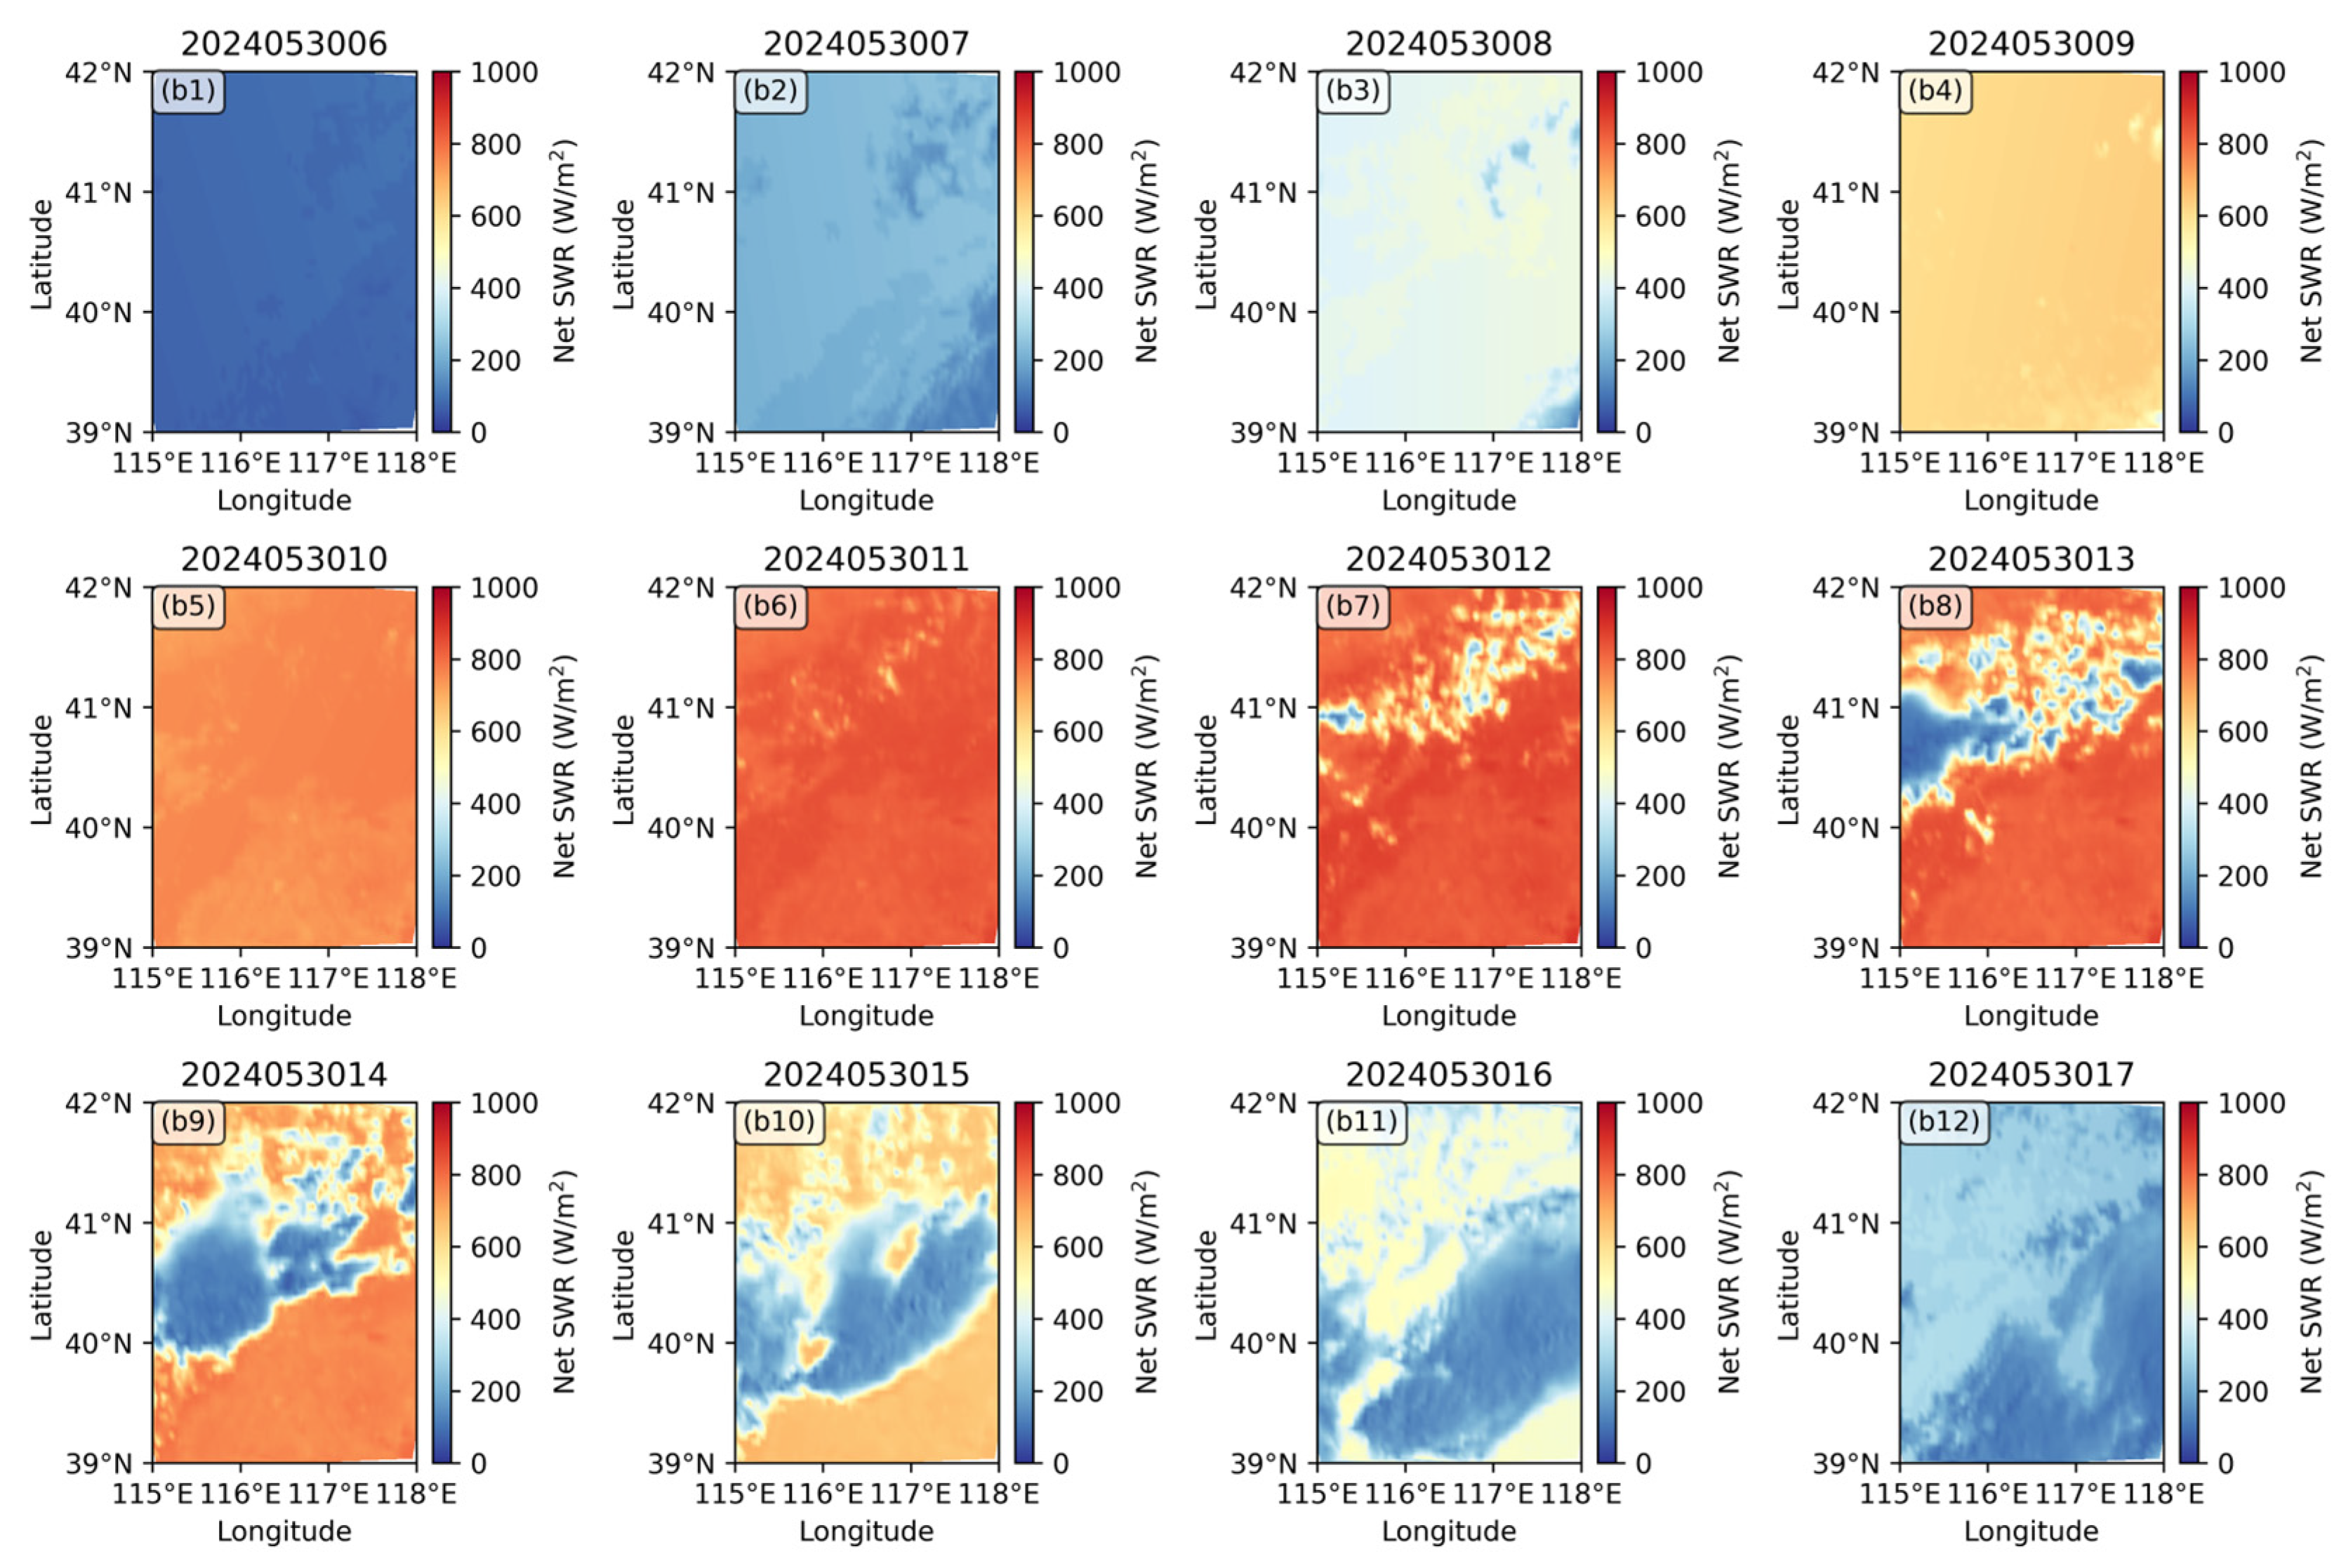
3.3.1. Diagnostic Analyses of Shortwave Radiation, Land Surface Temperature, and Cloud Coverage

As is shown in Figure 7, the diagnostic analysis of shortwave radiation is as follows: Part 1: Before the cloud formation, shortwave radiation continuously heats the surface. The solar shortwave radiation simulated by the CMA-MESO (Figure 7(a1–a12)) begins heating at 0600 BJT, and its overall intensity during 0600–1000 BJT is slightly higher than that from FY-4B observations (Figure 7(b1–b12)). From 1100 to 1200 BJT, the simulated intensity by the CMA-MESO is identical to that of FY-4B observations. Part 2: After the cloud formation, the radiative effect of clouds causes a reduction in shortwave radiation [29]. The CMA-MESO simulations show a slightly smaller low-value area of shortwave radiation, as the blocking effect by cloud is underestimated.
Due to the objective reason that satellite detection is affected by clouds, the diagnostic analysis of land surface temperature mainly considers the variable results before cloud formation (i.e., Part 1), which focuses on the shortwave radiation heating effect before cloud formation. As the surface temperature shown in Figure 8, the simulated shortwave radiation from the CMA-MESO (Figure 7) starts heating earlier with a slightly greater intensity before the cloud formation, which results in a higher surface temperature in the CMA-MESO simulations starting from 0700 BJT (Figure 8).
For spatial distributions of cloud-related variables, the focus is primarily on the variable results after cloud formation, (i.e., Part 2). The comparison between the CMA-MESO simulations and FY-4B L2 products reveals that during the development and intensification stages of the gale from 1200 to 1600 BJT, the cloud coverage area from the CMA-MESO simulations (Figure 9(a1–a12)) is obviously smaller than that from FY-4B L2 products (Figure 9(b1–b12)). Additionally, during the period from 1300 to 1600 BJT, FY-4B effectively captures the entire process of cloud formation starting from 1300 BJT in northwestern Beijing, as well as its movement toward the southeast.

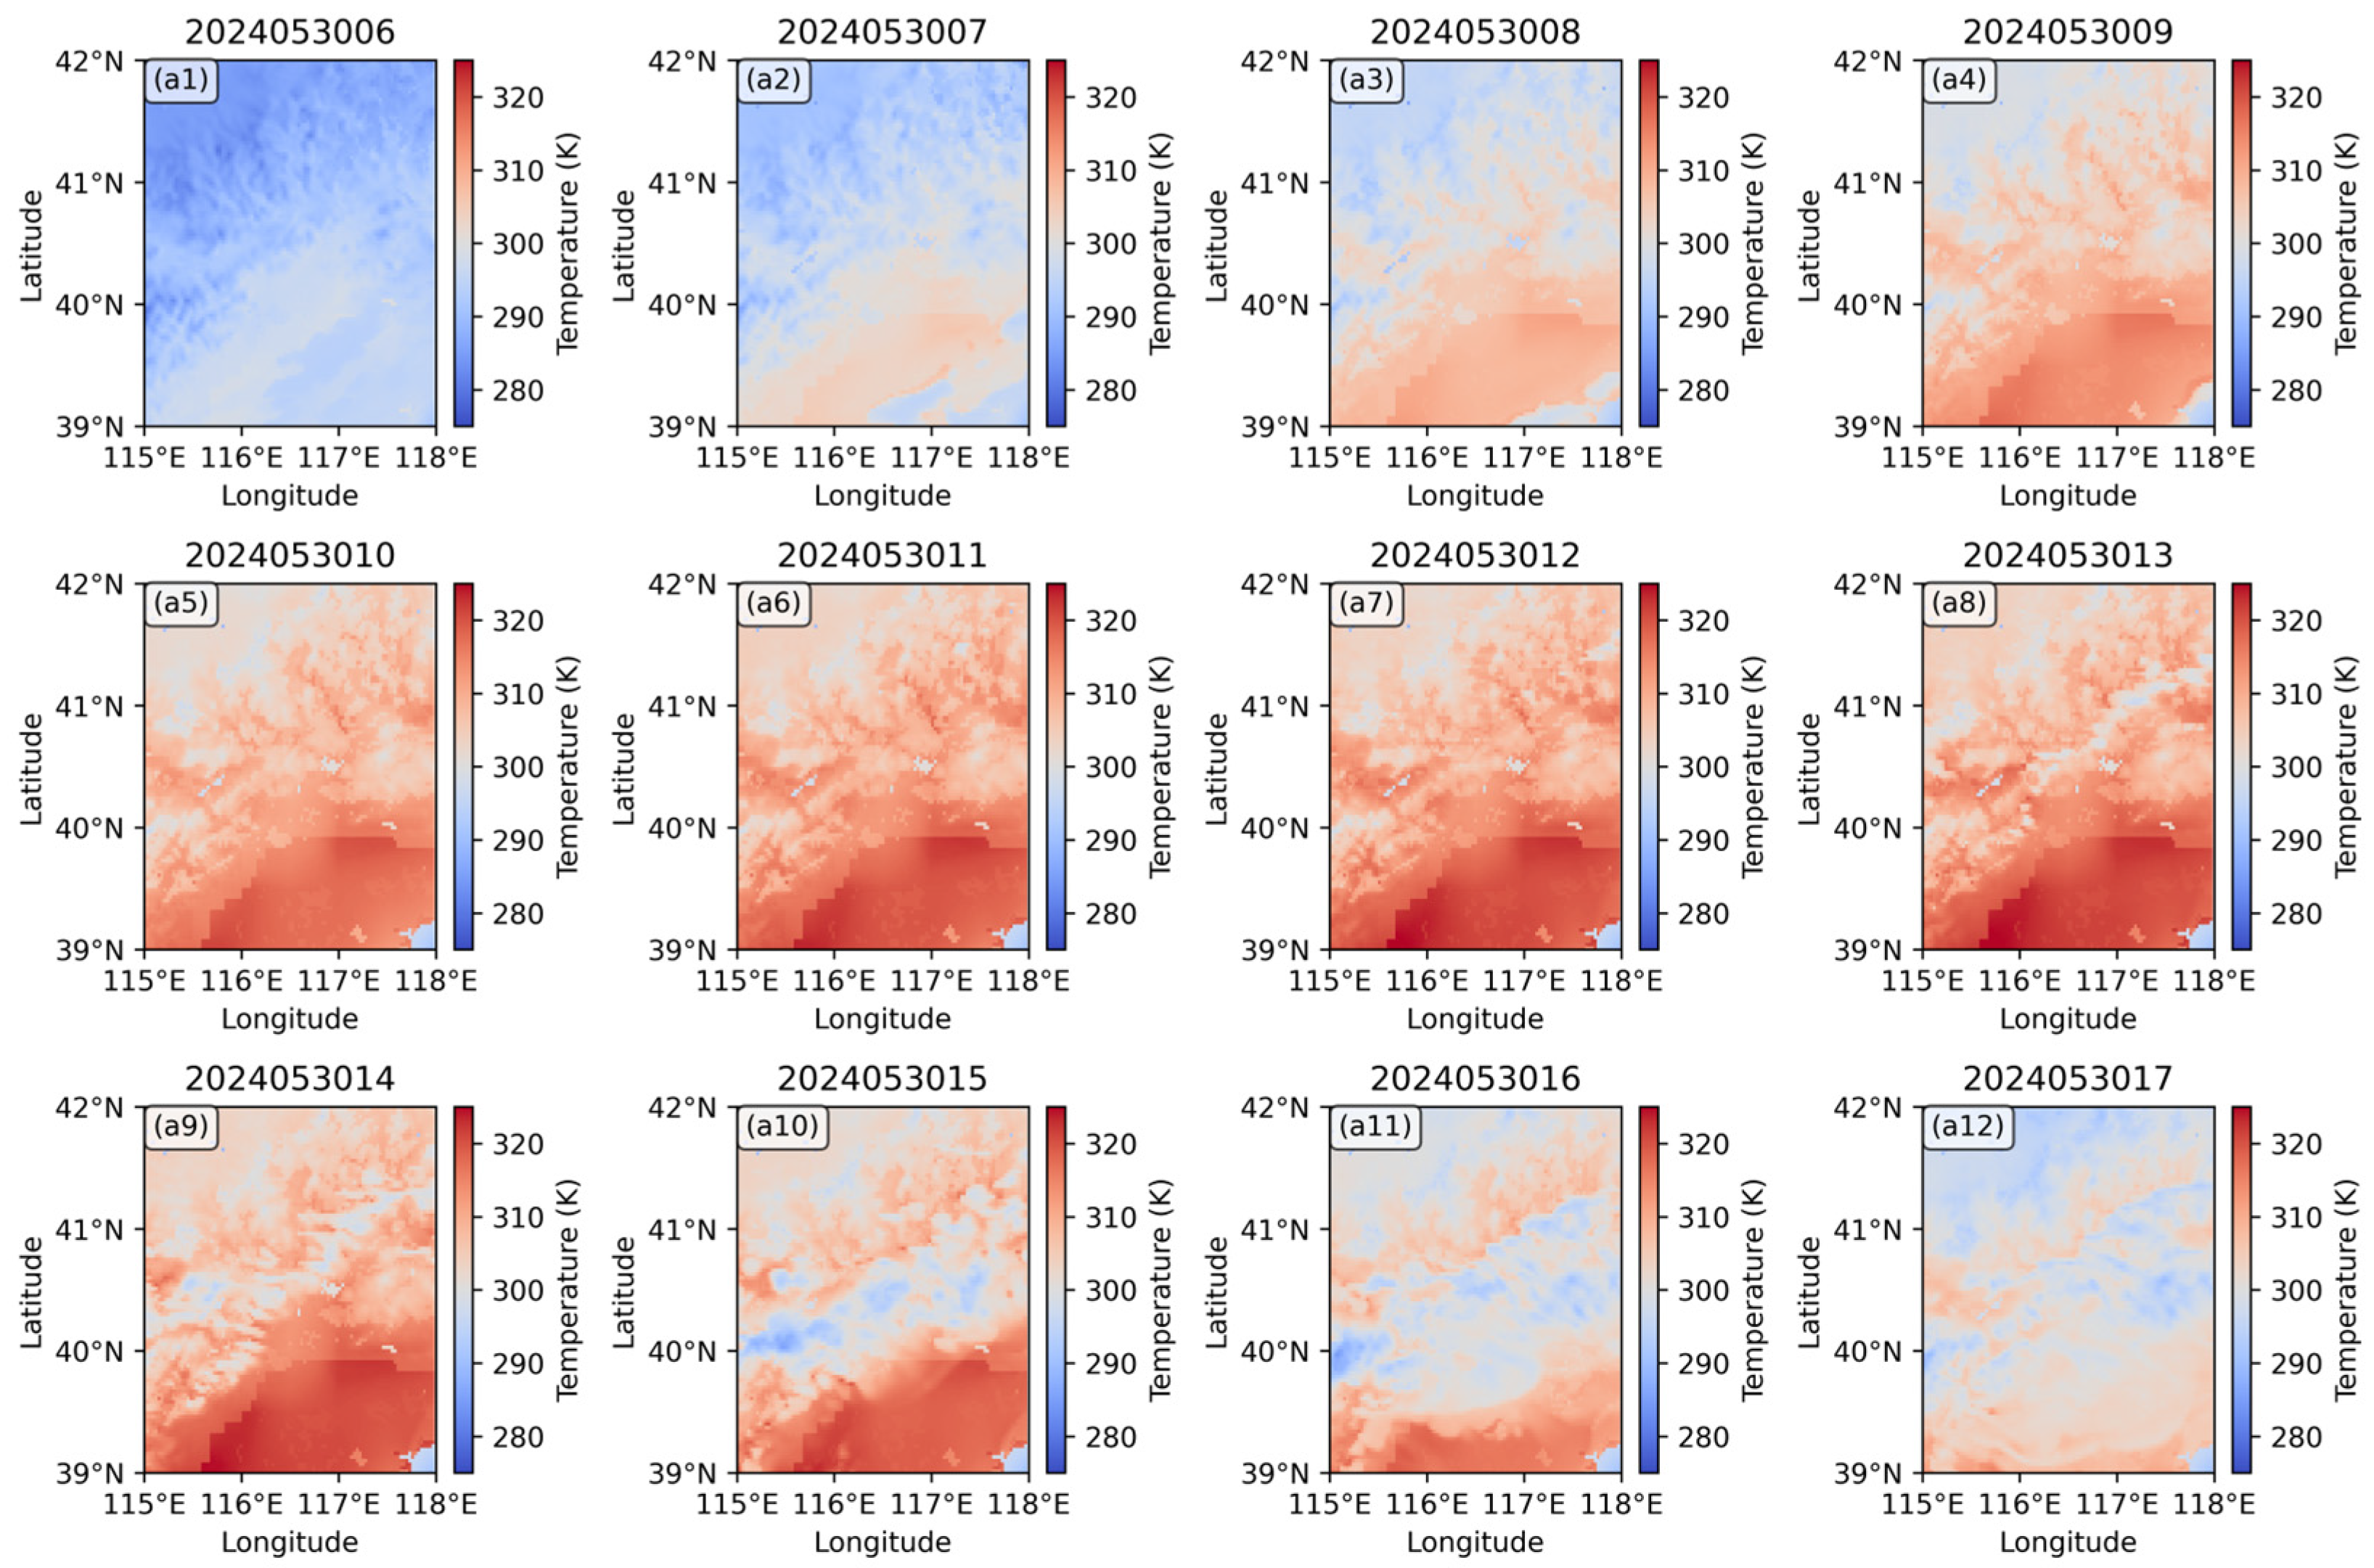
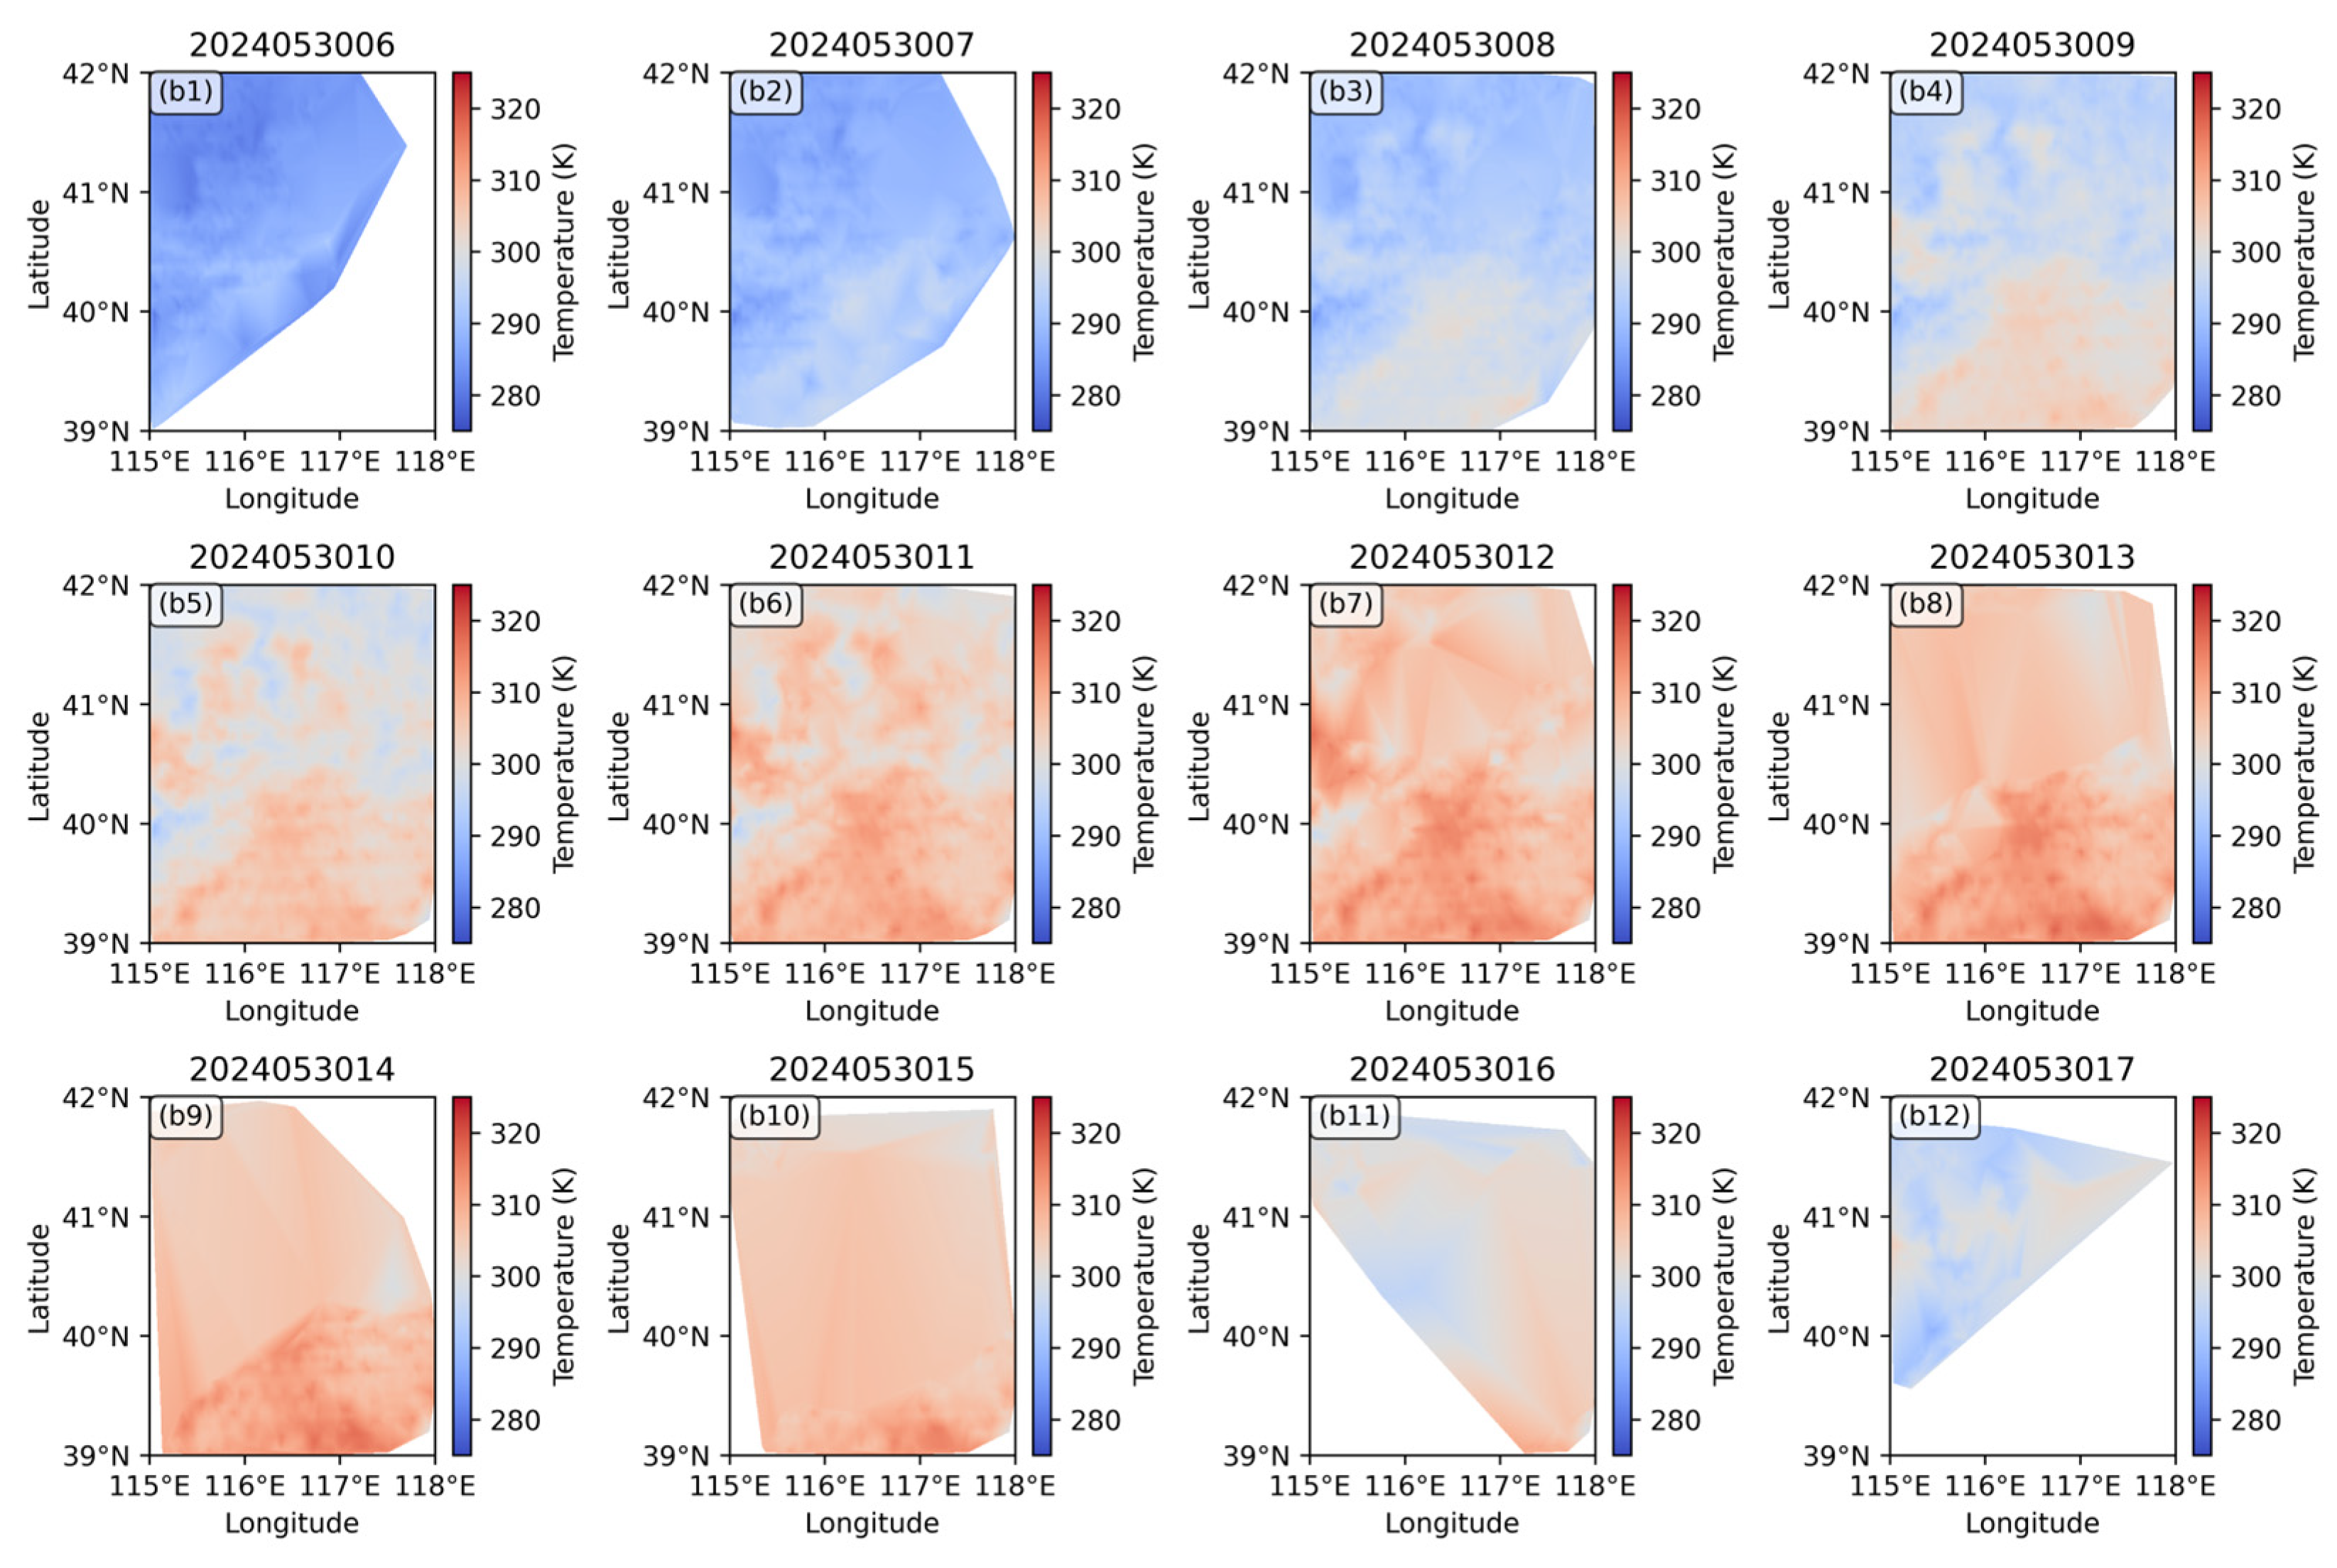
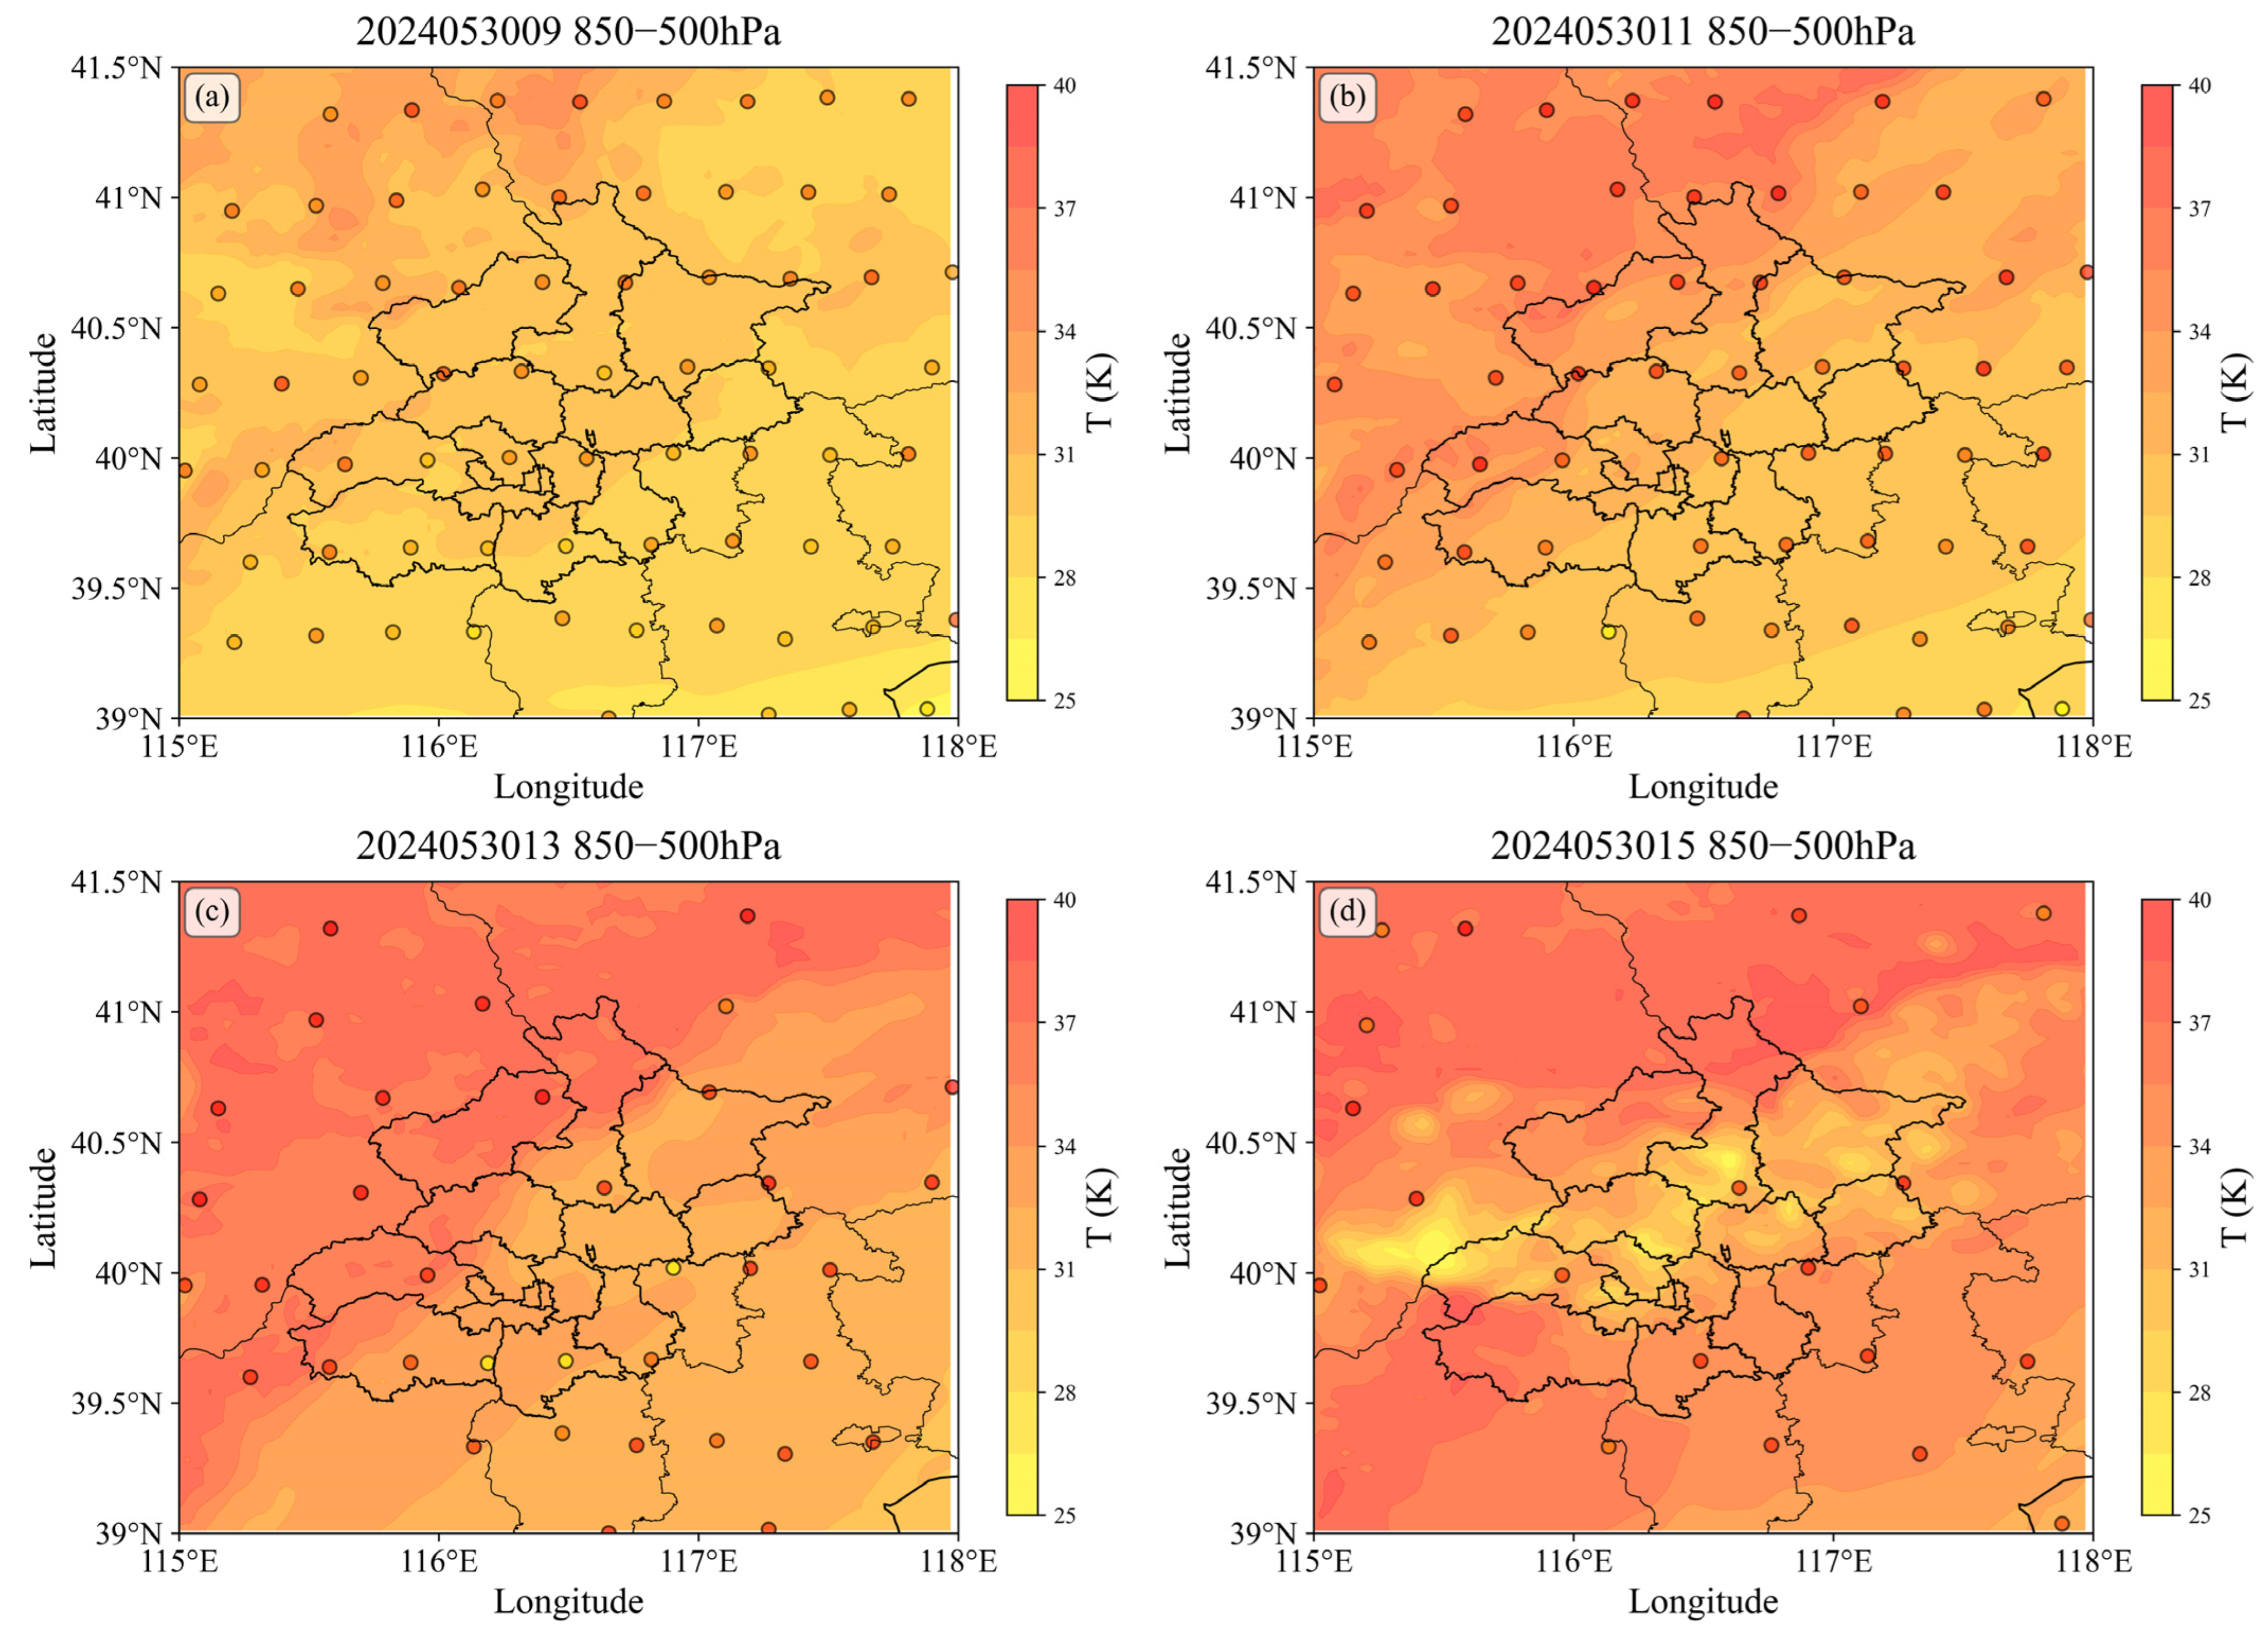
3.3.2. Diagnostic Analysis of the Thermal Field

The temperature difference between 850 hPa and 500 hPa serves as a robust indicator of the instability in the mid-to-lower troposphere. When this temperature difference exceeds 28 K, it signifies an unstable atmospheric condition, which is highly conducive to the triggering of convective weather. Figure 10 shows the variation in the thermal field during the gale. Part 1: Before the cloud formation, from 0900 to 1100 BJT, the temperature difference observed by the FY-4B L2 Products is already greater than that simulated by the CMA-MESO. Part 2: The cloud formation began at 1300 BJT, leading to data gaps in the FY-4B observations. By 1500 BJT, convection had developed vigorously, resulting in more missing data. However, a comparison using the available data indicates that the temperature difference simulated by the CMA-MESO is mostly lower than that observed by the FY-4B. This suggests that the forecasts of atmospheric instability intensity still require improvement and optimization.

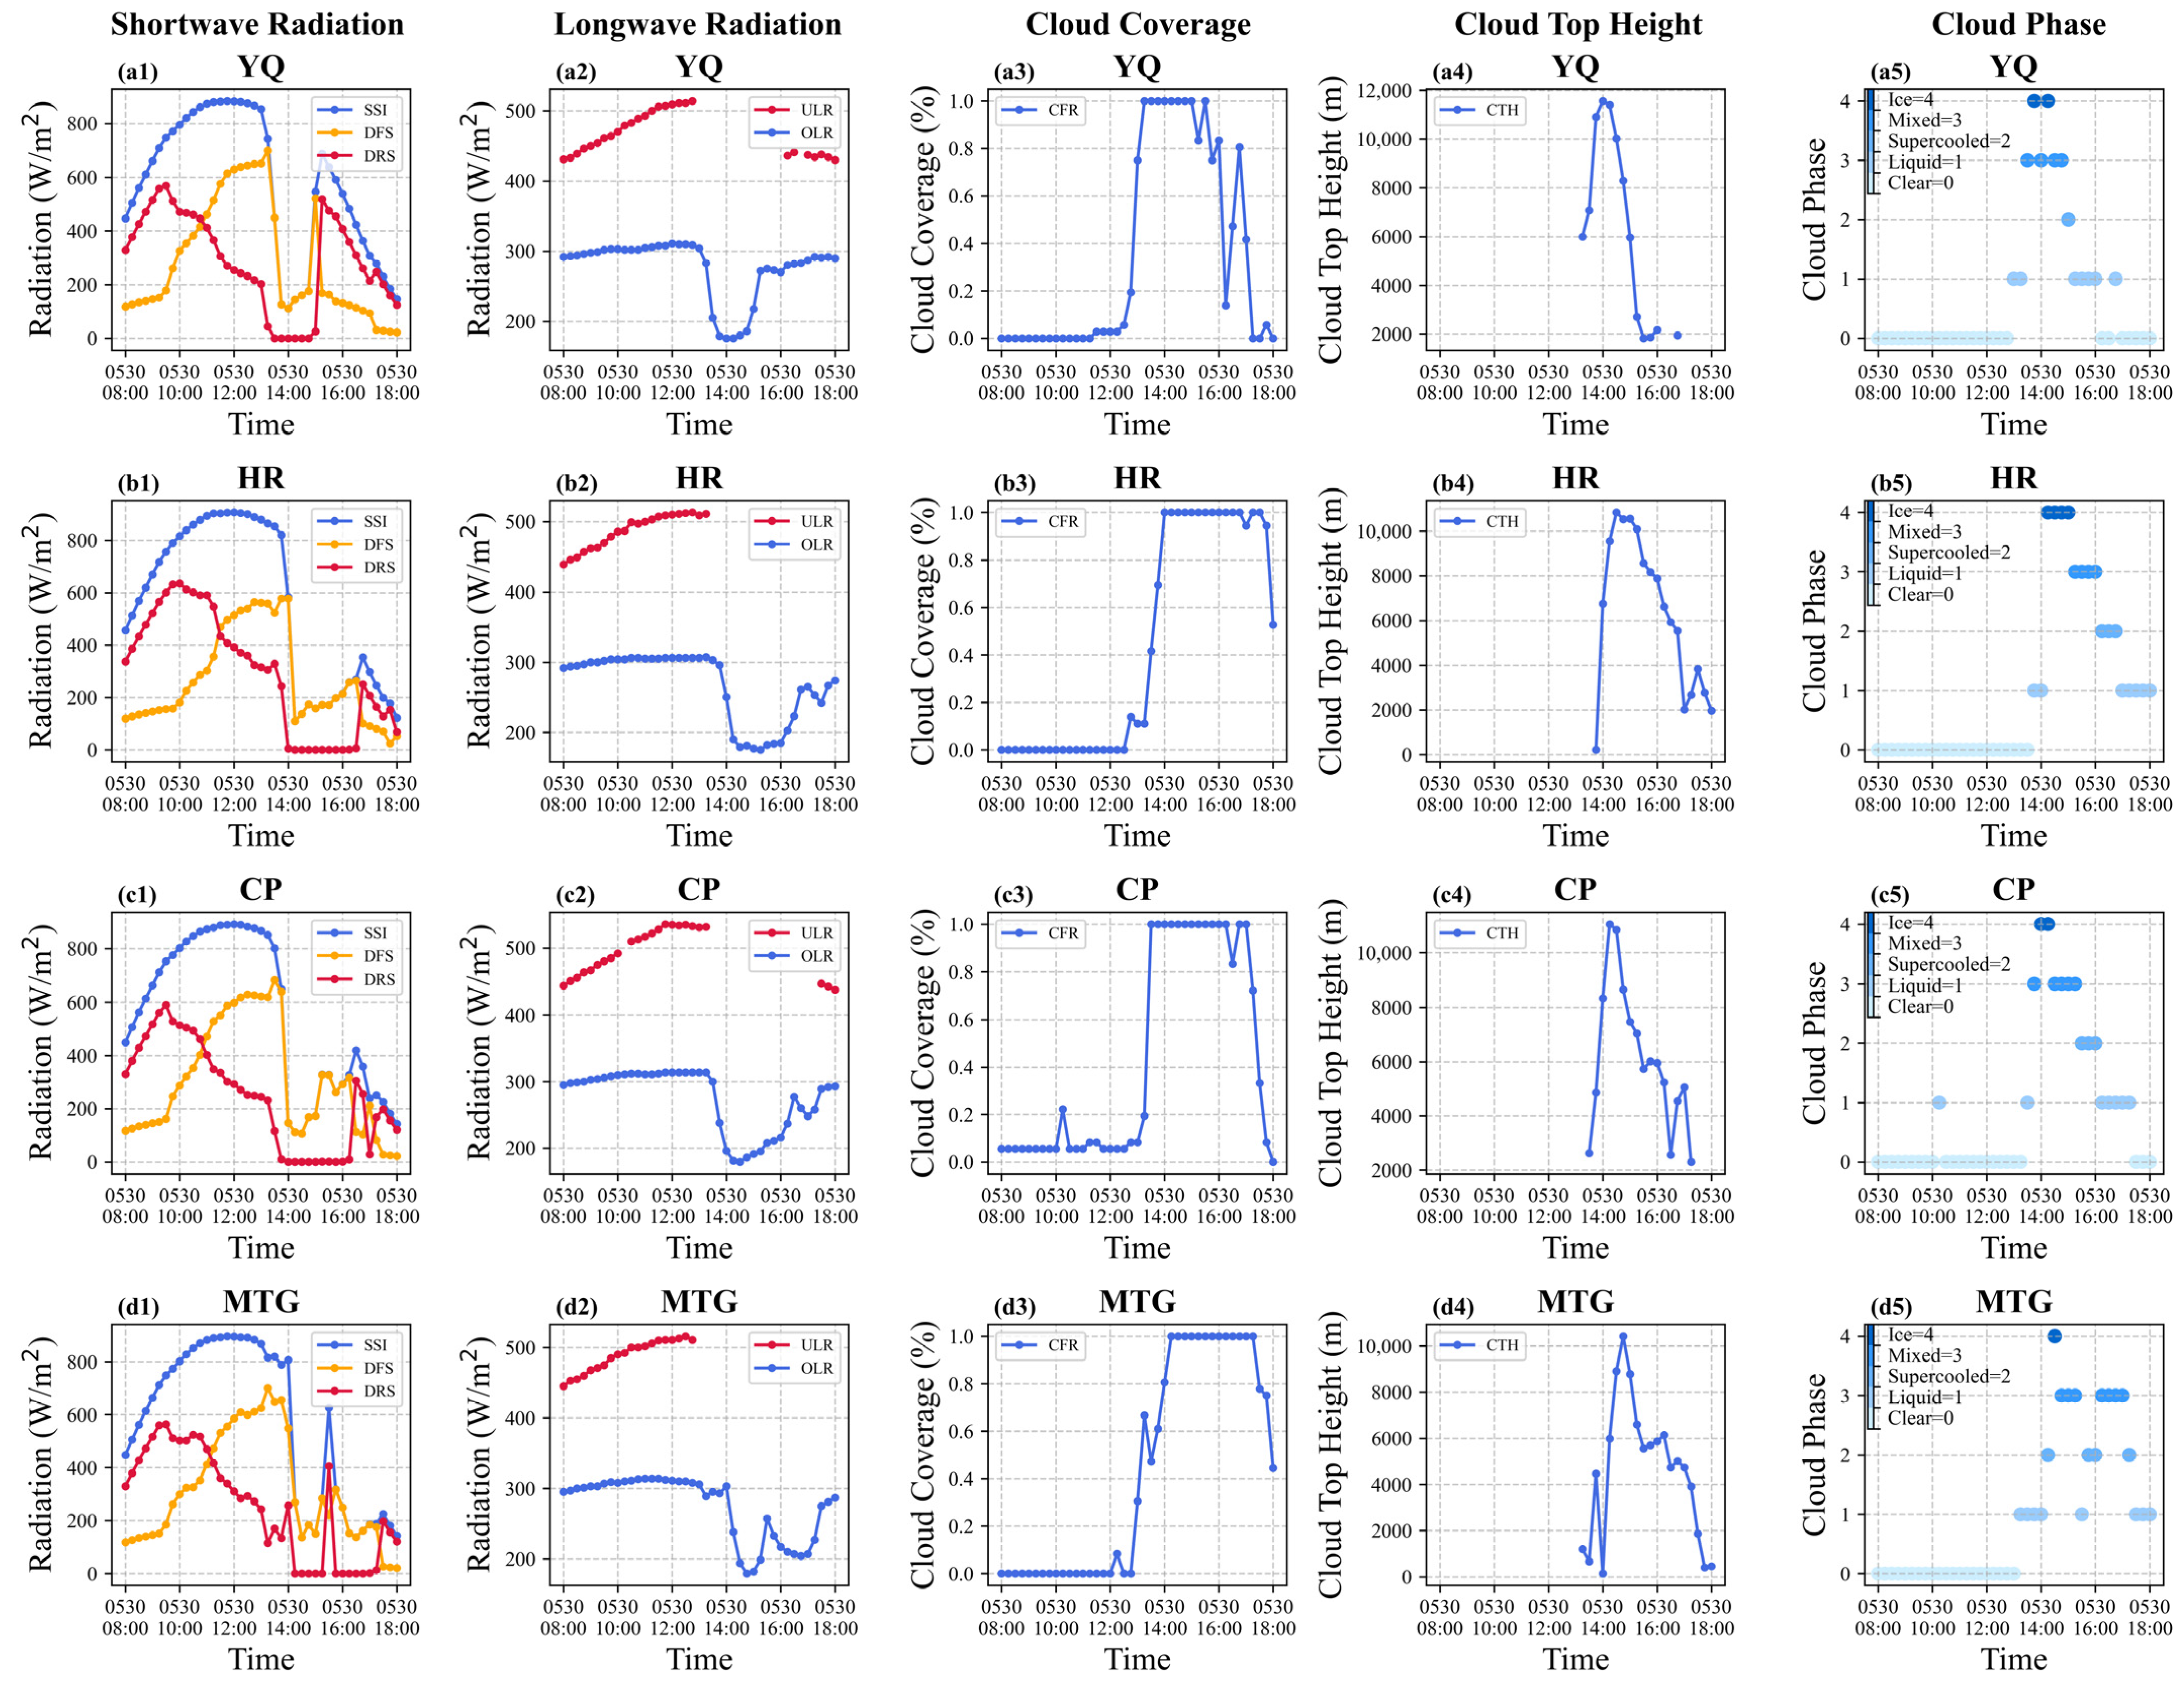
3.4. Station Diagnostic Analysis

3.4.1. Overall Diagnostic Analysis of Surface Net Shortwave Radiation, Land Surface Temperature, and Cloud Top Height

To perform the diagnostic analysis for the 14 typical impacted stations, the station dataset is firstly used to conduct an overall analysis of the three variables of NSR, LST, and CTH. As is shown in Figure 11, the simulated shortwave radiation by the CMA-MESO is generally stronger when its intensity exceeds 300 W m−2, with a difference of about 100 W m−2 relative to the observations. This corresponds to a higher surface temperature in the CMA-MESO simulations, with a maximum temperature difference reaching approximately 10 K. Additionally, during this gale, the cloud tops from the observation data products are generally higher, indicating a stronger convective development. However, the CMA-MESO fails to capture the cloud formation accurately, with the values being 0.

3.4.2. Specific Diagnostic Analysis of Surface Net Shortwave Radiation, Land Surface Temperature, Cloud Coverage, and Cloud Top Height

From the perspective of a single station, the NSR from the CMA-MESO simulations exhibits a larger intensity between 0500 BJT and 0900 BJT after the heating starts, with the largest difference reaching 100 W m−2 at 0700 BJT (Figure 12(a1–c1)). This causes a stronger continuous heating effect from solar shortwave radiation in the CMA-MESO simulations, further leading to a greater LST increase (Figure 12(a2–c2)). Furthermore, the CMA-MESO simulations generally exhibit lower CTH values, indicating a weaker convective development, a delayed onset of cloud formation, and a shorter duration of cloud coverage. Notably, meteorological observations show that the temperature dropped sharply by 12 °C within 15 min starting from 1440 BJT, but the CMA-MESO simulations fail to capture this sudden temperature drop. This indicates that the CMA-MESO is incapable of simulating the cloud formation associated with this strong convective process.

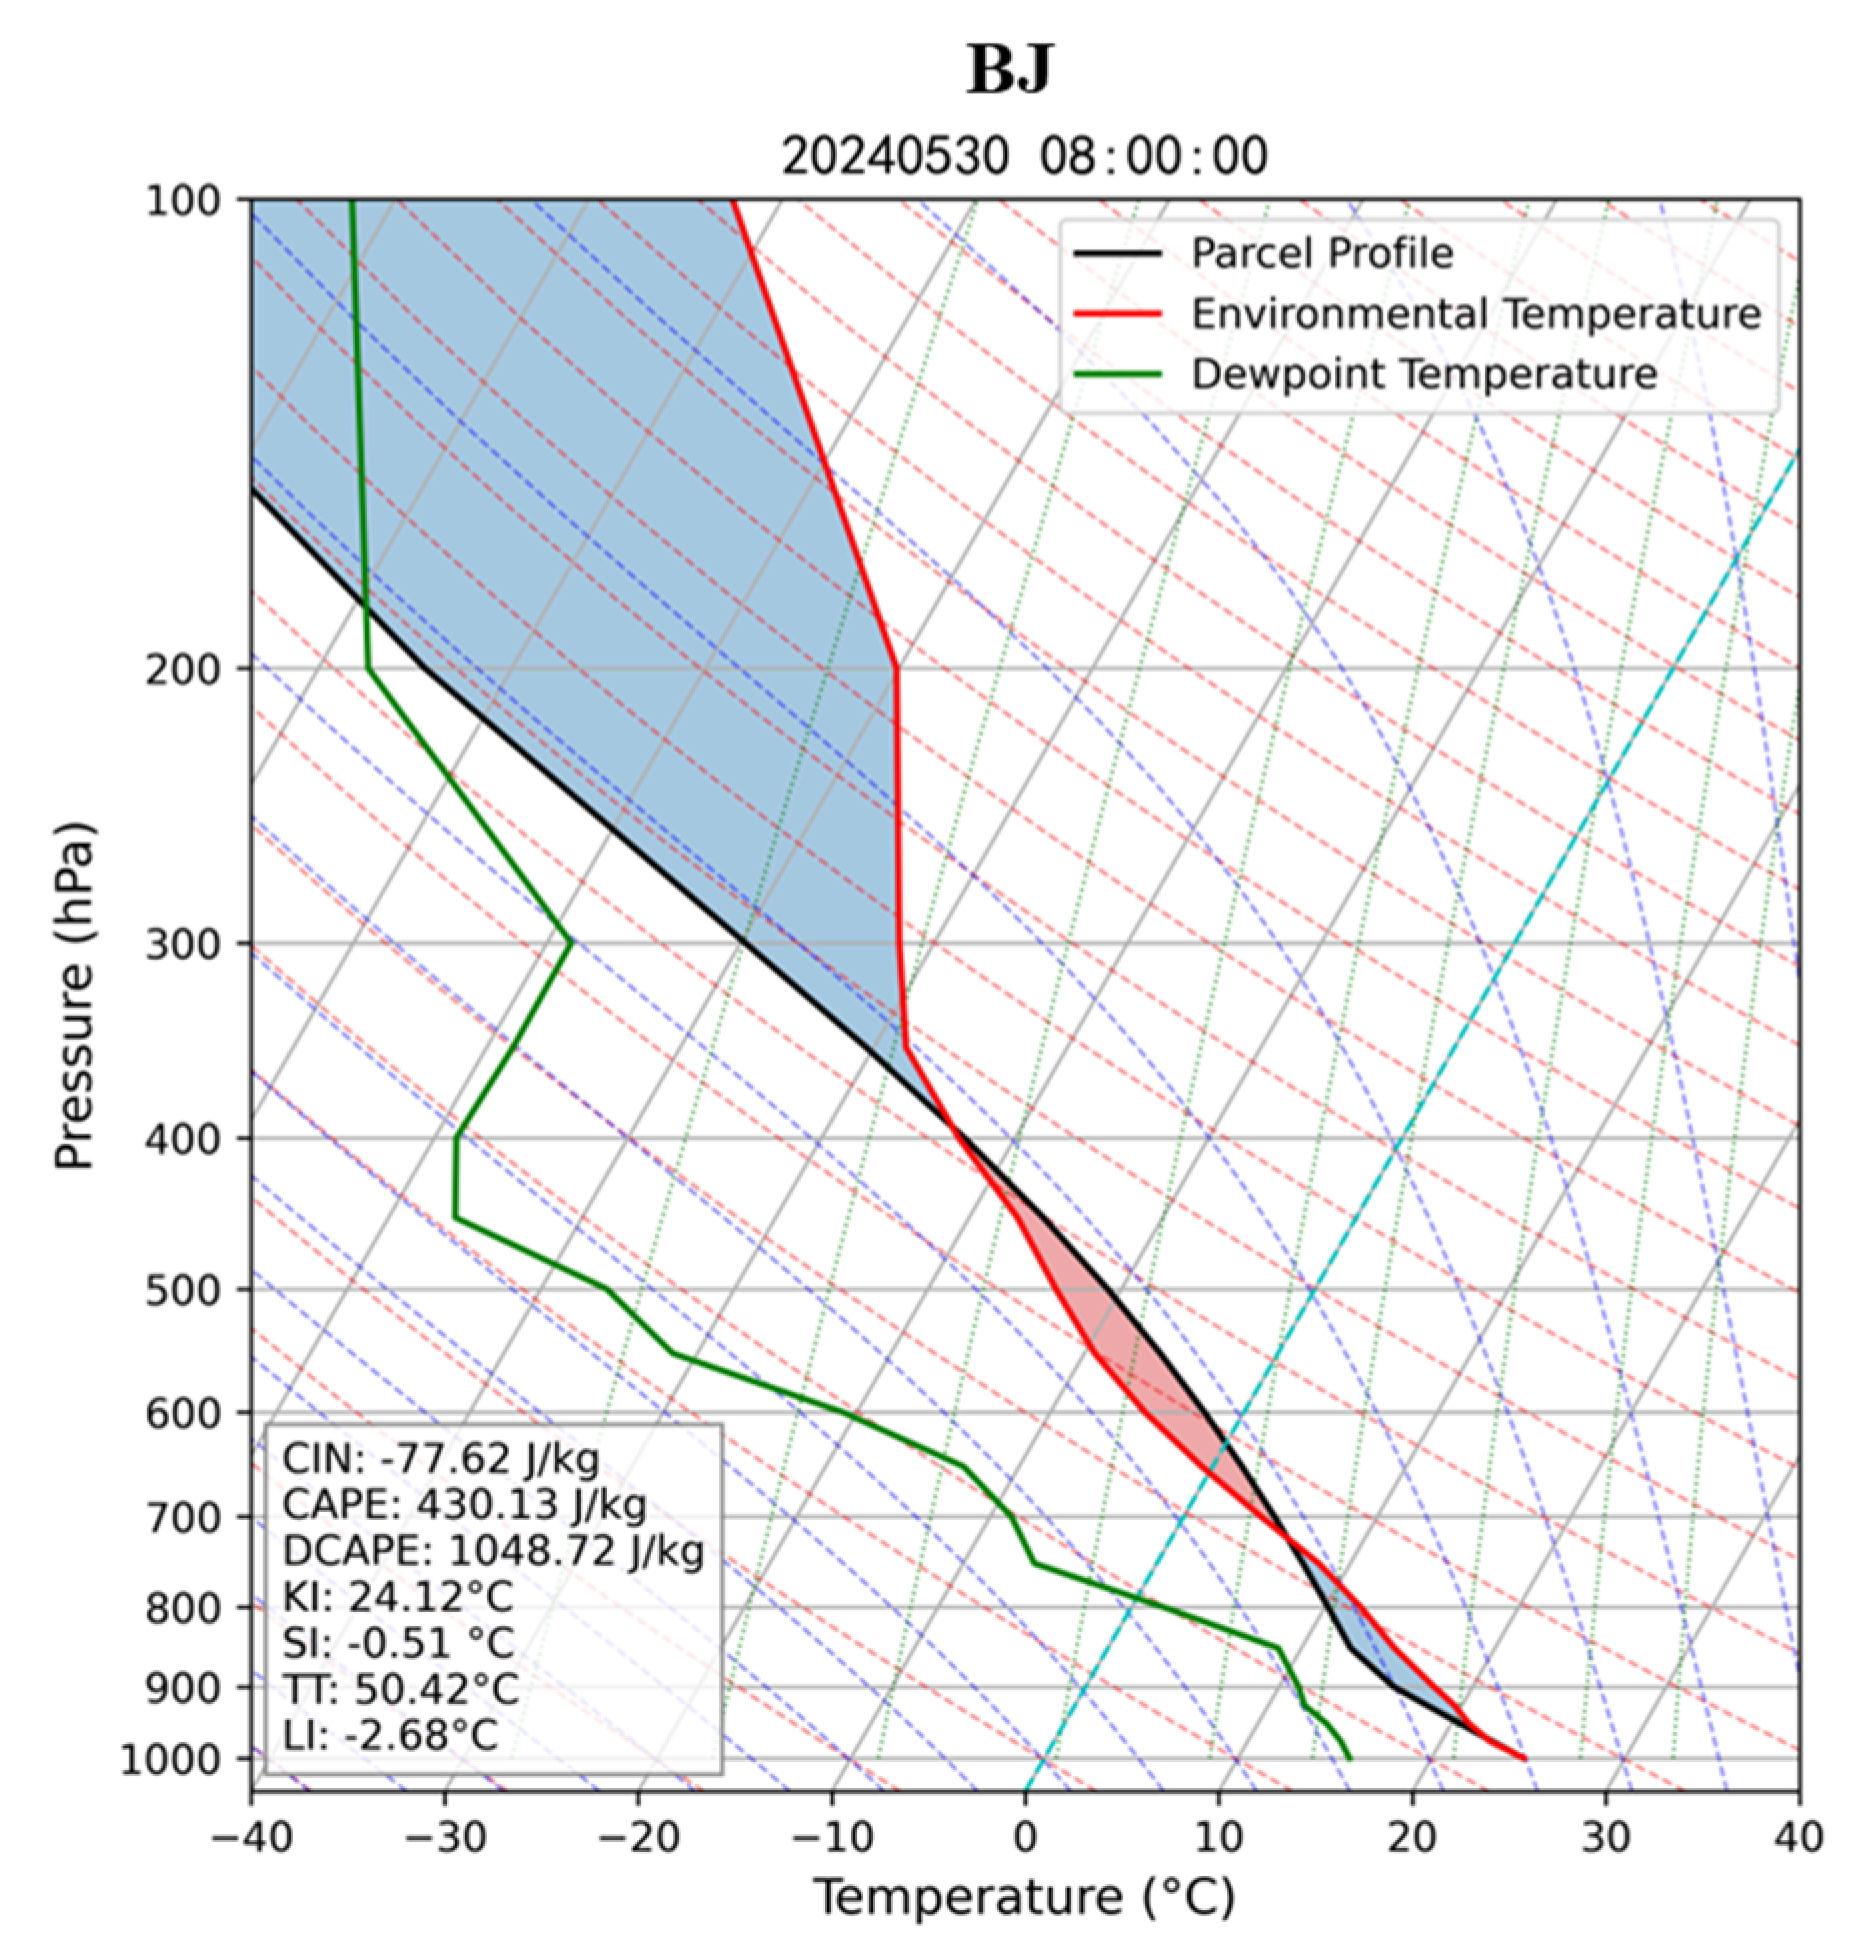
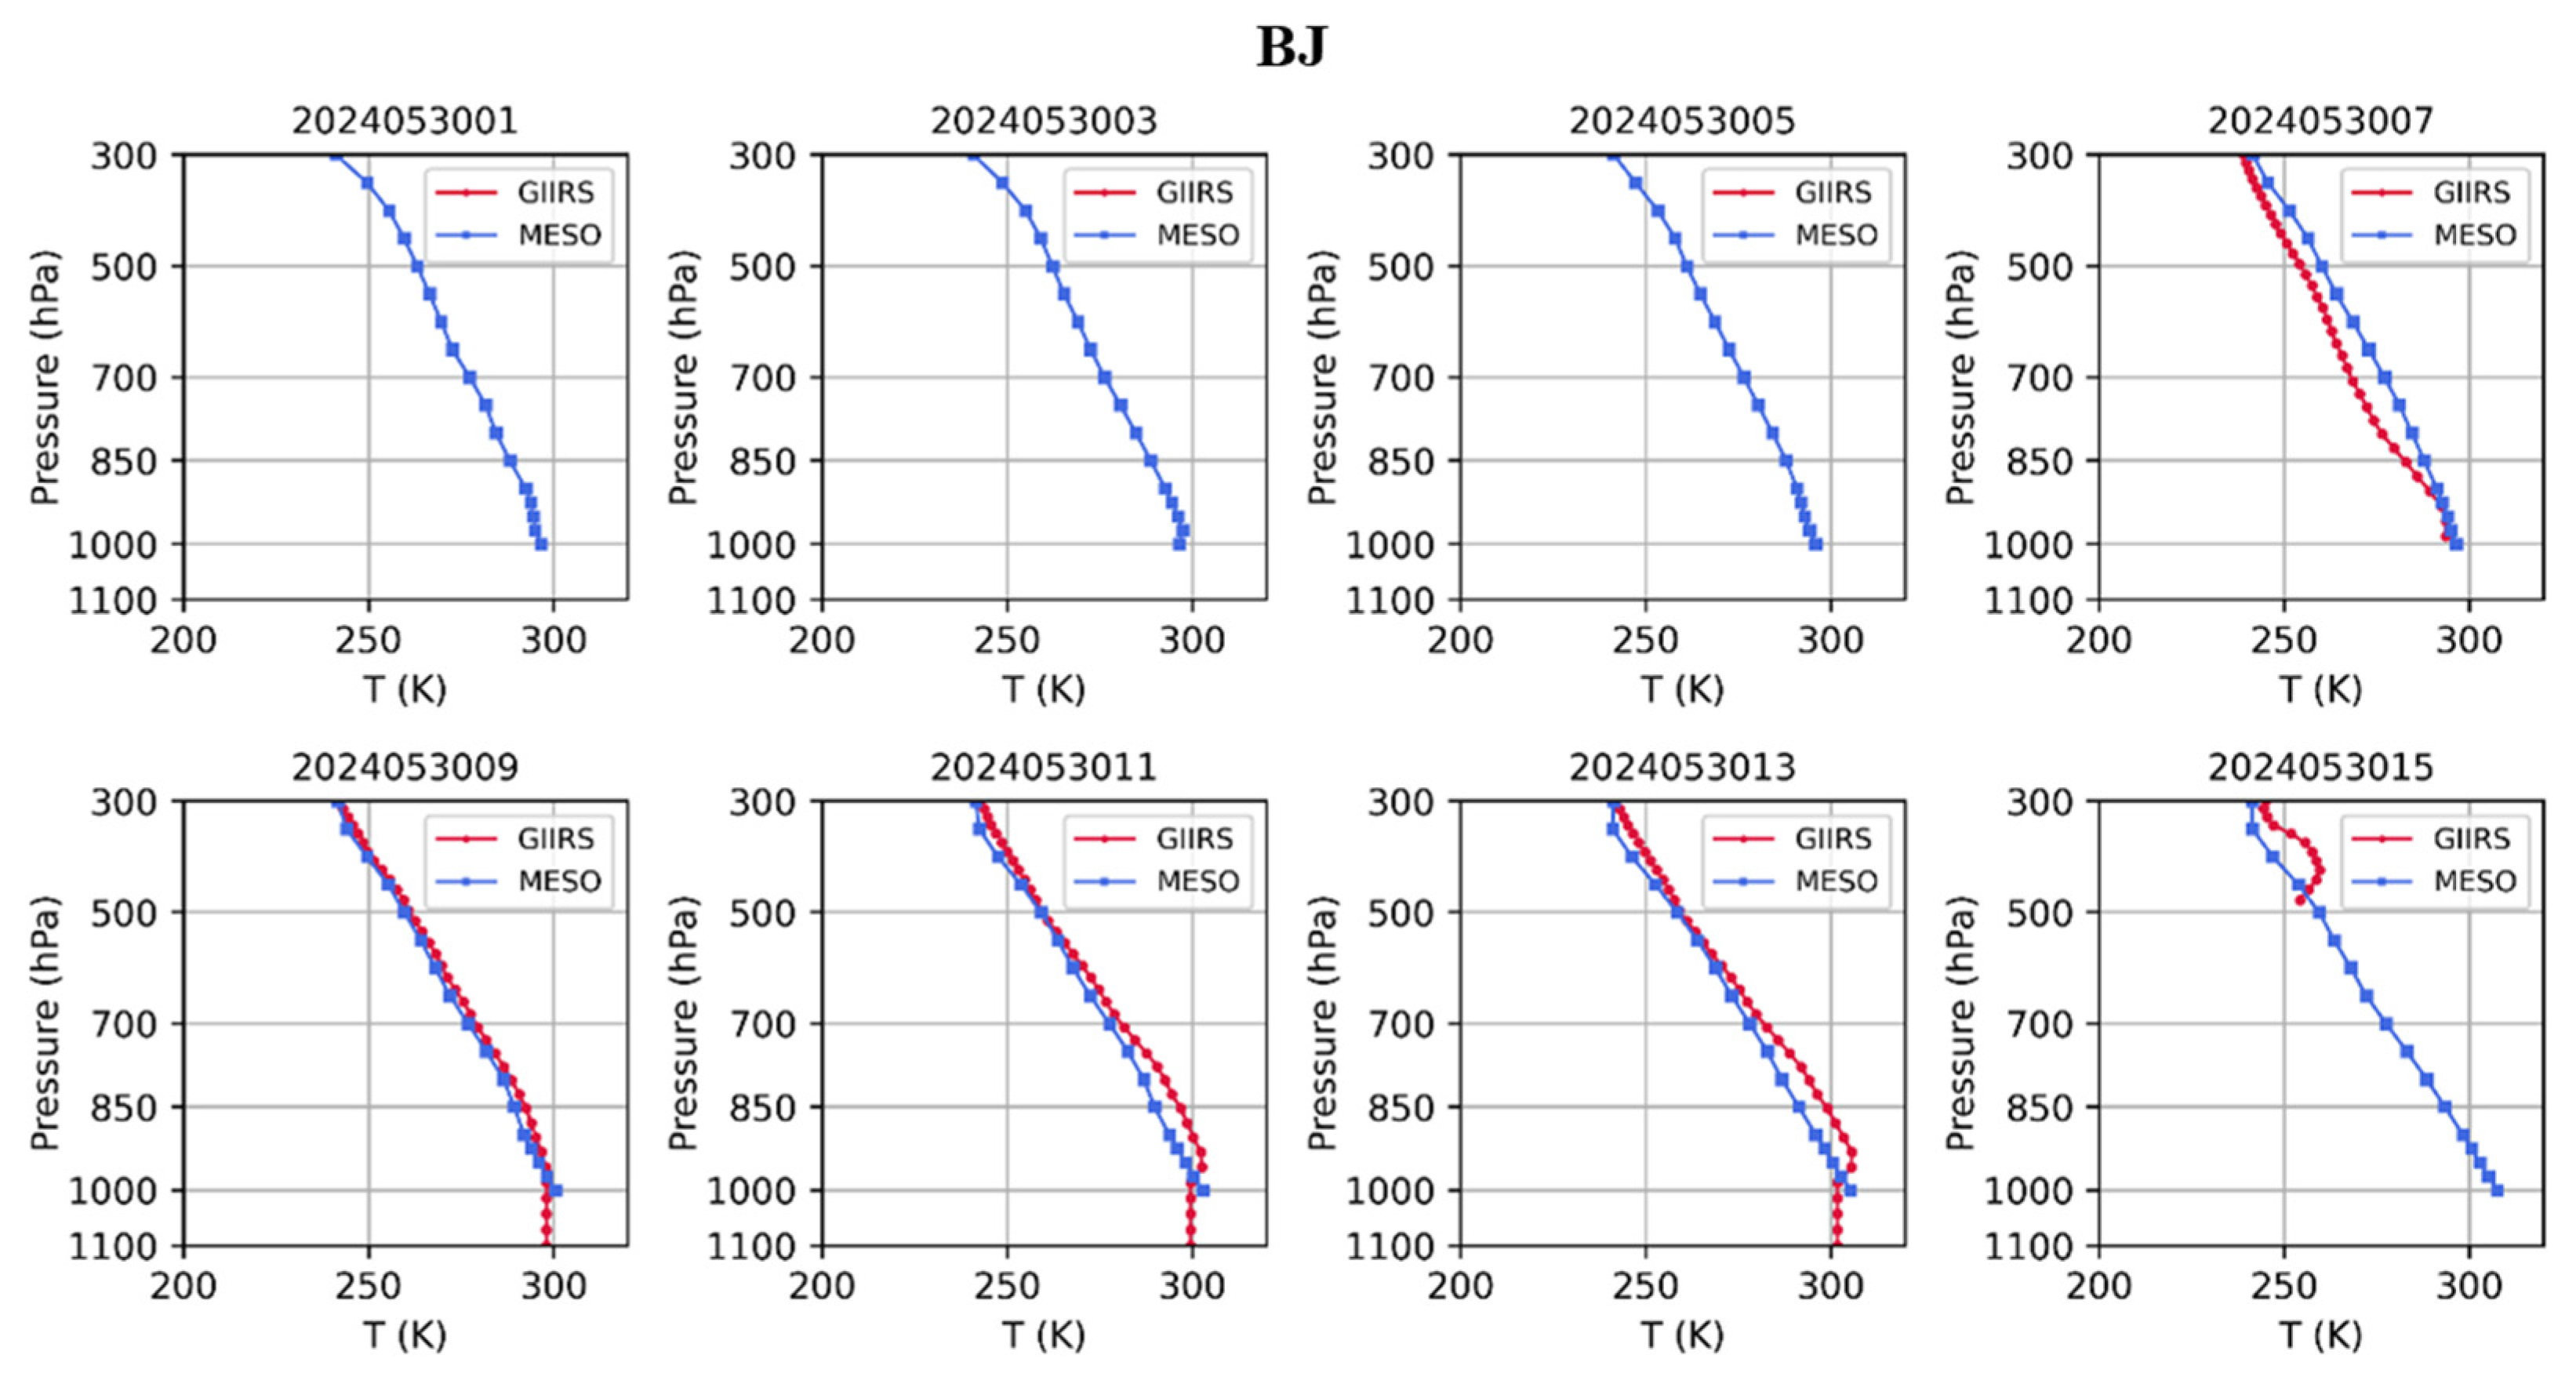
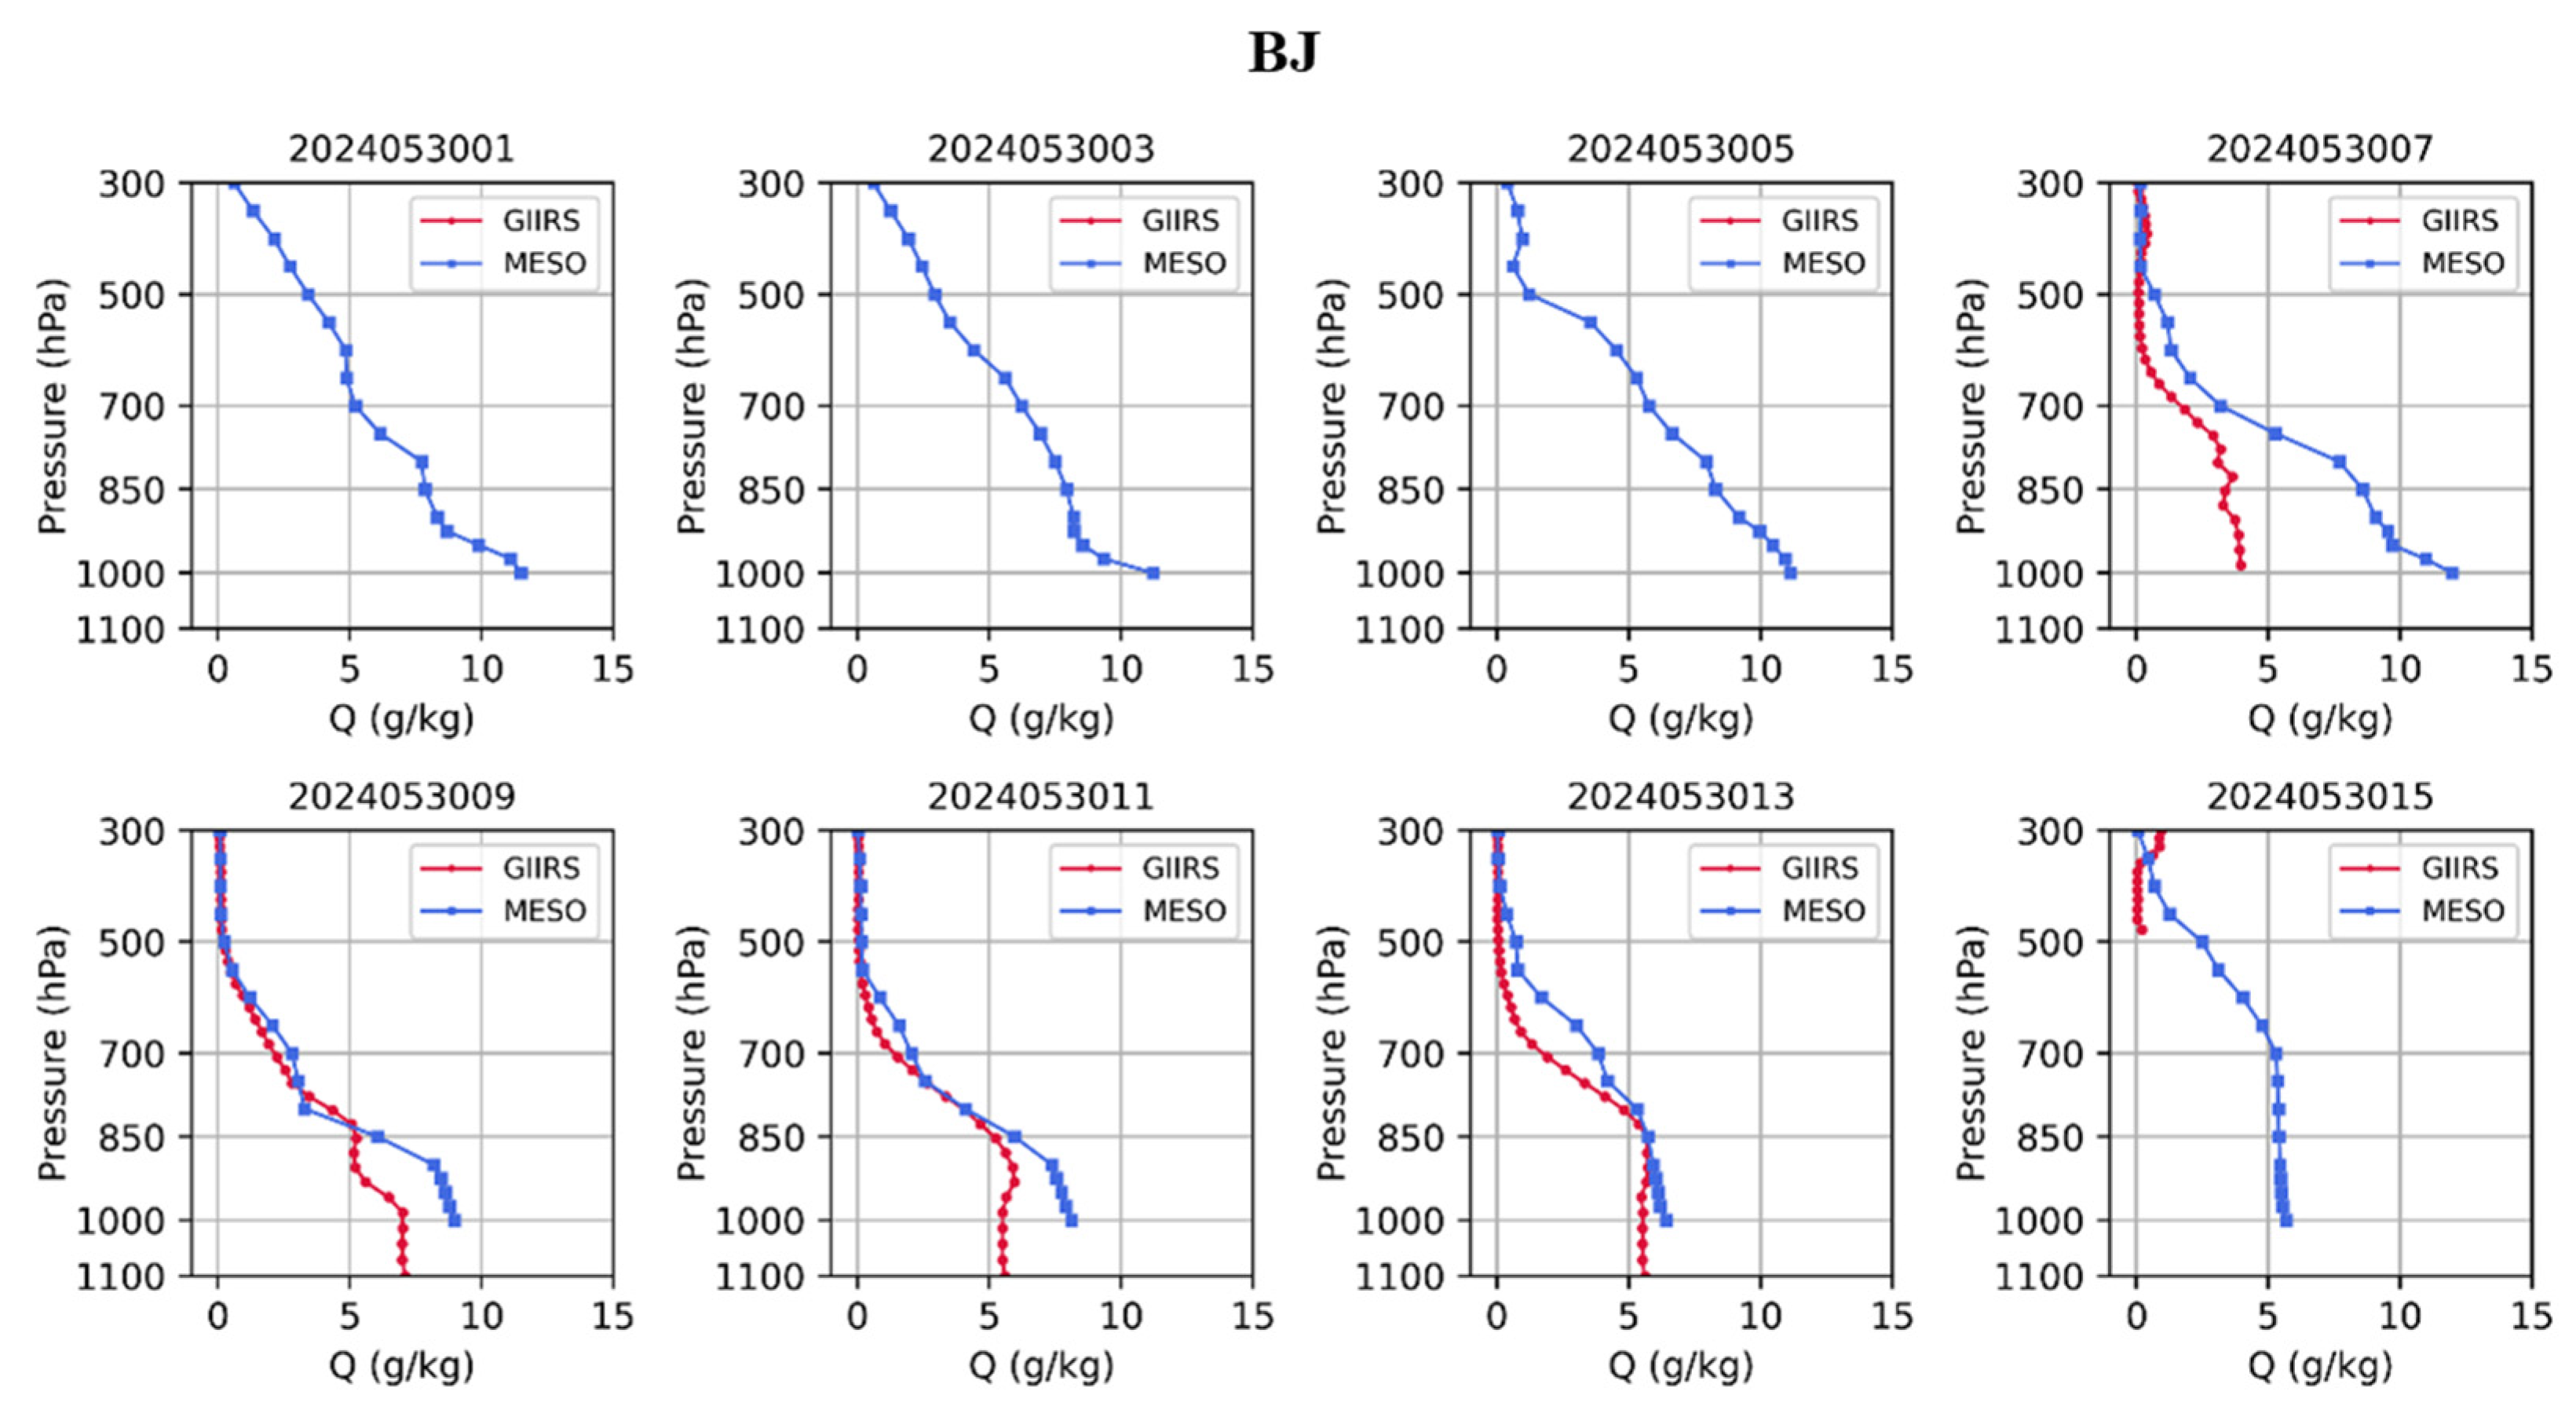
3.4.3. Specific Diagnostic Analysis of Temperature and Humidity Profiles

Figure 13 illustrates the T-logP diagram above Beijing station at 0800 BJT. The CMA-MESO simulations indicate the presence of some convective available potential energy (CAPE; red-filled area) in the temperature and humidity profiles. However, the convective inhibition (CIN; blue-filled area) of 77.62 J kg−1 needs to be overcome to trigger unstable energy and thereby allow free ascent [40]. Compared with the observations, the CMA-MESO simulations yield smaller values for both CAPE and downdraft CAPE (Table 3), suggesting an underestimation of the convective energy and an overestimation of the convective inhibition. As a result, the conditions for unstable ascent are more difficult to reach in the CMA-MESO simulations compared with the observations, which leads to a weakened convective development.
After the heating by shortwave radiation, the temperature (Figure 14) and water vapor (Figure 15) at 1000 hPa have increased, which then affect the upper atmosphere. As is illustrated by Figure 14, the temperature profiles reveal that between 0900 BJT and 1300 BJT, the CMA-MESO simulates slightly lower temperature values in the 500–1000 hPa layer than the GIIRS observations. The simulated temperature difference is lower between the middle and lower layers (T850−T700), and the smaller temperature gradient between the cold upper layer and the warm lower layer results in a weaker convective development [41]. As can be seen in the humidity profiles shown in Figure 15, between 0700 BJT and 1300 BJT, the GIIRS observations exhibit lower specific humidity values near 700 hPa, indicating drier air. Existing research has demonstrated that dry air intrusion near 700 hPa can enhance the evaporation rate during strong downward convection, leading to stronger convective intensity [19]. Therefore, the simulation of humidity requires further improvement and optimization, and the forecasting of dry air intrusion near 700 hPa should be emphasized.

4. Conclusions and Discussion

Gale processes, such as the one that occurred in Beijing on 30 May 2024, are characterized by their sudden onset and destructive power, often causing significant losses of property. However, the rapid development and high variability of convective systems bring more challenges for regional models to predict the intensity and impact of such events accurately. In this study, satellite observation products are utilized to assess the NWP results. Focusing on the gale in Beijing on 30 May 2024, this study conducts a diagnostic analysis of the 3 km CMA-MESO forecast results using the FY-4B L2 products. The diagnostic analysis method integrates shortwave radiation data with cloud-related variables and thermal field information to provide a detailed evaluation of the forecast performance of the CMA-MESO. The results of this study offer insights into the applications of FY-4B data products in model diagnostics and initially discover areas for improvement of the CMA-MESO model in forecasting the gale.
Firstly, for the case of the gale process on 30 May 2024, this study performed a diagnostic analysis of the CMA-MESO simulations from multiple perspectives. Grounded in the triggering mechanisms of convection and the development of the gale, it highlights the substantial impacts of the heating effect of solar shortwave radiation during this process. Moreover, this study explored the physical mechanisms of air parcel heating, convection initiation, cloud droplet formation, cloud development, and droplet descent from a microscopic perspective, revealing the physical process from local convection to gale formation. The diagnostic analysis of this case reveals that before the cloud formation, the CMA-MESO can accurately simulate solar shortwave radiation. However, during the initial heating phase, the model overestimates the intensity of solar radiation, leading to stronger heating and a larger surface temperature increase. The simulated cloud formation time was delayed compared with observations, accompanied by smaller, shorter-lasting cloud coverage and a lower cloud top height. Moreover, from the perspective of thermal analysis, the smaller temperature difference between the middle and lower layers, as well as the more humid middle layer simulated by the CMA-MESO, jointly contribute to forecasts with lower instability and weaker convective development.
According to the diagnostic analysis results of the gale in Beijing on 30 May 2024, in order to simulate this study case better, the future direction of the use and optimization of CMA-MESO is summarized. In the future, for this study case, it is necessary to optimize the radiation and cloud microphysics schemes to enhance the simulation accuracy of radiation, cloud variables, and wind fields. However, higher-resolution regional models can also be utilized to simulate this study case and other gales with conditions similar to this, allowing for more detailed and systematic diagnostic analyses of physical processes and simulation effects. Conducting such diagnostic analyses combined with additional satellite observation data will further expand the application of diagnostic analysis methods, identify systematic biases, refine physical schemes, and ultimately improve the accuracy of regional model simulation of local gales.

Author Contributions

Conceptualization, X.X., Z.N. and Q.L.; methodology and experiment design, X.X., Z.N., Q.L. and F.W. formal analysis, X.X., Z.N., Q.L., R.L., C.W. and J.H.; writing—original draft preparation, X.X.; writing—review and editing, X.X., Z.N., Q.L., R.L., C.W., F.W. and J.H. All authors have read and agreed to the published version of the manuscript.

Funding

This research was funded by the National Key Research and Development Program of China (Grant No. 2022YFC3004100, 2022YFC3004102) and the Natural Science Foundation of China (Grant No. U2242212).

Data Availability Statement

The original contributions presented in this study are included in the article. Further inquiries can be directed to the corresponding author.

Acknowledgments

We appreciate the National Satellite Meteorological Center of the China Meteorological Administration for their data support for the FY-4B L2 products. We are also very grateful to the reviewers for their careful review and very valuable comments, which have led to substantial improvements to this manuscript.

Conflicts of Interest

The authors declare no conflicts of interest.

References

  1. Kelly, D.L.; Schaefer, J.T.; Doswell, C.A. Climatology of nontornadic severe thunderstorm events in the United States. Mon. Weather Rev. 1985, 113, 1997–2014. [Google Scholar] [CrossRef]
  2. Fujita, T. Precipitation and cold air production in mesoscale thunderstorm systems. J. Atmos. Sci. 1959, 16, 454–466. [Google Scholar] [CrossRef]
  3. Doswell, C.A., III. The distinction between large-scale and mesoscale contribution to severe convection: A case study example. Weather Forecast. 1987, 2, 3–16. [Google Scholar] [CrossRef]
  4. Tao, S.Y. Rainstorms in China; Science Press: Beijing, China, 1980. [Google Scholar]
  5. Ding, Y.H. Advanced Synoptic Meteorology, 2nd ed.; China Meteorological Press: Beijing, China, 2005. [Google Scholar]
  6. Fang, C.; Wang, X.G.; Sheng, J.; Cao, Y.C. Temporal and Spatial Distribution of North China Thunder-gust Winds and the Statistical Analysis of Physical Characteristics. Plateau Meteorol. 2017, 36, 1368–1385. [Google Scholar]
  7. Doswell, C.A., III. Severe convective storms—An overview. Sev. Convect. Storms 2001, 28, 1–26. [Google Scholar] [CrossRef]
  8. Doswell, C.A., III. Historical overview of severe convective storms research. E-J. Sev. Storms Meteorol. 2007, 2, 1–25. [Google Scholar] [CrossRef]
  9. Anthes, R.A. Numerical prediction of severe storms—Certainty, possibility, or dream? Bull. Am. Meteorol. Soc. 1976, 57, 423–430. [Google Scholar]
  10. Wan, Z.W.; Sun, S.Y.; Zhao, B.; Chen, Q.Y. Evaluation and Error Analysis of the July 2021 Extremely Severe Rainstorm in Henan Province Simulated by CMA-MESO Mode. Meteorol. Mon. 2024, 50, 33–47. [Google Scholar] [CrossRef]
  11. Yang, J.; Quan, W.; Zhang, L.; Hu, J.; Chen, Q.; Wild, M. Evaluation of radiation schemes in the CMA-MESO model using high time-resolution radiation measurements in China: I. Long-wave radiation. Geosci. Model Dev. Discuss. 2024, 2024, 1–29. [Google Scholar] [CrossRef]
  12. Zhang, R.; Fu, W.; Wang, L.; Xu, Y. Influence of Different Radiation Schemes on Strong Convective Weather Processes. In Proceedings of the 2007 Annual Meeting of the Chinese Meteorological Society, Guangzhou, China, 23–25 November 2007. [Google Scholar]
  13. Zhang, L.X.; Li, Z.C. Numerical Analysis of Solar Shortwave Radiation Affecting Severe Convection in Cold Vortex over Northeastern China. Meteorol. Mon. 2008, 34, 3–10. [Google Scholar]
  14. Zheng, L.L.; Zhang, X.G.; Qiu, X.X.; Zheng, L.L.; Zhang, S.L.; Qiu, X.X.; Tao, W.; Wang, Y.; Shao, L.Y.; Xie, F.; et al. Impacts of the Dabie Mountains on a Mesoscale Convective System that Occurred in the Background of the Northeast Cold Vortex. Chin. J. Atmos. Sci. 2023, 47, 2001–2019. [Google Scholar] [CrossRef]
  15. Wild, M. Global dimming and brightening: A review. J. Geophys. Res. Atmos. 2009, 114, D00D16. [Google Scholar] [CrossRef]
  16. Tang, W.; Yang, K.; He, J.; Qin, J. Quality control and estimation of global solar radiation in China. Sol. Energy 2010, 84, 466–475. [Google Scholar] [CrossRef]
  17. Tang, W.; Yang, K.; Qin, J.; Min, M. Development of a 50-year daily surface solar radiation dataset over China. Sci. China Earth Sci. 2013, 56, 1555–1565. [Google Scholar] [CrossRef]
  18. Letu, H.; Yang, K.; Nakajima, T.Y.; Ishimoto, H.; Nagao, T.M.; Riedi, J.; Baran, A.J.; Ma, R.; Wang, T.; Shang, H. High-resolution retrieval of cloud microphysical properties and surface solar radiation using Himawari-8/AHI next-generation geostationary satellite. Remote Sens. Environ. 2020, 239, 111583. [Google Scholar] [CrossRef]
  19. Tang, W.; Li, J.; Yang, K.; Qin, J.; Zhang, G.; Wang, Y. Dependence of remote sensing accuracy of global horizontal irradiance at different scales on satellite sampling frequency. Sol. Energy 2019, 193, 597–603. [Google Scholar] [CrossRef]
  20. Zheng, L.L.; Qian, L. Simulation Study of a Squall Line Case Based on Assimilation Radar Reflectivity Data. Meteorol. Mon. 2019, 45, 73–87. [Google Scholar] [CrossRef]
  21. Chen, F.; Dong, M.Y.; Su, T.; Ji, C.X. Influence of Radar Data Assimilation on the Numerical Simulation of a Rare Squall Line in Zhejiang Province in Early Spring. Meteorol. Mon. 2020, 46, 462–477. [Google Scholar]
  22. Lai, A.W.; Ma, H.Z.; Cui, C.G.; Kang, Z.P.; Wang, Z.B.; Du, M.Y.; Xiao, Y.J.; Wang, J. A Squall Line Case Study of Assimilating the Radar Data, Retrieval of Water Vapor and In-Cloud Potential Temperature from Reflectivity in a 3DVAR Framework. Meteorol. Mon. 2021, 47, 932–952. [Google Scholar] [CrossRef]
  23. Lv, M.; Hou, Z.; Zhou, Y. Dynamic Meteorology; Meteorological Press: Beijing, China, 2004. [Google Scholar]
  24. Heitor, A.; Biga, A.; Rosa, R. Thermal radiation components of the energy balance at the ground. Agric. For. Meteorol. 1991, 54, 29–48. [Google Scholar] [CrossRef]
  25. Budyko, M.I. The heat balance of the earth’s surface. Sov. Geogr. 1961, 2, 3–13. [Google Scholar] [CrossRef]
  26. Nullet, D.; Sanderson, M. Radiation and energy balances and air temperature. Prevail. Trade Wind. Weather Clim. Hawaii. Univ. Hawaii Press Honol. 1993, 37–55. [Google Scholar] [CrossRef]
  27. Stephens, G.; Campbell, G.; Haar, T.V. Earth radiation budgets. J. Geophys. Res. Ocean. 1981, 86, 9739–9760. [Google Scholar] [CrossRef]
  28. Cotton, W.R.; Anthes, R.A. Storm and Cloud Dynamics; Academic Press: New York, NY, USA, 1992. [Google Scholar]
  29. Dudhia, J. Numerical study of convection observed during the winter monsoon experiment using a mesoscale two-dimensional model. J. Atmos. Sci. 1989, 46, 3077–3107. [Google Scholar] [CrossRef]
  30. Wang, S.; Lu, F.; Feng, Y. An investigation of the Fengyun-4A/B GIIRS performance on temperature and humidity retrievals. Atmosphere 2022, 13, 1830. [Google Scholar] [CrossRef]
  31. NSMC. FY-4B L2 Products. Available online: https://data.nsmc.org.cn/DataPortal/cn/data/overview.html (accessed on 20 October 2024).
  32. Dehui, C.; Xueshun, S. Recent progress on GRAPES research and application. J. Appl. Meteorol. Sci. 2006, 17, 773–777. [Google Scholar]
  33. Chen, D.; Xue, J.; Yang, X.; Zhang, H.; Shen, X.; Hu, J.; Wang, Y.; Ji, L.; Chen, J. New generation of multi-scale NWP system (GRAPES): General scientific design. Chin. Sci. Bull. 2008, 53, 3433–3445. [Google Scholar] [CrossRef]
  34. Wang, Y.L.L. GRAPES_MESO Operational System Technical Report. In Proceedings of the 2007 Annual Meeting of the Chinese Meteorological Society, Weather Forecasting, Warning, and Impact Assessment Technical Session, Guangzhou, China, 23–25 November 2007. [Google Scholar]
  35. Huang, L.P.; Deng, L.T.; Xu, Z.F.; Yu, F.; Jiang, Y.; Zhou, F.F. Main Technical Improvements of GRAPES_Meso V4.0 and Verification. J. Appl. Meteorol. Sci. 2017, 28, 25–37. [Google Scholar] [CrossRef]
  36. Hong, S.-Y.; Lim, J.-O.J. The WRF single-moment 6-class microphysics scheme (WSM6). Asia-Pac. J. Atmos. Sci. 2006, 42, 129–151. [Google Scholar]
  37. Mlawer, E.J.; Taubman, S.J.; Brown, P.D.; Iacono, M.J.; Clough, S.A. Radiative transfer for inhomogeneous atmospheres: RRTM, a validated correlated-k model for the longwave. J. Geophys. Res. Atmos. 1997, 102, 16663–16682. [Google Scholar] [CrossRef]
  38. Beljaars, A.; Holtslag, A. Flux parameterization over land surfaces for atmospheric models. J. Appl. Meteorol. Climatol. 1991, 30, 327–341. [Google Scholar] [CrossRef]
  39. Ek, M.; Mitchell, K.; Lin, Y.; Rogers, E.; Grunmann, P.; Koren, V.; Gayno, G.; Tarpley, J. Implementation of Noah land surface model advances in the National Centers for Environmental Prediction operational mesoscale Eta model. J. Geophys. Res. Atmos. 2003, 108, 8851. [Google Scholar] [CrossRef]
  40. Li, Y.D.; Liu, J.W.; Gao, S.T. On the Progress of Application for Dynamic and Energetic Convective Parameters Associated with Severe Convective Weather Forecasting. Acta Meteorol. Sin. 2004, 62, 401–409. [Google Scholar] [CrossRef]
  41. Sun, J.S.; Tao, Z.Y. Some Essential Issues Connected with Severe Connected with Severe Convective Weather Analysis and Forecast. Meteorol. Mon. 2012, 38, 164–173. [Google Scholar]
Figure 1. Locations of the 14 meteorological stations. (GTR: Guanting Reservoir; QLM: Qianling Mountain; FS SH: Fangshan Nanhe; YQ: Yanqing; HR: Huairou; CP: Changping; MTG: Mentougou; SDZ: Shangdianzi; HD: Haidian; SJS: Shijingshan; CY: Chaoyang; PG: Pinggu; TAM: Dongcheng Tian’anmen; BJ: Beijing).
Remotesensing 17 01378 g001
Figure 2. Circulation fields of geopotential height (contour lines), temperature (shaded in K), and wind (vector arrows) from the CMA-MESO simulations at (a,b) 500 hPa and (c,d) 850 hPa at (a,c) 0800 BJT and (b,d) 1400 BJT, respectively.
Remotesensing 17 01378 g002
Figure 3. CMA-MESO simulations of 10 m wind and surface temperature fields at (a) 1300 BJT and (b) 1400 BJT.
Remotesensing 17 01378 g003
Figure 4. Detection coverage of GIIRS and AGRI onboard FY-4B.
Remotesensing 17 01378 g004
Figure 5. Application of physical processes and datasets in the diagnostic analysis.
Remotesensing 17 01378 g005
Figure 6. AGRI observations of the May 30 severe convective gale at stations of (a1a5) Yanqing, (b1b5) Huairou, (c1c5) Changping, and (d1d5) Mentougou. Variables are represented as follows: 1 for shortwave radiation, 2 for longwave radiation, 3 for cloud cover, 4 for cloud top height, and 5 for cloud phase.
Remotesensing 17 01378 g006
Figure 7. Spatial distributions of solar net shortwave radiation from the (a1a12) CMA-MESO simulations and (b1b12) FY-4B L2 products.
Remotesensing 17 01378 g007aRemotesensing 17 01378 g007b
Figure 8. Spatial distributions of land surface temperature from the (a1a12) CMA-MESO simulations and (b1b12) FY-4B L2 products.
Remotesensing 17 01378 g008aRemotesensing 17 01378 g008b
Figure 9. Spatial distributions of cloud coverage from the (a1a12) CMA-MESO simulations and (b1b12) FY-4B L2 products.
Remotesensing 17 01378 g009aRemotesensing 17 01378 g009b
Figure 10. The temperature difference between 850 hpa and 500 hpa at (a) 0900 BJT, (b) 1100 BJT, (c) 1300 BJT, and (d) 1500 BJT. The red circles are FY-4B L2 products and the shadings are CMA-MESO simulations.
Remotesensing 17 01378 g010
Figure 11. Comparisons of the (a) surface net shortwave radiation, (b) land surface temperature, and (c) cloud top height between FY-4B observations and CMA-MESO simulations at the 14 typical stations.
Remotesensing 17 01378 g011
Figure 12. Time series of (a1c1) surface net shortwave radiation, (a2c2) land surface temperature, (a3c3) total cloud cover, and (a4c4) cloud top height at (a) Changping, (b) Mentougou, and (c) Shangdianzi stations.
Remotesensing 17 01378 g012
Figure 13. Temperature and humidity profiles simulated by the CMA-MESO over the Beijing station, along with associated instability indexes.
Remotesensing 17 01378 g013
Figure 14. Temperature profiles from GIIRS L2 products and CMA-MESO simulations over Beijing station.
Remotesensing 17 01378 g014
Figure 15. Humidity profiles from GIIRS L2 products and CMA-MESO simulations over Beijing station.
Remotesensing 17 01378 g015
Table 1. FY-4B observation products and associated variables used in this study.
Satellite Instrument/Product CategoryVariableVariableVariableVariable
AGRI/Surface Shortwave RadiationSurface Solar Irradiance (SSI)Surface Direct Solar Irradiance (DRS)Surface Diffuse Solar Irradiance (DFS)Surface Net Shortwave Radiation (NSR)
AGRI/Longwave RadiationUpward Longwave Radiation (ULR)Downward Longwave Radiation (DLR)Outgoing Longwave Radiation (OLR)
AGRI/CloudCloud Coverage (CFR)Cloud Top Height (CTH)Cloud Phase (CLP)
AGRI/Land Surface TemperatureLand Surface Temperature (LST)
GIIRS/Atmospheric Vertical ProfilingAtmospheric Temperature Profile (AT_Prof)Atmospheric Humidity Profile (AQ_Prof)
Table 2. The 3 km CMA-MESO operational model parameters.
Forecast Area10.0°N–60.01°N;70.0°E–145.0°E
Resolution0.03° (approximately 3 km)/50 layers
Observational DataConventional observations: sounding reports, ship reports, buoy reports, aircraft reports, surface reports (ps, u, v, RH, rain)
Radar data: Doppler radar (reflectivity, radial wind, velocity-azimuth display wind) and wind profiler radar (u, v) data
Satellite data: satellite cloud drift winds (FY-2G, HIMAWARI-8), Global Navigation Satellite System radio occultation, FY-4A imaging radiometer humidity meter(FY4-AGRI), FY2GTBB, FY2GCTA,
Global Positioning System precipitable water
Physical SchemeShallow convection parameterization scheme
WSM6 cloud microphysics scheme
RRTM longwave radiation scheme
Dudhia shortwave radiation scheme
Monin–Obukhov near-surface-layer scheme
Noah land surface model scheme
New Medium-Range-Forecast boundary layer scheme
Table 3. Comparison of instability energy at Beijing Station between observation and simulation.
Variable (Unit)ObservationSimulation
Convective available potential energy (J Kg−1)886.40430.13
Downdraft convective available potential energy (J Kg−1)1161.001048.72
Convective inhibition (J Kg−1)077.62
Disclaimer/Publisher’s Note: The statements, opinions and data contained in all publications are solely those of the individual author(s) and contributor(s) and not of MDPI and/or the editor(s). MDPI and/or the editor(s) disclaim responsibility for any injury to people or property resulting from any ideas, methods, instructions or products referred to in the content.

