
Spatiotemporal Analysis of Drought Variation from 2001 to 2023 in the China–Mongolia–Russia Transboundary Heilongjiang River Basin Based on ITVDI

 ,
,
Abstract
1. Introduction
2. Data and Methods
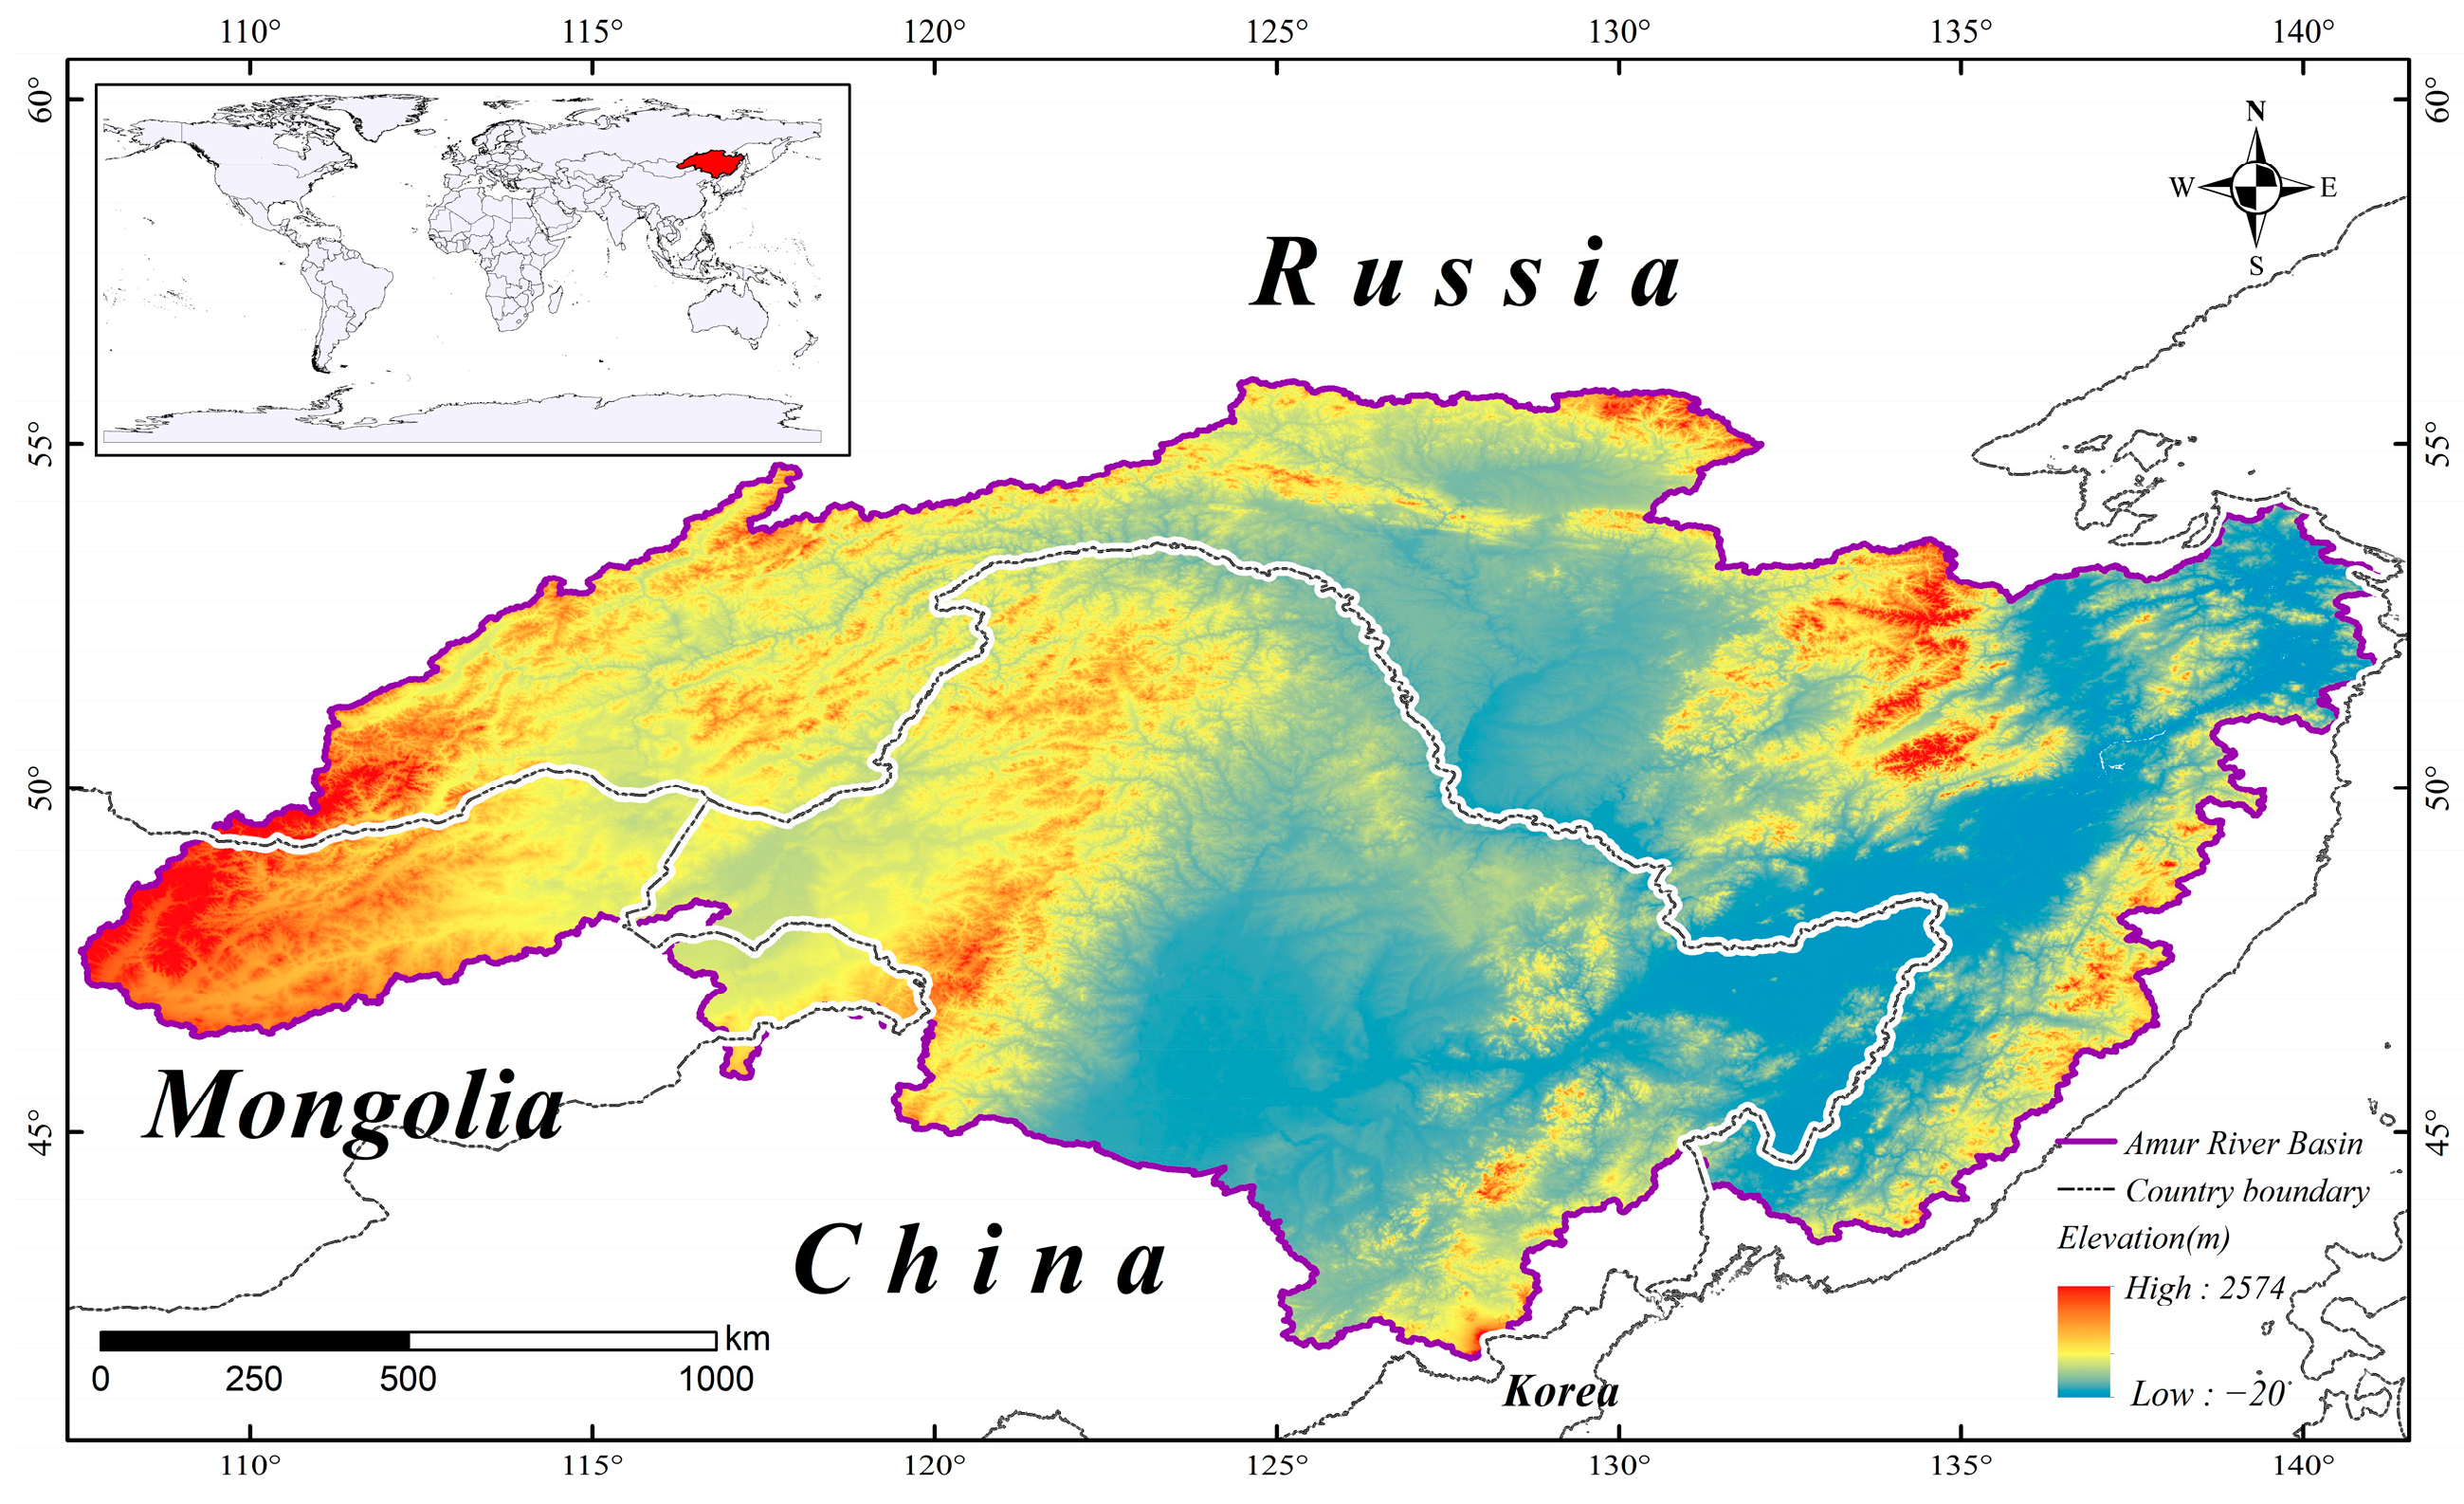
2.1. Study Area
2.2. Data Sources
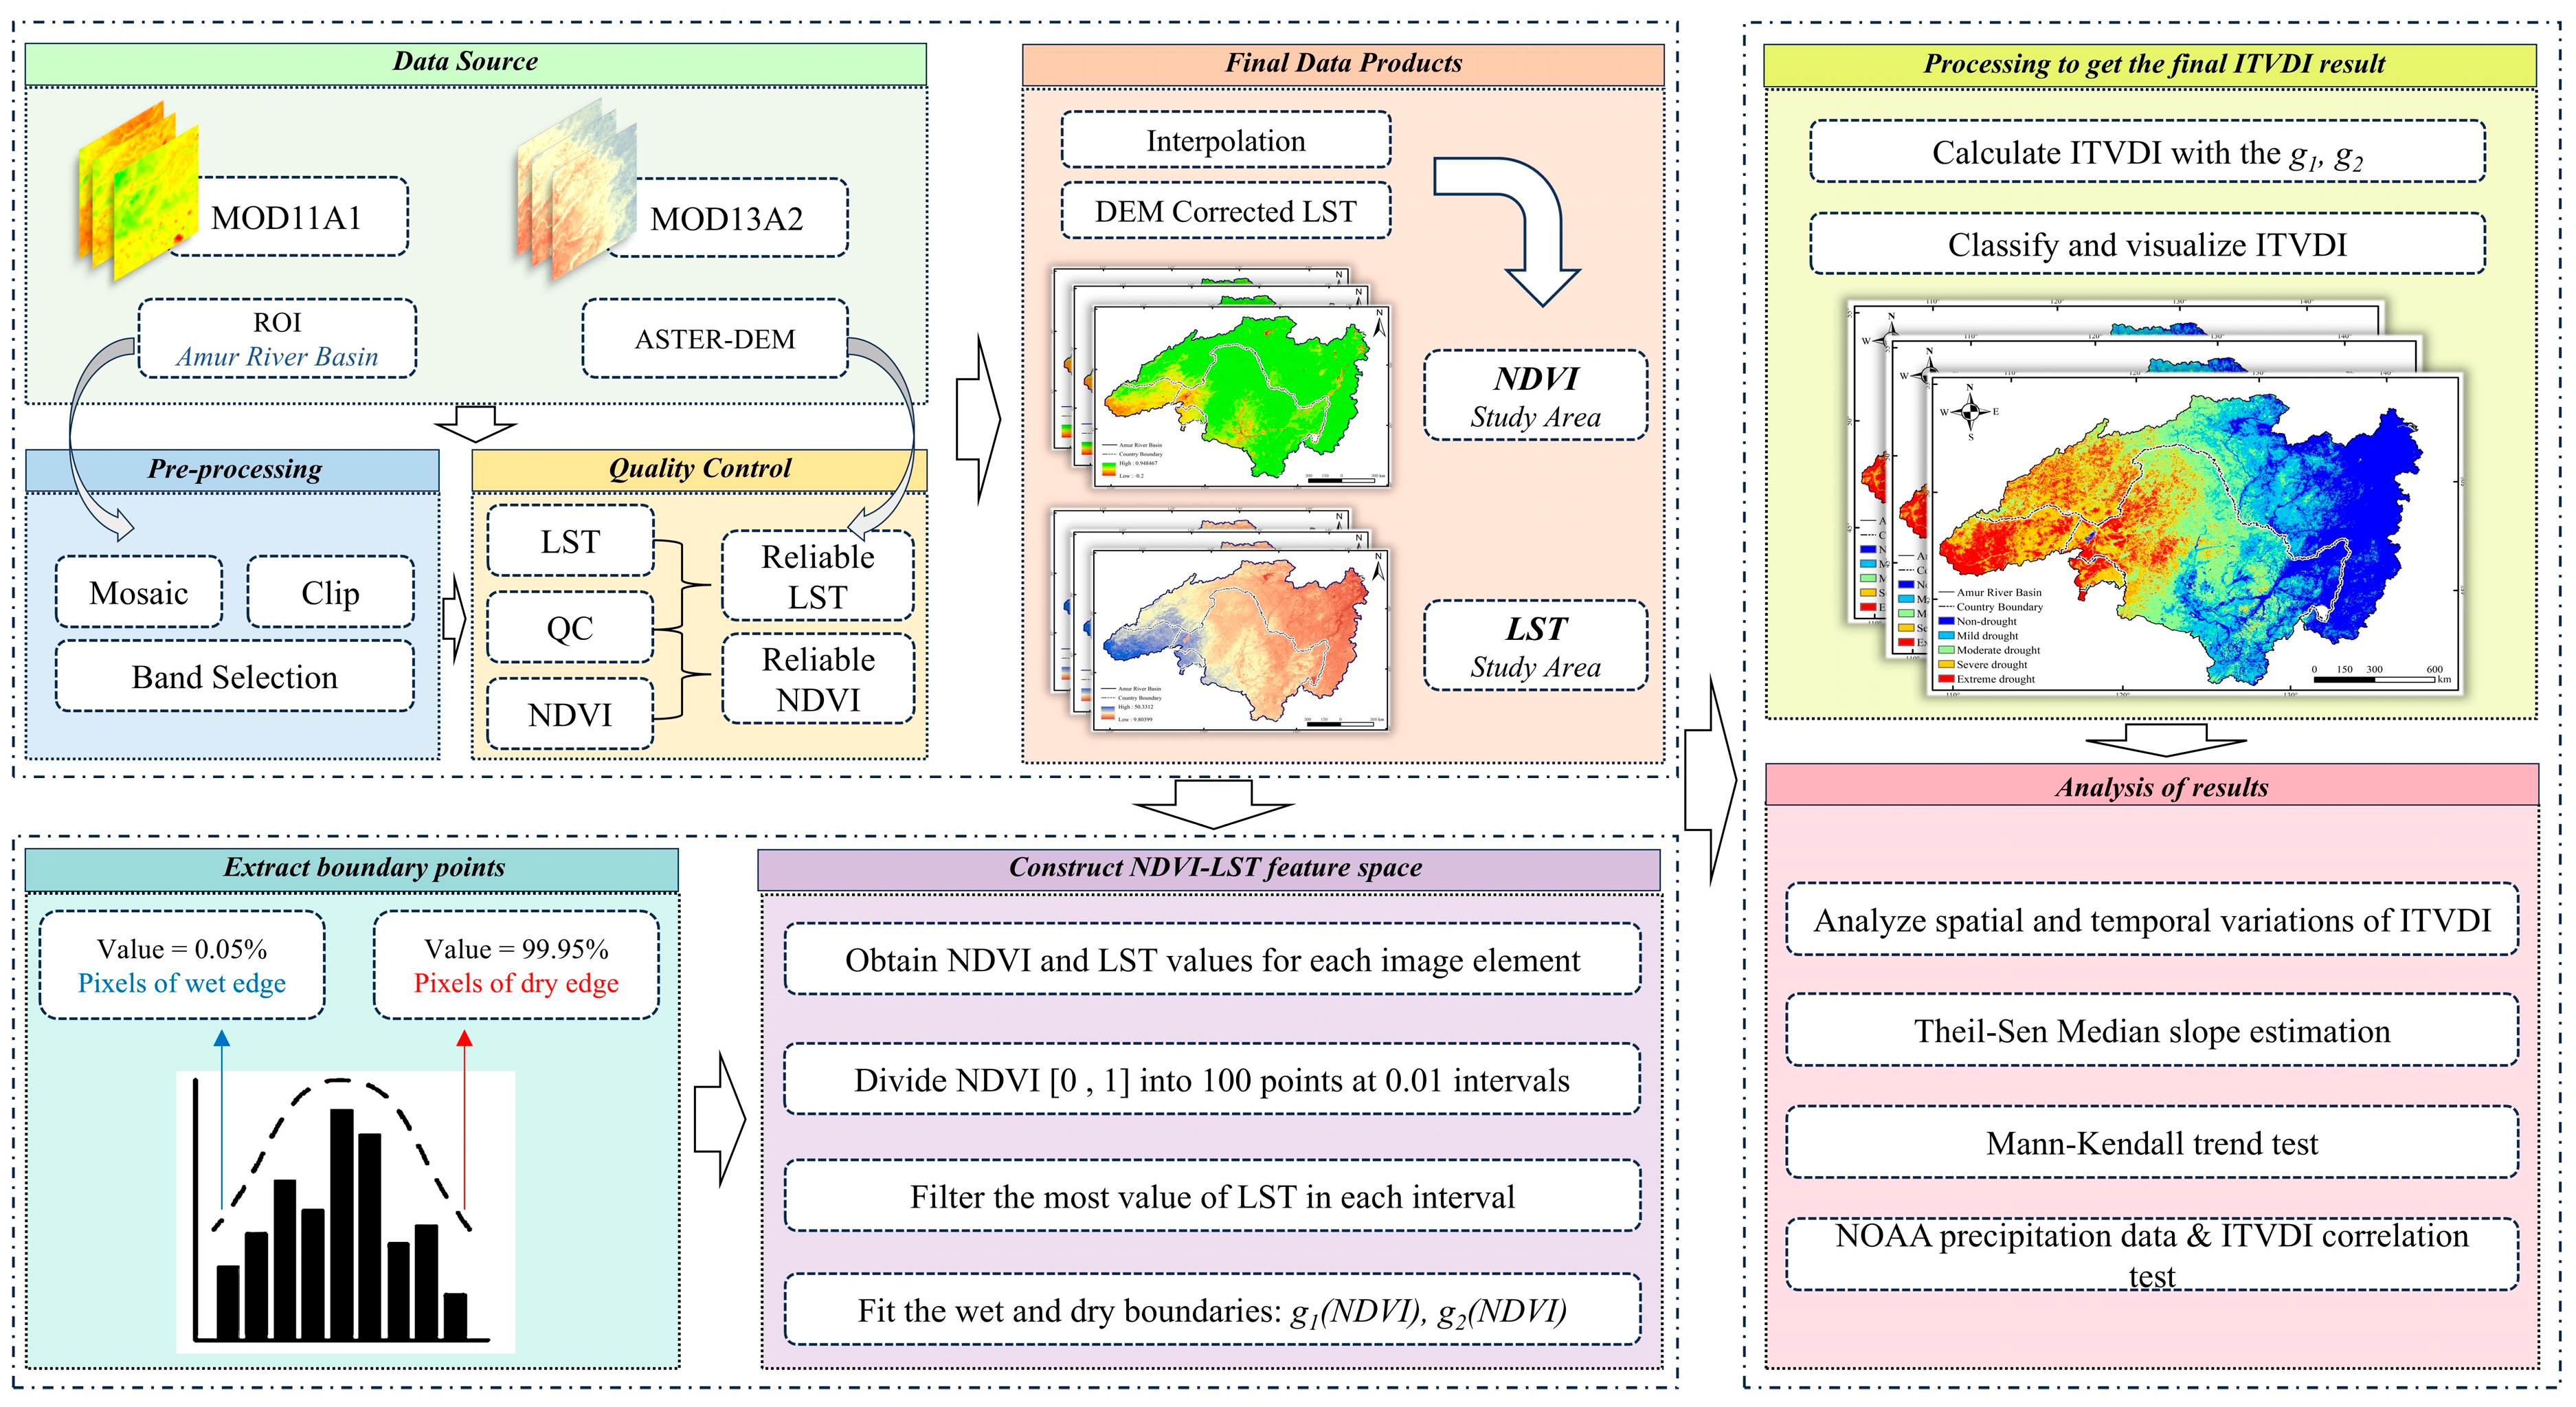
2.3. Methods
2.3.1. DEM-Based Correction of Surface Temperatures
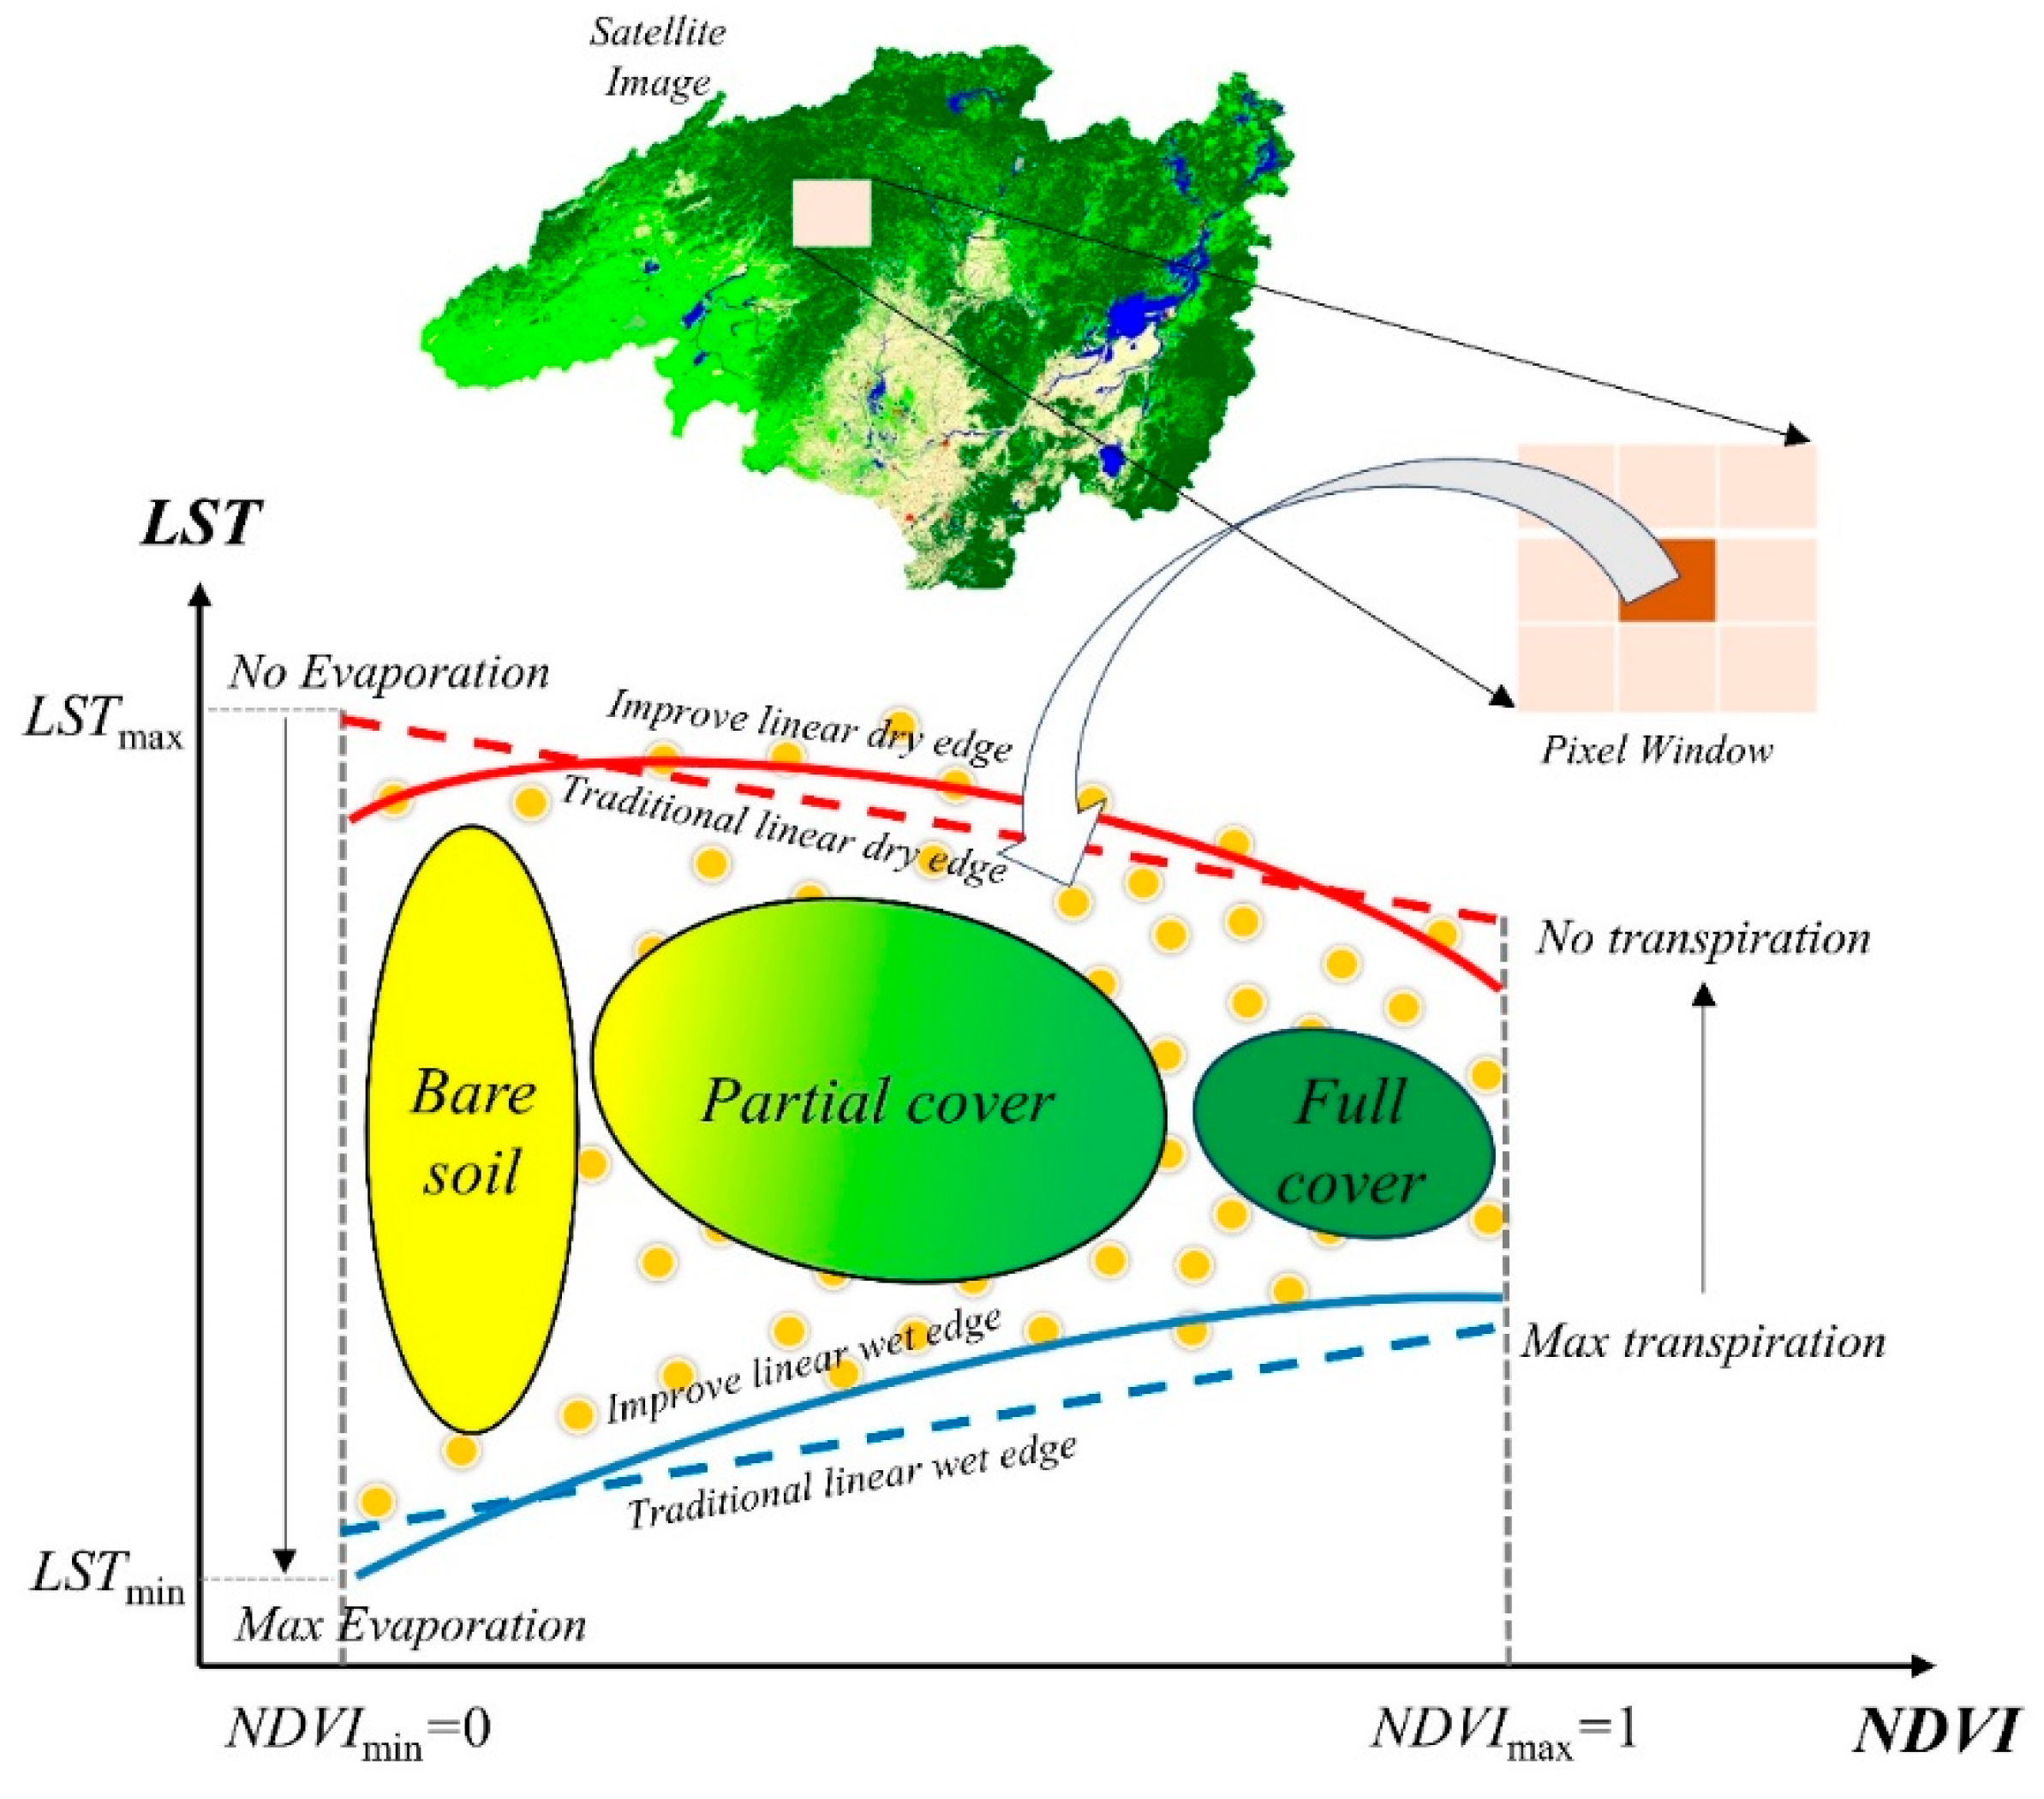
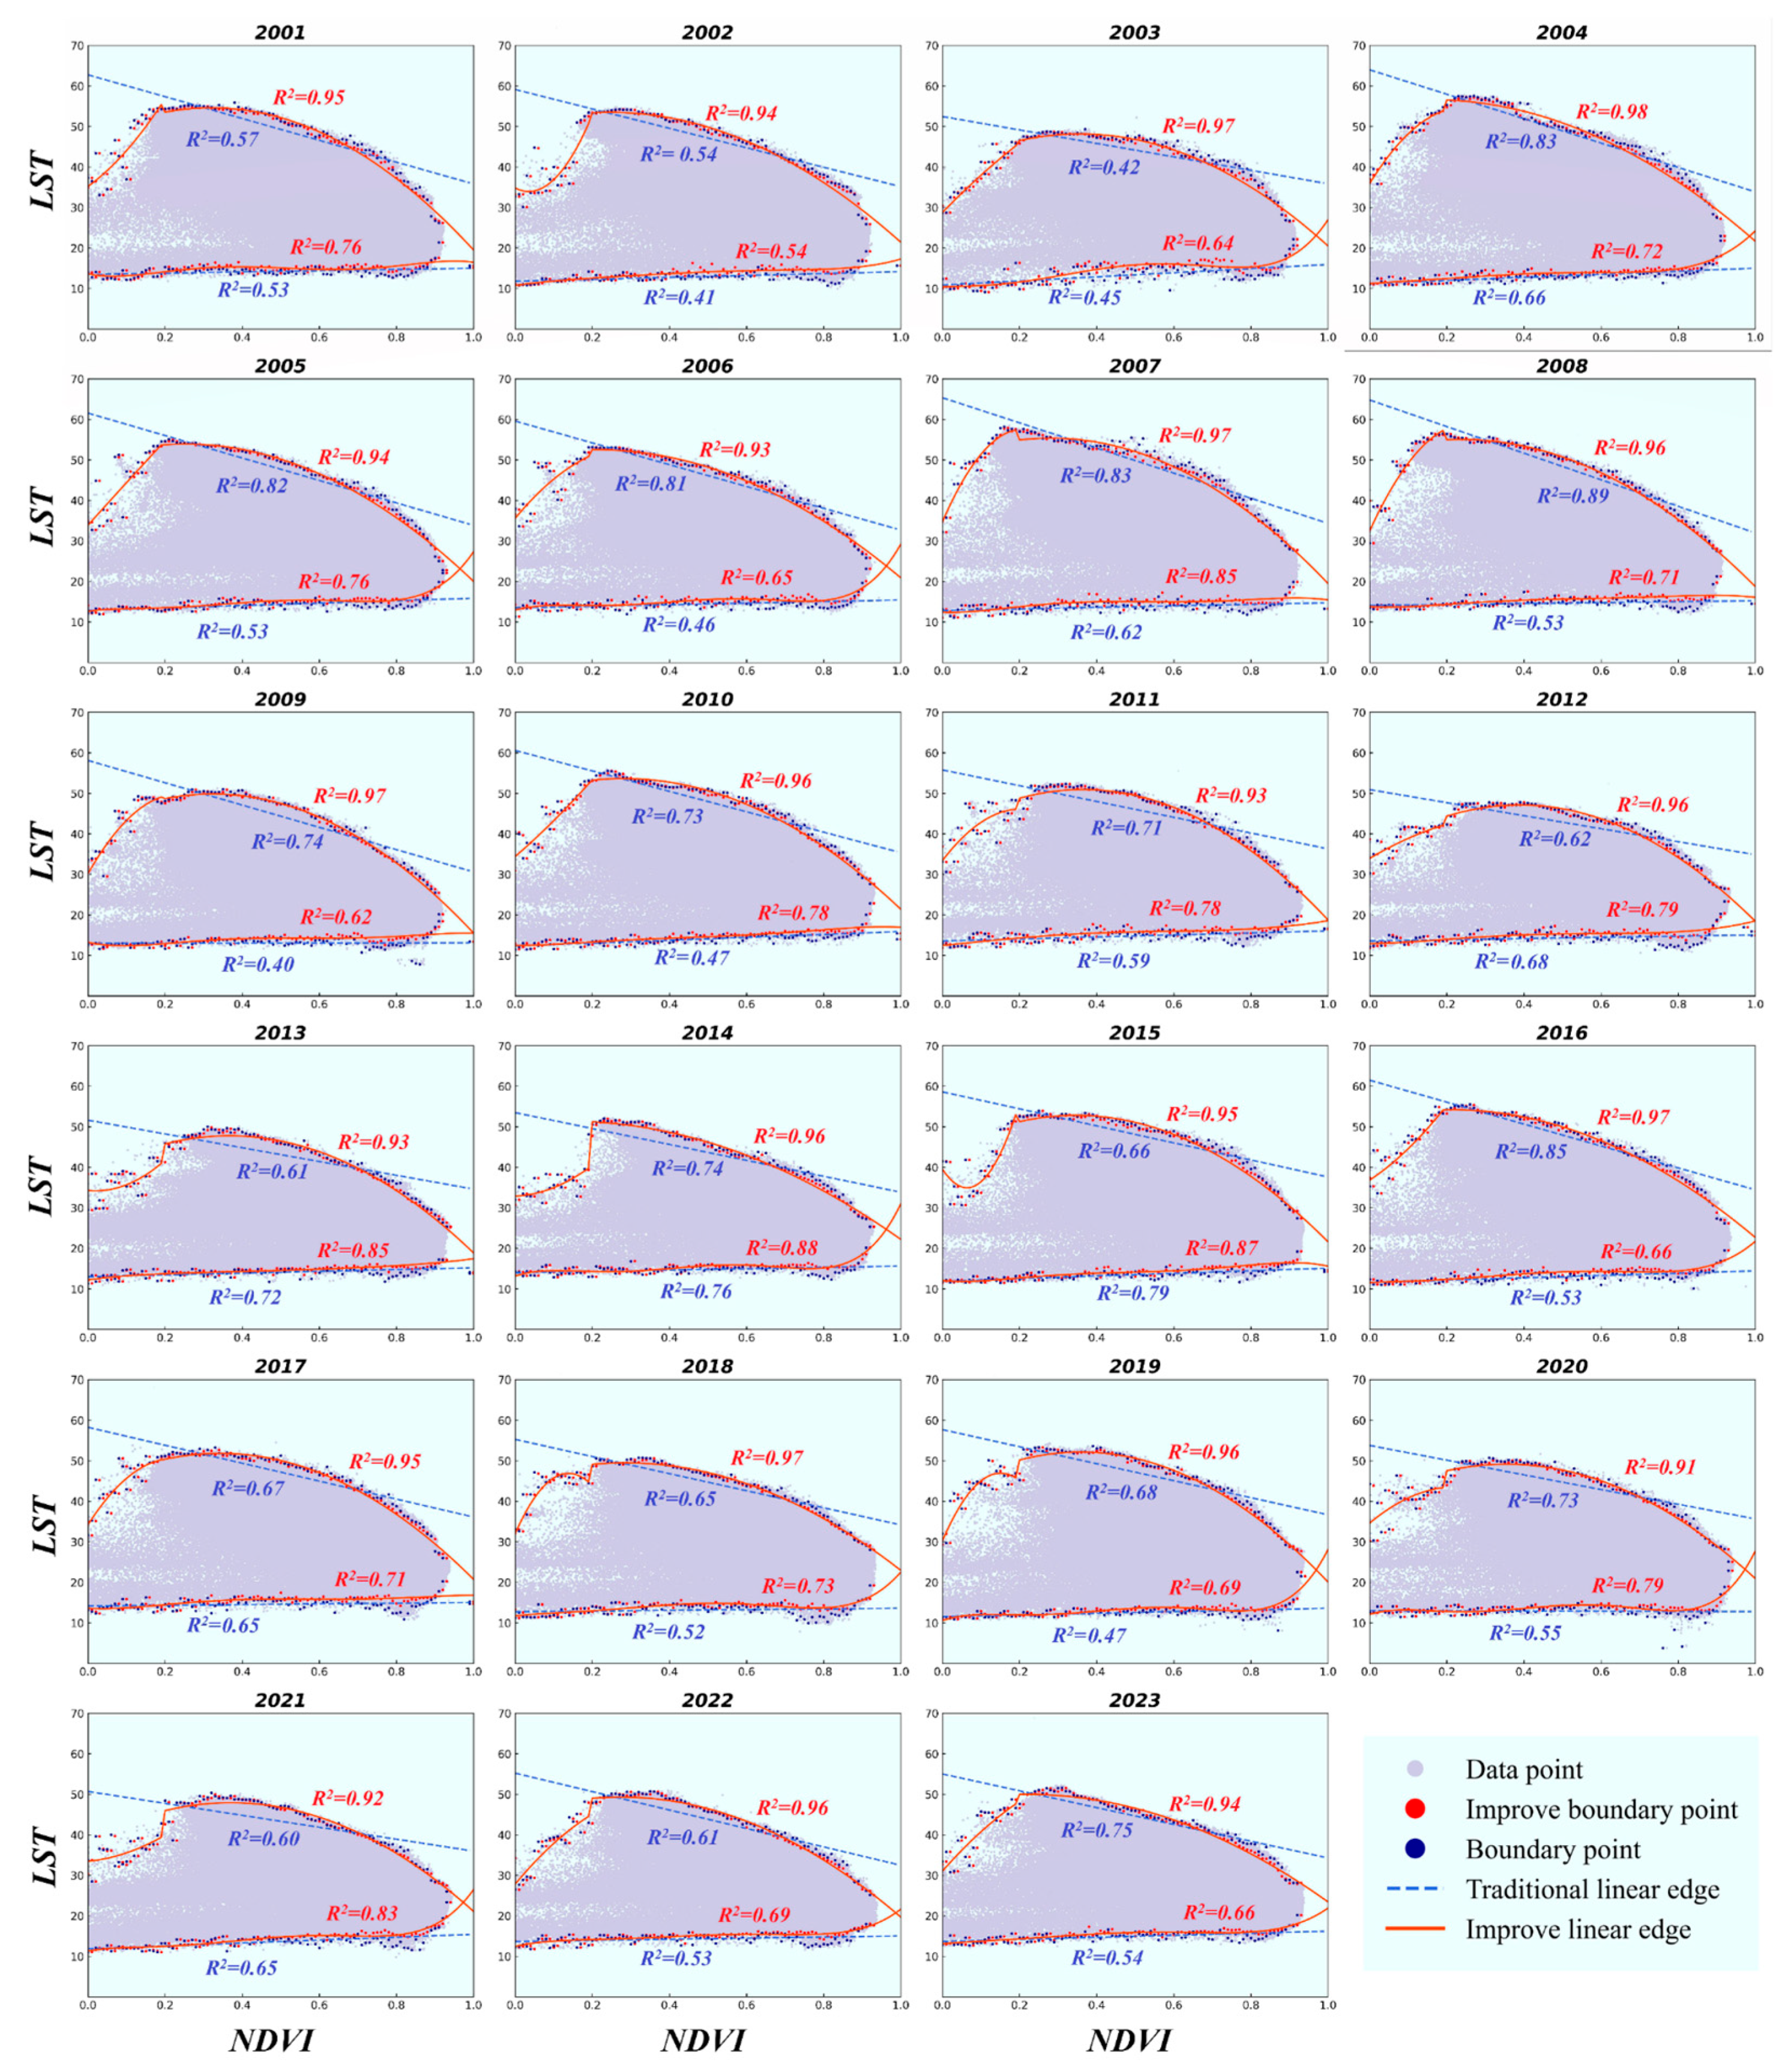
2.3.2. Constraint Line Method for Fitting Boundaries
2.3.3. Improved Temperature Vegetation Drought Index (ITVDI)
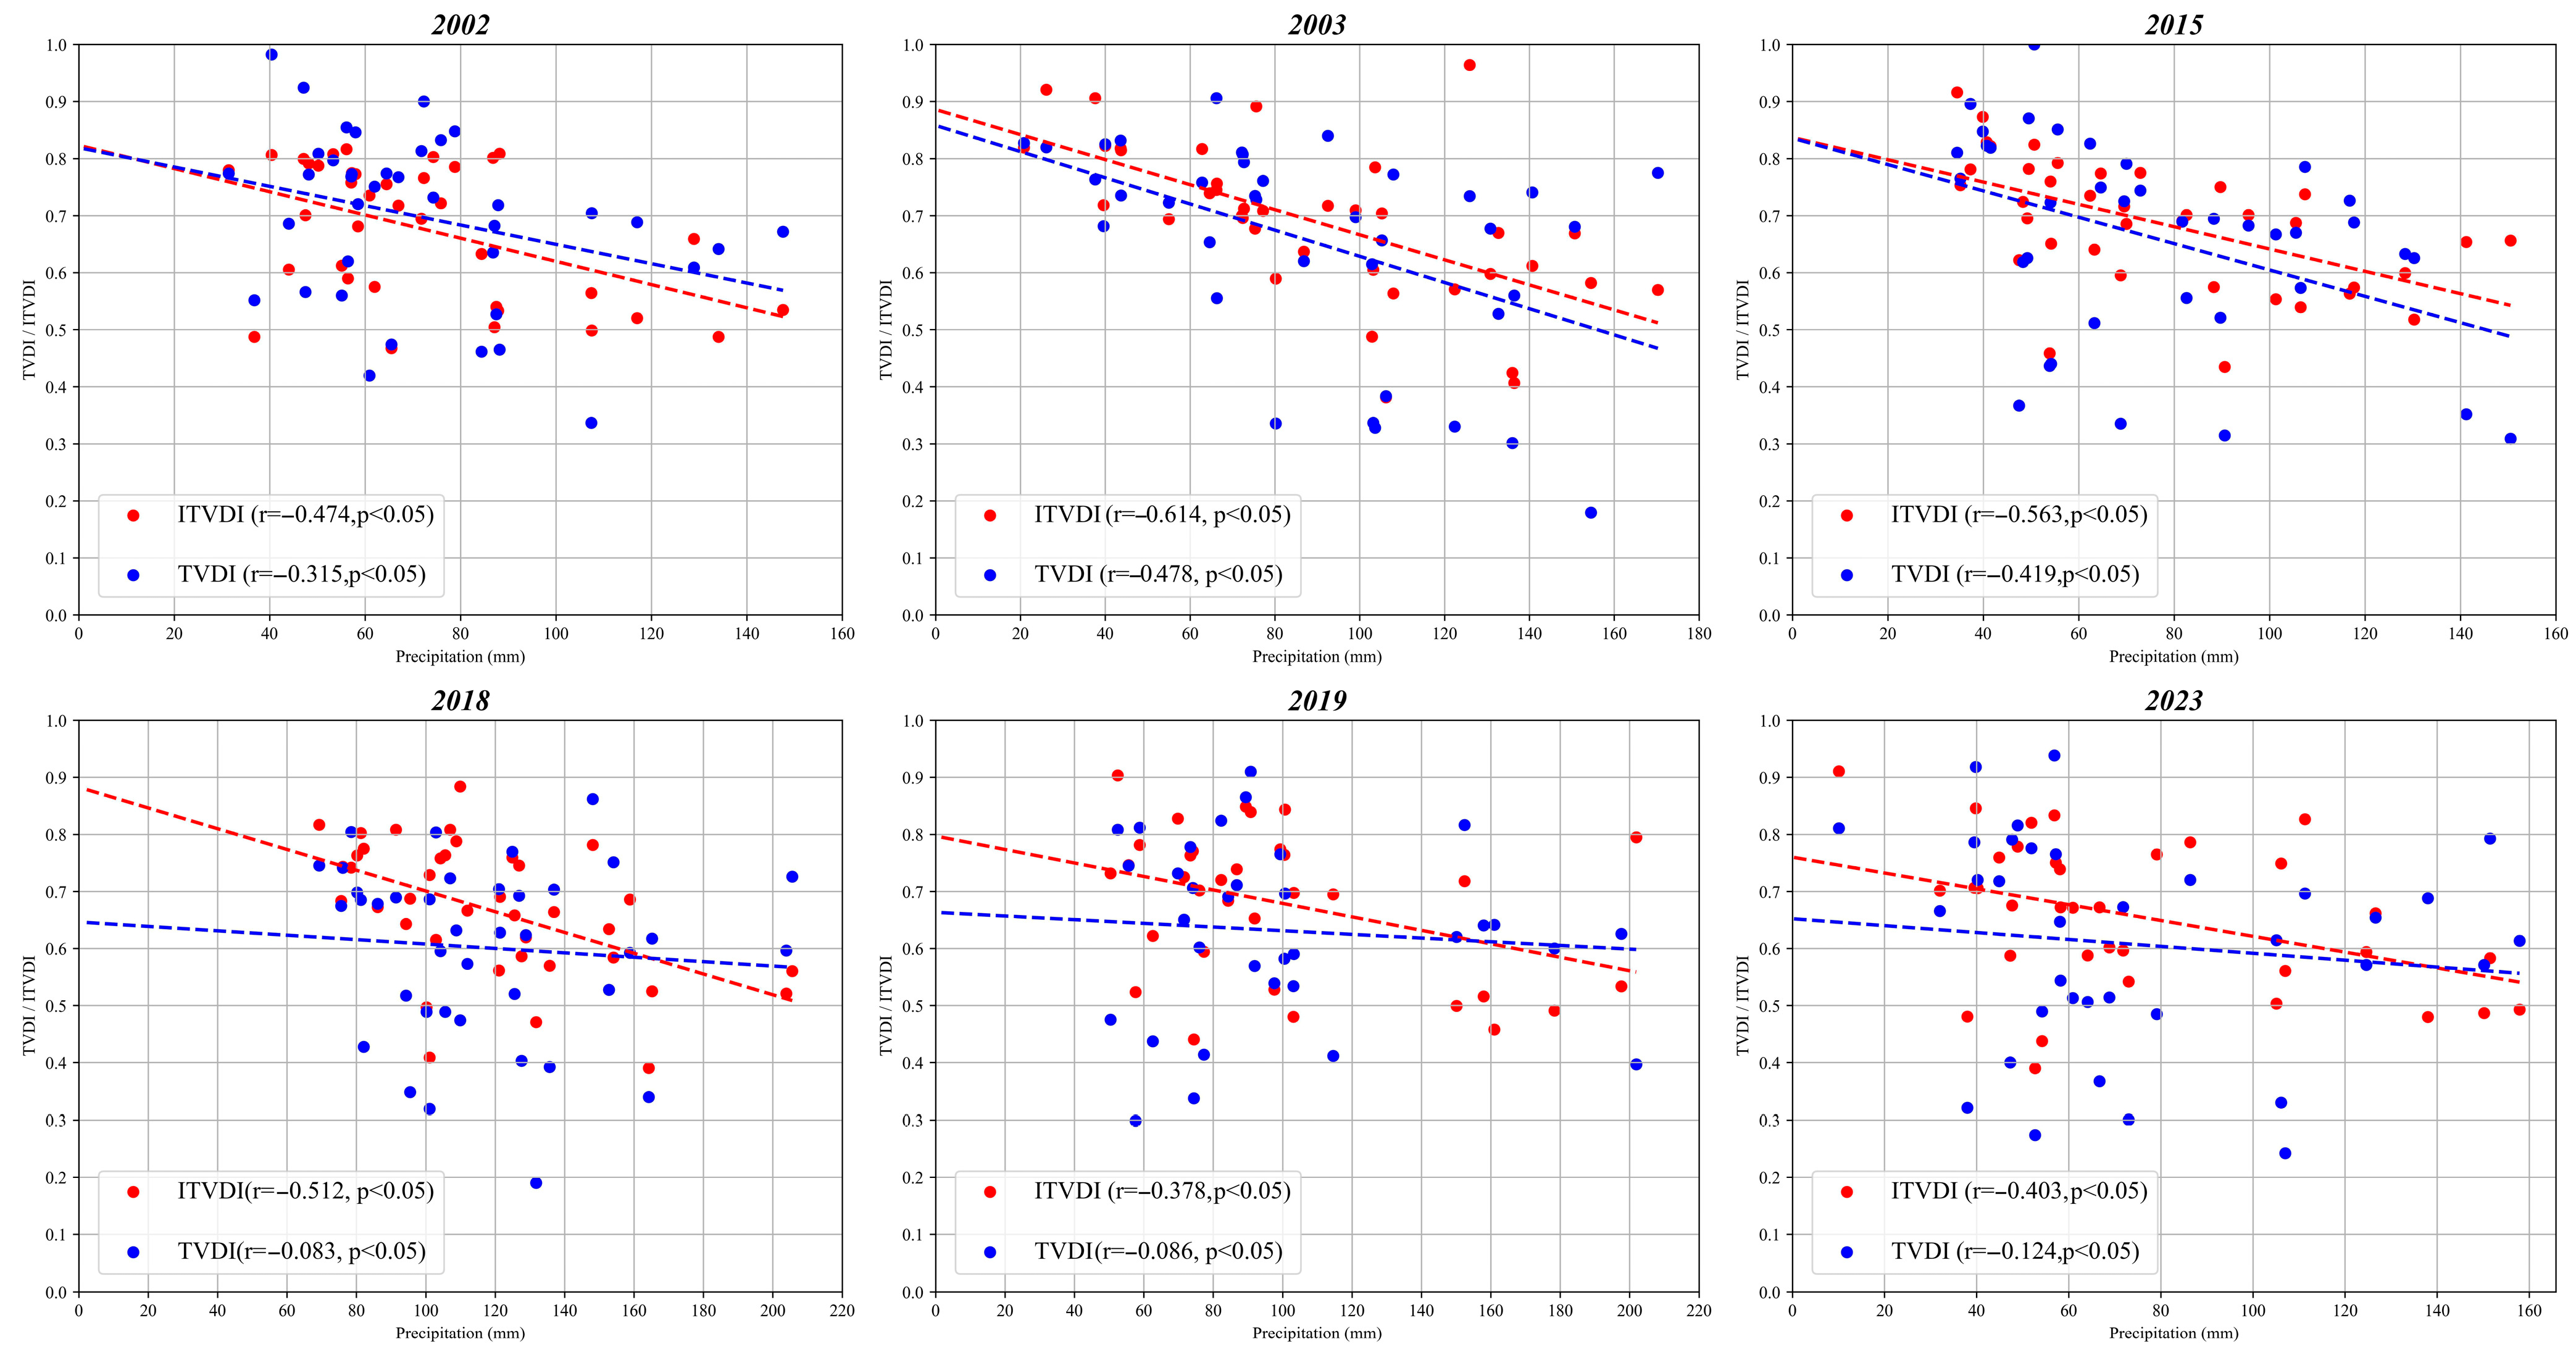
2.3.4. Correlation Analysis
2.3.5. Sen–MK Trend Analysis
3. Results
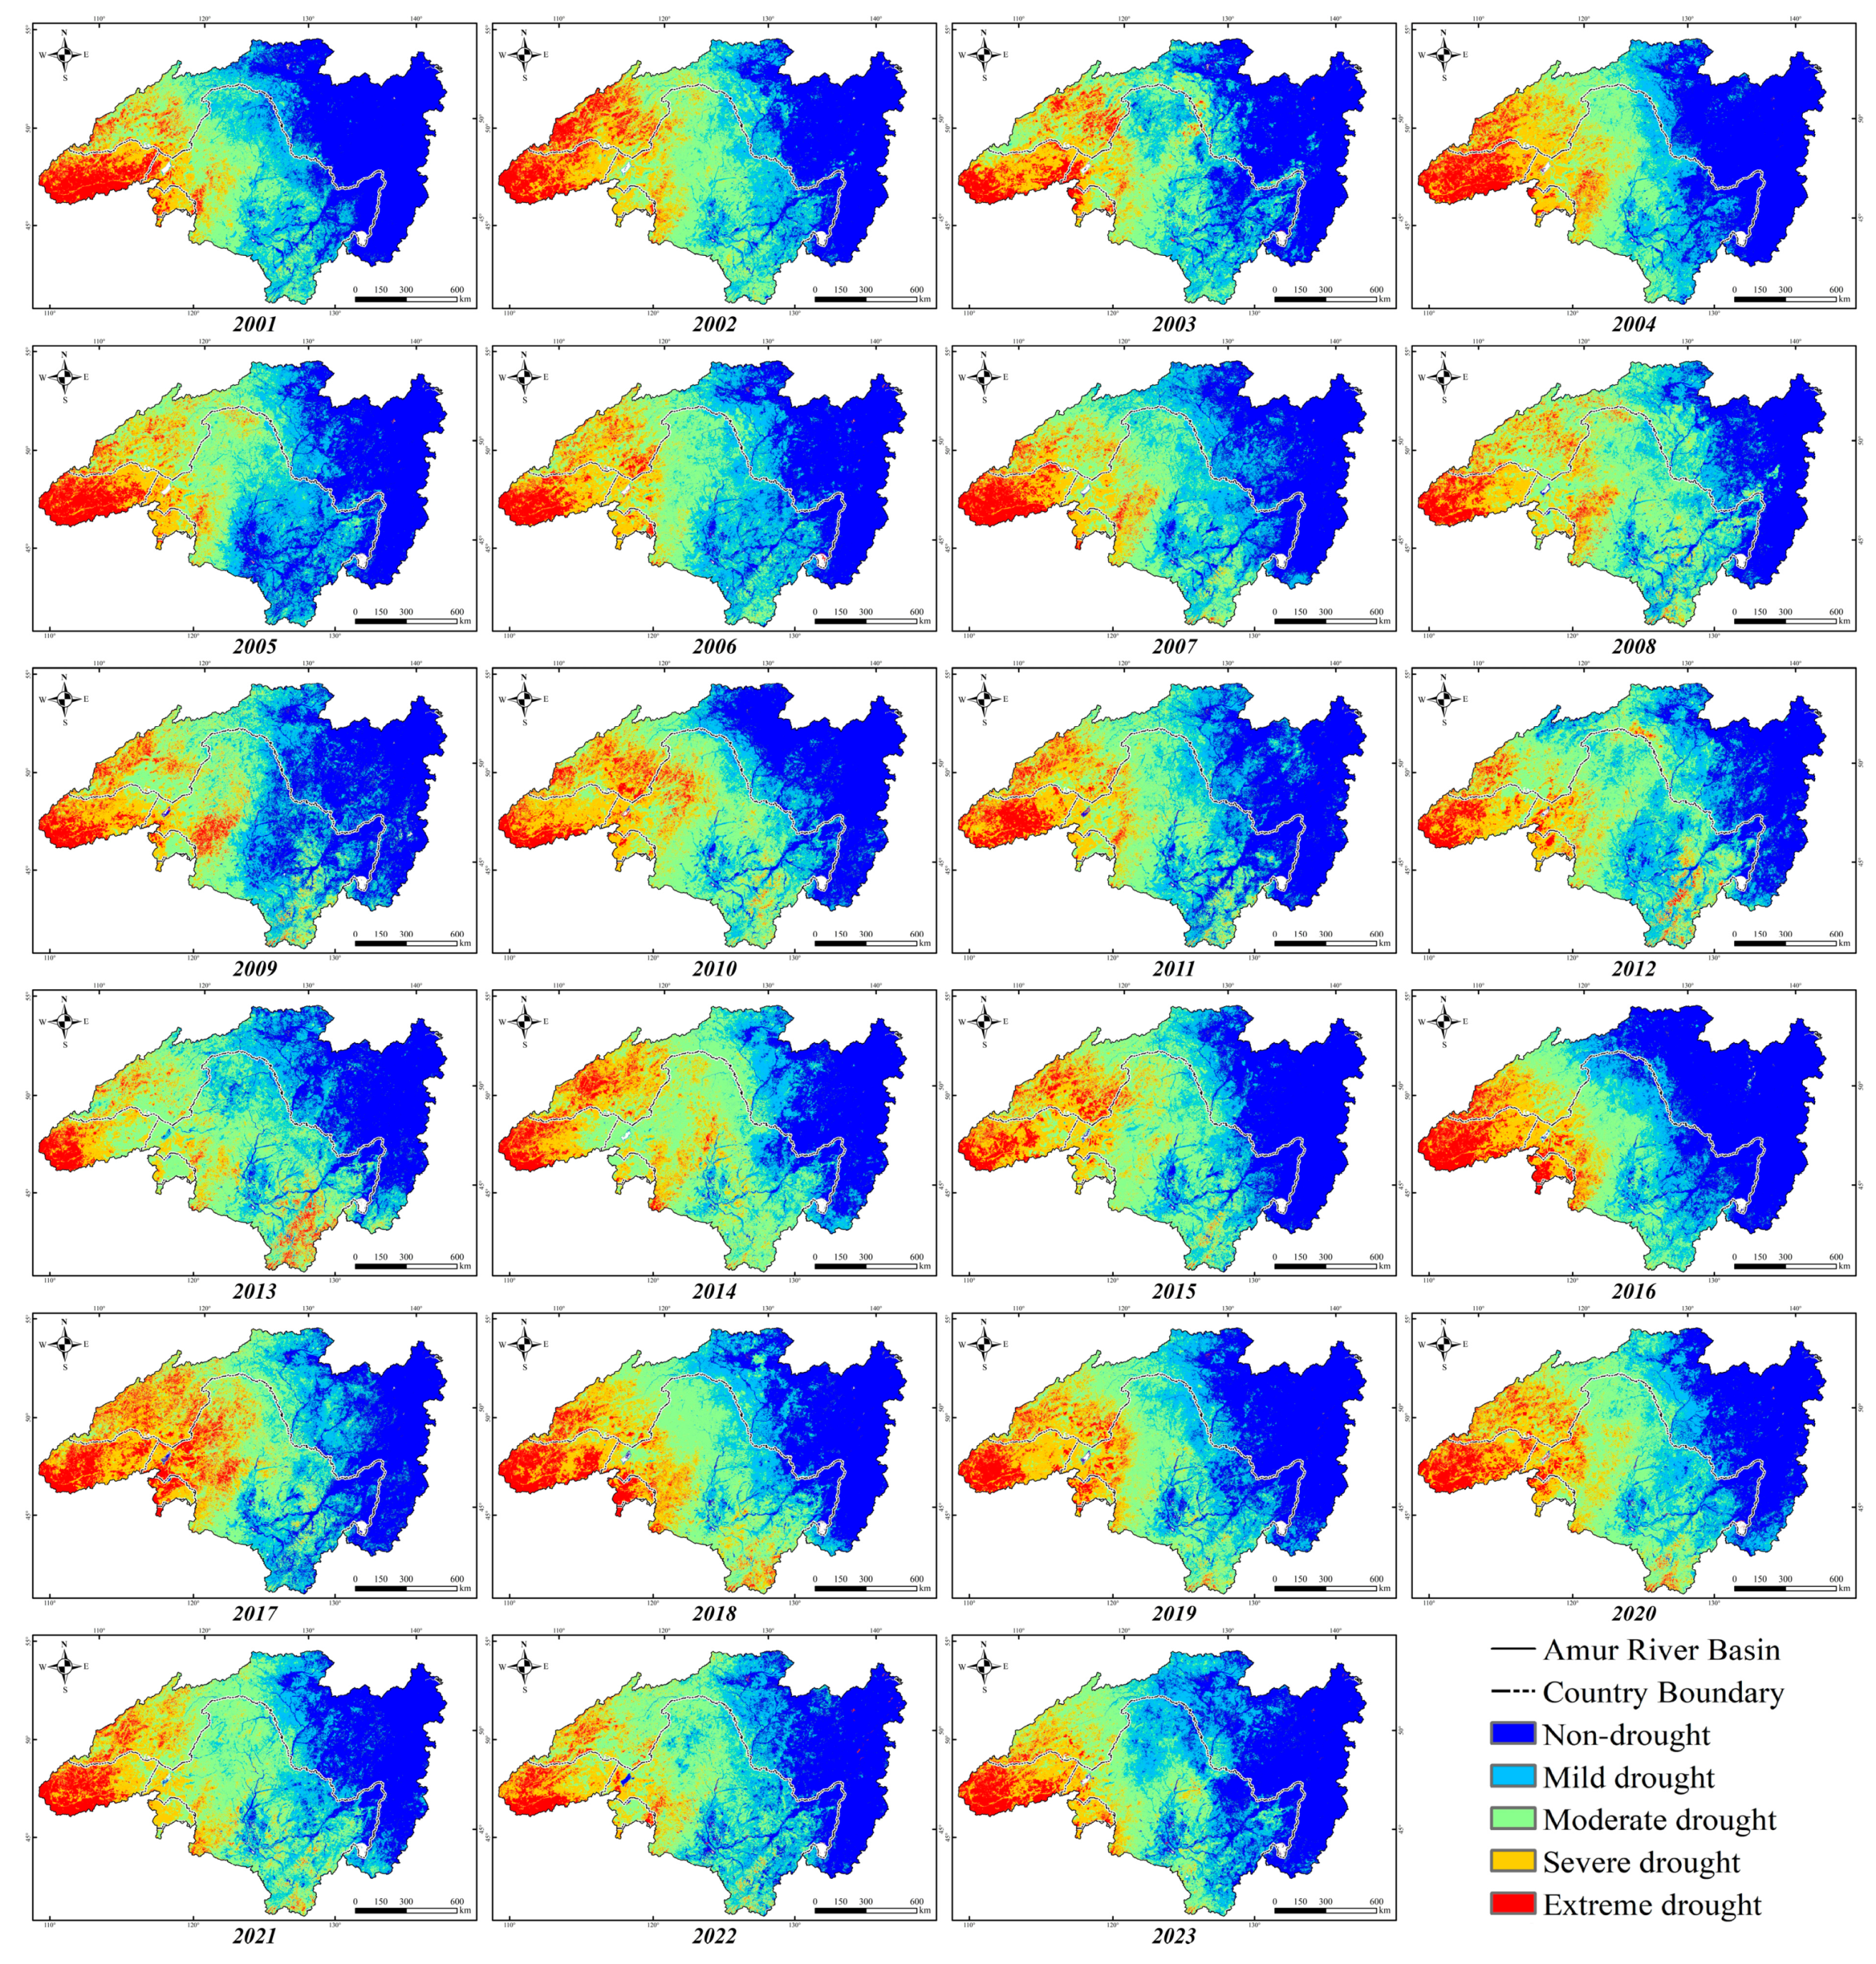
3.1. Spatial and Temporal Distribution Pattern of Drought
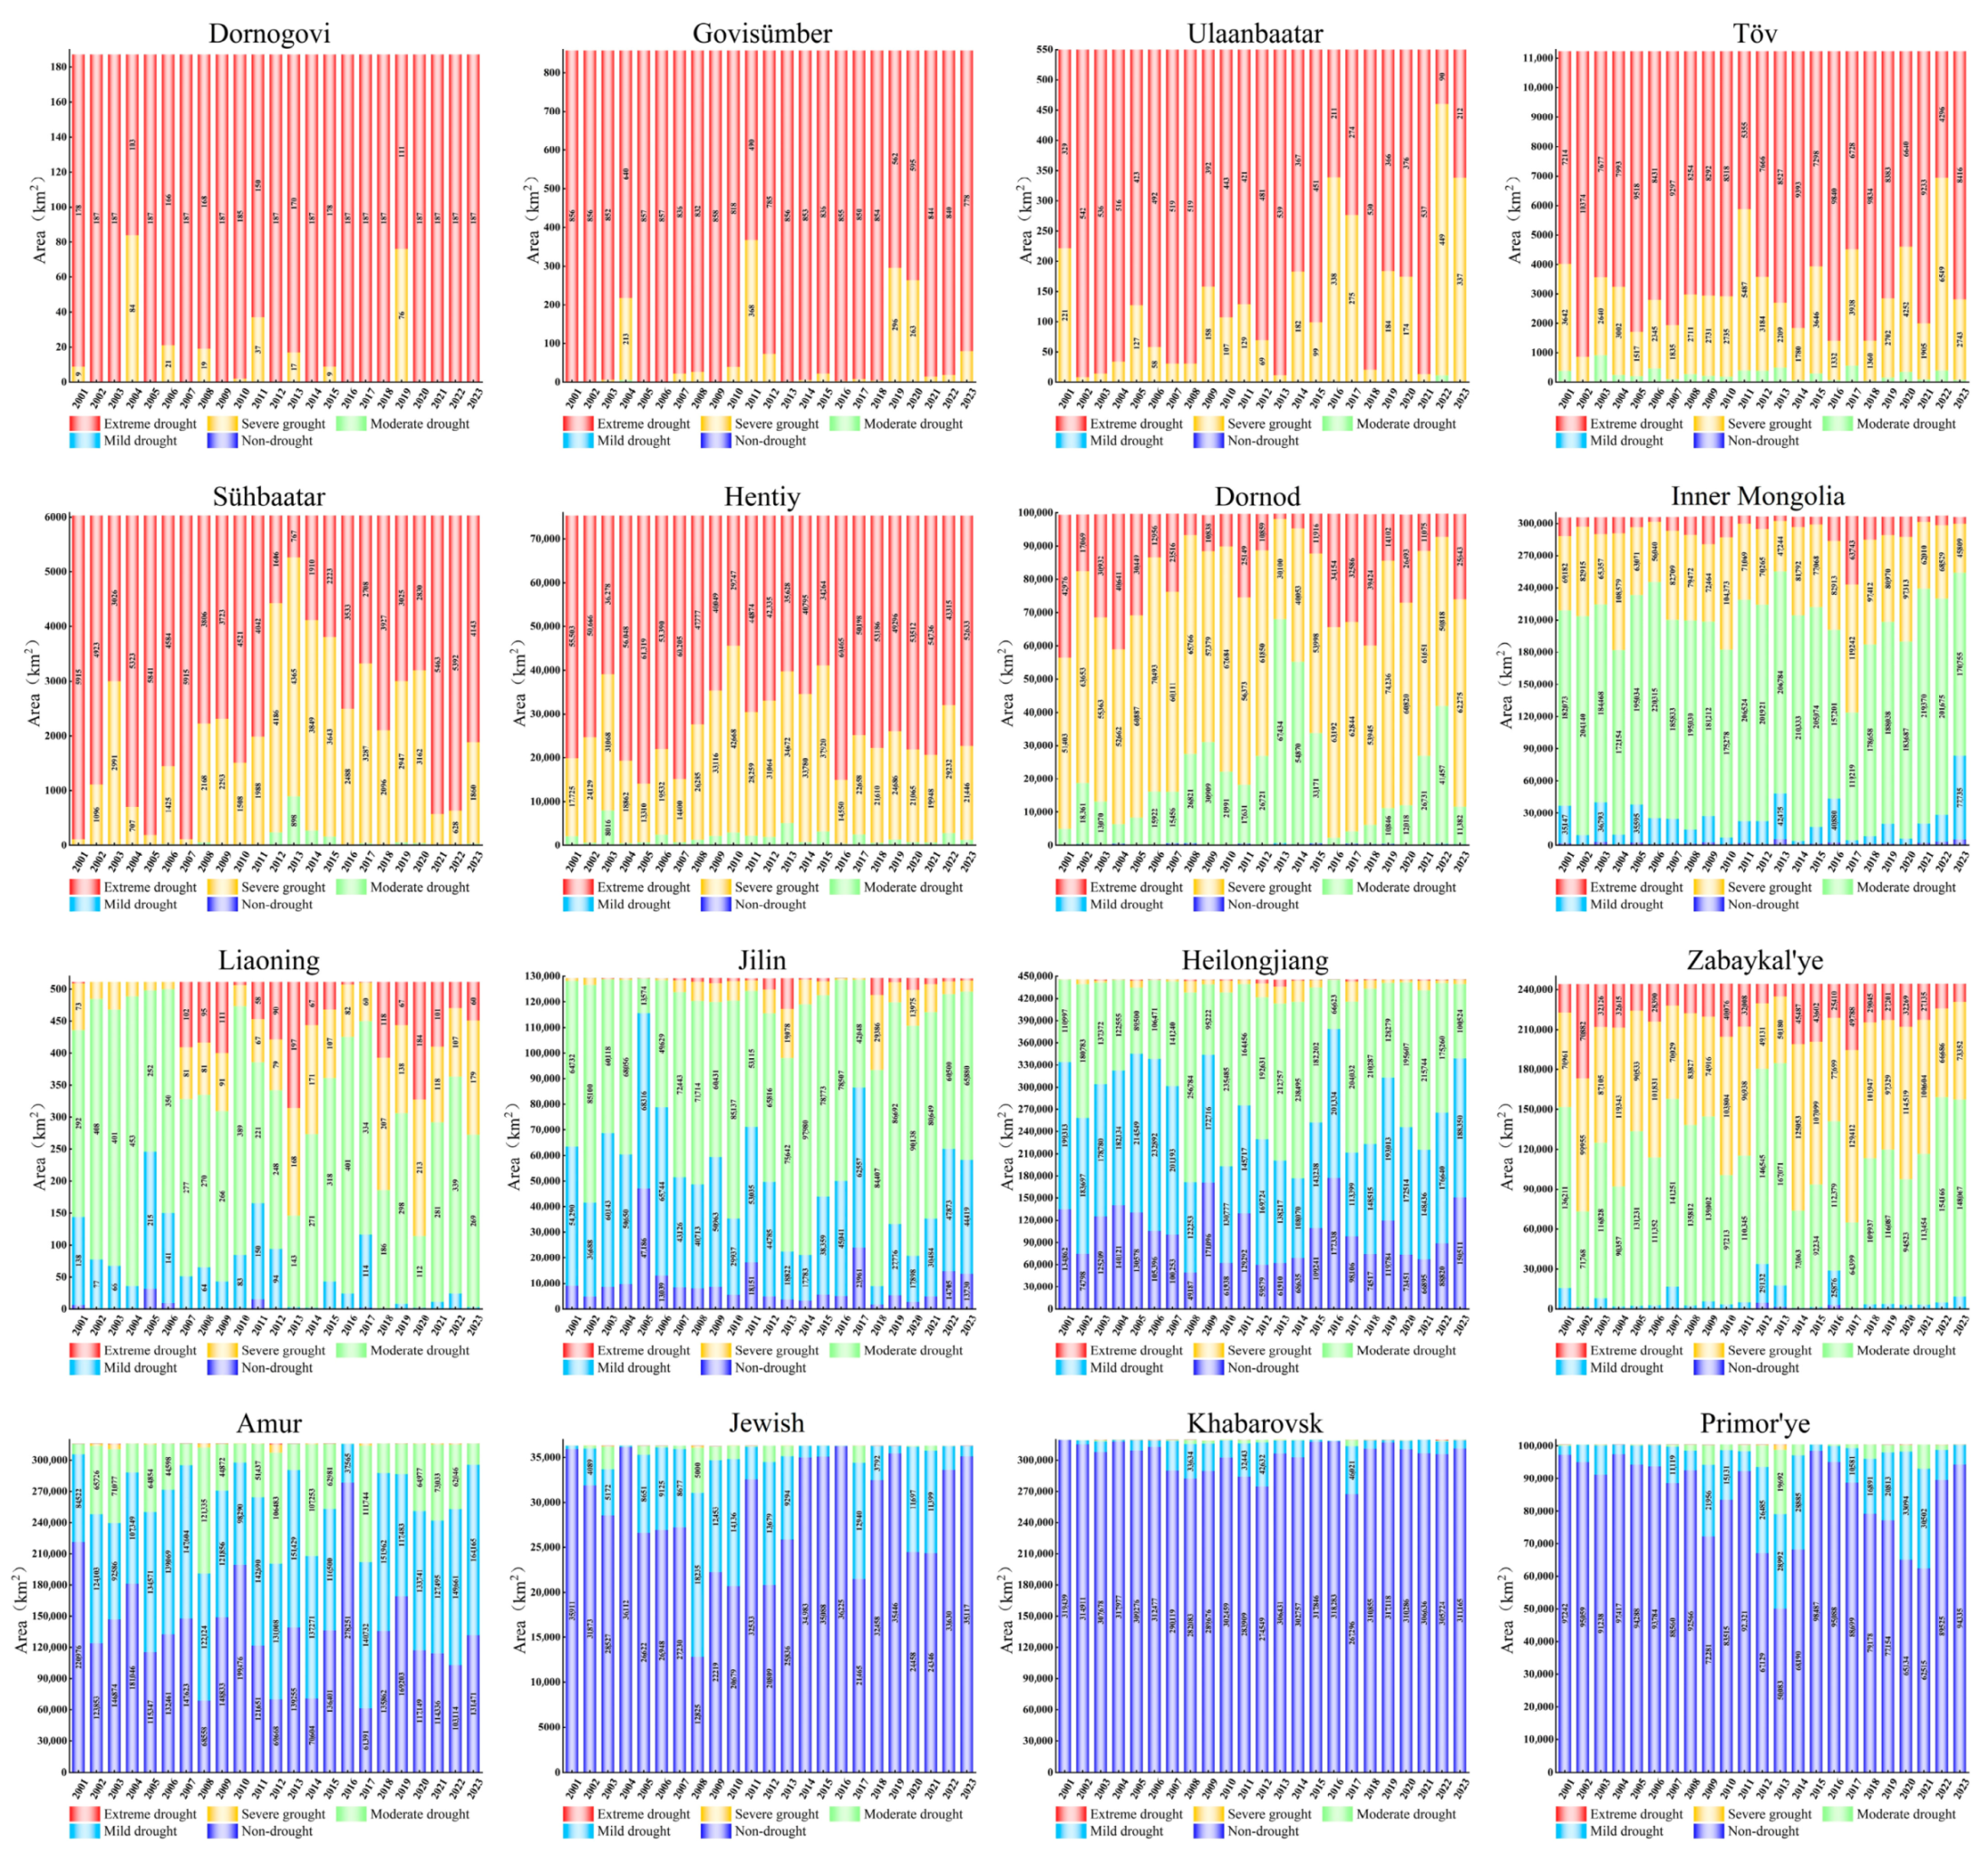
3.2. Characterization of the Drought Distribution at the Regional Scale
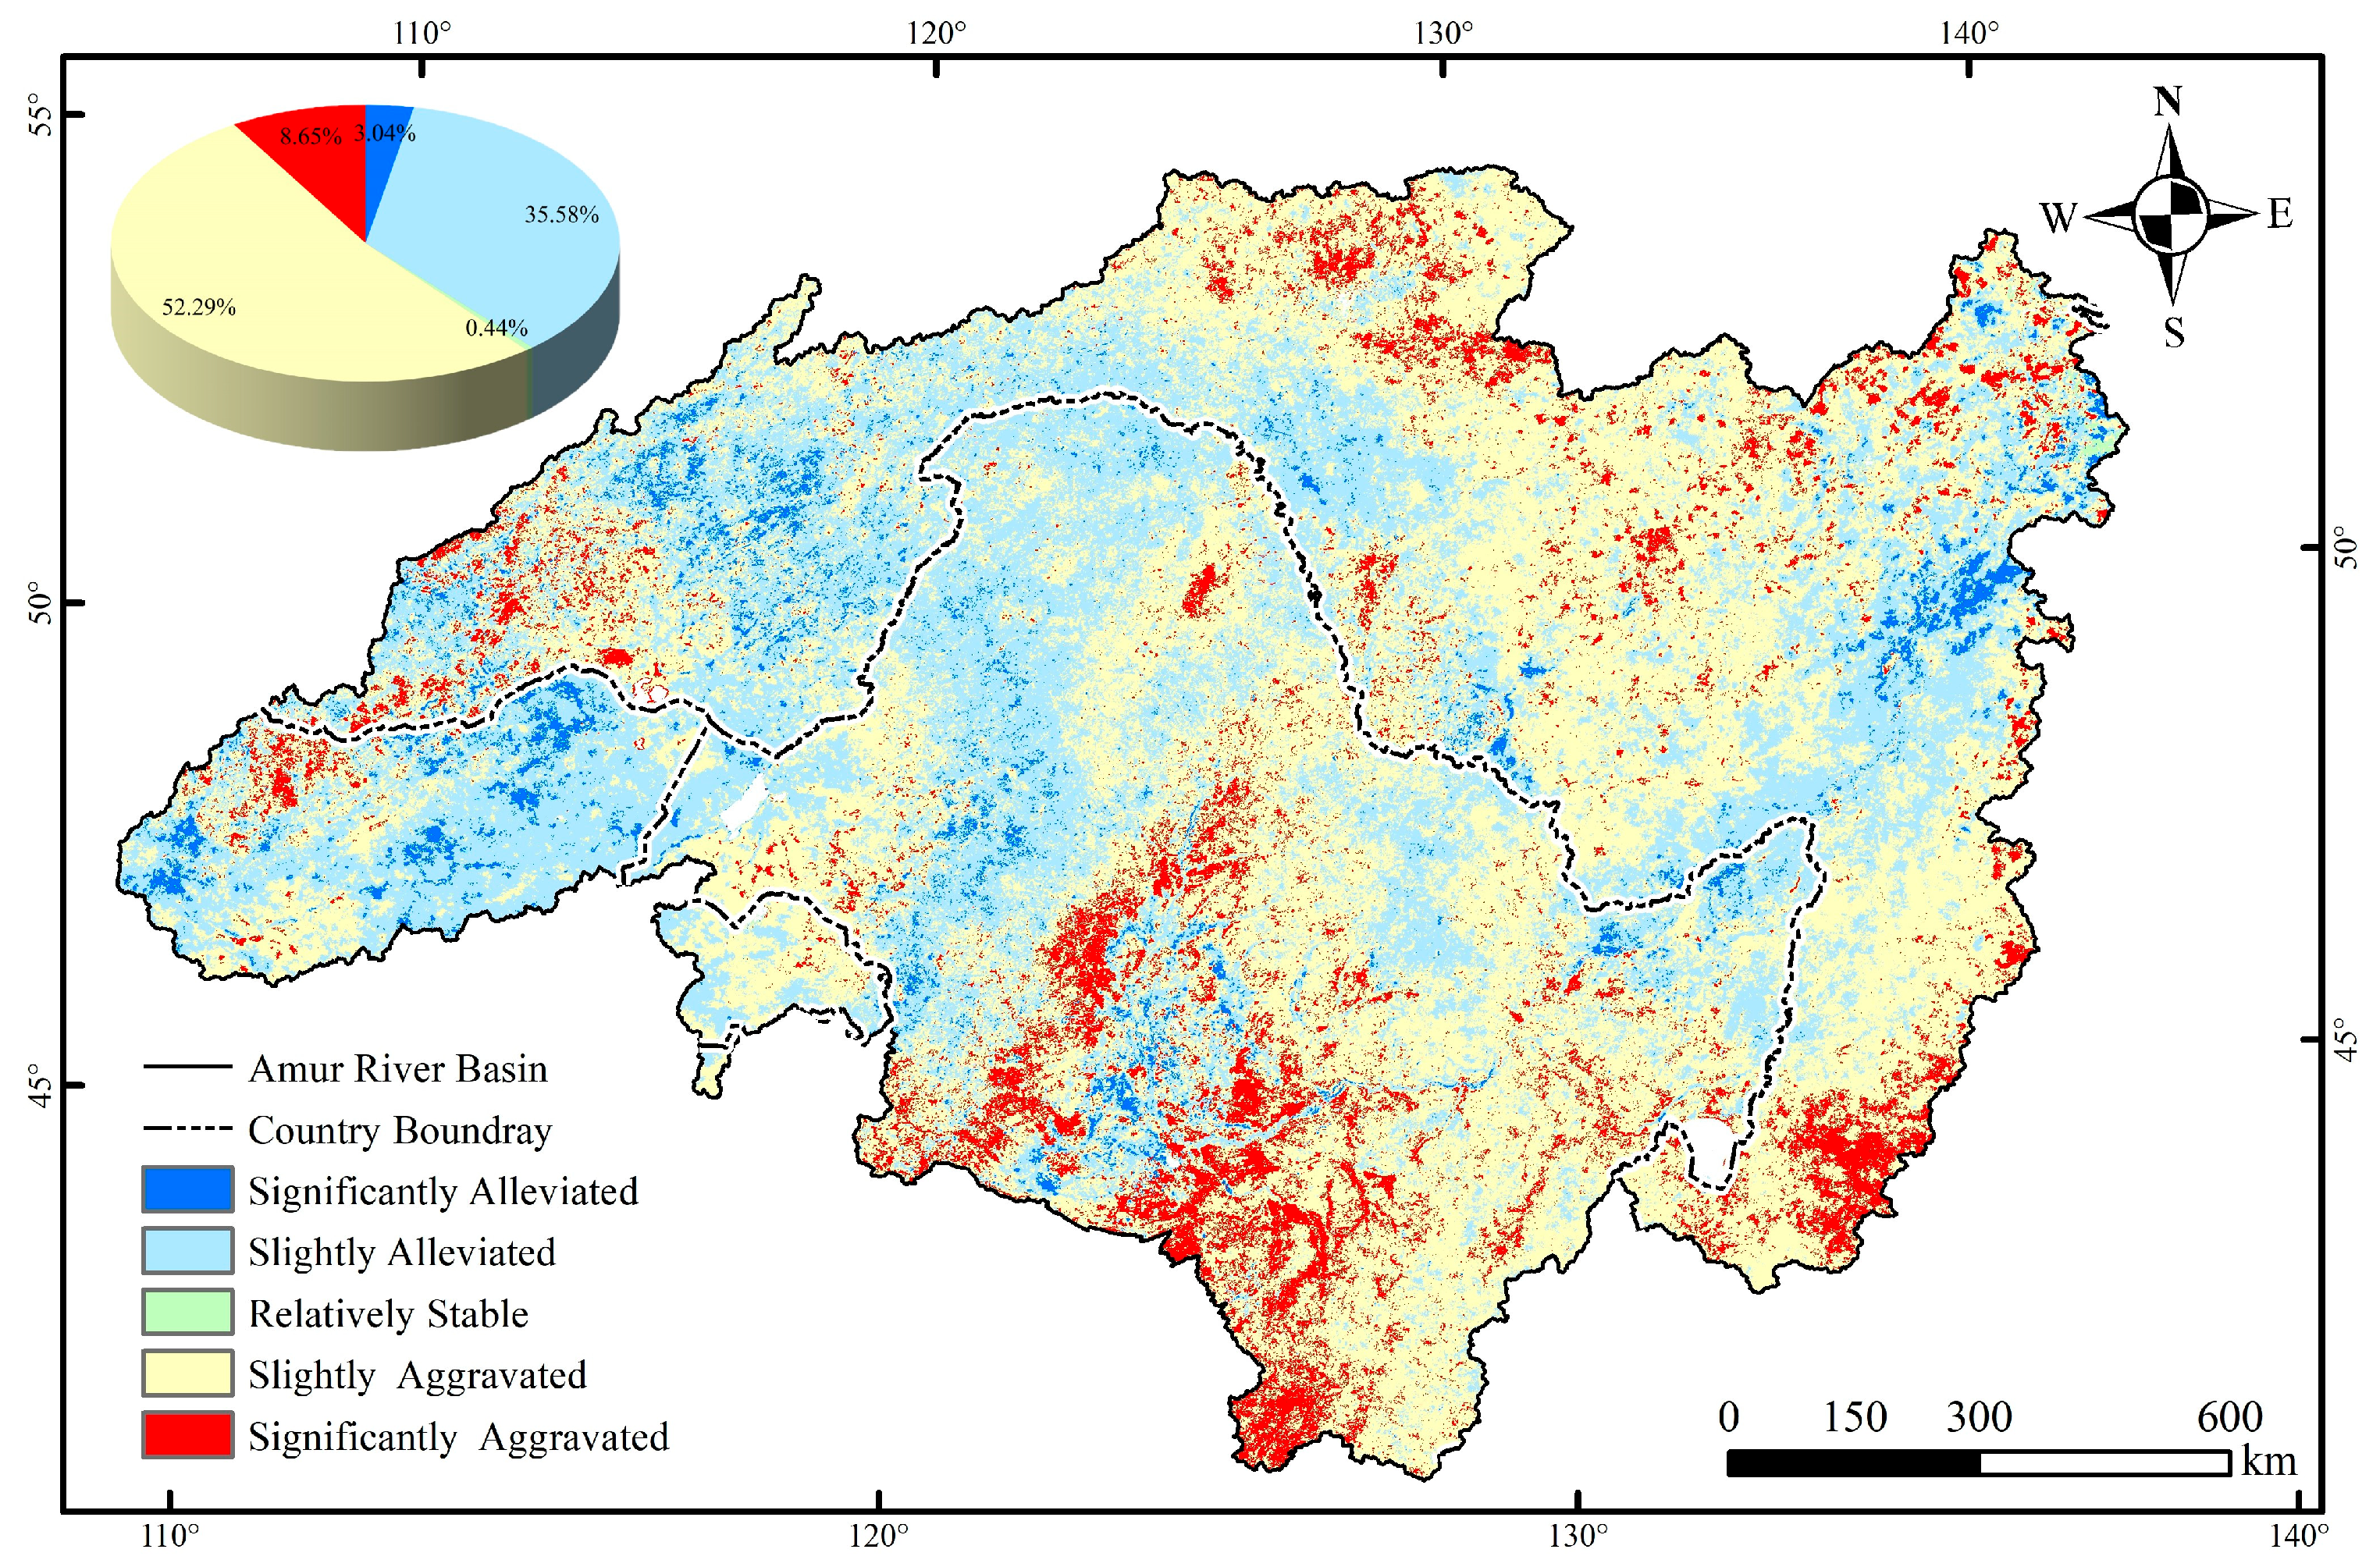
3.3. Analysis of Drought Trends in the Heilongjiang River Basin
4. Discussion
4.1. ITVDI Suitability Evaluation
4.2. Comparison of Dry and Wet Edge Fitting Results
4.3. Analysis of Extreme Weather Events
4.4. Recommendations and Regulatory Strategies
- (1)
- In the Heilongjiang River Basin Region of China, technology-driven and food security guarantees should be implemented. There was significant spatial heterogeneity in drought severity across Northeastern China and Inner Mongolia. As a core region for national food production, this area should prioritize technological innovation as the core approach to address drought risks. Strengthen capacity building for agricultural disaster mitigation and prevention in the black soil region. Continuously improve the construction level of farmland water conservancy facilities and disaster resistance capacity. Establish a precision agricultural meteorological service system covering the entire growth cycle from sowing to harvesting. Reduce climate disaster risks in agricultural production. In response to the ecological vulnerability of the Inner Mongolian grassland region, accelerate the genetic improvement and large-scale cultivation of drought-tolerant forage varieties. Construct a synergistic grass–livestock–water resilient ecosystem.
- (2)
- In the Heilongjiang River Basin Region of Mongolia, efforts should focus on ecological restoration and sustainable pasture management. In the grassland region of Mongolia, extreme drought occurs frequently, with scarce non-drought areas. Ecological restoration is necessary as the core to stabilize the foundation of animal husbandry. It is recommended to designate seasonal grazing ban areas and rotational grazing demonstration areas. Implement natural vegetation restoration and overseeding of drought-resistant grass species to enhance grassland productivity. Construct decentralized rainwater harvesting facilities in settlements of pastoral households, alleviating the shortage of drinking water for livestock. Establish a drought insurance mechanism for animal husbandry. Enhance climate adaptation training for pastoralist communities. Promote grass–animal balance management techniques. Promote the transition from traditional nomadic pastoralism to sustainable intensification.
- (3)
- In the Heilongjiang River Basin Region of Russia, resource optimization and cross-border data collaboration are necessary. The drought risk in the Russian Far East is relatively low, and local moderate-to-severe droughts may impact agricultural exports. It is recommended to optimize crop allocation in agricultural zones, such as Amur Oblast and Primorsky Krai. Reduce the proportion of water-intensive crops grown. Priority should be given to the development of drought-tolerant crops (buckwheat and oats) and water-saving dry farming. In the area of cross-border cooperation, establish a shared China–Mongolia–Russia drought data platform, and jointly develop cross-border river basin drought prediction models. Drought management in cross-border river basins requires breaking through administrative barriers. Construct a “region-specific strategies–collaborative response” framework, and provide scientific support for synergistic regional drought responses.
5. Conclusions
Author Contributions
Funding
Data Availability Statement
Conflicts of Interest
References
- Yang, N.; Deng, S. Research Progress in Agricultural Drought Monitoring Based on Multi—Source Information. J. Catastrophology 2024, 39, 125–135. [Google Scholar]
- Vogel, E.; Donat, M.G.; Alexander, L.V.; Meinshausen, M.; Ray, D.K.; Karoly, D.; Meinshausen, N.; Frieler, K. The Effects of Climate Extremes on Global Agricultural Yields. Environ. Res. Lett. 2019, 14, 054010. [Google Scholar] [CrossRef]
- Dai, A. Increasing Drought under Global Warming in Observations and Models. Nat. Clim. Change 2013, 3, 52–58. [Google Scholar] [CrossRef]
- Mukherjee, S.; Mishra, A.; Trenberth, K.E. Climate Change and Drought: A Perspective on Drought Indices. Curr. Clim. Change Rep. 2018, 4, 145–163. [Google Scholar] [CrossRef]
- Deng, H.; Yin, Y.; Zong, X.; Yin, M. Future Drought Risks in the Yellow River Basin and Suggestions for Targeted Response. Int. J. Disaster Risk Reduct. 2023, 93, 103764. [Google Scholar] [CrossRef]
- Sun, Y.T.; Cao, C.R.; Huang, K.Q.; Shi, J.A.; Zhao, L.Z.; Li, M.Z.; Bai, H.Y.; Gu, L.; Zheng, D.N.; Wang, W.H. Real-Space Imaging of Nucleation and Size Induced Amorphization in PdSi Nanoparticles. Intermetallics 2016, 74, 31–37. [Google Scholar] [CrossRef]
- Zhang, J.; Sun, F.; Lai, W.; Lim, W.H.; Liu, W.; Wang, T.; Wang, P. Attributing Changes in Future Extreme Droughts Based on PDSI in China. J. Hydrol. 2019, 573, 607–615. [Google Scholar] [CrossRef]
- Dehghan, S.; Salehnia, N.; Sayari, N.; Bakhtiari, B. Prediction of Meteorological Drought in Arid and Semi-Arid Regions Using PDSI and SDSM: A Case Study in Fars Province, Iran. J. Arid Land 2020, 12, 318–330. [Google Scholar] [CrossRef]
- Blackstock, J.M.; Owens, P.R.; Moore, P.A.; Torbenson, M.C.A.; Ashworth, A.R.; Anderson, K.R.; Burgess-Conforti, J.; Delhom, C.D. Spatiotemporal Patterns of pH Related to Streamflow Variability, Drought Conditions, and Bedrock Lithology in Acid Sensitive Streams within a Humid, Subtropical Catchment: Mulberry River, Arkansas, USA. J. Hydrol. Reg. Stud. 2024, 56, 101992. [Google Scholar] [CrossRef]
- Gaire, N.P.; Dhakal, Y.R.; Shah, S.K.; Fan, Z.-X.; Bräuning, A.; Thapa, U.K.; Bhandari, S.; Aryal, S.; Bhuju, D.R. Drought (scPDSI) Reconstruction of Trans-Himalayan Region of Central Himalaya Using Pinus Wallichiana Tree-Rings. Palaeogeogr. Palaeoclimatol. Palaeoecol. 2019, 514, 251–264. [Google Scholar] [CrossRef]
- Zhao, H.; Gao, G.; An, W.; Zou, X.; Li, H.; Hou, M. Timescale Differences between SC-PDSI and SPEI for Drought Monitoring in China. Phys. Chem. Earth Parts A/B/C 2017, 102, 48–58. [Google Scholar] [CrossRef]
- Van der Schrier, G.; Barichivich, J.; Briffa, K.R.; Jones, P.D. A scPDSI-based global data set of dry and wet spells for 1901–2009. J. Geophys. Res. Atmos. 2013, 118, 4025–4048. [Google Scholar] [CrossRef]
- Sayat, A.; Lyazzat, M.; Elmira, T.; Gaukhar, B.; Gulsara, M. Assessment of the Impacts of Climate Change on Drought Intensity and Frequency Using SPI and SPEI in the Southern Pre-Balkash Region, Kazakhstan. Watershed Ecol. Environ. 2025, 7, 11–22. [Google Scholar] [CrossRef]
- Zhang, S.; Li, J.; Zhang, T.; Feng, P.; Liu, W. Response of Vegetation to SPI and Driving Factors in Chinese Mainland. Agric. Water Manag. 2024, 291, 108625. [Google Scholar] [CrossRef]
- Lee, S.; Moriasi, D.N.; Danandeh Mehr, A.; Mirchi, A. Sensitivity of Standardized Precipitation and Evapotranspiration Index (SPEI) to the Choice of SPEI Probability Distribution and Evapotranspiration Method. J. Hydrol. Reg. Stud. 2024, 53, 101761. [Google Scholar] [CrossRef]
- He, Q.; Wang, M.; Liu, K.; Wang, B. High-Resolution Standardized Precipitation Evapotranspiration Index (SPEI) Reveals Trends in Drought and Vegetation Water Availability in China. Geogr. Sustain. 2024, 6, 100228. [Google Scholar] [CrossRef]
- Wang, D. Spatial and Temporal Characteristics of the Loess Plateau Drought and Its Potential Risk to Vegetation Growth; Lanzhou University: Lanzhou, China, 2023. [Google Scholar]
- Pei, Z.; Fang, S.; Wang, L.; Yang, W. Comparative Analysis of Drought Indicated by the SPI and SPEI at Various Timescales in Inner Mongolia, China. Water 2020, 12, 1925. [Google Scholar] [CrossRef]
- Tang, J.; Hu, B.; Yu, B.; Zou, Y.; Su, H. Spatio-temporal variation of Guangxi drought based on the SPEI__PM and its correlation with ENSO. Chin. J. Agrometeorol. 2024, 45, 1067–1078. [Google Scholar]
- Bian, Z.; Roujean, J.; Fan, T.; Dong, Y.; Hu, T.; Cao, B.; Li, H.; Du, Y.; Xiao, Q.; Liu, Q. An angular normalization method for temperature vegetation dryness index (TVDI) in monitoring agricultural drought. Remote Sens. Environ. 2023, 284, 113330. [Google Scholar] [CrossRef]
- Gao, Y.; Fu, S.; Cui, H.; Cao, Q.; Wang, Z.; Zhang, Z.; Wu, Q.; Qiao, J. Identifying the spatio-temporal pattern of drought characteristics and its constraint factors in the Yellow River Basin. Ecol. Indic. 2023, 154, 110753. [Google Scholar] [CrossRef]
- Jiang, Z.; Huete, A.R.; Didan, K.; Miura, T. Development of a Two-Band Enhanced Vegetation Index without a Blue Band. Remote Sens. Environ. 2008, 112, 3833–3845. [Google Scholar] [CrossRef]
- Matsushita, B.; Yang, W.; Chen, J.; Onda, Y.; Qiu, G. Sensitivity of the Enhanced Vegetation Index (EVI) and Normalized Difference Vegetation Index (NDVI) to Topographic Effects: A Case Study in High-Density Cypress Forest. Sensors 2007, 7, 2636–2651. [Google Scholar] [CrossRef]
- Li, J.; Li, Y.; Yin, L.; Zhao, Q. A Novel Composite Drought Index Combining Precipitation, Temperature and Evapotranspiration Used for Drought Monitoring in the Huang-Huai-Hai Plain. Agric. Water Manag. 2024, 291, 108626. [Google Scholar] [CrossRef]
- Zhang, A.; Jia, G. Monitoring Meteorological Drought in Semiarid Regions Using Multi-Sensor Microwave Remote Sensing Data. Remote Sens. Environ. 2013, 134, 12–23. [Google Scholar] [CrossRef]
- Lu, J.; Carbone, G.J.; Gao, P. Mapping the Agricultural Drought Based on the Long-Term AVHRR NDVI and North American Regional Reanalysis (NARR) in the United States, 1981–2013. Appl. Geogr. 2019, 104, 10–20. [Google Scholar] [CrossRef]
- Rodigheri, G.; Fontana, D.C.; da Luz, L.B.; Dalmago, G.A.; Schirmbeck, L.W.; Schirmbeck, J.; de Gouvêa, J.A.; da Cunha, G.R. TVDI-Based Water Stress Coefficient to Estimate Net Primary Productivity in Soybean Areas. Ecol. Model. 2024, 490, 110636. [Google Scholar] [CrossRef]
- Wang, Y.; Wu, Y.; Ji, L.; Zhang, J.; Meng, L. Assessing the Spatial–Temporal Pattern of Spring Maize Drought in Northeast China Using an Optimised Remote Sensing Index. Remote Sens. 2023, 15, 4171. [Google Scholar] [CrossRef]
- Huang, D.; Ma, T.; Liu, J.; Zhang, J. Agricultural Drought Monitoring Using Modified TVDI and Dynamic Drought Thresholds in the Upper and Middle Huai River Basin, China. J. Hydrol. Reg. Stud. 2025, 57, 102069. [Google Scholar] [CrossRef]
- Rahimzadeh-Bajgiran, P.; Omasa, K.; Shimizu, Y. Comparative evaluation of the Vegetation Dryness Index (VDI), the Temperature Vegetation Dryness Index (TVDI) and the improved TVDI (iTVDI) for water stress detection in semi-arid regions of Iran. ISPRS J. Photogramm. Remote Sens. 2012, 68, 1–12. [Google Scholar] [CrossRef]
- Li, M.; Yang, Q.; Zong, S.; Wang, G.; Zhang, D. Understanding the spatiotemporal dynamics of vegetation drought and its time-lag link with teleconnection factors on the Loess Plateau. J. Hydrol. Reg. Stud. 2024, 53, 101778. [Google Scholar] [CrossRef]
- Dai, C.; Wang, S.; Li, Z.; Zhang, Y.; Gao, Y.; Li, C. Review on hydrological geography in Heilongjiang River Basin. Acta Geogr. Sin. 2015, 70, 1823–1834. [Google Scholar]
- Li, C.; Adu, B.; Wu, J.; Qin, G.; Li, H.; Han, Y. Spatial and Temporal Variations of Drought in Sichuan Province from 2001 to 2020 Based on Modified Temperature Vegetation Dryness Index (TVDI). Ecol. Indic. 2022, 139, 108883. [Google Scholar] [CrossRef]
- Lin, X.; Zhang, W.; Huang, Y.; Sun, W.; Han, P.; Yu, L.; Sun, F. Empirical Estimation of Near-Surface Air Temperature in China from MODIS LST Data by Considering Physiographic Features. Remote Sens. 2016, 8, 629. [Google Scholar] [CrossRef]
- Feng, K.; Zhang, Y.; Tian, D.; Kang, J. A dataset of monthly temperature vegetation dryness index along the China–Pakistan Economic Corridor from 2000–2017. China Sci. Data 2019, 4, 97–111. [Google Scholar] [CrossRef]
- Webb, R.A. Use of the Boundary Line in the Analysis of Biological Data. J. Hortic. Sci. 1972, 47, 309–319. [Google Scholar] [CrossRef]
- Hao, R.; Yu, D.; Wu, J.; Guo, Q.; Liu, Y. Constraint line methods and the applications in ecology. Chin. J. Plant Ecol. 2016, 40, 1100–1109. [Google Scholar]
- Sandholt, I.; Rasmussen, K.; Andersen, J. A Simple Interpretation of the Surface Temperature/Vegetation Index Space for Assessment of Surface Moisture Status. Remote Sens. Environ. 2002, 79, 213–224. [Google Scholar] [CrossRef]
- Przeździecki, K.; Zawadzki, J.J. Triangle Method Modification with Second Degree Polynomial Edges Fitting in LST NDVI Scatterplot in Lignite Mine Influence Area. Remote Sens. Appl. Soc. Environ. 2020, 20, 100404. [Google Scholar] [CrossRef]
- Wu, L. Classification of Drought Grades Based on Temperature Vegetation Drought Index Using the MODIS Data. Res. Soil Water Conserv. 2017, 24, 130–135. [Google Scholar]
- Hamed, K.H. Trend Detection in Hydrologic Data: The Mann–Kendall Trend Test under the Scaling Hypothesis. J. Hydrol. 2008, 349, 350–363. [Google Scholar] [CrossRef]
- Cao, S.; He, Y.; Zhang, L.; Chen, Y.; Yang, W.; Yao, S.; Sun, Q. Spatiotemporal Characteristics of Drought and Its Impact on Vegetation in the Vegetation Region of Northwest China. Ecol. Indic. 2021, 133, 108420. [Google Scholar] [CrossRef]
- Samiei, S.; Alijanian, M. A comprehensive spatiotemporal and risk reduction drought assessment study utilizing SPEI index for Urmia Lake Basin, Iran. J. Hydrol. Reg. Stud. 2025, 58, 102203. [Google Scholar] [CrossRef]
- Yin, G.; He, W.; Liu, W.; Liu, X.; Xia, Y.; Zhang, H. Drought stress and its characteristics in China from 2001 to 2020 considering vegetation response and drought creep effect. J. Hydrol. Reg. Stud. 2024, 53, 101763. [Google Scholar] [CrossRef]
- Ma, Y.; He, T.; McVicar, T.R.; Liang, S.; Liu, T.; Peng, W.; Song, D.-X.; Tian, F. Quantifying how topography impacts vegetation indices at various spatial and temporal scales. Remote Sens. Environ. 2024, 312, 114311. [Google Scholar] [CrossRef]
- Zhao, W.; Duan, S.-B.; Li, A.; Yin, G. A practical method for reducing terrain effect on land surface temperature using random forest regression. Remote Sens. Environ. 2019, 221, 635–649. [Google Scholar] [CrossRef]
- Zhu, X.; Duan, S.-B.; Li, Z.-L.; Zhao, W.; Wu, H.; Leng, P.; Gao, M.; Zhou, X. Retrieval of Land Surface Temperature With Topographic Effect Correction From Landsat 8 Thermal Infrared Data in Mountainous Areas. IEEE Trans. Geosci. Remote Sens. 2021, 59, 6674–6687. [Google Scholar] [CrossRef]
- Liu, Y.; Kang, H.; Li, X. Characteristics of Drought-flood Abrupt Events During Growing Season in the Songhua River Basin. J. Appl. Meteorol. Sci. 2025, 36, 233–244. [Google Scholar]
- Sun, J.; Su, B.; Wang, D.; Huang, J.; Wang, B.; Dai, R.; Jiang, T. Temporospatial characteristics of drought-flood abrupt alteration events in China. Water Resour. Hydropower Eng. 2024, 55, 13–23. [Google Scholar]

| ITVDI Value Range | Soil/Vegetation Conditions | Degree of Drought |
|---|---|---|
| (0, 0.46) | Land surface wetting | Non-drought |
| [0.46, 0.57) | Normal soil moisture or dry air near land surface | Mild drought |
| [0.57, 0.76) | Soil surface drying, leaves drying and yellowing due to lack of water | Moderate drought |
| [0.76, 0.86) | Soil shows a dry layer, dry yellow leaves | Severe drought |
| [0.86, 1) | Drying out and death of surface plants | Extreme drought |
| Index | Advantages | Limitations | Characteristics | |
|---|---|---|---|---|
| Drought index based on meteorological stations | PDSI | Reflects soil moisture balance, superior for agricultural drought assessment. | Computationally intensive; slow response; poor regional portability. | Sparse spatial distribution, limited coverage, low timeliness. |
| scPDSI | Self-calibrating to climatic conditions; automated correction via station data. | Soil parameters are difficult to obtain; lacks real-time capability. | ||
| SPI | Simple computation; applicable across multiple timescales. | Ignore the evaporation effect; lag in drought response. | ||
| SPEI | Improves SPI by incorporating evapotranspiration stress. | Relies on empirical formulas for evapotranspiration; limited applicability in alpine zones. | ||
| Drought index based on remote sensing data | VCI | Directly reflects physiological vegetation stress; highly suitable for agriculture. | Sensitive to phenology and crop-type variations. | Rapid monitoring, high spatiotemporal resolution, broad coverage. |
| EVI | High sensitivity to vegetation dynamics; widely applicable. | The calculation is complex and relies on multi-band data; data availability and continuity are limited. | ||
| TVDI | Integrates vegetation–temperature data; clear physical basis; scalable for large areas. | Distorted in complex terrain; affected by mixed pixels. | ||
| ITVDI | Combines topographic correction and nonlinear fitting; suited for heterogeneous surfaces. | The statistical properties of the mean value may smooth out extreme fluctuations at short time scales, failing to identify abrupt changes in moisture conditions at decadal or weekly scales. | ||
Disclaimer/Publisher’s Note: The statements, opinions and data contained in all publications are solely those of the individual author(s) and contributor(s) and not of MDPI and/or the editor(s). MDPI and/or the editor(s) disclaim responsibility for any injury to people or property resulting from any ideas, methods, instructions or products referred to in the content. |
© 2025 by the authors. Licensee MDPI, Basel, Switzerland. This article is an open access article distributed under the terms and conditions of the Creative Commons Attribution (CC BY) license (https://creativecommons.org/licenses/by/4.0/).
Share and Cite
Zou, W.; Wang, J.; Li, C.; Yang, K.; Fetisov, D.; Jiang, J.; Liu, M.; Liu, Y. Spatiotemporal Analysis of Drought Variation from 2001 to 2023 in the China–Mongolia–Russia Transboundary Heilongjiang River Basin Based on ITVDI. Remote Sens. 2025, 17, 2366. https://doi.org/10.3390/rs17142366
Zou W, Wang J, Li C, Yang K, Fetisov D, Jiang J, Liu M, Liu Y. Spatiotemporal Analysis of Drought Variation from 2001 to 2023 in the China–Mongolia–Russia Transboundary Heilongjiang River Basin Based on ITVDI. Remote Sensing. 2025; 17(14):2366. https://doi.org/10.3390/rs17142366
Chicago/Turabian StyleZou, Weihao, Juanle Wang, Congrong Li, Keming Yang, Denis Fetisov, Jiawei Jiang, Meng Liu, and Yaping Liu. 2025. "Spatiotemporal Analysis of Drought Variation from 2001 to 2023 in the China–Mongolia–Russia Transboundary Heilongjiang River Basin Based on ITVDI" Remote Sensing 17, no. 14: 2366. https://doi.org/10.3390/rs17142366
APA StyleZou, W., Wang, J., Li, C., Yang, K., Fetisov, D., Jiang, J., Liu, M., & Liu, Y. (2025). Spatiotemporal Analysis of Drought Variation from 2001 to 2023 in the China–Mongolia–Russia Transboundary Heilongjiang River Basin Based on ITVDI. Remote Sensing, 17(14), 2366. https://doi.org/10.3390/rs17142366