Article

Spatiotemporal Dynamics and Driving Factors of Soil Wind Erosion in Inner Mongolia, China

1
College of Geographical Science, Inner Mongolia Normal University, Hohhot 010028, China
2
Institute of Forest Resource Information Techniques, Chinese Academy of Forestry, Beijing 100091, China
3
Key Laboratory of Forestry Remote Sensing and Information System, NFGA, Beijing 100091, China
4
College of Resources and Environment, University of Chinese Academy of Sciences, Beijing 100049, China
*
Author to whom correspondence should be addressed.
Remote Sens. 2025, 17(14), 2365; https://doi.org/10.3390/rs17142365
Submission received: 2 May 2025 / Revised: 8 June 2025 / Accepted: 8 July 2025 / Published: 9 July 2025

Abstract

Wind erosion poses a major threat to ecosystem stability and land productivity in arid and semi-arid regions. Accurate identification of its spatiotemporal dynamics and underlying driving mechanisms is a critical prerequisite for effective risk forecasting and targeted erosion control. This study applied the Revised Wind Erosion Equation (RWEQ) model to assess the spatial distribution, interannual variation, and seasonal dynamics of the Soil Wind Erosion Modulus (SWEM) across Inner Mongolia from 1990 to 2022. The GeoDetector model was further employed to quantify dominant drivers, key interactions, and high-risk zones via factor, interaction, and risk detection. The results showed that the average SWEM across the study period was 35.65 t·ha−1·yr−1 and showed a decreasing trend over time. However, localised increases were observed in the Horqin and Hulun Buir sandy lands and central grasslands. Wind erosion was most intense in spring (17.64 t·ha−1·yr−1) and weakest in summer (5.57 t·ha−1·yr−1). Gale days, NDVI, precipitation, and wind speed were identified as dominant drivers. Interaction detection revealed non-linear synergies between gale days and temperature (q = 0.40) and wind speed and temperature (q = 0.36), alongside a two-factor interaction between NDVI and precipitation (q = 0.19). Risk detection indicated that areas with gale days > 58, wind speed > 3.01 m/s, NDVI < 0.2, precipitation of 30.17–135.59 mm, and temperatures of 3.01–4.23 °C are highly erosion-prone. Management should prioritise these sensitive and intensifying areas by implementing site-specific strategies to enhance ecosystem resilience.

1. Introduction

Soil wind erosion is the process by which surface materials are detached, transported, and redeposited under the influence of wind. It is also a continuous and complex integrated physical–geographical process [1]. Globally, approximately 8.9 × 10⁴ km2 of degraded land is affected by wind erosion [2]. It removes fine soil particles [3], leading to nutrient depletion and reduced water-holding capacity [4], which ultimately accelerates land degradation [5] and desertification [6]. Moreover, the large amounts of suspended particulate matter generated during wind erosion are a major source of atmospheric aerosols that deteriorate air quality [7] and pose serious risks to human health [8].
An accurate quantification of erosion intensity is essential to control soil wind erosion and mitigate desertification [9]. Traditional methods of wind erosion assessment include field investigation [10] and wind-tunnel simulations [11]. Although these approaches offer high accuracy in estimating erosion intensity, they are often labour intensive, spatially limited, and insufficient for capturing the spatiotemporal heterogeneity of wind erosion [9]. To solve this problem, a series of wind erosion prediction models based on physical processes and expert experience have been developed, such as the Wind Erosion Prediction System [12], the Dynamic Model for Soil Wind Erosion [13], the Wind Erosion Assessment Model [14], and the Revised Wind Erosion Equation (RWEQ) model [15]. Among these, the RWEQ model has been widely used due to its high flexibility regarding parameter substitution, ease of data acquisition, and operational simplicity [16]. Ma [17] conducted a global meta-analysis on soil erosion studies and found that among commonly used wind erosion models, the RWEQ model exhibited the highest assessment accuracy. Originally developed and validated at meteorological stations in the United States, the RWEQ model has since been successfully applied in other regions, including South Africa [18], Central Asia [19], Mongolia [20], and China [21,22,23,24].
Quantitative evaluation of the spatiotemporal dynamics of wind erosion and its driving factors is essential to improve our understanding of erosion processes and provide a scientific basis for the development of effective windbreak and sand-fixation strategies [21]. Wind erosion is a complex process that is jointly driven by multiple factors, including climatic conditions, soil properties, and surface environmental features [25,26]. Near-surface wind speed, as a key climatic driver, strongly influences wind erosion by removing topsoil layers [27]. Temperature and precipitation affect both the stability of surface particles and the water–energy balance at the soil–atmosphere interface [18]. Human activities significantly alter wind erosion processes by modifying surface conditions [23]. For instance, agricultural management practices such as cultivation and land abandonment can exert either positive or negative effects on erosion by changing vegetation cover, soil physicochemical properties, and microtopography [28]. In previous studies on wind erosion in Inner Mongolia, influencing factors and mechanisms have often been analysed using conventional statistical methods. For example, Zhang et al. [23] evaluated the impact of climate change and human activities on soil wind erosion in Inner Mongolia through correlation analysis. Hoffmann et al. [29] identified extreme wind erosion zones in Inner Mongolia using a wind erosion index and concluded that aridification trends and vegetation decline were the primary contributors to rising erosion risk. Lyu et al. [30] simulated wind erosion in the Xilingol steppe using the RWEQ model and revealed key climatic drivers and ecological service losses, providing targeted recommendations for sustainable grassland management. Zhou et al. [31] developed a multi-factor wind erosion estimation model integrating remote sensing and GIS, and revealed that from 1985 to 2011, wind erosion in Inner Mongolia exhibited a southwest–northeast spatial differentiation pattern, driven jointly by natural surface features and vegetation coverage. However, such linear approaches often overlook the complex nonlinear interactions among driving factors, resulting in a high degree of uncertainty in the analytical outcomes [8]. Wind erosion is jointly driven by multiple natural and anthropogenic factors in a nonlinear and spatially heterogeneous manner. However, the identification and quantitative analysis of these complex relationships remain insufficient. Wang et al. [32] proposed the GeoDetector model, which does not require linear assumptions between variables and can quantitatively reveal the underlying mechanisms of spatial variation in dependent variables based on intra-region consistency and inter-region heterogeneity [33]. This approach not only identifies dominant driving factors, but also detects interaction enhancement effects and spatial risk features among different drivers [34]. At present, the GeoDetector model has been widely applied in studies on ecosystem services [35], land-use change [36], and environmental change [37], and has demonstrated a strong adaptability and explanatory power across diverse research domains.
Inner Mongolia, located in the interior of the Eurasian continent, is one of the largest arid and semi-arid regions globally. It also serves as a critical ecological security barrier and functional zone in northern China [38]. The region is characterised by an extensive distribution of deserts and sandy lands, fragile ecosystems, and frequent, high-intensity wind erosion processes that pose serious threats to regional ecological security and sustainable development [39,40]. However, a systematic understanding of the spatiotemporal evolution of large-scale soil wind erosion and its driving mechanisms in Inner Mongolia remains limited. Few studies have quantitatively identified the dominant factors or explored the interactive mechanisms among multiple drivers of wind erosion. To address these gaps, the present study integrates the RWEQ model with the GeoDetector method to (1) characterise the spatiotemporal dynamics of the Soil Wind Erosion Modulus (SWEM) from 1990 to 2022, including its spatial distribution, interannual variation, and seasonal dynamics; (2) quantitatively assess the dominant factors, interaction effects, and high-risk thresholds of SWEM; (3) investigate the drivers underlying wind erosion by exploring the coupling relationships between SWEM and key natural factors and to provide scientific and site-specific management strategies for regional land and ecosystem management. We hypothesise that (i) wind erosion intensity has shown a declining trend from 1990 to 2022; and (ii) this change is primarily attributable to enhanced vegetation coverage associated with large-scale ecological restoration projects and changing climatic conditions.

2. Materials and Methods
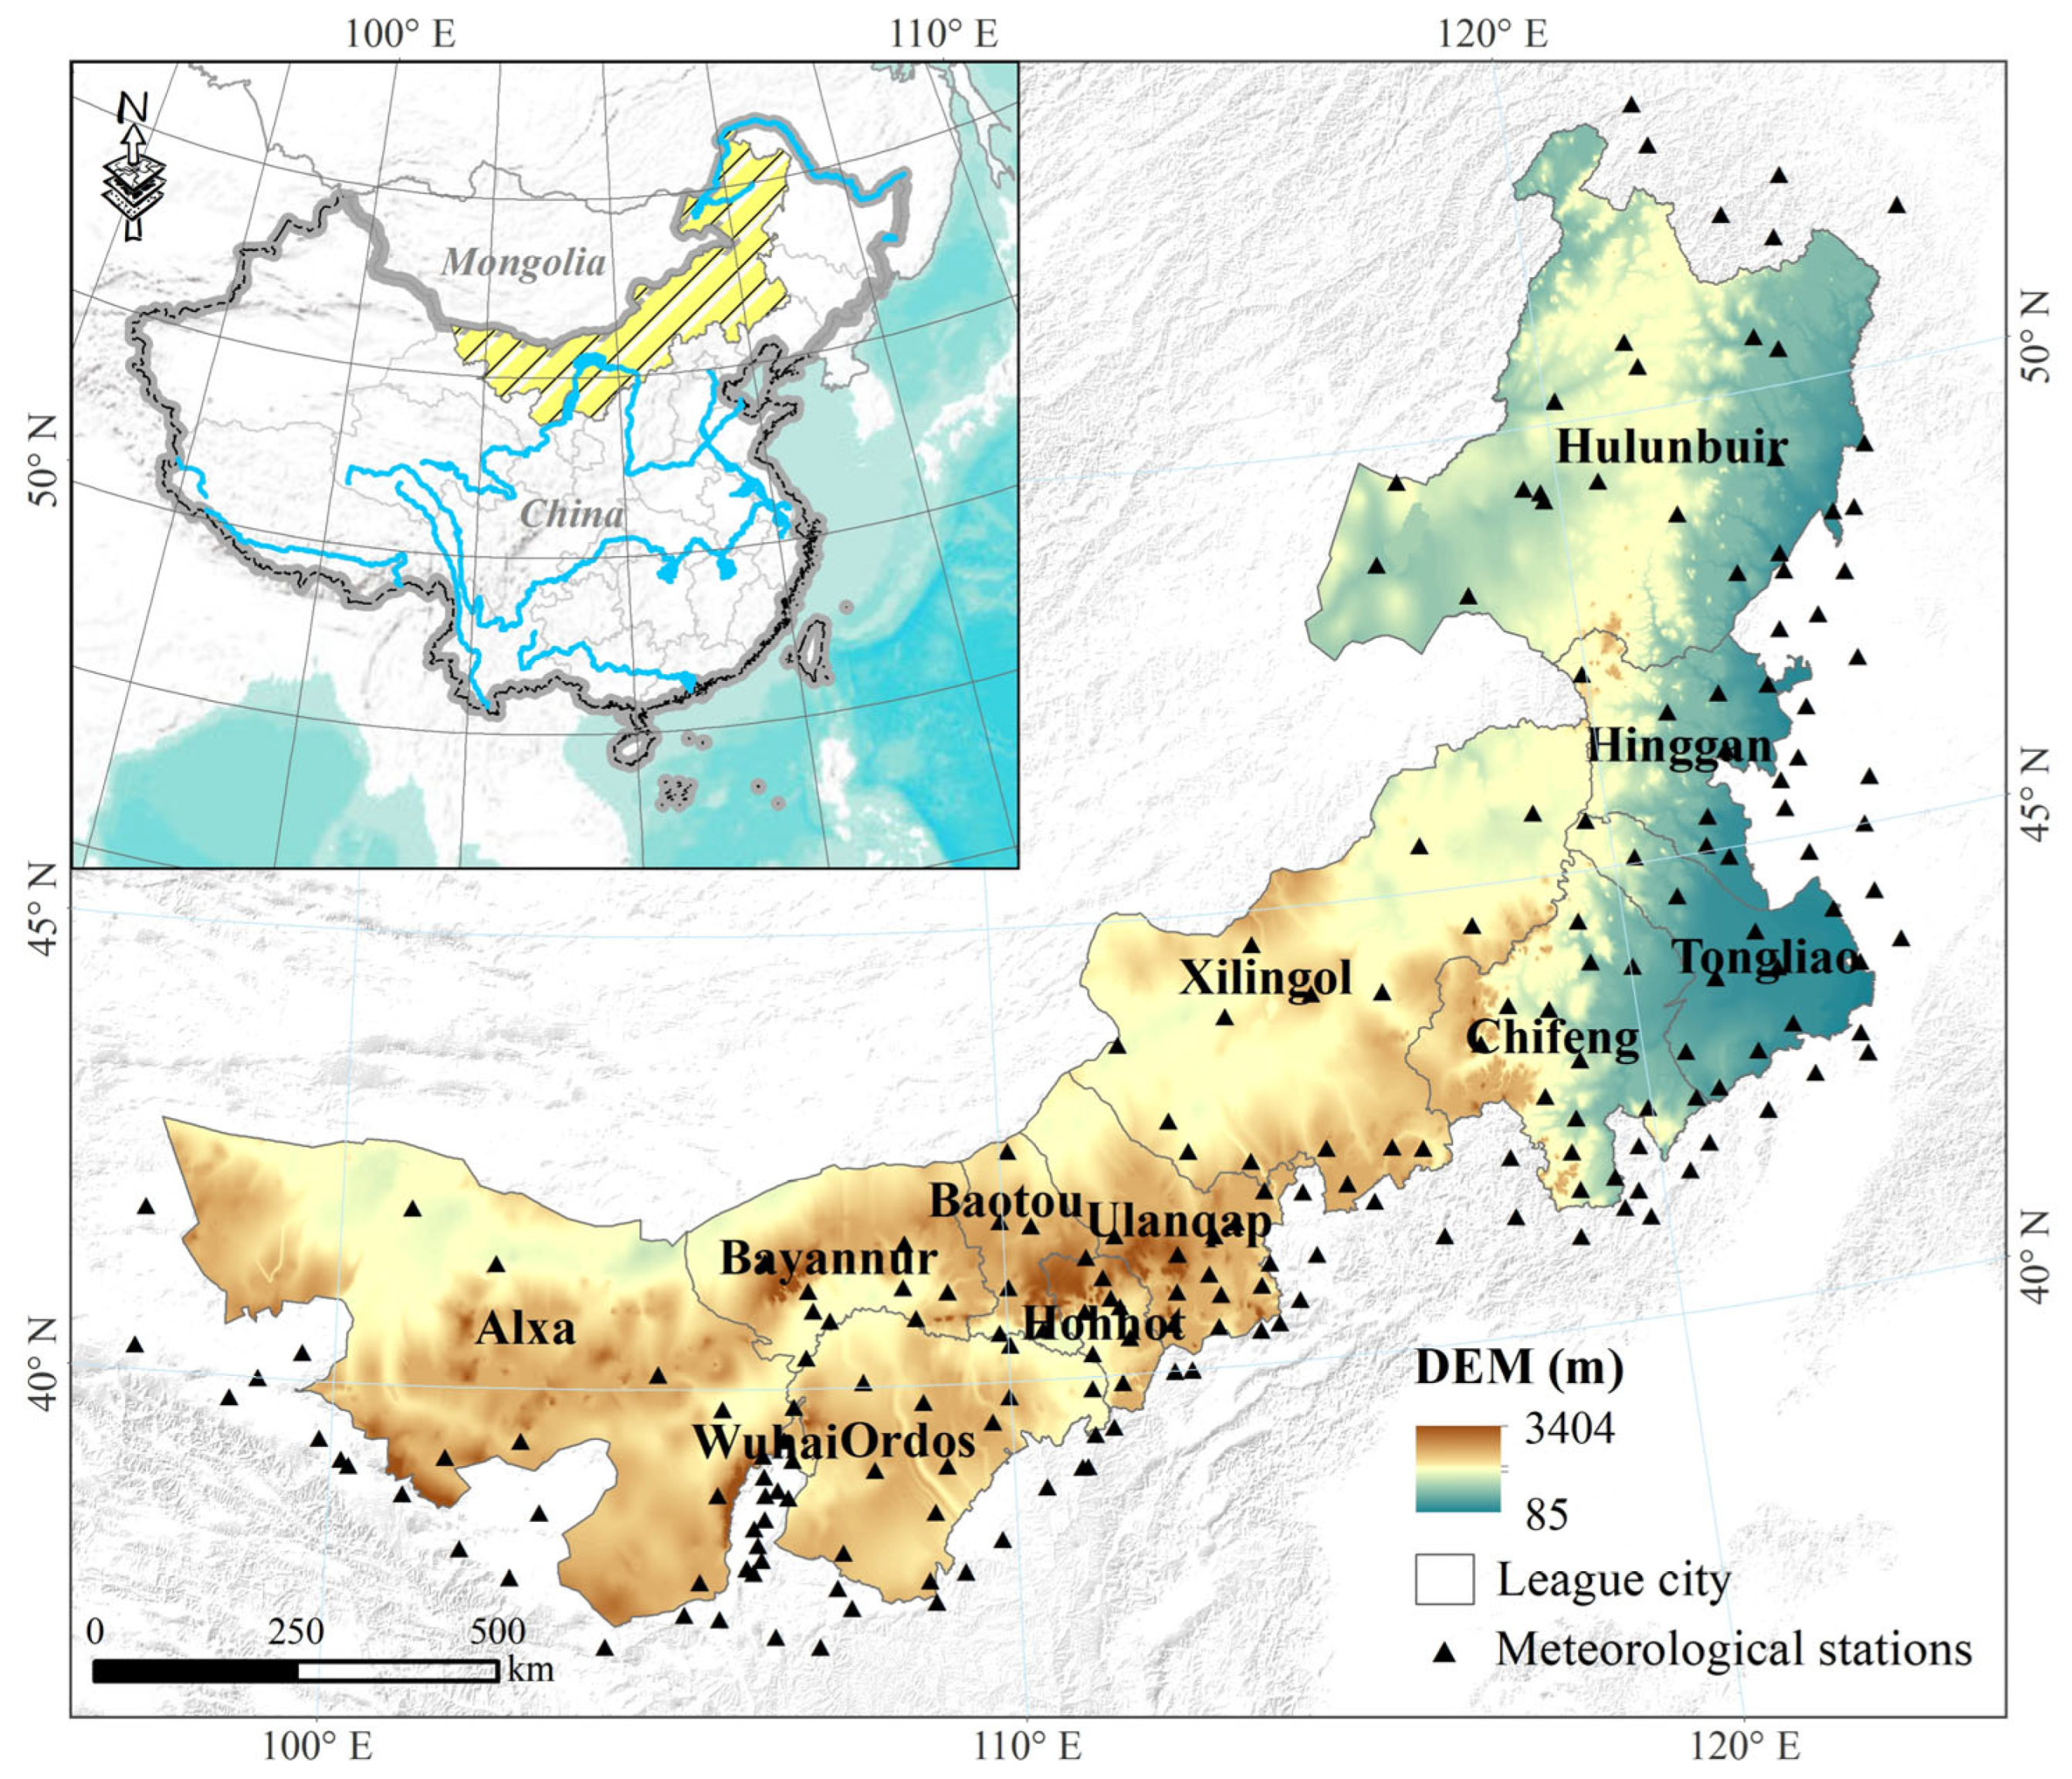
2.1. Study Area

Inner Mongolia, covering an area of approximately 1.18 × 10⁶ km2, is located in northern China (34°24′–53°23′N, 97°12′–126°04′E) and consists of 12 prefecture-level administrative divisions (leagues and cities) (Figure 1). The region is predominantly a plateau, with its average elevation exceeding 1000 m. It has a predominantly temperate continental monsoon climate, characterised by cold winters, hot summers, and large diurnal temperature variations. Meteorological records from 1990 to 2022 indicate that the annual average temperature ranges from 1.3 to 11.1 °C and decreases gradually from the southwest to the northeast. The annual precipitation ranges from 33.5 to 543.6 mm and increases from the southwest to the northeast. The annual average wind speed is approximately 2.7–3.1 m/s, with maximum wind speeds reaching up to 17 m/s. It has a variety of soil types, including aeolian sandy, dark brown, black, brown, chestnut grey-brown desert, and grey-brown desert soil. Most of these soils have a loose texture and are highly susceptible to wind erosion [41]. Over 70% of the region is covered by natural ecological areas such as grasslands, forests, and wetlands that serve as vital ecological barriers against the northwest wind and sand.
Inner Mongolia is one of the regions that has been affected most severely by ecological degradation and soil erosion in China, owing to the prolonged human activities in the area, such as overgrazing and agricultural reclamation, coupled with natural factors such as arid climate and frequent strong winds [9]. Therefore, a thorough investigation of the spatiotemporal distribution patterns and driving factors of wind erosion in this region is of significant theoretical and practical value for regional soil and water conservation and desertification control.

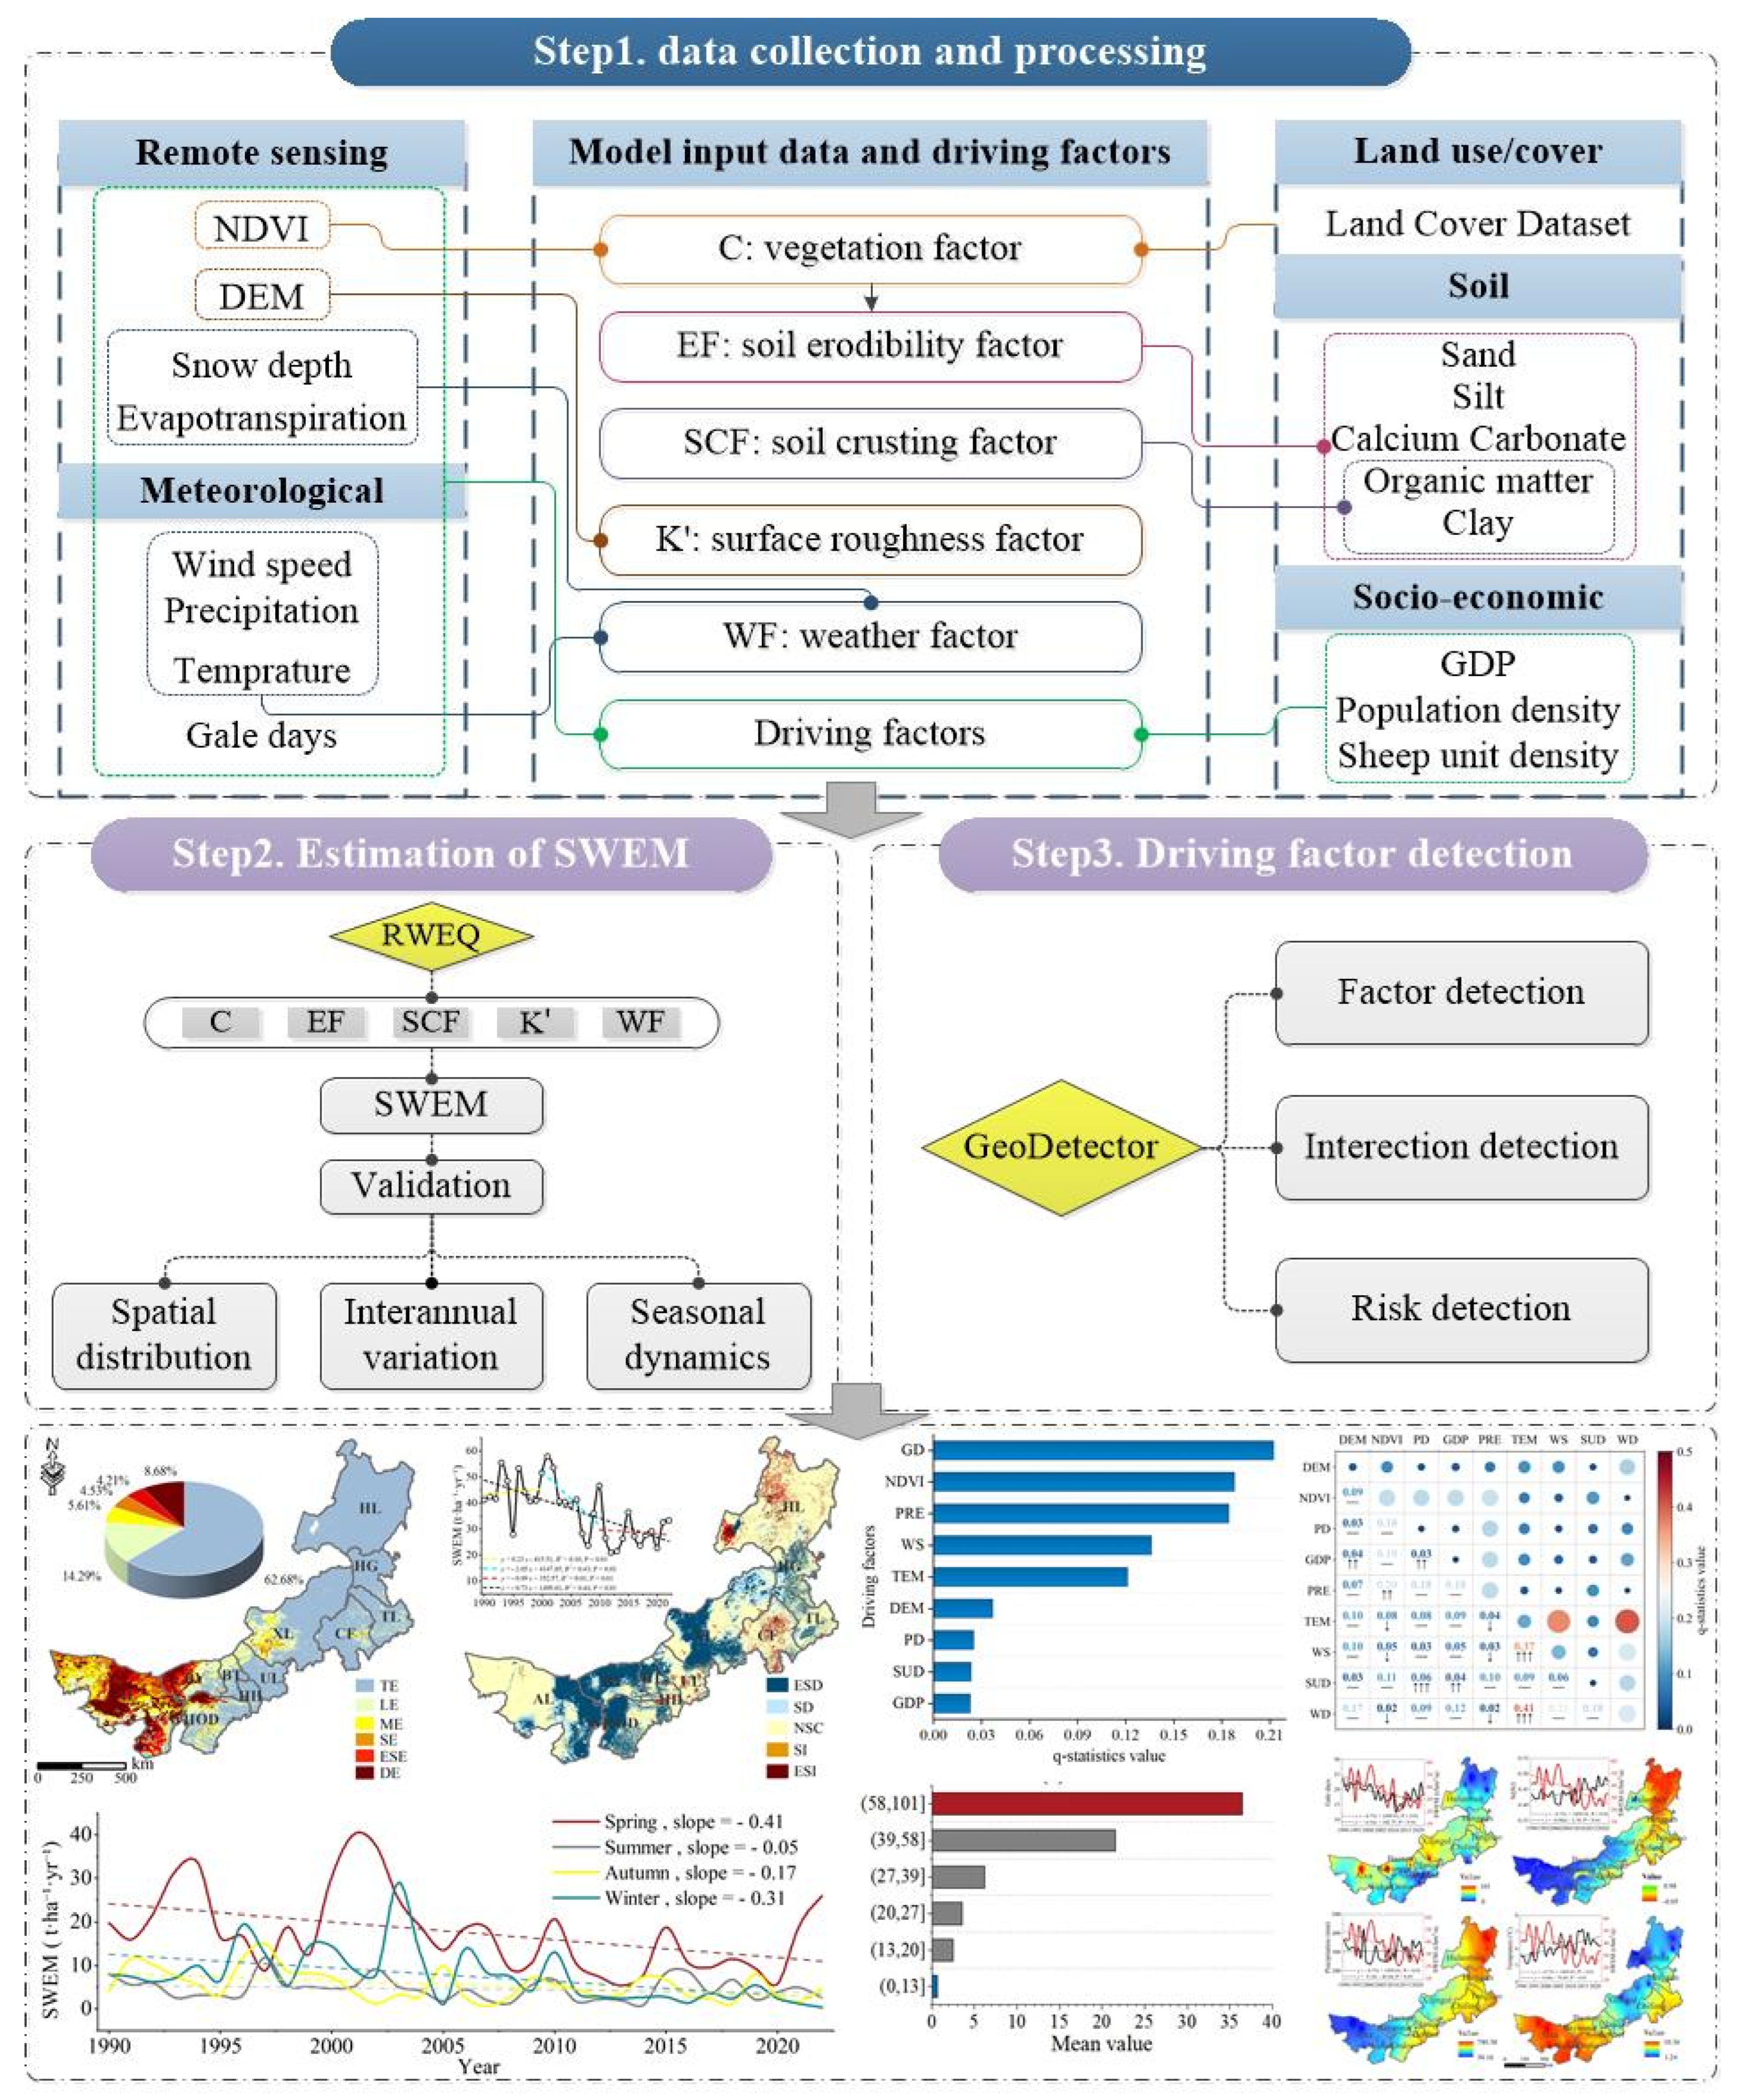
2.2. Data Collection and Processing

The data used in this study include both model input data and driving factors data, which are categorised into five groups, as detailed in Table 1.
Meteorological data, such as daily average wind speed, temperature, and precipitation, collected from 205 stations located within and around the study area were selected as input variables for the model. Wind speed was adjusted to a 2-m height value using Elliott’s [42] “seventh-power law”. Gale days refer to the number of days with wind speeds > 5 m/s. These data were then interpolated using the ArcGIS 10.8 software to generate a spatial dataset with a long-term time series.
The soil data were obtained from the World Soil Database (IPCC default soil classes derived from the Harmonized World Soil Database, version 1.2), which includes information on soil types, calcium carbonate content, organic matter content, sand, silt, clay content, and soil layer thickness.
Land-use data were obtained from the annual China Land Cover Dataset (CLCD) produced by Wuhan University [43]. The CLCD has an overall accuracy of 79.31%, and evaluations based on third-party tests show that its overall precision surpasses that of the ESACCI_LC, MCD12Q1, GlobeL30, and FROM_GLC104 datasets [43]. Based on the actual conditions in Inner Mongolia, the land-use types were reclassified into four categories: grassland, barren, forest (including shrub), and cropland. These reclassified land-use data were further used to calculate the vegetation coverage factor.
The remote sensing data included snow depth, potential evapotranspiration, DEM, and NDVI. The NDVI data were processed using the MODIS Reprojection Tool (MRT) for projection and format conversion, with maximum value compositing applied to obtain annual data.
The total livestock population was calculated as the sum of the number of sheep at the end of the year and the number of large livestock (including cattle, horses, donkeys, mules, and camels). Large livestock were converted to sheep units at a rate of five sheep per head [44] and were then allocated to the corresponding grassland for the relevant year during the rasterisation process.
In this study, all spatial datasets were uniformly resampled to a spatial resolution of 1 km × 1 km (with a grid size of 2498 rows × 1927 columns) using ArcGIS 10.8, and reprojected to the WGS_1984_Albers coordinate system to ensure spatial registration consistency and the accuracy of subsequent spatial analyses.

2.3. Methods

The present study developed an integrated wind erosion assessment framework based on multi-source data, incorporating remote sensing, meteorological, soil, and socioeconomic information to extract key driving factors. The RWEQ model was employed to simulate the SWEM from 1990 to 2022, capturing its spatial distribution, interannual variation, and seasonal dynamics. In combination with the GeoDetector model, dominant drivers and their underlying mechanisms were identified through factor detection, interaction detection, and risk detection. The overall workflow and analytical procedures are illustrated in Figure 2.

2.3.1. Wind Erosion Evaluation by the RWEQ Model Change Trend

The RWEQ model was used to simulate SWEM in Inner Mongolia from 1990 to 2022. This model, developed by the United States Department of Agriculture (USDA), is designed to estimate soil loss (SL) from agricultural fields at a height of 2 m [10], which was calculated as follows:
S L = 2 z S 2 ×   Q m a x ×   e ( z S ) 2
S = 150.7 ( W F × E F × K × S C F × C ) 0.3711
Qmax= 109.8 × WF × EF × K′ × SCF × C
where SL is the actual soil wind erosion modulus (t·ha−1); z is the maximum distance to the downwind point of wind erosion and set to 50 m; S is the length of the critical area (m); Qmax refers to the maximum sand and dust transport capacity (kg/m); WF is the weather factor (kg/m); EF, K′, SCF, and C represent soil erodibility, surface roughness, soil crusting, and vegetation factors, respectively (dimensionless).
The WF represents the combined effect of meteorological factors such as temperature, precipitation, evapotranspiration, and wind speed on wind erosion and was calculated as follows:
W F = W f × ρ g S W × S D
W f = i = 1 N U 2 × ( U 2 U t ) × N d N
ρ = 348.0 × ( 1.013 0.1183 E L + 0.0048 E L 2 T )
S W = E T P ( R + I ) × R d N d E T P
SD = 1−P(snow depth > 25.4 mm)
where Wf denotes the wind factor (m3/s3); SW is the soil wetness factor (dimensionless); SD refers to the snow cover factor; g is the acceleration due to gravity (set to 9.8 m/s2); ρ is air density (set to 1.29 kg/m3); Ut is the threshold wind speed at a height of 2 m (set to 5 m/s); U2 refers to the monthly average wind speed at 2 m derived from meteorological station observations (m/s); Nd is the number of experimental days; N is the number of observations; EL is the elevation (km) obtained from DEM data; T is the absolute temperature (degrees Kelvin); ETp is the potential evapotranspiration (mm); R is the average precipitation (mm); I is the total irrigation (set to 0 mm); Rd is the number of rainfall days; and P is the probability of snow depth > 25.4 mm.
The EF and SCF represent the sensitivity of soil to erosion, defined by the following equations:
E F = 29.9 + 0.31 S a + 0.17 S i + 0.33 S a / C l 2.59 O M 0.95 C A C O 3 100
S C F = 1 1 + 0.0066 C l 2 + 0.021 O M 2
where EF is the soil erodibility factor; SCF is the soil crust factor; Sa, Si, Cl, OM, and CaCO3 refer to the sand content, silt content, clay content, organic matter content, and calcium carbonate content, respectively (%).
The K′ factor represents the degree of surface roughness caused by variations in terrain elevation, reflecting the undulating nature of the Earth’s surface. The calculation is as follows:
K = e ( 1.86 K r 2.41 K r 0.934 0.127 C r r )
K r = 0.2   × ( H ) 2 L
where Kr is the ridge/oriented roughness factor (cm); Crr is the aggregate/random roughness factor (cm), which is set to 0 in this study; L is the terrain undulation parameter (m); and ∆H is the elevation difference within the range of L (m).
The C factor reflects the vegetation coverage in different land-use units and represents the ability of vegetation to impede the movement of fine particles on the surface and is expressed as follows:
C = e α ( S C )
SC = (NDVINDVImim)/(NDVImaxNDVImin)
where α represents the coefficient for different vegetation use types, with its value determined according to the “Ecological Protection Red Line Demarcation Guidelines” as shown in Table 2. SC is the vegetation coverage (%); NDVImin is the NDVI value for bare land, corresponding to the cumulative frequency of 2%; NDVImax is the maximum NDVI value, corresponding to the cumulative frequency of 98%.

2.3.2. Classification of Soil Wind Erosion Intensity

According to the standard for “Classification criteria for soil erosion intensities” (SL190–2007) [45], the wind erosion intensity in the study area was categorised by six grades (Table 3).

2.3.3. Trend Analysis

A simple linear regression method was used to characterise the trend of SWEM changes in the study area from 1990 to 2022.
S l o p e = n × i = 1 n i × X i ( i = 1 n i ) ( i = 1 n X i ) n × i = 1 n i 2 ( i = 1 n i ) 2
where n is the total number of years in the monitoring period (n = 33) and Xi is the value of the analysis factors for year i. A positive slope indicates an upward trend, whereas a negative slope indicates a downward trend. The Mann–Kendall trend test was also applied to assess the statistical significance of the trend in each factor, with significance levels analysed at a 0.05 confidence level. Based on the test results, the trends were classified into five categories: extremely significant decrease (ESD; slope < 0, p < 0.01), significant decrease (SD; slope < 0, 0.01 ≤ p < 0.05), no significant change (NSC; p > 0.05), significant increase (SI; slope > 0, 0.01 ≤ p < 0.05), and extremely significant increase (ESI; slope > 0, p < 0.01).

2.3.4. Geographical Detector Model

This study applied the GeoDetector model proposed by Wang and Xu [46] to explore the spatial heterogeneity of SWEM and its driving factors. GeoDetector is a spatial statistical method that quantifies the influence of explanatory factors on spatial variation without assuming linearity or normality, based on the principle of stratified heterogeneity. In the present study, a custom Python implementation was developed to carry out the analysis, which comprised the following three core modules: factor detection, interaction detection, and risk detection.
  • 1. Factor detection. Factor detection is used to quantify the explanatory power of the driving factor (X) in the spatial variation of the response variable (Y), measured by the q value. The higher the q value, the more influential the driving factors are in explaining the variation [47]. All continuous driving factors were discretised prior to analysis. By iteratively searching for optimal breakpoints that maximise the q-statistic, each variable was divided into 4 to 9 categorical levels. The formula for calculating the q value is as follows:
    Q ( D H )     1 h = 1 L N h σ h 2 N σ 2
    where D represents a specific influencing factor, H is the SWEM, Q indicates the contribution of the influencing factor to the soil erosion modulus, with a range of [0–1]. N and σ2 denote the number of units and value factors, respectively; h is the stratification of SWEM, and L is the score of the influencing factor. The statistical significance of q values was evaluated using p values computed via the R geodetector package (version 1.0-0), with p < 0.05 indicating significance.
  • 2. Interaction detector. The interaction detector can identify whether there are interactions between different driving factors, as well as the linearity or nonlinearity, direction, and intensity of these interactions [46]. The classification of interaction types and corresponding interpretation criteria is presented in Table 4.
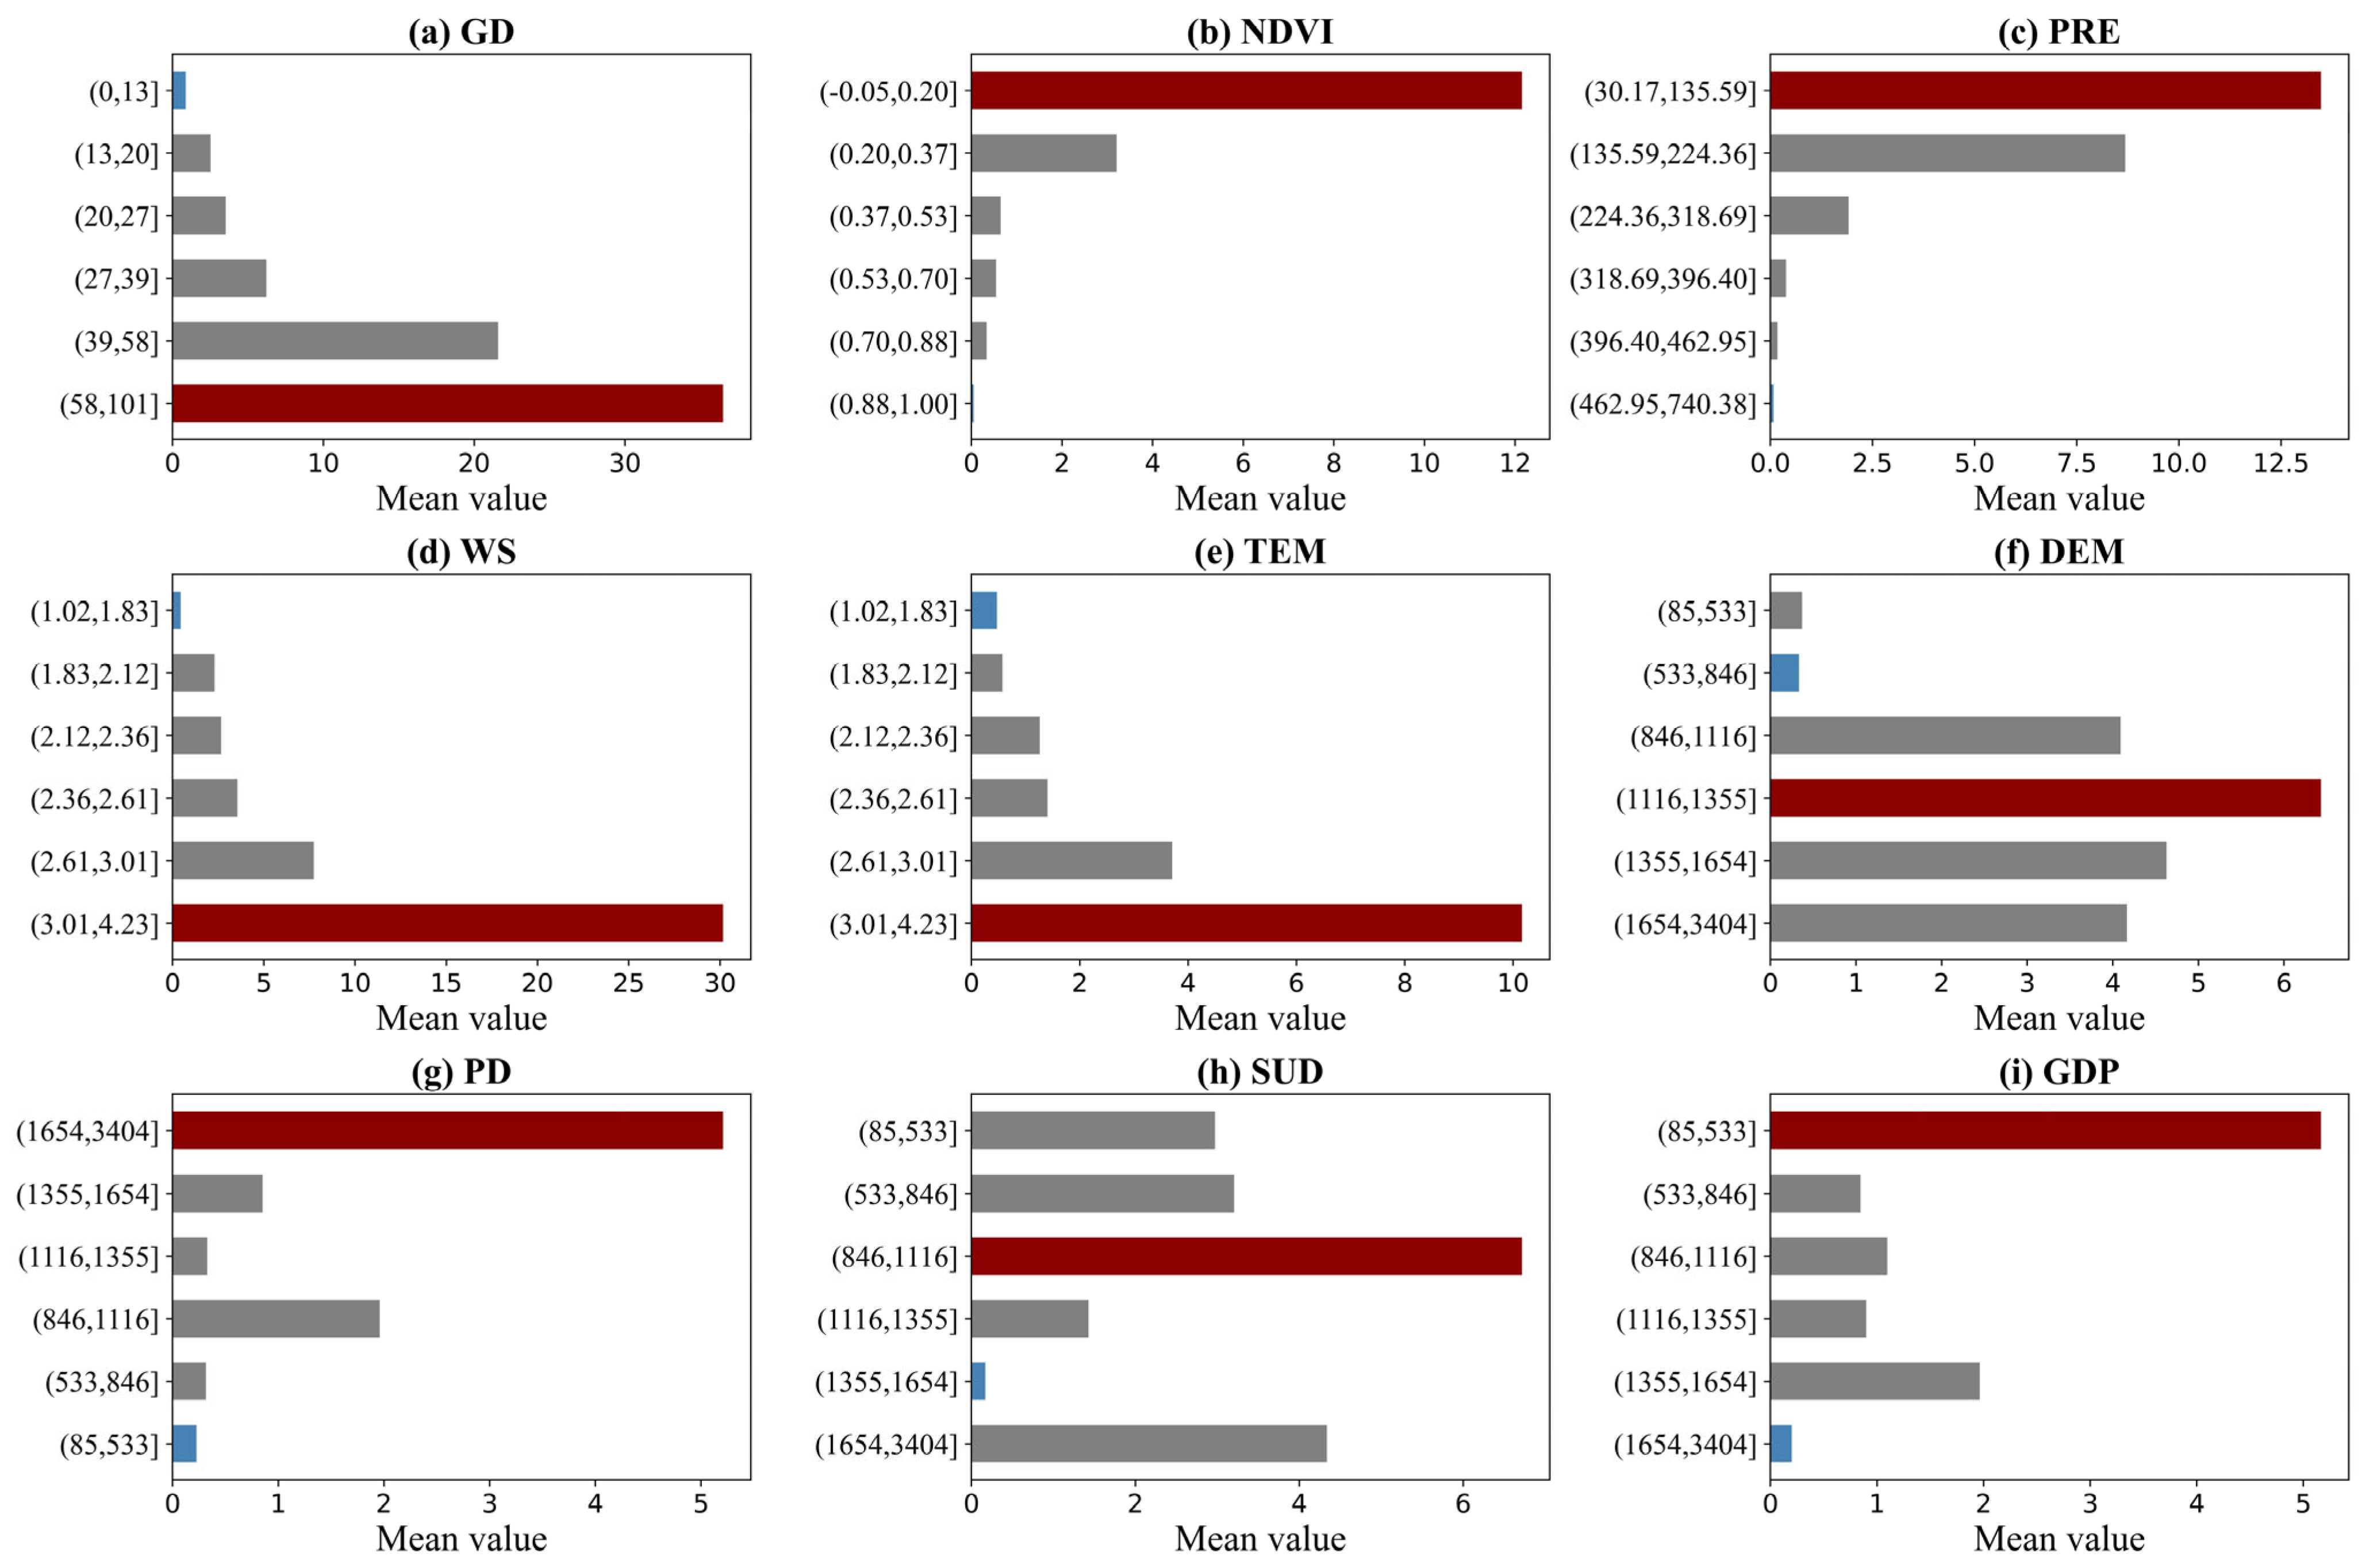
  • 3. Risk detector. The risk detector module further compares the mean value of SWEM under the different strata (intervals) of a given factor. It is used to identify the risk threshold ranges of each variable that contribute significantly to high erosion intensity.

3. Results

3.1. Accuracy Assessment of the RWEQ Model

Aeolian processes at the land surface are the primary source of dust particles in the atmosphere and largely determine the frequency and intensity of dust storms [22]. Due to the absence of long-term field measurements, dust storm records from meteorological stations were used as proxy indicators to validate the SWEM simulated by the RWEQ model [21]. From 2000 to 2020, the SWEM simulated by the RWEQ model exhibited an overall decreasing trend, which closely mirrored the interannual variations in dust storm frequencies. Both variables exhibited peak values in 2001 (Figure 3a). Regression analysis further revealed a statistically significant positive correlation between the annual frequency of dust storms and the interannual variation in the RWEQ-estimated SWEM (R2 = 0.75, p < 0.01) (Figure 3b). These results indicate that the RWEQ model can effectively capture the actual dynamics of wind erosion in the study area and demonstrate a high degree of reliability.

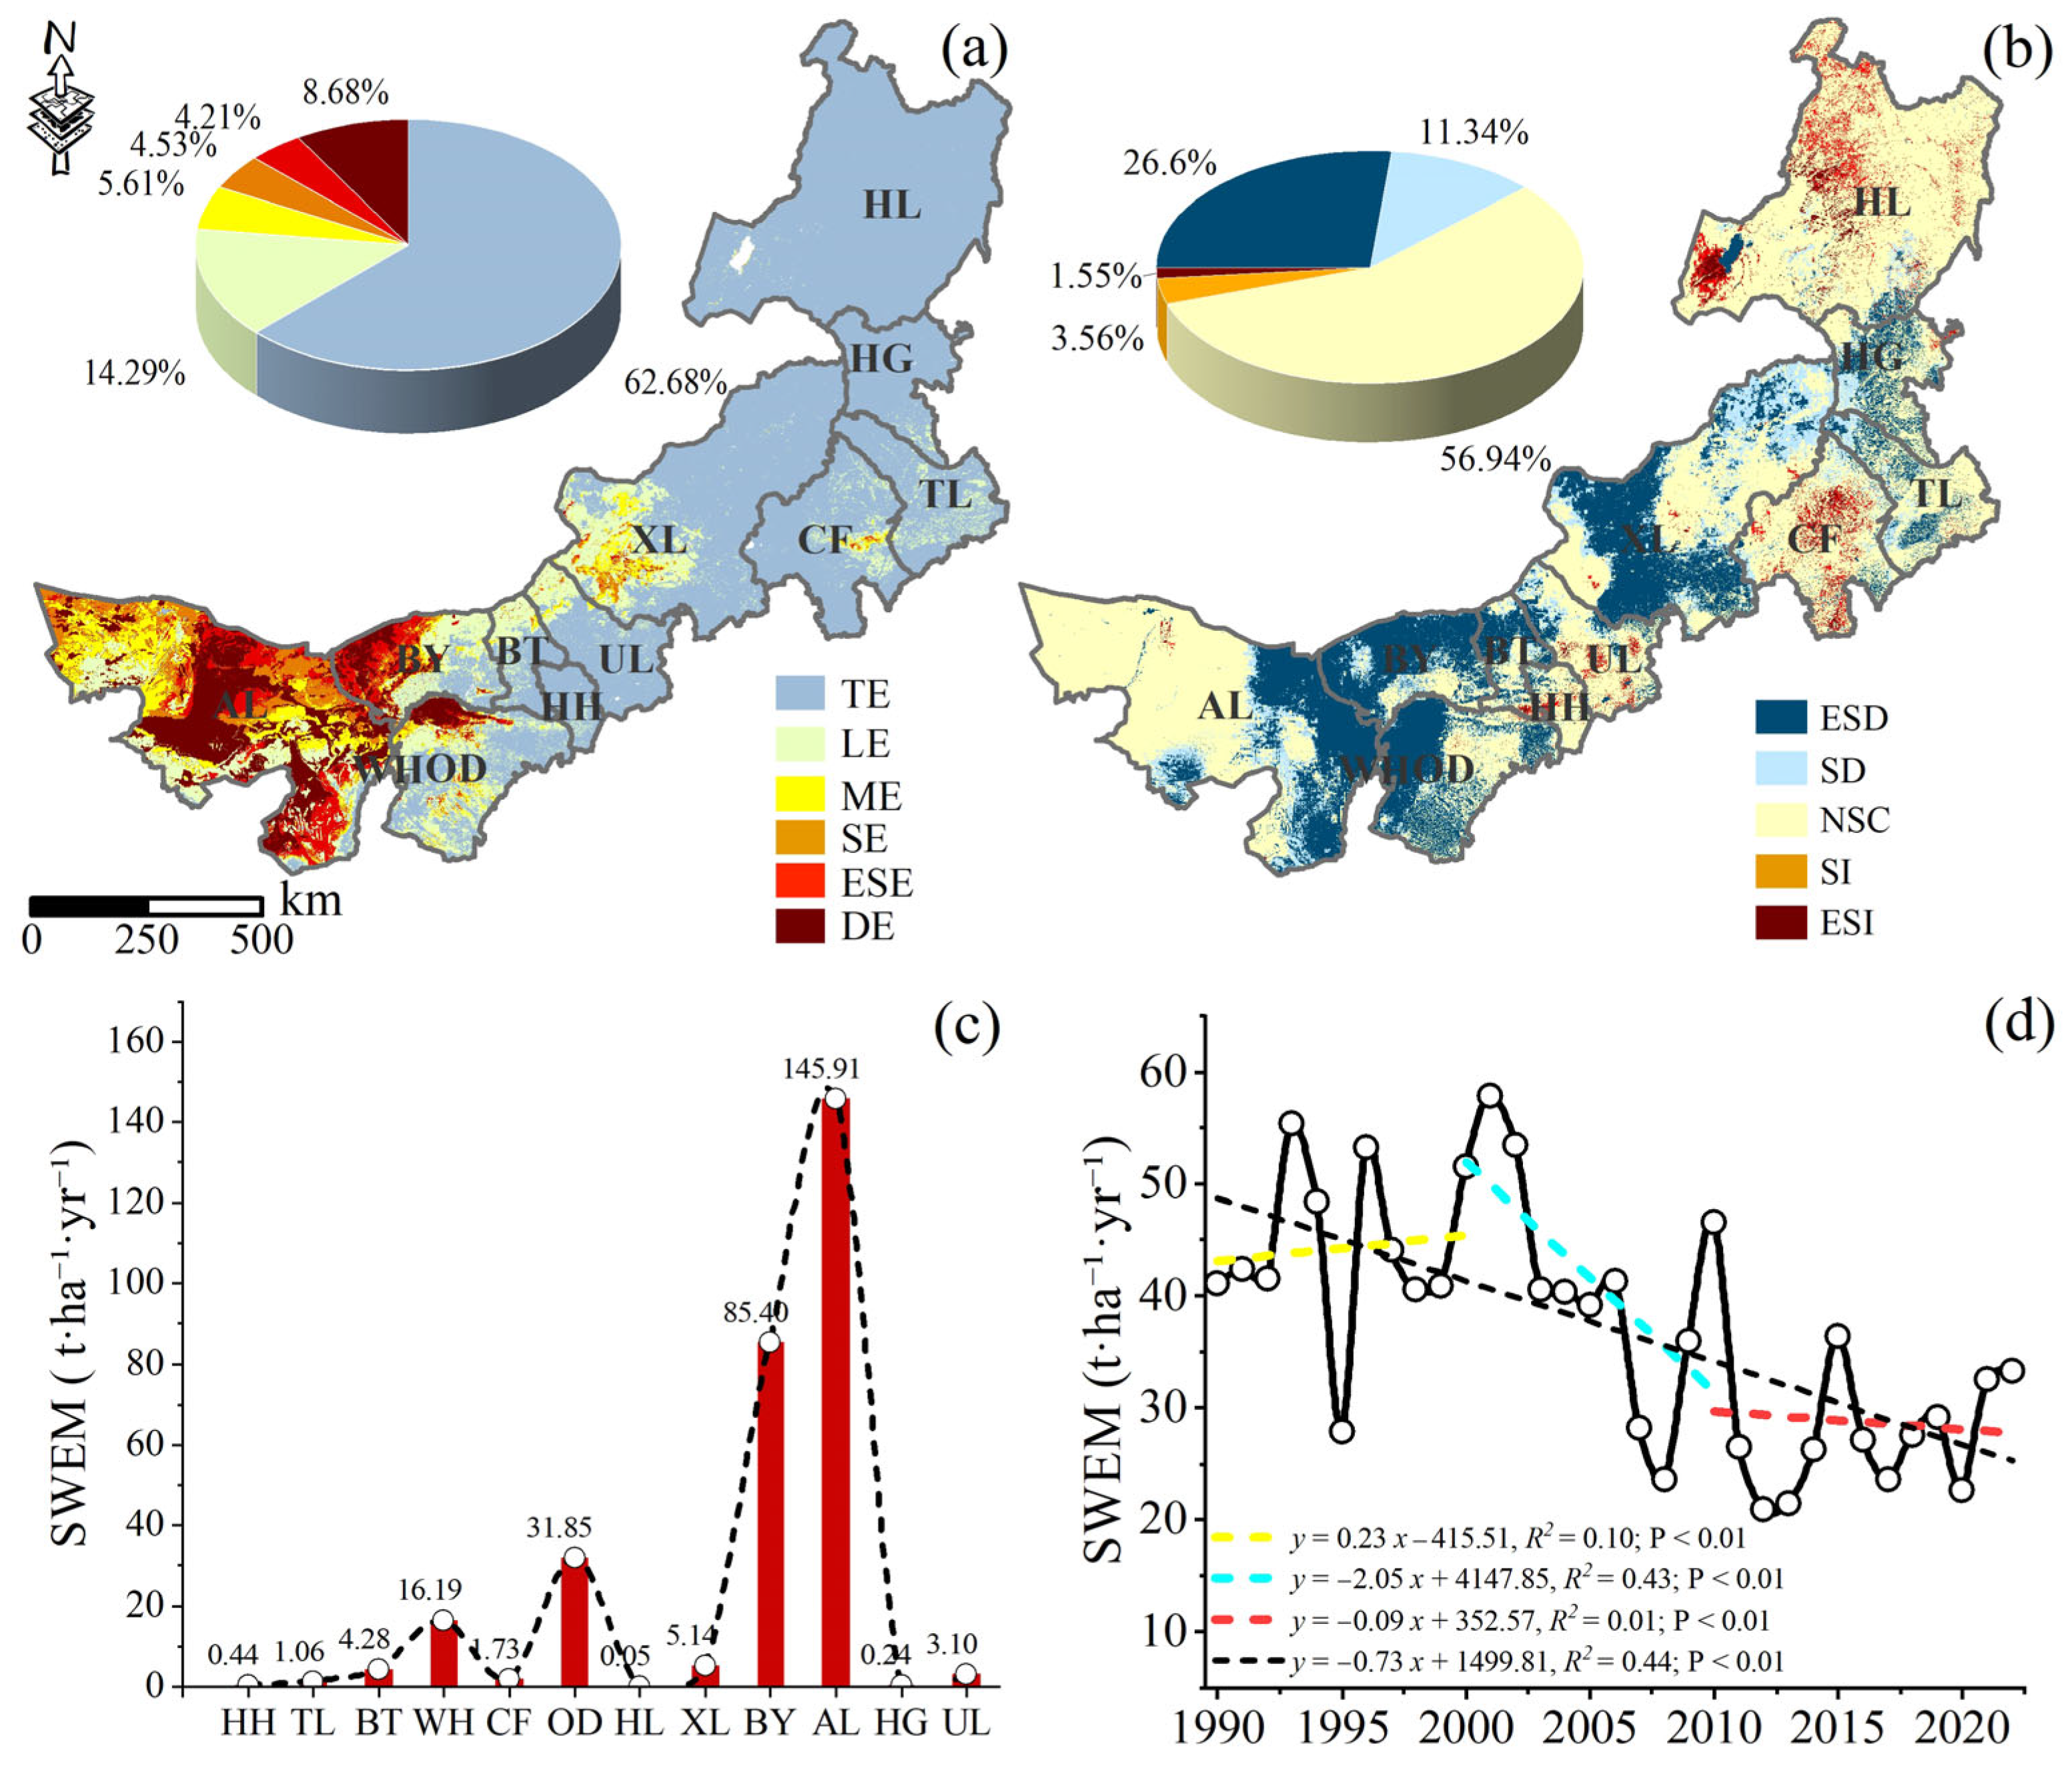
3.2. Spatiotemporal Variations of the SWEM

3.2.1. Annual Variations of the SWEM

The intensity of SWEM in the study area exhibited pronounced spatial heterogeneity, characterised by a general decreasing trend from the southwest to the northeast (Figure 4a). Our results show that TE was mainly distributed in the eastern forested regions and central grasslands, which accounted for 62.68% of the total study area, LE was primarily concentrated in the central-western grassland regions (14.29%), whereas ME are predominantly located in typical sandy areas, such as the Mu Us, Hunshandake, and the Horqin Sandy Land (5.61%). Areas with SE, ESE, and DE intensities collectively accounted for 17.42% of the study area, and were primarily distributed in the western deserts, sandy lands, and sparse grasslands. At the administrative unit level, there were significant differences in wind erosion intensities across regions (Figure 4c). In the western region, Alxa League recorded the highest annual SWEM (145.91 t·ha−1·yr−1) followed by BY (85.40 t·ha−1·yr−1), OD (31.85 t·ha−1·yr−1), and WH (16.19 t·ha−1·yr−1). These areas are predominantly located within arid desertification zones and experience high SWEM. In contrast, the central and eastern regions exhibited relatively low SWEM values; HH, HL, and HG recorded less than 1 t·ha−1·yr−1, which indicated minimal SWEM.
Temporally, the SWEM exhibited a generally decreasing trend with fluctuations from 1990 to 2022, with an overall decline rate of –0.73 t·ha−1·yr−1 (p < 0.01). Phase-specific variations were observed (Figure 4d): during the first stage (1990–2000), SWEM showed an increasing trend at a rate of 0.23 t·ha−1·yr−1 (p < 0.01); in contrast, the second (2001–2010) and third (2011–2022) stages experienced significant and slight declines, with rates of –2.05 (p < 0.01) and –0.09 t·ha−1·yr−1 (p < 0.01), respectively. The mean annual SWEM was 35.65 t·ha−1, with a maximum of 57.78 t·ha−1 in 2001 and a minimum of 18.87 t·ha−1 in 2012. Spatially, areas with ESD and SD trends, mainly distributed across the central-western desert zones, accounted for 37.94% of the study area. In contrast, areas with ESI and SI trends, primarily located in Hulun Buir and Horqin Sandy Land, and parts of central HH and UL, accounted for only 5.11% of the total area (Figure 4b).

3.2.2. Seasonal Variations of the SWEM

The spatial distribution pattern of seasonal wind erosion in Inner Mongolia generally mirrors that of the annual mean (Figure 5). However, the intensity of wind erosion varied markedly across seasons. Among the four seasons, wind erosion was most intense in spring (17.64 t·ha−1·yr−1), followed by winter (7.98 t·ha−1·yr−1), autumn (5.78 t·ha−1·yr−1), and summer (5.57 t·ha−1·yr−1), accounting for 49.48%, 22.38%, 16.21%, and 15.62% of the annual average SWEM (35.65 t·ha−1·yr−1), respectively. In terms of temporal trends (Figure 5a), SWEM exhibited a significant decreasing trend in spring (slope = −0.41, p < 0.05), autumn (slope = −0.17, p < 0.01), and winter (slope = −0.31, p < 0.01). In contrast, the trend in summer (slope = −0.05, p = 0.25) was not statistically significant.
Spatially, spring exhibited the highest SWEM and the widest spatial extent, with high-value areas mainly distributed along the northern edge of the Badain Jaran and northern Kubuqi deserts, and the northern part of the Hetao irrigation district (Figure 5b). Wind erosion in winter ranked second, with significant areas concentrated in the Ulan Buh and Kubuqi deserts (Figure 5c). In contrast, autumn and summer exhibit relatively lower average SWEM values, with wind erosion primarily concentrated in the western Badain Jaran and Kubuqi deserts, whose spatial extents were markedly smaller than those in spring and winter (Figure 5d,e).

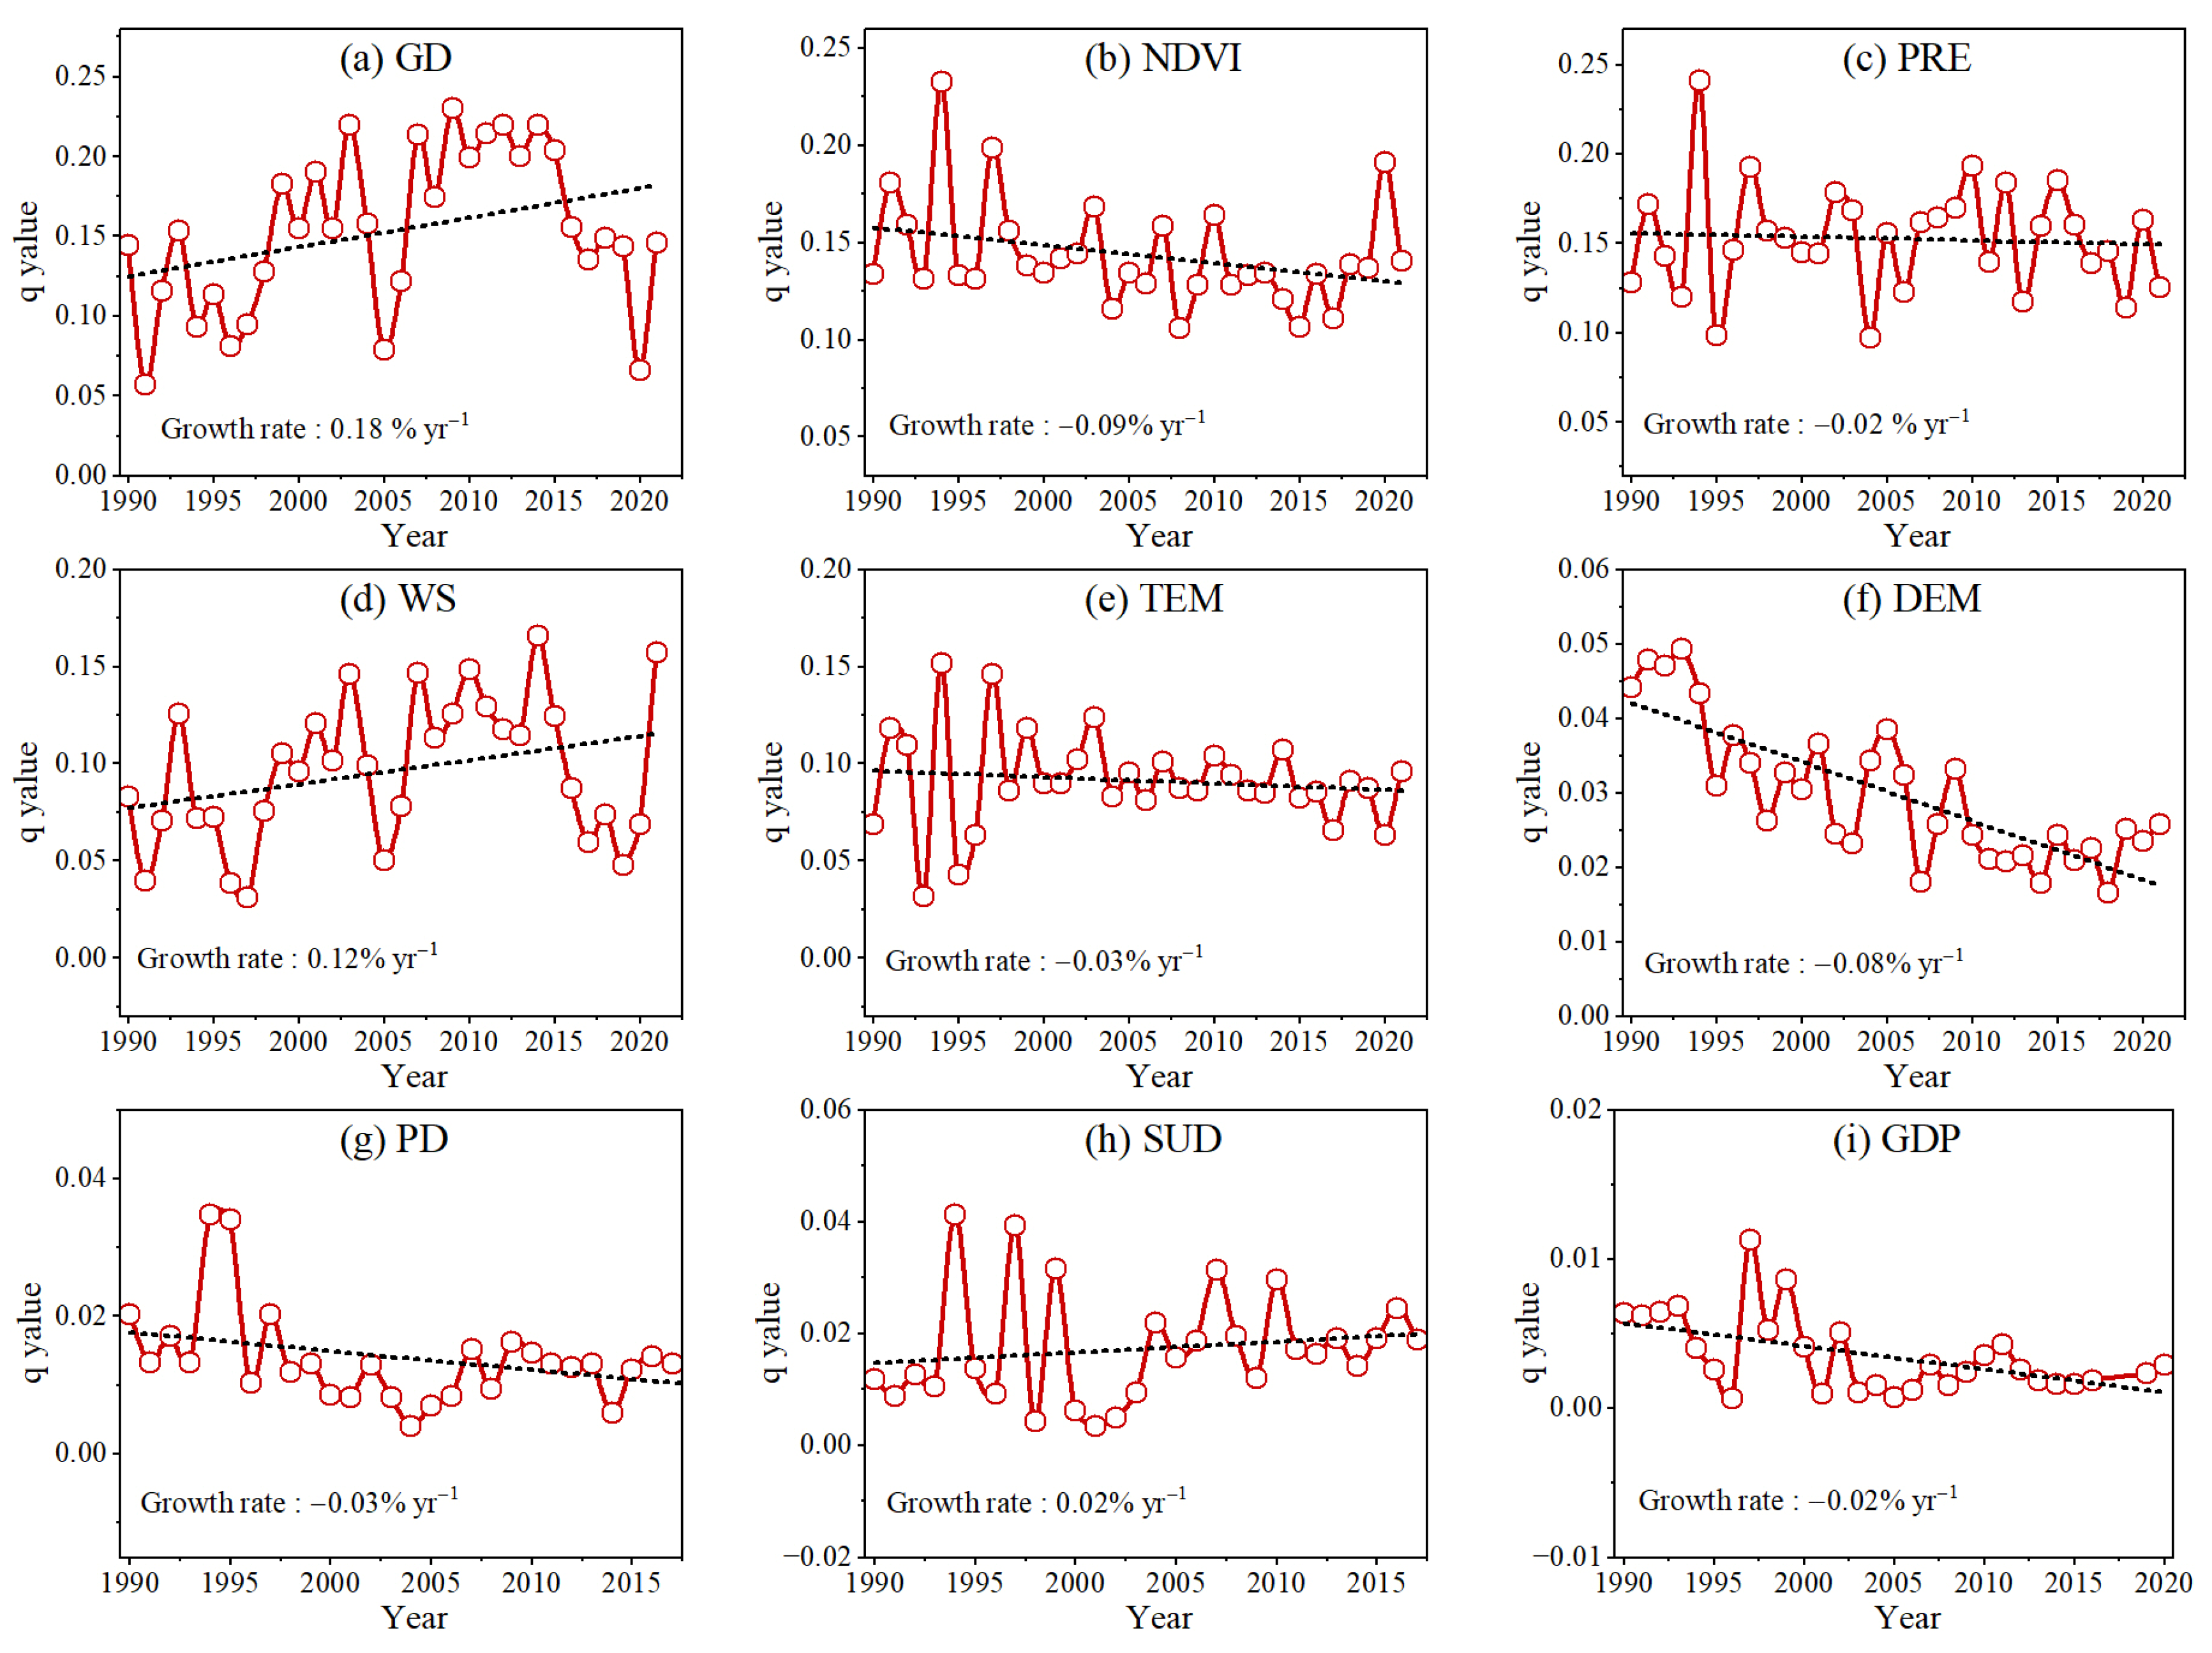
3.3. Analysis of Driving Factors Based on a GeoDetector Model

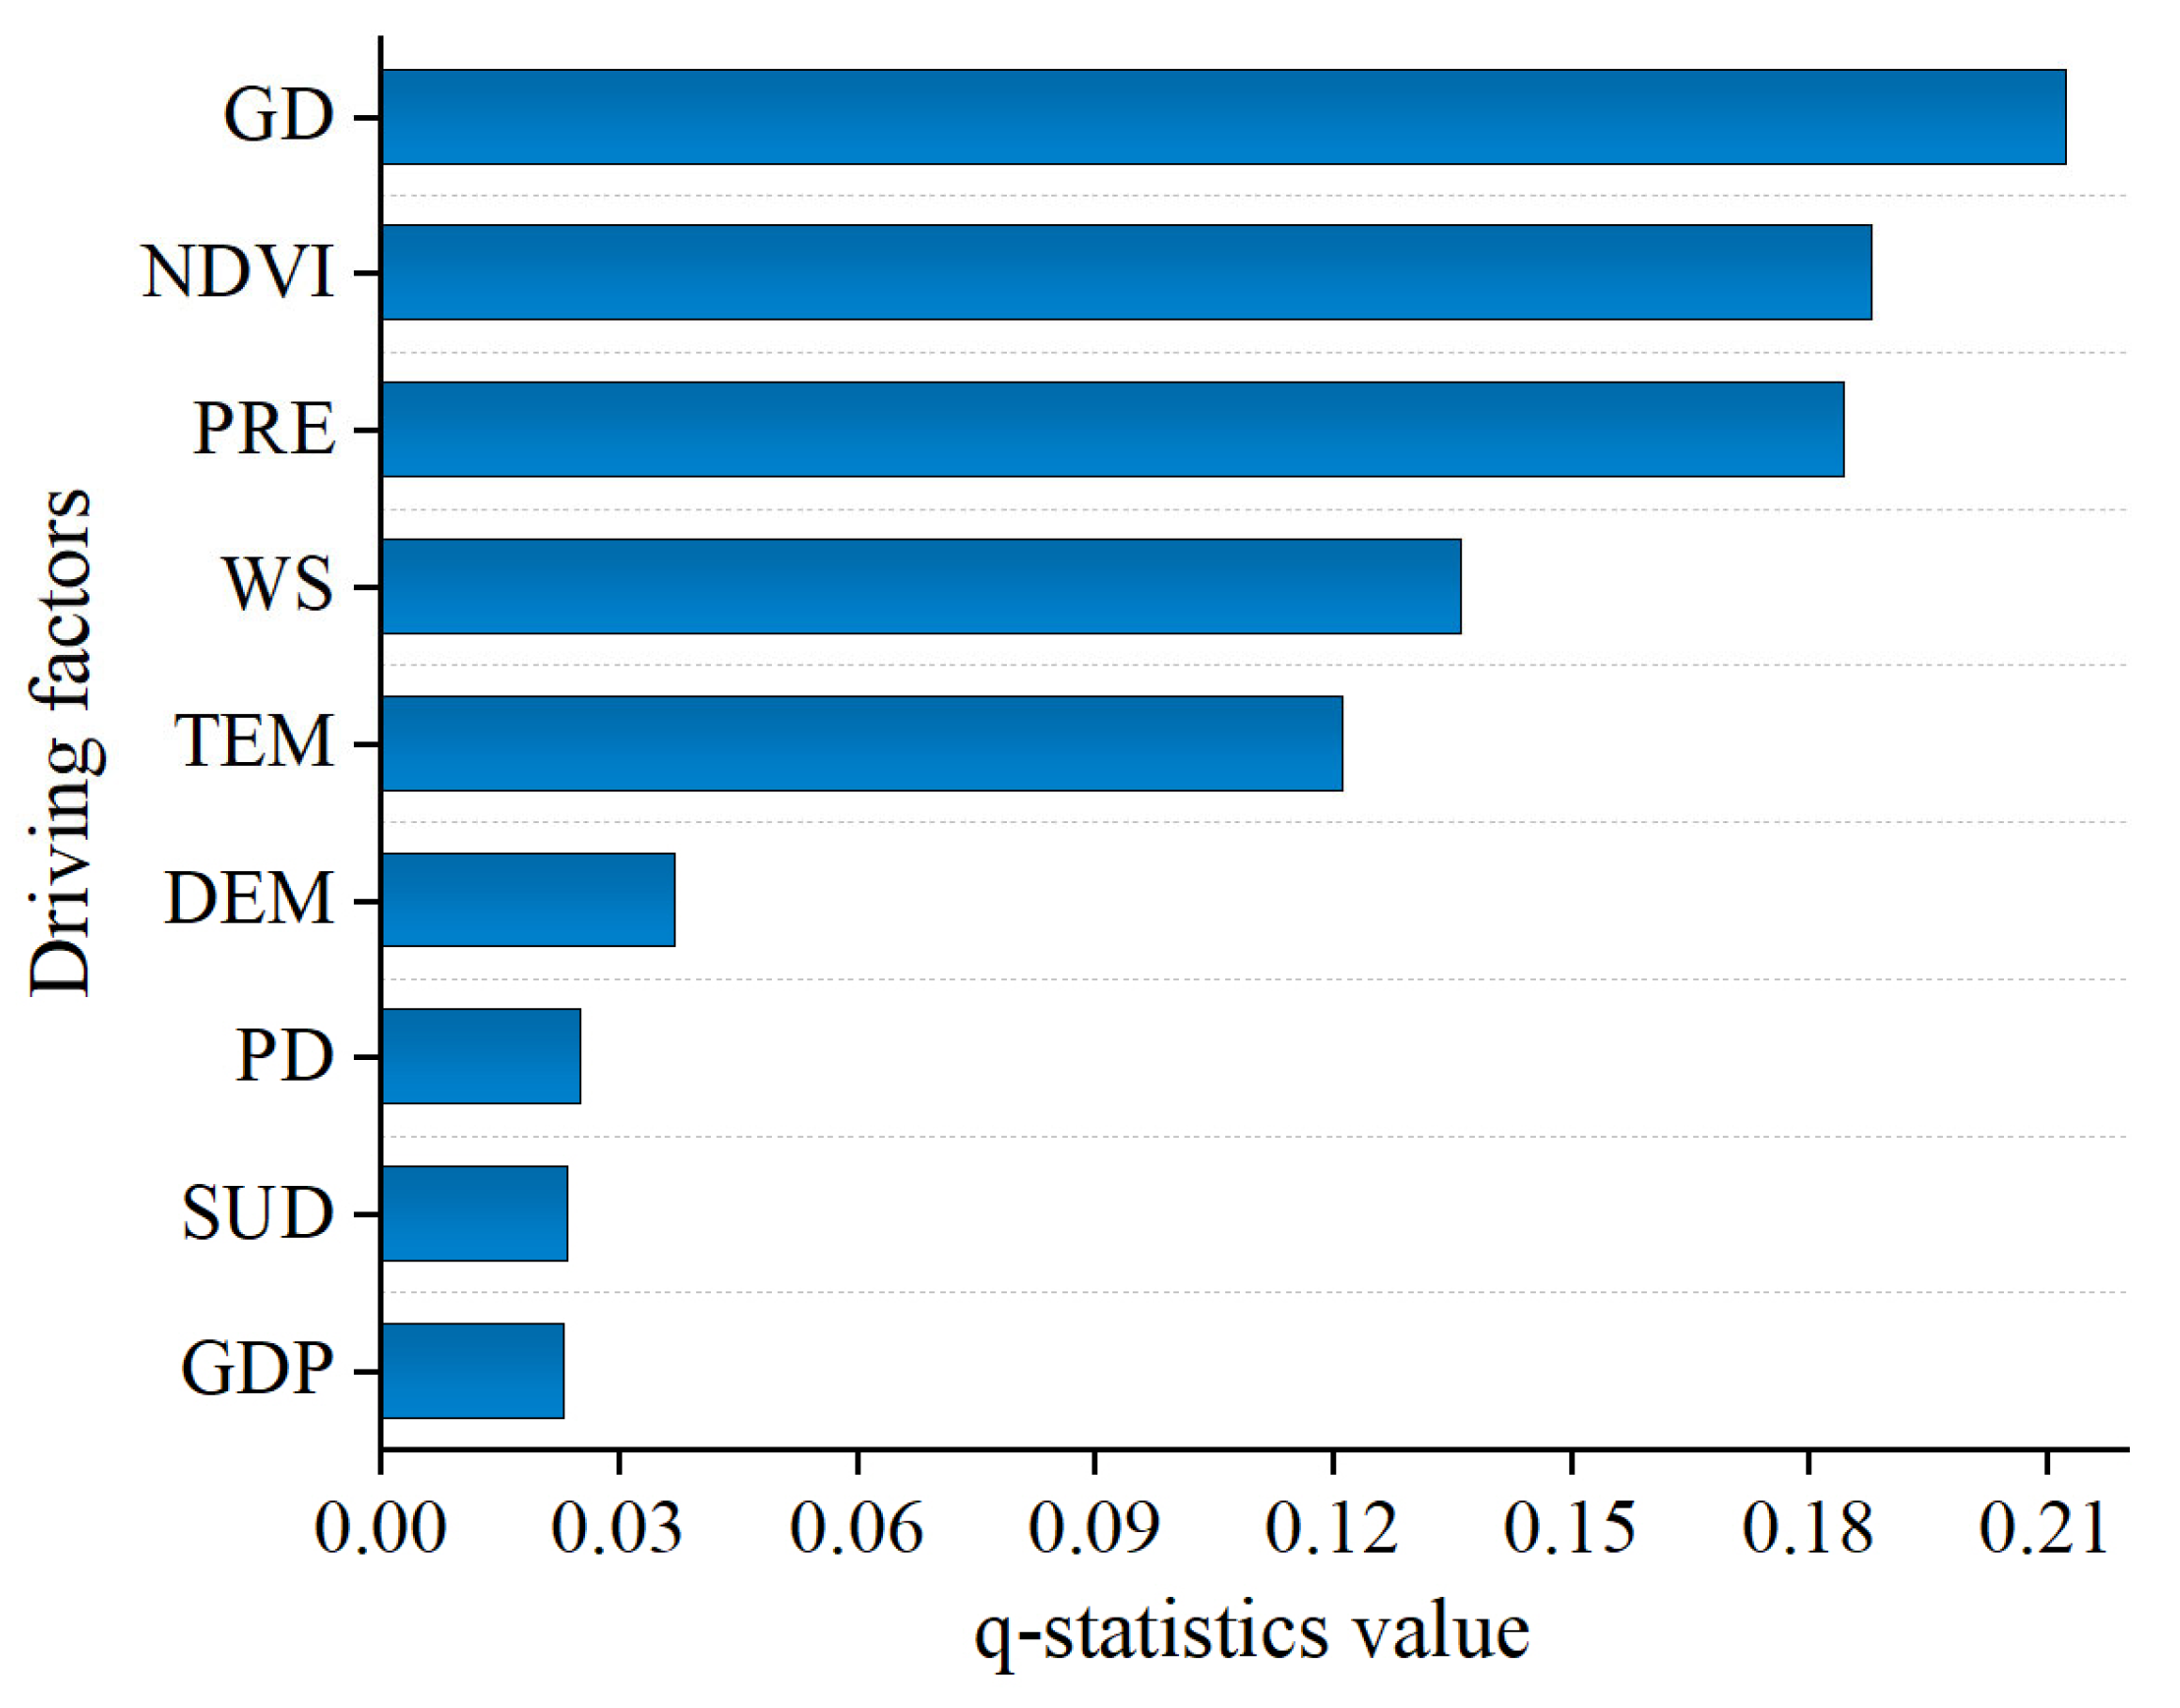
3.3.1. Factor Detection Analysis

To quantify the influence of various driving factors on the SWEM in the study area, the factor detector module of the GeoDetector model was applied to calculate the interannual explanatory power (q-values) of nine potential drivers for SWEM from 1990 to 2022 (Figure 6). The results revealed significant differences in the mean annual q-values across variables and were ranked in descending order as follows: GD (0.21) > NDVI (0.19) > PRE (0.18) > WS (0.14) > TEM (0.12) > DEM (0.04) > PD (0.03) > SUD (0.024) > GDP (0.023). The statistical significance of q-values was confirmed (p < 0.001 for all factors), as detailed in Table 5.
Regarding interannual dynamics, the q-values of GD, WS, and SUD showed increasing trends at rates of 0.18, 0.12, and 0.02% yr−1, respectively, indicating that their roles in wind erosion were gradually strengthening (Figure 7). In contrast, the explanatory power of NDVI, PRE, TEM, DEM, PD, and GDP showed declining trends, decreasing by 0.09 yr−1, 0.02 yr−1, 0.03% yr−1, 0.08% yr−1, 0.03% yr−1, and 0.02% yr−1, respectively. Overall, natural factors were identified as the primary drivers of wind erosion dynamics in Inner Mongolia. The explanatory power of wind-related variables such as GD and WS continued to increase, whereas the influence of anthropogenic factors (PD and GDP) remained relatively weak.

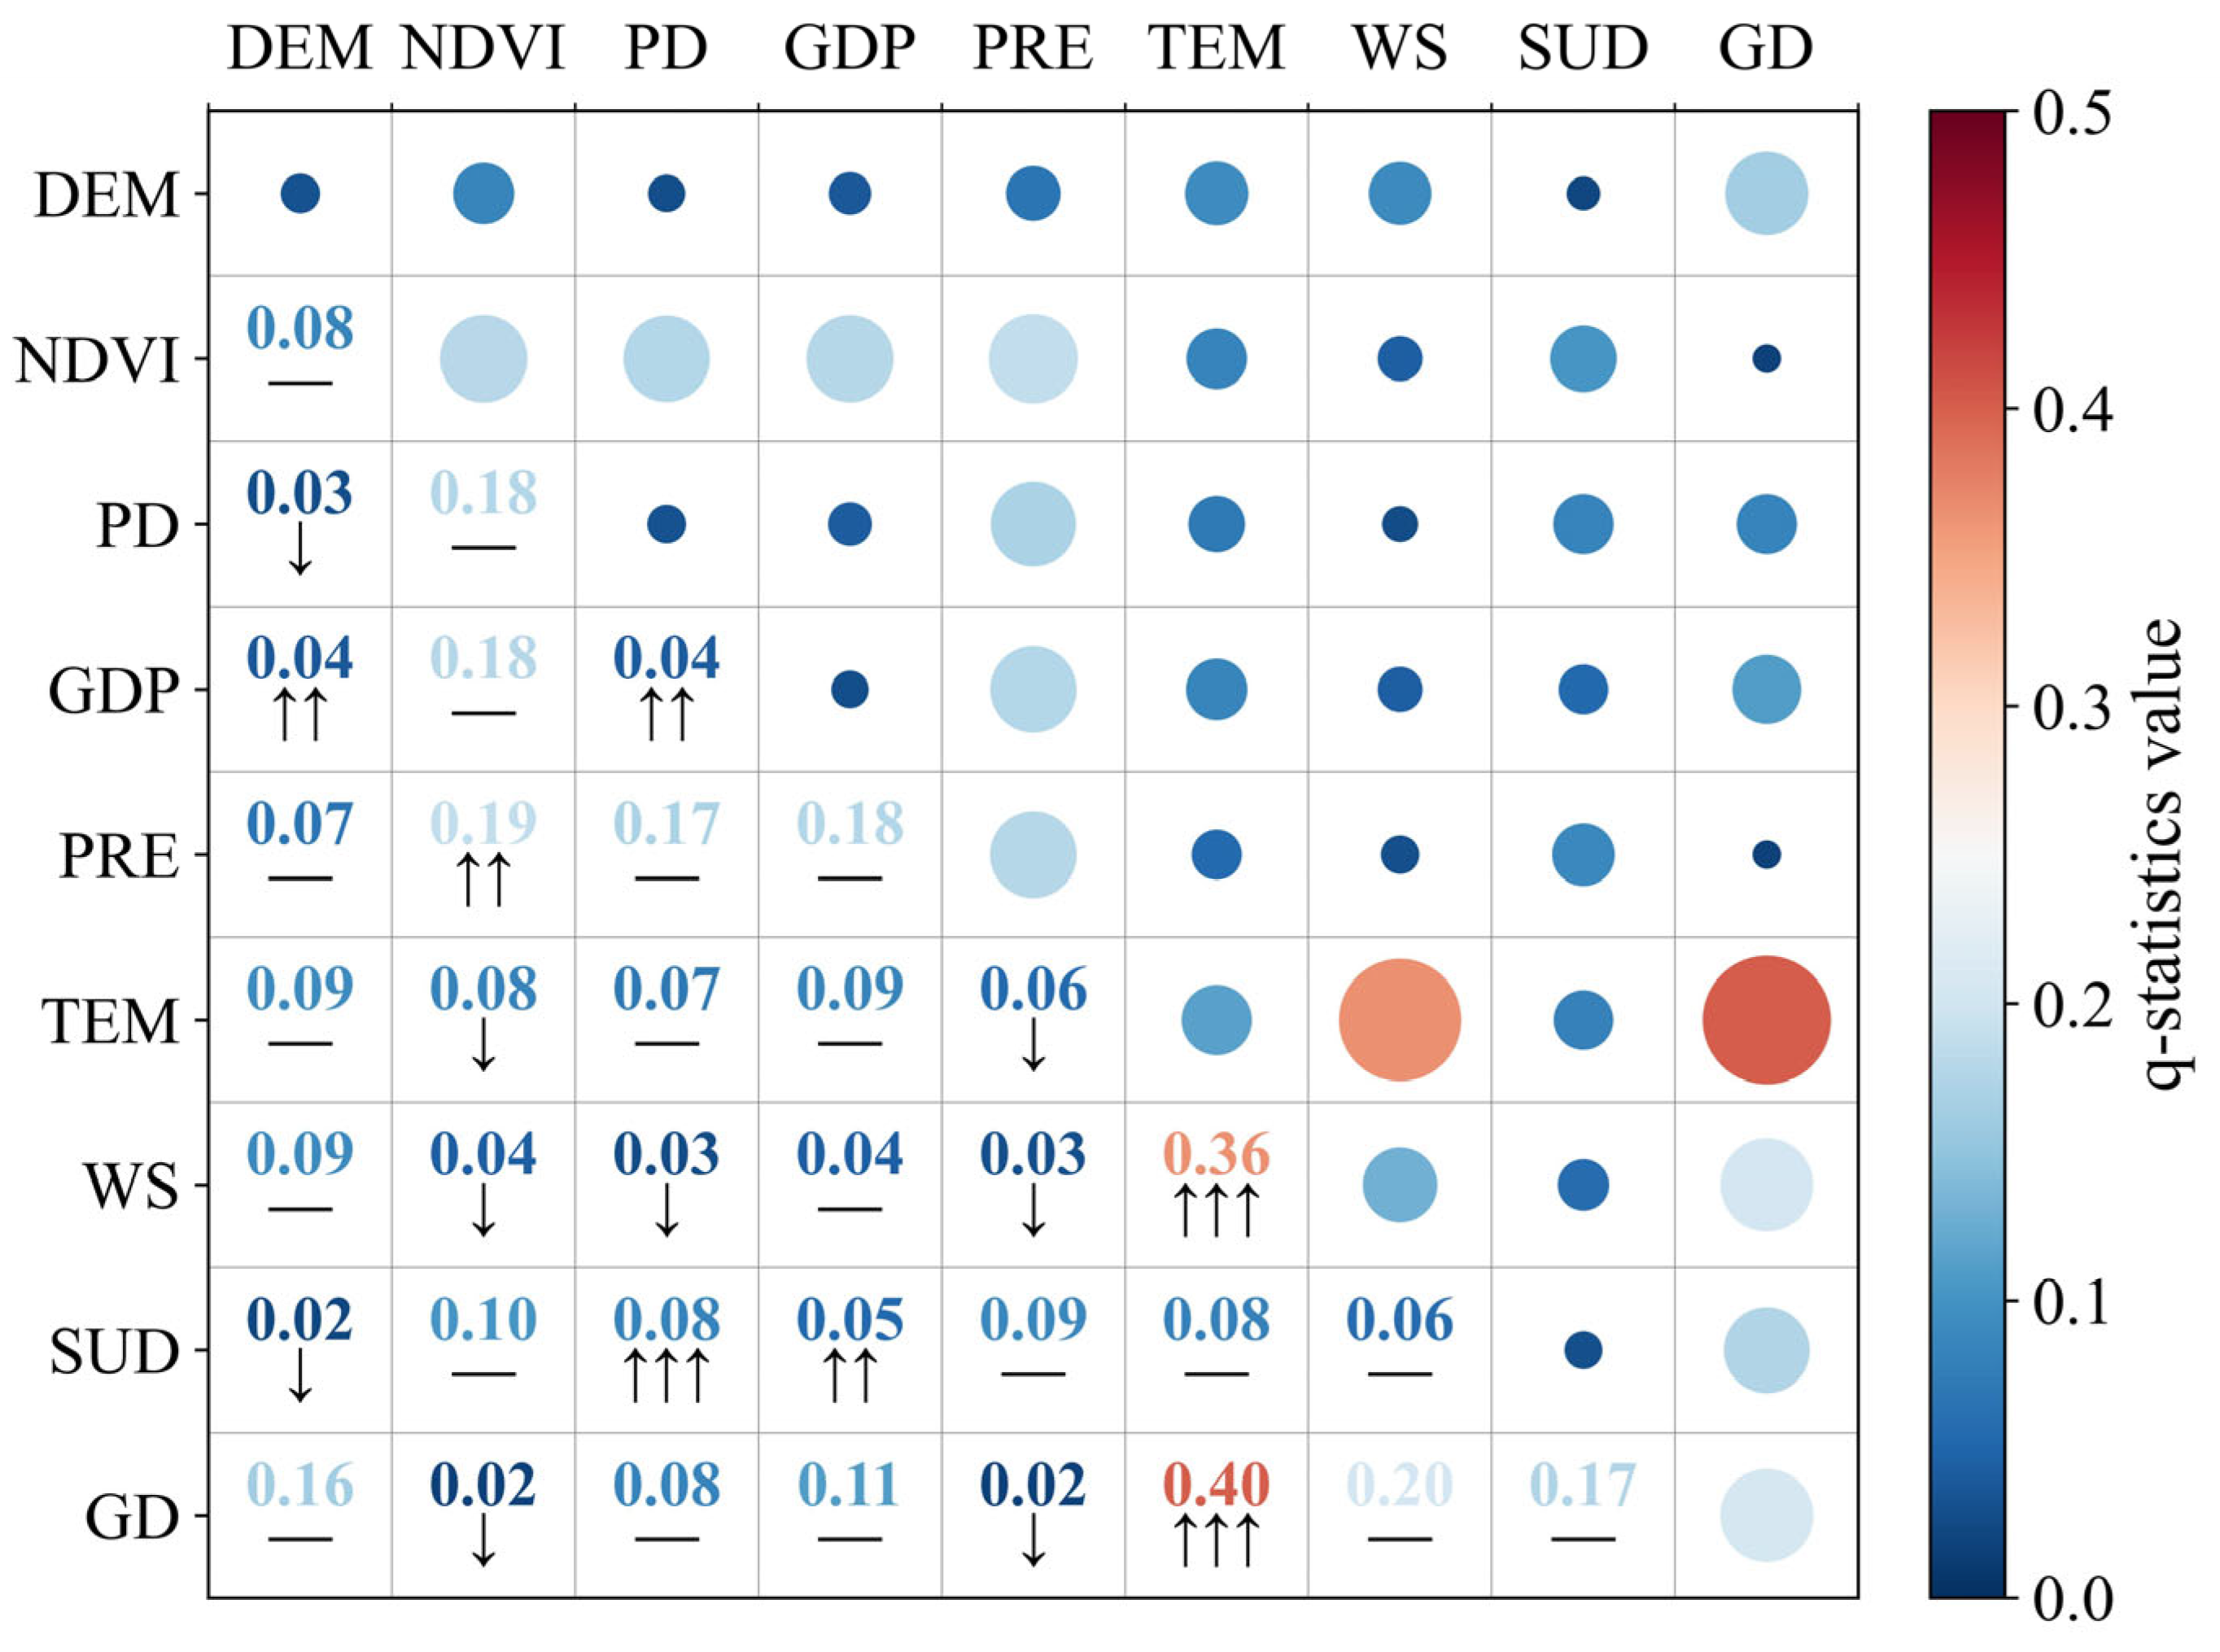
3.3.2. Interaction Detection Analysis

To further explore the interaction mechanisms among different driving factors, an interaction detection was conducted using the GeoDetector model, and a heatmap of the interaction effects was generated (Figure 8). The results revealed substantial variation in the interaction explanatory power (q-values) of different factor combinations for SWEM, with most interactions exhibiting enhancement effects. Among them, the interactions between TEM and wind-related variables—GD and WS—both exhibited non-linear enhancement effects, with q-values of 0.40 and 0.36, respectively. Additionally, the interaction between NDVI and PRE exhibited a two-factor enhancement (q = 0.19). In contrast, most anthropogenic factors (GDP and PD) exhibited weak interactions with other variables, with q-values generally below 0.1, indicating independent or offsetting effects.

3.3.3. Risk Detection Analysis

Based on the risk detector module of the GeoDetector model, the present study analysed the stratified intervals of each driver to identify the critical ranges that significantly affect SWEM (Figure 9). Among natural factors, wind-related indicators were found to be the primary drivers of SWEM. The results showed that SWEM values increased significantly with higher GD and WS levels, particularly when GD ranged from 58 to 101 days and WS from 3.01 to 4.23 m·s−1, during which the mean SWEM exceeded 30 t·ha−1 (Figure 9a,d). Regions with low NDVI values (<0.2) exhibited higher SWEM, suggesting that sparsely vegetated areas have weaker resistance to wind erosion and represent high-risk zones (Figure 9b). Precipitation and temperature were also important climatic factors that influenced wind erosion. When annual precipitation ranged from 30.17 to 135.59 mm and the mean annual temperature was between 3.01 and 4.23 °C, the corresponding SWEM values increased significantly, indicating that arid and warm climatic conditions elevate the risk of wind erosion (Figure 9c,e). In terms of topography, when elevation ranged within 1116 and 1355 m, the average SWEM reached a relatively high level, suggesting that mid-altitude areas may exhibit greater sensitivity to wind erosion (Figure 9f). In contrast, anthropogenic factors such as PD, SUD, and GDP had relatively weaker effects on wind erosion intensity. The intervals associated with increased wind erosion risk were concentrated within 1654–3404 for PD, 846–1116 for SUD, and 85–533 for GDP (Figure 9g–i).

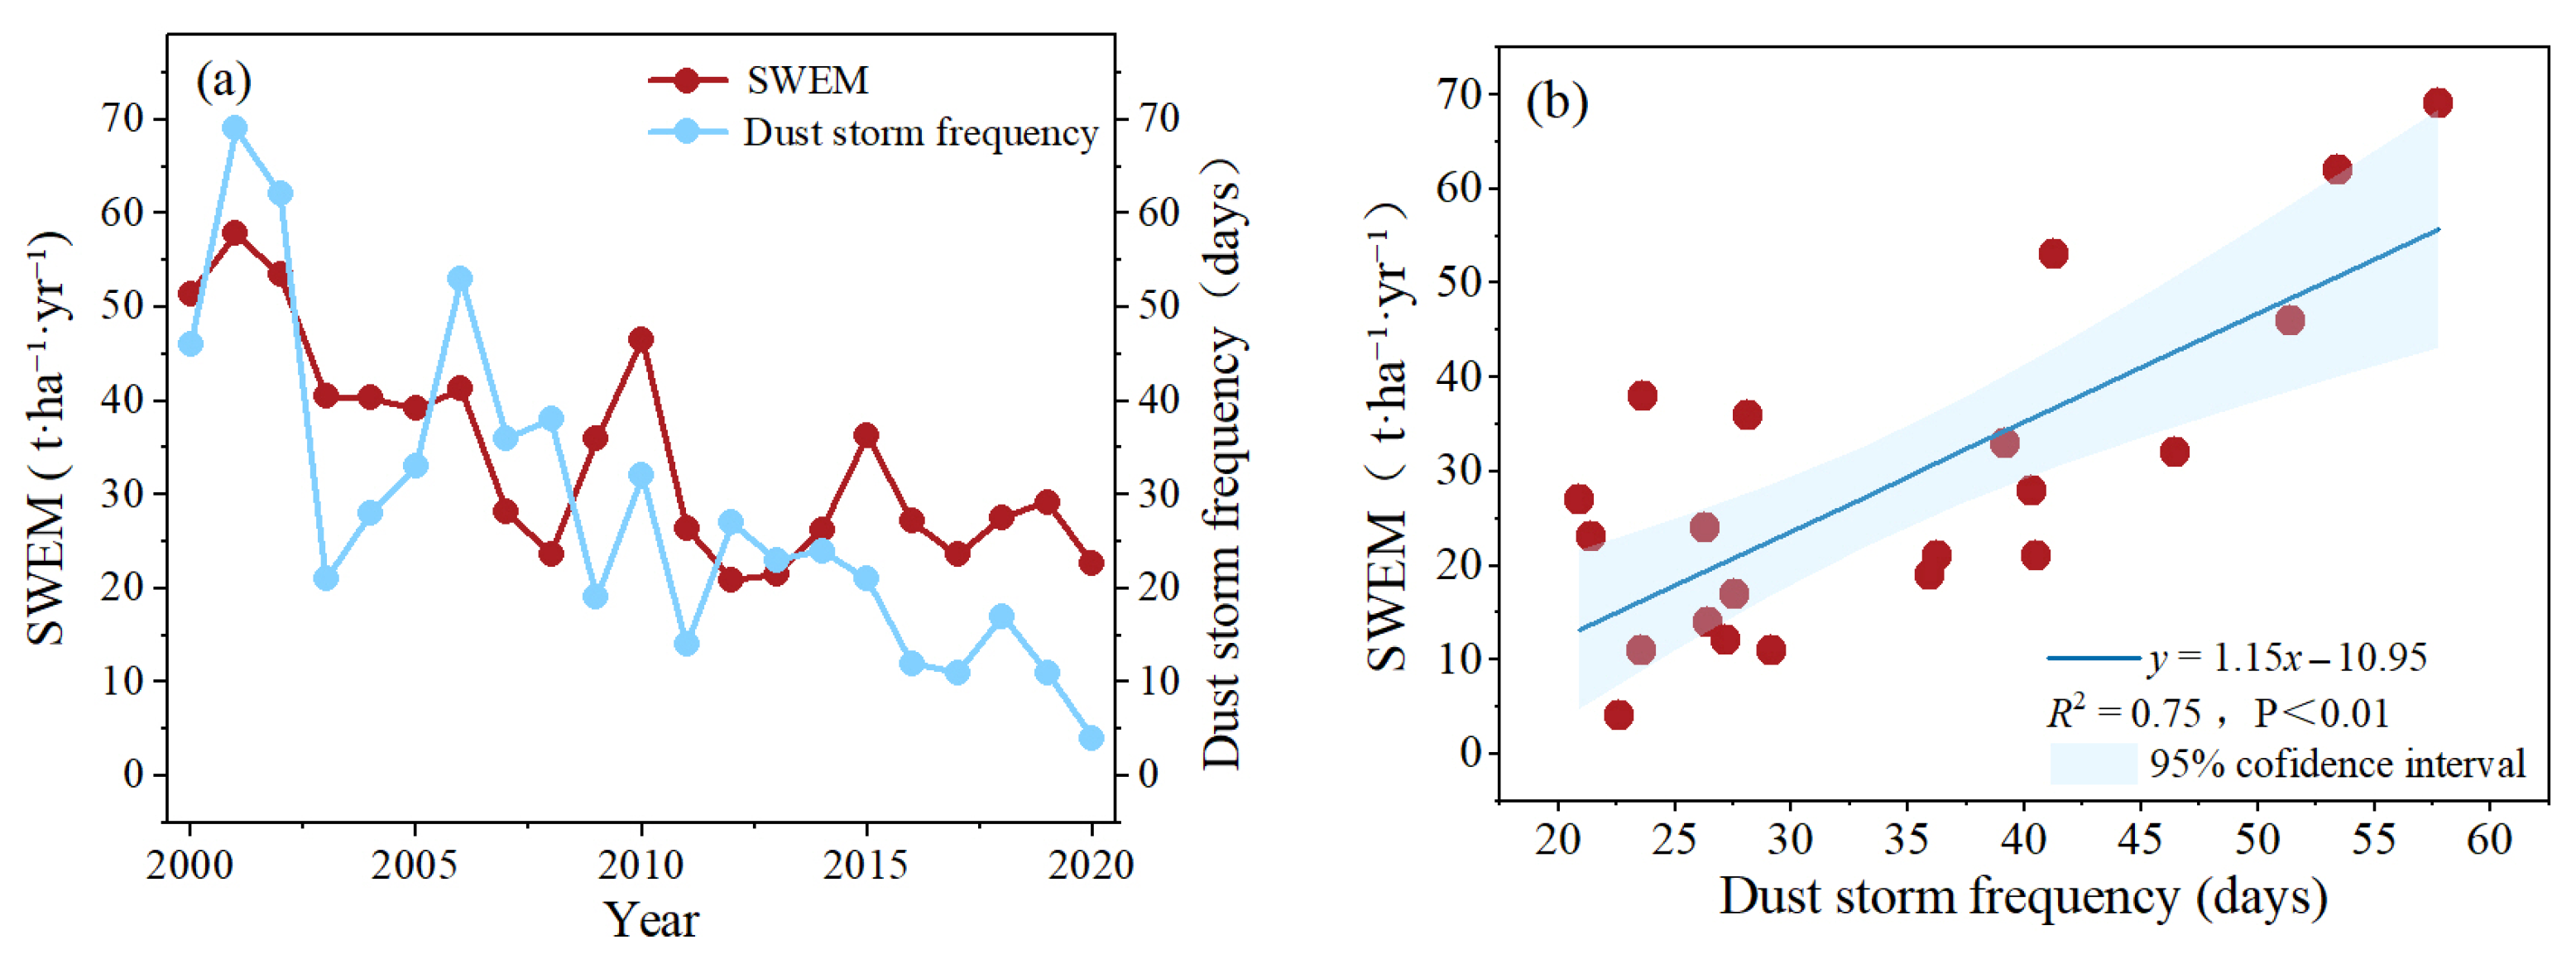
3.4. Relationships Between Key Drivers and the SWEM

In a bid to further elucidate the response of SWEM to key natural drivers, the present study analysed the interannual variation trends and spatial distribution patterns of GD, NDVI, PRE, and TEM (Figure 10).
During 1990–2020, the GD in the study area exhibited a significant decreasing trend, with an average annual decline of approximately 0.16 days (p < 0.01). Interannually, the fluctuations in GD closely mirrored those of SWEM, showing synchronous increases and decreases in most years. Spatially, areas with high GD values were primarily concentrated in typical wind erosion-prone zones, including the northern Alxa Plateau, the Ulan Buh–Tengger Desert transition zone, and the western Xilin Gol grasslands (Figure 10a). NDVI showed a significant upward trend over the observation period, with an average annual increase of approximately 0.002 (p < 0.01). Temporally, NDVI exhibited a strong negative correlation with SWEM, as indicated by their opposite fluctuation patterns. Spatially, NDVI displayed a gradual increase from the southwest to the northeast, with relatively high values concentrated in the eastern and northeastern regions, while the arid western areas showed consistently low NDVI values (Figure 10b). Precipitation exhibited a non-significant increasing trend during the observation period, with an average annual change rate of 0.18 mm (p = 0.83). Nevertheless, the interannual variation in PRE showed a generally inverse relationship with SWEM, particularly in years with lower precipitation when SWEM values tended to be markedly higher. Spatially, precipitation demonstrated a decreasing gradient from northeast to southwest (Figure 10c). The annual mean temperature in the study area exhibited a significant upward trend from 1990 to 2020, with an average increase rate of approximately 0.04 °C (p < 0.01). However, the interannual variability of temperature showed no significant correlation with SWEM. Spatially, temperature displayed an overall increasing gradient from the northeast to the southwest (Figure 10d).

4. Discussion

4.1. Spatial Pattern of SWEM

Soil wind erosion in Inner Mongolia exhibits pronounced spatial heterogeneity, with a southwest-to-northeast decreasing gradient that aligns with established research findings [9,23]. This spatial pattern is influenced not only by natural geographical conditions, but also by land use practices and socioeconomic development patterns [29,48,49]. In the western regions of the study area, such as Alxa and Bayannur, large expanses of exposed deserts and sandy lands provide the material basis for wind erosion [50]. In addition, persistently dry surface conditions and high sand content in the soil make this region the most active zone for wind erosion processes [51]. Due to limited natural resource endowments, local herders predominantly rely on traditional nomadic or semi-settled grazing systems. However, overgrazing has accelerated vegetation loss, exacerbating the susceptibility of grasslands to wind erosion [48]. The central region of Inner Mongolia lies in a transitional zone between arid and semi-arid ecosystems and is also an area of intensive human activity [52]. In recent years, the expansion of agriculture and industrial land, driven by resource-based industries, has led to extensive degradation of native grasslands [53,54,55]. Increasing landscape fragmentation and declining ecological connectivity have weakened vegetation’s buffering capacity against wind disturbance, leaving exposed surfaces more susceptible to wind erosion [56]. In contrast, eastern Inner Mongolia shows stronger erosion resistance, with generally lower SWEM values than the central and western regions [56]. Favourable hydrothermal conditions in eastern Inner Mongolia enhance soil moisture and vegetation cover, supporting the stable distribution of meadow steppes and mixed forests. Moreover, ecological restoration programs implemented since 2000 have been particularly effective in this region, contributing over 62% of the total wind erosion reduction in Inner Mongolia [49]. These differences highlight the combined influence of climate, land use, and human interventions in shaping regional wind erosion patterns.
Owing to the pronounced seasonal variability of climatic factors, vegetation also exhibits cyclical phenological stages throughout the year [57]. These dynamics result in significant seasonal differences in wind erosion intensity [20]. Wind erosion peaked in spring, especially in fragile zones such as the northern Badain Jaran and Kubuqi deserts and northern Hetao. In spring, vegetation is in the early regreening stage, which leaves large exposed areas of bare soil [58]. At the same time, strong convective weather events are frequent, and high wind speeds persist for extended periods [58]. These combined conditions make spring the most active season for wind erosion [59,60]. Winter showed the second highest wind erosion, which may be attributed to the combined effects of freeze–thaw cycles and persistence of residual winter winds [61]. Although snowfall generally suppresses wind erosion [62], the extent of snow cover in arid and semi-arid regions in winter is usually limited. In addition, post-harvest bare croplands, combined with dry soil and persistent north-westerly winds, favoured wind erosion. In contrast, wind erosion intensity was substantially lower in summer and autumn. In summer and autumn, higher precipitation, soil moisture, and dense vegetation outside deserts effectively suppressed wind erosion by enhancing windbreak and sand-fixation capacity [59].

4.2. Relationships Between Key Drivers and SWEM

GeoDetector analysis revealed that natural factors—particularly gale days, vegetation, precipitation, and temperature—primarily shape the spatial pattern of SWEM, while anthropogenic factors such as population and livestock density exert limited regional influence.
At the regional scale, wind is a key meteorological factor that both drives and constrains wind erosion intensity [18,22]. It exerts a decisive influence on the spatiotemporal distribution and evolution of wind erosion processes [23,63]. Numerous studies have shown that, in Inner Mongolia and other arid regions, the gale days offer greater explanatory power for the spatiotemporal variability of wind erosion. Wind tunnel experiments have demonstrated an exponential relationship between wind speed and dust transport flux, indicating that wind exerts a stronger driving force on wind erosion intensity than vegetation cover or soil moisture [1]. Empirical analysis by Zhang et al. [58] in the Horqin Sandy Land further showed that wind strength and frequency together explained approximately 49.9% of the spatial variation in wind erosion. Our findings also reveal a strong interannual synchrony between the number of gale days and SWEM (Figure 10a), suggesting that fluctuations in wind frequency directly regulate regional wind erosion intensity over time. When wind speed exceeds the threshold required to initiate particle movement, the resulting increase in surface shear stress triggers particle saltation and collision, progressively dislodging surrounding materials and establishing a positive feedback loop of wind erosion [64]. This mechanism is particularly pronounced on bare or sparsely vegetated surfaces, where insufficient surface roughness fails to attenuate wind force or impede sediment transport, thereby facilitating erosion. Therefore, vegetation also plays a crucial role in controlling wind erosion, as its root systems act as natural insulators that effectively reduce wind erosion intensity by lowering near-surface wind speed and enhancing soil stability [65]. Notably, the increase in NDVI over the past three decades reflects the positive outcomes of regional ecological restoration efforts and highlights the critical role of vegetation recovery in mitigating wind erosion. Precipitation and temperature influence wind erosion processes indirectly by regulating the regional water and energy balance [26]. Although their explanatory power at broad spatial scales remains limited, their regulatory effects become more pronounced in ecologically sensitive or climatically extreme zones [23]. The strong inverse relationship observed between precipitation and SWEM in arid western Inner Mongolia highlights the regulatory importance of limited rainfall in erosion-prone environments (Figure 10c). Even minor increases in precipitation may contribute to short-term improvements in vegetation growth and surface soil cohesion, thereby serving as a crucial buffer against wind-induced erosion under extreme aridity. The influence of temperature on wind erosion is more complex than that of precipitation [20]. Rising temperatures intensify evapotranspiration, reducing soil moisture and weakening the cohesion between particles, which in turn increases soil erodibility [66]. This effect is particularly pronounced in marginal desertification zones with sparse vegetation and loose soil structure.

4.3. Policy Impacts on Wind Erosion and Implications for Future Land Management

To address the escalating issues of grassland degradation and intensified wind erosion, the Chinese government has successively launched a series of large-scale ecological restoration policies and national control programs. Among the most prominent initiatives are the Grain for Green Programme (GGP) [67], Beijing–Tianjin Sand Source Control Engineering Project (BTSSCE) [68], Fencing Grassland and Moving Users (FGMU) [69], Returning Grazing Land to Grassland Project (RGLGP) [70], and Ecological Subsidy and Award System (ESAS) [71,72]. These policies promoted grassland and forest recovery by reducing grazing pressure, enforcing grazing bans or rotation, and converting farmland. Economic subsidies further incentivised rangeland conservation. A national-scale analysis revealed that grassland degradation and cropland expansion between 1990 and 2000 significantly increased wind erosion, whereas post-2000, ecological programs reduced total wind erosion by approximately 278 × 104 t [73]. Other studies found that initiatives such as the GGP markedly enhanced sand fixation and dust retention, particularly in erosion-prone zones and aeolian corridors [74]. In Inner Mongolia, the BTSSCP was estimated to fix 1.37 × 10⁸ t of sand between 2001 to 2013 [75], further confirming the effectiveness of ecological engineering in mitigating wind erosion across multiple spatial scales. Our findings reveal a significant post-2000 increase in NDVI and a concurrent decline in SWEM. Given that this period coincides with the large-scale implementation of national ecological restoration programs, it is plausible that the observed improvements in wind erosion patterns are closely linked to policy-driven interventions. Future research could incorporate policy-related variables and econometric approaches to quantitatively assess the actual impact of policy interventions on wind erosion dynamics, thereby clarifying the relative contributions of natural and anthropogenic drivers
To achieve sustainable development in the future, policy measures should be tailored to local conditions and exhibit a high degree of adaptability. High-risk wind erosion areas should be prioritised for targeted interventions, such as shelterbelt establishment, cover cropping, or grazing exclusion, with incentive schemes adjusted based on on-site monitoring outcomes. Moreover, implementing a “performance-based” approach can shift herders from passive recipients of subsidies to active participants in ecological restoration, thereby contributing to the establishment of a long-term conservation mechanism. Taken together, evidence from on-the-ground data in Inner Mongolia and international best practices suggests that site-specific management strategies, a scientific monitoring system, and well-targeted incentive schemes are key pathways for effectively controlling wind erosion and enhancing the resilience of grassland ecosystems [2,76].

4.4. Limitations of This Study and Future Directions

The present study offers an in-depth exploration of the spatial heterogeneity and driving forces of wind erosion across multiple scales and factors; several important limitations remain. The RWEQ model was originally developed for wind erosion assessment in U.S. agricultural lands [10], and its application to other regions may introduce regional biases. First, the meteorological data used for wind erosion simulation are primarily at the daily scale, whereas extreme erosion events are often triggered by high wind speeds at hourly or even minute-level resolutions. Previous studies have shown that using higher temporal resolution wind speed data (e.g., hourly) can more accurately capture critical erosion moments and avoid underestimating erosion intensity [77]. Second, the NDVI datasets used in this study are derived from a fusion of GIMMS and MODIS products. Although statistical methods were applied to enhance temporal continuity and spatial resolution, the results remain susceptible to uncertainties caused by differences in sensor spectral response and varying observation conditions. Additionally, the availability and spatial consistency of certain input parameters in RWEQ, such as soil texture, remain limited in some regions, which constrains the model’s adaptability across heterogeneous landscapes. Finally, while the GeoDetector model enabled the identification of dominant drivers and their interactions, it is less effective in capturing the full complexity of nonlinear and scale-dependent relationships among multiple factors.
To enhance the accuracy and regional applicability of wind erosion modelling in arid and semi-arid regions, future studies could pursue several improvements. First, incorporating high-resolution hourly wind speed data would enable more precise detection of extreme erosion events [77]. Second, integrating statistical downscaling techniques, spatial regression methods, and field-based calibration could effectively reduce model uncertainty and improve adaptability to heterogeneous landscapes. Additionally, drawing on international best practices can help establish more operational erosion risk assessment systems [78]. For example, Australia’s AUSLEM and DustWatch frameworks combine high-resolution climatic data, real-time field monitoring, and spatial modelling to support wind erosion monitoring and management [79,80]. Finally, explainable artificial intelligence (XAI) techniques—such as SHAP and interpretable machine learning models—hold great promise for uncovering nonlinear relationships and synergistic effects among multiple drivers, thereby advancing our understanding of the complex mechanisms underlying wind erosion processes [81].

5. Conclusions

The present study aimed to assess the spatial-temporal patterns of wind erosion across Inner Mongolia and to explore its dominant driving factors and interaction effects based on the GeoDetector Model. Our substantial findings include the following: (1) From 1990 to 2022, the average SWEM was 35.65 t·ha−1, with a significant spatial decline from southwest to northeast. Severe erosion zones were mainly concentrated in western deserts and sandy grasslands. (2) Natural factors dominated wind erosion dynamics. Gale days, NDVI, precipitation, and wind speed each explained over 14% of the spatial variation. Notably, interactions such as gale days and temperature (q = 0.40) and wind speed and temperature (q = 0.36) showed strong nonlinear enhancement effects. (3) The temporal trajectories of key natural drivers, such as gale days and NDVI, were found to exert significant regulatory influence on SWEM. The present study provides a scientific basis for recognising high-risk areas, guiding ecological restoration priorities, and improving grassland resource management efficiency.

Author Contributions

Conceptualization, B.; methodology, Y.M.; software, Y.M.; validation, C.H. and Y.C.; writing—original draft preparation, Y.M.; writing—review and editing, Y.W. and Y.H.; supervision, A.C. and B.; project administration, B.; funding acquisition, B. All authors have read and agreed to the published version of the manuscript.

Funding

This research was funded by the following bodies: First-Class Discipline Scientific Research Special Project, grant number YLXKZX-NSD-028; the National Natural Science Foundation of China—Regional Fund, grant number Grant No.42261048; the National Natural Science Foundation of China—Youth Fund, grant number 42301362; the Natural Science Foundation of the Inner Mongolia Autonomous Region, China, grant number 2022QN04002; the 2023 Young Scientific and Technological Talent Development Program (Young Scientific Talent), grant number NJYT23017; a project supported by the Research Start-Up Fund for Introducing High-Level Talents, Inner Mongolia Normal University, grant number 2021JYRC004; a project supported by the Special Fund for Fundamental Research Business Expenses of the Inner Mongolia Normal University, grant number 2022JBQN098; and the 2023 Ministry of Human Resources and Social Security’s Talent Sponsorship Program for Studying Abroad (no grant number).

Data Availability Statement

The data used in this study were obtained from the following sources: meteorological data (wind speed, precipitation, and temperature) were obtained from the Copernicus Climate Data Store (https://cds.climate.copernicus.eu/, accessed on 1 March 2025); Soil data (soil texture, organic matter, calcium carbonate content; constant) were acquired from the ISRIC Soil Data Hub (https://data.isric.org/, accessed on 3 March 2025); Land use/cover data were obtained from (https://doi.org/10.5281/zenodo.5816591, accessed on 4 March 2025); Remote sensing data: snow depth from (https://cds.climate.copernicus.eu/, accessed on 5 March 2025); evapotranspiration from TPDC (https://data.tpdc.ac.cn/, accessed on 6 March 2025); MODIS NDVI data from NASA LP DAAC (https://ladsweb.modaps.eosdis.nasa.gov/, accessed on 7 March 2025); GIMMS NDVI from the Westdc Data Center (http://westdc.westgis.ac.cn/, accessed on 7 March 2025); and DEM data from the Geospatial Data Cloud (https://www.gscloud.cn/, accessed on 8 March 2025); Socio-economic data: GDP and population density were collected from the Resource and Environment Data Center of China (https://www.resdc.cn/, accessed on 10 March 2025); sheep unit density was retrieved from the Inner Mongolia Statistical Yearbook (https://tj.nmg.gov.cn/, accessed on 10 March 2025).

Conflicts of Interest

The authors declare no conflicts of interest.

Abbreviations

The following abbreviations are used in this manuscript:
RWEQRevised Wind Erosion Equation
SWEMSoil Wind Erosion Modulus
HLHulunbuir City
HGHinggan League
TLTongliao City
CFChifeng City
XLXilingol League
ULUlanqab City
BTBaotou City
HHHohhot City
BYBayannur City
ODOrdos City
WHWuhai City
ALAlxa League
CLCDAnnual China Land Cover Dataset
WSWind speed
GDGale days
PREPrecipitation
TEMTemperature
PETEvapotranspiration
NDVINormalized Difference Vegetation Index
DEMDigital Elevation Model
GDPGross Domestic Product
PDPopulation density
SUDSheep unit density
TETolerable erosion
LELight erosion
MEModerate erosion
SESevere erosion
ESEExtremely Severe erosion
ESDExtremely significant decrease
SDSignificant decrease
NSCNo significant change
ESIExtremely significant increase
SISignificant increase

References

  1. Meng, Z.; Dang, X.; Gao, Y.; Ren, X.; Ding, Y.; Wang, M. Interactive Effects of Wind Speed, Vegetation Coverage and Soil Moisture in Controlling Wind Erosion in a Temperate Desert Steppe, Inner Mongolia of China. J. Arid Land 2018, 10, 534–547. [Google Scholar] [CrossRef]
  2. Wang, Y.; Xiao, Y.; Xu, J.; Xie, G.; Qin, K.; Liu, J.; Niu, Y.; Gan, S.; Huang, M. Evaluation of Inner Mongolia Wind Erosion Prevention Service Based on Land Use and the RWEQ Model. J. Resour. Ecol. 2022, 13, 763–774. [Google Scholar] [CrossRef]
  3. Fallahzade, J.; Karimi, A.; Naderi, M.; Shirani, H. Soil Mechanical Properties and Wind Erosion Following Conversion of Desert to Irrigated Croplands in Central Iran. Soil Tillage Res. 2020, 204, 104665. [Google Scholar] [CrossRef]
  4. Pierre, C.; Kergoat, L.; Hiernaux, P.; Baron, C.; Bergametti, G.; Rajot, J.-L.; Abdourhamane Toure, A.; Okin, G.S.; Marticorena, B. Impact of Agropastoral Management on Wind Erosion in Sahelian Croplands. Land Degrad. Dev. 2018, 29, 800–811. [Google Scholar] [CrossRef]
  5. Zhang, K.; Qu, J.; Han, Q.; Xie, S.; Kai, K.; Niu, Q.; An, Z. Wind Tunnel Simulation of Windblown Sand Along China’s Qinghai–Tibet Railway. Land Degrad. Dev. 2014, 25, 244–250. [Google Scholar] [CrossRef]
  6. Zhou, W.; Gang, C.; Zhou, F.; Li, J.; Dong, X.; Zhao, C. Quantitative Assessment of the Individual Contribution of Climate and Human Factors to Desertification in Northwest China Using Net Primary Productivity as an Indicator. Ecol. Indic. 2015, 48, 560–569. [Google Scholar] [CrossRef]
  7. Joshi, J.R. Quantifying the Impact of Cropland Wind Erosion on Air Quality: A High-Resolution Modeling Case Study of an Arizona Dust Storm. Atmos. Environ. 2021, 263, 118658. [Google Scholar] [CrossRef]
  8. Li, J.; Yuan, X.; Su, Y.; Qian, K.; Liu, Y.; Yan, W.; Xu, S.; Yang, X.; Luo, G.; Ma, X. Trade-Offs and Synergistic Relationships in Wind Erosion in Central Asia over the Last 40 Years: A Bayesian Network Analysis. Geoderma 2023, 437, 116597. [Google Scholar] [CrossRef]
  9. Dai, Y.; Tian, L.; Zhu, P.; Dong, Z.; Zhang, R. Dynamic Aeolian Erosion Evaluation and Ecological Service Assessment in Inner Mongolia, Northern China. Geoderma 2022, 406, 115518. [Google Scholar] [CrossRef]
  10. Fryrear, D.W.; Stout, J.E.; Hagen, L.J.; Vories, E.D. Wind Erosion: Field Measurement And Analysis. Trans. ASAE 1991, 34, 0155. [Google Scholar] [CrossRef]
  11. Fister, W.; Ries, J.B. Wind Erosion in the Central Ebro Basin under Changing Land Use Management. Field Experiments with a Portable Wind Tunnel. J. Arid. Environ. 2009, 73, 996–1004. [Google Scholar] [CrossRef]
  12. Hagen, L.J. A Wind Erosion Prediction System to Meet User Needs. J. Soil Water Conserv. 1991, 46, 106–111. [Google Scholar] [CrossRef]
  13. Zou, X.; Zhang, C.; Cheng, H.; Kang, L.; Wu, X.; Chang, C.; Wang, Z.; Zhang, F.; Li, J.; Liu, C.; et al. Classification and Representation of Factors Affecting Soil Wind Erosion in A Model. Adv. Earth Sci. 2014, 29, 875–889. [Google Scholar] [CrossRef]
  14. Shao, Y.P.; Leys, J.F. A Model for Predicting Aeolian Sand Drift and Dust Entrainment on Scales from Paddock to Region. Soil Res. 1996, 34, 309–342. [Google Scholar] [CrossRef]
  15. Fryrear, D.W.; Bilbro, J.D.; Saleh, A.; Schomberg, H.; Stout, J.E.; Zobeck, T.M. RWEQ: Improved Wind Erosion Technology. J. Soil Water Conserv. 2000, 55, 183–189. [Google Scholar] [CrossRef]
  16. Wang, J.; Zhen, J.; Hu, W.; Chen, S.; Lizaga, I.; Zeraatpisheh, M.; Yang, X. Remote Sensing of Soil Degradation: Progress and Perspective. Int. Soil Water Conserv. Res. 2023, 11, 429–454. [Google Scholar] [CrossRef]
  17. Ma, X.; Zhao, C.; Zhu, J. Aggravated Risk of Soil Erosion with Global Warming—A Global Meta-Analysis. Catena 2021, 200, 105129. [Google Scholar] [CrossRef]
  18. Zhao, C.; Zhang, H.; Wang, M.; Jiang, H.; Peng, J.; Wang, Y. Impacts of Climate Change on Wind Erosion in Southern Africa between 1991 and 2015. Land Degrad. Dev. 2021, 32, 2169–2182. [Google Scholar]
  19. Wang, W.; Samat, A.; Ge, Y.; Ma, L.; Tuheti, A.; Zou, S.; Abuduwaili, J. Quantitative Soil Wind Erosion Potential Mapping for Central Asia Using the Google Earth Engine Platform. Remote Sens. 2020, 12, 3430. [Google Scholar] [CrossRef]
  20. Wei, X.; Wu, X.; Wang, D.; Wu, T.; Li, R.; Hu, G.; Zou, D.; Bai, K.; Ma, X.; Liu, Y.; et al. Spatiotemporal Variations and Driving Factors for Potential Wind Erosion on the Mongolian Plateau. Sci. Total Environ. 2023, 862, 160829. [Google Scholar] [CrossRef]
  21. Lin, J.; Guan, Q.; Pan, N.; Zhao, R.; Yang, L.; Xu, C. Spatiotemporal Variations and Driving Factors of the Potential Wind Erosion Rate in the Hexi Region, PR China. Land Degrad. Dev. 2021, 32, 139–157. [Google Scholar] [CrossRef]
  22. Zhang, G.; Azorin-Molina, C.; Shi, P.; Lin, D.; Guijarro, J.A.; Kong, F.; Chen, D. Impact of Near-Surface Wind Speed Variability on Wind Erosion in the Eastern Agro-Pastoral Transitional Zone of Northern China, 1982–2016. Agric. For. Meteorol. 2019, 271, 102–115. [Google Scholar] [CrossRef]
  23. Zhang, H.; Fan, J.; Cao, W.; Harris, W.; Li, Y.; Chi, W.; Wang, S. Response of Wind Erosion Dynamics to Climate Change and Human Activity in Inner Mongolia, China during 1990 to 2015. Sci. Total Environ. 2018, 639, 1038–1050. [Google Scholar] [CrossRef]
  24. Zhang, X.; Zhang, C.; Zuo, X.; Zou, X.; Wang, X.; Zhao, J.; Li, W.; Zhou, Z.; Zhang, Y. Extension of the Revised Wind Erosion Equation (RWEQ) to Calculate Grassland Wind Erosion Rates Based on the 137Cs Tracing Technique. CATENA 2024, 234, 107544. [Google Scholar] [CrossRef]
  25. Borrelli, P.; Robinson, D.A.; Fleischer, L.R.; Lugato, E.; Ballabio, C.; Alewell, C.; Meusburger, K.; Modugno, S.; Schütt, B.; Ferro, V. An Assessment of the Global Impact of 21st Century Land Use Change on Soil Erosion. Nat. Commun. 2017, 8, 2013. [Google Scholar] [CrossRef] [PubMed]
  26. Keesstra, S.; Pereira, P.; Novara, A.; Brevik, E.C.; Azorin-Molina, C.; Parras-Alcantara, L.; Jordan, A.; Cerda, A. Effects of Soil Management Techniques on Soil Water Erosion in Apricot Orchards. Sci. Total Environ. 2016, 551–552, 357–366. [Google Scholar] [CrossRef]
  27. Xu, J.; Xiao, Y.; Xie, G.; Wang, Y.; Jiang, Y. Computing Payments for Wind Erosion Prevention Service Incorporating Ecosystem Services Flow and Regional Disparity in Yanchi County. Sci. Total Environ. 2019, 674, 563–579. [Google Scholar] [CrossRef]
  28. García-Ruiz, J.M. The Effects of Land Uses on Soil Erosion in Spain: A Review. Catena 2010, 81, 1–11. [Google Scholar] [CrossRef]
  29. Hoffmann, C.; Funk, R.; Reiche, M.; Li, Y. Assessment of Extreme Wind Erosion and Its Impacts in Inner Mongolia, China. Aeolian Res. 2011, 3, 343–351. [Google Scholar] [CrossRef]
  30. Lyu, X.; Li, X.; Wang, H.; Gong, J.; Li, S.; Dou, H.; Dang, D. Soil Wind Erosion Evaluation and Sustainable Management of Typical Steppe in Inner Mongolia, China. J. Environ. Manag. 2021, 277, 111488. [Google Scholar] [CrossRef]
  31. Zhou, Y.; Guo, B.; Wang, S.; Tao, H. An Estimation Method of Soil Wind Erosion in Inner Mongolia of China Based on Geographic Information System and Remote Sensing. J. Arid Land 2015, 7, 304–317. [Google Scholar] [CrossRef]
  32. Wang, J.-F.; Zhang, T.-L.; Fu, B.-J. A Measure of Spatial Stratified Heterogeneity. Ecol. Indic. 2016, 67, 250–256. [Google Scholar] [CrossRef]
  33. Zhao, X.; Tan, S.; Li, Y.; Wu, H.; Wu, R. Quantitative Analysis of Fractional Vegetation Cover in Southern Sichuan Urban Agglomeration Using Optimal Parameter Geographic Detector Model, China. Ecol. Indic. 2024, 158, 111529. [Google Scholar] [CrossRef]
  34. Yan, M.; Li, Q.; Song, Y. Spatial and Temporal Distribution Characteristics and Influential Mechanisms of China’s Industrial Landscape Based on Geodetector. Land 2024, 13, 746. [Google Scholar] [CrossRef]
  35. Li, H.; Chen, J.; Ling, M.; Chen, Z.; Lan, Y.; Huang, Q.; Li, X.; You, H.; Wang, F.; Han, X.; et al. A Framework for Dynamic Assessment of Soil Erosion and Detection of Driving Factors in Alpine Grassland Ecosystems Using the RUSLE-InVEST (SDR) Model and Geodetector: A Case Study of the Source Region of the Yellow River. Ecol. Inform. 2025, 85, 102928. [Google Scholar] [CrossRef]
  36. Du, Z.; Yu, L.; Chen, X.; Gao, B.; Yang, J.; Fu, H.; Gong, P. Land Use/Cover and Land Degradation across the Eurasian Steppe: Dynamics, Patterns and Driving Factors. Sci. Total Environ. 2024, 909, 168593. [Google Scholar] [CrossRef]
  37. Yao, B.; Gong, X.; Li, Y.; Li, Y.; Lian, J.; Wang, X. Spatiotemporal Variation and GeoDetector Analysis of NDVI at the Northern Foothills of the Yinshan Mountains in Inner Mongolia over the Past 40 Years. Heliyon 2024, 10, e39309. [Google Scholar] [CrossRef]
  38. Dou, H.; Li, X.; Li, S.; Dang, D.; Li, X.; Lyu, X.; Li, M.; Liu, S. Mapping Ecosystem Services Bundles for Analyzing Spatial Trade-Offs in Inner Mongolia, China. J. Clean. Prod. 2020, 256, 120444. [Google Scholar] [CrossRef]
  39. Li, D.; Wu, S.; Liu, L.; Zhang, Y.; Li, S. Vulnerability of the Global Terrestrial Ecosystems to Climate Change. Glob. Change Biol. 2018, 24, 4095–4106. [Google Scholar] [CrossRef]
  40. Du, H.; Dou, S.; Deng, X.; Xue, X.; Wang, T. Assessment of Wind and Water Erosion Risk in the Watershed of the Ningxia-Inner Mongolia Reach of the Yellow River, China. Ecol. Indic. 2016, 67, 117–131. [Google Scholar] [CrossRef]
  41. Jiang, L.; Xiao, Y.; Zheng, H.; Ouyang, Z. Spatio-Temporal Variation of Wind Erosion in Inner Mongolia of China Between 2001 and 2010. Chin. Geogr. Sci. 2016, 26, 155–164. [Google Scholar]
  42. Elliot, D. Adjustment and Analysis of Data for Regional Wind Energy Assessments. In Proceedings of the Workshop on Wind Climate, Asheville, NC, USA, 12–13 November 1979; pp. 121–173. [Google Scholar]
  43. Yang, J.; Huang, X. The 30 m Annual Land Cover Dataset and Its Dynamics in China from 1990 to 2019. Earth Syst. Sci. Data 2021, 13, 3907–3925. [Google Scholar] [CrossRef]
  44. Teng, Y.; Zhan, J.; Liu, W.; Sun, Y.; Agyemang, F.B.; Liang, L.; Li, Z. Spatiotemporal Dynamics and Drivers of Wind Erosion on the Qinghai-Tibet Plateau, China. Ecol. Indic. 2021, 123, 107340. [Google Scholar] [CrossRef]
  45. SL190-2007; Classification Criteria of Soil Erosion Intensities. Ministry of Water Resources of the People’s Republic of China: Beijing, China, 2007.
  46. Wang, J.; Xu, C. Geodetector: Principle and Prospective. Acta Geogr. Sin. 2017, 72, 116–134. [Google Scholar] [CrossRef]
  47. Li, W.; Kang, J.; Wang, Y. Spatiotemporal Changes and Driving Forces of Ecological Security in the Chengdu-Chongqing Urban Agglomeration, China: Quantification Using Health-Services-Risk Framework. J. Clean. Prod. 2023, 389, 136135.1–136135.15. [Google Scholar]
  48. Hoffmann, C.; Funk, R.; Li, Y.; Sommer, M. Effect of Grazing on Wind Driven Carbon and Nitrogen Ratios in the Grasslands of Inner Mongolia. CATENA 2008, 75, 182–190. [Google Scholar] [CrossRef]
  49. Chi, W.; Zhao, Y.; Kuang, W.; Pan, T.; Ba, T.; Zhao, J.; Jin, L.; Wang, S. Impact of Cropland Evolution on Soil Wind Erosion in Inner Mongolia of China. Land 2021, 10, 583. [Google Scholar] [CrossRef]
  50. Tao, W. Aeolian Desertification and Its Control in Northern China. Int. Soil Water Conserv. Res. 2014, 2, 34–41. [Google Scholar] [CrossRef]
  51. Xue, H.; Chen, Y.; Dong, G.; Li, J. Quantitative Analysis of Spatiotemporal Changes and Driving Forces of Vegetation Net Primary Productivity (NPP) in the Qimeng Region of Inner Mongolia. Ecol. Indic. 2023, 154, 110610. [Google Scholar] [CrossRef]
  52. Feng, S.; Liu, X.; Zhao, W.; Yao, Y.; Zhou, A.; Liu, X.; Pereira, P. Key Areas of Ecological Restoration in Inner Mongolia Based on Ecosystem Vulnerability and Ecosystem Service. Remote Sens. 2022, 14, 2729. [Google Scholar] [CrossRef]
  53. Batunacun; Wieland, R.; Lakes, T.; Yunfeng, H.; Nendel, C. Identifying Drivers of Land Degradation in Xilingol, China, between 1975 and 2015. Land Use Policy 2019, 83, 543–559. [Google Scholar] [CrossRef]
  54. Batunacun; Nendel, C.; Hu, Y.; Lakes, T. Land-use Change and Land Degradation on the Mongolian Plateau from 1975 to 2015—A Case Study from Xilingol, China. Land Degrad. Dev. 2018, 29, 1595–1606. [Google Scholar] [CrossRef]
  55. Hu, Y.; Nacun, B. An Analysis of Land-Use Change and Grassland Degradation from a Policy Perspective in Inner Mongolia, China, 1990–2015. Sustainability 2018, 10, 4048. [Google Scholar] [CrossRef]
  56. Jiang, H.; Gao, W.; Liu, B.; Chang, A.; Guo, Q. Quantifying Soil Wind Erosion Attribution in Inner Mongolia’s Desert Grassland. Sci. Rep. 2025, 15, 14319. [Google Scholar] [CrossRef]
  57. Lijuan, M.; Daniel, M.; Xuefeng, C.; Meihong, M.; Sylvain, D. Changes in Vegetation Phenology on the Mongolian Plateau and Their Climatic Determinants. PLoS ONE 2017, 12, e0190313. [Google Scholar] [CrossRef]
  58. Zhang, H.; Gao, Y.; Sun, D.; Liu, L.; Cui, Y.; Zhu, W. Wind Erosion Changes in a Semi-Arid Sandy Area, Inner Mongolia, China. Sustainability 2019, 11, 188. [Google Scholar] [CrossRef]
  59. Yue, S.; Yang, R.; Yan, Y.; Yang, Z.; Wang, D. Spatial and Temporal Variations of Wind Erosion Climatic Erosivity in the Farming-Pastoral Zone of Northern China. Theor. Appl. Climatol. 2019, 135, 1339–1348. [Google Scholar] [CrossRef]
  60. Zhang, H.; Peng, J.; Zhao, C.; Xu, Z.; Gao, Y. Wind Speed in Spring Dominated the Decrease in Wind Erosion across the Horqin Sandy Land in Northern China. Ecol. Indic. 2021, 127, 107599. [Google Scholar] [CrossRef]
  61. Ye, H.; Bai, D.; Liu, S.; Tan, S.; Wang, J.; Xie, F.; Zhu, Y. Spatiotemporal Evolution Characteristics of Freeze–Thaw Erosion Intensity in the High-Cold Mountainous Areas of Northwestern Yunnan from 2017 to 2023. Sci. Rep. 2025, 15, 9521. [Google Scholar] [CrossRef]
  62. Wang, L.; Shi, Z.H.; Wu, G.L.; Fang, N.F. Freeze/Thaw and Soil Moisture Effects on Wind Erosion. Geomorphology 2014, 207, 141–148. [Google Scholar] [CrossRef]
  63. Du, H.; Wang, T.; Xue, X. Potential Wind Erosion Rate Response to Climate and Land-use Changes in the Watershed of the Ningxia–Inner Mongolia Reach of the Yellow River, China, 1986–2013. Earth Surf. Process. Landf. 2017, 42, 1923–1937. [Google Scholar] [CrossRef]
  64. Anonymous. Integrated Wind-Erosion Modelling. In Physics and Modelling of Wind Erosion; Shao, Y., Ed.; Springer: Dordrecht, The Netherlands, 2008; pp. 303–360. ISBN 978-1-4020-8895-7. [Google Scholar]
  65. Shen, L.; Tian, M.; Gao, J. Analysis on Wind Erosion and Main Factors in Desertification Control Ecologincal Function Area of Hunshandake Using the Revised Wind Erosio Equation Model. Res. Soil Water Conserv. 2016, 23, 90–97. [Google Scholar]
  66. D’Odorico, P.; Bhattachan, A.; Davis, K.F.; Ravi, S.; Runyan, C.W. Global Desertification: Drivers and Feedbacks. Adv. Water Resour. 2013, 51, 326–344. [Google Scholar] [CrossRef]
  67. Liu, D.; Chen, Y.; Cai, W.; Dong, W.; Xiao, J.; Chen, J.; Zhang, H.; Xia, J.; Yuan, W. The Contribution of China’s Grain to Green Program to Carbon Sequestration. Landsc. Ecol. 2014, 29, 1675–1688. [Google Scholar] [CrossRef]
  68. Zeng, X.; Zhang, W.; Liu, X.; Cao, J.; Shen, H.; Zhao, X.; Zhang, N.; Bai, Y.; Yi, M. Change of Soil Organic Carbon after Cropland Afforestation in ‘Beijing-Tianjin Sandstorm Source Control’ Program Area in China. Chin. Geogr. Sci. 2014, 24, 461–470. [Google Scholar] [CrossRef]
  69. Akram, M.; Zhang, Q.; Li, W. Policy Analysis in Grassland Management of Xilingol Prefecture, Inner Mongolia. In The Future of Drylands; Lee, C., Schaaf, T., Eds.; Springer: Dordrecht, The Netherlands, 2008; pp. 493–505. ISBN 978-1-4020-6969-7. [Google Scholar]
  70. Liu, M. China’s Grassland Policies and the Inner Mongolian Grassland System. Ph.D. Thesis, Wageningen University, Wageningen, The Netherlands, 2017. [Google Scholar]
  71. Démurger, S.; Pelletier, A. Volunteer and Satisfied? Rural Households’ Participation in a Payments for Environmental Services Programme in Inner Mongolia. Ecol. Econ. 2015, 116, 25–33. [Google Scholar] [CrossRef]
  72. Pan, X.; Xu, L.; Yang, Z.; Yu, B. Payments for Ecosystem Services in China: Policy, Practice, and Progress. J. Clean. Prod. 2017, 158, 200–208. [Google Scholar] [CrossRef]
  73. Chi, W.; Zhao, Y.; Kuang, W.; He, H. Impacts of Anthropogenic Land Use/Cover Changes on Soil Wind Erosion in China. Sci. Total Environ. 2019, 668, 204–215. [Google Scholar] [CrossRef]
  74. Wei, W.; Wang, B.; Niu, X. Soil Erosion Reduction by Grain for Green Project in Desertification Areas of Northern China. Forests 2020, 11, 473. [Google Scholar] [CrossRef]
  75. Yu, B.-L.; Wu, W.-J.; Zhao, X.-J.; Wu, E.-T.; Cai, L.-Y.; Yang, F.-J. Benefits of Soil Wind Erosion Control of the Beijing-Tianjin Sand Source Control Project in Inner Mongolia. Arid Zone Res. 2016, 6, 1278–1286. [Google Scholar]
  76. Yan, H.; Xie, G.; Yan, F.; Niu, Z.; Xue, Z.; Wang, B. The Effects of Human Activities on Windbreak and Sand Fixation Services in Inner Mongolia Grasslands from 2000 to 2020. J. Geogr. Sci. 2024, 34, 2421–2439. [Google Scholar] [CrossRef]
  77. Buschiazzo, D.E.; Zobeck, T.M. Validation of WEQ, RWEQ and WEPS Wind Erosion for Different Arable Land Management Systems in the Argentinean Pampas. Earth Surf. Process. Landf. 2008, 33, 1839–1850. [Google Scholar] [CrossRef]
  78. Zhang, Z.; Huisingh, D. Combating Desertification in China: Monitoring, Control, Management and Revegetation. J. Clean. Prod. 2018, 182, 765–775. [Google Scholar] [CrossRef]
  79. Webb, N.P.; McGowan, H.A.; Phinn, S.R.; McTainsh, G.H. AUSLEM (AUStralian Land Erodibility Model): A Tool for Identifying Wind Erosion Hazard in Australia. Geomorphology 2006, 78, 179–200. [Google Scholar] [CrossRef]
  80. Yang, X.; Leys, J.; Zhang, M.; Gray, J.M. Estimating Nutrient Transport Associated with Water and Wind Erosion across New South Wales, Australia. Geoderma 2023, 430, 116345. [Google Scholar] [CrossRef]
  81. Zhang, H.; Peng, J.; Zhao, C. Wind Speed and Vegetation Coverage in Turn Dominated Wind Erosion Change with Increasing Aridity in Africa. Earth’s Future 2024, 12, e2024EF004468. [Google Scholar] [CrossRef]
Figure 1. Study area and distribution of meteorological stations.
Remotesensing 17 02365 g001
Figure 2. Study framework for wind erosion simulation and driving mechanism analysis.
Remotesensing 17 02365 g002
Figure 3. Interannual variation (a) and linear regression model (b) of SWEM and dust storm frequency in Inner Mongolia from 2000 to 2020.
Remotesensing 17 02365 g003
Figure 4. Spatial distribution and temporal variation of the SWEM in inner Mongolia from 1990 to 2022: (a) Average wind erosion intensity, note: TE, LE, ME, SE, ESE, and DE represent tolerable, light, moderate, severe, extremely severe, and destructive erosion, respectively; (b) Change trend, note: ESD, SD, NSC, SI, and ESI represent extremely significant decrease, significant decrease, no significant change, significant increase and extremely significant increase, respectively; (c) Total annual SWEM of each league/city; and (d) Annual variation.
Remotesensing 17 02365 g004
Figure 5. Spatial distribution of the SWEM values in different seasons in Inner Mongolia: (a) seasonal changes between 1990 and 2022; (b) spring; (c) summer; (d) autumn; and (e) winter.
Remotesensing 17 02365 g005
Figure 6. Factor detection results of driving forces on the SWEM.
Remotesensing 17 02365 g006
Figure 7. The q-statistic distribution and its interannual changes from 1990 to 2022 that indicate the influence of driving factors on SWEM distribution.
Remotesensing 17 02365 g007
Figure 8. Interaction detection heatmap of driving factors. Note: the heatmap was generated using Python 3.9 based on the interaction results from the GeoDetector model. Note: symbols (↓, ↑↑, —, ↑↑↑) represent non-linear reduction, two-factor enhancement, independence and non-linear enhancement.
Remotesensing 17 02365 g008
Figure 9. Mean values of the SWEM under different levels of driving factors based on risk detection.
Remotesensing 17 02365 g009
Figure 10. Spatiotemporal variations of key natural driving factors influencing SWEM in Inner Mongolia from 1990 to 2020: (a) gale days, (b) NDVI, (c) total annual precipitation, and (d) mean annual temperature.
Remotesensing 17 02365 g010
Table 1. Summary of data sources.
Data TypeInput ParametersAcronymResolutionTime SeriesData Sources
Meteorological dataWind speed (m·s−1)WSSite
statistics
1990–2022https://cds.climate.copernicus.eu/, accessed on 1 March 2025
Gale days (days)GD
Precipitation (mm)PRE
Temperature (°C)TEM
Soil dataSoil sand content (%)SA1 kmConstanthttps://data.isric.org/, accessed on 3 March 2025
Soil silt content (%)SI
Soil clay content (%)CL
Soil organic matter content (%)OM
Calcium Carbonate Content (%)CACO3
Land-use/cover dataLand useLUCC30 m1990–2022https://doi.org/10.5281/zenodo.5816591, accessed on 4 March 2025
Remote sensing dataSnow depth (mm)SD0.1°1990–2022https://cds.climate.copernicus.eu/, accessed on 5 March 2025
Evapotranspiration (mm)PET1km1990–2022https://data.tpdc.ac.cn/, accessed on 6 March 2025
Normalized Difference Vegetation IndexMODIS-NDVI
GIMMS-NDVI
250 m
8 km
1990–2000
2001–2022
https://ladsweb.modaps.eosdis.nasa.gov/, accessed on 7 March 2025
Digital Elevation Model (m)DEM30 mConstanthttps://www.gscloud.cn/, accessed on 8 March 2025
Socio-economic dataGross Domestic ProductGDPCounty
statistics
1990–2020https://www.resdc.cn/, accessed on 10 March 2025
Population densityPD1990–2020https://www.resdc.cn/, accessed on 10 March 2025
Sheep unit densitySUD1990–2016https://tj.nmg.gov.cn/, accessed on 10 March 2025
Table 2. Parameter values corresponding to different land-use types.
Land-Use TypeCoefficients
Forest−0.1535
Grassland−0.1151
Barren−0.0768
Cropland−0.0438
Table 3. Classification of soil wind erosion modulus.
ClassificationAbbreviationVegetation
Coverage (%)
Soil Wind Erosion
Thickness (mm/a)
Soil Wind Erosion
Modulus [t·ha−1·yr−1]
TolerableTE>70<2<2
LightLE50–702–102–25
ModerateME30–5010–2525–50
SevereSE10–3025–5050–80
Extremely SevereESE<1050–10080–150
DestructiveDE<10>100>150
Table 4. Classification of interaction types in the Geodetector model.
Types of InteractionDescriptionsSymbol
Non-linear reductionq(X1∩X2) < Min(q(X1), q(X2))
Single-factor non-linear reductionMin(q(X1), q(X2)) < q(X1∩X2) < Max(q(X1), q(X2))
Two-factor enhancementq(X1∩X2) > Max(q(X1), q(X2))↑↑
Independentq(X1∩X2) = q(X1) + q(X2)
Non-linear enhancementq(X1∩X2) > q(X1) + q(X2)↑↑↑
Table 5. q and p values of key driving factors.
Driversq Valuep Value
GD0.206 p < 0.001
NDVI0.181 p < 0.001
PRE0.178 p < 0.001
WS0.129 p < 0.001
TEM0.114 p < 0.001
DEM0.033 p < 0.001
PD0.032 p < 0.001
SUD0.030 p < 0.001
GDP0.029 p < 0.001
Disclaimer/Publisher’s Note: The statements, opinions and data contained in all publications are solely those of the individual author(s) and contributor(s) and not of MDPI and/or the editor(s). MDPI and/or the editor(s) disclaim responsibility for any injury to people or property resulting from any ideas, methods, instructions or products referred to in the content.

