1. Introduction
Developing countries face governance challenges in impoverished urban areas amid the ongoing global urbanization. The expansion of slums not only reflects the challenges of structural inequality in urban development—where low-income groups are forced to cluster due to insufficient housing, environmental conditions, and sanitation infrastructure—but also directly impacts the quality of life for their residents and the effectiveness of urban governance. In this context, the establishment of an accurate and efficient settlement identification and monitoring system has become the primary technical challenge to achieving the United Nations’ (UN’s) housing security goals.
The formation of slums is primarily driven by rapid urban population growth. Its speed exceeds the government’s ability to provide housing, environmental services, and sanitary infrastructure, leaving low-income groups struggling to access adequate and affordable living conditions [
1]. The traditional method based on field surveying and mapping [
2] is inefficient and labor-intensive, making it difficult to meet the increasing needs due to the significant increase in the number of slums [
3]. Therefore, using remote sensing technology combined with artificial intelligence to conduct large-scale, long-term “spatiotemporal dynamic” mapping of slums has become a new method that has attracted considerable attention [
3].
Given that slums show significant morphological differences in different regions, cities, and development stages, their complexity and diversity make it extremely difficult to construct a generalized remote sensing inversion model of slums, limiting the applicability of traditional remote sensing inversion methods in this field [
3]. Therefore, the method of visual interpretation based on remote sensing images has become popular. Such methods need to be performed by professionals. Professionals can be experts from local or non-local areas, but local experts possess contextual expertise, enabling them to avoid overlooking local opinions, geo-ethical issues, and other concerns during annotation [
2]. Although the method based on manual labeling by professionals has significantly reduced the cost compared with traditional offline visits, it still faces the problem of high human and material consumption. Therefore, understanding how to efficiently and accurately extract slums through modern automated methods has become an important challenge in current remote sensing and urban planning research.
Considering this backdrop, automatic recognition methods based on artificial intelligence have emerged. ML, as a discipline that combines statistical modeling with algorithm optimization, is capable of automatically extracting patterns and features from data, achieving task automation [
4]. These algorithms typically possess a strong learning ability and can effectively adapt to the diverse characteristics of slum morphology. Algorithms such as random forest [
5], K-means clustering [
6], support vector machine (SVM) [
7], and logistic regression [
8] have been widely applied in the extraction of slums from remote sensing images. Researchers have made targeted improvements to these algorithms to further improve the recognition effect. Leonita et al. compared the performance of the improved SVM with the random forest algorithm in a slum identification task in Bandung, India, and pointed out that the optimized SVM can achieve a recognition accuracy of up to 88.5% [
9]. Cunha et al. compared eight classification models based on data from the slums of Rio de Janeiro and they found that GradientBoost and XGBoost exhibited high robustness and accuracy in complex urban environments [
10]. Gram-Hansen et al. proposed the use of canonical correlation forests for slum extraction on low-resolution remote sensing data, providing an economically effective solution for urban monitoring under resource-constrained conditions [
11].
In recent years, DL has gradually become a major research topic in the field of remote sensing image processing with the significant improvement in hardware performance and the development of big data technologies. DL is a branch of ML [
12]. Moreover, DL possesses outstanding feature learning capabilities on high-dimensional, unstructured data due to its multi-layer neural network models. The representational power and adaptability of DL are more remarkable compared with traditional ML [
13].
Convolutional neural networks (CNNs) are widely used in image analysis tasks, including classical models, such as LeNet-5 [
14], AlexNet [
15], VGG [
16], and GoogLeNet (Inception) [
17]. Numerous scholars are dedicated to exploring DL methods, which are suitable for slum extraction, based on these network structures. Ibrahim et al. developed the predictSLUMS model, which integrates spatial statistical information with artificial neural networks and utilizes street intersection data to achieve high-precision identification of slums with a small amount of data [
18]. Haworth et al. proposed the URBAN-i model, which focuses on data fusion and integrated information from aerial and street view images to achieve the multi-scale detection of urban informal areas [
19]. Verma et al. utilized a pre-trained CNN model to construct a specialized training set using ultra-high-resolution and medium-resolution satellite imagery for the detection and segmentation of slum areas [
20]. Lu et al. designed GASlumNet, which combines a dual-branch architecture of Unet and ConvNeXt, utilizing the two branches to identify high-resolution images and geological feature images, respectively. The efficiency and robustness of the model in slum extraction tasks were validated in the case of Mumbai, India [
21].
In effectively recognizing slum areas, the features of the slums must be extracted. Previous studies have made substantial summaries. For example, UN-Habitat asserts that slums typically lack access to clean water sources, sanitation facilities, adequate living space, stability, and safety [
22]. Verma et al. proposed that slum settlements can be distinctly identified through their unique architectural morphology characterized by high building density and disorganized development patterns [
21]. Pedro et al. identified the following defining features of slums: irregular spatial configurations, the absence of pathways wider than 3 m, lack of public green spaces, extreme building density (with roof coverage exceeding 90%), the dominance of small-scale structures, and the occupation of hazard-prone locations adjacent to railways, major roadways, and riverbanks [
23].
This study summarizes the various characteristics of slums based on related research and classifies them based on the types of data sources, which are required when computers obtain these characteristics. This task is carried out to set the input image categories in the dataset for model recognition. The specific classification is shown in
Table 1. This classification approach can better guide the construction of datasets. DL models demonstrate inherent superiority in image feature extraction through their capacity to automatically capture multi-scale features via convolutional operations. This hierarchical feature learning mechanism enables comprehensive characterization of visual patterns across spatial resolutions [
24]. When creating the dataset, one simply sets the corresponding images, and the model will automatically extract the features of slums.
However, the training of DL models is highly dependent on high-quality datasets. In the field of building extraction in remote sensing imagery, the current datasets that are widely used include the following: WHU Building Dataset [
25], Massachusetts Buildings Dataset [
26], and Open AI Tanzania Buildings Dataset. Fang et al. pointed out that the cross-modal fusion of complementary information from multi-spectral remote sensing images can enhance the perception capability of detection algorithms, thereby making them highly robust and reliable in broad applications [
27]. However, remote sensing datasets focusing on slum areas are not only extremely scarce but also mostly contain only RGB band images, lacking multi-spectral or other specific band information that can fully characterize the geospatial semantic features of slums. Considering the significant role of multispectral images in the identification of slums, this study has constructed the São Paulo slums dataset. This dataset not only includes high-resolution RGB images but also integrates three key geospatial indicator images, enriching the research materials in this domain.
In the continuous evolution of DL models, the U
2-Net, a two-level nested U-shaped structure proposed by Qin et al., efficiently performs in multi-scale feature extraction [
28]. This model stacks the U-shaped residual U (RSU) blocks in the form of a Unet, forming a two-layer nested U-shaped structure, which can extract multi-scale features from the image without reducing the image resolution. Their research shows that the model exhibits strong competitiveness compared with state-of-the-art (SOTA) methods on six public datasets. Although U
2-Net was initially mainly used for salient object detection tasks, after targeted improvements, it can also be successfully applied to binary classification tasks, such as slum image segmentation. This mechanism provides a new technological approach to the automatic monitoring of urban poverty areas.
U
2-Net achieves high-precision edge perception through its nested U-shaped architecture and deep supervision mechanism. The dense feature pyramid of the model has advantages in extracting local details. However, the direct application of U
2-Net for slum extraction will result in numerous challenges. For instance, the multi-level recursive downsampling of the model results in a limited effective receptive field (ERF) [
29]. When the input resolution decreases, the blurring of local textures exacerbates the issue of contextual discontinuity caused by insufficient receptive fields. Most multispectral images possess only low resolution due to technological constraints. Consequently, U
2-Net is unsuitable for recognition tasks involving low-resolution geoscientific indicator images of slums. Furthermore, remote sensing images exhibit distinct geospatial sensitivity characteristics compared with conventional optical imagery. Nevertheless, the existing U
2-Net model lacks a targeted spatial encoding mechanism, failing to adequately parse the geospatial coordinate attributes embedded in the imagery during feature extraction. This structural deficiency hinders the network’s ability to effectively capture the precise spatial correlation properties of surface targets.
By contrast, DeepLabv3+ [
30] incorporates multi-scale dilated convolutions through Atrous Spatial Pyramid Pooling (ASPP), expanding the global receptive field while maintaining the resolution of feature maps. When combined with the strong representation ability of low-resolution features from backbone networks, such as Xception, this model precisely compensates for the shortcoming of U
2-Net, making it suitable for identifying slum geospatial indicators in images. Furthermore, considering the unique characteristic of remote sensing images being highly sensitive to spatial positions, this study improves the U
2-Net by adding a CoordAttention mechanism [
31], enabling it to effectively extract the spatial coordinate semantics of remote sensing images.
The main contributions of this study are summarized as follows:
- (1)
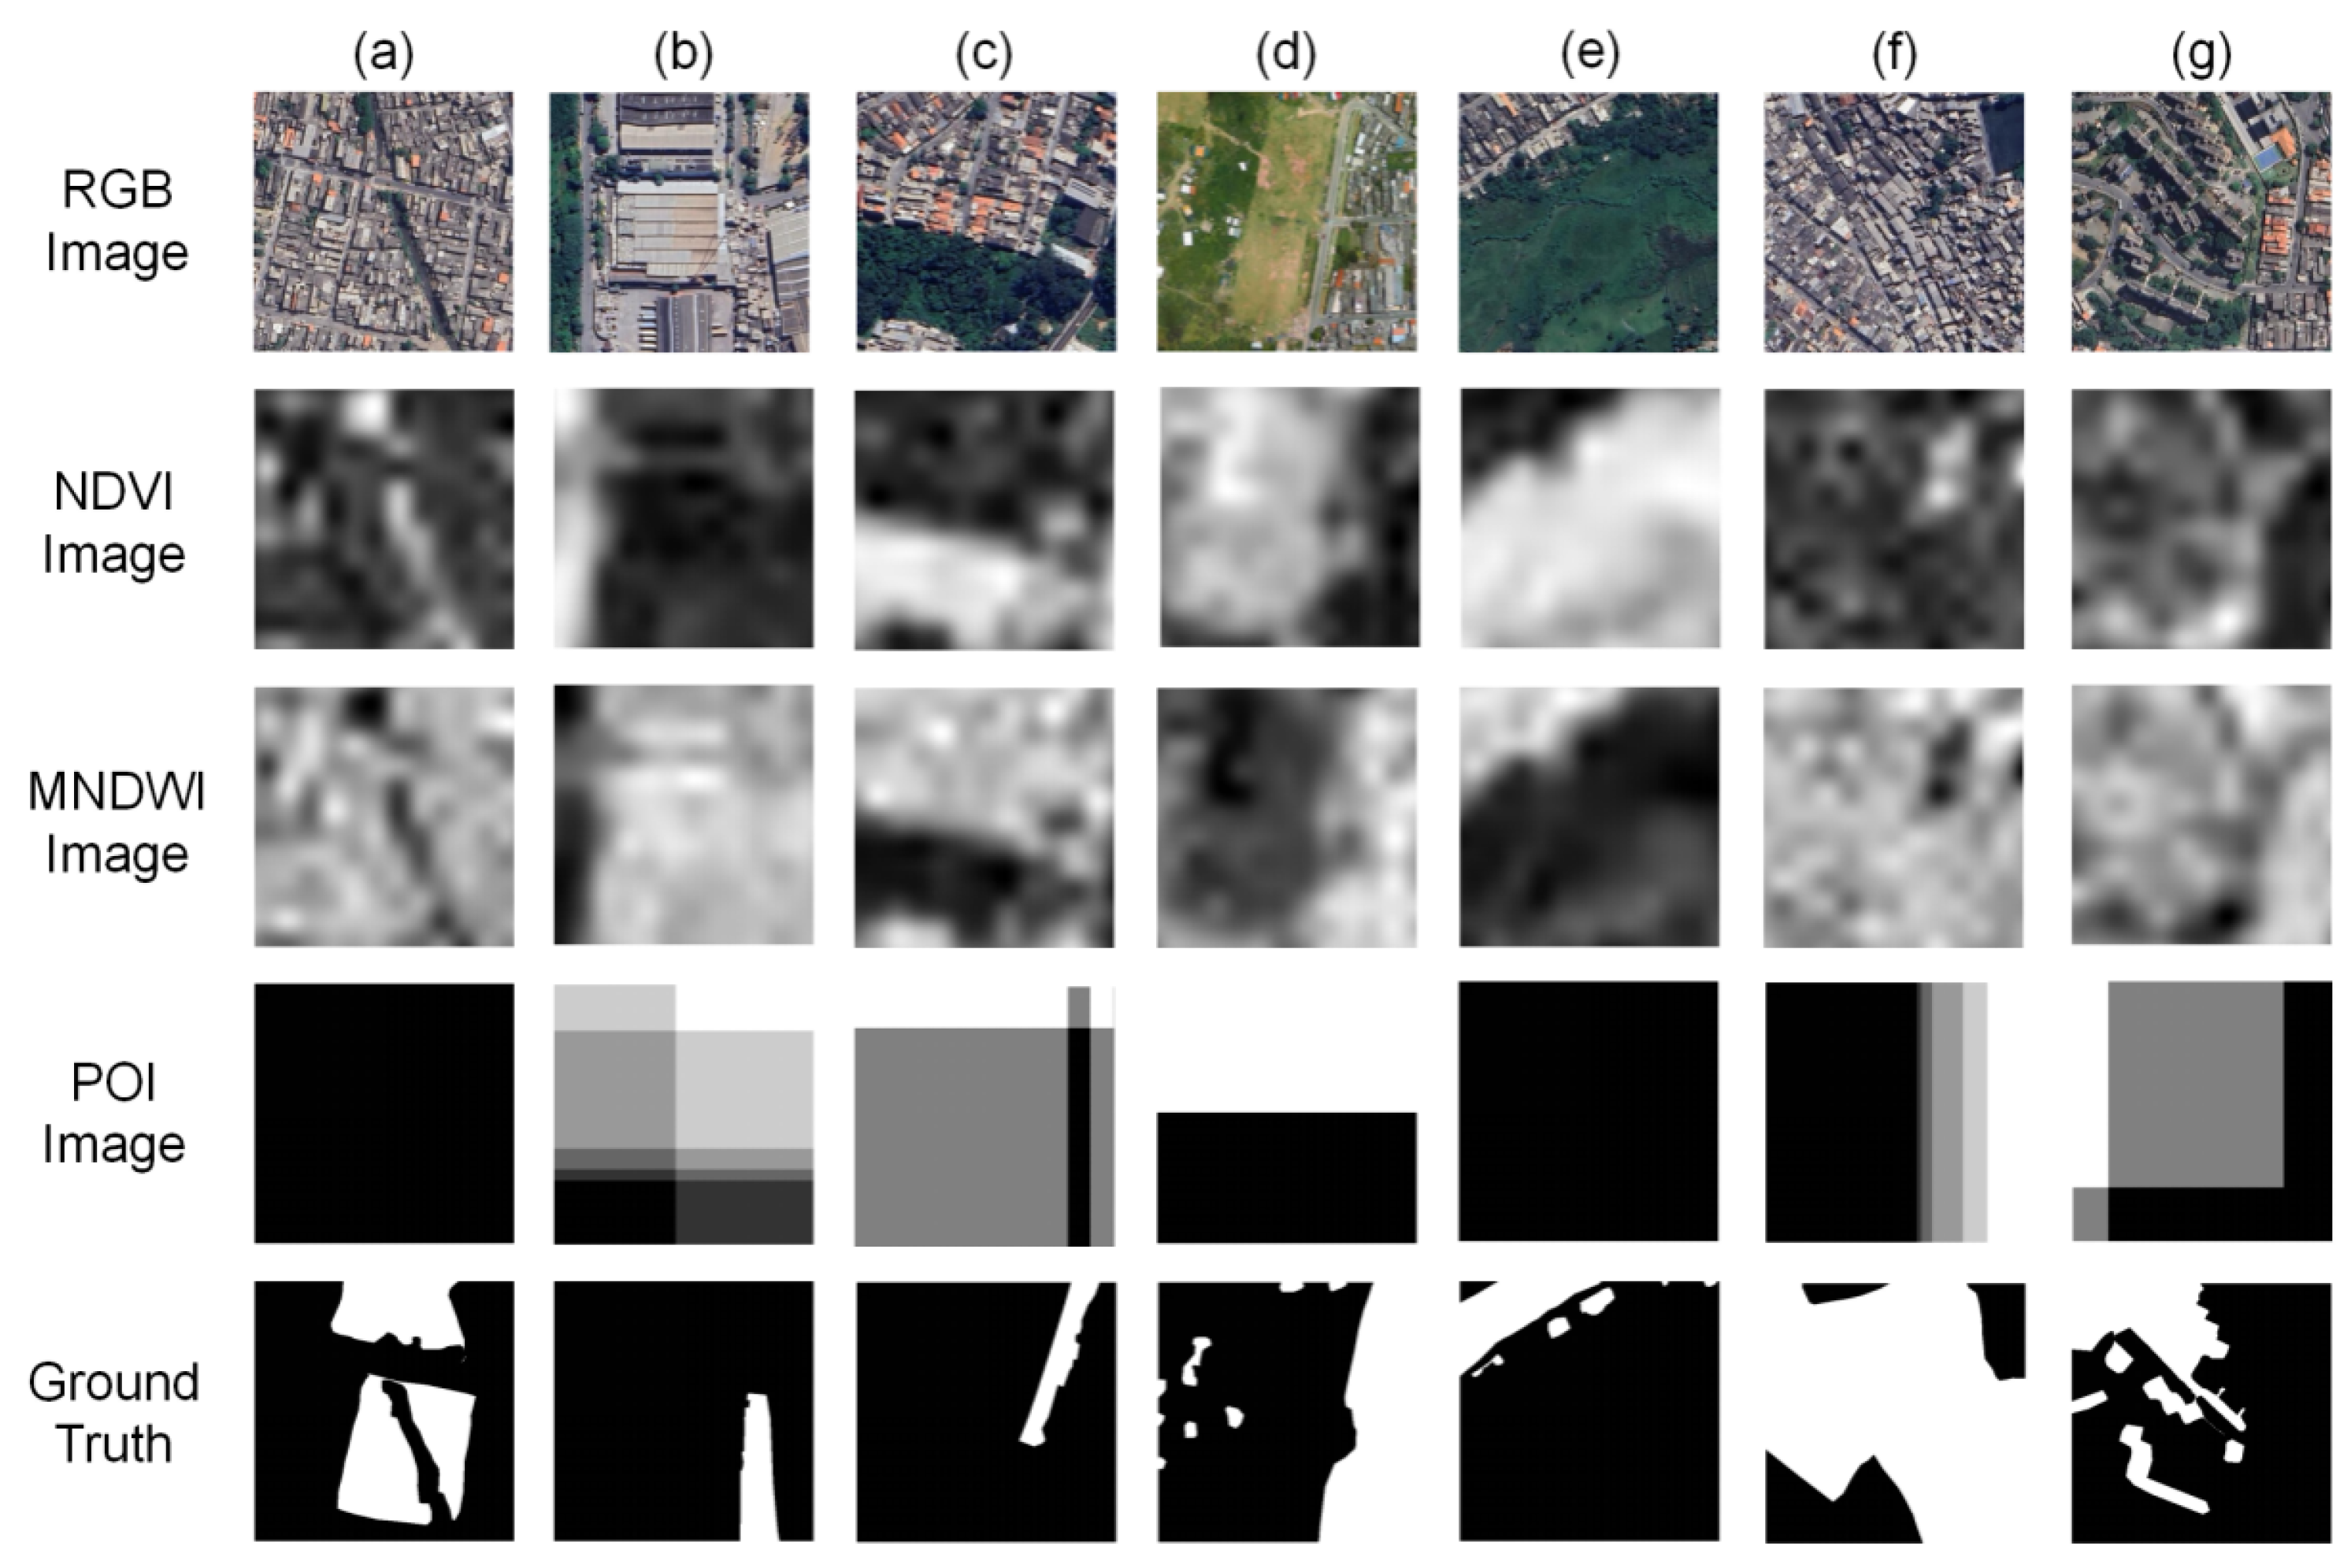
The São Paulo slums dataset has been created. The dataset contains 7878 images with a 512 × 512 resolution, with spatial resolutions of 0.5 m for the RGB imagery and POI indicator images and 20 m for the NDVI and MNDWI indicator images.
- (2)
The coordinate-attentive U
2-DeepLab network (CAU
2DNet) model is designed and constructed in this study for the slum extraction problem. The model is a two-branch network architecture that combines two branches of U
2-Net and DeepLabV3+ and introduces the CoordAttention mechanism to fully explore the image and geo-semantic features. The code for the CAU
2DNet model can be obtained from the following URL:
https://github.com/luoooxia/CAU2DNet (accessed on 24 May 2025).
Section 2 will introduce the study area and the creation method of the São Paulo slums dataset;
Section 3 will introduce the internal structure and specific details of CAU
2DNet;
Section 4 will introduce the datasets and methods used for experiments, the parameters set for model training, and the comparative evaluation of the models; and
Section 5 will conduct ablation experiments and summarize the entire study.
3. Methodology
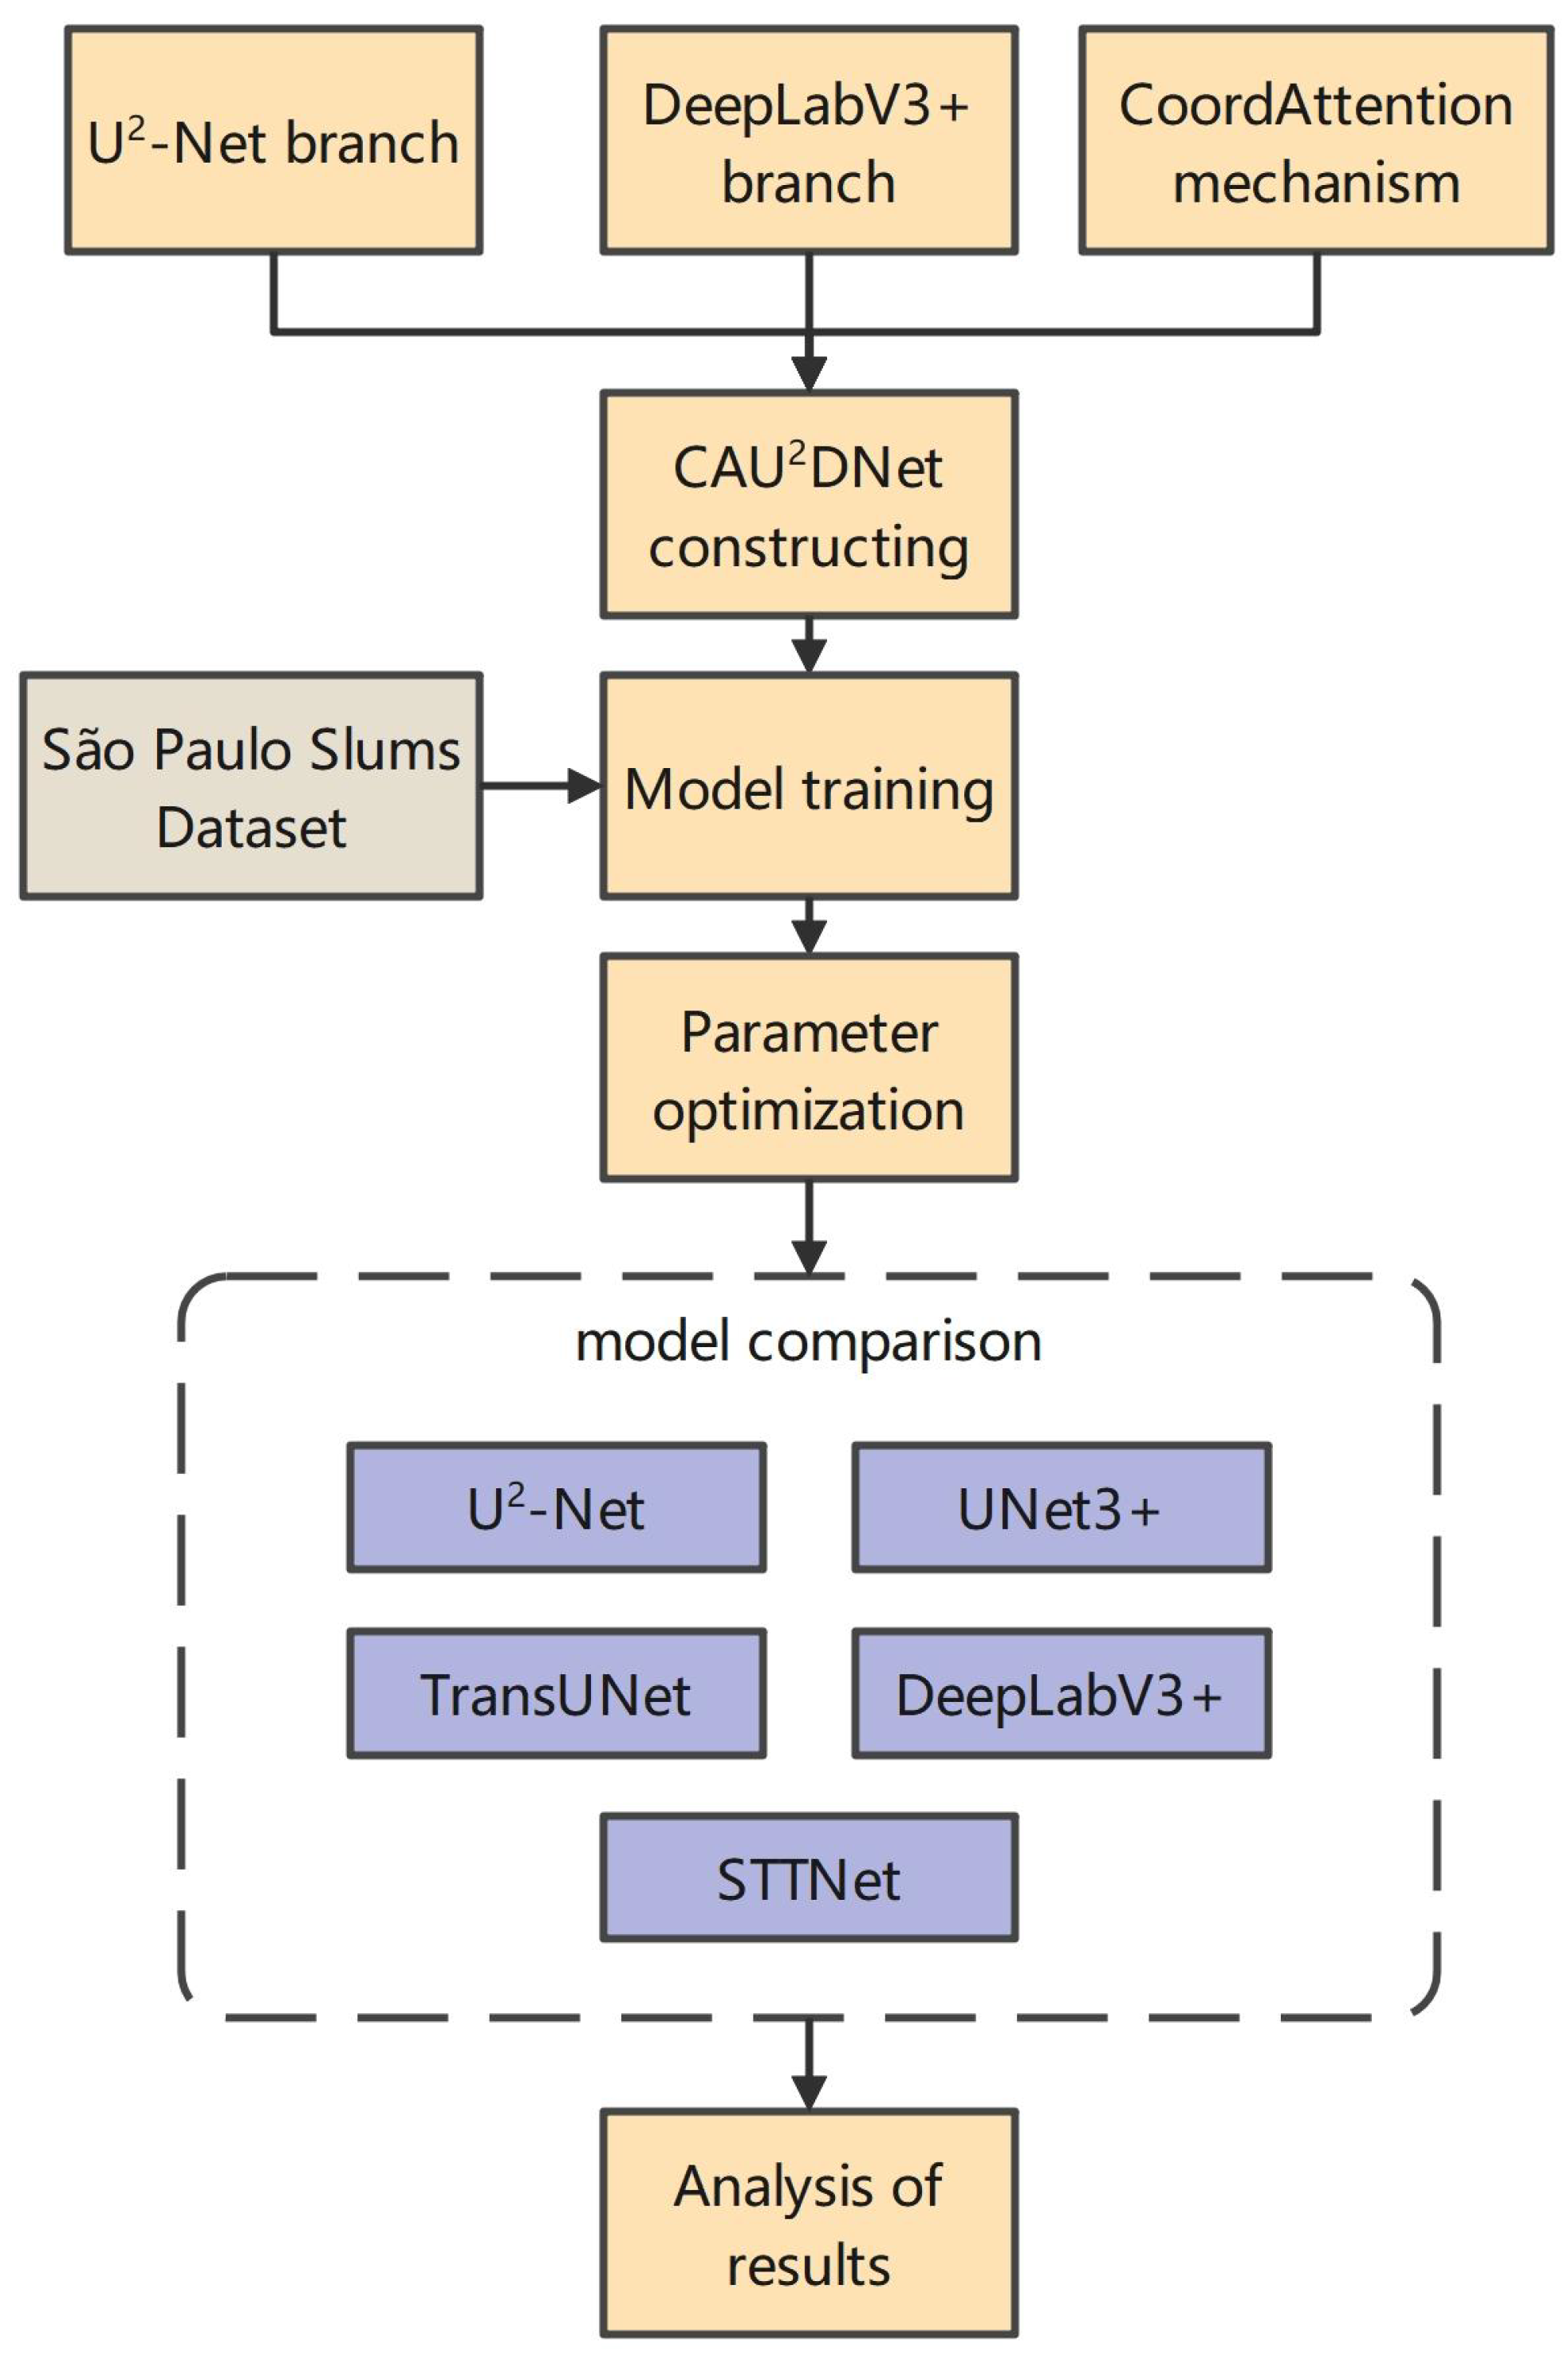
This section will outline the overall framework of the CAU
2DNet model. The model inputs the RGB and geoscientific indicator images into two separate branches and fuses the results using a weighted sum approach for feature integration. Moreover, this study made some improvements and introduced the CoordAttention attention mechanism to effectively adapt the model to the task of slum recognition, thereby enhancing the accuracy of the model. The technical roadmap of this study is shown in
Figure 6.
3.1. Model Overview
CAU
2DNet adopts a dual-stream encoding–decoding architecture, and its mathematical model can be formally defined as follows:
where
represents the decision fusion function, and
and
correspond to the two branches of CAU
2DNet.
The model structure is shown in
Figure 7,
CAU2DNet consists of two branches: the U2-Net branch is responsible for processing RGB image inputs . This model achieves outstanding segmentation accuracy due to its nested U-shaped architecture, which effectively aggregates multi-scale features, making it particularly suitable for processing complex high-resolution remote sensing images. The DeepLabV3+ branch is responsible for processing geoscientific indicator image inputs . The ASPP module of the model significantly expands the receptive field through multi-scale dilated convolutions, effectively capturing context information at different scales, making it suitable for processing lower-resolution geoscientific auxiliary images.
This study introduced the CoordAttention mechanism into the U
2-Net branch to further enhance the performance of the model in slum remote sensing recognition tasks. This study cascades a CoordAttention mechanism module after each RSU block in the original U
2-Net. This mechanism enhances the network’s spatial perception by explicitly modeling spatial coordinate information, which helps in accurately locating target areas and improving the segmentation accuracy. This study replaced the backbone network of the DeepLabV3+ branch from Xception to ConvNextV2 [
33], which utilizes advanced convolutional design and sparse gating mechanisms, enabling efficient feature extraction, thereby enhancing the model’s recognition accuracy and receptive field range.
In terms of the integration mechanism, this study designed a decision-level integration strategy. Specifically, this strategy involves processing the input image on two separate branches and generating preliminary segmentation results, which are then fused through a weighted sum approach. The fusion weights are set as learnable model parameters
and
, which are automatically learned as the optimal weights through the optimization algorithm during the training process. The calculation formula is as follows:
The final fusion result maps the output value range to the interval through the Sigmoid function to represent the probability of each pixel belonging to the slum area. The confidence threshold is set to 0.5. When the output value is greater than 0.5, the area is determined to be a slum area; otherwise, it is determined to be a non-slum area.
3.2. U2-Net Branch
U
2-Net adopts a nested U-shaped architecture, following a recursive downsampling–upsampling paradigm (
Figure 7a). The topological structure of this model can be formally described as an encoder–decoder structure with a hierarchical symmetry. The excellent recognition accuracy of this model makes it highly suitable for identifying RGB image information in CAU
2DNet.
Specifically, the encoder module of this branch contains six consecutive downsampling stages. Meanwhile, the decoder module consists of five upsampling stages. The output of the sixth downsampling stage is connected to the decoder through a feature projection layer. Moreover, skip connections are utilized between encoders and decoders at the same level to pass shallow information, allowing the model to effectively integrate deep semantic information while retaining high-resolution details. This model enables the decoder to retain the high-resolution features of the encoder, thereby helping in the restoration of the details and maintaining segmentation accuracy.
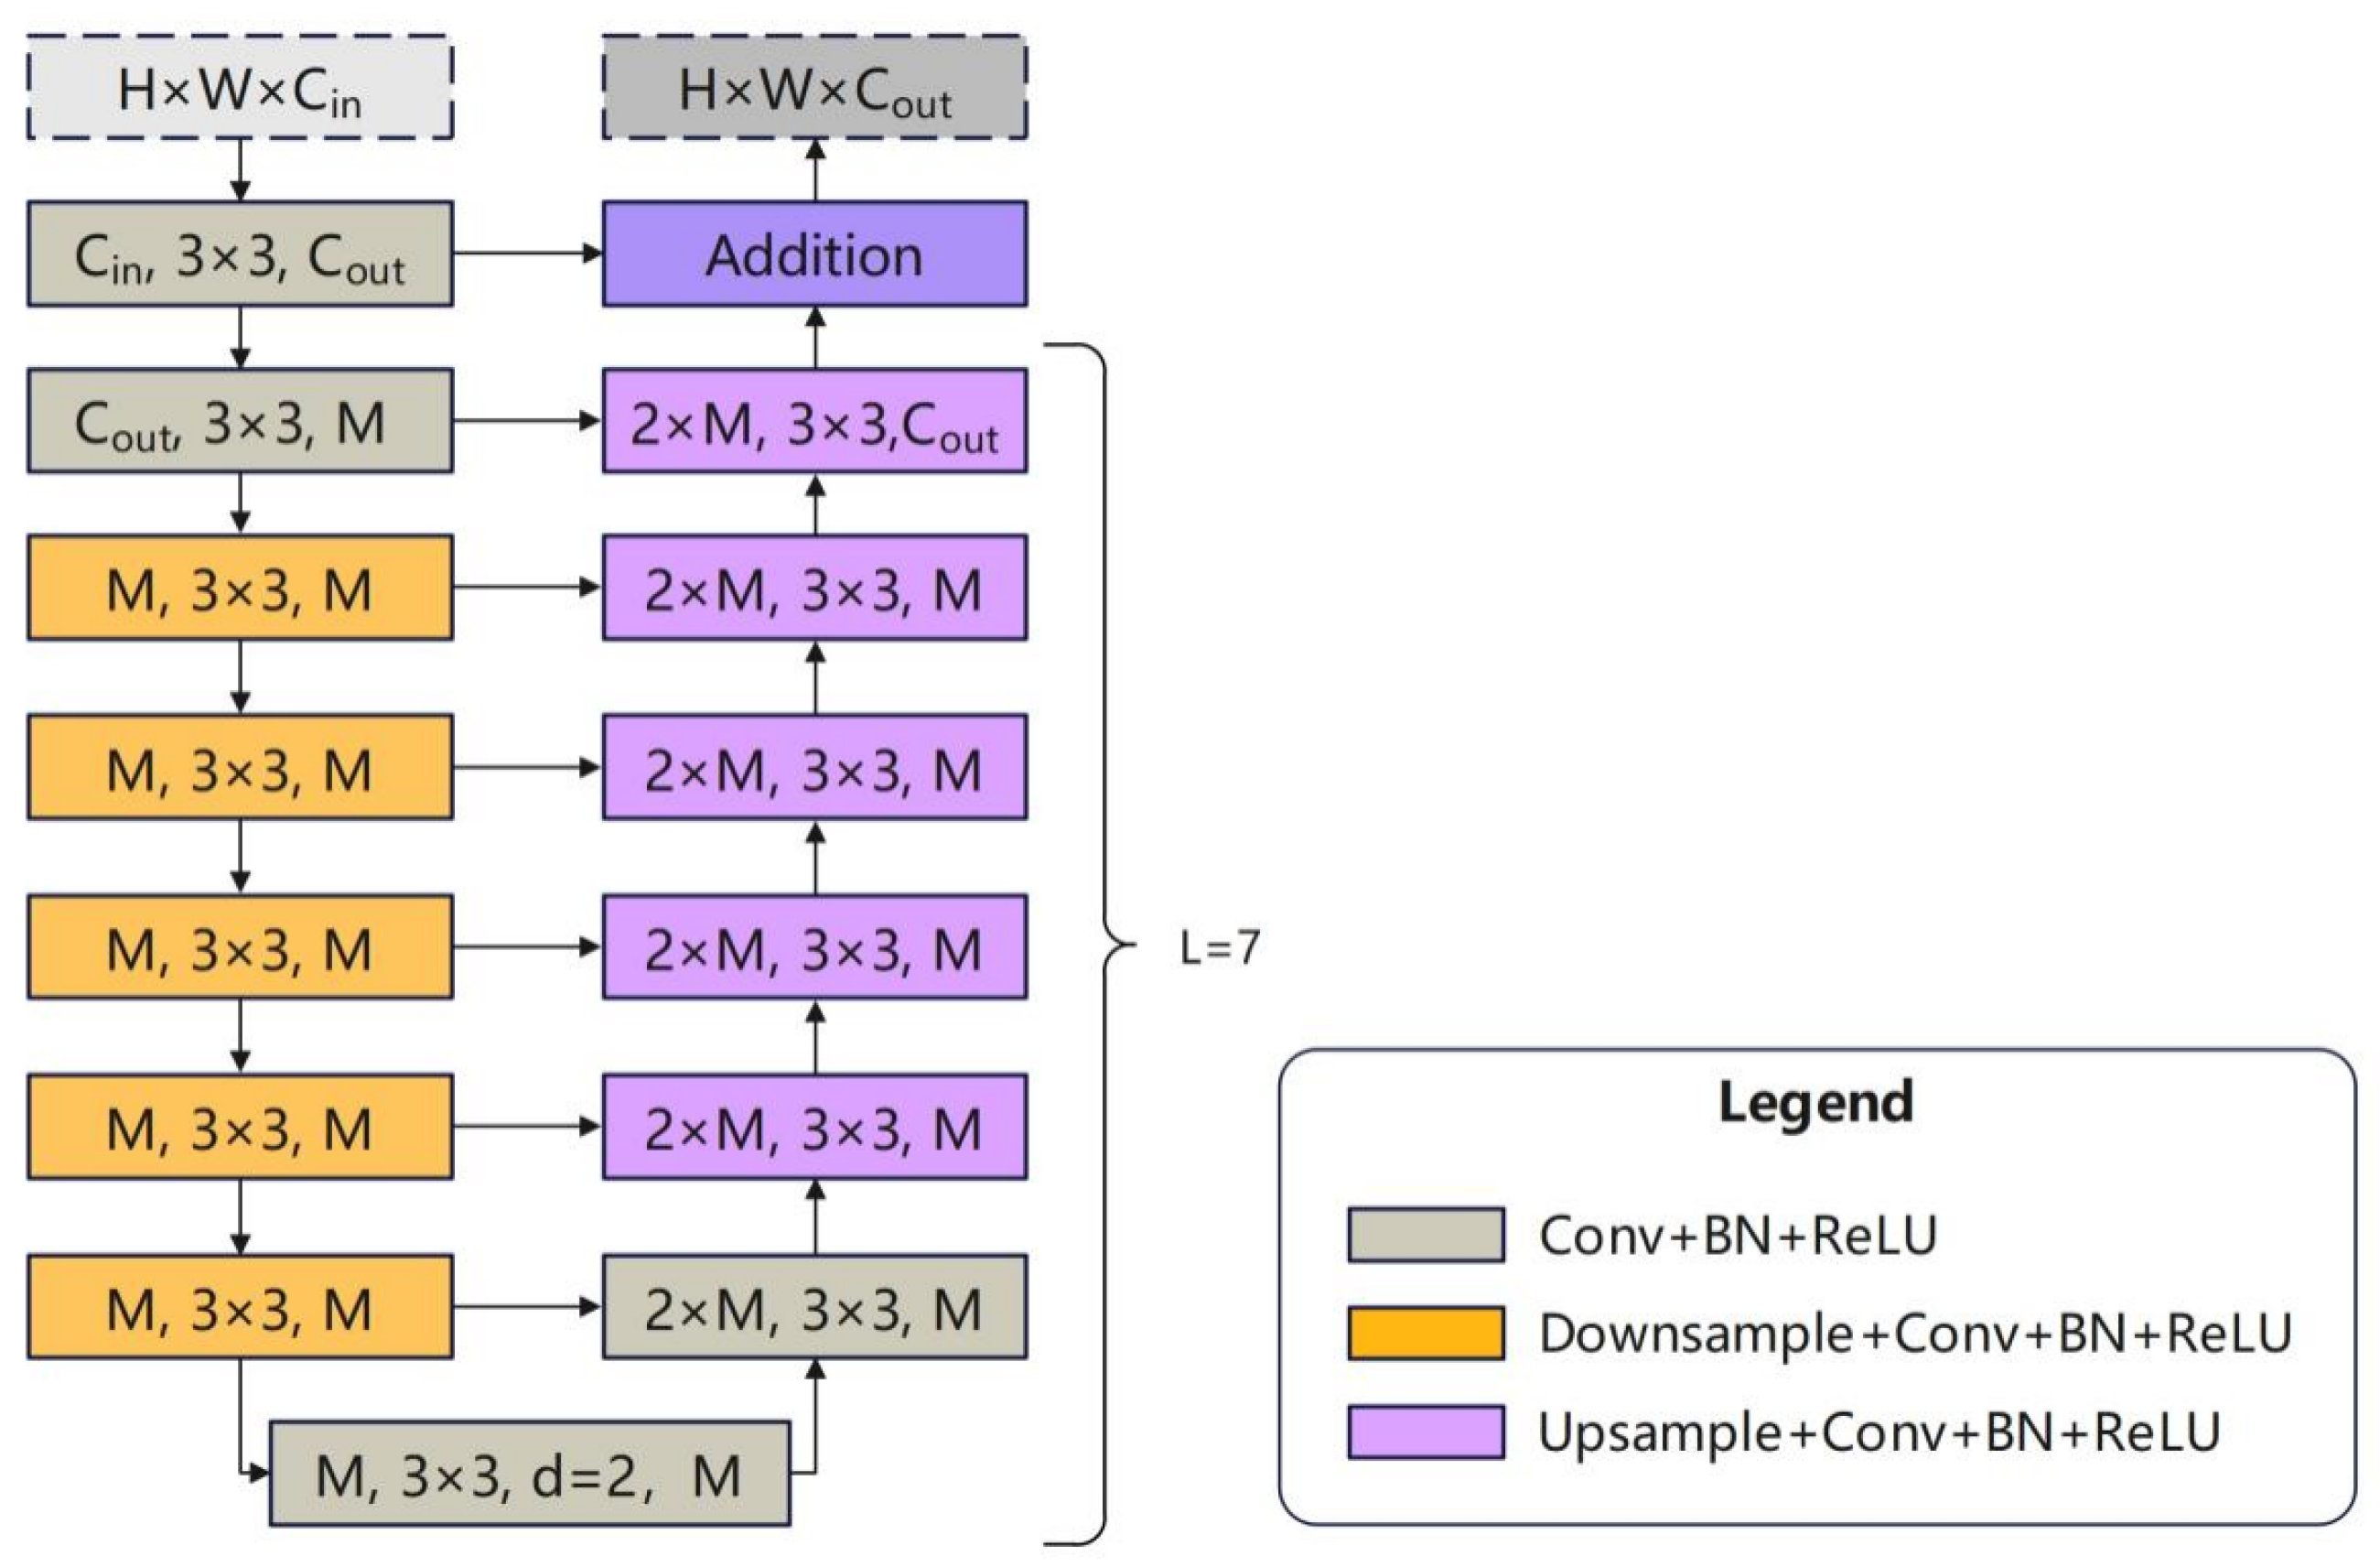
Each encoding and decoding stage utilizes the residual U (RSU) block, with its internal downsampling and upsampling structure shown in
Figure 8 and also performs skip connections on stages at the same level.
The depth of the RSU block at the
k-th layer is determined by the network level that it resides in, which satisfies the decreasing pattern. This deep adaptive design enables shallow networks to achieve a larger ERF through multiple downsampling operations. In the last two downsampling stages (
and
) and the first upsampling stage (
), further downsampling would result in the loss of substantial information due to the original image being compressed to a considerably small size. Therefore, these three stages use dilated convolution to replace upsampling, and the RSU used is referred to as RSU-4F. The output of the RSU block can be simply represented as follows:
where
represents the input vector, and
D and
U represent the downsampling and the upsampling operations respectively. In the U
2-Net branch of the CAU
2DNet model, the parameters of each RSU block are shown in
Table 3. In the U
2-Net branch, the encoder part of the input RGB image
can be defined as follows:
where
, and
represents the depth of the RSU block. The decoder part can be defined as follows:
where
to maintain the encoding and decoding symmetry and ⊕ represents the feature concatenation operation (skip connection).
U2-Net utilizes a feature fusion pattern that combines skip connections with deep supervision. In each RSU block, the feature maps are directly passed between the encoder and the decoder via skip connections. Thereafter, the feature maps passed to the decoder are fused with the upsampled feature maps through an additive fusion, which is element-wise addition.
In terms of deep supervision, the feature maps of the different scales outputted by the various decoders will be concatenated to achieve the fusion of multi-scale features, enabling U
2-Net to have good capabilities in preserving detailed information and capturing multi-scale features. The final mathematical expression is as follows:
where
represents a 1 × 1 convolution for channel compression, and ⊗ denotes the feature-level cascading operation, which is element-wise addition in this context.
In addressing the spatial location sensitivity characteristics of the remote sensing images that distinguish them from other types of images, this study improves the RSU module by cascading a coordinate attention module (CoordAttention) after its final upsampling layer to enable the model to identify slums. The calculation process of CoordAttention can be divided into feature encoding in two orthogonal directions, achieving location awareness through the embedding of coordinate information, thereby greatly improving the accuracy of identification in remote sensing images.
3.3. DeepLabV3+ Branch
The DeepLabV3+ model is an advanced semantic segmentation model, as shown in
Figure 6b, which combines an encoder–decoder architecture and an ASPP module. Its large receptive field makes it particularly suitable for identifying low-resolution geoscientific indicator images within the CAU
2DNet.
The backbone primarily utilizes existing pretrained DL models, such as ResNet [
34] or Xception [
35]. To enhance our model’s ability to recognize slum areas more effectively, this study selects ConvNextV2, which features a sparse gating mechanism as the backbone and retrains it on the São Paulo slums dataset.
The ASPP module is the encoder of DeepLabV3+, which captures multi-scale contextual information through dilated separable convolutions with different sampling rates, thereby enhancing the model’s ability to recognize targets of different sizes. This module consists of three parallel dilated convolution layers with different sampling rates, a pooling layer, and a 1 × 1 convolution layer. This design allows DeepLabV3+ to have a multi-scale receptive field, which can effectively perceive geoscientific indicator images with low resolution. This model can be simply represented as follows:
where
is the
i-th dilated convolutional layer, and
M is the number of dilated convolutional layers. The specific parameters of the ASPP module used in CAU
2DNet are shown in
Table 4. Given that the ASPP module does not change the size of the input feature map, the size of the input and output feature maps is 512 × 512.
The decoder part of the DeepLabV3+ is the main optimization portion of the model compared with the DeepLabV3 [
36]. This model utilizes skip connections to combine the output of the encoder with the output of the ASPP module. Specifically,
- (1)
The feature maps produced by the encoder’s ASPP module are upsampled to the resolution of the shallow features using bilinear interpolation by a factor of four.
- (2)
The shallow features of corresponding size from the backbone are extracted and concatenated with the output of the decoder and encoder.
- (3)
3 × 3 convolution is performed to refine the features.
- (4)
The feature maps are restored to their original resolution using 4× upsampling again.
These improvements can significantly enhance the segmentation effect of the model, especially in terms of restoring object boundaries. If this process is represented as
, then the input geoscientific indicator image input
. The DeepLabV3+ branch can be represented as follows:
where
represents the backbone part of DeepLabV3+, and
is the shallow part of the backbone.
3.4. ConvNextV2 Backbone
ConvNextV2 is a CNN that has been improved from ConvNext, incorporating self-supervised learning and architectural innovations. ConvNext is a pure convolutional model inspired by the Swin Transformer architecture, consisting of multiple ConvNext blocks combined with downsampling blocks. This model aims to combine the advantages of modern Transformer architectures while maintaining the efficiency and simplicity of CNNs. ConvNextV2 is used to replace Xception as the backbone network in the DeepLabV3+ branch in this study due to its faster computational efficiency and higher recognition accuracy compared with Xception.
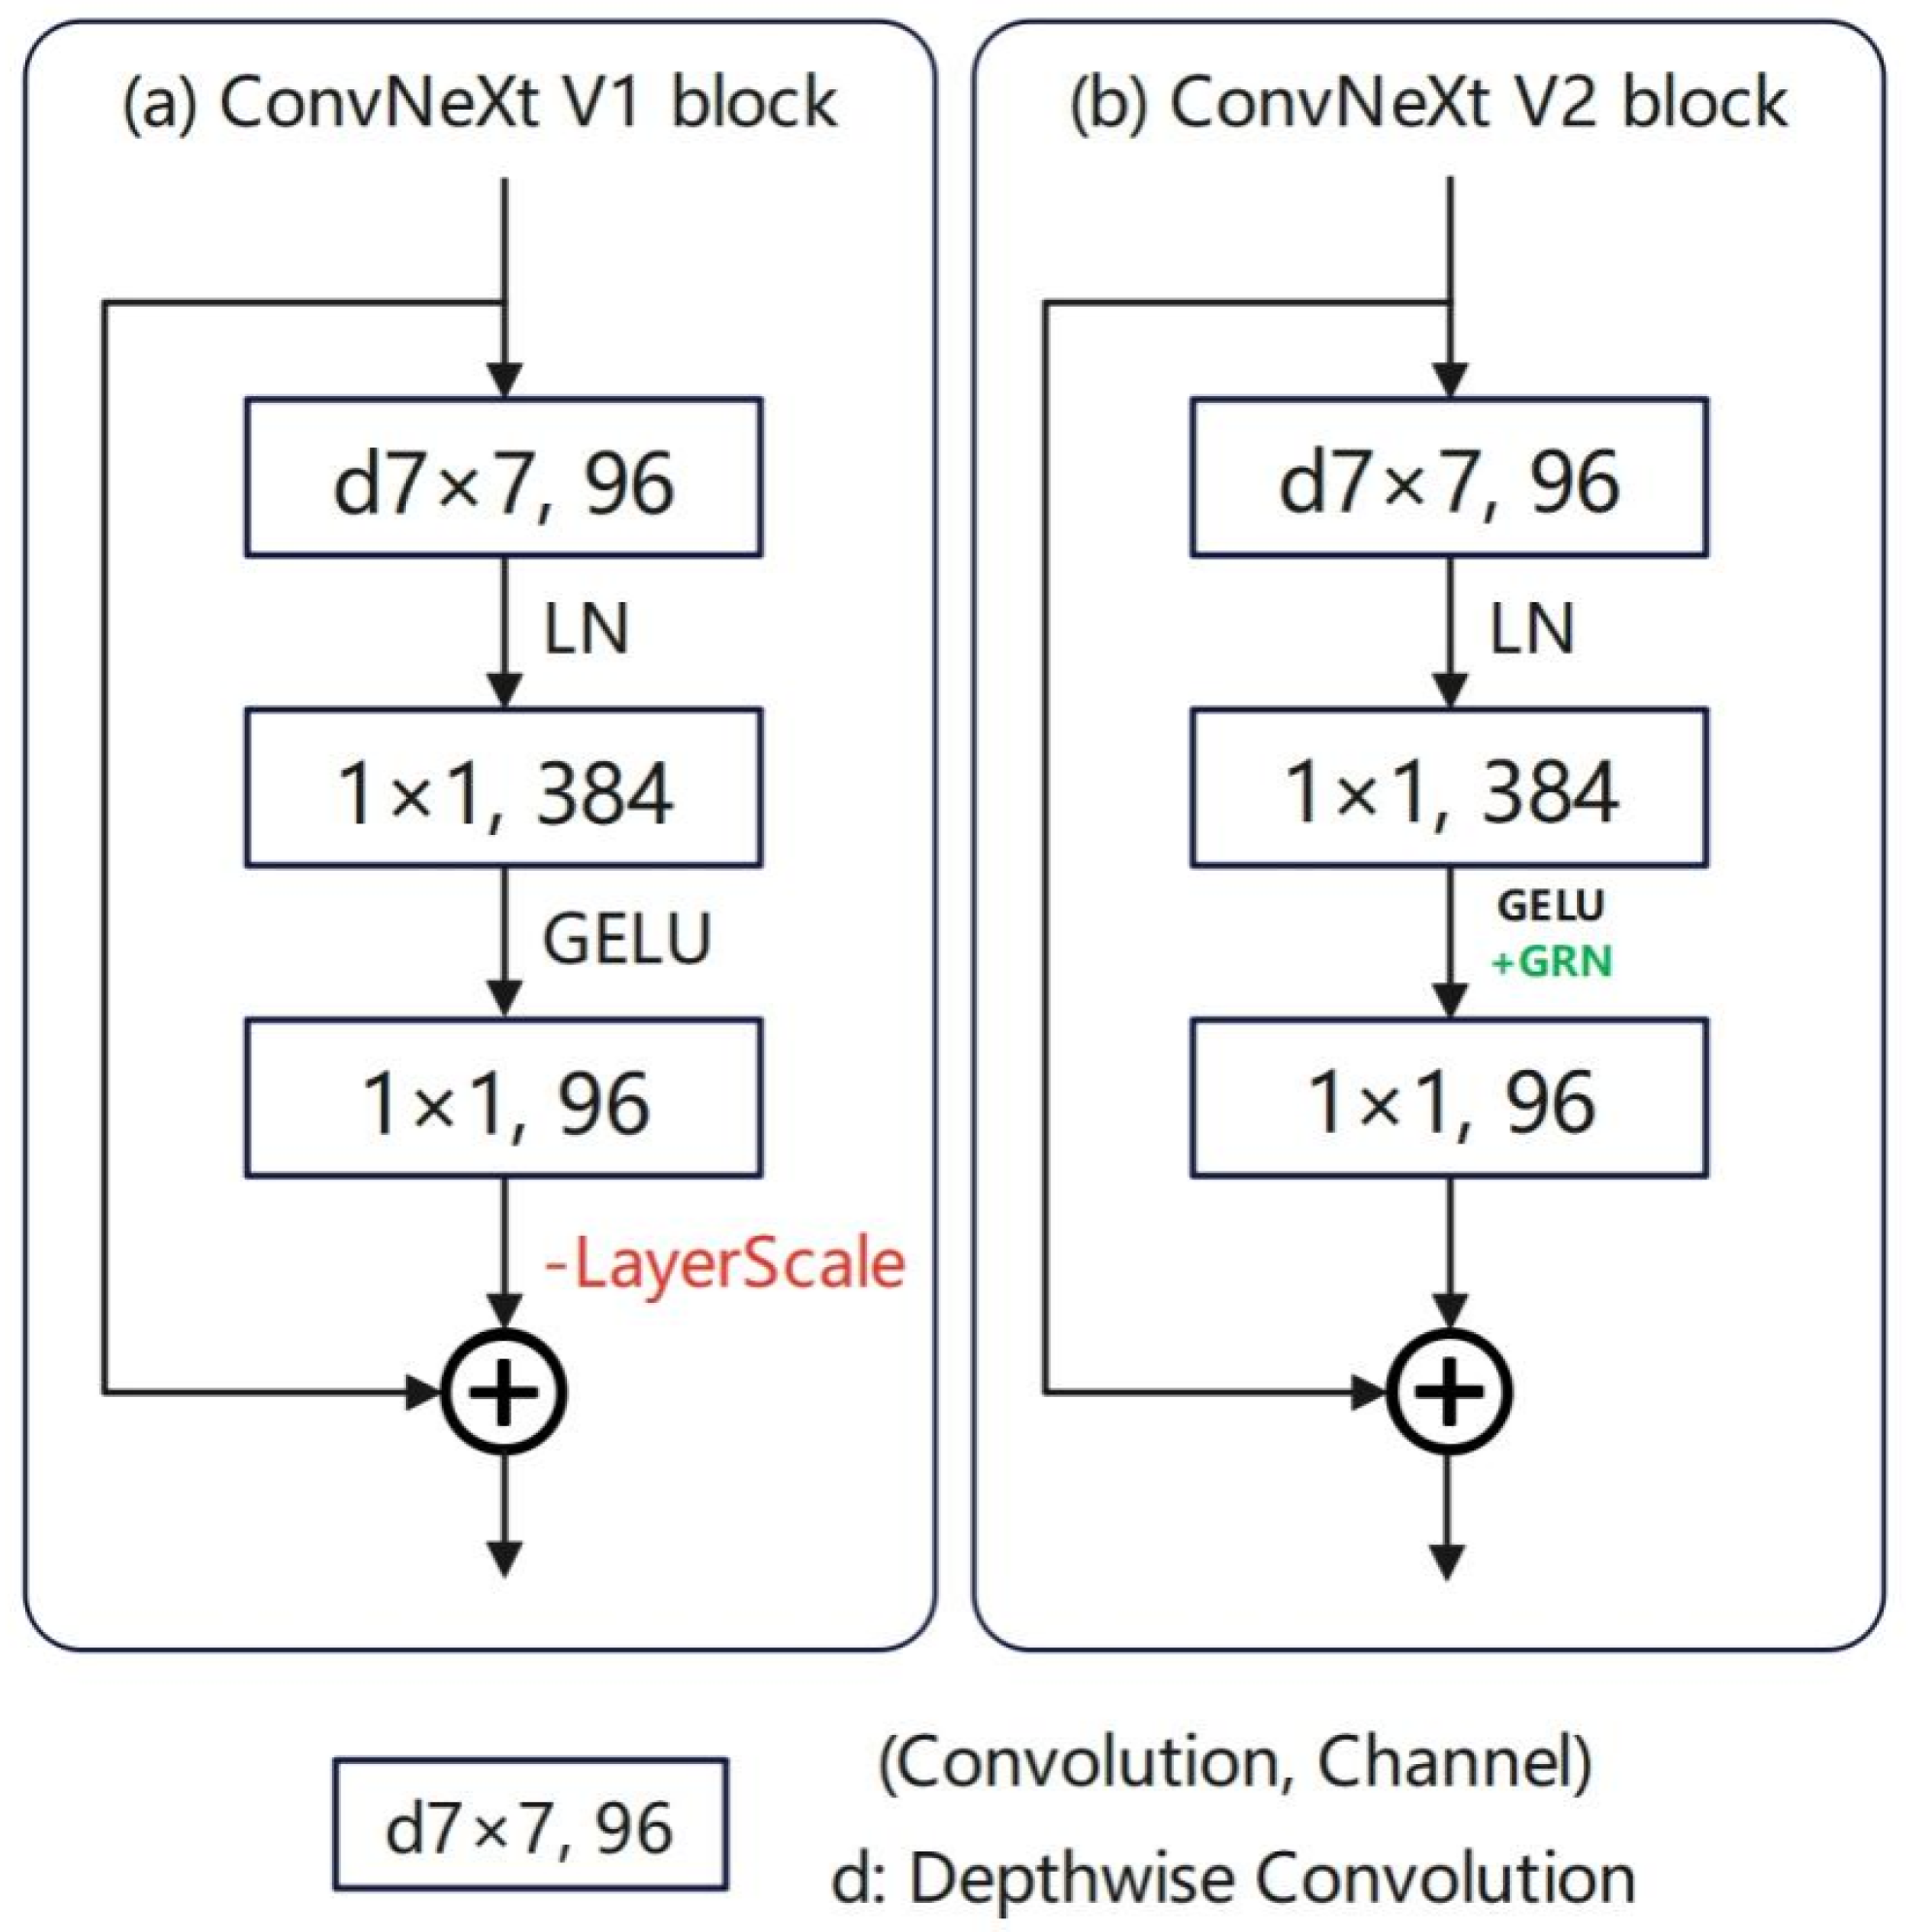
The ConvNext block structure is shown in
Figure 9a. The input feature map first enters a deep CNN layer to extract its local feature information and then passes through a 1 × 1 point-wise convolutional layer, which can adjust the number of channels and perform feature fusion without changing the spatial resolution of the feature map. Subsequently, a layer normalization layer is applied to accelerate the training of the model. Finally, the GeLU activation function is used to output the feature maps. The ConvNext block performs a skip connection at the end, adding the input to the output feature maps, to preserve substantial feature information and alleviate the gradient vanishing problem.
Compared to traditional CNN backbones, the main advantages of ConvNextV2 lie in its Global Response Normalization (GRN) layer (
Figure 9b) and sparse convolution mechanism. The GRN layer effectively mitigates the feature collapse through inter-channel feature competition, enabling the model to extract key features across different channels more evenly and enhance feature representation for low-resolution geoscientific indicator images. The sparse convolution mechanism performs convolution operations only on activated points, significantly reducing computational load while maintaining accuracy, making it particularly suitable for remote sensing image recognition tasks with large datasets. Additionally, subsequent ablation experiments demonstrate that replacing the backbone of DeepLabV3+ with ConvNextV2 leads to a 1.11% increase in Recall, a 1.03% improvement in F1 score, and an IoU boost to 0.6372. These results directly validate ConvNextV2’s optimization effects for low-resolution geoscientific feature modeling.
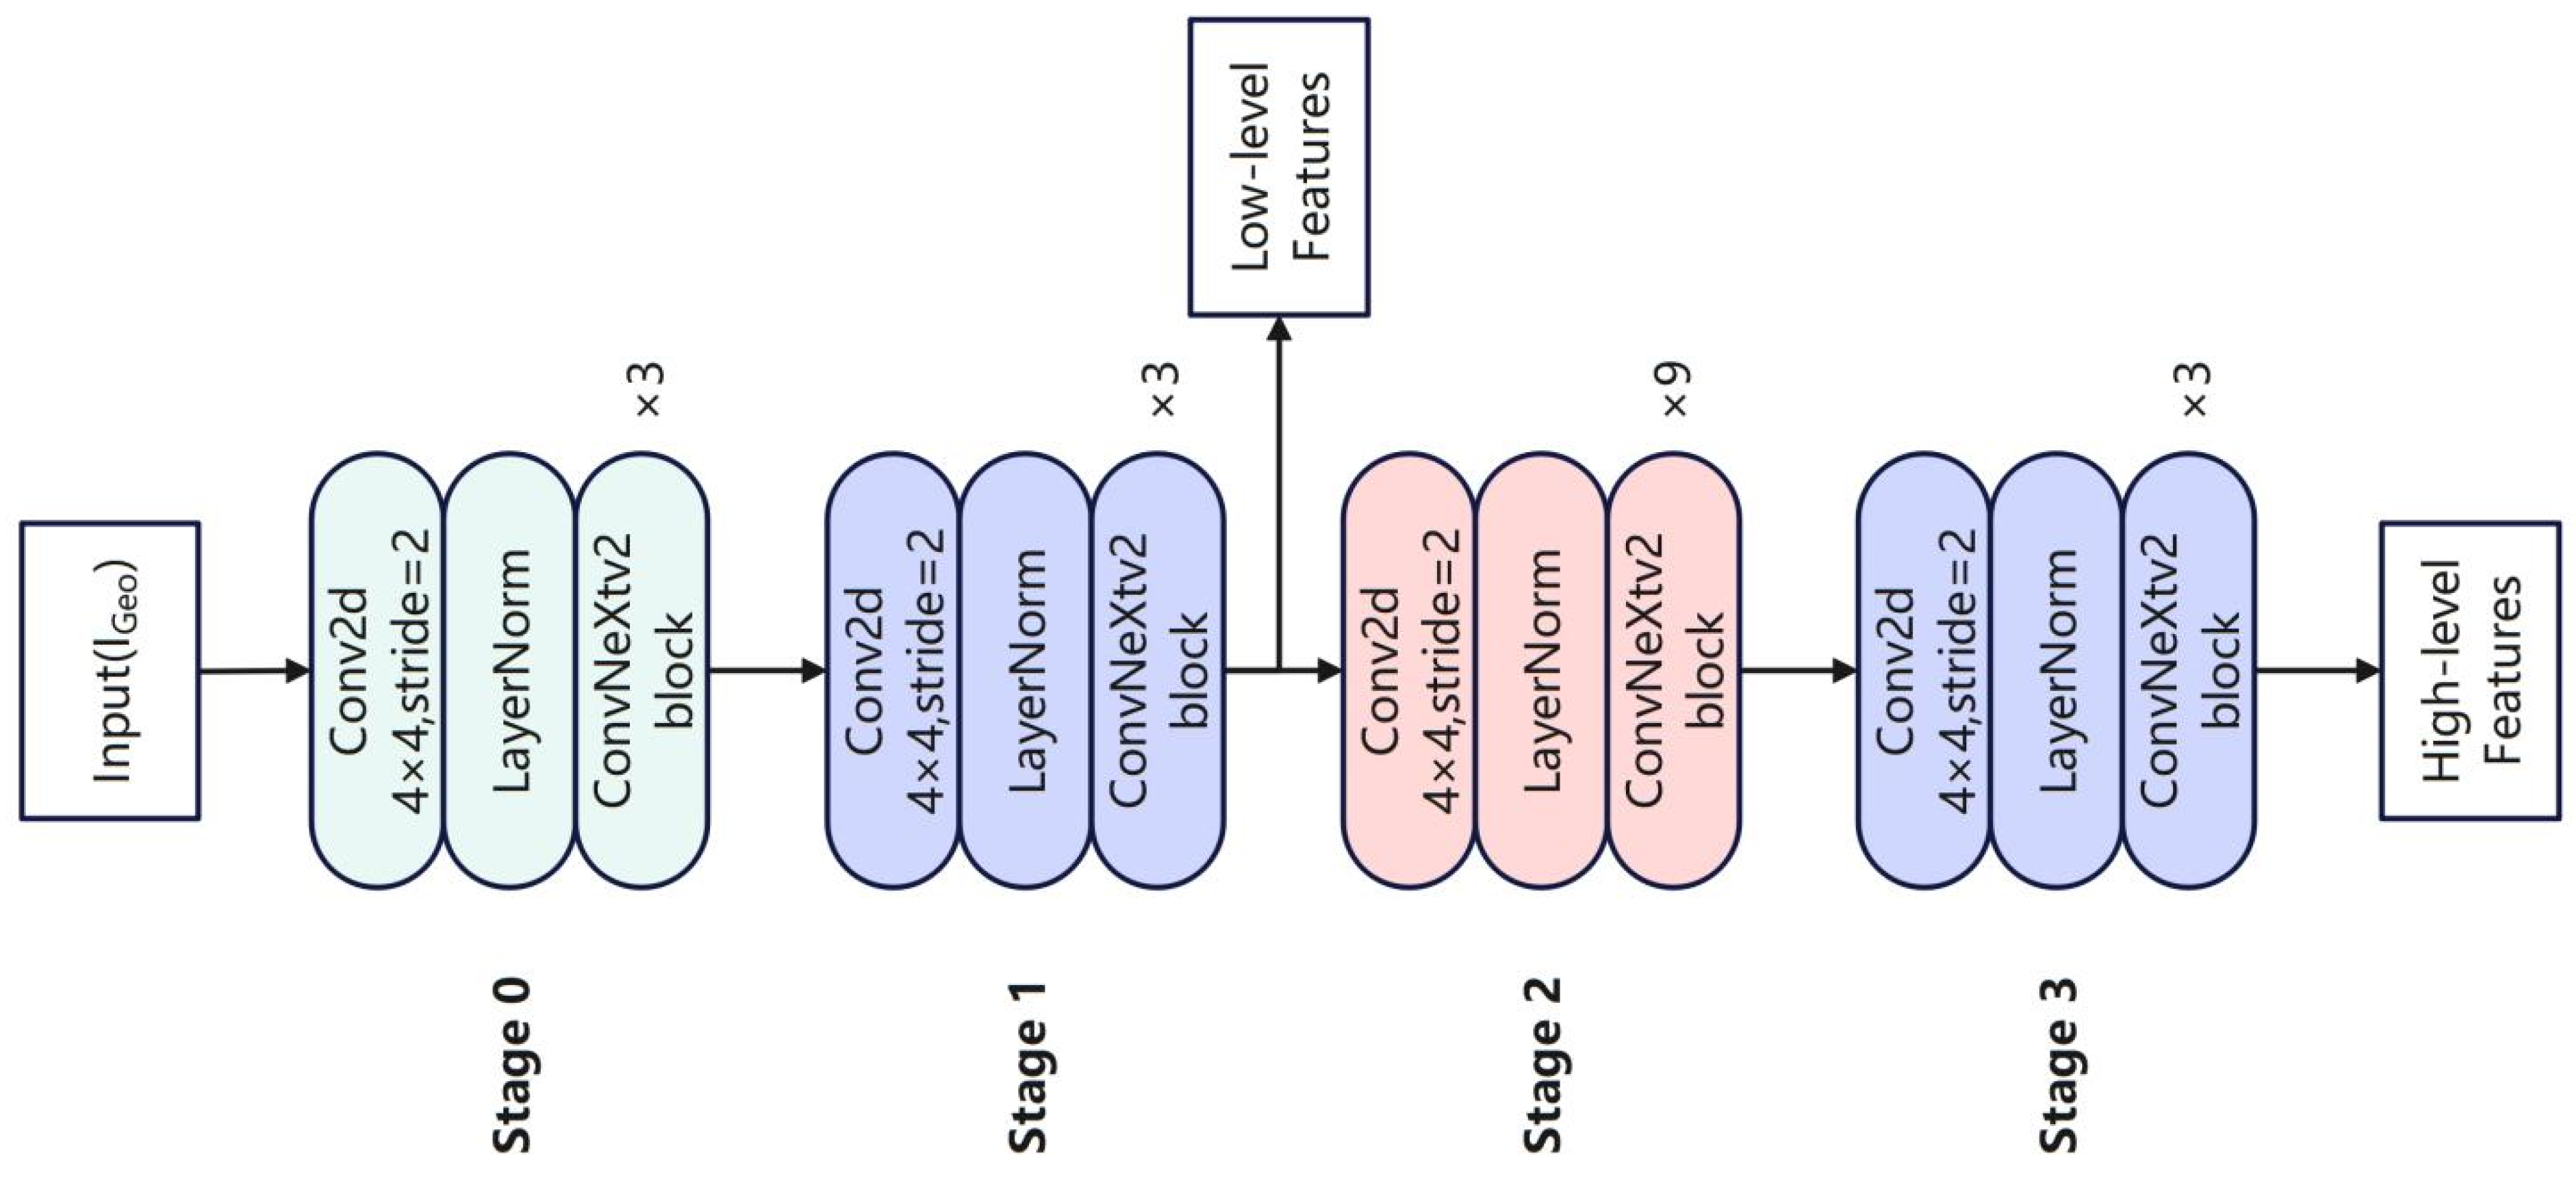
In the DeepLabV3+ branch of the CAU
2DNet model, the ConvNextV2 network primarily consists of four encoder stages, without an explicit decoder, as shown in
Figure 10. Each stage sequentially passes through a Conv2d layer, a LayerNorm layer, and multiple ConvNextV2 block layers, with the number of ConvNextV2 block layers in the four stages being three, three, nine, and three in this study, respectively. The output of Stage 1 serves as low-level features, which are later fused with the output of the ASPP module. Meanwhile, the output of Stage 3 serves as the input for the ASPP module. The specific parameters of ConvNextV2 are shown in
Table 5.
The ConvNextV2 backbone can be mathematically expressed as follows
where
refers to the stacking of the
k-th stage ConvNext block.
refers to the output features of the
stage,
, and ⊗ refers to the feature cascading operation.
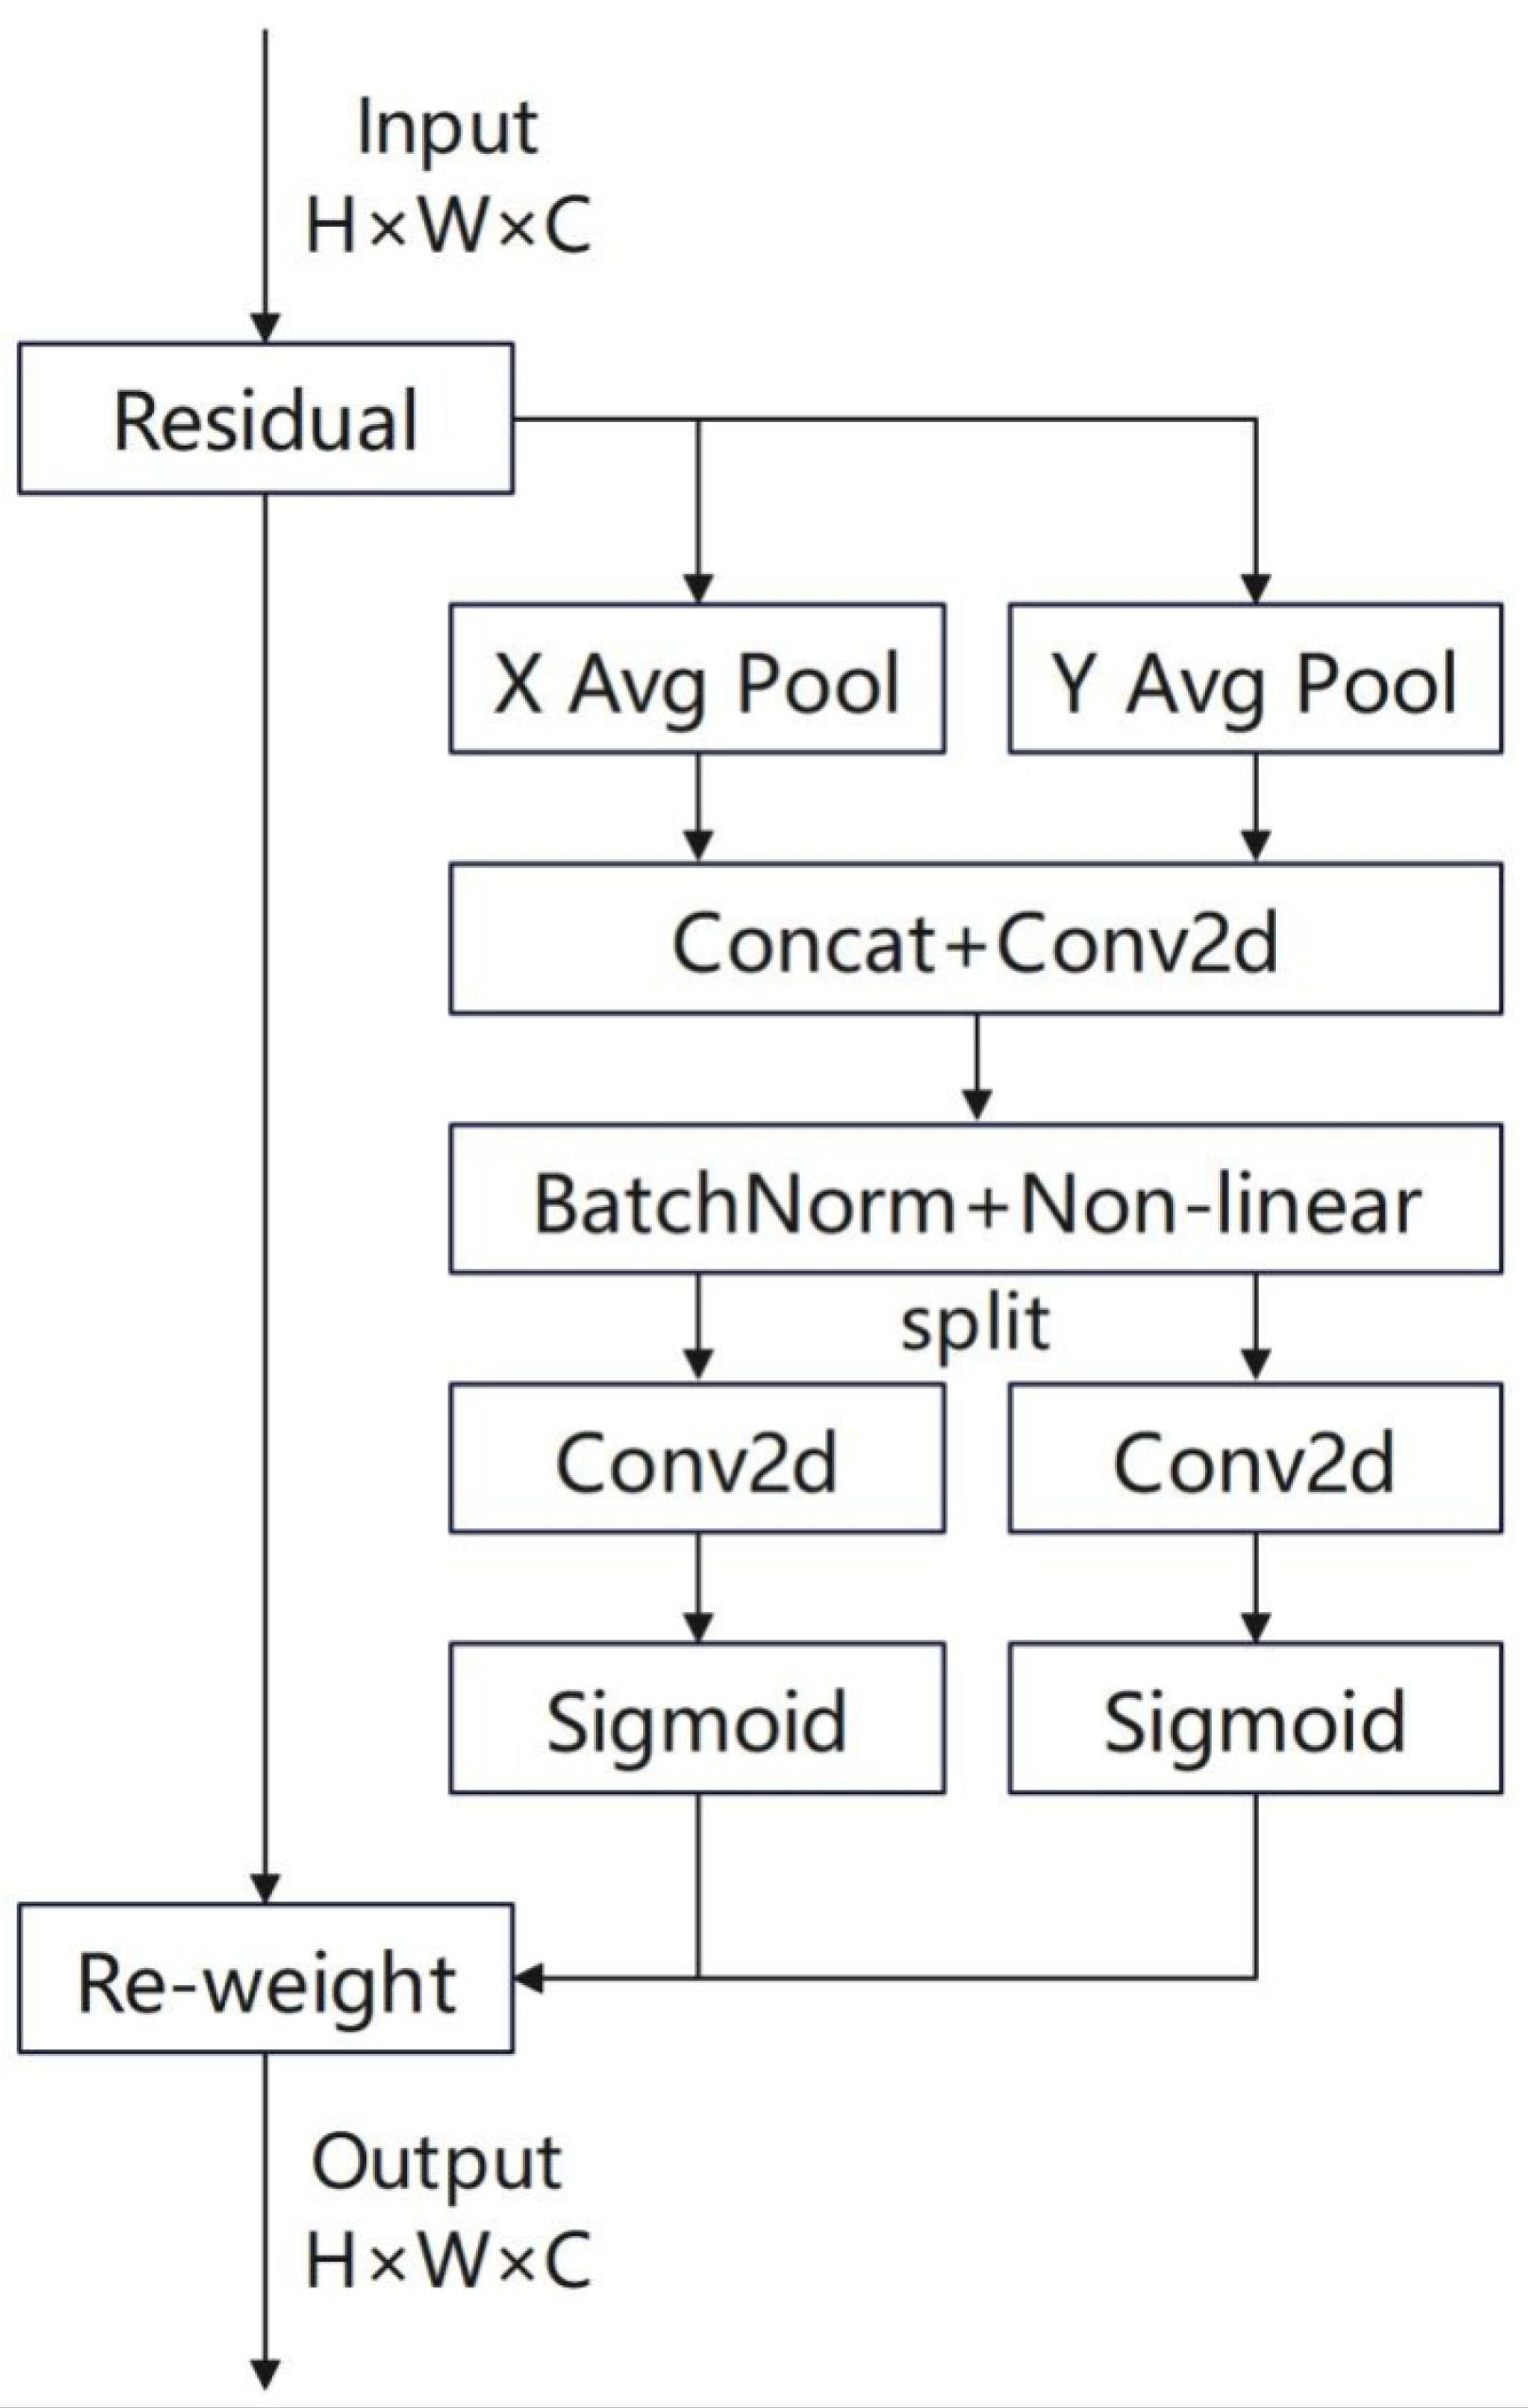
3.5. CoordAttention Mechanism
In improving the U
2-Net architecture and its accuracy in slum detection, this study cascades a CoordAttention (CA) block after each RSU module to strengthen the network’s joint modeling capability of target spatial location and channel dependencies, thereby enhancing the identification ability of slum areas. CoordAttention decomposes channel attention into the aggregation of coordinate information along the horizontal and vertical directions through a decomposed feature encoding strategy. The specific structure of the model is shown in
Figure 11.
The primary reason for selecting the CoordAttention mechanism over other recent attention mechanisms (such as CBAM or SE modules) lies in its ability to explicitly model the spatial coordinate information of remote sensing images, thereby enhancing the network’s perception of target spatial locations, which is crucial for slum identification tasks.The goal of CoordAttention is to simultaneously capture “inter-channel dependencies” and “spatial locations” to avoid information loss. By decoupling spatial dimensions, encoding positional information, and integrating the processes of channel and spatial attention, CoordAttention deeply binds the spatial locations of targets with channel features, thereby enhancing the network’s joint modeling capability for target spatial locations and channel dependencies.
In a given feature map
, coordinate information embedding is first performed by encoding the horizontal and vertical spatial context information separately to perceive directional features. With regard to the feature value at the spatial position
in the
c-th channel, 1D pooling is performed along the horizontal and vertical directions:
where
and
represent the spatial context information in the horizontal and vertical directions, respectively. After concatenating these factors along the spatial dimension, the intermediate feature
is formed:
where
represents the nonlinear activation function (such as ReLU),
refers to the cross-channel interaction using a 1 × 1 convolution kernel, and
indicates the spatial dimension concatenation. Thereafter,
f is decoupled into
and
through the splitting operation, and they are separately transformed using
and
convolution kernels:
where
refers to the Sigmoid function and
and
refer to the attention weight maps in the horizontal and vertical directions, respectively.
The final output feature Y is obtained through position-sensitive attention weighting:
3.6. Loss Function
Given that slum recognition is a typical image segmentation task, which is a binary classification problem, CAU
2DNet mainly adopts binary cross-entropy (BCE) as the final loss function. This mechanism is capable of effectively evaluating the difference between the predicted probability values of the model and the actual values. In a given set of predicted values
and the true values
y, the BCE loss calculation formula is expressed as follows:
4. Results and Analysis
4.1. Experimental Environment
In this study, all experiments were implemented based on PyTorch. The Python version used during the experiments was 3.11.5, the PyTorch version was 2.4.1, and the system version was Ubuntu 20.04.2 LTS. The model training utilized an NVIDIA GeForce RTX 2080 Ti (NVIDIA, Santa Clara, CA, USA) with 24 GB of video memory to train for 100 epochs. The batch size was set to two for all batches. The initial learning rate for the Adam optimizer was set to 0.01, with an optimizer momentum of 0.9 and a weight decay of 0.0001. A cosine annealing learning rate scheduler was utilized to automatically adjust the learning rate.
4.2. Experimental Dataset
This study conducted experiments using a self-constructed São Paulo favela dataset to verify the model’s ability in slum recognition. The construction process of this dataset has been discussed in detail in
Section 2.3, and it is randomly divided into a training set and a testing set at a ratio of 8:2. Furthermore, this study selected the WHU building dataset for training to validate the model’s generalizability and superiority.
The WHU (Wuhan University) building dataset is a public dataset released by the School of Remote Sensing and Information Engineering at Wuhan University, primarily serving research on intelligent extraction of buildings from remote sensing images and dynamic change detection. This dataset includes four distinct subsets: (1) The aerial image dataset is based on high-resolution aerial images of the Christchurch region in New Zealand, covering detailed annotations of approximately 22,000 buildings. (2) The Global Urban Satellite Dataset integrates multi-source sensor data (including QuickBird/WorldView), covering urban built-up areas across multiple climate zones. (3) The East Asian satellite data focuses on architectural features in the East Asian region, providing over 17,000 standardized samples. (4) The building change detection dataset is used for temporal analysis in post-earthquake reconstruction.
The WHU Building Dataset exhibits notable characteristics of a diverse urban environment. It boasts extensive coverage, integrating multi-source sensor data that spans urban built-up areas across multiple climate zones, encompassing samples with varying lighting conditions, architectural forms, and scene complexities, so it can simulate real-world environments of different cities globally. Additionally, it demonstrates strong task adaptability, focusing specifically on building extraction from remote sensing imagery, which is like slum identification. Consequently, the results obtained from the WHU Building Dataset can indirectly validate a model’s capability to identify complex urban areas, thereby verifying its generalization performance.
This study selected the East Asian satellite dataset for training, which has a resolution of 0.45 m and contains 17,388 samples of 512 × 512 pixels, of which 1616 samples include building areas (
Figure 12). This study only conducted experiments on the 1616 samples that include building areas. The official training set and test set, which include the building area, are 713 and 903 respectively. To make the training and evaluation of the model more stable, the two were swapped in this study.
4.3. Evaluation Indicators
Five indicators were chosen for calculation to objectively and comprehensively evaluate the model proposed in this study: accuracy, precision, recall,
score, and intersection over union (IoU). Accuracy represents the proportion of correct predictions made by the model; precision indicates the proportion of samples predicted as the positive class that are actually positive; recall represents the proportion of samples that are actually positive among those predicted as the positive class; the
score is the harmonic mean of precision and recall, which can comprehensively measure the performance of the model; IoU stands for intersection over union, which represents the overlap ratio between the predicted and the true regions and can be indirectly calculated using the confusion matrix. The formulas are expressed as follows:
where
and
indicate true positives, false positives, false negatives, and true negatives, respectively.
4.4. Comparison with State-of-the-Art Methods
This study selected five baseline models for comparison to demonstrate the superiority of CAU2DNet. These models incorporate mainstream Unet and Transformer architectures, demonstrating strong representativeness.
- (1)
U2-Net: This model adopts a nested U-shaped architecture, following a recursive downsampling–upsampling paradigm, and its topological structure can be formally described as an encoder–decoder structure with a hierarchical symmetry. The RSU block can capture multi-scale contextual information without significantly increasing the computational load by combining dilated convolutions of different scales and a symmetric encoding–decoding structure while maintaining high-resolution features.
- (2)
DeepLabV3+: This classic model in the field of semantic segmentation utilizes an encoder–decoder architecture. The encoder utilizes backbone networks, such as Xception or ResNet to extract features and integrates with the ASPP module. This model captures multi-scale contextual information in parallel through atrous convolutions at different rates while also utilizing global pooling to integrate global features.
- (3)
Unet3+ [
37]: This model is improved based on Unet++. The main contribution is the proposal of full-scale skip connections, indicating that each layer of the decoder is connected to all encoders. These improvements can enhance the model’s multi-scale interaction, fully utilize multi-scale information, and improve segmentation accuracy.
- (4)
TransUnet [
38]: This model is the first to combine the Transformer architecture with the Unet architecture, effectively integrating the advantages of both. Moreover, this model leverages the Transformer’s ability to focus on the global context, compensating for the limited receptive field of Unet.
- (5)
STTNet [
39]: This model is relatively new in the field of building recognition. Given that buildings occupy particularly small areas in remote sensing images, this model adopts an efficient dual-path Transformer architecture and introduces a novel module called the “Sparse Token Sampler” to represent buildings as a set of “sparse” feature vectors in their feature space, thereby achieving optimal performance with low time costs.
4.5. Experimental Results on the WHU East Asia Satellite Building Dataset
The experimental results comparing CAU
2DNet with other baseline methods are shown in
Table 6. CAU
2DNet outperforms all other baseline methods in nearly all evaluation metrics, with only a marginal 0.05% disadvantage in recall compared with STTNet. Given that this dataset does not include multispectral images, this study only conducted experiments using the U
2-Net branch that includes the CoordAttention mechanism. Therefore, the outstanding performance of this model mainly stems from the CoordAttention’s ability to perceive spatial location information. CAU
2DNet achieved leads of 0.31%, 0.27%, 6.82%, 0.28%, 2.84%, and 0.0155 in various metrics compared with the experimental results of U
2-Net. In particular, the significant improvement in precision can prove that these enhancements give CAU
2DNet a stronger ability to distinguish building areas.
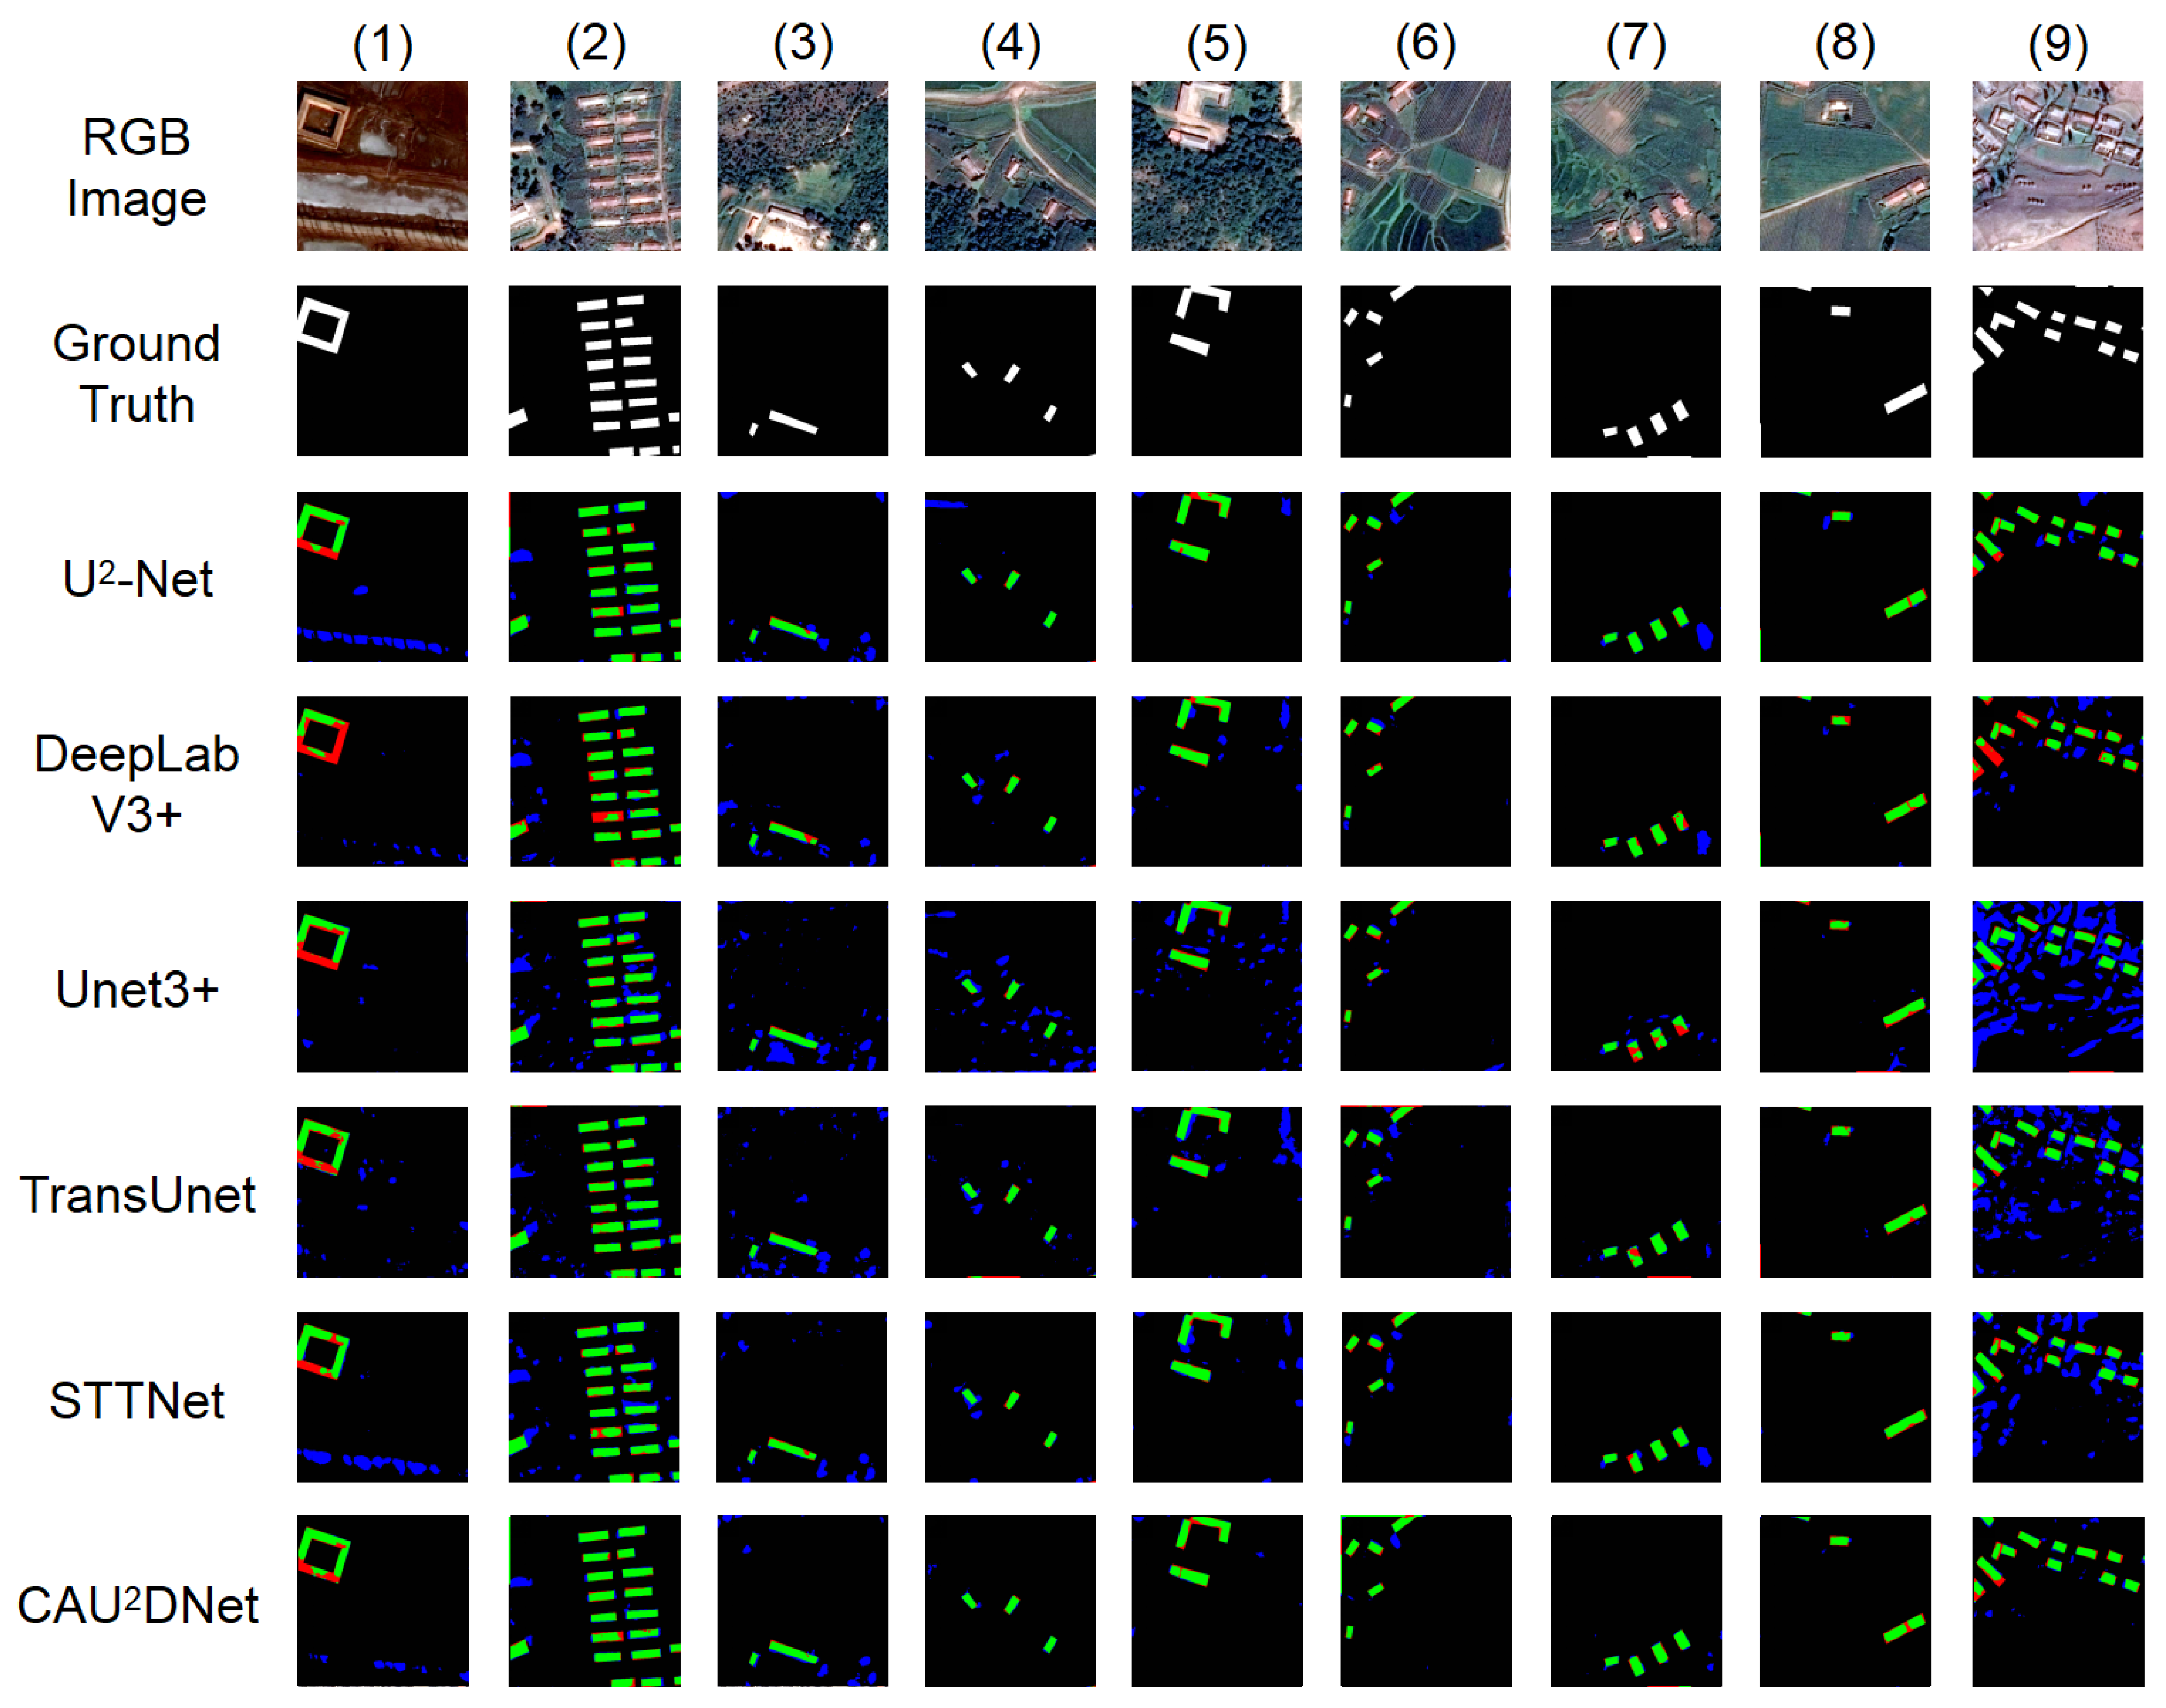
The recognition results of the different methods on the test set are exhibited in
Figure 13. On the WHU East Asia satellite building dataset, all models have a certain ability to recognize building areas. However, CAU
2DNet has better control over non-building areas, with a significantly smaller false positive area than the other models. Moreover, this model ensures a leading level of recognition accuracy for real building areas.
For example, in (1), U2-Net fails to distinguish the road area below the image from the building area. However, this situation has been significantly improved after the improvements made in this study. In (5) and (8), the comparison between CAU2DNet and U2-Net indicates that U2-Net fails to distinguish two bare soil areas, which CAU2DNet did not identify as buildings. This notion indicates that the improvements made in this study can uncover a deeper level of semantic information about buildings. In (9), the overexposed images and large areas of bare soil caused Unet3+, TransUnet, and STTNet to produce large areas of false detection regions. Although DeepLabV3+ did not identify these areas as buildings, it also failed to properly identify the real building areas. CAU2DNet and U2-Net can better accomplish identification tasks compared with other models.
The WHU East Asia satellite building dataset has a limited number of samples, making it difficult for various models to be effectively trained. However, U2-Net and CAU2DNet, which are improved upon this dataset, still manage to maintain excellent performance. This notion indicates that the CAU2DNet architecture has a more efficient feature extraction capability compared with other models.
Overall, Unet3+ and TransUnet perform poorly, with a large number of false positive areas indicating that they only extract shallow semantic information for building areas. CAU2DNet can distinguish similar areas, such as roads and bare soil, while ensuring the identification of building areas, demonstrating its ability to perceive deep semantic information.
4.6. Experimental Results on the São Paulo Slums Dataset
The experimental results of CAU
2DNet and other baseline methods applied to the São Paulo Favela dataset are shown in
Table 7. CAU
2DNet outperforms other baseline methods on all evaluation metrics. The superior performance of CAU
2DNet mainly stems from its dual-branch architecture and the use of the CoordAttention, for which enhancements effectively strengthen the model’s feature perception for slum areas.
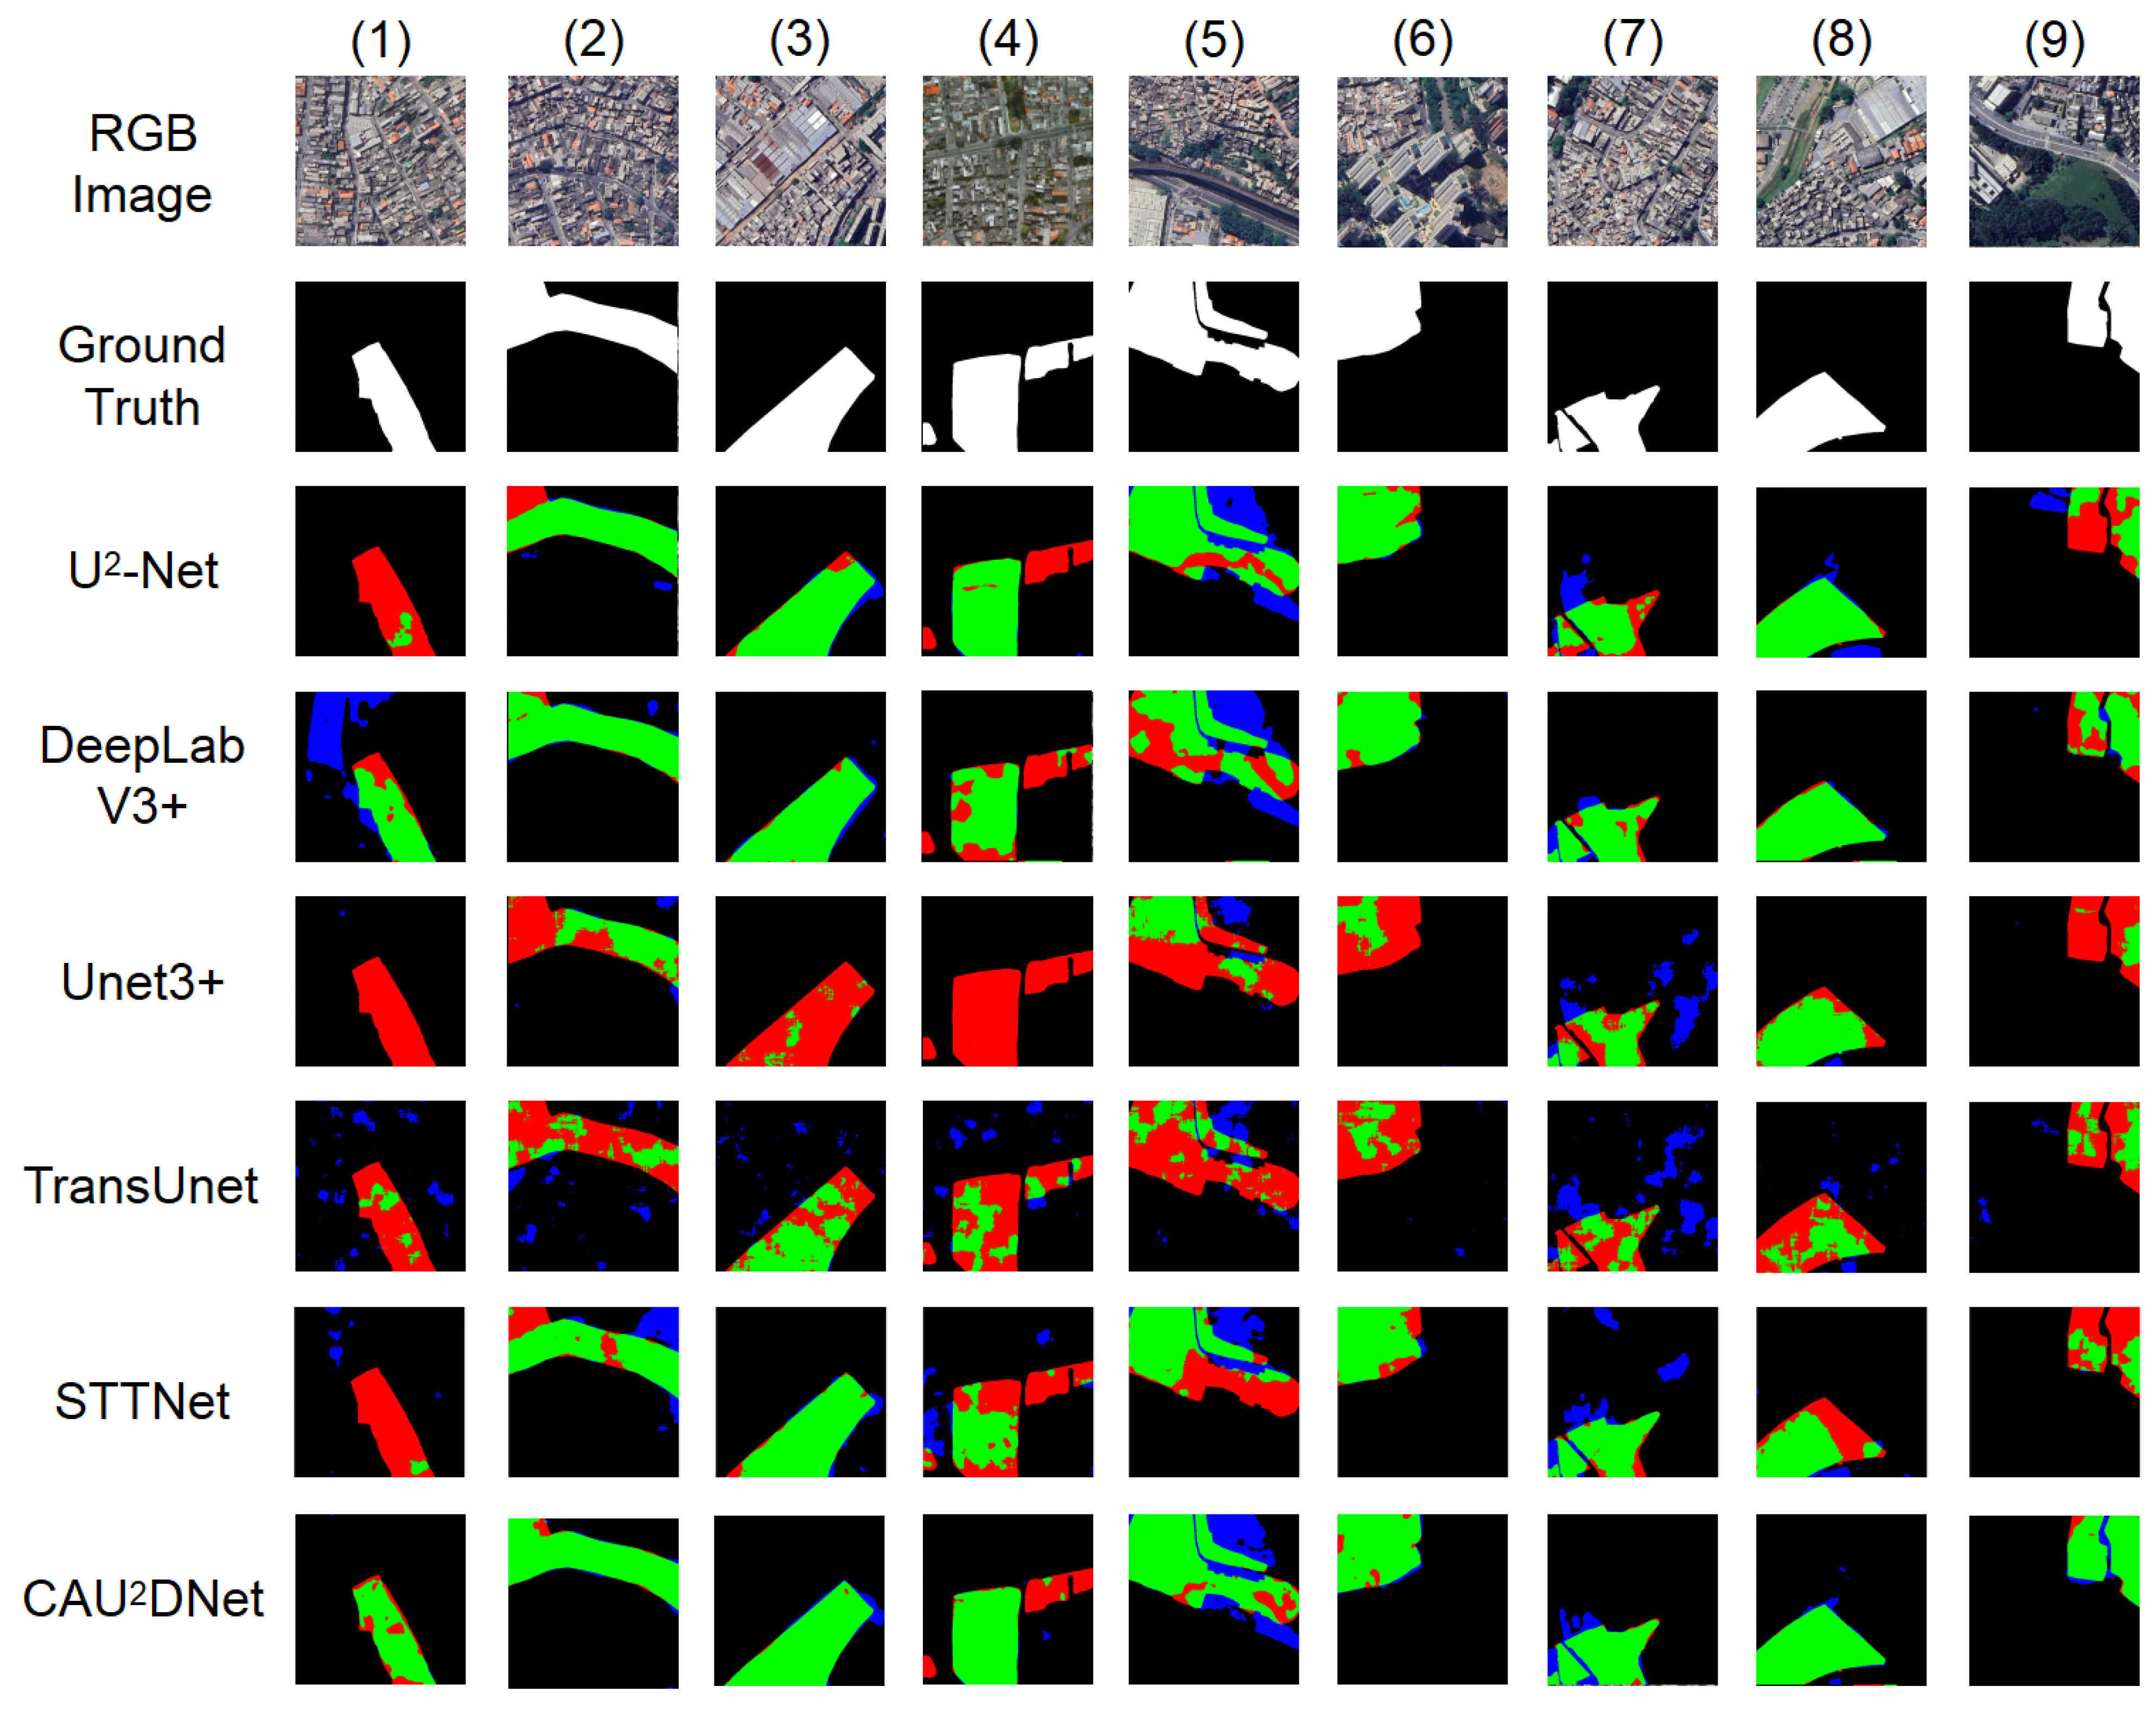
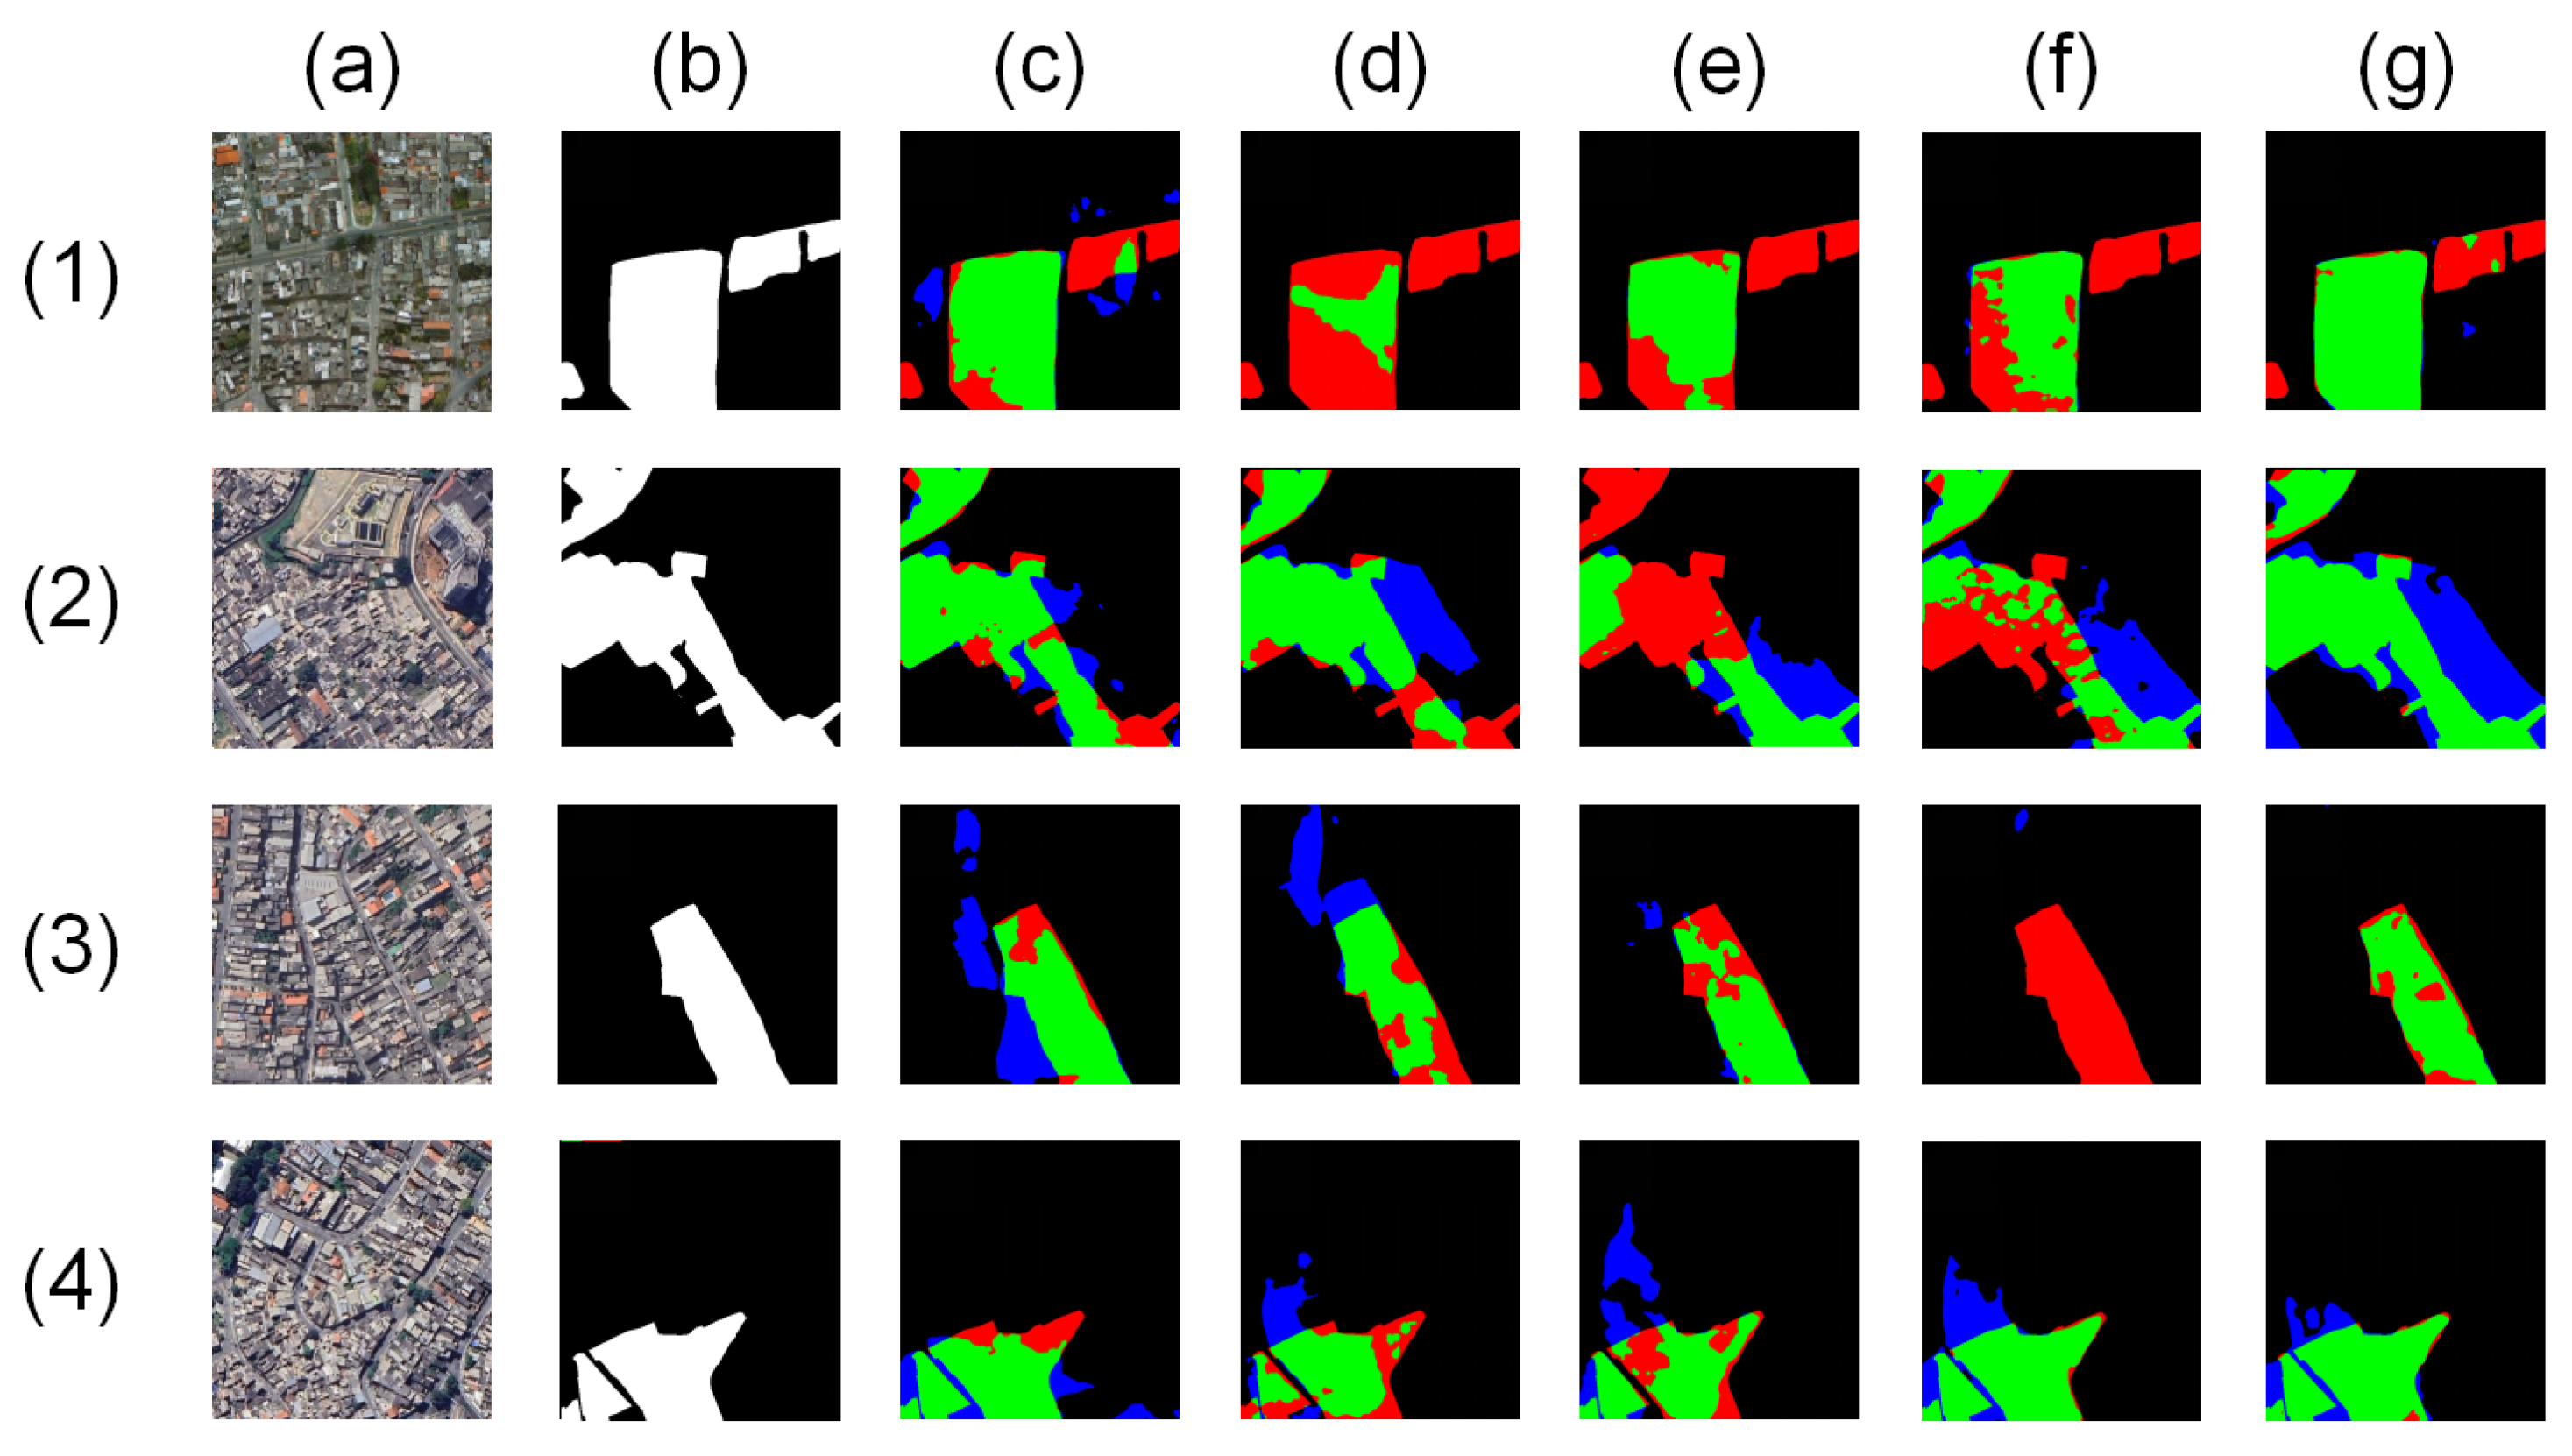
The results of the different methods on the test set are exhibited in
Figure 14.
CAU2DNet has a number of true positive (TP) regions while also being able to effectively control the false positive (FP) regions. This results verifies that the precision indicator of this model is significantly ahead of other methods.
In terms of the dense and complex building clusters represented by (1), U2-Net, Unet3+, TransUnet, and STTNet failed to detect the slum areas within them. DeepLabV3+ confused other buildings with slums, resulting in a large number of false positive areas. However, CAU2DNet was able to accurately identify the correct slum areas, with only partial missed detections in a few areas at the edges and inside, demonstrating its good perception of the deeper semantics of slums. With regard to the slum areas with clear edges represented by (3) and (5), CAU2DNet can identify smoother edges than the other methods, reflecting its excellent performance in edge extraction.
Unet3+ and TransUnet are the two methods with the worst performance. In particular, although Unet3+ has a large number of parameters and a very long training time, it still yields unsatisfactory results. This notion may indicate that this model is unsuitable for slum identification without improvements. The recognition results of TransUnet are distributed in a patchy manner with a large number of false positive areas, with numerous missed detections within the actual slum areas. This situation may be attributed to the Transformer architecture that requires a large number of samples to support its training, and the sample size of the slums in the São Paulo dataset is insufficient to support it. However, in reality, slum samples are particularly scarce, and methods such as Unet can achieve excellent results on small datasets, making them highly suitable for the objectives of this study.
Although other baseline models demonstrate excellent performance in their respective domains, they fail to adequately adapt to the characteristics of remote sensing imagery, such as significant variations in resolution and the inclusion of spatial location information. In contrast, CAU2DNet features a dual-branch architecture, enabling the use of high-precision networks for identifying high-resolution images and wide-receptive-field networks for low-resolution images, thereby accommodating different resolutions of remote sensing imagery. Additionally, CAU2DNet incorporates a CoordAttention mechanism capable of recognizing implicit spatial location information in remote sensing images. These constitute the specific advantages of CAU2DNet in slum identification tasks.
5. Discussion
5.1. Ablation Experiments
In this section, ablation experiments are conducted to test the effectiveness of the improvements. CAU2DNet is primarily an improvement based on U2-Net. The main improvements are as follows:
- (1)
Enhancing feature extraction capabilities by increasing the input of geoscientific indicator images.
- (2)
Integrating the DeepLabV3+ branch for identifying geoscientific indicator images
- (3)
Integrating the CoordAttention mechanism to enhance the model’s sensitivity to spatial location information.
- (4)
Replacing the backbone of DeepLabV3+ with ConvNextV2.
This study designed the following five ablation experiments to evaluate the effectiveness of these improvements:
- (1)
U2-Net (RGB) refers to the U2-Net network without any modifications, which only takes RGB true color images as input images.
- (2)
U2-Net (RGB + Geo) refers to the original U2-Net network without any modifications, which takes RGB true color images and geoscientific indicator images as input images.
- (3)
U2-Net (RGB) + DeepLab (Geo) refers to the combination of the unmodified U2-Net and DeepLabV3+ as branches, utilizing the same decision-level feature fusion mechanism as CAU2DNet for feature integration. The RGB true-color image is used as the input image for the U2-Net branch, while the geoscientific index image serves as the input for the DeepLabV3+ branch. The backbone of the DeepLabV3+ branch is the original Xception.
- (4)
U2-Net + DeepLab + CoordAttention refers to adding the CoordAttention mechanism to the U2-Net branch on the basis of the model in (3).
- (5)
CAU2DNet refers to the final version of the model in this study. It is based on the model in (4), where the backbone of the DeepLabV3+ branch is replaced with ConvNextV2.
These ablation experiments were conducted on the São Paulo Favela dataset constructed in this study using the experimental environment described in
Section 4.1 and the evaluation metrics described in
Section 4.3. The results are shown in
Table 8.
The comparison of the results of experiments (1) and (2) indicates that all indicators have been improved, with the most significant increase in precision, which increased by 7.54%. Ofthe other indicators, IoU increased from 0.5485 to 0.5559, and the score increased by 3.88%. This indicates that the introduction of multi-source images can effectively enhance the model’s ability to recognize slums.
Furthermore, the comparison of the results of experiments (2) and (3) indicates that the precision increased by 5.79%, recall increased by 6.25%, the score increased by 6.05%, and the IoU increased by 0.6274 by using DeepLabV3+ to recognize low-resolution geoscientific indicator images. The ASPP module of the DeepLabV3+ branch, through multi-scale dilated convolutions, significantly enhances the modeling capability for low-resolution geoscientific features.
The comparison of the results of experiments (3) and (4) indicates that adding the CoordAttention mechanism increased the precision by 1.89%, but recall decreased by 1.72%. The CoordAttention mechanism enhances the model’s ability to focus on key features by strengthening position-sensitive attention, thereby improving recognition accuracy. However, it may reduce the coverage of all relevant samples due to stricter screening criteria, ultimately manifesting as an increase in precision but a decrease in recall in experimental results. This issue will be alleviated with the use of the ConvNextV2 backbone.
Meanwhile, the comparison of the results of experiments (4) and (5) shows that the replacement of the ConvNextV2 backbone caused the recall to increase by 1.11% while also increasing the score by 1.03% and the IoU to 0.6372. The sparse convolution mechanism in ConvNextV2 can selectively focus on highly distinctive pixels, effectively balancing the overly stringent recognition criteria of the CoordAttention mechanism, leading to a recovery in recall.
These improvements have resulted in the proposed CAU2DNet outperforming the original U2-Net in every aspect, with an accuracy increase of 1.46%, precision improvement of 16.12%, recall enhancement of 6.2%, an score of 10.85%, and an IoU improvement from 0.5485 to 0.6372.
The specific identification results are shown in
Figure 15.
The model gains an in-depth understanding of the semantics of slums, and the identification results become increasingly accurate with the gradual addition of the modifications. CAU2DNet has the best recognition accuracy among these four highly challenging samples. However, in (1), U2-Net (RGB + Geo) shows a decrease in the identification of slums compared with U2-Net (RGB). We speculate that this result is due to the low resolution of the geoscientific indicator images causing confusion for the U2-Net model, which has a high recognition accuracy and a small receptive field, in identifying the semantics of slums. Moreover, the subsequent use of DeepLabV3+ for recognizing geological indicator images has restored accuracy, which can also verify this hypothesis. In (3), U2-Net + DeepLab + CoordAttention completely missed the slum areas in the image. This phenomenon may be due to the introduction of the CoordAttention mechanism, which altered the model’s understanding of slum features, resulting in extensive missed detections in this area. This issue was also improved after replacing the ConvNextV2 backbone.
5.2. Model Efficiency
To evaluate the computational efficiency of the models, this study calculated the Giga Floating-point Operations Per Second (GFLOPs) and the number of model parameters (Params) for each model. The results are shown in
Table 9. It can be observed that CAU
2DNet exhibits relatively higher values in both metrics. This is primarily due to CAU
2DNet’s dual-branch architecture. While such a structure enables the model to achieve high accuracy, it also increases the model’s complexity, resulting in lower computational efficiency. In subsequent research, more efforts should be made with respect to its lightweight design to explore its potential for acceleration.
6. Conclusions
This study aims at the remote sensing recognition task of urban slums, summarizes the slum image features classified by data source type, constructs a São Paulo slum dataset integrating multispectral images, and proposes the CAU2DNet model based on a dual-branch DL architecture, which can better be used for identifying slums based on remote sensing images, providing data support and methodological reference for subsequent research and applications in this field.
The CAU2DNet model introduced in this study utilizes the U2-Net branch to identify high-resolution true-color remote sensing images and the DeepLabV3+ branch to recognize low-resolution geoscientific indicator images. This model can fully leverage the respective advantages of both branches and has achieved significant advantages compared with the baseline model. Furthermore, this study has added the CoordAttention mechanism to the U2-Net branch, enabling the model to effectively recognize spatial location features in remote sensing images. This study replaces the backbone of the DeepLabV3+ branch with ConvNextV2, which has a large receptive field. The experiments proved that this model can effectively improve the issue of recall index decline caused by missing detection of blurry boundary areas.
This study conducted experiments on the São Paulo slums dataset and the WHU East Asia satellite building dataset. The results showed that the CAU2DNet model achieved the best performance in terms of accuracy, precision, recall, score, and IoU compared with other baseline methods, proving its highly competitive performance in the field of slum remote sensing recognition. Moreover, this study conducted ablation experiments on various improvements using the São Paulo slumxczs dataset. The results demonstrated that all modifications made in this research can effectively enhance model performance.
However, this study still has the following limitations. (1) Geographical limitations of the data: The current dataset only covers the city of São Paulo. In the future, this work needs to be expanded to areas with different climate zones and stages of urban development. (2) High computational costs: The dual-branch architecture has a large number of parameters. In subsequent work, knowledge distillation or lightweight design can be used to optimize inference efficiency. (3) Insufficient temporal dynamic analysis: This study focuses on static identification. In the future, temporal remote sensing data can be combined to explore the driving mechanisms behind the expansion and evolution of slums. This study encourages further research in this field and hopes that more scholars will contribute to addressing these limitations in the future.


 ,
, 


