Article

Analysis of Droughts and Floods Evolution and Teleconnection Factors in the Yangtze River Basin Based on GRACE/GFO

1
College of Resources and Environment, University of Chinese Academy of Sciences, Beijing 101408, China
2
Graduate School of Science Department of Geosciences, Osaka Metropolitan University, 3-3-138 Sugimoto Sumiyoshi-ku, Osaka-shi 558-8585, Japan
3
Department of Physical Geography and Ecosystem Science, Lund University, Sölvegatan 12, 223 62 Lund, Sweden
*
Author to whom correspondence should be addressed.
Remote Sens. 2025, 17(14), 2344; https://doi.org/10.3390/rs17142344
Submission received: 11 May 2025 / Revised: 25 June 2025 / Accepted: 7 July 2025 / Published: 8 July 2025
(This article belongs to the Special Issue Remote Sensing in Natural Resource and Water Environment II)

Abstract

In recent years, under the influence of climate change and human activities, droughts and floods have occurred frequently in the Yangtze River Basin (YRB), seriously threatening socioeconomic development and ecological security. The topography and climate of the YRB are complex, so it is crucial to develop appropriate drought and flood policies based on the drought and flood characteristics of different sub-basins. This study calculated the water storage deficit index (WSDI) based on the Gravity Recovery and Climate Experiment (GRACE) and GRACE-Follow On (GFO) mascon model, extended WSDI to the bidirectional monitoring of droughts and floods in the YRB, and verified the reliability of WSDI in monitoring hydrological events through historical documented events. Combined with the wavelet method, it revealed the heterogeneity of climate responses in the three sub-basins of the upper, middle, and lower reaches. The results showed the following. (1) Compared and verified with the Standardized Precipitation Evapotranspiration Index (SPEI), self-calibrating Palmer Drought Severity Index (scPDSI), and documented events, WSDI overcame the limitations of traditional indices and had higher reliability. A total of 21 drought events and 18 flood events were identified in the three sub-basins, with the lowest frequency of drought and flood events in the upper reaches. (2) Most areas of the YRB showed different degrees of wetting on the monthly and seasonal scales, and the slowest trend of wetting was in the lower reaches of the YRB. (3) The degree of influence of teleconnection factors in the upper, middle, and lower reaches of the YRB had gradually increased over time, and, in particular, El Niño Southern Oscillation (ENSO) had a significant impact on the droughts and floods. This study provided a new basis for the early warning of droughts and floods in different sub-basins of the YRB.

1. Introduction

Droughts and floods are extremely destructive hydrological events that seriously threaten agricultural production, industrial development, and the safety of human life and property and can bring substantial economic losses and lasting social impacts [1,2]. Drought is a persistent and abnormal state of water shortage characterized by significantly below average river runoff, lowered lake and reservoir levels, and declining groundwater levels [3,4]. Flooding is a rapid increase in the volume of water in a hydrological system, which is more likely than drought to damage infrastructure and result in many deaths and injuries [5,6]. Due to climate change and human activities, the frequency and severity of droughts and floods have increased in recent years [7,8]. The Yangtze River Basin (YRB) is the largest basin in China, with a population density of 1.8 times China’s average [9]. It covers six major urban agglomerations, making it one of China’s most economically developed regions. However, drought and flood disasters have occurred frequently in the YRB in recent years, such as extreme drought in the middle and lower reaches in 2019, a super flood in 2020, and a super drought in 2022, which have caused significant economic losses and great social impacts [10]. Therefore, it is necessary to comprehensively analyze the trends and influencing factors of droughts and floods in order to provide a solid scientific basis for early warning, real-time monitoring, and accurate prediction. This will enhance the efficiency of emergency responses, optimize disaster prevention and mitigation measures, and ultimately reduce the societal, economic, and ecological impacts of droughts and floods.
Flood and drought events are usually assessed quantitatively using various indices such as the Standardized Precipitation Index (SPI), Standardized Runoff Index (SRI), and Standardized Precipitation Evapotranspiration Index (SPEI) [11,12,13]. However, these traditional indices are usually based on a few hydrometeorological elements to reflect the characteristics of specific types of droughts and floods. They cannot fully portray the complexity of actual droughts and floods [14]. The data required for these indices often come from in situ measurements, hydrologic models, and meteorological satellites [15]. However, each of these data sources has different limitations. Field measurement data have limited spatial coverage and are susceptible to environmental constraints, making it difficult to reflect continuous spatial change characteristics. Hydrological model data are widely used in drought and flood monitoring and can combine multiple hydrological variables to provide theoretical support. However, hydrological model data have some limitations, which tend to ignore the complexity of the hydrological simulation process and have some uncertainty errors [16]. Meteorological satellites, despite the advantages of wide coverage and high spatial and temporal resolution, face the following limitations in capturing droughts and floods: inability to capture short-term variations, susceptibility to significant impacts from obstacles and weather conditions, high costs due to high resolution, and limitations of a single monitoring variable to reflect the multifactorial synergies of droughts and floods [17,18,19]. Terrestrial water storage (TWS) derived from the Gravity Recovery and Climate Experiment and GRACE-Follow On (GRACE/GFO) satellite data cover all forms of water on land, such as surface water (lakes, rivers, and reservoirs), soil moisture, groundwater, canopy, ice, snow, and biomass water [20]. This data can reflect the impacts of both natural and human factors on water storage changes under complex hydrometeorological processes, overcoming the limitations of traditional drought and flood indices and offering a unique perspective for drought and flood monitoring [21]. For example, reconstructed high-resolution terrestrial water storage anomalies (TWSA) data were utilized to monitor extreme hydrologic events in China, the Han River Basin, and across the United States [22,23,24]. Due to its global coverage, its application in the basin scale has obvious advantages, making it a new method for monitoring floods on a large scale [25], and it has also been used as a key indicator for characterizing drought [26], which has been integrated into the study of drought indices [27]. Numerous scholars have already utilized the GRACE/GFO-based drought index for drought identification around the world [28,29,30,31]. For example, the GRACE/GFO-based water storage deficit index (WSDI) has been widely applied in multiple regions such as China, Turkey, Central Asia, Ethiopia, and the Indus Basin Irrigation System to capture drought events, and has also been used to characterize a single extreme flood event in the Pearl River Basin during the 2015–2016 period [21,27,32,33,34,35,36]. As the largest basin in China, it is important to quantify the characteristics of hydrological events in the YRB for water resources allocation and management. Recently, some studies based on the GRACE/GFO index in the YRB have focused on drought events. For example, using the GRACE/GFO drought severity index (GRACE/GFO-DSI) to characterize the spatial and temporal evolution of TWSA during an extreme drought event in the YRB in 2022 [37]. The standardized GRACE/GFO reconstructed TWSA index (SGRTI) was utilized to assess the drought severity of the YRB from 1963 to 2019 [38]. The weighted water storage deficit or WSDI was used to characterize drought events in the YRB, respectively [15,39]. While these studies have made significant progress in monitoring drought events in the YRB, they have typically ignored flood events during the study period. Currently, there are still limited studies on identifying and extracting features of multiple flooding events in the YRB based on the GRACE/GFO index. DSI and WSDI are calculated slightly differently, but both perform similarly in identifying hydrological drought events [40]. Since WSDI already has a basis for characterizing single flood events, it is recommended for further research and will be used for simultaneous drought and flood monitoring in this study [21,41].
Floods and droughts are influenced by many factors, especially precipitation and evapotranspiration, which have traditionally been the focus of research as important factors [37,42]. However, in the context of climate change, atmospheric circulation anomalies also play a significant role in the occurrence and evolution of droughts and floods [43]. TWSA derived from the GRACE/GFO has great potential to identify extreme hydrologic events [44]. However, many studies typically focus on monitoring drought events using GRACE/GFO at the basin-wide scale, while few studies have explored the relationship between teleconnection factors and droughts and floods based on GRACE/GFO data at the sub-basin level. The teleconnection factors are key climate anomalies that influence the variation in TWS and the mechanism of droughts and floods [21,45]. As a driver of the global and local water cycles, ENSO is a significant regulator of TWS variability and drought and flood events in most parts of the globe [46,47]. However, the teleconnection factors at the regional scale show obvious characteristics of spatial heterogeneity. For instance, the Arctic Oscillation (AO) and North Atlantic Oscillation (NAO) are also the dominant factors causing TWS changes by controlling climate variables in Asia and Eastern Europe [48]. The phase transition of NAO is the main contributor affecting the TWS fluctuations in the Iberian Peninsula [49]. The Indian Ocean Dipole (IOD) is a key factor influencing the formation mechanism of drought and flood events in Africa [50]. The North Pacific Index (NPI), the Southern Oscillation Index (SOI), and the Sunspot Index (SSI) also play essential roles in the formation of droughts [51,52]. Therefore, this study chooses to explore the dynamic response relationship between hydrological events and teleconnection factors using WSDI at the scale of the upper, middle, and lower reaches of the basin, so as to reveal the heterogeneity of the response to climate in different sub-basins.
To further analyze the evolution of droughts and floods at the sub-basin scale, this study mainly focuses on the following three aspects: (1) extraction of the duration and peak values of droughts and floods in the sub-basins of the YRB based on WSDI and use the documented events to assist in the validation; (2) exploration of the spatial evolution characteristics and change rates of WSDI on monthly and seasonal scales; and (3) discussion of the dynamic relationship between drought and flood events and different teleconnection factors in the upper, middle, and lower reaches of the YRB.

2. Study Area and Data
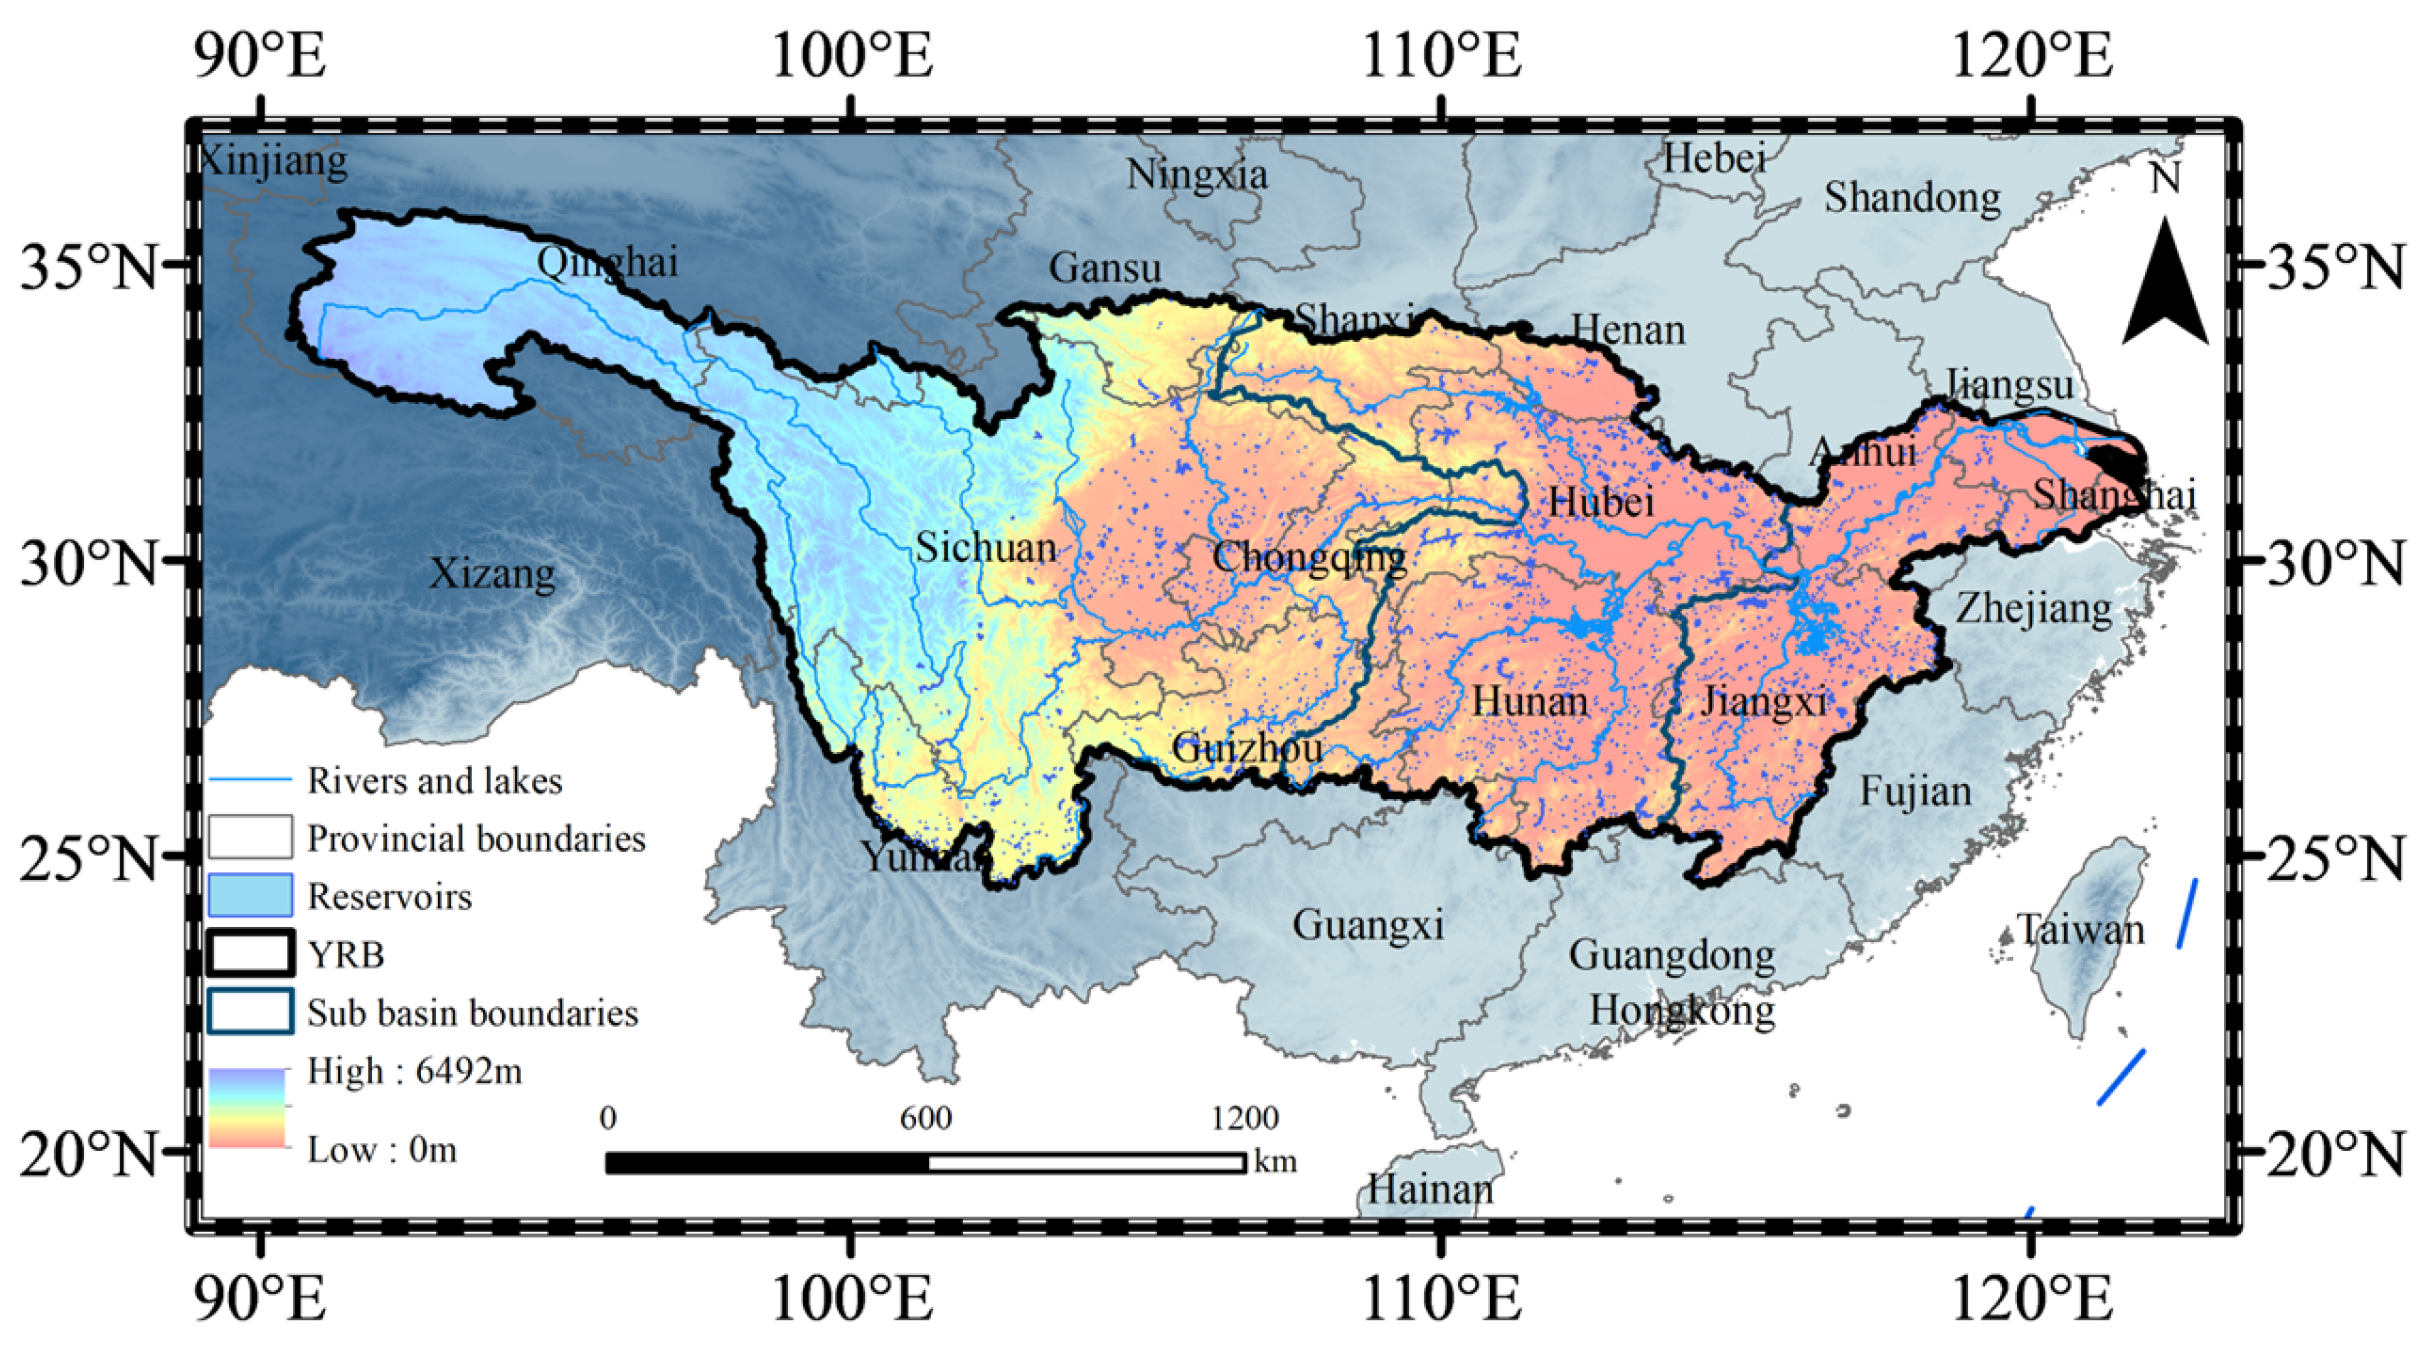
2.1. Study Area

The length of the Yangtze River is 6387 km. The YRB is located at 90°32′~121°56′E and 24°28′~35°46′N, originating from the Tanggula Mountains on the Tibetan Plateau. It is the largest basin in China and the third largest in the world, spanning the three major regions of Southwest China, Central China, and East China, covering nineteen provinces [53]. The basin’s total area is about 1.8 million km2, accounting for 18.8% of China’s land area [54]. The YRB is located in a subtropical monsoon climate and has a diverse topography, with plateaus, mountains, and basins dominating the upper reaches, hills dominating the middle, and plains dominating the lower reaches. The basin is rich in water resources, accounting for 36% of China’s total, including more than 3000 rivers and 4000 lakes, with abundant precipitation. Still, due to the monsoon climate, precipitation has obvious spatial and temporal variations and is subject to frequent natural disasters [55,56]. Since the application area of the Center for Space Research at the University of Texas (CSR) GRACE/GFO mascon product should be larger than 200,000 km2 and the whole YRB has obvious topographic, climatic, and hydrological differences [46,57], following a previous study [37], this study divided the YRB into the upper, middle, and lower reaches, as shown in Figure 1.

2.2. Data

All the data used in this study are shown in Table 1, with key data details described below.

2.2.1. GRACE/GFO Data

GRACE/GFO data mainly includes spherical harmonic coefficients (SHC) and mascon products. Compared to mascon products, traditional SHC products cause leakage errors due to filtering processing, and the signal strength at the higher order is still smaller than that of mascon solution after adding scale factors, so higher precision hydrological signals cannot be detected [58]. Therefore, the version of RL06 mascon data provided by the CSR was selected for this study. This data has been completed with follow-up processing such as C20 term replacement, glacial equilibrium correction, and first-order term correction, and the 2004–2009 background field has been removed. The gap data for mission intervals during 2017–2018 was obtained from [59]. The other missing months’ data were filled with the cubic spline function interpolation method, based on three months of data before and after the missing month. When two consecutive months were missing, the raw data of the same months in the complete year were manually masked, the same interpolation scheme was executed and the root mean square error (RMSE) was calculated for error assessment.

2.2.2. Hydrological Model
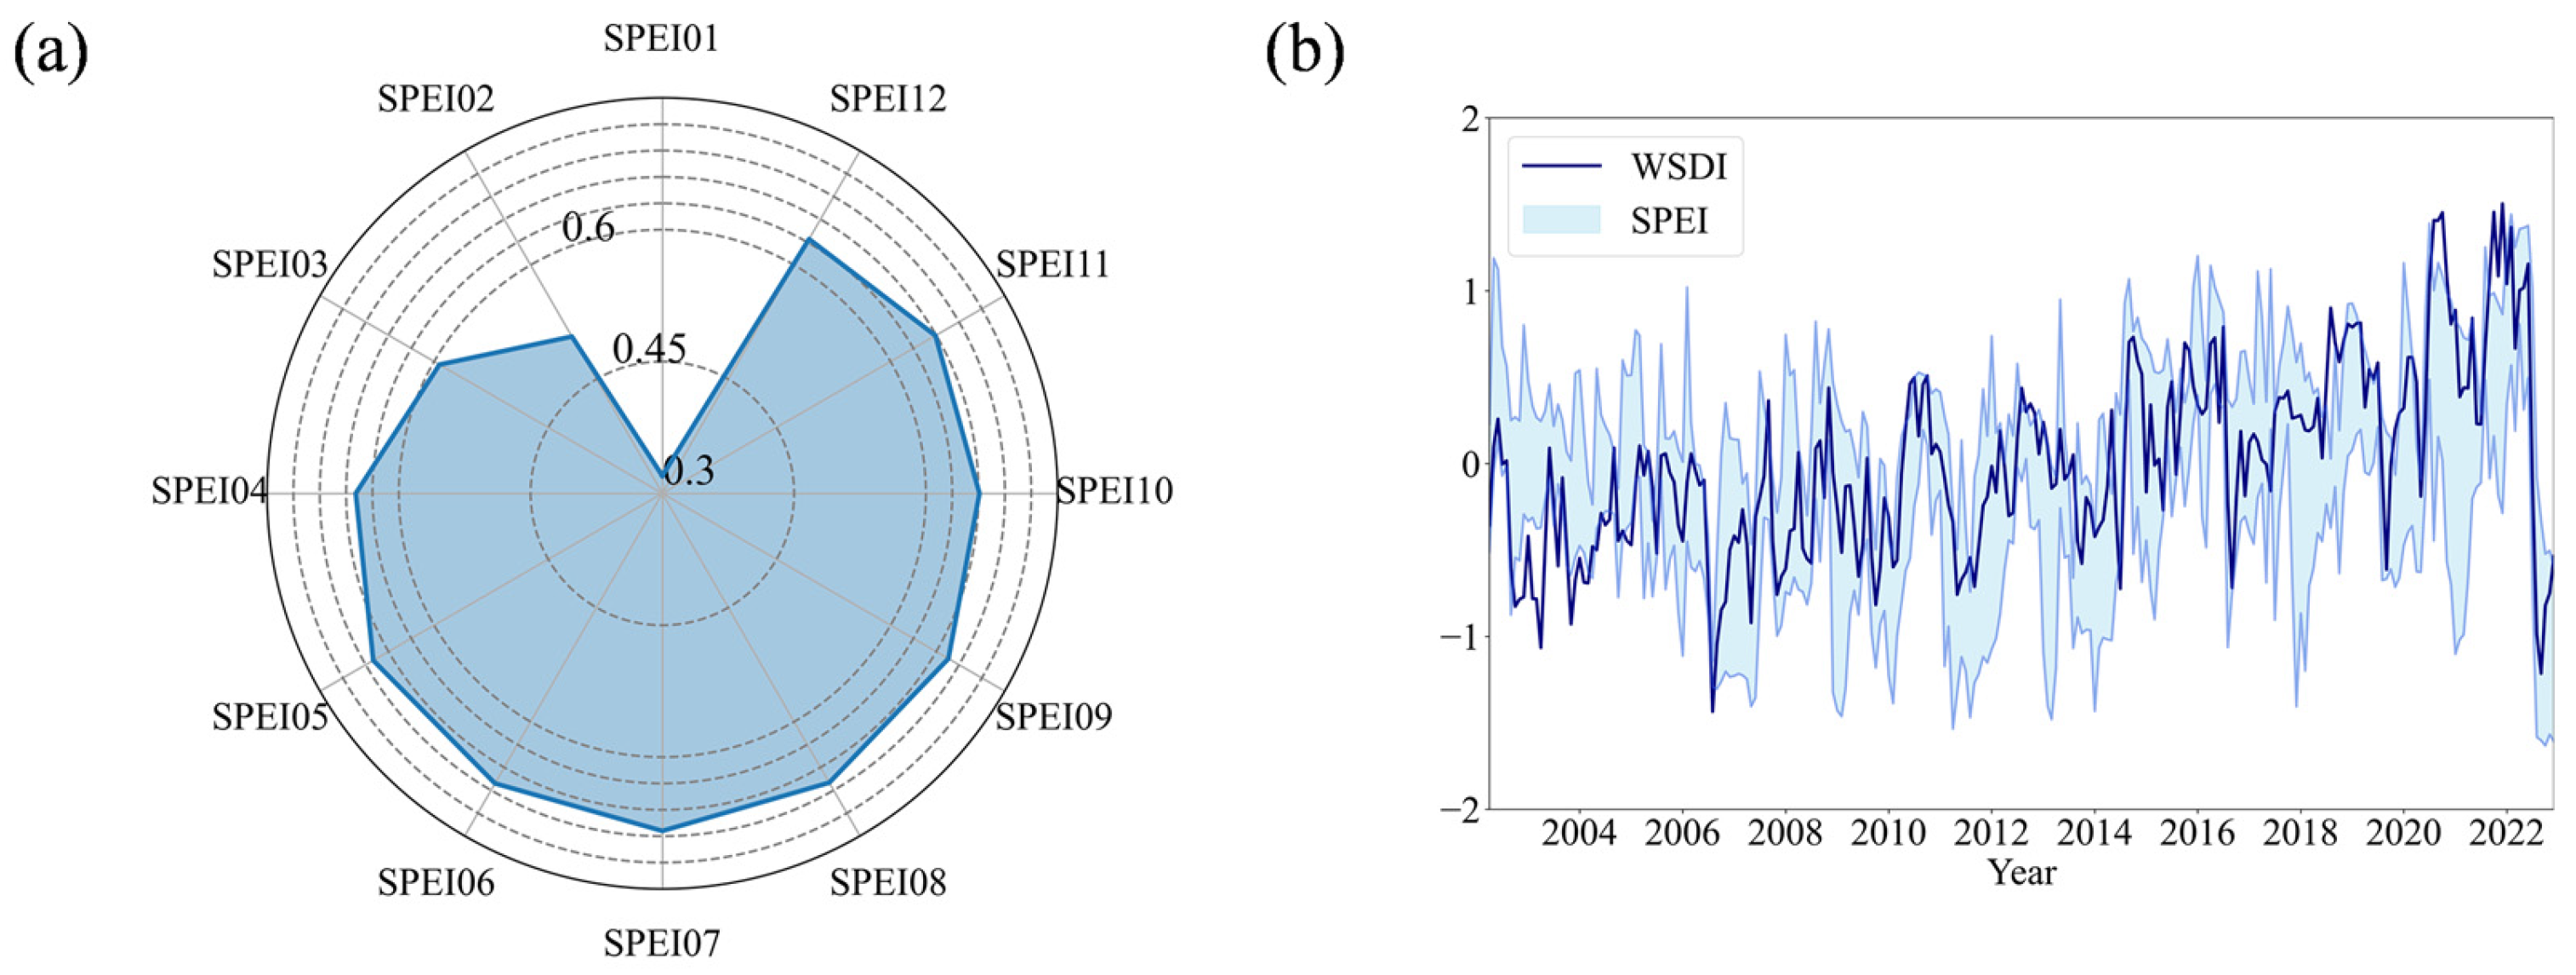
The Global Land Data Assimilation Systems (GLDAS) consists of four land surface models and uses ground observation and satellite data to generate the best flux and variable field on the land surface [60]. In order to be consistent with the GRACE/GFO data resolution and period, GLDAS NOAH v2.1 version data were selected for this study, and TWSA was calculated using snow water equivalent, canopy water, and soil water, where soil water is the sum of 0–200 cm soil water.
The WaterGAP Global Hydrology Model (WGHM) quantifies global terrestrial water resources excluding glaciers, including runoff, snow, soil water, groundwater, and net surface water withdrawals. It focuses on assessing water stress caused by human water use and reservoir construction [61]. This study selected WGHM v2.2d data from April 2002 to December 2019.

2.2.3. SPEI

This study used SPEI to verify the reliability of WSDI. SPEI avoids the limitation of SPI on evapotranspiration and retains the multi-scale time characteristics of SPI. It can evaluate drought and flood conditions from different perspectives compared with WSDI, indicating a potential correlation between them [62]. In this study, SPEI01 to SPEI12 were selected for verification, corresponding to time scales of 1 to 12 months, respectively. These different time scales are closely related to the types of droughts. For example, SPEI03, SPEI06, and SPEI12 are associated with changes in soil moisture (agricultural drought), river flow (hydrologic drought), and groundwater storage (groundwater drought), respectively [37].

2.2.4. The Self-Calibrating Palmer Drought Severity Index (scPDSI)

Compared to the Palmer Drought Severity Index (PDSI), the scPDSI optimizes the sensitivity of drought monitoring based on site data and automatically adapts to the climate characteristics of different regions [63]. In this study, month-scale scPDSI data from the Climatic Research Unit (CRU) were selected for comparative analysis with the WSDI.

2.2.5. Teleconnection Factors
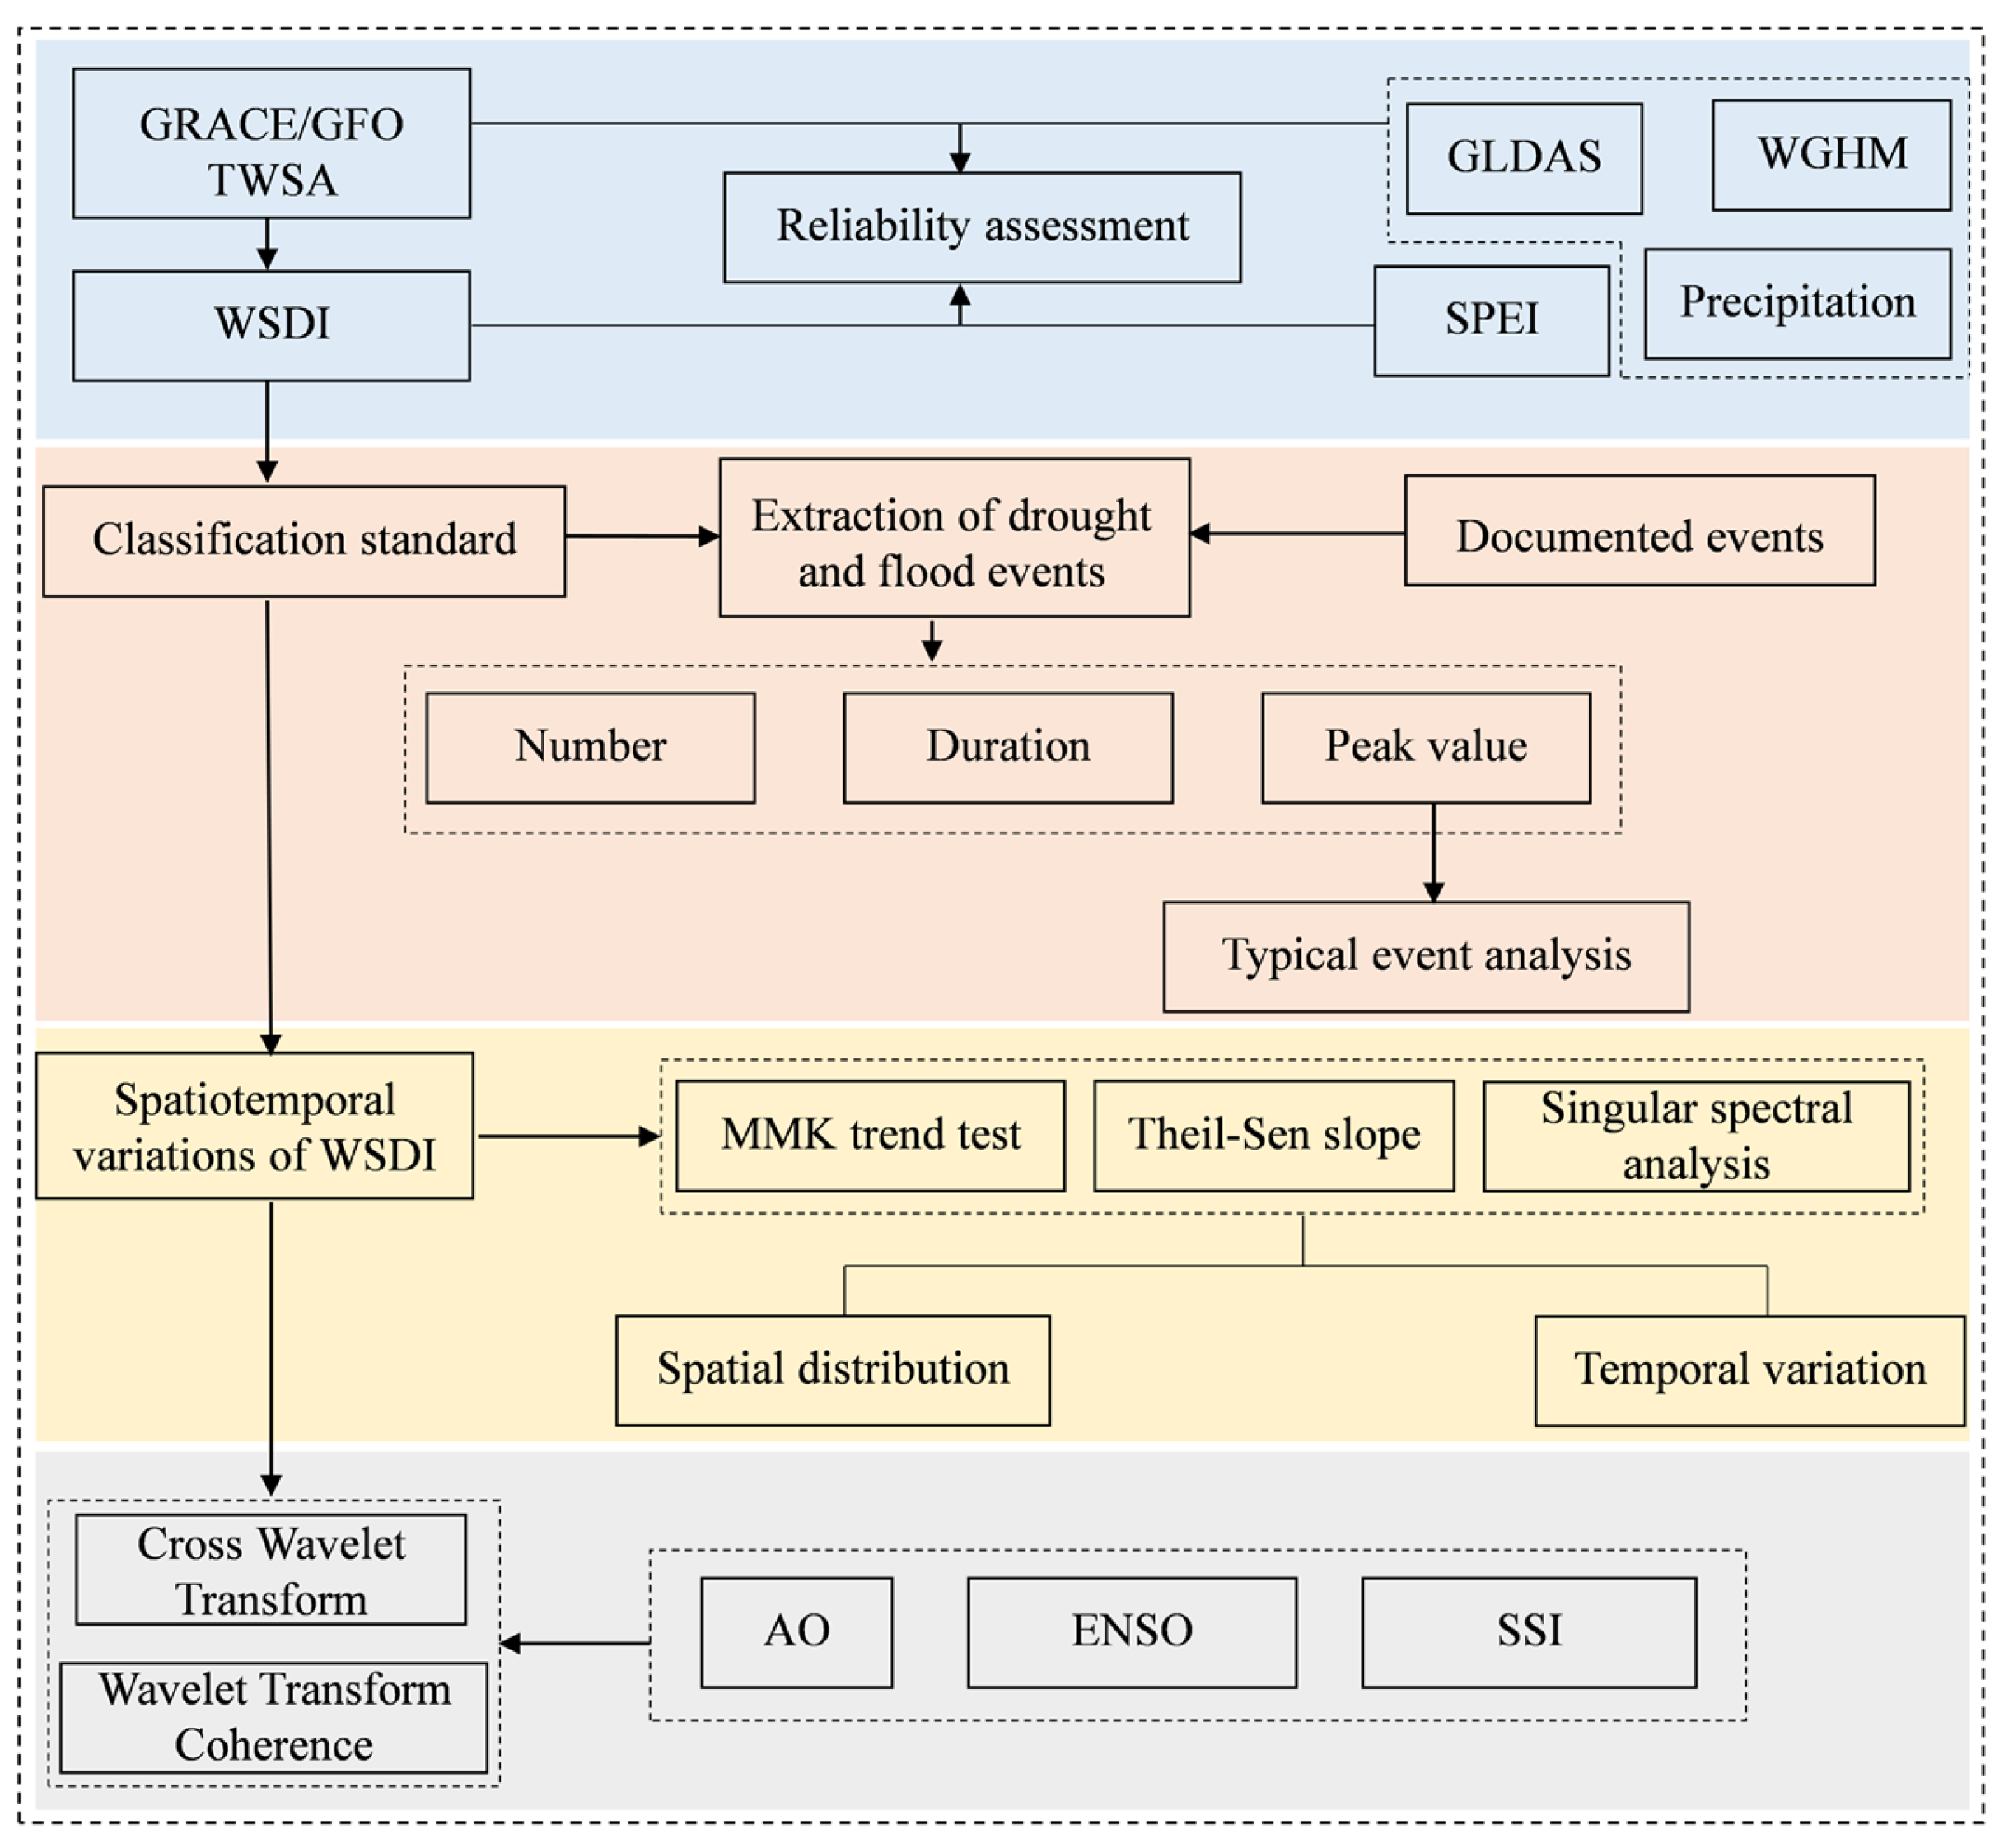
In this study, ENSO, AO, and SSI were selected as key factors for wavelet analysis, and the Multivariate ENSO Index (MEI) was chosen to characterize ENSO. ENSO, as one of the globally important climate factors, plays a significant role in regulating climate change in East Asia [64]. The variation in AO has a huge impact on the climatic anomalies in the Northern Hemisphere [65]. Furthermore, solar activities are associated with drought and flood events by influencing precipitation patterns [66]. Therefore, SSI was selected to explore the impact of solar activities on hydrological processes in the YRB. Among the three indices, MEI and AO were from the National Oceanic and Atmospheric Administration, and SSI was from the Solar Influences Data Analysis Center. The acquisition method is in Table 1.

3. Methods

In this study, the reliability of WSDI in characterizing drought and flood events was verified in two dimensions: through correlation analysis of multi-source data and comparison of the accuracy in identifying drought and flood events. Additionally, the distribution characteristics of typical drought and flood events in the YRB and the spatial-temporal evolution trends of WSDI at multiple scales were revealed. Meanwhile, the dynamic relationship between droughts and floods and climate factors such as ENSO and AO was explored by wavelet analysis. The time series presented in the study are monthly spatial averages of the YRB or sub-basins generated based on the spatial averaging method. The specific process of this study is shown in Figure 2.

3.1. Water Storage Deficit Index (WSDI)

The water storage deficit (WSD) is defined as the difference between GRACE/GFO TWSA time series and the average of the monthly TWSA and is calculated as follows [67]:
W S D i , j   = T W S A i , j T W S A j ¯
where T W S A i , j represents the TWSA value for month j of the year i , obtained from GRACE/GFO, and T W S A j ¯ represents the long-term average of the TWSA for month j ; that is, the average value of the same month, from April 2002 to December 2022. Positive values of W S D i , j represent water storage surplus and negative values represent water storage deficit. In order to facilitate comparisons with other drought indices, WSD can be normalized to WSDI. The calculation of WSDI is usually based on raw data without detrending and is calculated as follows [68]:
W S D I i , j = W S D i , j μ σ
where μ and σ represent the mean and standard deviation of the WSD time series, respectively. The drought and flood classification criteria of WSDI, SPEI, and scPDSI are shown in Table 2 [14,21,69].
A drought or flood event is defined as one in which each index exceeds the mild threshold for more than three months [70]. The peak value in a drought or flood event is the minimum or maximum value and the corresponding time is the peak date.

3.2. The Modified Mann–Kendall (MMK) Trend Test

The Mann–Kendall trend test is a nonparametric test for detecting trends in time series data, but most hydrological time series have autocorrelation, which affects the test results. The Modified Mann–Kendall trend test can solve the autocorrelation problem of time series and is more reliable and robust than the traditional Mann–Kendall trend test in capturing the trend of hydrometeorological series [71]. Therefore, the MMK method was adopted to identify the characteristics of spatial and temporal changes in WSDI in the YRB from 2002 to 2022.

3.3. Theil–Sen Slope

The Theil–Sen slope is a nonparametric test for estimating the trend of a time series, which, combined with MMK, can accurately obtain the significance and magnitude of the changing trend. It is insensitive to outliers, has good noise immunity, and has been widely used in the fields of drought, astronomy, and remote sensing [45]. The formula is as follows:
Q m e d = m e d i a n x j x k j k
where x j and x k are the time series sample data of time j and k. If Q m e d > 0, it indicates that the time series has an upward trend; otherwise, it has a downward trend. The larger the Q m e d is, the more pronounced the change trend of the time series is.

3.4. Singular Spectral Analysis (SSA)

The singular spectrum analysis is a time series analysis method for nonlinear data decomposition by singular value decomposition, which is based on empirical orthogonal functions and statistical dynamic reconstruction techniques of time series [72]. Since the method avoids the overfitting problem compared to other methods, it is widely adopted to analyze the characteristics of time series variations and extract time series information, especially for extracting nonlinear trends and oscillatory components or removing noise [52].

3.5. Cross Wavelet Transform (XWT) and Wavelet Transform Coherence (WTC)

Cross wavelet transform and wavelet transform coherence are effective signal analysis techniques that combine cross spectrum analysis and wavelet transform [73]. XWT can reflect the regions with the same energy spectrum after the wavelet transform of WSDI and different teleconnection factors in high-energy regions and reveal their relationship in the time–frequency domain from the perspective of multiple time scales [74]. The theoretical distribution of the cross-wavelet power spectrum based on XWT is as follows:
D W n X S W n Y * S σ X σ Y < P = Z v p v P k X P k Y
where σ X and σ Y are the standard deviations of WSDI and teleconnection factors, Z v p is the confidence interval associated with the probability density function, and P k X and P k Y are the background power spectra.
Wavelet transform coherence can be determined by estimating the wavelet coherence coefficients between WSDI and teleconnection factors in the time–frequency domain to determine their relationship in the low-energy region [75]. The wavelet coherence coefficients are calculated as follows:
R n 2 S = S S 1 W n X Y S 2 S S 1 S W n X S 2 · S S 1 S W n Y S 2
where R n 2 S varies from 0 to 1 and S is the smoothing operator. The common frequency (period) range of WSDI and the teleconnection factors is 2–86 months [76]. The Morlet wavelet is chosen as the mother wavelet because it preserves the temporal resolution of the original signal and is very suitable for time–frequency analysis as it effectively reduces the influence of ripple effects on the results [77].

4. Results

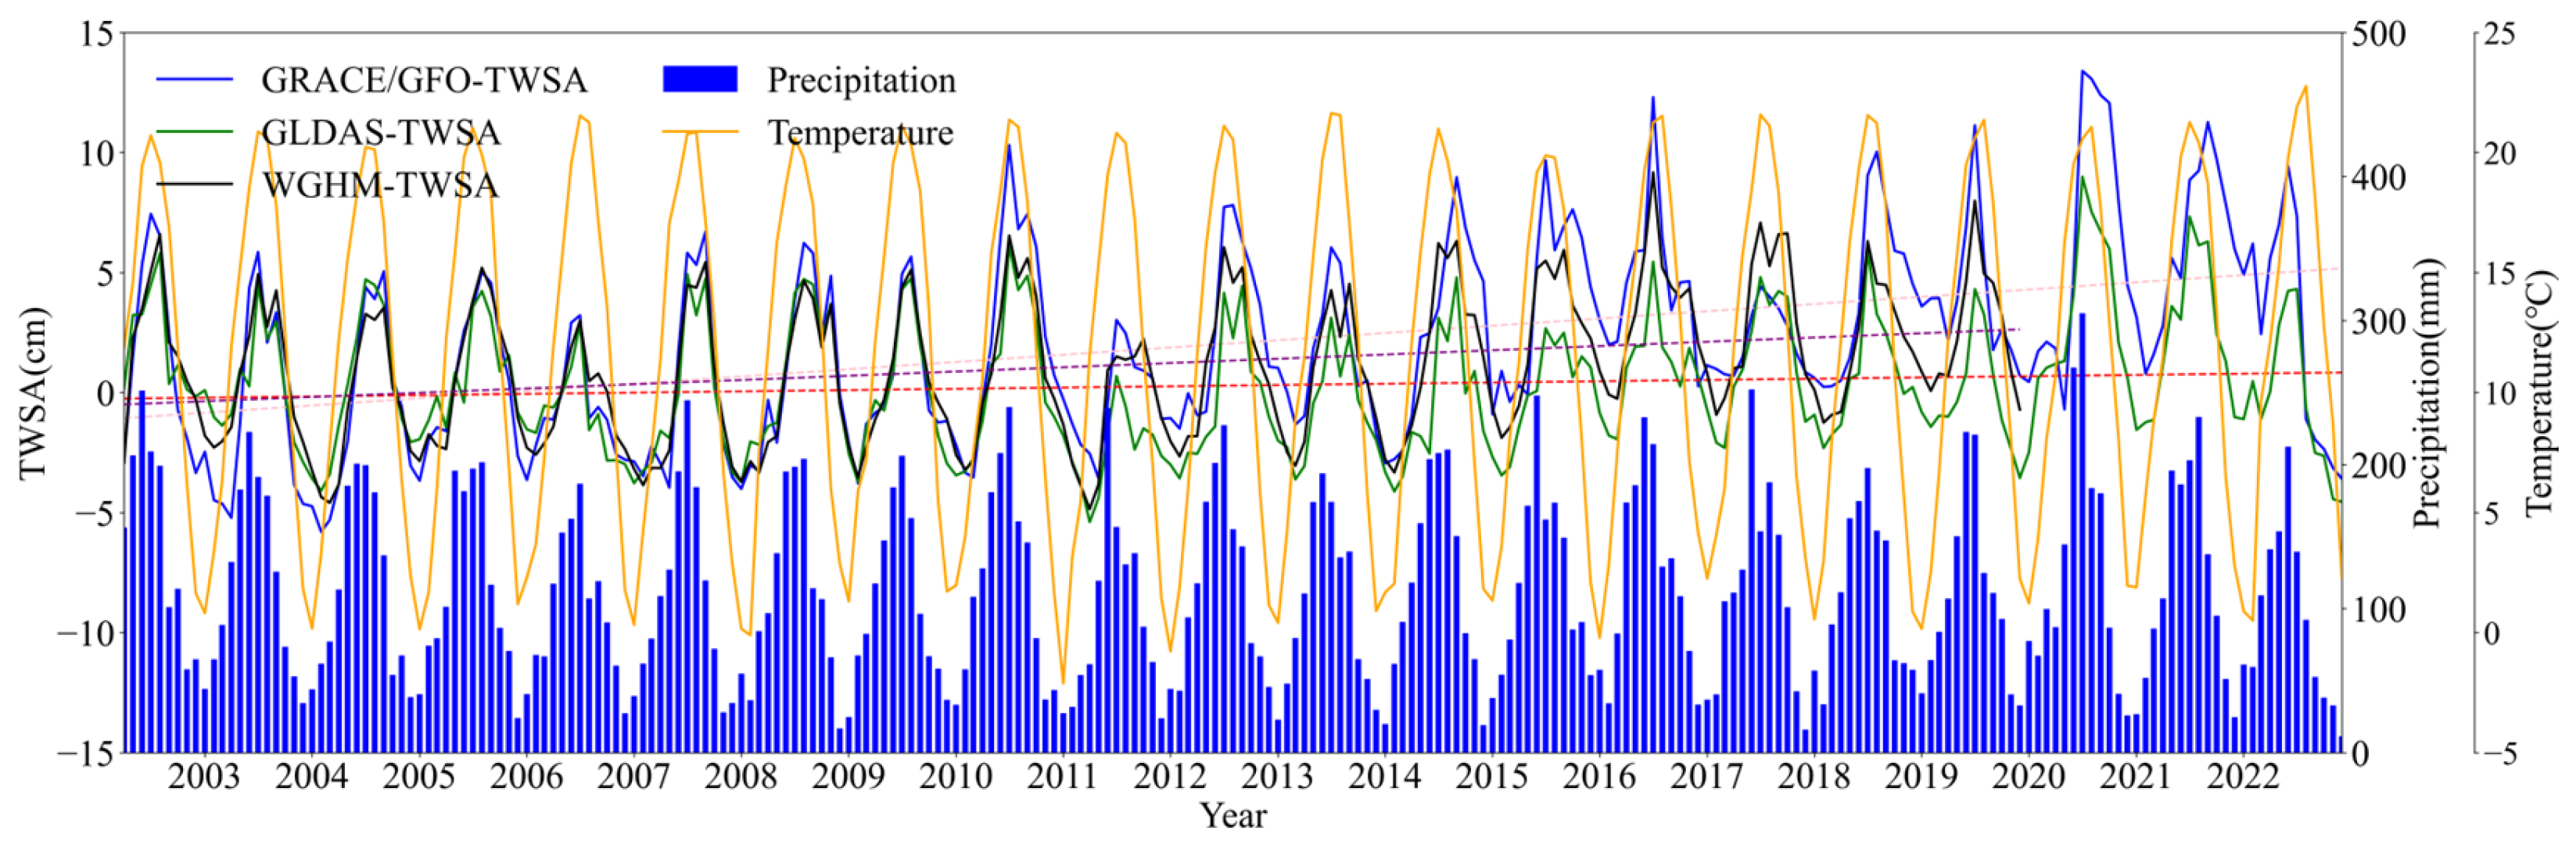
4.1. Reliability Verification

4.1.1. GRACE/GFO Assessment

In order to ensure the reliability of the TWSA derived from GRACE/GFO after interpolation, the WGHM hydrological model data and the GLDAS NOAH assimilation data were selected for the comparative analysis of GRACE/GFO data in this study [78]. As shown in Figure 3, all three TWSAs contained the same water fraction and thus showed a high degree of correlation. The correlation coefficients of GRACE/GFO data with the two types of TWSA were 0.9 and 0.82 ( p < 0.05), respectively. In terms of the range of variation, GRACE/GFO varied from −5.80 to 13.40 cm, GLDAS varied from −5.38 to 8.99 cm, and WGHM varied from −4.85 to 9.17 cm (Figure 4). Since GLDAS did not contain groundwater, while WGHM contained 10 water components, including groundwater, its correlation with GRACE/GFO was higher than GLDAS. The three TWSAs also demonstrated consistent seasonal fluctuations with precipitation, with correlation coefficients of 0.53, 0.66, and 0.63, respectively (Figure 3a). The highest precipitation in 2020 was 1567.09 mm and the annual cumulative value of GRACE/GFO-TWSA for that year also reached its maximum at 73.73 cm (Figure 4). As shown in Figure 3b, the correlation coefficients of the three TWSAs with precipitation were at their maximum values of 0.71, 0.82, and 0.84 when lagged for one month, indicating that there was a one-month lagged effect between TWSA and precipitation, which was consistent with the results of some other regions [79,80]. This lag effect was influenced by the nature of the catchment and geological conditions and was closely related to hydrological processes such as infiltration, storage, and subsequent release of precipitation [81,82].
After 2010, the difference between the GLDAS and the other two TWSAs gradually increased, indicating that the sum of groundwater storage and surface water storage in the YRB was increasing. In summary, the results of the quantitative analysis of GRACE/GFO were credible and valid, indicating that GRACE/GFO data could provide a solid foundation for subsequent drought and flood monitoring research.

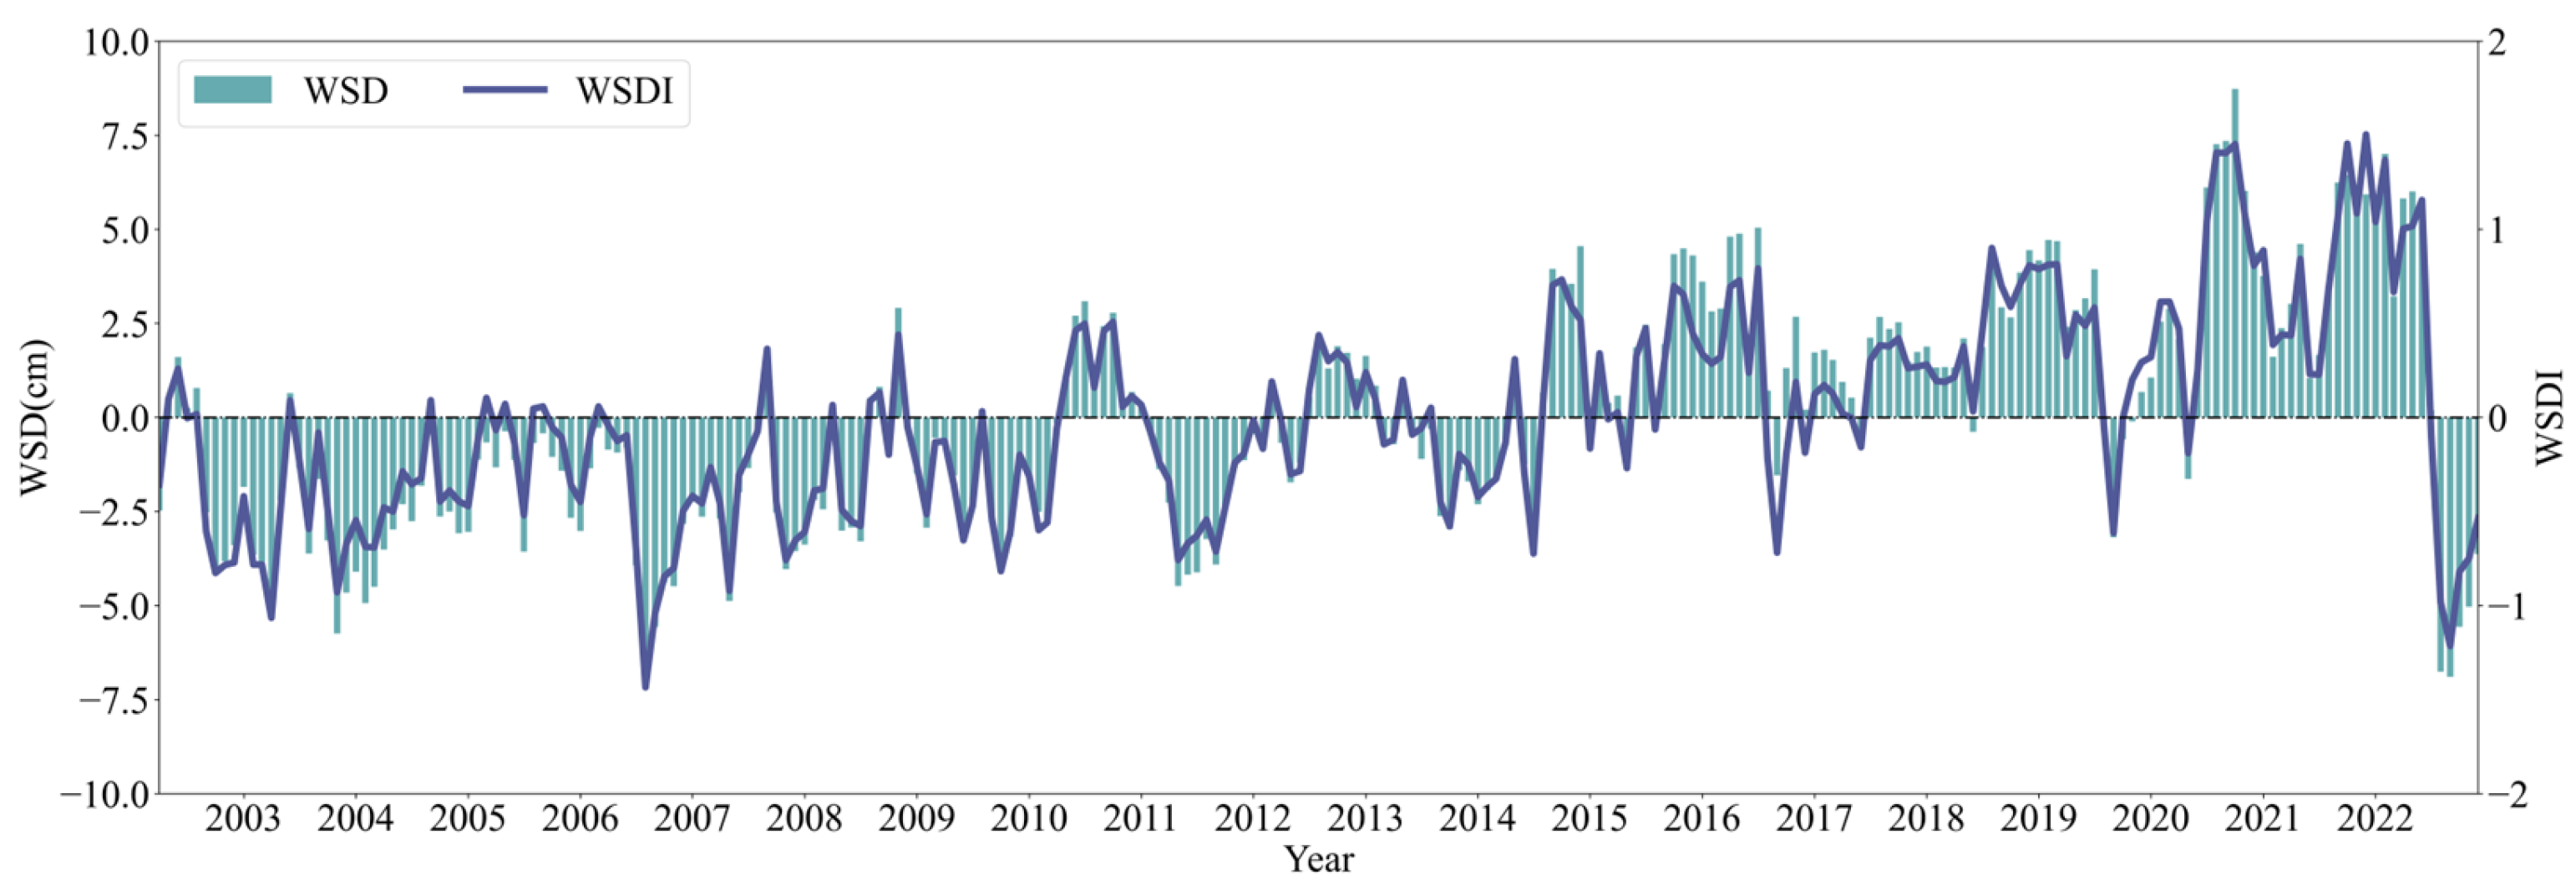
4.1.2. WSDI Assessment

After evaluating the reliability of GRACE/GFO data, WSDI was calculated according to formulas (1) and (2), as shown in Figure 5. Before 2015, WSD was primarily negative, with an average of −1.43 cm. After 2015, except for the three periods of apparent water reserve deficit, the remaining periods all showed a water reserve surplus, and the WSD reached the maximum value of 8.73 cm in October 2020. In September 2022, WSD reached a minimum value of −6.90 cm. Since WSDI was a metric of WSD, the changes and fluctuations of the two were relatively similar.
In order to assess the reliability of WSDI for monitoring droughts and floods, SPEI with a time scale of 1–12 months were selected for comparison with WSDI, and correlation coefficients were calculated. As can be seen from Figure 6, the WSDI lay roughly within the shaded interval of the SPEI and exhibited significant positive correlations ( p < 0.01) with the SPEI at different time scales, with the correlation varying with time and space. The correlation coefficients between WSDI and SPEI were all greater than 0.6 from SPEI04 to SPEI12, suggesting that WSDI can reflect the long-term cumulative effects of droughts and floods [83]. The SPEI at the 7-month scale had the strongest correlation with WSDI, with a correlation coefficient of 0.684.

4.2. Drought and Flood Events Based on WSDI

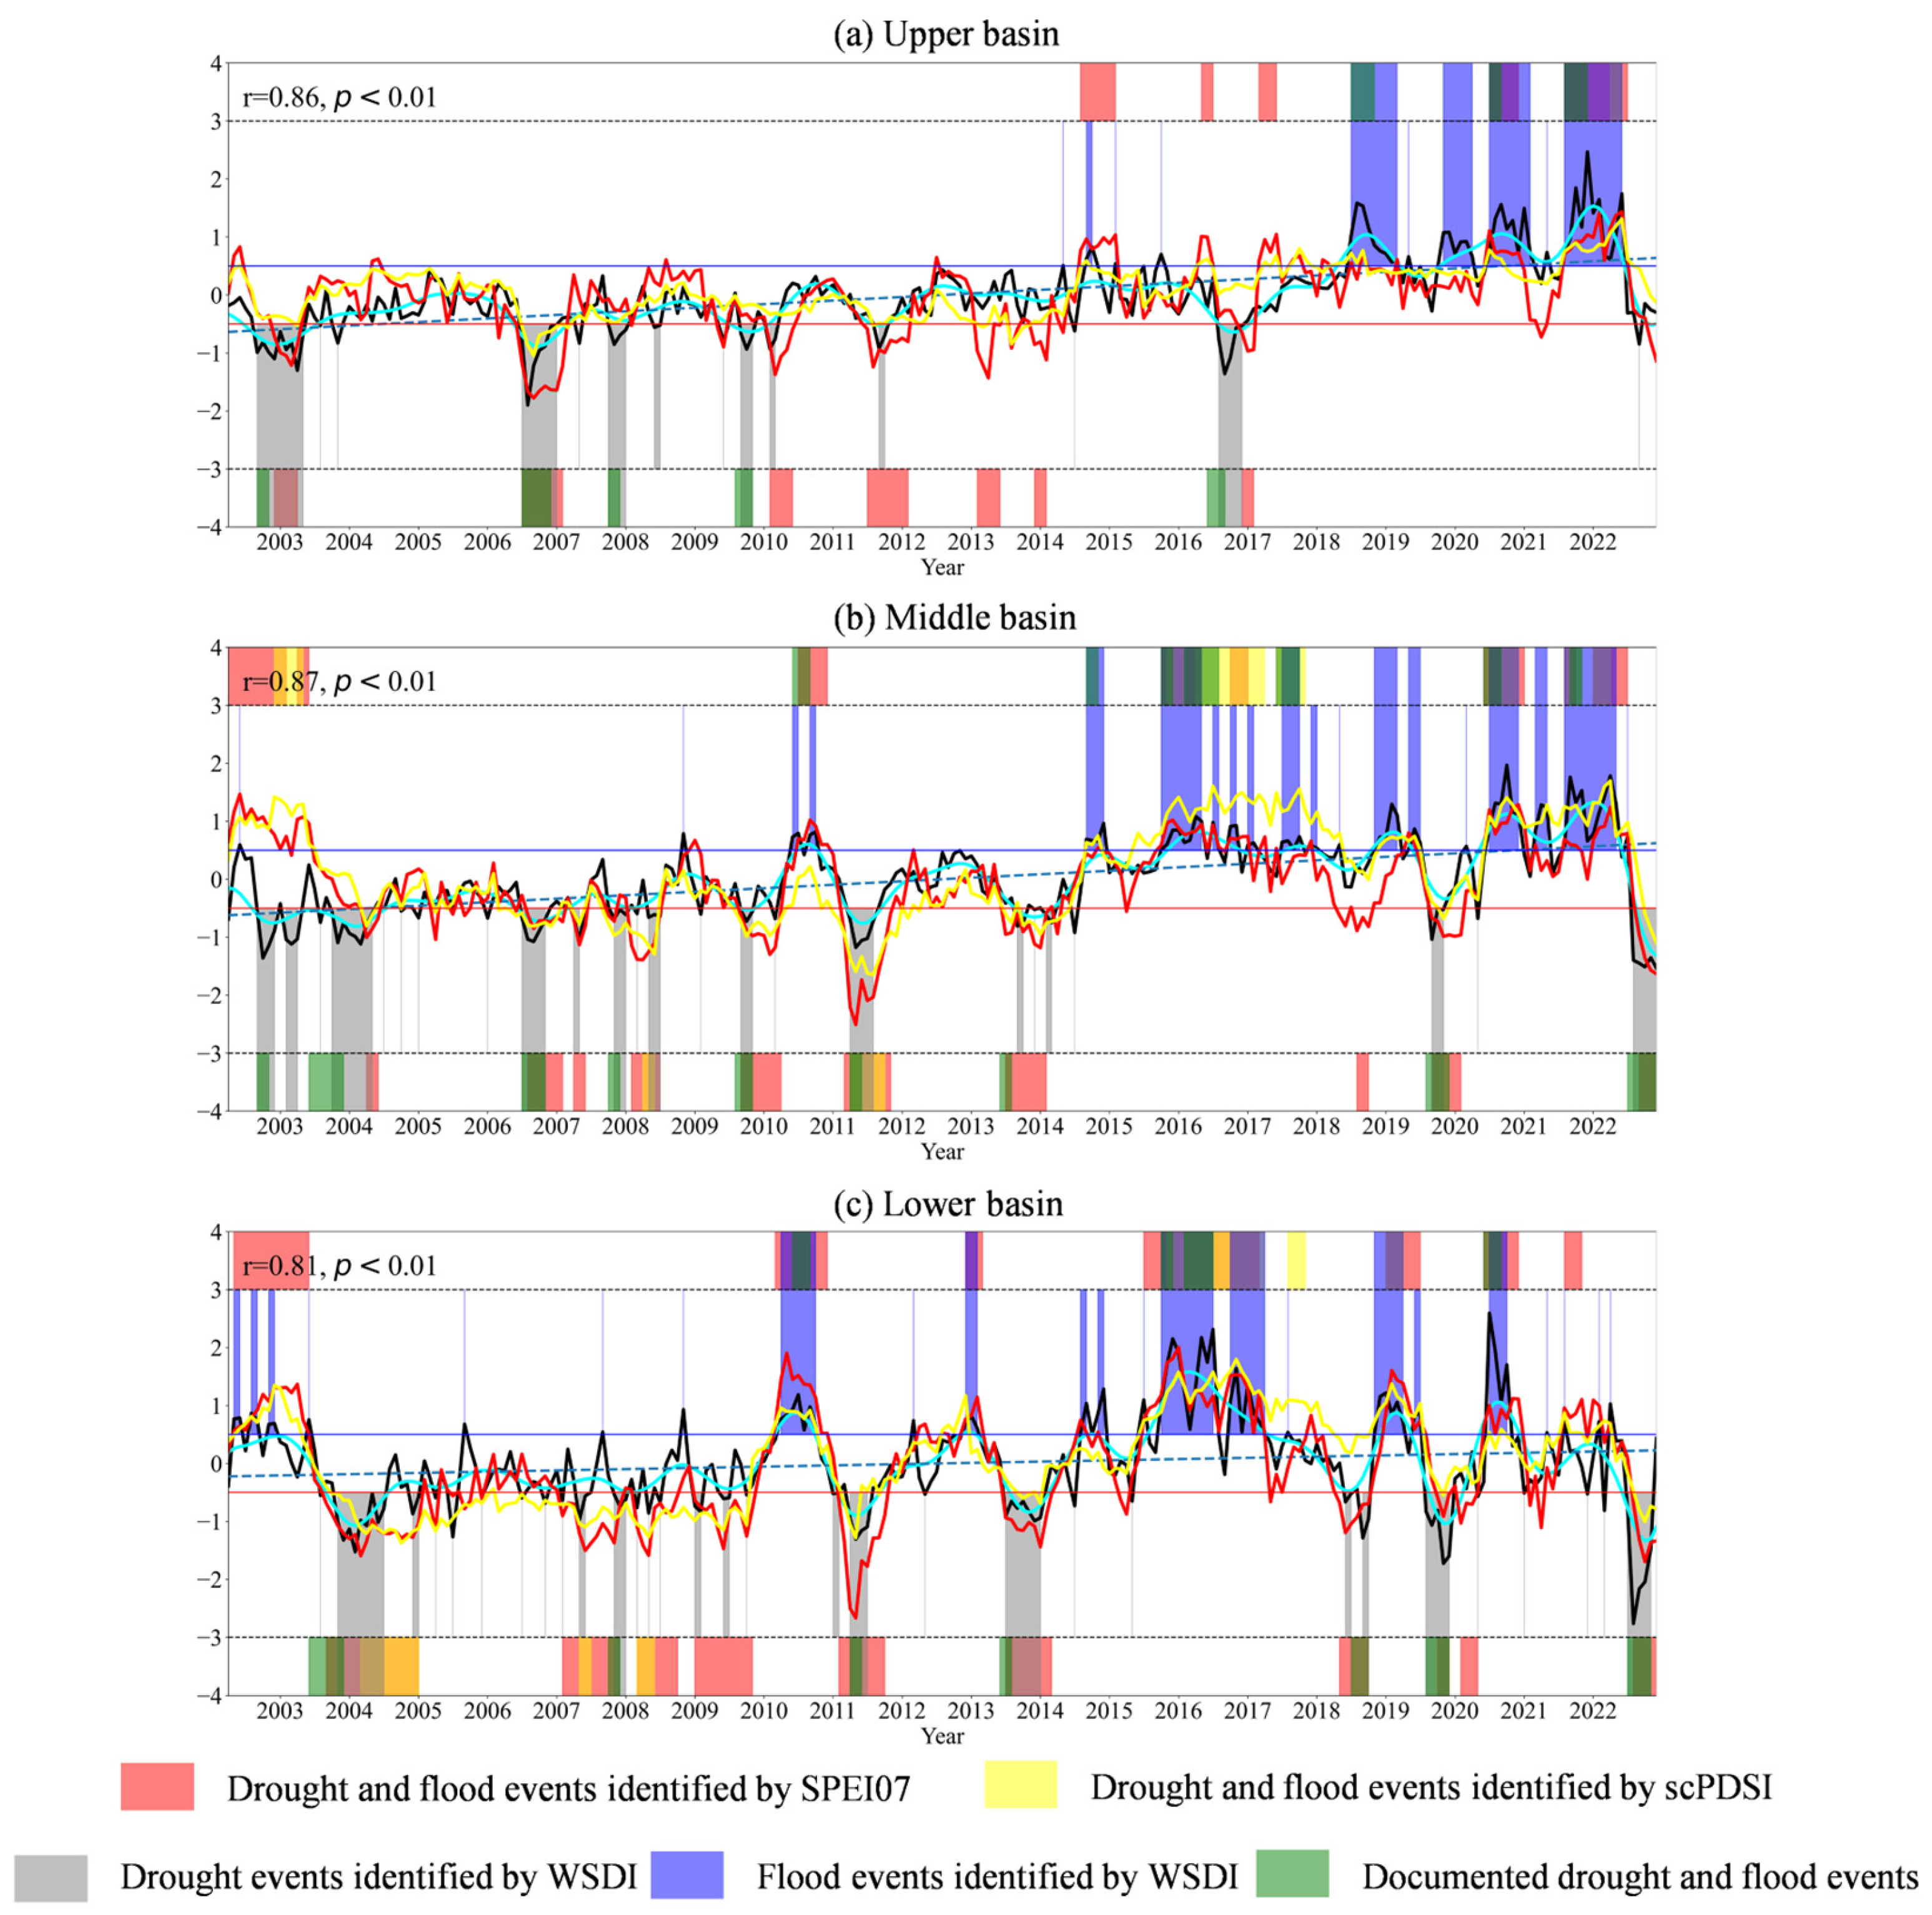
4.2.1. Identification of Drought and Flood Events

The WSDI and SPEI07 time series for each sub-basin of the YRB from 2002 to 2022, the drought and flood events captured by the two indices, and the timing of the documented drought and flood events are shown in Figure 7. According to the annual Bulletin of Water Resources in the Yangtze River Basin and Southwest Rivers, from 2002 to 2022, five drought events and three flood events occurred in the UYRB (Figure 7a), nine drought events and seven flood events occurred in the MYRB (Figure 7b), and seven drought events and four flood events occurred in the LYRB (Figure 7c). Compared to WSDI, SPEI and scPDSI performed relatively poorly in drought and flood events recognition. Specifically, SPEI tended to identify a higher number of events, while scPDSI identified an insufficient number of events. Their identification results had lower consistency with historically documented events, indicating that SPEI and scPDSI had some limitations in terms of the accuracy and reliability of event identification. In contrast, WSDI was able to capture drought and flood events more accurately, and its identification results were more consistent with historically documented events, demonstrating higher accuracy. However, in the middle reaches, the WSDI identified a total of 10 drought events, one more than the historical record. This difference may stem from the following two reasons. First, as a quantitative indicator based on water storage anomalies, the WSDI can detect minor drought events whose intensity slightly falls below the documentation threshold but exceeds the WSDI critical value. Second, documented events tend to prioritize those with significant socio-economic or ecological impacts, meaning that some smaller events with weaker intensities may not have been included in the statistics.
As can be seen from Figure 7a–c, WSDI performed better in capturing documented drought and flood events after 2005. The identified drought and flood events were consistent with typical drought and flood years in history, and many typical severe drought and flood events, such as the YRB extreme flood in 2020 and the YRB extreme drought in 2022, have been successfully captured. This was due to the poor quality of the initial data obtained at the beginning of the GRACE/GFO mission compared to the results obtained during the interim phase [37]. Since WSDI was a comprehensive reflection of surplus or deficit of various hydrological components such as snow water, groundwater, and surface water, and the response time of hydrological components to water balance generally extended with the water infiltration process, there were differences in the capture and response time of WSDI to droughts and floods [83]. In general, WSDI could accurately reflect drought and flood events.
The WSDI of the three sub-basins, both linear and SSA-derived trends (nonlinear trend curves of WSDI), showed an increasing trend, representing that the whole YRB tended to be wetter and prone to flooding. However, the change characteristics of the three sub-basins were not completely synchronized, which was related to the specific region (upper, middle, and lower reaches) of the YRB where the drought or flood event occurred. The frequency of flood events in all three sub-basins has increased in recent years, which was related to more frequent and severe extreme precipitation events in the YRB, especially in the eastern region [39,84].
In the three sub-basins, the number of drought and flood events in the MYRB and LYRB were significantly higher than in the UYRB, especially in the MYRB, where ten drought events and eight flood events occurred (Table 3). The average peak value of droughts gradually decreased from UYRB to LYRB, changing from −0.55 to −1.51. In the middle reaches, the average duration of droughts and floods, as well as the peak value of floods, were the smallest among the three sub-basins, with values of 5.6 months, 8.75 months, and 1.25, respectively. The average durations of droughts in the UYRB and LYRB were very similar, at 5.6 and 5.5 months, while the average durations of floods were 8.75 and 6.17 months, respectively. The average peak values of floods in the two sub-basins were also quite close, at 1.67 and 1.63, respectively.

4.2.2. Typical Drought and Flood Events

The China Meteorological Administration and Changjiang Water Resources Commission (CWRC) recorded that the YRB experienced the most severe floods in 2020, second only to those in 1954 and 1998, and the most severe drought since 1961 in 2022. Table 3 also shows that in 2020 and 2022, the peak WSDI in the LYRB reached the maximum and minimum values among the three sub-basins, which were −2.77 and 2.59, respectively, far exceeding the extreme threshold. Therefore, these two events were selected as cases of drought and flood.
Figure 8 shows the spatial and temporal distribution of extreme floods in the YRB in 2020. In July 2020, extreme flooding occurred in the mainstem area of the MYRB and LYRB, with the average WSDI in the LYRB reaching a historical maximum of 2.59. The most severe flooding occurred in October, with an average WSDI of 1.45, indicating that almost the entire basin suffered the most severe flood disaster, with extreme flooding in Anhui, Jiangxi, Hubei, Hunan, Chongqing, and most parts of Guizhou. Meanwhile, the WSDI in the MYRB also reached a historical maximum. Since November 2020, flooding has subsided, leaving only parts of Hubei, Hunan, and Jiangxi still experiencing extreme flooding by December 2020. The flooding was particularly severe in parts of Hubei and Hunan and lasted for up to six months.
In the summer of 2022, an extreme drought occurred in the YRB. Figure 9 shows the spatial and temporal distribution of this drought event. Since August 2022, extreme drought has occurred in some areas of Sichuan, Gansu, Hubei, Anhui, and Jiangxi, and the WSDI of LYRB reached the lowest value in history of −2.77. The drought expanded further in September 2022, when the mean WSDI for the YRB reached its lowest value of −1.21, indicating that this month was the most severe period of drought. Drought conditions gradually weakened from October, and by December, the WSDI had risen to −0.54, with extreme drought remaining only in parts of the MYRB and UYRB. The border areas of Jiangxi, Hubei, and Anhui provinces were hardest hit by the drought, with the extreme drought lasting for two months, indicating that the region is more vulnerable to drought.

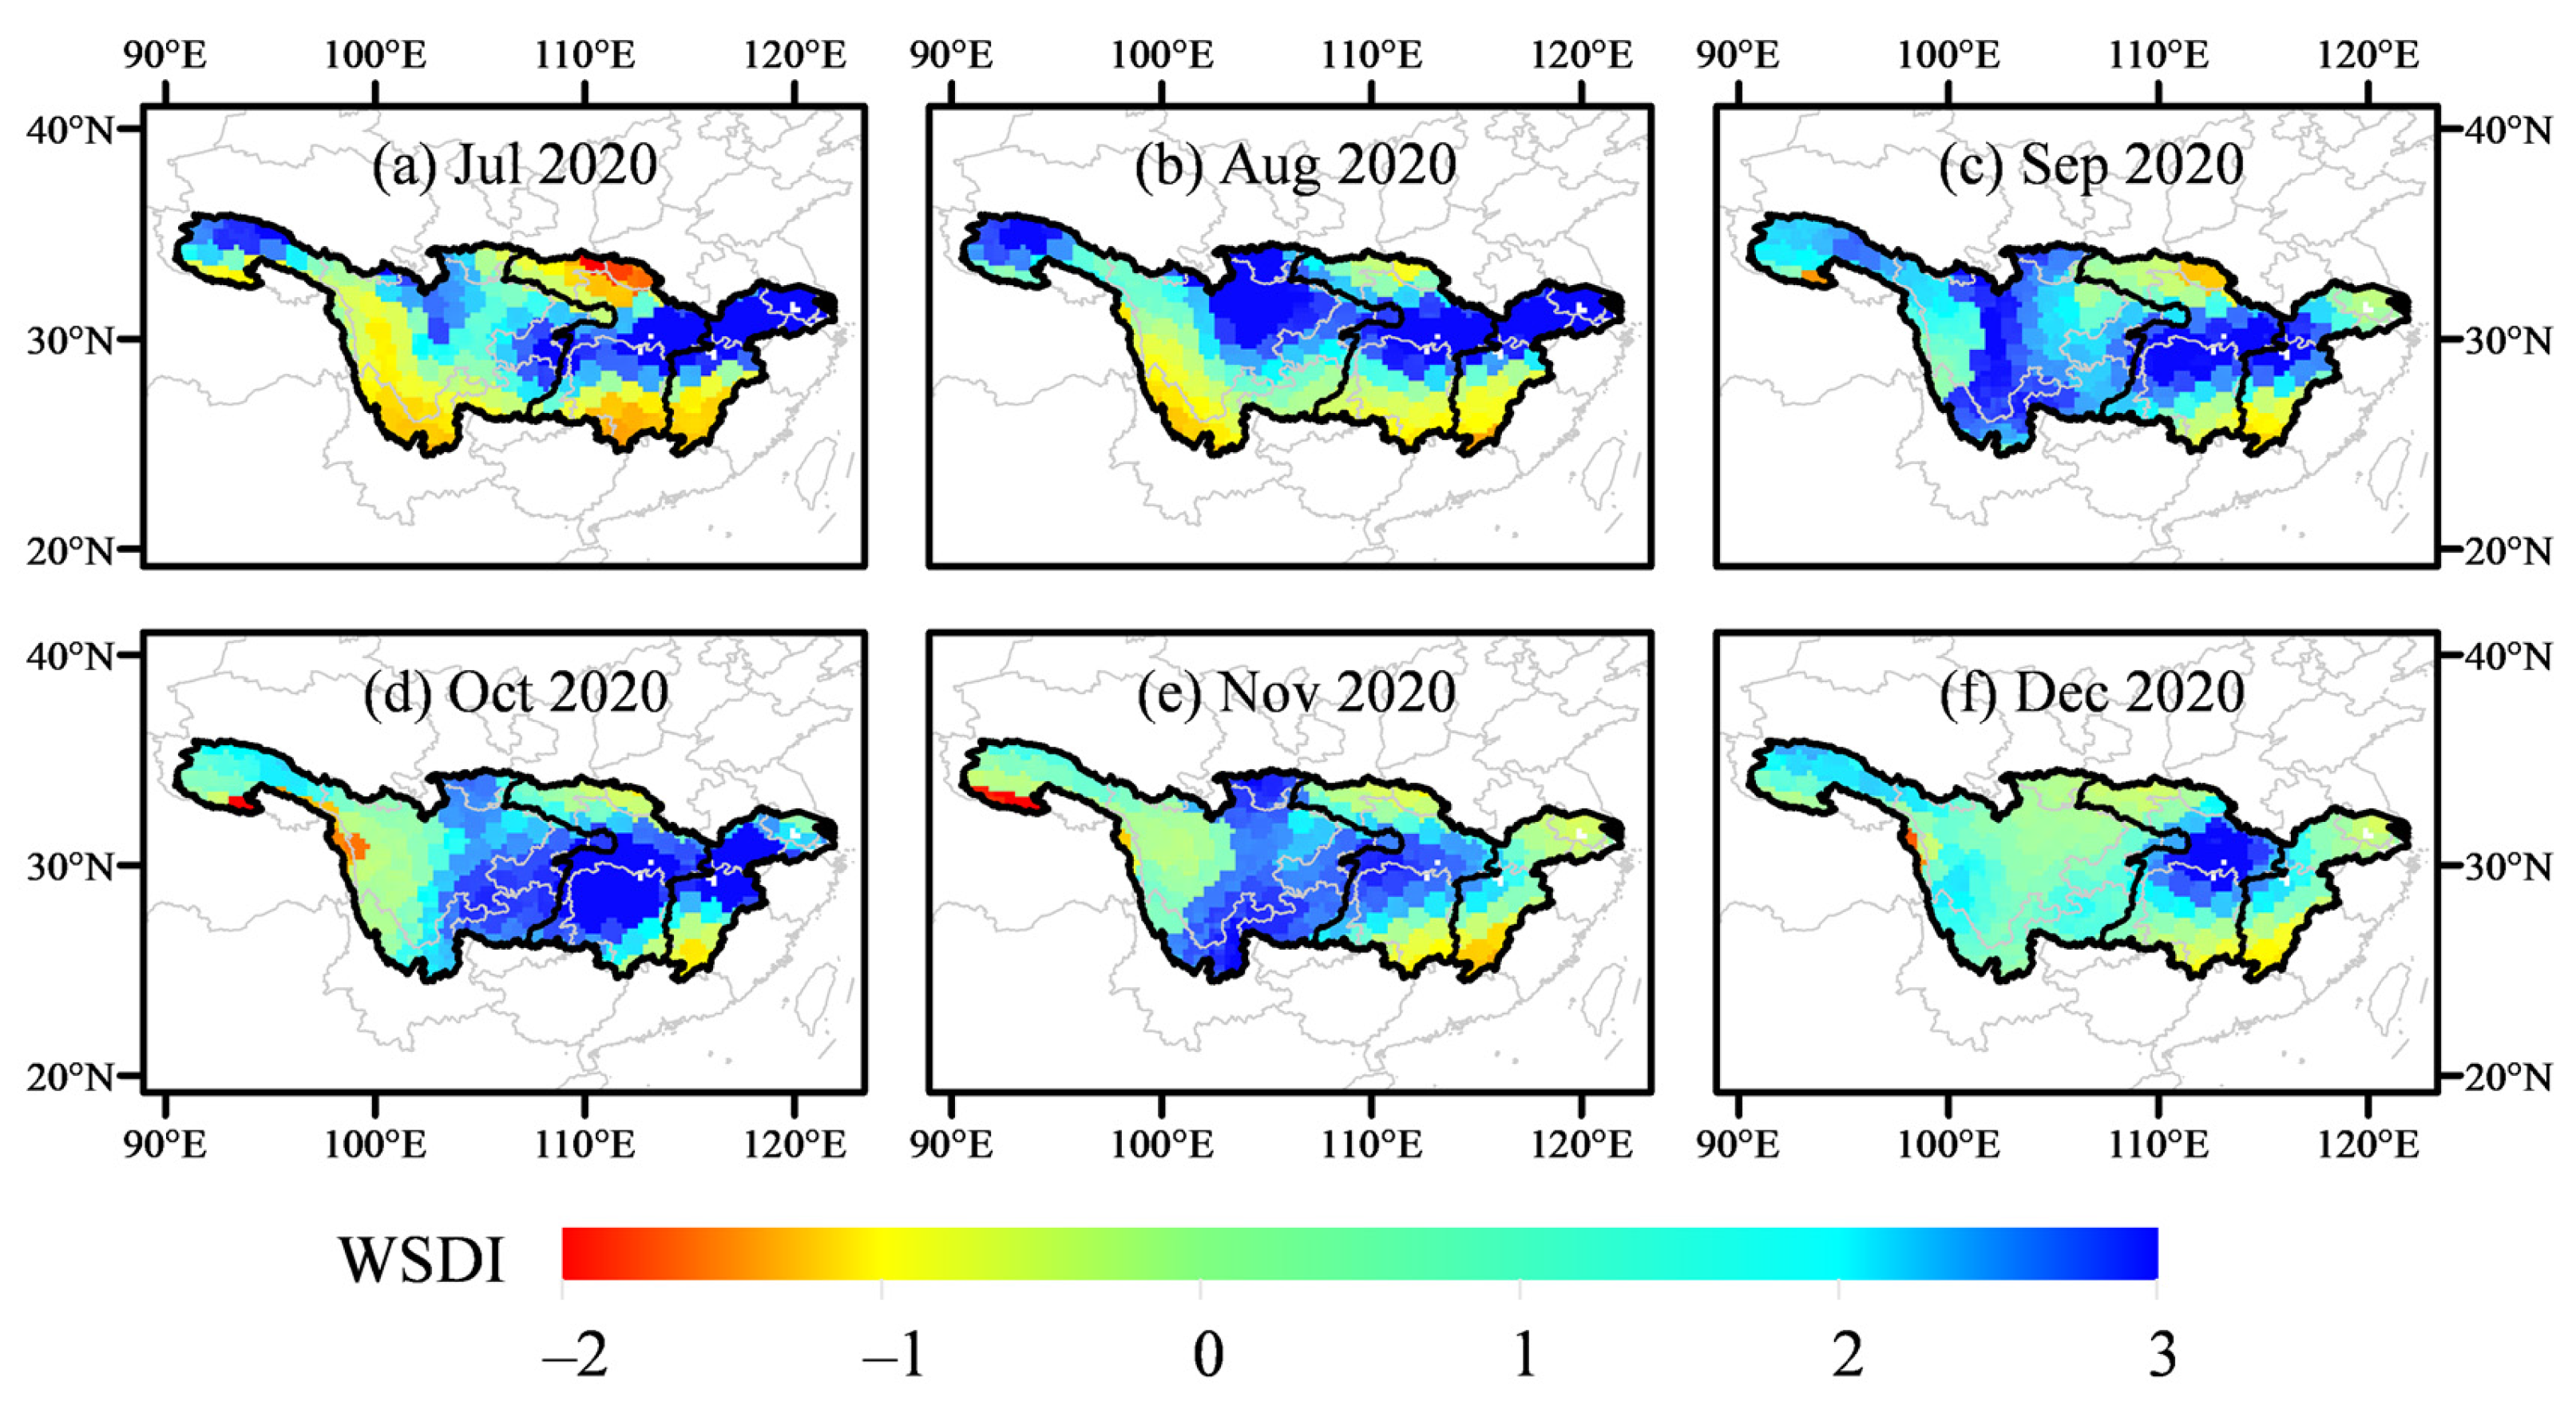
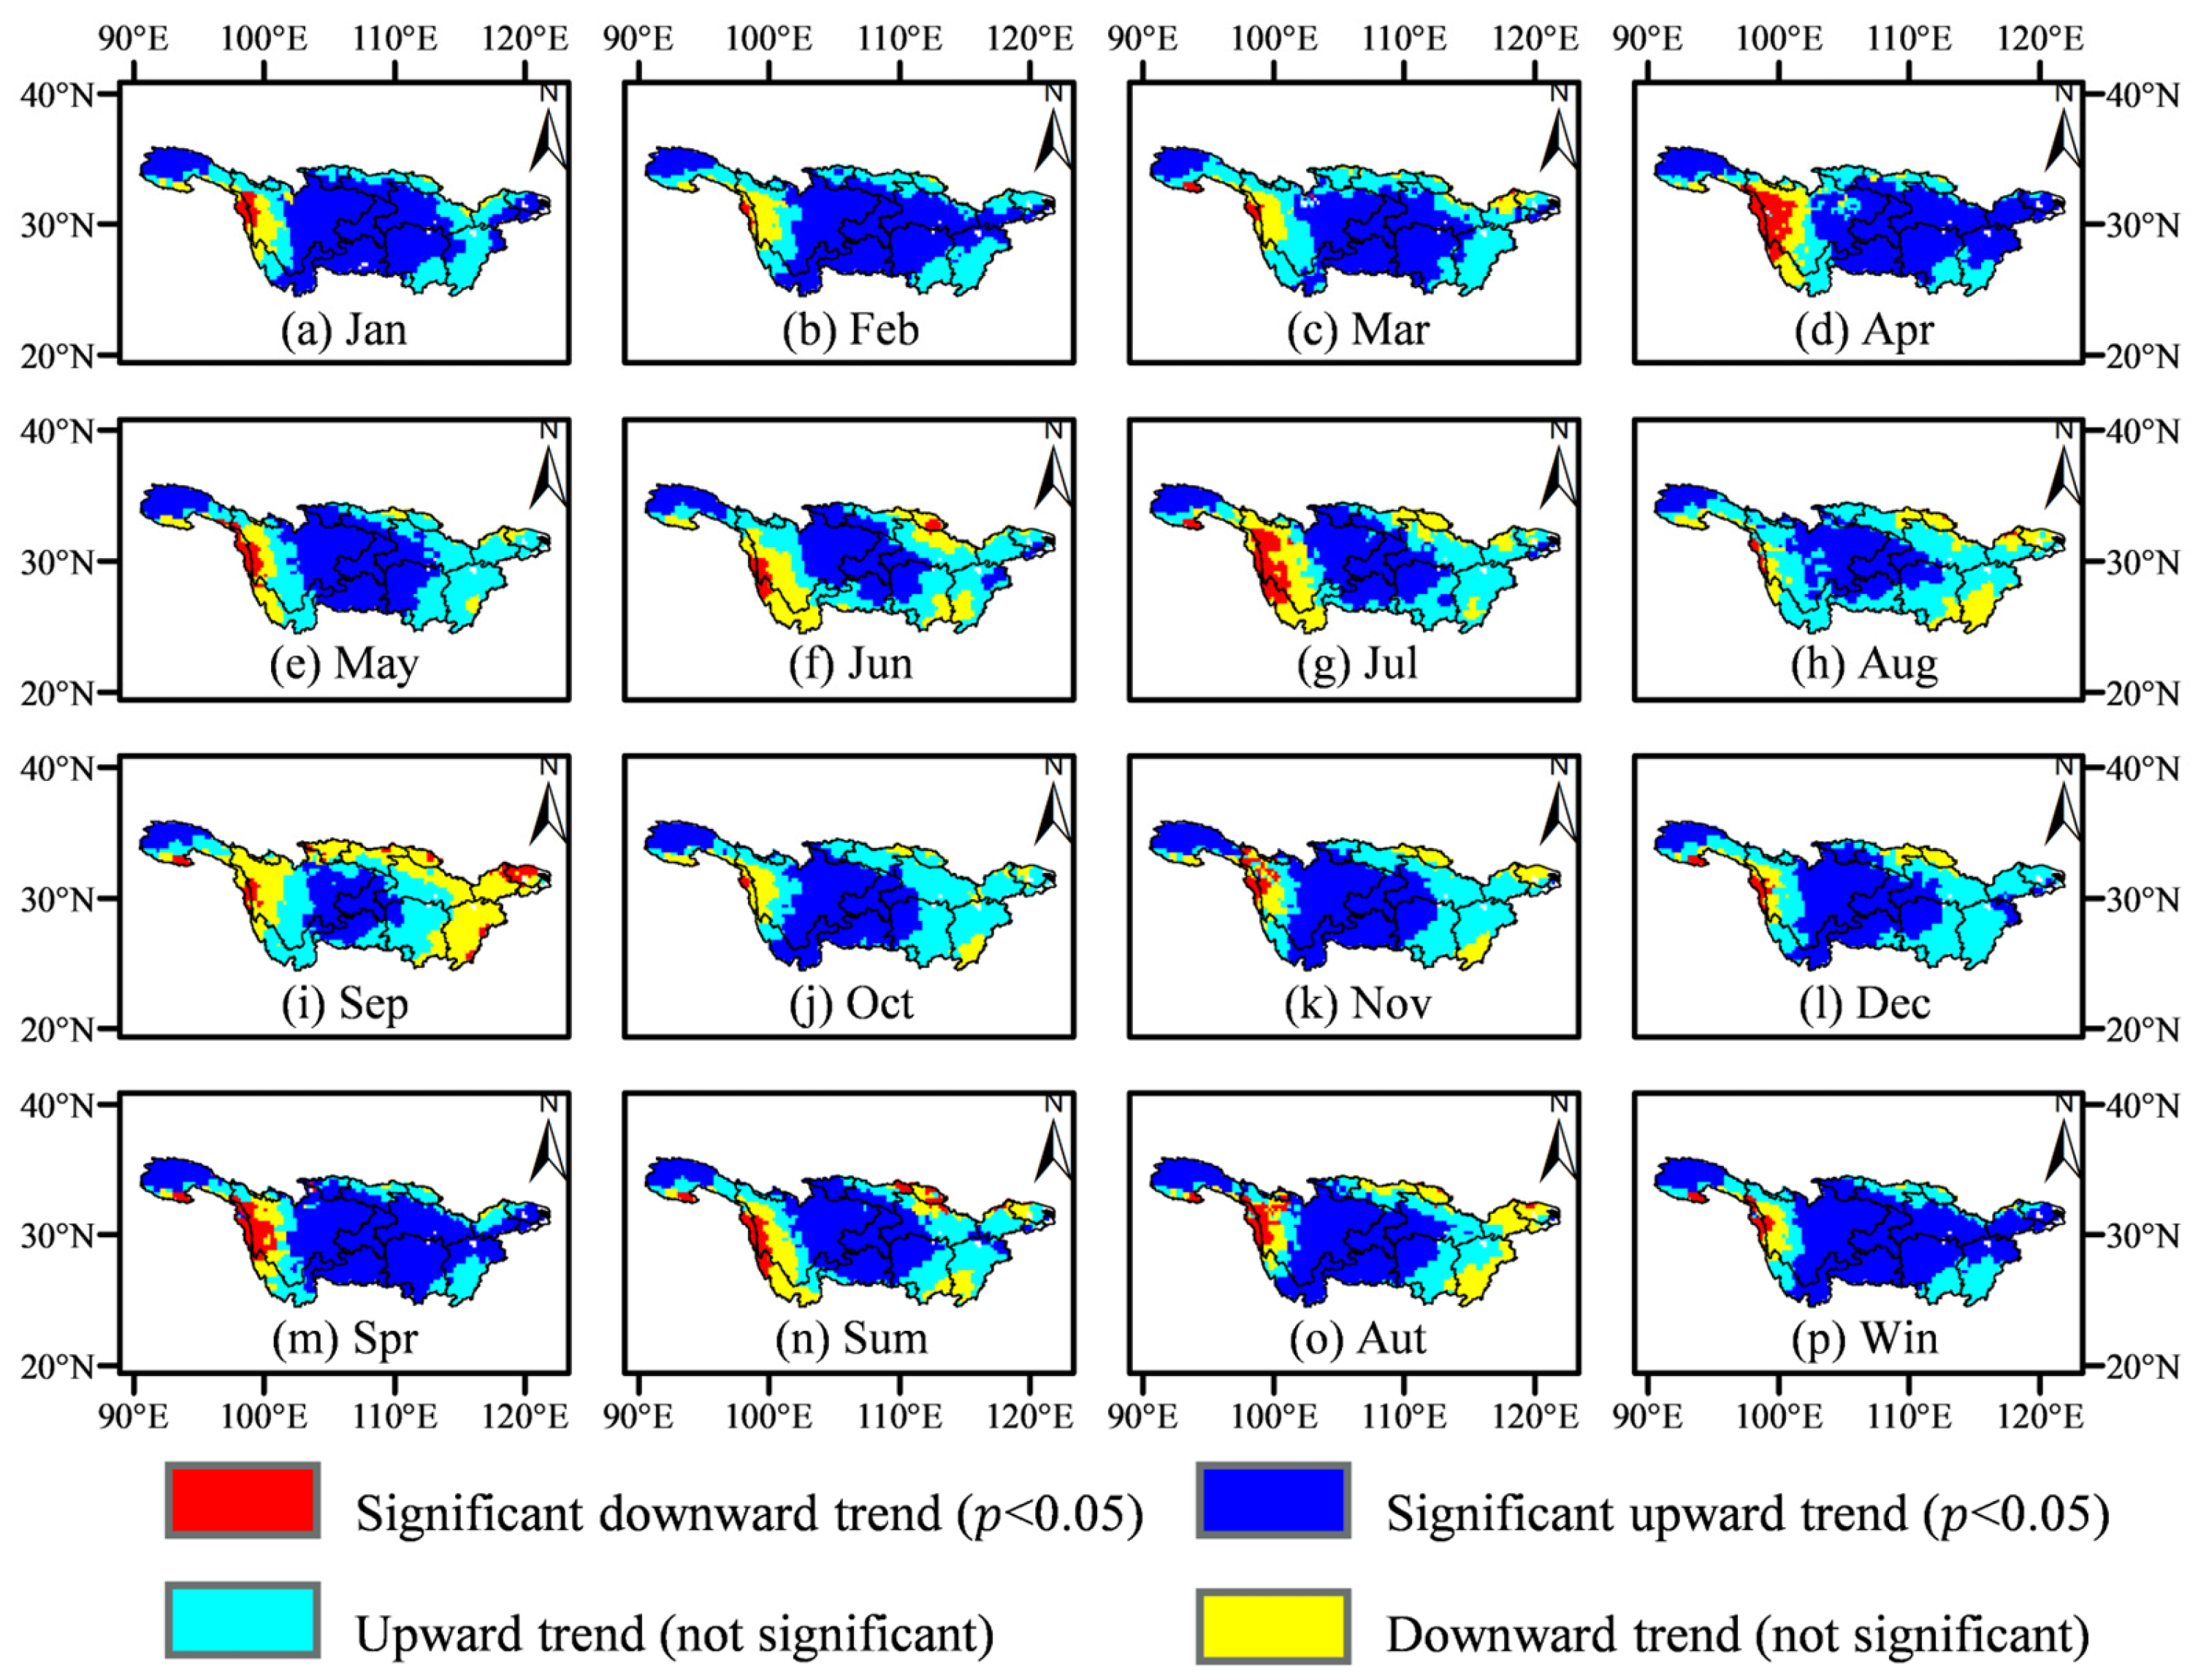
4.3. Spatial and Temporal Evolution of WSDI

The overall WSDI in the YRB showed an upward trend (Figure 5). However, in order to systematically assess the spatial and temporal characteristics of WSDI changes, the MMK trend test method was employed to analyze the monthly and seasonal variation trend of WSDI and their significance in the YRB from April 2002 to December 2022, as shown in Figure 10. The results showed the following. (1) The average test statistic Z* values of WSDI trends in the YRB from January to December were 2.33, 2.53, 2.12, 2.42, 1.84, 1.25, 1.28, 1.33, 0.75, 1.75, 2.18, and 2.04, respectively, and the average WSDI in each month showed an upward trend, indicating that the YRB showed a trend of wetting during 2002–2022. The percentage of area with an increasing trend in WSDI between January and December ranged from 60.4% to 92.9%, with the largest percentage of area significantly increasing ( p < 0.05) in February, accounting for 62.3% and the smallest percentage of area in September, accounting for 24.2%. (2) On the seasonal scale, the average Z* values of WSDI in spring, summer, autumn, and winter were 2.81, 2.05, 2.35, and 3.65, respectively, and the proportions of the area with an upward trend were 87.3%, 77.5%, 78.8%, and 92.6%, respectively. The largest range of area with a significant increase ( p < 0.05) in WSDI was 68.9% in winter. (3) The trend of WSDI varied in different regions. Western Sichuan showed a drying trend throughout the year, with the largest percentage of significantly drying area in July at 7.16% ( p < 0.05). The LYRB showed a drying trend only in September and autumn. Chongqing and eastern Sichuan showed significant wetting ( p < 0.05) throughout the year.
To quantitatively obtain the magnitude of the change trend in Figure 10, the monthly and seasonal spatial change rates of WSDI in the YRB from April 2002 to December 2022 were calculated based on the Theil–Sen slope method (Figure 11). The results showed the following. (1) The rate ranged from −0.15 to 0.23/year from January to December. The minimum rate was located at the junction of Sichuan, Yunnan, and Tibet in June, and the maximum rate was situated in the northwest of Hunan in March. (2) The maximum average rate was 0.07/year in November, and the minimum was 0.02/year in June. The mean rates in four seasons were 0.02, 0.01, 0.02, and 0.02/year, respectively. (3) The distribution of change rate also had noticeable spatiotemporal differences. From January to March, the area with the highest rate gradually shrank from the junction of Chongqing, Guizhou, and Hunan to the northwest of Hunan. In summer, it was transferred to the border areas of Sichuan and Gansu in June and July and to the border areas of Sichuan, Chongqing, Guizhou, and Yunnan from September to December. The border areas of Sichuan and Tibet had the lowest rate of change on monthly and seasonal scales. To summarize, WSDI increased significantly in most regions, which was consistent with the increasing trend of GRACE/GFO-TWSA. Terrestrial water storage was increasing in the YRB, especially in the central region.
In summary, the central area of the YRB and the source area became significantly wetter, and the WSDI in most of the area showed different degrees of increase, indicating that the regional TWSA was increasing. The result was consistent with the findings of Zhong et al. [85], further verifying the regional characteristics of water storage changes in the YRB.

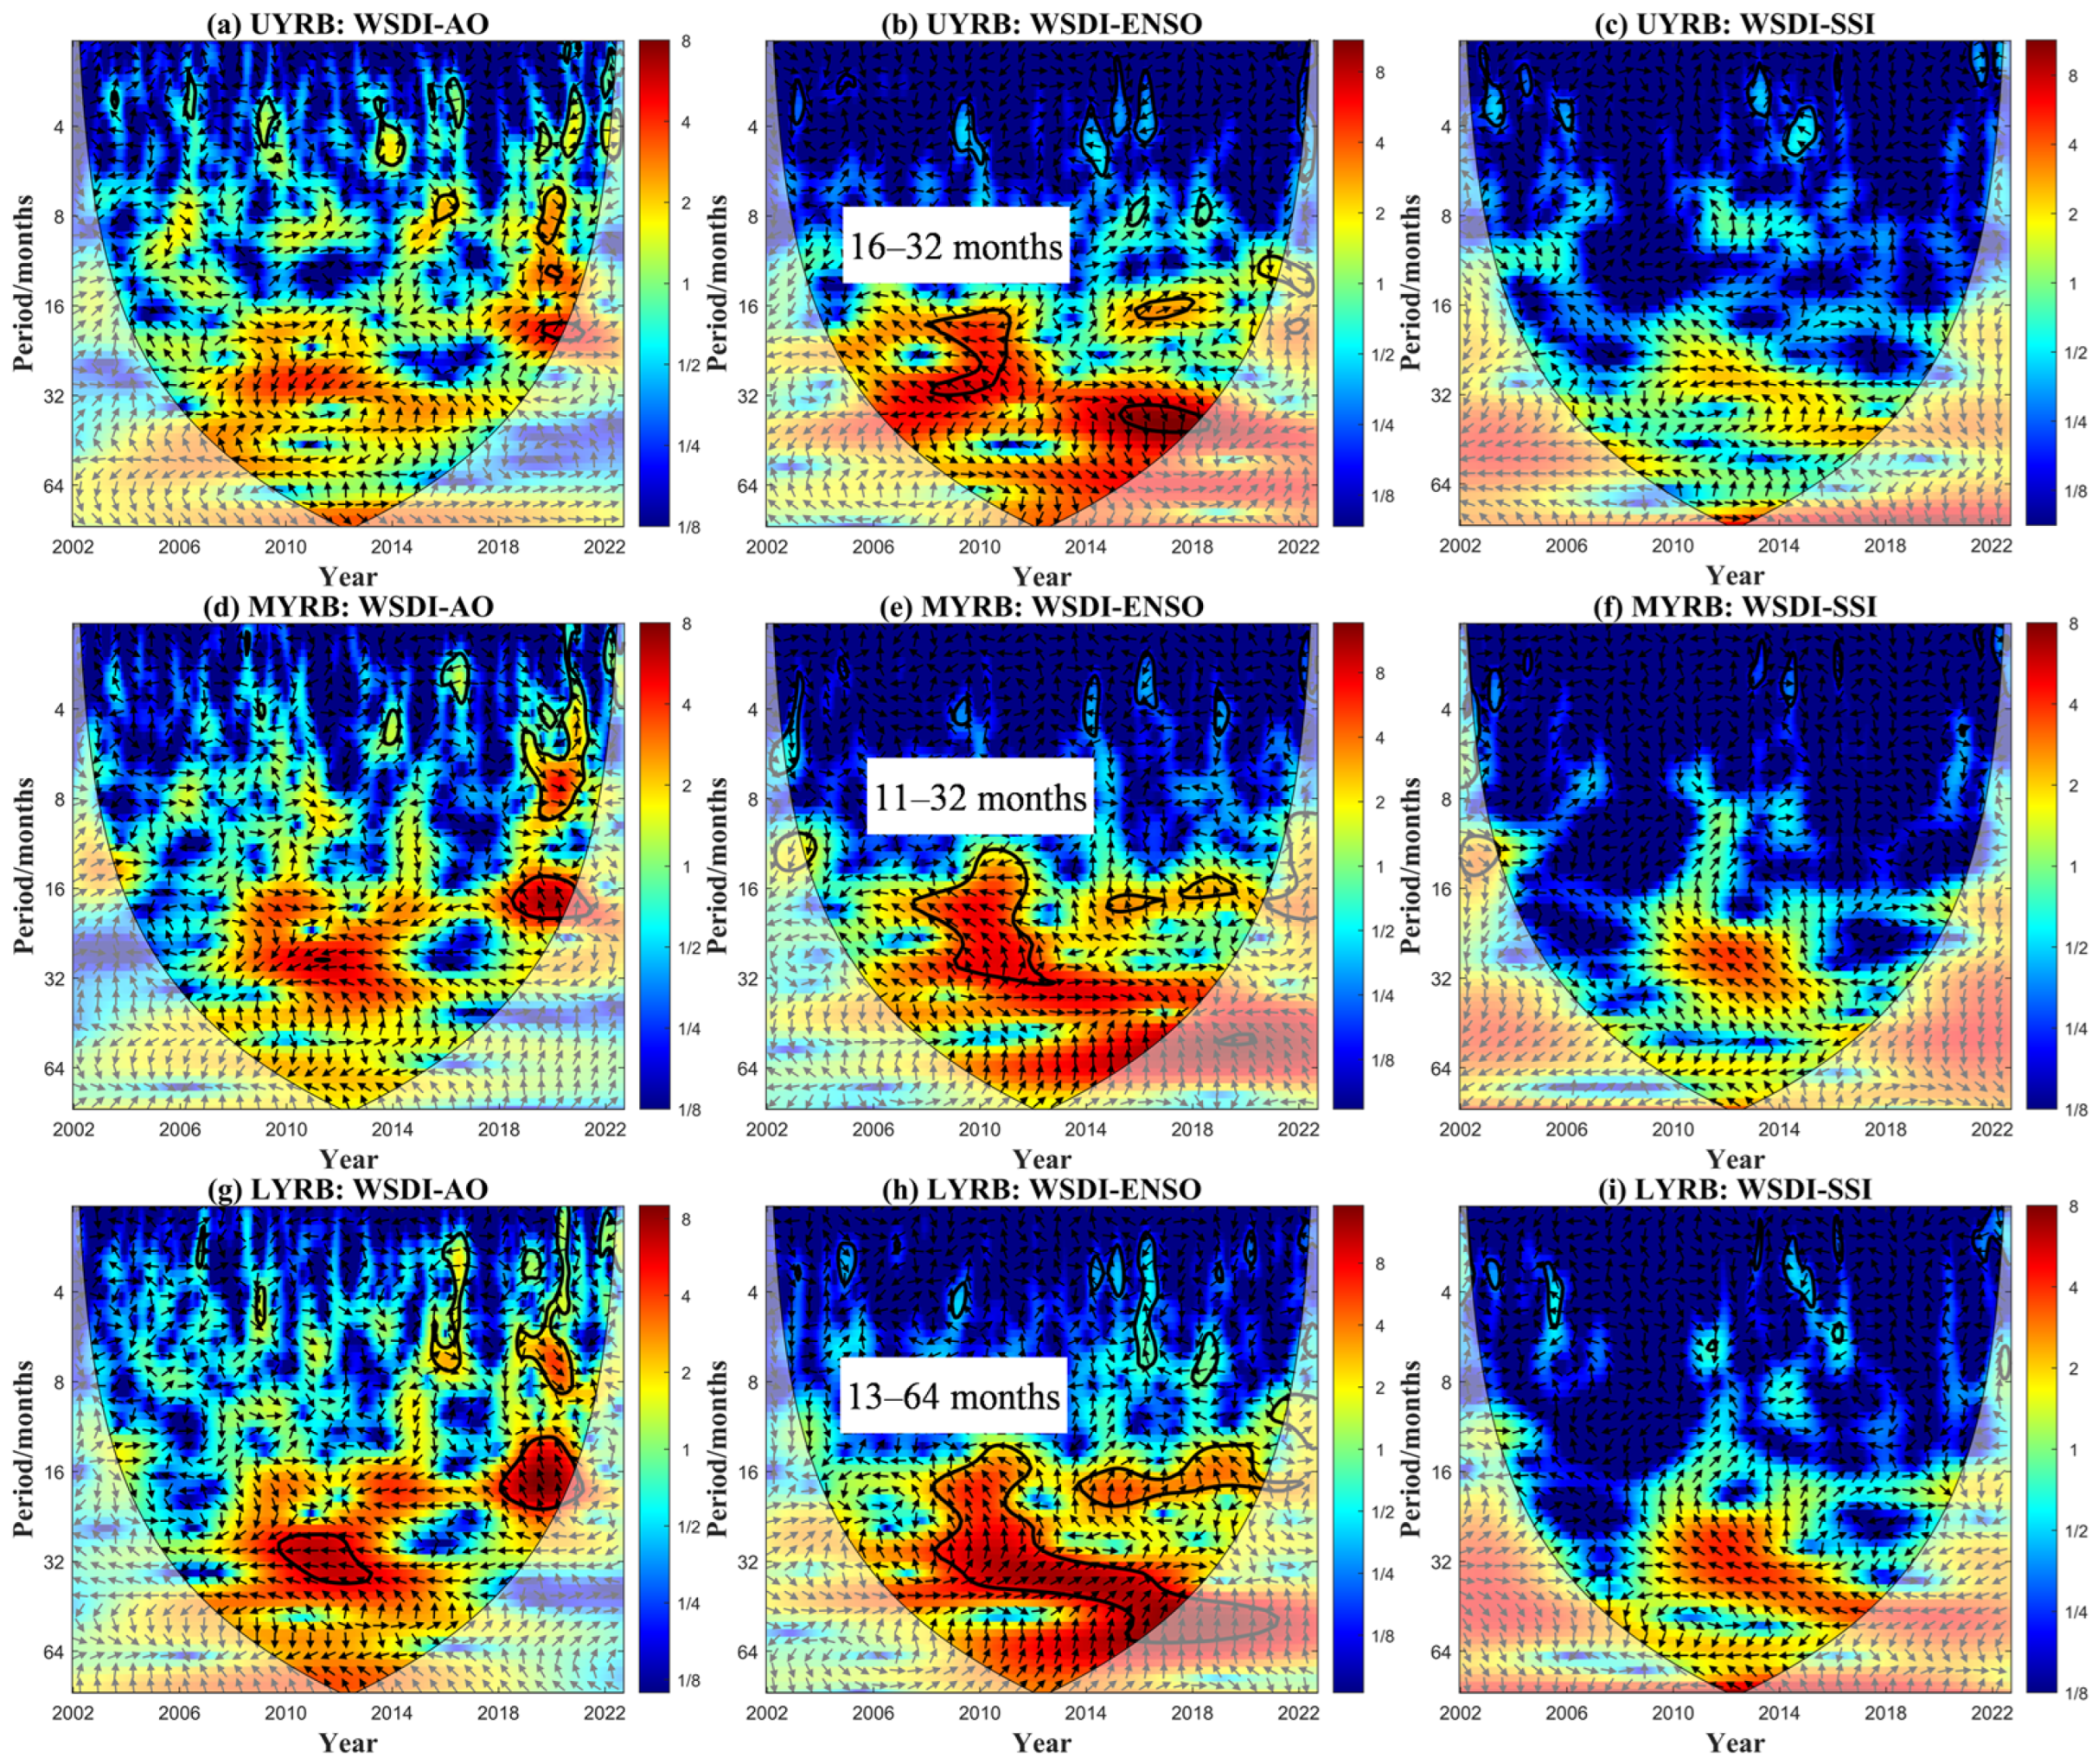
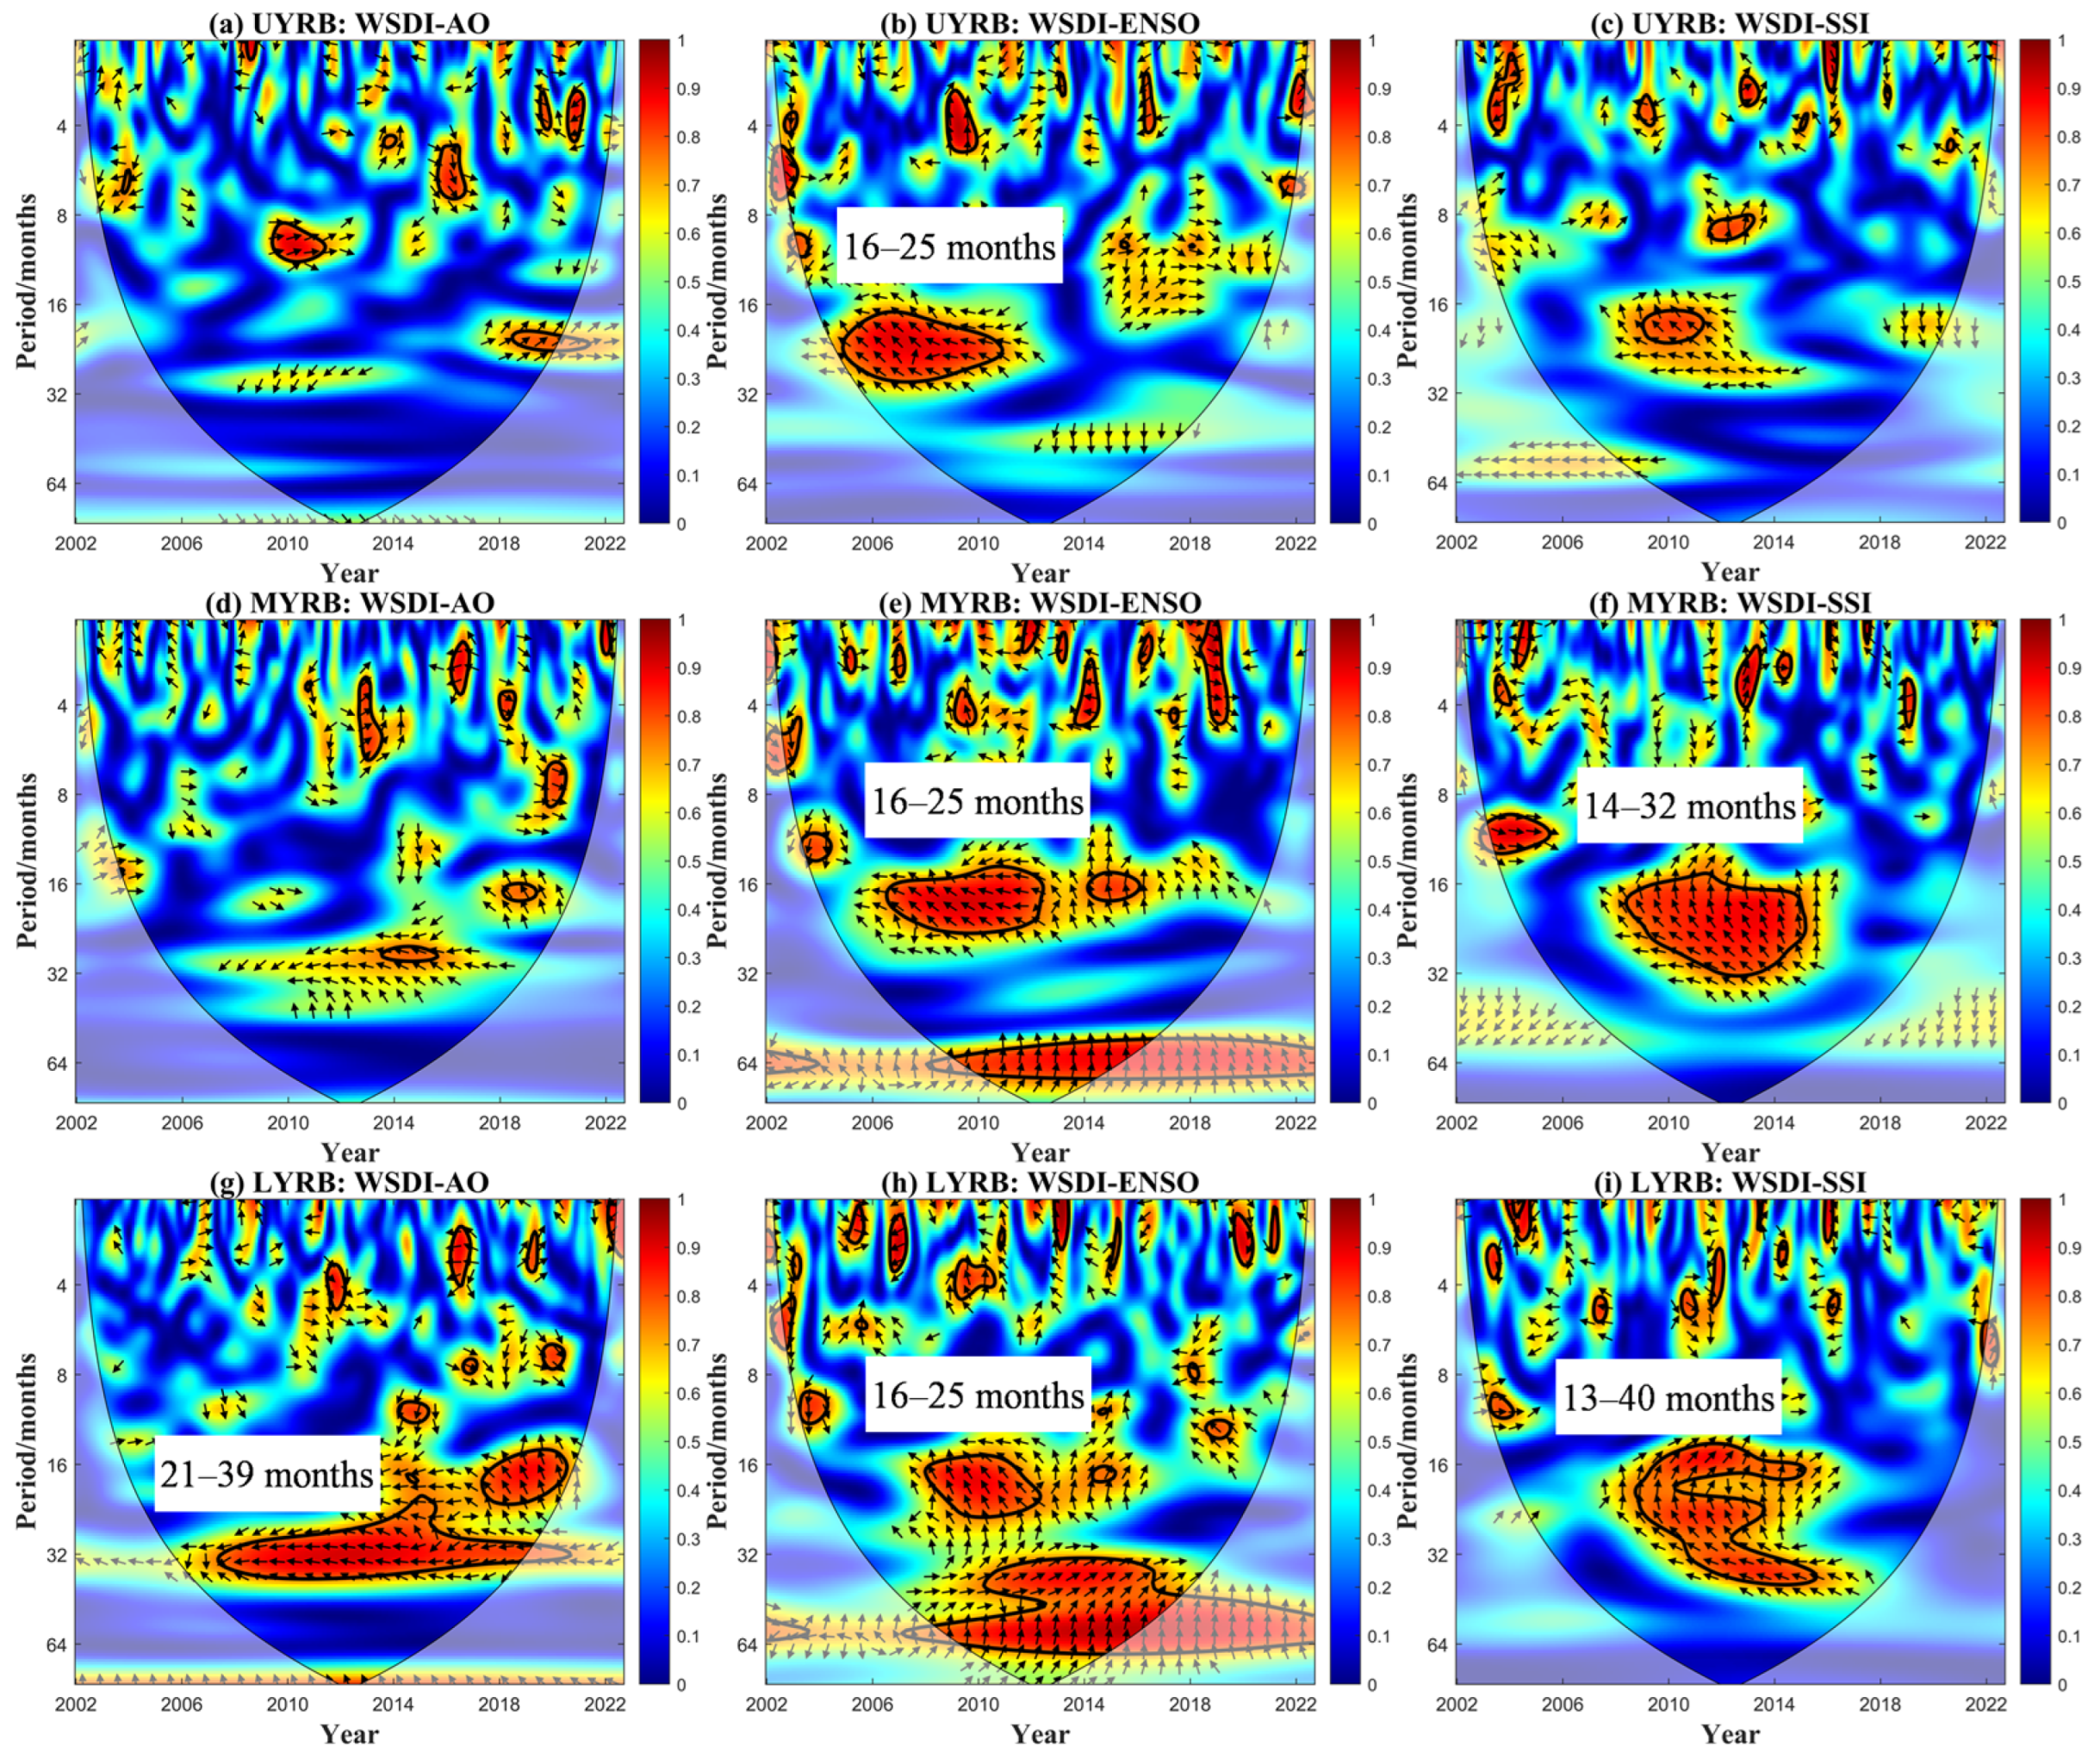
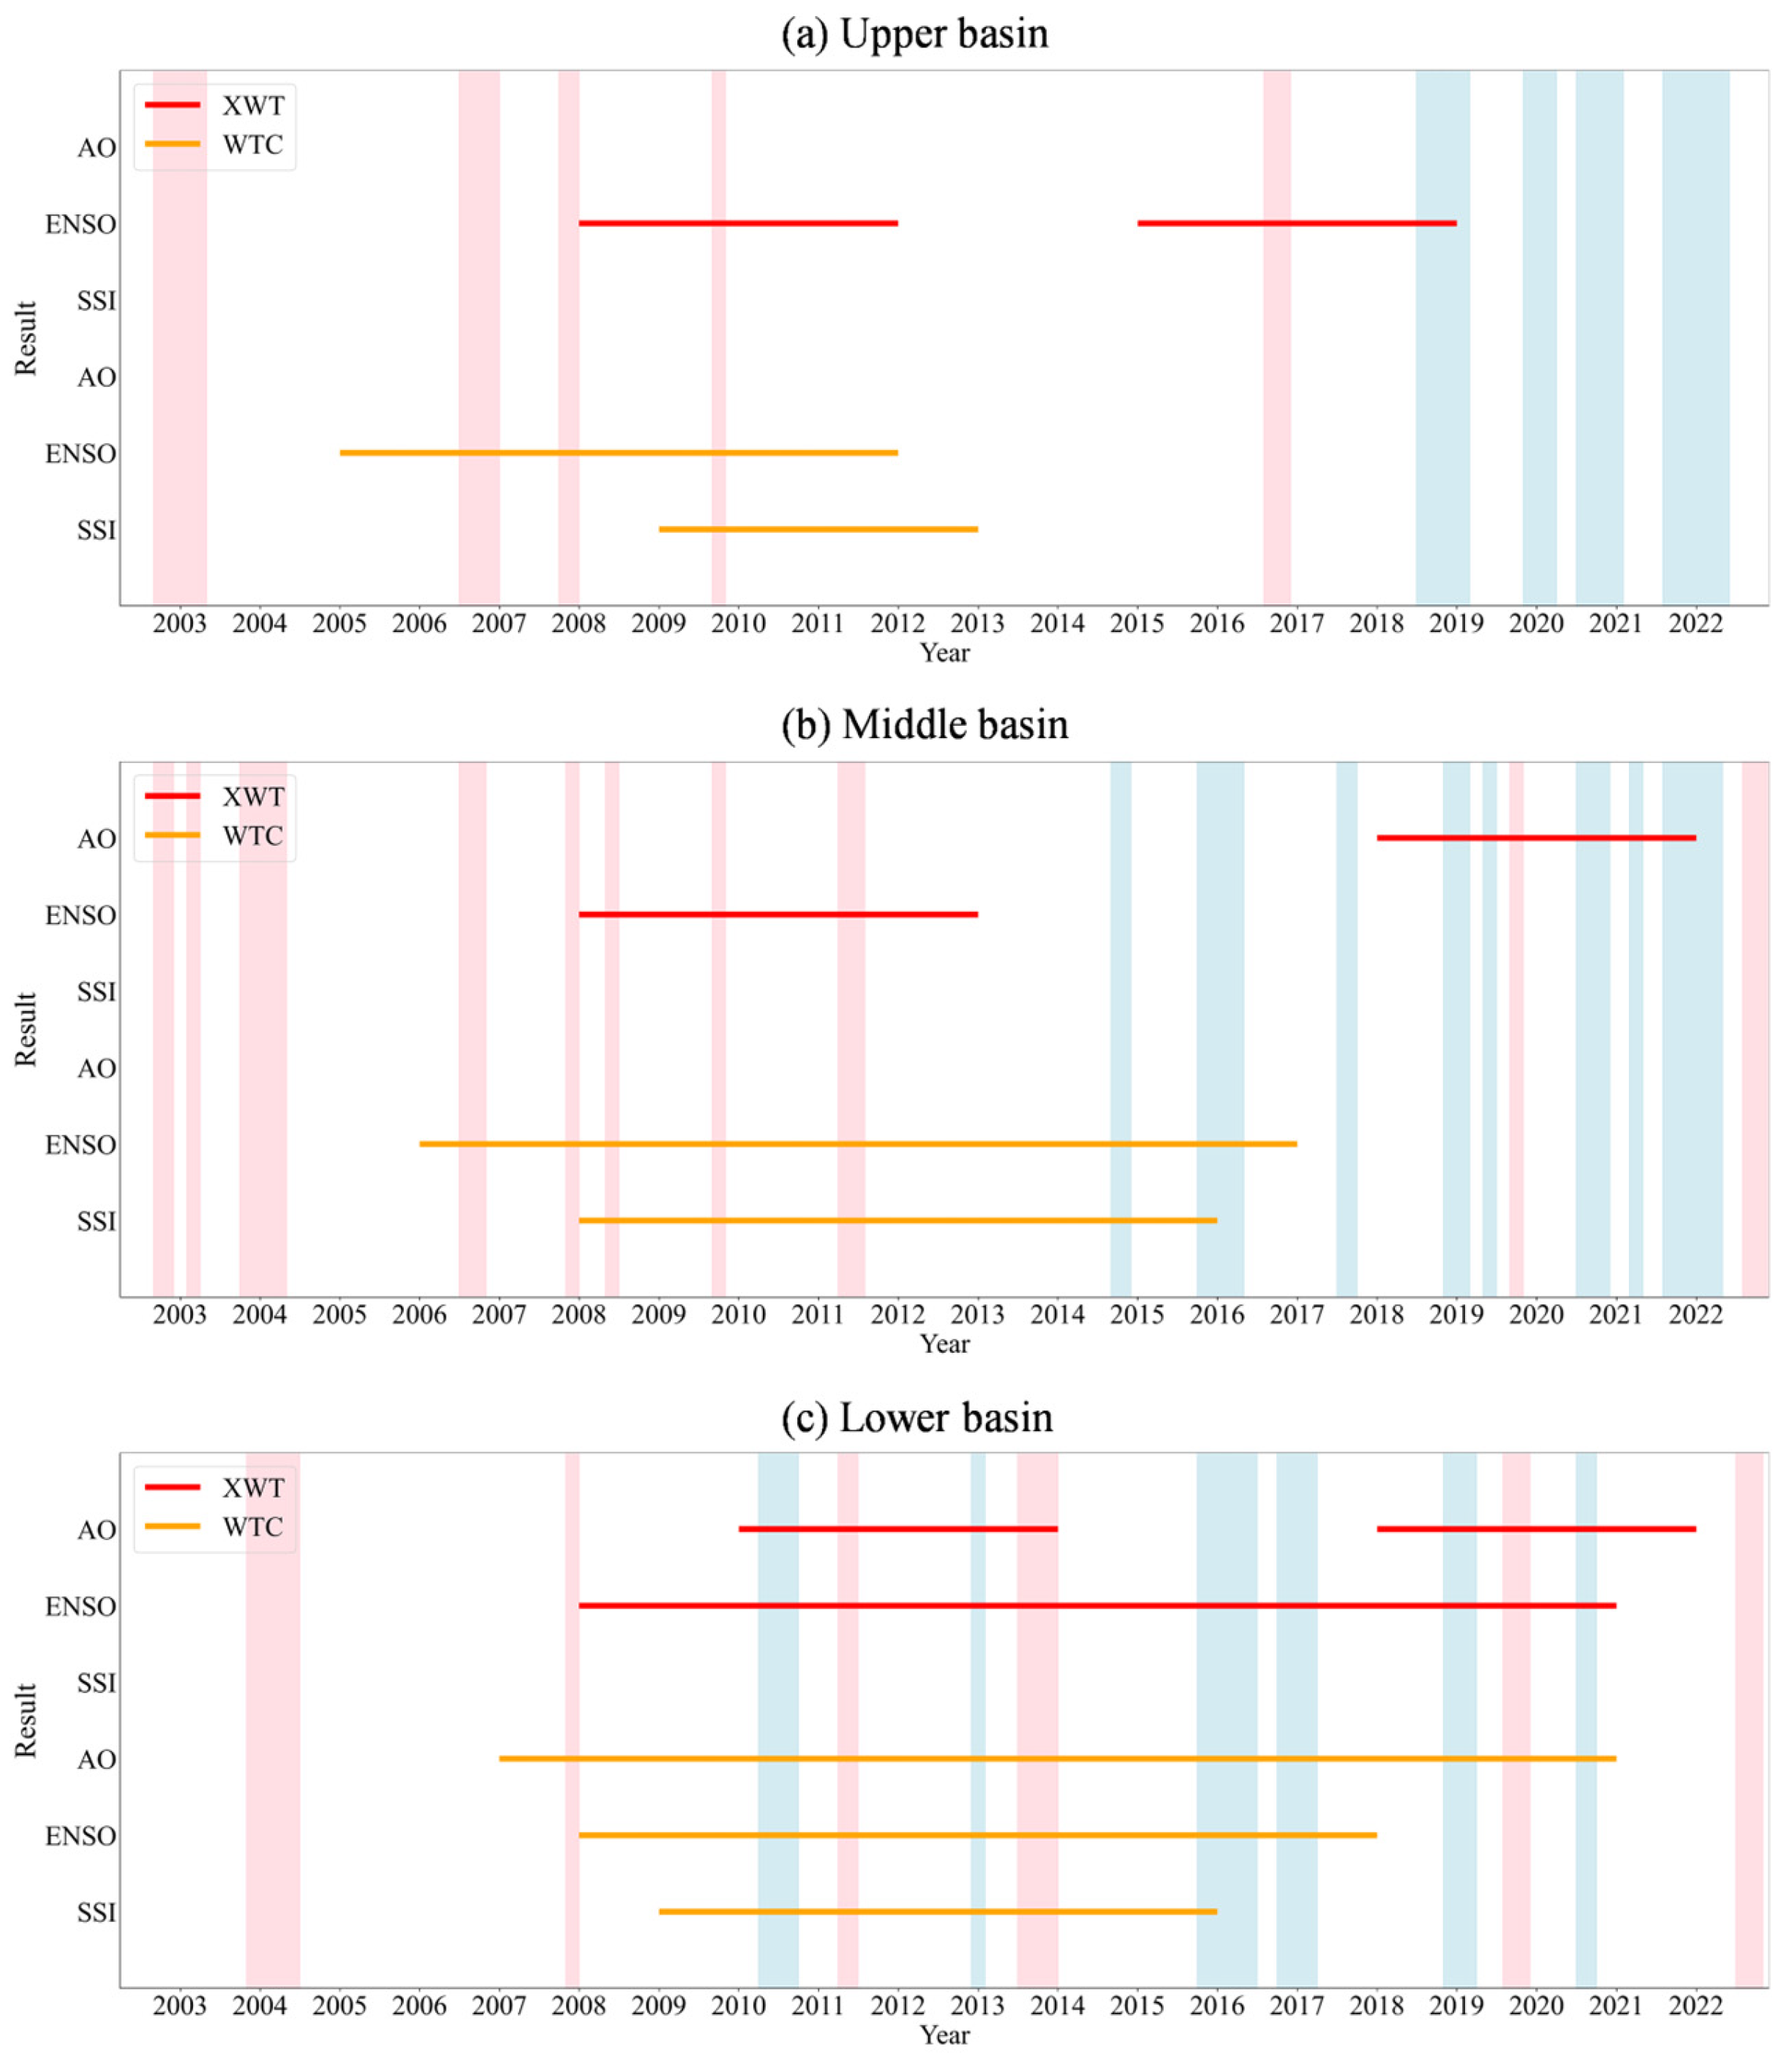
4.4. Dynamic Response of WSDI and Teleconnection Factors

AO, ENSO, and SSI data were employed to reveal the relationship between atmospheric changes and floods and droughts from a long-time-series perspective. The cross-wavelet power spectra of WSDI and different teleconnection factors in the three sub-basins are shown in Figure 12. In the figure, the thin solid line represents the boundary of the cone of influence, the area of valid spectral values is inside the thin solid line, and the range surrounded by the thick solid line represents the signal passing the 95% confidence interval test. Arrows to the left represent negative correlations, arrows to the right represent positive correlations, and the angle of the arrows represent leading or lagging relationships. As can be seen in Figure 12a–c, the teleconnection factors had relatively small influence on the UYRB. Only some intermittent resonance periods showed the correlation between AO and WSDI. There were only two small resonance periods between ENSO and WSDI, the negative correlation signal from 2008 to 2011 and the positive correlation signal from 2015 to 2018, indicating that ENSO had a slight impact on the TWS changes in the UYRB. The response patterns of the MYRB and LYRB to AO and ENSO were relatively consistent and very significant. Similar resonance cycles emerged between WSDI and AO in the MYRB and LYRB from 2018 to 2021 (Figure 12d,g). Compared to AO, ENSO was a significant factor influencing the water storage in the middle and lower reaches (Figure 12e,h). The two basins had similar resonance periods during 2008–2012. However, the resonance period in the LYRB was extended to 2018, and the signal was expanded to 64 months, suggesting that TWS in the LYRB was more susceptible to ENSO.
WTC was utilized to explore the dynamic response relationship between WSDI and teleconnection factors in the low-energy region. The wavelet coherence between WSDI and each teleconnection factor of the three sub-basins based on the WTC method is shown in Figure 13. ENSO continued to have a significant impact on the three sub-basins, with similar signals in the range of about 16–25 months in the three sub-basins (Figure 13b,e,h), as well as signals in the middle and lower reaches that were heavily influenced by boundary effects. It is worth noting that the SSI also showed a significant influence on water storage dynamics in the three sub-basins, with similar intermittent resonance cycles occurring during the study period. However, the MYRB and LYRB were more strongly affected by the SSI, with larger resonance cycles occurring between 2008 and 2015, with signals ranging from 14 to 32 months and 13 to 40 months, respectively (Figure 13f,i). In summary, cross wavelet transform and wavelet coherence could effectively reveal the relationship between climate factors and droughts and floods from the perspective of the time–frequency domain. The teleconnection factors and WSDI showed statistically significant correlations, suggesting that teleconnection factors played key roles in the evolution of droughts and floods in the YRB. In particular, ENSO was the most important factor in influencing droughts and floods in the sub-basins, especially in the LYRB.
To explore the relationship between teleconnection factors and drought and flood events, we jointly counted the drought and flood events identified by WSDI (Table 3) and their resonance period years with different teleconnection factors, as shown in Figure 14. The frequency of teleconnection factors influencing the three sub-basins increased from upstream to downstream. Many drought and flood events in the LYRB from 2007 to 2021 were closely related to the three factors, especially the summer flood of 2010, the spring drought of 2011, the flood of 2013, and the autumn drought of 2014, which were caused by the joint action of AO, ENSO, and SSI (Figure 14c). ENSO and AO mainly dominated the extreme flood of the whole basin in 2020. These results show that the development of drought and flood events is closely related to large-scale atmospheric circulation, and the LYRB is more susceptible to atmospheric changes than the UYRB.

5. Discussion

5.1. Advantages of WSDI for Recognizing Drought and Flood Events

Droughts and floods are the result of the synergistic effects of many factors, such as precipitation, evapotranspiration, runoff, and human activities. The performance of WSDI in identifying drought events and flood events in the YRB was relatively similar, with 90.5% and 92.8% identification rates for the number of documented events, and with better accuracy compared to SPEI and scPDSI (Figure 7). This is due to the fact that SPEI and scPDSI rely only on a few variables. In contrast, WSDI is calculated based on physical observations of terrestrial water storage from GRACE/GFO satellite and encompasses integrated changes in multiple hydrologic elements such as surface water, soil water, and groundwater in the basin (Figure 4), which can reflect the integrated wet and dry conditions in the basin, including meteorological droughts, agricultural droughts, and hydrological droughts [86], and thus more comprehensively portray the complex characteristics of drought and flood events. In addition, groundwater is an important buffer resource for regulating droughts and floods [87], and its variability has a significant impact on the duration and intensity of drought and flood events. WSDI has outstanding performance in reflecting deep water storage [67], which makes up for the shortcomings of traditional indices in characterizing groundwater dynamics, and is able to more realistically and accurately characterize the spatial and temporal evolution patterns of drought and flood events and their driving mechanisms.

5.2. Analysis of Influencing Factors of Droughts and Floods

The spread and frequency of droughts and floods, accelerated by climate change and human activities in recent years, will have devastating socioeconomic impacts [88]. Therefore, it is essential to analyze the factors affecting drought and flood for disaster prevention and reduction. Precipitation leads to the dynamic change in terrestrial water storage, so it is the direct driving factor of drought and flood disasters in the YRB [85]. ENSO was a significant climate factor influencing hydrological changes in the YRB (Figure 12 and Figure 13). The synergistic effect of the ENSO (El Niño) and IOD events in 2020 caused the western North Pacific Subtropical High to move westward and intensified the westerly jet over the YRB, resulting in the convergence of the lower tropospheric wind fields over the basin [89,90]. This further triggered abnormally excessive precipitation in the basin, which directly led to the occurrence of historical extreme flood disasters (Figure 8). This year, the precipitation in the YRB reached the maximum value (1567.09 mm) and GRACE/GFO also reached the maximum value of 73.73 cm (Figure 4). However, for drought, in addition to the influence of precipitation, temperature is also one of the important reasons. As shown in Figure 9, the most extreme drought in the MYRB and LYRB was in 2022. This extreme drought was influenced by the compounding effect of low rainfall and high temperatures. The ENSO (La Nina) event was conducive to the continuous abnormal strength and westward extension of the western Pacific subtropical high through ocean–atmosphere interactions, leading to the formation of a large-scale warm high belt over the YRB, resulting in persistent low rainfall [37]. The annual precipitation was reduced by 10.3% compared to the multi-year average, with precipitation reduced by more than 20% in many water resources secondary zones in the MYRB and LYRB. The extreme anomalous high pressure also caused the YRB to be controlled by the downdrafts, with persistently clear skies and few clouds, and the heating of the near-surface by solar radiation and the retention of hot air led to a significant increase in near-surface temperatures, triggering frequent high-temperature weather [91]. The average temperatures of the entire basin reached the historical maximum values successively in July and August, which were 22.0 °C and 22.8 °C, respectively (Figure 4). Under the dual impact of persistent high temperatures and sharply reduced precipitation, the middle and lower reaches of the WSDI hit record lows, falling to −1.53 and −2.77, respectively (Table 3). The role of teleconnection factors in droughts and floods cannot be ignored. Previous studies have pointed out that teleconnection factors, such as ENSO and AO, play an important role in regulating water storage changes around the world [47,48,49,50]. Ocean–atmosphere interactions lead to the El Niño Southern Oscillation (ENSO), which can be recognized as warm (El Niño), cold (La Niña), and neutral events based on Pacific sea surface temperature anomalies [92,93,94]. On this basis, this study further explored the influence of these large-scale climate models on the hydrological processes in the YRB and found that the hydrological events in the basin were closely related to climate factors. ENSO events of different modes have differentiated impacts on precipitation patterns and the distribution of droughts and floods in the YRB by altering atmospheric circulation and water vapor transport. The UYRB is situated in the interior of China and is surrounded by high plateaus and mountain ranges that act as natural barriers to the transport of water vapor, reducing the impact of ENSO on the region. In contrast, the LYRB lies within the core area of the East Asian monsoon region, characterized by low and flat terrain that enables anomalous atmospheric circulation to directly modulate water vapor flux, triggering extreme hydrological events such as droughts and floods. As a key factor, the frequency and intensity of ENSO are increasing due to global warming [95], which will lead to more frequent and severe droughts and floods in the YRB, posing a serious challenge to regional water resources management.
In addition to natural factors, human factors are also important in influencing droughts and floods in the YRB. The YRB is a densely populated area in China, and excessive use of water for agricultural irrigation, industry, and domestic uses will lead to a drastic reduction in water resources, which will accelerate the occurrence of drought [45]. In addition, the construction of reservoirs can cause an increase in water storage and change the distribution of droughts and floods [85]. According to CWRC, from 2003 to 2022, the number of large and medium-sized water storage reservoirs in the YRB increased from 1144 to 1843. Among them, the number of large reservoirs increased from 146 to 293, and the number of medium-sized reservoirs increased from 998 to 1550. The number of reservoirs was significantly positively correlated with WSDI ( r = 0.70 ,   p < 0.05). The MYRB and LYRB have shown a wetting trend in recent years due to increased water storage (Figure 10), which is closely related to the distribution of highly concentrated reservoirs [96]. There are many reservoirs in the MYRB and LYRB (Figure 1). The construction of reservoirs and the storage of water in these reservoirs lead to an increase in surface water storage, which is an important factor contributing to the increase in water storage in this region [85,97,98]. On the other hand, water conservancy facilities regulate the distribution of water resources through the mechanism of storage and release of water, which can alleviate the frequency and intensity of extreme drought and flood disasters to some extent [99]. In conclusion, droughts and floods are subject to multiple influences from nature and human activities, and the relevant departments should take all factors into account in order to formulate scientific water resources management policies.

5.3. Limitations and Prospects

Although drought and flood studies based on GRACE/GFO have achieved promising results in the YRB, there are still some limitations. Firstly, this study used cubic spline interpolation to compensate for missing data from GRACE/GFO satellites, except for mission intervals, which was an efficient and simple method and has been widely used [100,101]. The significant ( p < 0.05) correlation of GRACE/GFO-TWSA with the other two TWSAs also indicated that the results were reliable. However, there was still some uncertainty about the error when two consecutive months of data were missing, with an average RMSE of 1.65 cm. While this may affect the identification of certain short-term events, when performing long-term series analysis, the impact of interpolation accuracy on the analysis of regional water storage trends can generally be disregarded [102]. Future research will explore machine-learning-based missing data filling solutions to decompose TWSA time-series features to capture the changing patterns of the data and obtain more accurate and consistent data. Secondly, 20 years of GRACE/GFO data limit teleconnection factors analysis in the low-energy region. Due to the short duration of the time series, the dry conditions before 2011 and wet conditions after 2014 were severely affected by boundary effects, which prevented the capture of their resonance period. In the future, the focus will be on analyzing the long-term time series of GRACE/GFO data, integrating paleoclimate data and historical records to more comprehensively reveal the characteristics of hydrological changes and their driving mechanisms. Finally, this study focused mainly on the YRB. Due to the different geographical, climatic, and hydrological conditions of different basins, the direct applicability of the research conclusions in other basins may be limited. Future study will select multiple research regions and conduct comparative analyses with more traditional indices to explore the universality of the application of this method in different regions.

6. Conclusions

In this study, we constructed the WSDI based on GRACE/GFO satellite TWSA data. At the sub-basin scale, the WSDI was extended to bidirectional monitoring of droughts and floods, and its reliability in the YRB was verified in conjunction with documented events. Then, we analyzed the spatial and temporal evolution characteristics of WSDI and discussed its relationship with teleconnection factors to reveal the heterogeneity of climate response. The main conclusions are as follows. (1) Compared with SPEI and scPDSI, WSDI showed higher reliability in identifying drought and flood events and successfully captured many typical drought and flood disaster events in the YRB. From 2002 to 2022, WSDI identified 21 drought events and 18 flood events in the 3 sub-basins. The UYRB had the fewest drought and flood events, but the average duration of these events was the longest, and the peak value of floods was also the highest. (2) WSDI in most areas of the YRB showed an increasing trend on the monthly and seasonal scale, especially in the central region and the source region. WSDI increased significantly in February and winter, with significant increases of 62.3% and 68.9%, respectively. In the 12 months, the change rate of WSDI was the highest in November, which was 0.07/year. (3) The influence of teleconnection factors on droughts and floods was significant, and the influence intensity showed spatial differentiation, gradually increasing from upstream to downstream. In particular, ENSO, as a key driver, played an important role in drought and flood changes in the YRB. This study demonstrated the reliability of WSDI in capturing drought and flood events and revealed the dynamics of drought and flood evolution in the Yangtze River sub-basins and their response relationship with key climate factors. In doing so, this study provides new scientific bases for flood and drought policies in the YRB; sub-basin-specific early warning systems for droughts and floods in the LYRB should prioritize the integration of ENSO forecasting, while in the central YRB, flood risks can be mitigated by optimizing reservoir management strategies. It also provides a reference for GRACE/GFO-based droughts and floods studies in other basins.

Author Contributions

Conceptualization, R.R. and X.S.; methodology, R.R.; software, R.R.; validation, X.S.; formal analysis, R.R.; data curation, R.R. and X.S.; writing—original draft preparation, R.R. and X.S.; writing—review and editing, R.R., Z.D., T.N., V.R. and X.S.; visualization, R.R.; supervision, X.S. All authors have read and agreed to the published version of the manuscript.

Funding

This research was partly supported by the National Key Research and Development Program of China (No. 2023YFF0804304 and 2020YFC1807103) and Global Strategy Fund of Osaka Metropolitan University, Japan. In addition, Z.D. is grateful to have received funding from the Crafoord Foundation (No. 20200595 and No. 20210552).

Data Availability Statement

The data presented in this study are available on request from the corresponding author.

Conflicts of Interest

The authors declare no conflicts of interest.

References

  1. Frich, P.; Alexander, L.V.; Della-Marta, P.; Gleason, B.; Haylock, M.; Tank, A.M.G.K.; Peterson, T. Observed coherent changes in climatic extremes during the second half of the twentieth century. Clim. Res. 2002, 19, 193–212. [Google Scholar] [CrossRef]
  2. Barredo, J.I. Major flood disasters in Europe: 1950–2005. Nat. Hazards 2007, 42, 125–148. [Google Scholar] [CrossRef]
  3. Mishra, A.K.; Singh, V.P. A review of drought concepts. J. Hydrol. 2010, 391, 202–216. [Google Scholar] [CrossRef]
  4. Van Loon, A.F. Hydrological drought explained. WIREs Water 2015, 2, 359–392. [Google Scholar] [CrossRef]
  5. Wu, J.; Chen, X.; Lu, J. Assessment of long and short-term flood risk using the multi-criteria analysis model with the AHP-Entropy method in Poyang Lake basin. Int. J. Disaster Risk Reduct. 2022, 75, 102968. [Google Scholar] [CrossRef]
  6. Tellman, B.; Sullivan, J.A.; Kuhn, C.; Kettner, A.J.; Doyle, C.S.; Brakenridge, G.R.; Erickson, T.A.; Slayback, D.A. Satellite imaging reveals increased proportion of population exposed to floods. Nature 2021, 596, 80–86. [Google Scholar] [CrossRef]
  7. Wang, H.; Wang, S.; Shu, X.; He, Y.; Huang, J. Increasing Occurrence of Sudden Turns From Drought to Flood Over China. J. Geophys. Res. Atmos. 2024, 129, e2023JD039974. [Google Scholar] [CrossRef]
  8. Rodell, M.; Li, B. Changing intensity of hydroclimatic extreme events revealed by GRACE and GRACE-FO. Nat. Water 2023, 1, 241–248. [Google Scholar] [CrossRef]
  9. Jin, W.; Qi-hua, R.A.N.; Lin, L.I.U.; Hai-long, P.A.N.; Sheng, Y.E. Research on the Dominant Mechanism of Extreme Flow Events in the Middle and Lower Reaches of the Yangtze River. China Rural Water Hydropower 2022, 6, 119–124. [Google Scholar]
  10. Yang, P.; Xia, J.; Luo, X.; Meng, L.; Zhang, S.; Cai, W.; Wang, W. Impacts of climate change-related flood events in the Yangtze River Basin based on multi-source data. Atmos. Res. 2021, 263, 105819. [Google Scholar] [CrossRef]
  11. McKee, T.B.; Doesken, N.J.; Kleist, J. The relationship of drought frequency and duration to time scales. In Proceedings of the 8th Conference on Applied Climatology, Anaheim, CA, USA, 17–22 January 1993; pp. 179–183. [Google Scholar]
  12. Shukla, S.; Wood, A.W. Use of a standardized runoff index for characterizing hydrologic drought. Geophys. Res. Lett. 2008, 35, L02405. [Google Scholar] [CrossRef]
  13. Beguería, S.; Vicente-Serrano, S.M.; Angulo-Martínez, M. A Multiscalar Global Drought Dataset: The SPEIbase: A New Gridded Product for the Analysis of Drought Variability and Impacts. Bull. Am. Meteorol. Soc. 2010, 91, 1351–1356. [Google Scholar] [CrossRef]
  14. Nigatu, Z.M.; Fan, D.; You, W.; Melesse, A.M. Hydroclimatic Extremes Evaluation Using GRACE/GRACE-FO and Multidecadal Climatic Variables over the Nile River Basin. Remote Sens. 2021, 13, 651. [Google Scholar] [CrossRef]
  15. Wang, J.; Chen, Y.; Wang, Z.; Shang, P. Drought evaluation over Yangtze River basin based on weighted water storage deficit. J. Hydrol. 2020, 591, 125283. [Google Scholar] [CrossRef]
  16. Cai, J.; Zhang, Y.; Li, Y.; Liang, X.; Jiang, T. Analyzing the Characteristics of Soil Moisture Using GLDAS Data: A Case Study in Eastern China. Appl. Sci. 2017, 7, 566. [Google Scholar] [CrossRef]
  17. Yi, H.; Wen, L. Satellite gravity measurement monitoring terrestrial water storage change and drought in the continental United States. Sci. Rep. 2016, 6, 19909. [Google Scholar] [CrossRef]
  18. Huang, S.; Zhang, H.; Liu, Y.; Liu, W.; Wei, F.; Yang, C.; Ding, F.; Ye, J.; Nie, H.; Du, Y.; et al. Assessment of Hydrological and Meteorological Composite Drought Characteristics Based on Baseflow and Precipitation. Water 2024, 16, 1466. [Google Scholar] [CrossRef]
  19. Li, Z.; Shen, H.; Weng, Q.; Zhang, Y.; Dou, P.; Zhang, L. Cloud and cloud shadow detection for optical satellite imagery: Features, algorithms, validation, and prospects. ISPRS J. Photogramm. Remote Sens. 2022, 188, 89–108. [Google Scholar] [CrossRef]
  20. Ramillien, G.; Famiglietti, J.S.; Wahr, J. Detection of Continental Hydrology and Glaciology Signals from GRACE: A Review. Surv. Geophys. 2008, 29, 361–374. [Google Scholar] [CrossRef]
  21. Zhang, L.; Shen, Y.; Chen, Q.; Wang, F. Influence factors and mechanisms of 2015–2016 extreme flood in Pearl River Basin based on the WSDI from GRACE. J. Hydrol. Reg. Stud. 2023, 47, 101376. [Google Scholar] [CrossRef]
  22. Liu, S.; Wu, Y.; Xu, G.; Xiao, C.; Wu, X.; Zhong, Y. Revealing the spatiotemporal evolution of the 2024 extreme flood in Guangdong Province: Insights from GRACE-FO and in situ measurements. J. Hydrol. Reg. Stud. 2025, 59, 102451. [Google Scholar] [CrossRef]
  23. Cui, L.; Yu, L.; Bo, Z.; Jiachuan, A.; Jiacheng, M.; Haoyang, G.; Xu, C. Assessing the impact of 2022 extreme drought on the Yangtze River basin using downscaled GRACE/GRACE-FO data obtained by partitioned random forest algorithm. Int. J. Remote Sens. 2025, 46, 1219–1247. [Google Scholar] [CrossRef]
  24. Uz, M.; Akyilmaz, O.; Shum, C.K. Deep learning-aided temporal downscaling of GRACE-derived terrestrial water storage anomalies across the Contiguous United States. J. Hydrol. 2024, 645, 132194. [Google Scholar] [CrossRef]
  25. Xiao, C.; Zhong, Y.; Wu, Y.; Bai, H.; Li, W.; Wu, D.; Wang, C.; Tian, B. Applying Reconstructed Daily Water Storage and Modified Wetness Index to Flood Monitoring: A Case Study in the Yangtze River Basin. Remote Sens. 2023, 15, 3192. [Google Scholar] [CrossRef]
  26. Yin, J.; Wei, J.; Li, Q.; Ayantobo, O.O. Regional Characteristics and Impact Factors of Change in Terrestrial Water Storage in Northwestern China From 2002 to 2020. IEEE J. Sel. Top. Appl. Earth Obs. Remote Sens. 2023, 16, 386–398. [Google Scholar] [CrossRef]
  27. Ren, J.; Xu, M.; Kang, S.; Han, H.; Li, X.; Hou, Z. Comprehensive understanding of hydrological drought based on GRACE data at multiple spatiotemporal scales in Northwest China. Nat. Hazards 2025, 121, 2465–2481. [Google Scholar] [CrossRef]
  28. Luo, X.; Wu, T.; Lu, L.; Chao, N.; Liu, Z.; Peng, Y. Using Geodetic Data to Monitor Hydrological Drought at Different Spatial Scales: A Case Study of Brazil and the Amazon Basin. Remote Sens. 2025, 17, 1670. [Google Scholar] [CrossRef]
  29. Yang, S.; Zhong, Y.; Wu, Y.; Yang, K.; An, Q.; Bai, H.; Liu, S. Quantifying long-term drought in China’s exorheic basins using a novel daily GRACE reconstructed TWSA index. J. Hydrol. 2025, 655, 132919. [Google Scholar] [CrossRef]
  30. Terwayet Bayouli, O.; Zhang, W.; Terwayet Bayouli, H.; Zhang, Z.; Ma, Q. Grace-based assessment of hydrometeorological droughts and their Possible teleconnection Mechanisms using wavelet based quantitative approach. Int. J. Appl. Earth Obs. Geoinf. 2025, 137, 104410. [Google Scholar] [CrossRef]
  31. Zheng, W.; Askari, K.; Song, C.; Shi, P.; Ge, W.; Shi, S.; Chu, J.; Chen, H.; Wang, F. Increasing vulnerability of vegetation to Meteorological and Groundwater drought: A Case study in Argentina. J. Hydrol. Reg. Stud. 2024, 55, 101931. [Google Scholar] [CrossRef]
  32. Wu, S.; Dong, Z.; Cai, C.; Zhu, S.; Shao, Y.; Meng, J.; Amponsah, G.E. Identification of Extreme Droughts Based on a Coupled Hydrometeorology Index from GRACE-Derived TWSA and Precipitation in the Yellow River and Yangtze River Basins. Water 2023, 15, 1990. [Google Scholar] [CrossRef]
  33. Liu, J.; Zhu, G.; Zhao, K.; Jiao, Y.; Liu, Y.; Yang, M.; Zhang, W.; Qiu, D.; Lin, X.; Ye, L. GRACE Combined with WSD to Assess the Change in Drought Severity in Arid Asia. Remote Sens. 2022, 14, 3454. [Google Scholar] [CrossRef]
  34. Topçu, E. Drought Characterization Using the Grace Terrestrial Water Storage Deficit in Turkey. J. Indian Soc. Remote Sens. 2024, 52, 1003–1018. [Google Scholar] [CrossRef]
  35. Getahun, Y.S.; Li, M.-H.; Chen, Y.-Y.; Yate, T.A. Drought characterization and severity analysis using GRACE-TWS and MODIS datasets: A case study from the Awash River Basin (ARB), Ethiopia. J. Water Clim. Chang. 2023, 14, 516–542. [Google Scholar] [CrossRef]
  36. Ali, S.; Khorrami, B.; Jehanzaib, M.; Tariq, A.; Ajmal, M.; Arshad, A.; Shafeeque, M.; Dilawar, A.; Basit, I.; Zhang, L.; et al. Spatial Downscaling of GRACE Data Based on XGBoost Model for Improved Understanding of Hydrological Droughts in the Indus Basin Irrigation System (IBIS). Remote Sens. 2023, 15, 873. [Google Scholar] [CrossRef]
  37. Xu, G.; Wu, Y.; Liu, S.; Cheng, S.; Zhang, Y.; Pan, Y.; Wang, L.; Dokuchits, E.Y.; Nkwazema, O.C. How 2022 extreme drought influences the spatiotemporal variations of terrestrial water storage in the Yangtze River Catchment: Insights from GRACE-based drought severity index and in-situ measurements. J. Hydrol. 2023, 626, 130245. [Google Scholar] [CrossRef]
  38. Zhong, Y.; Hu, E.; Wu, Y.; An, Q.; Wang, C.; Bai, H.; Gao, W. Reconstructing a long-term water storage-based drought index in the Yangtze River Basin. Sci. Total Environ. 2023, 883, 163403. [Google Scholar] [CrossRef]
  39. Hao, H.; Yang, M.; Wang, H.; Dong, N. Human activities reshape the drought regime in the Yangtze River Basin: A land surface-hydrological modelling analysis with representations of dam operation and human water use. Nat. Hazards 2023, 118, 2097–2121. [Google Scholar] [CrossRef]
  40. Feng, K.; Cao, Y.; Du, E.; Zhou, Z.; Zhang, Y. Spatiotemporal Dynamics of Drought and the Ecohydrological Response in Central Asia. Remote Sens. 2025, 17, 166. [Google Scholar] [CrossRef]
  41. Liu, X.; Feng, X.; Ciais, P.; Fu, B.; Hu, B.; Sun, Z. GRACE satellite-based drought index indicating increased impact of drought over major basins in China during 2002–2017. Agric. For. Meteorol. 2020, 291, 108057. [Google Scholar] [CrossRef]
  42. Wang, L.; Peng, Z.; Ma, X.; Zheng, Y.; Chen, C. Multiscale gravity measurements to characterize 2020 flood events and their spatio-temporal evolution in Yangtze river of China. J. Hydrol. 2021, 603, 127176. [Google Scholar] [CrossRef]
  43. Cui, A.; Li, J.; Zhou, Q.; Zhu, R.; Liu, H.; Wu, G.; Li, Q. Use of a multiscalar GRACE-based standardized terrestrial water storage index for assessing global hydrological droughts. J. Hydrol. 2021, 603, 126871. [Google Scholar] [CrossRef]
  44. Sun, A.Y.; Scanlon, B.R.; AghaKouchak, A.; Zhang, Z. Using GRACE Satellite Gravimetry for Assessing Large-Scale Hydrologic Extremes. Remote Sens. 2017, 9, 1287. [Google Scholar] [CrossRef]
  45. Wang, F.; Wang, Z.; Yang, H.; Di, D.; Zhao, Y.; Liang, Q. Utilizing GRACE-based groundwater drought index for drought characterization and teleconnection factors analysis in the North China Plain. J. Hydrol. 2020, 585, 124849. [Google Scholar] [CrossRef]
  46. Ma, W.; Zhou, H.; Dai, M.; Tang, L.; Xu, S.; Luo, Z. Characterizing the drought events in Yangtze River basin via the insight view of its sub-basins water storage variations. J. Hydrol. 2024, 633, 130995. [Google Scholar] [CrossRef]
  47. Ni, S.; Chen, J.; Wilson, C.R.; Li, J.; Hu, X.; Fu, R. Global Terrestrial Water Storage Changes and Connections to ENSO Events. Surv. Geophys. 2018, 39, 1–22. [Google Scholar] [CrossRef]
  48. Liu, X.; Feng, X.; Ciais, P.; Fu, B. Widespread decline in terrestrial water storage and its link to teleconnections across Asia and eastern Europe. Hydrol. Earth Syst. Sci. 2020, 24, 3663–3676. [Google Scholar] [CrossRef]
  49. Neves, M.C. Links Between Extremes in GRACE TWS and Climate Patterns Across Iberia. Water 2025, 17, 1108. [Google Scholar] [CrossRef]
  50. Scanlon, B.R.; Rateb, A.; Anyamba, A.; Kebede, S.; MacDonald, A.M.; Shamsudduha, M.; Small, J.; Sun, A.; Taylor, R.G.; Xie, H. Linkages between GRACE water storage, hydrologic extremes, and climate teleconnections in major African aquifers. Environ. Res. Lett. 2022, 17, 014046. [Google Scholar] [CrossRef]
  51. Zhi, R.; Wang, Q.; Feng, G.; Feng, A. Using moving North Pacific index to improve rainy season rainfall forecast over the Yangtze River basin by analog error correction. J. Meteorol. Res. 2015, 29, 627–638. [Google Scholar] [CrossRef]
  52. Wang, F.; Lai, H.; Li, Y.; Feng, K.; Tian, Q.; Guo, W.; Qu, Y.; Yang, H. Spatio-temporal evolution and teleconnection factor analysis of groundwater drought based on the GRACE mascon model in the Yellow River Basin. J. Hydrol. 2023, 626, 130349. [Google Scholar] [CrossRef]
  53. Li, R.; Jin, W. The role of the Yangtze River Protection Law in the emergence of adaptive water governance in China. Ecol. Soc. 2023, 28, 32. [Google Scholar] [CrossRef]
  54. Chao, N.; Wang, Z. Characterized Flood Potential in the Yangtze River Basin from GRACE Gravity Observation, Hydrological Model, and In-Situ Hydrological Station. J. Hydrol. Eng. 2017, 22, 05017016. [Google Scholar] [CrossRef]
  55. Li, B.; Chen, N.; Wang, W.; Wang, C.; Schmitt, R.J.P.; Lin, A.; Daily, G.C. Eco-environmental impacts of dams in the Yangtze River Basin, China. Sci. Total Environ. 2021, 774, 145743. [Google Scholar] [CrossRef] [PubMed]
  56. Zhang, X.; Hao, Z.; Singh, V.P.; Zhang, Y.; Feng, S.; Xu, Y.; Hao, F. Drought propagation under global warming: Characteristics, approaches, processes, and controlling factors. Sci. Total Environ. 2022, 838, 156021. [Google Scholar] [CrossRef]
  57. Zhang, L.; Sun, W. Progress and prospect of GRACE Mascon product and its application. Rev. Geophys. Planet. Phys. 2022, 53, 35–52. [Google Scholar] [CrossRef]
  58. Zhang, L.; Yi, S.; Wang, Q.; Chang, L.; Tang, H.; Sun, W. Evaluation of GRACE mascon solutions for small spatial scales and localized mass sources. Geophys. J. Int. 2019, 218, 1307–1321. [Google Scholar] [CrossRef]
  59. Zhong, Y.; Feng, W.; Humphrey, V.; Zhong, M. Human-Induced and Climate-Driven Contributions to Water Storage Variations in the Haihe River Basin, China. Remote Sens. 2019, 11, 3050. [Google Scholar] [CrossRef]
  60. Rodell, M.; Houser, P.R.; Jambor, U.; Gottschalck, J.; Mitchell, K.; Meng, C.-J.; Arsenault, K.; Cosgrove, B.; Radakovich, J.; Bosilovich, M.; et al. The Global Land Data Assimilation System. Bull. Am. Meteorol. Soc. 2004, 85, 381–394. [Google Scholar] [CrossRef]
  61. Müller Schmied, H.; Cáceres, D.; Eisner, S.; Flörke, M.; Herbert, C.; Niemann, C.; Peiris, T.A.; Popat, E.; Portmann, F.T.; Reinecke, R.; et al. The global water resources and use model WaterGAP v2.2d: Model description and evaluation. Geosci. Model Dev. 2021, 14, 1037–1079. [Google Scholar] [CrossRef]
  62. Vicente-Serrano, S.M.; Beguería, S.; López-Moreno, J.I. A Multiscalar Drought Index Sensitive to Global Warming: The Standardized Precipitation Evapotranspiration Index. J. Clim. 2010, 23, 1696–1718. [Google Scholar] [CrossRef]
  63. Wells, N.; Goddard, S.; Hayes, M.J. A Self-Calibrating Palmer Drought Severity Index. J. Clim. 2004, 17, 2335–2351. [Google Scholar] [CrossRef]
  64. Park, C.-H.; Son, S.-W. Subseasonal Variability of ENSO–East Asia Teleconnections Driven by Tropical Convection Over the Indian Ocean and Maritime Continent. Geophys. Res. Lett. 2024, 51, e2023GL108062. [Google Scholar] [CrossRef]
  65. Simpkins, G. Breaking down the NAO–AO connection. Nat. Rev. Earth Environ. 2021, 2, 88. [Google Scholar] [CrossRef]
  66. Thomas, E.; Abraham, N.P. Relationship between sunspot number and seasonal rainfall over Kerala using wavelet analysis. J. Atmos. Sol.-Terr. Phys. 2022, 240, 105943. [Google Scholar] [CrossRef]
  67. Thomas, A.C.; Reager, J.T.; Famiglietti, J.S.; Rodell, M. A GRACE-based water storage deficit approach for hydrological drought characterization. Geophys. Res. Lett. 2014, 41, 1537–1545. [Google Scholar] [CrossRef]
  68. Sinha, D.; Syed, T.H.; Famiglietti, J.S.; Reager, J.T.; Thomas, R.C. Characterizing Drought in India Using GRACE Observations of Terrestrial Water Storage Deficit. J. Hydrometeorol. 2017, 18, 381–396. [Google Scholar] [CrossRef]
  69. Nie, N.; Zhang, W.; Chen, H.; Guo, H. A Global Hydrological Drought Index Dataset Based on Gravity Recovery and Climate Experiment (GRACE) Data. Water Resour. Manag. 2018, 32, 1275–1290. [Google Scholar] [CrossRef]
  70. Zou, R.; Yin, Y.; Wang, X.; Zhang, Z.; Ma, X.; Liu, M.; Ullah, I. Characteristics and propagation of meteorological and hydrological droughts in eastern Gansu, a typical semi-arid region, China. Int. J. Climatol. 2023, 43, 5327–5347. [Google Scholar] [CrossRef]
  71. Guo, Y.; Huang, S.; Huang, Q.; Wang, H.; Fang, W.; Yang, Y.; Wang, L. Assessing socioeconomic drought based on an improved Multivariate Standardized Reliability and Resilience Index. J. Hydrol. 2019, 568, 904–918. [Google Scholar] [CrossRef]
  72. Walwer, D.; Calais, E.; Ghil, M. Data-adaptive detection of transient deformation in geodetic networks. J. Geophys. Res. Solid Earth 2016, 121, 2129–2152. [Google Scholar] [CrossRef]
  73. Torrence, C.; Compo, G.P. A Practical Guide to Wavelet Analysis. Bull. Am. Meteorol. Soc. 1998, 79, 61–78. [Google Scholar] [CrossRef]
  74. Huang, S.; Huang, Q.; Chang, J.; Zhu, Y.; Leng, G.; Xing, L. Drought structure based on a nonparametric multivariate standardized drought index across the Yellow River basin, China. J. Hydrol. 2015, 530, 127–136. [Google Scholar] [CrossRef]
  75. Xue, H.; Zhang, R.; Luan, W.; Yuan, Z. The Spatiotemporal Variations in and Propagation of Meteorological, Agricultural, and Groundwater Droughts in Henan Province, China. Agriculture 2024, 14, 1840. [Google Scholar] [CrossRef]
  76. Veleda, D.; Montagne, R.; Araujo, M. Cross-Wavelet Bias Corrected by Normalizing Scales. J. Atmos. Ocean. Technol. 2012, 29, 1401–1408. [Google Scholar] [CrossRef]
  77. Cohen, M.X. A better way to define and describe Morlet wavelets for time-frequency analysis. NeuroImage 2019, 199, 81–86. [Google Scholar] [CrossRef]
  78. Cao, Y.; Nan, Z.; Cheng, G. GRACE Gravity Satellite Observations of Terrestrial Water Storage Changes for Drought Characterization in the Arid Land of Northwestern China. Remote Sens. 2015, 7, 1021–1047. [Google Scholar] [CrossRef]
  79. Deng, H.; Li, Y.; Zhang, Y.; Chen, X. Monitoring spatio-temporal variations of terrestrial water storage changes and their potential influencing factors in a humid subtropical climate region of Southeast China. J. Hydrol. 2024, 634, 131095. [Google Scholar] [CrossRef]
  80. Deng, H.; Chen, Y.; Chen, X. Driving factors and changes in components of terrestrial water storage in the endorheic Tibetan Plateau. J. Hydrol. 2022, 612, 128225. [Google Scholar] [CrossRef]
  81. Hsu, Y.-J.; Fu, Y.; Bürgmann, R.; Hsu, S.-Y.; Lin, C.-C.; Tang, C.-H.; Wu, Y.-M. Assessing seasonal and interannual water storage variations in Taiwan using geodetic and hydrological data. Earth Planet. Sci. Lett. 2020, 550, 116532. [Google Scholar] [CrossRef]
  82. Li, B.; Rodell, M.; Kumar, S.; Beaudoing, H.K.; Getirana, A.; Zaitchik, B.F.; de Goncalves, L.G.; Cossetin, C.; Bhanja, S.; Mukherjee, A.; et al. Global GRACE Data Assimilation for Groundwater and Drought Monitoring: Advances and Challenges. Water Resour. Res. 2019, 55, 7564–7586. [Google Scholar] [CrossRef]
  83. Ran, Y.; Zhong, M.; Chen, W.; Zhong, Y.; Feng, W. Monitoring the extreme drought in the middle and lower reaches of the Yangtze River in 2019 from GRACE-FO satellites. Chin. Sci. Bull. 2020, 66, 107–117. [Google Scholar] [CrossRef]
  84. Wu, X.; Wang, L.; Niu, Z.; Jiang, W.; Cao, Q. More extreme precipitation over the Yangtze River Basin, China: Insights from historical and projected perspectives. Atmos. Res. 2023, 292, 106883. [Google Scholar] [CrossRef]
  85. Zhong, Y.; Bai, H.; Feng, W.; Lu, J.; Humphrey, V. Separating the Precipitation- and Non-Precipitation- Driven Water Storage Trends in China. Water Resour. Res. 2023, 59, e2022WR033261. [Google Scholar] [CrossRef]
  86. Pokhrel, Y.; Felfelani, F.; Satoh, Y.; Boulange, J.; Burek, P.; Gädeke, A.; Gerten, D.; Gosling, S.N.; Grillakis, M.; Gudmundsson, L.; et al. Global terrestrial water storage and drought severity under climate change. Nat. Clim. Chang. 2021, 11, 226–233. [Google Scholar] [CrossRef]
  87. Nott, A.H.; Allen, D.M.; Hahm, W.J. Groundwater Responses to Deluge and Drought in the Fraser Valley, Pacific Northwest. Water Resour. Res. 2024, 60, e2023WR036769. [Google Scholar] [CrossRef]
  88. Jehanzaib, M.; Sattar, M.N.; Lee, J.-H.; Kim, T.-W. Investigating effect of climate change on drought propagation from meteorological to hydrological drought using multi-model ensemble projections. Stoch. Environ. Res. Risk Assess. 2020, 34, 7–21. [Google Scholar] [CrossRef]
  89. Zhou, Z.-Q.; Xie, S.-P.; Zhang, R. Historic Yangtze flooding of 2020 tied to extreme Indian Ocean conditions. Proc. Natl. Acad. Sci. 2021, 118, e2022255118. [Google Scholar] [CrossRef]
  90. Li, C.; Lu, R.; Dunstone, N.; Scaife, A.A.; Bett, P.E.; Zheng, F. The Seasonal Prediction of the Exceptional Yangtze River Rainfall in Summer 2020. Adv. Atmos. Sci. 2021, 38, 2055–2066. [Google Scholar] [CrossRef]
  91. Lyu, Z.-Z.; Gao, H.; Gao, R.; Ding, T. Extreme characteristics and causes of the drought event in the whole Yangtze River Basin in the midsummer of 2022. Adv. Clim. Chang. Res. 2023, 14, 642–650. [Google Scholar] [CrossRef]
  92. Dash, M.K.; Pandey, P.C.; Vyas, N.K.; Turner, J. Variability in the ENSO-induced southern hemispheric circulation and Antarctic sea ice extent. Int. J. Climatol. 2013, 33, 778–783. [Google Scholar] [CrossRef]
  93. Wang, J.; Liang, Z.; Wang, D.; Liu, T.; Yang, J. Impact of Climate Change on Hydrologic Extremes in the Upper Basin of the Yellow River Basin of China. Adv. Meteorol. 2016, 2016, 1404290. [Google Scholar] [CrossRef]
  94. Chowdhury, M.R. The El Niño-Southern Oscillation (ENSO) and seasonal flooding–Bangladesh. Theor. Appl. Climatol. 2003, 76, 105–124. [Google Scholar] [CrossRef]
  95. Power, S.; Delage, F.; Chung, C.; Kociuba, G.; Keay, K. Robust twenty-first-century projections of El Niño and related precipitation variability. Nature 2013, 502, 541–545. [Google Scholar] [CrossRef] [PubMed]
  96. Song, C.; Fan, C.; Zhu, J.; Wang, J.; Sheng, Y.; Liu, K.; Chen, T.; Zhan, P.; Luo, S.; Yuan, C.; et al. A comprehensive geospatial database of nearly 100 000 reservoirs in China. Earth Syst. Sci. Data 2022, 14, 4017–4034. [Google Scholar] [CrossRef]
  97. Lai, Y.; Zhang, B.; Yao, Y.; Li, J. Quantitatively Analyzing the Impacts of Seasonal Water Storage Changes in the Three Gorges Reservoir on Nearby Crust. Pure Appl. Geophys. 2022, 179, 817–831. [Google Scholar] [CrossRef]
  98. Wang, Y.; Long, D.; Li, X. High-temporal-resolution monitoring of reservoir water storage of the Lancang-Mekong River. Remote Sens. Environ. 2023, 292, 113575. [Google Scholar] [CrossRef]
  99. Cheng, H.; Wang, T.; Yang, D. Quantifying the Regulation Capacity of the Three Gorges Reservoir on Extreme Hydrological Events and Its Impact on Flow Regime in a Changing Climate. Water Resour. Res. 2024, 60, e2023WR036329. [Google Scholar] [CrossRef]
  100. Huang, Z.; Jiao, J.J.; Luo, X.; Pan, Y.; Jin, T. Drought and Flood Characterization and Connection to Climate Variability in the Pearl River Basin in Southern China Using Long-Term GRACE and Reanalysis Data. J. Clim. 2021, 34, 2053–2078. [Google Scholar] [CrossRef]
  101. Feng, T.; Shen, Y.; Chen, Q.; Wang, F.; Zhang, X. Groundwater storage change and driving factor analysis in north china using independent component decomposition. J. Hydrol. 2022, 609, 127708. [Google Scholar] [CrossRef]
  102. Chen, Z.W.; Zhang, X.F.; Zhou, B.Y.; Cui, J.W. Filling method and accuracy analysis of missing values of monthly GRACE temporal gravity model. Prog. Geophys. 2020, 35, 815–822. [Google Scholar] [CrossRef]
Figure 1. Elevation, water system, reservoirs, geographical location of the YRB, and some administrative divisions of China. The dark blue curve divides YRB into three sub-basins: from left to right, the upper reaches of the Yangtze River Basin (UYRB), the middle reaches of the Yangtze River Basin (MYRB), and the lower reaches of the Yangtze River Basin (LYRB).
Remotesensing 17 02344 g001
Figure 2. Schematic diagram of the research process.
Remotesensing 17 02344 g002
Figure 3. The correlation coefficients among GRACE/GFO-TWSA, WGHM-TWSA, GLDAS-TWSA, and precipitation (calculated based on the time series of spatial average values). (a) The correlation coefficients at a lag of 0 month and (b) the correlation coefficients at a lag of 1 to 3 months.
Remotesensing 17 02344 g003
Figure 4. Time series of GRACE/GFO-TWSA, WGHM-TWSA, GLDAS-TWSA, precipitation, and temperature based on spatial average values.
Remotesensing 17 02344 g004
Figure 5. Time series of WSD and WSDI from April 2002 to December 2022.
Remotesensing 17 02344 g005
Figure 6. The correlation coefficients and time series between WSDI and SPEI at different time scales. (a) The correlation coefficients between WSDI and SPEI at different time scales and (b) the time series of WSDI and the range of SPEI01–SPEI12.
Remotesensing 17 02344 g006
Figure 7. WSDI time series, identified and documented drought and flood events of (a) UYRB, (b) MYRB, and (c) LYRB. Black solid line: WSDI. Red solid line: SPEI07. Yellow solid line: scPDSI. Cyan solid line: trend extracted by SSA. Blue dashed line: linear trend.
Remotesensing 17 02344 g007
Figure 8. Spatial distribution of extreme flood in the YRB in 2020.
Remotesensing 17 02344 g008
Figure 9. Spatial distribution of extreme drought in the YRB in 2022.
Remotesensing 17 02344 g009
Figure 10. Monthly and seasonal trends extracted based on the MMK trend test from April 2002 to December 2022.
Remotesensing 17 02344 g010
Figure 11. Monthly and seasonal change rates extracted based on the Theil–Sen slope from April 2002 to December 2022.
Remotesensing 17 02344 g011
Figure 12. Cross wavelet transform results of WSDI with AO, ENSO, and SSI in the UYRB, MYRB, and LYRB.
Remotesensing 17 02344 g012
Figure 13. Wavelet coherence results of WSDI with AO, ENSO, and SSI in the UYRB, MYRB, and LYRB.
Remotesensing 17 02344 g013
Figure 14. The resonance period of WSDI with different teleconnection factors and the time of drought and flood events. Pink bands: drought events. Blue bands: flood events.
Remotesensing 17 02344 g014
Table 1. Data used in this study.
VariableProductResolutionPeriodSource
TWSAGRACE/GFO RL06 Mascon0.25°, monthly2002–2022https://www2.csr.utexas.edu/grace
(accessed on 21 April 2024)
GLDAS NOAH0.25°, monthly2002–2022https://disc.gsfc.nasa.gov/datasets/
(accessed on 22 April 2024)
WGHM v2.2d0.5°, monthly2002–2019https://doi.org/10.1594/PANGAEA.918447 (accessed on 22 April 2024)
PrecipitationERA5-L0.1°, monthly2002–2022https://doi.org/10.24381/cds.e2161bac
(accessed on 28 April 2024)
TemperatureERA5-L0.1°, monthly2002–2022https://doi.org/10.24381/cds.e2161bac
(accessed on 18 April 2025)
scPDSIPreliminary 4.070.5°, monthly2002–2022https://crudata.uea.ac.uk/cru/data/drought/ (accessed on 22 April 2025)
SPEI01-12SPEIbase v2.90.5°, monthly2002–2022https://digital.csic.es/handle/10261/332007
(accessed on 28 April 2024)
Documented eventsCWRC Bulletin-, yearly2002–2022http://www.cjw.gov.cn/zwzc/zdgk/jyys/szygb/ (accessed on 17 May 2024)
Teleconnection factorsAO-, monthly2002–2022https://www.cpc.ncep.noaa.gov/
(accessed on 3 June 2024)
ENSO-, monthly2002–2022https://psl.noaa.gov/enso/mei/
(accessed on 3 June 2024)
SSI-, monthly2002–2022https://www.sidc.be/SILSO/datafiles
(accessed on 3 June 2024)
Table 2. Classification standard for drought and flood of WSDI, SPEI, and scPDSI.
CategoryWSDI/SPEIscPDSI
Extreme flood≥2≥4
Severe flood[1.5, 2)[3, 4)
Moderate flood[1, 1.5)[2, 3)
Mild flood[0.5, 1)[1, 2)
Normal(−0.5, 0.5)(−1, 1)
Mild drought(−1, −0.5](−2, −1]
Moderate drought(−1.5, −1](−3, −2]
Severe drought(−2, −1.5](−4, −3]
Extreme drought≤−2≤−4
Table 3. The duration and peak value of drought and flood events identified by WSDI in the three sub-basins.
RegionsTypesPeriodDuration (Month)Peak Value (Peak Date)
UYRBDrought2002.09–2003.059−1.30 (2003.04)
2006.07–2007.017−1.90 (2006.08)
2007.10–2008.0140.85 (2007.11)
2009.09–2009.1130.94 (2009.10)
2016.08–2016.125−1.36 (2016.09)
Flood2018.07–2019.0391.58 (2018.08)
2019.11–2020.0471.08 (2019.12)
2020.07–2021.0281.56 (2020.09)
2021.08–2022.06112.47 (2021.12)
MYRBDrought2002.09–2002.124−1.36 (2002.10)
2003.02–2003.043−1.12 (2003.03)
2003.10–2004.058−1.12 (2004.03)
2006.07–2006.115−1.08 (2006.09)
2007.11–2008.013−0.69 (2007.11)
2008.05–2008.073−0.66 (2008.05)
2009.09–2009.113−0.73 (2009.10)
2011.04–2011.085−1.18 (2011.05)
2019.09–2019.113−1.04 (2019.09)
2022.08–2022.125−1.53 (2022.12)
Flood2014.10–2014.1230.96 (2014.12)
2015.10–2016.0581.08 (2016.04)
2017.07–2017.1040.73 (2017.10)
2018.11–2019.0351.30 (2019.02)
2019.05–2019.0730.87 (2019.06)
2020.07–2020.1261.97 (2020.10)
2021.03–2021.0531.28 (2021.04)
2021.08–2022.05101.78 (2022.04)
LYRBDrought2003.11–2004.079−1.53 (2004.02)
2007.11–2008.013−0.74 (2007.12)
2011.04–2011.074−1.31 (2011.05)
2013.07–2014.017−0.99 (2013.12)
2019.08–2019.125−1.73 (2019.11)
2022.07–2022.115−2.77 (2022.08)
Flood2010.04–2010.1071.19 (2010.07)
2012.12–2013.0230.82 (2013.01)
2015.10–2016.07102.31 (2016.07)
2016.10–2017.0471.64 (2016.11)
2018.11–2019.0461.22 (2019.01)
2020.07–2020.1042.59 (2020.07)
Disclaimer/Publisher’s Note: The statements, opinions and data contained in all publications are solely those of the individual author(s) and contributor(s) and not of MDPI and/or the editor(s). MDPI and/or the editor(s) disclaim responsibility for any injury to people or property resulting from any ideas, methods, instructions or products referred to in the content.

