Abstract
Strapdown gravity systems are increasingly employed in airborne geophysical exploration and geodetic studies due to advantages such as ease of installation, wide dynamic range, and adaptability to various platforms, including airplanes, helicopters, and large drones. This study presents results from an airborne gravity survey conducted over the northeastern sector of Sardinia (Italy), using a high-resolution strapdown gravity ensuring an accuracy of approximately 1 mGal. Data were collected at an average altitude of 1800 m with a spatial resolution of 3.0 km. The survey focused on the Sos Enattos area near Lula (Nuoro province), a candidate site for the Einstein Telescope (ET), a third-generation gravitational wave observatory. The ideal site is required to be geologically and seismically stable with a well-characterized subsurface. To support this, we performed a new gravity survey to complement existing geological and seismic data aimed at characterizing the mid-to-shallow crustal structure of Sos Enattos. Results show that the strapdown system effectively detects gravity anomalies linked to crustal sources down to ~3.5 km, with particular emphasis within the 1–2 km depth range. Airborne gravity data reveal higher frequency anomalies than those resolved by the EGM2008 global gravity model and show good agreement with local terrestrial gravity data. Forward modeling of the gravity field suggests a crust dominated by alternating high-density metamorphic rocks and granitoid intrusions of the Variscan basement. These findings enhance the geophysical understanding of Sos Enattos and support its candidacy for the ET site.
1. Introduction
Mapping the gravity field is a key element in unveiling Earth’s interior and understanding the geologic processes that shape it. Since the development of the first portable sensors in the 1950s (Worden and LaCoste models), gravity investigation methods have been applied to a wide range of purposes. Gravity prospecting remains an essential tool for regional geologic studies, including the analysis of major seismo-tectonic structures, volcanic edifices and their internal plumbing systems, as well as water mass storage. Over the past five decades, the oil and gas industry has extensively utilized gravity data for exploration purposes [1,2,3]. Moreover, studying the geoid as an equipotential gravity surface is critical for establishing a common reference level for positioning and navigation [4,5]. A worldwide view of the gravity signal can be achieved using data from gravity satellite missions, such as those from the GOCE (Gravity field and steady-state Ocean Circulation Explorer; [6]) and GRACE missions (Gravity Recovery and Climate Experiment; [7]). These datasets depict the long-wavelength spectral components of Earth’s gravity field and are invaluable for understanding global processes [8,9], such as water mass variability across the entire planet [10,11]. In addition to satellite methods, local and more detailed measurements of the gravity field can be obtained through terrestrial, shipborne, and airborne surveys.
Due to the favorable balance between survey time and the accuracy of gravity estimates, airborne gravity methods have been extensively utilized for geological investigations [12] and geodetic studies [13,14,15]. Pioneering airborne surveys began in the 1960s with the use of a LaCoste and Romberg spring-type gravimeter specifically modified for use on aircraft [16,17,18,19]. Subsequent technological advancements enabled the development of stabilized platforms that housed sensitive gravity sensors, allowing them to adapt to the dynamics of airborne data acquisition [20]. Significant improvements in the accuracy of such surveys were achieved in the 1990s with the advent of GNSS systems [21]. Thank to this improvement, airborne gravity studies have benefited from a new type of sensor based on inertial measurement technology, known as the inertial gravity systems or strapdown gravimeters [22,23,24,25,26]. Technically, this sensor incorporates accelerometers coupled to high-resolution gyro-compass systems that track the angular velocities and estimate the attitude of the carriers.
Strapdown gravimetry offers advantages, including an easier installation without the need of additional platforms and no requirement for specific maneuvers during data acquisition. However, its major disadvantages include the necessity for extremely high-resolution positioning and a constant thermal stabilization both before and during data acquisition. Inertial gravity surveys have been successfully conducted in various tests and geological studies [27,28], including in polar regions [29,30].
We present the results of an airborne gravity survey of the NE sector of Sardinia island (Italy), conducted using the strapdown gravity sensor iCORUS-02 by iMAR Navigation GmbH (St. Ingbert Germany). The survey focused on the Sos Enattos area, located close to Lula municipality in Nuoro province (Figure 1). Considering the international relevance of the Sos Enattos site, we carried out an expanded geophysical survey that included airborne gravity measurements. The goal was to acquire high-resolution data to better characterize the subsurface geological structure and to produce a regional gravity anomaly map supporting multiple objectives:
- (i).
- Assess the lateral gravity variations associated with lithological and density contrasts among the main geological units exposed in the region;
- (ii).
- Develop a forward model to estimate the depth and geometry of major geological boundaries, with a focus on identifying potential structural discontinuities beneath the candidate site that may affect its development;
- (iii).
- Provide a long-wavelength gravity dataset to contribute to the refinement of the regional geoid model;
- (iv).
- Support the ongoing integration and updating of the geological model of the site, in conjunction with other geophysical techniques such as multichannel seismic surveys, electrical resistivity tomography (ERT) [31], and seismic noise characterization [32,33];
- (v).
- Establish a representative case study that may serve as a methodological reference for future site investigations in similar geological contexts.
Additionally, a local terrestrial gravity survey was conducted at the Sos Enattos mining site to act as reference and validation data for the airborne gravity acquisition.
The target area represents the Italian candidate site for the potential installation and development of the Einstein Telescope (ET) infrastructure [34]. The ET would become one of the largest European facilities, designed to host an underground gravitational wave detector (https://www.et-gw.eu/, accessed on 6 January 2025). The ET project aims to continue and enhance the ground-breaking results achieved by the LIGO and Virgo gravitational wave detectors [35], which have revolutionized our understanding of the Universe. Currently, the project is in its preparatory phase, focusing on feasibility design studies identifying the optimal site for the installation of this research underground infrastructure. Sos Enattos is one of the candidate site locations, along with the Euregio Meuse–Rhine site, located near the borders of the Netherlands, Belgium, and Germany.
Since ET infrastructure will be built a few hundreds of meters underground, it could be strongly affected by vibrations from human activities (e.g., local traffic, civil or industrial operations) in addition to noise signals produced by geological sources (e.g., seismic events or intense groundwater movements). Being located in a non-seismic region (such as the whole of Sardinia) in a rural area far from industrial activities, the Sos Enattos area could represent an ideal site to host the ET. More specifically, recent studies on local seismicity indicated a very low noise level comprising 1–10 Hz, compliant to the limits required for interferometric measurements [32,33,36,37]. The new airborne gravity survey would provide additional geophysical and geological insights aimed to improve the capability to derive a more detailed noise propagation model, contributing also to support the engineering feasibility study aimed at identifying an optimal location in the Sos Enattos for the ET underground infrastructure.
2. Geological Setting
The survey area investigated using airborne gravimetric technique extends roughly 48 km east–west and 52 km north–south from the Sos Enattos mining sites in northeastern Sardinia (Figure 1C). More broadly, Sardinia island, together with Corsica, can be considered a micro-continent situated between two major basins: the western Mediterranean to the west and the Tyrrhenian Sea to the east. This region features a continental crust exceeding 30 km in thickness which exhibits very low seismicity. Historically, only three seismic events with a magnitude greater than 5 have been reported, with just one occurring offshore in the Gallura region (northwest) [38]. Despite the very limited number of recorded seismic events, Gorshkov et al. [39] argue that the Sardinia–Corsica block cannot be considered completely aseismic.
The Sardinia block is interpreted as a fragment of the European Hercynian basement that was originally located adjacent to the French continental margin. It drifted eastward as a result of the Oligocene opening of the Ligurian–Provencal Basin [40,41,42]. Paleomagnetic data indicate an anticlockwise rotation of the block, associated with a tectonic regime that involved both NE–SW strike–slip kinematic shortening and N–S extension in the western part of the island. Additionally, a NW–SE extension characterized the Campidano area during the Tortonian–Pliocene period (Figure 1A) [42]. The Sardinian basement (i.e., the Variscan basement) is primarily composed of several tectonic units that were affected by crustal shortening during the Hercynian orogeny, and subsequently, by extensional tectonics and regional uplift [43,44,45,46,47]. This unit also includes Permian–Carboniferous batholiths emplaced between 340 and 280 Ma [43]. Above the Variscan basement, a Permian–Oligocene sedimentary unit is emplaced. This sequence formed in a passive margin setting and characterized by carbonate platform deposits (Figure 1B) [48].
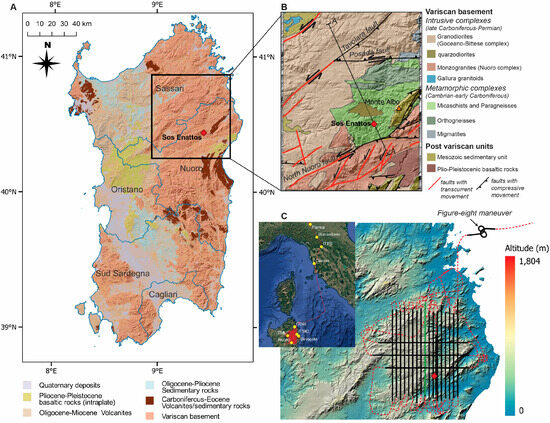
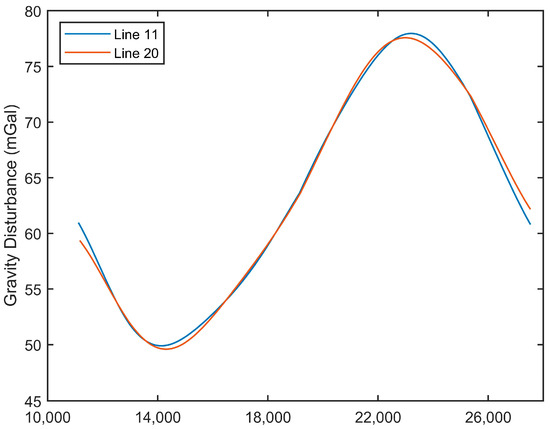
Figure 1.
(A) Geologic map of Sardinia island (simplified from Carmignani et al. [44] and Italian Geological Survey Mapping Project, 1993–2008 CARG Project). (B) Inset of geologic features of the Sos Enattos region, NE Sardinia. Locations of faults are from Costamagna [49]. (C) Layout of airborne strapdown gravity survey overlaid the resolution digital elevation model of NE Sardinia (10 m of resolution; data are free available from the repository https://www.sardegnageoportale.it, accessed on 6 January 2025). Black colored lines identify the segments of survey lines used included in the data processing. The dashed red colored lines represent the entire acquired survey including segments discharged during the processing phase. Green colored solid lines (nr. 11 and 20) identified the coincident flight tracks used for the data comparison shown in Figure 2. In the upper left corner, we report distribution of GNSS base stations used for flight trajectory correction. Red filled dot identifies the geographical position of the Sos Enattos site.
Figure 2.
Comparison of gravity disturbance distribution along line nr. 11 and line nr. 20. The two lines were flights following the same heading. See their locations in Figure 1C (green solid lines).
A third major unit consists of the Oligocene–upper Miocene volcano–sedimentary succession, which reflects the extensional regime that affected the Sardinian region. In western Sardinia, this local extensional regime generated volcanism, resulting in the emplacement of various volcanic products, including andesites, calc-alkaline ignimbrites (such as the Ignimbrite of Buda), and minor lava flows, dated to 30–12 Ma [40]. Finally, siliciclastic–carbonate deposits were emplaced during the Tortonian–Messinian period, predominantly in the Logudoro area (NW Sardinia).
The Sos Enattos site is located in the northeastern sector of Sardinia, where the Variscan–Hercynian basement is widely exposed. This basement comprises three main crustal domains: (i) a dyke complex ranging in composition from acidic to basic, dated from the upper Carboniferous to the Triassic; (ii) upper Carboniferous to Permian plutonic complexes, including leucogranites, monzo-granodiorites, and gabbros; and (iii) Precambrian to lower Paleozoic metamorphic complexes, characterized by migmatitic and amphibolite facies assemblages [44]. In northeastern Sardinia, the basement is structurally deformed by a prominent NE–SW trending fault system of Tertiary age, which includes both strike–slip and compressive/thrust-related components (i.e., north Nuoro Fault, Tavolara and Posada Faults; Figure 1B) [48,49]. Additionally, minor NNW–SSE trending faults are present in the south-eastern portion of the area.
The Sos Enattos mining site lies atop a high-grade metamorphic unit primarily composed of Paleozoic biotite-rich micaschists. To the north, outcrops of magmatic orthogneisses (migmatites) appear as isolated enclaves (Figure 1B). The metamorphic units are bounded to the north by granodiorites of the Goceano–Bittese complex and to the south by monzogranites of the Nuoro complex.
From a compositional perspective, the Paleozoic metamorphic rocks of the Sos Enattos area are notably enriched in ore minerals and metals. This metallogenic potential led to the development of extensive mining operations beginning in the mid-1800s. During the 20th century, Sos Enattos had evolved into a large-scale mining complex, with core-drilling campaigns reaching hundreds of meters in depth. The mine primarily extracted galena and sphalerite, which are rich in zinc (Zn), lead (Pb), sulfur (S), and iron (Fe). Mining activities ceased in the late 1990s, and the site was subsequently abandoned. More recently, the site has been converted into a research facility for experiments in theoretical physics [50].
Due to their composition, the metamorphic units, especially the migmatites, are generally characterized by high density values, often reaching up to 3000 kg/m3 [51]. These high density rocks can exhibit a relative contrast with surrounding granitoids [52,53] which is expected to generate measurable gravity anomalies, even when observed with airborne gravimetric techniques operating at high altitudes.
Structurally, the study area is located at a significant distance from major active deformation zones (e.g., the reverse/thrust fault systems to the south; see Figure 1B, [49]), suggesting a relatively stable geological setting. Consequently, the gravity field across the region is expected to exhibit smooth lateral gradients, primarily controlled by lithological contrasts rather than by tectonic discontinuities.
3. Materials and Methods
3.1. Airborne Gravity Instrumentation
An airborne gravity survey of the Sos Enattos area has been conducted using the iCORUS-02 strapdown gravity system. The strapdown gravity technology differs significantly from traditional gimbaled gravimeter, where gyroscopes mechanically stabilize the accelerometers or zero-length spring sensors. Technically, a strapdown sensor integrates three inertial-grade accelerometers and gyroscopes, which, unlike traditional stabilized-platform systems, are rigidly mounted to the aircraft’s internal structure. The data collected by these sensors are combined with precise GNSS-derived position and velocity measurements to isolate the gravitational acceleration from the total measured acceleration. This process is carried out entirely through numerical integration and sensor fusion, rather than relying on the mechanical compensation mechanisms used in conventional platform-stabilized gravimeters.
The iCORUS-02 system consists of a high-performance inertial navigation unit, incorporating a triad of accelerometer–gyro pairs arranged in a tri-axial geometry and rigidly mounted within a supporting case. The accelerometers are based on quartz technology, while the gyroscopes utilize the ring laser gyro (RLG) technique featured by low bias stability (<0.001°/hr) without a gravity-dependent drift. However, this type of gyro is sensitive to vibrations and, more critically, to temperature gradients. To address these challenges, the primary objective is to ensure effective and continuous thermal stabilization of the inertial navigation unit, thereby preventing sudden spikes in temperature gradients that could drastically affect the performance. The iCORUS-02 system integrates advanced GNSS engines and a dedicated built-in motherboard for sophisticated signal processing. The GNSS assists to several critical functions: (i) initializing of the INS with an initial positioning instance required for gyro alignment; (ii) aiding of navigation permitting to minimize the intrinsic drift of gyros providing corrected information about true heading; (iii) integrating into the Kalman filtering and providing stable solutions and referencing the acquired data to a real-world coordinate system. Technically speaking, the iCORUS-02 system delivers high performance with a nominal accuracy of <1 mGal (rms) and can resist accelerations of up to 20 g. The payload features compact dimensions of 30 × 50 × 30 cm and a weight <18 kg. The combination of high robustness, lightweight design, and low power consumption makes the iCORUS-02 system highly suitable for a wide range of airborne applications using classic ultra-light vehicles and large unmanned aerial vehicles (UAVs).
3.2. Airborne Gravity Survey
The airborne gravity survey of the Sos Enattos area was conducted during the winter of 2024 (27–28 December 2024) using a Piper Navajo PA-31 aircraft operated by CGR Spa. The flight operations began at Parma airport (the basecamp of CGR company) and concluded at Olbia airport. The survey lasted two working days, with a break in between for refueling operations.
Over the survey area, the aircraft flew at an altitude ranging between 1794 and 1930 m, with an average ground speed of 64.3 m/s (standard deviation: 3.83 m/s). The survey layout was carefully planned, taking into account the key geological features of the target area and the expected gravity signal (i.e., [54]). The airborne investigation followed 20 north–south oriented parallel flight lines, each 48 km long and spaced 2 km apart. Additionally, three orthogonal tie lines spaced approximately 6 km apart and 50 km long, were also acquired (Figure 1C). The final dataset includes more than 14,500 records collected along 934 linear km, covering an area > 2500 km2. Line 11 was repeated once (renamed Line 20) following the same heading (N0–2°). The two datasets are compared in Figure 2, demonstrating good coherence (Rcoef = 0.98) between the repeated acquisitions.
The positioning of the aircraft was ensured using a GNSS receiver with a G5ANT-3XXRX multi-frequency antenna mounted on the fuselage. The raw GNSS data were corrected using the post-processing approach, incorporating data from nine GNSS reference stations distributed along the survey path, including the departure airport in Parma (see Figure 1C and Table 1). The multi-base correction procedure was performed using Inertial Explorer software, achieving an average standard deviation of 0.0079 m for the north axis, 0.0066 m for the east axis, and 0.016 m for the Z axis (Figure 3).

Table 1.
GNSS reference stations.
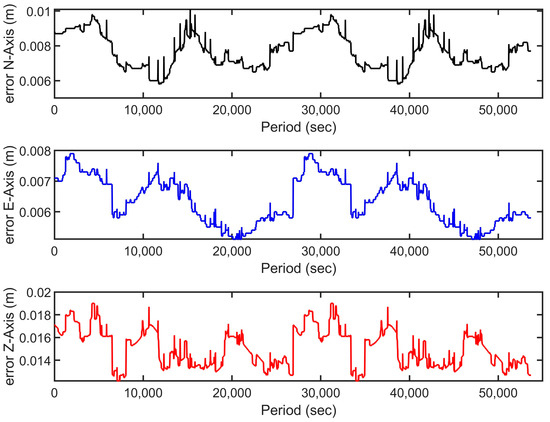
Figure 3.
Positioning errors along the N (north; black colored line), E (east; blue colored line), and Z (vertical, red colored line) axes of GNSS data collected on board the aircraft. The results are referenced using base station corrections (see Figure 1C and Table 1 for the geographic positions). The horizontal axis represents time in seconds, while the vertical axes represent the error magnitude in meters for each respective component.
3.3. Gravity Data Processing
Gravity data acquired by the iMAR iCORUS-02 gravity system were processed using the dedicated software iPosCAL-GRAV (version 1.7.3). This application computes vertical gravity by converting all recorded accelerations during the flights. To achieve this, the software requires both the raw acceleration dataset and the processed GNSS data from the flight paths. The accuracy of the resulting gravity estimates is highly dependent on the quality of the GNSS dataset; therefore, the post processing correction procedure (as explained above) is crucial for a reliable data acquisition. The processing sequence follows these steps:
- (a)
- Lever arm correction. This procedure accounts for the geometric offset between the position of the strapdown gravimeter sensor, installed inside the aircraft, and the GNSS antenna. Accurate gravity data acquisition is only possible if this offset is precisely known, with centimetric accuracy (ideally <5 cm). If the offset is not determined or significantly exceeds this threshold, the data acquisition process may be considered unreliable or infeasible.
During the Sos Enattos campaign, the lever arm offset gravity sensor with respect to the GNSS antenna was fixed at Parma airport before the beginning of the flight procedures and remained unchanged throughout the survey. The applied offset values were −0.393 m, −0.578 m, and −1.148 m along the X, Y, and Z directions, respectively. Additionally, a figure-eight flight maneuver (see inset in Figure 1C) was performed to capture maximum variations in pitch, roll, and heading. These data are crucial for the lever arm calibration performed by the iPosCAL-GRAV software.
- (b)
- Link to gravity reference stations and drift correction. The iCORUS-02 system provides relative gravity variations. However, the computation of gravity disturbance requires subtracting the normal gravity contribution from the observed data. To achieve this, the relative measurements must be tied to an absolute gravity value.
Additionally, if the survey begins and ends at different locations (i.e., airports), a precise correlation between terrestrial gravity measurements and the strapdown gravity readings is necessary. To ensure accuracy, terrestrial gravity measurements were conducted near both the departure and arrival airports. This approach allows for the quantification of system drift, as the iCORUS-02 system, like all strapdown technologies, is affected by gradual modifications in gravity estimates over time. To this end, a link between relative gravity readings and absolute reference stations has been established.
Absolute gravity values recorded at Loiano (Bologna, Italy) and Sos Enattos mining site (Nuoro, Italy) were used to transport the absolute gravity to the Parma and Olbia airports, respectively (see Table 2). The Loiano station is part of the First Order Gravity Network of Italy (see https://bgi.obs-mip.fr/, accessed on 6 January 2025), providing a reliable and nationally standardized reference for absolute gravity measurements. Instead, at the Sos Enattos site, a new absolute gravity measurement was carried out using a FG5#238 absolute gravimeter (Micro-g LaCoste, Lafayette, Colorado, USA). Although primarily designed for laboratory use, this instrument has been successfully employed in field data acquisition, as recently demonstrated by Greco et al. [55].
Table 2.
Absolute gravity values of Parma and Olbia airports.
Additionally, terrestrial gravity measurements were performed using a CG6 gravimeter (Scintrex Ltd, Ontario, Canada). Drift correction was performed directly using iPosCAL-GRAV software, applying a linear distribution approach over the working days. Standard deviation of corrected gravity value ranges from 0.8 to 1.09 mGal with a mean value of 0.95 mGal.
- (c)
- Filtering. The strapdown gravity system records all types of accelerations, which result in a summation of multispectral components, with gravity acceleration representing only one of them. To minimize the high-amplitude noise, low-pass filtering is essential. IPosCAL-GRAV uses a full-wavelength low-pass filter with a 100-s cut-off length. This filter length effectively reduces noise but also impacts the resolution of the data due to the combination with the airplane speed. The achievable spatial resolution is determined by the product of the filter length and the airplane speed.
Data collected at Sos Enattos were filtered using a 50-s cut-off length, resulting in an optimal spatial resolution of 3 km (half wavelength), considering an average speed of 60 m/s. However, the processed data were output with a spatial resolution of 2 km, without any aliasing effect.
After the filtering procedure we estimated the residual noise level floor for the entire lines in the frequency range of 0.05–0.2 Hz according to [26,28,56]. The overall noise level statistics indicate a mean value of 0.323 mGal/√Hz with a standard deviation of 0.119 mGal/√Hz. Example of the power spectra density of a single line (line number 10) and the histogram distribution of the entire survey are presented in Figures S1 and S2, respectively (Supplementary Material).
- (d)
- Gravity disturbance computation.
The raw gravity measurements were corrected for Eötvös acceleration, which depends on the velocity of the aircraft and the heading direction of the track lines. This effect is maximum along the E–W direction and minimum in the orthogonal way. After the Eötvös correction, the resulting gravity values represent the observed gravity field at the aircraft’s altitude, still referenced to the ellipsoid due to the GNSS-derived positions (ellipsoid height).
In this study, we computed the gravity disturbance, defined as the difference between the observed gravity and the normal gravity evaluated at the same point (same latitude, longitude, and ellipsoidal height):
where gP is the corrected gravity measurement at the aircraft position P, and γP is the normal gravity at the same location, computed using the formula from Torge and Müller [57], which accounts for the gravity signal related to the GRS80 reference ellipsoid for a point at ellipsoidal height h ≥ 0.
δg = gP − γP
We would to underline that the gravity disturbance differs conceptually and practically from the more commonly used gravity anomaly. The gravity anomaly involves projecting the observed gravity to a reference surface (typically the geoid) and comparing it with the normal gravity at a different point (on the ellipsoid), introducing centrifugal effects due to spatial separation. In contrast, the gravity disturbance compares gravity and normal gravity at the same physical location, and therefore reflects purely gravitational variations, free of centrifugal contributions.
Because our positioning data were obtained from GNSS and referenced to ellipsoidal heights, we estimated the gravity disturbance pattern for the surveyed region. As a result, we did not apply classic “free-air” correction.
Considering the wavelength resolution of the survey and the instrumental accuracy (1 mGal), tidal and atmospheric corrections were not applied.
- (e)
- Post processing data treatment. The U-turning portions and nonlinear segments of the track lines were removed to prevent spurious anomalies from affecting the entire dataset (see black lines in Figure 1C). After this step, the gravity disturbance was corrected using a statistical levelling approach. Data along the N–S lines were compared with those of the tie lines, resulting in a cross-over data matrix. This process led to a quasi-linear distribution (oblique trend), primarily due to minor inconsistencies in flight pattern. The cross-over errors range between −5.1 mGal to 4.98 mGal, a mean value of 0.1775 mGal and a standard deviation of 3.46 mGal (see Table S1 in Supplementary Material). This error matrix was thus subtracted from the original disturbance dataset, resulting in a levelled and smoother distribution.
- (f)
- Reduction of the topographic effect.
In general, the gravity disturbance distribution reflects the combined effect of multiple sources, including lateral and vertical variations in rock density, as well as the gravitational influence of topography. Among these, the topographic effect, i.e., the gravity signal generated by the mass of surface relief, often represents a dominant contribution. This strong topographic signal can mask the gravity variations related to deeper geological structures, explaining also the observed correlation between the gravity disturbance and surface morphology.
To isolate the subsurface structural signal, we estimated the gravity effect of the local topography using a FFT-based algorithm following the classic approach proposed by [58]. The input topographic data were derived from a 10 m resolution digital elevation model (DEM) (see Figure 1), which represents orthometric heights (referenced to the geoid surface). Since gravity disturbances are referenced to ellipsoidal heights, we applied a correction to the DEM using geoid undulation values extracted from the Earth Gravitational Model 2008 model (EGM2008, accessed on 01/06/2025) [59] to convert the elevations to ellipsoidal heights. The gravity effect of the topographic masses was then modeled assuming a reference rock density of 2670 kg/m3. This topographic gravity contribution was subsequently subtracted from the original gravity disturbance data, resulting in a residual gravity disturbance map, also named as the complete Bouguer disturbance. This reduced gravity field is more sensitive to subsurface density variations, providing a clearer image of the geological structures beneath the surface.
3.4. Modeling of Sos-Enattos Airborne Gravity Dataset
A qualitative interpretative model of the gravity signature in the Sos Enattos area was performed using a 2.5D forward modeling approach (GmSYS by Oasis Montaj software, version 2022.1). This technique enables a detailed reconstruction of the subsurface structure by iteratively adjusting the geometry and density of the causative bodies to achieve the best fit between observed and computed gravity profiles. The model accounts for variations in the size and shape of geological units both along the profile and in a direction perpendicular to it (2.5D dimensions; additional details in [60,61]). The forward model was constructed along a 44 km-long NNW–SSE oriented profile, which crosses the Sos Enattos mining site and intersects the major local lithological boundaries. The location of the profile is shown in Figure 1B and Figure 4A. The modeling was initially set up based on the spatial distribution of local geology, specifically considering the lithological contacts intersected along the profile. Minor discrepancies from the geological map were observed, which are attributed to adjustments made during the gravity data best-fitting procedure. The densities assigned to the rock units were based on values reported in the literature [51,52,53]. In addition, rather than assigning a single fixed value, a range of densities was used (e.g., 2700–2750 kg/m3 for metamorphic units) to account for the extended length of the profile, the scale of geological bodies, and the natural variability in rock density.
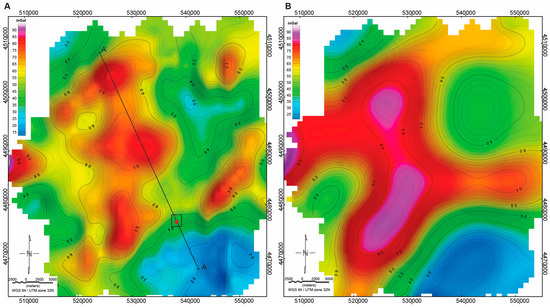
Figure 4.
Gravity disturbance distribution of the Sos Enattos study area. (A) Strapdown airborne gravity data acquired in 2024; data acquired along the survey track lines (see Figure 1C) are interpolated in an equally spatial grid using a minimum curvature gridding algorithm and a cell size of 1500 m. A-A’ black dashed line identifies the track of gravity profile of the 2.5D forward model (see Section 5.2); black rectangle identifies the area of terrestrial gravity survey (see Section 4), while the red filled dot identifies the geographical position of the Sos Enattos site. (B) EGM2008 gravity disturbance resampled along the flight track lines a grid cell size of 2000 m.
3.5. Terrestrial Gravity Survey
A total of 49 terrestrial gravity measurements were conducted in the area surrounding the Sos Enattos site. The survey was carried out using the CG6 gravity meter (Scintrex Co., Ltd., Vaughan, ON, Canada), a fully portable system with a reading resolution of 0.1 µGal and a standard deviation of <5 µGal. Additionally, this instrument benefits from very low intrinsic drift (<10 µGal per day) and a tare of 5 µGal, enabling simple and fast data correction during post-processing.
The survey covered an area of approximately 200 × 103 m2, with an average distribution of gravity stations spaced approximately 75 m apart. However, an uncovered portion is present in the northeastern part of the investigated region due to inaccessible area. The survey was conducted a few weeks after the airborne investigation. Additionally, eight gravity stations were positioned along the line nr. 7 of the airborne gravity survey. This approach ensures to compare airborne and terrestrial gravity data (see Section 4).
Ground gravity data were corrected for instrumental drift by performing daily open–close cyclic measurements at a base station located near the survey area. The estimated daily drift of 5 µGal per day aligns with the instrument nominal specification.
The geographical positions of the gravity stations were determined using a Stonex high-precision RTK Differential GPS unit, offering 1 mm vertical accuracy. The relative gravity readings were then tied to the same absolute gravity reference used for the airborne gravity survey, located in the Sos Enattos area. Gravity readings were processed removing tide effect and then the daily drift. Gravity disturbance distribution was estimated approaching the same computation technique used for the strapdown gravity dataset.
4. Results
4.1. Airborne Strapdown Survey
Airborne gravity disturbance distribution in the Sos Enattos region ranges between 8 and 85 mGal, displaying a distinct pattern primarily characterized by three prominent positive anomalies roughly aligned in a N–S direction (Figure 4A). In contrast, the eastern sector exhibits a series of E–W to SW–NE elongated mid-high anomalies (~60 mGal) that enclose a relative gravity minimum (~25 mGal). The southeastern sector of the study area features the lowest gravity anomalies, ranging between 8 and 20 mGal. This observed gravity pattern is strongly correlated with the morphological features of the area, where topography plays a dominant role in shaping the gravity disturbance signal. The Sos Enattos area is located in a hilly-mountainous region, characterized by NE–SW elongated structural highs that reach elevations exceeding 1000 m (e.g., Monte Albo, 1127 m a.s.l.; Figure 1) and are interspersed with narrow valleys. This rugged morphology results from a NE–SW fault system, which has tectonically deformed the Hercynian–Variscan basement and the overlying Mesozoic–Eocene sedimentary sequences [44,48,49] (Figure 1). The Sos Enattos mining site, situated at an altitude of 304 m, lies southwest of Monte Albo. From a gravity perspective, this sector is characterized by a moderate to low gravity disturbance (30–35 mGal), distinctly contrasting with the higher anomalies in the surrounding regions.
The gravity disturbance pattern shown in Figure 4A displays a clear correlation with the surface topography. This topographic effect tends to mask the gravity signal associated with variations in rock density, both laterally and with depth, in the mid-to-shallow crust. To isolate the contribution of subsurface density variations, we computed the gravitational effect of the local topography (see Section 3; Figure 5). The amplitude of gravity anomalies directly related to the topographic masses ranges from −43 to 25 mGal, representing the main contribution in the gravity disturbance (Figure 5A). Removing this contribution from the gravity disturbance dataset, we derived the complete Bouguer disturbance (Figure 5B). This correction allows for a clearer interpretation of gravity anomalies that are directly linked to variations in rock density in the mid-shallow crustal layer. The resulting anomalies can be interpreted as increases or decreases in the gravity signal relative to a reference density value, set in our case at 2670 kg/m3 (see Section 5).
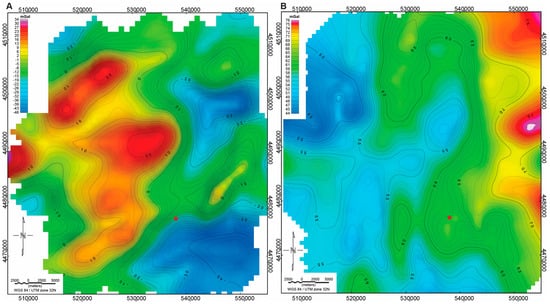
Figure 5.
(A) Gravitational contribution of the topography of the Sos Enattos region (See DEM in Figure 1C). (B) Complete Bouguer disturbance obtained by subtracting the gravity effect of the topography from the gravity disturbance (Figure 4A). The red filled dot identifies the geographical position of the Sos Enattos mining site.
4.2. Airborne Strapdown Data Validation
The strapdown gravity disturbance was compared with gravity estimates derived from the EGM2008 model [59]. This model is a spherical harmonic representation of Earth’s gravity field, with a maximum degree of 2190 and order of 2159. It was constructed using a combination of satellite-derived gravity model (ITG-GRACE mission) and a global dataset of terrestrial, altimetry-derived, and airborne gravity anomalies (i.e., National Geospatial-Intelligence Agency catalogue), averaged on a 5 arc-minute grid.
For this study, the EGM2008 gravity disturbance distribution was extracted using a 2.5 × 2.5 arc-minute resolution and resampled using a grid cell size of 2 km while the airborne gravity data were gridded using a cell size of 1500 m (Figure 4B). The EGM2008 gravity disturbance values range between 21 and 93 mGal, closely aligning with the strapdown gravity disturbance values. Both datasets exhibit a comparable overall pattern, although they differ in spectral content. EGM2008 primarily describes the low-frequency components of the gravity field, which results in a smoother anomaly distribution. In contrast, the strapdown gravity data reveal higher-frequency variations, particularly in the northeastern sector, where local gravity disturbances are more pronounced. Notably, in the central part of the study area (west of Sos Enattos), the EGM2008 anomalies exhibit a pseudo-N–S alignment, a feature clearly marked also in the strapdown pattern (Figure 4). However, short-wavelength gravity variations present in the airborne data, especially in the NE sector, are largely absent in the EGM2008 dataset due to its lower resolution. Despite these differences, both datasets display a consistent gravity decreasing trend in the southeastern sector of the study area. The primary discrepancy between the two maps arises from the high-frequency gravity contributions, which are better resolved and described by the strapdown survey. This difference can be quantitatively assessed through the comparison of the radial averaged power spectral density of the two datasets (Figure 6). The two spectra have a very similar pattern, especially at low wavenumbers (long wavelengths), where both datasets record high power, reflecting the spectral contribution of regional-scale geological features. At higher wavenumbers (shorter wavelengths), however, the strapdown spectrum consistently shows greater power, indicating its enhanced ability to resolve small-scale and localized gravity anomalies; features that are relatively smoother in the EGM2008 spectrum.
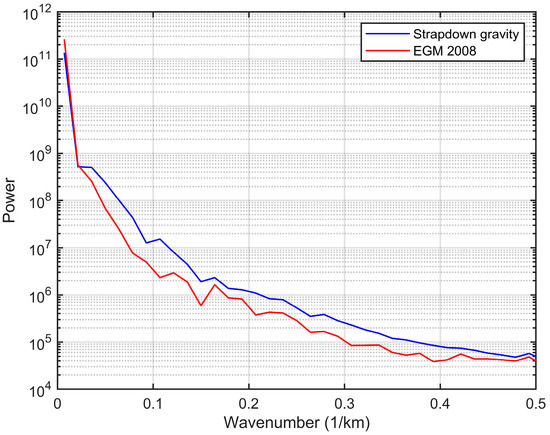
Figure 6.
Semi-log plot of radial average power spectrum of strapdown gravity dataset compared to the EGM2008 model. The two power spectral densities are averaged on the same area using the same spatial resolution.
A detailed depiction of the local gravity field in the Sos Enattos area was obtained through a dedicated ground-based gravity survey (Figure 7). This survey was specifically designed to enhance the gravity signal associated with the shallow structural setting of the target area. The local topographic gradient shows a distinct southeast-to-northwest decreasing trend (Figure 7A), which is closely mirrored by the gravity disturbance pattern recorded in this survey, ranging from 52 to 66 mGal (Figure 7B). However, this local gravity pattern does not fully align with that observed in the strapdown gravity dataset. This discrepancy primarily reflects the different spectral resolutions of the two surveys. The ground-based measurements were collected over an area of approximately 500 m × 300 m, less than half the minimum wavelength resolvable by the strapdown survey, thus capturing higher-frequency variations. To enable a meaning comparison, we selected a subset of ground gravity stations located as close as possible to the airborne survey flight tracks. Specifically, we used data from eight stations located within 5 to 14 m from Line 7 (Figure 7B). In order to compare the datasets on a consistent basis, the ground gravity data were upward continued to the flight altitude of the airborne survey. Both datasets were then rescaled relative to their respective mean values. The resulting profiles exhibit similar overall trends, although their best-fit linear regressions show slight divergence (Figure 8). Nevertheless, the differences between the two datasets range from −2.8 to +1.97 mGal, indicating a good level of agreement and confirming the reliability of the strapdown measurements in capturing local gravity variations.
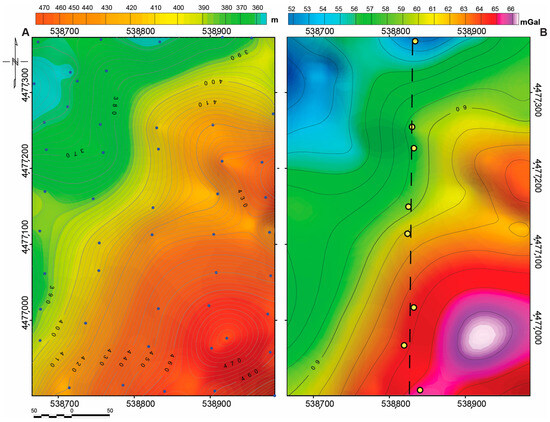
Figure 7.
Ground gravity survey. (A) Topography of the area where terrestrial gravity measurements were conducted (blue filled dots represent measurement stations). (B) Gravity disturbance distribution. The dashed line represents flight line. 7, used for terrestrial–airborne data coherence comparison (see text). Yellow filled dots indicate the subset of terrestrial gravity stations included in the analysis.
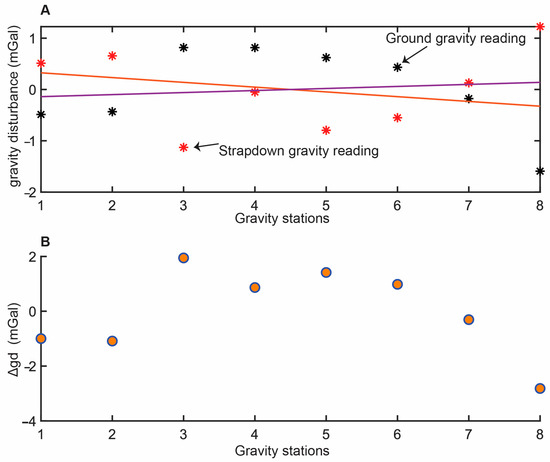
Figure 8.
(A) Comparisons between airborne strapdown gravity disturbance and terrestrial gravity measurements. Airborne data have been linearly interpolated along the track using a 10 m sampling step and then sampled on the same geographical positions of ground gravity measurement. (B) Differences in gravity disturbance between the two datasets.
5. Discussion
5.1. Gravity Disturbance Dataset
The resulting gravity disturbance dataset shows strong compatibility with the gravity disturbance derived from the EGM2008 model. Both datasets (Figure 4) highlight similar long-wavelength gravity features (Figure 6), indicating that they capture the same regional-scale gravitational trends.
A spectral analysis based on the classic Spector and Grant method [62] was used to investigate the depth distribution of the gravity sources across different wavenumber domains. More generally, this technique interprets the slope of the logarithmic radially averaged power spectrum to estimate the average depth of the sources responsible for the potential field anomalies. It was intensively used to interpret magnetic data [63,64,65,66]; however, successful applications to gravity anomalies have been also provided [67,68,69].
Depth vs. wavenumber plots of the two datasets reveal broadly similar patterns (Figure 9). However, the EGM2008-derived data shows sensitivity to deeper sources, with maximum depth estimates reaching approximately 7 km. Most of the spectral power in this dataset is associated with sources between 3 and 2 km depth. In contrast, the strapdown airborne data exhibits a shallower depth range, resolving sources down to approximately 4 km. The larger portion of the spectral energy is concentrated between 1 and 2 km depth, with the shallowest identified sources located at approximately 400–500 m. These results suggest that the strapdown survey was optimized to resolve gravity anomalies generated within the upper ~3.5 km of the crust, offering enhanced resolution of shallow geological structures, particularly in the 1–2 km depth range.
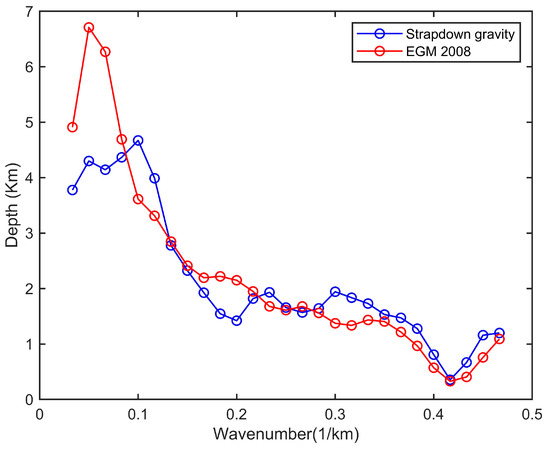
Figure 9.
Estimates of depth positions of the gravity generating sources (ensemble of sources) derived from analysis of radial power spectral density distributions of strapdown gravity disturbance and EGM2008 (see Figure 6).
The airborne strapdown pattern has been also compared with a very local terrestrial gravity investigation (Figure 7B). Although the two datasets are in coherence (see Figure 8 and Section 4) the terrestrial investigation describes a higher spectral contribution which is only in minor part detected also by airborne survey. A further extension of the terrestrial area could improve the coherence in terms of spectral contribution between the two surveys.
In the Sos Enattos area, the Bouguer disturbance ranges from 44 to 76 mGal, with a distinct and intense positive anomaly concentrated in the northeastern sector of the map (Figure 5B). This intense gravity pattern is most likely associated with high density lithologies such as migmatites, amphibolites, and eclogite-bearing units, which crop out in the northern part of the Baronie region [44]. These metamorphic complexes typically show densities ranging from 2800 to 2900 kg/m3, and in some cases exceeding 3000 kg/m3 [51,53], thereby generating significant positive Bouguer anomalies.
The Sos Enattos site is located within a mid-to-high anomaly zone, with local values averaging approximately 60 mGal. Moving northward, the complete Bouguer disturbance decreases to 55 mGal, then increases again to values up to 65 mGal near the northern boundary of the study area.
This peculiar gravity pattern correlates well with the known geological framework, which includes an alternation of granitic intrusions (monzogranites to the south and granodiorites to the north, Figure 1B), and metamorphic layers, including quartzites and amphibolites belonging to the Phyllites of Lula formation (Figure 1B). All these lithologies generally exhibit high density values (>2700 kg/m3), and although the relative density contrasts between the different units can be modest, they can be considered sufficient to produce the observed variations in Bouguer disturbances (Figure 5B).
5.2. Geological Interpretation
A tentative interpretation of the crustal features in the Sos Enattos area was carried out using a 2.5D forward modeling approach applied to the gravity disturbance data (Figure 10). This method allows for the definition of both the geometry and depth of causative bodies along a linear profile (see Section 3). The selected profile crosses the Sos Enattos mining site, intersecting both granitic intrusions and metamorphic units, as previously discussed. Along this profile, the gravity disturbance ranges from 19 to 84 mGal, with a mean value of approximately 49.5 mGal.
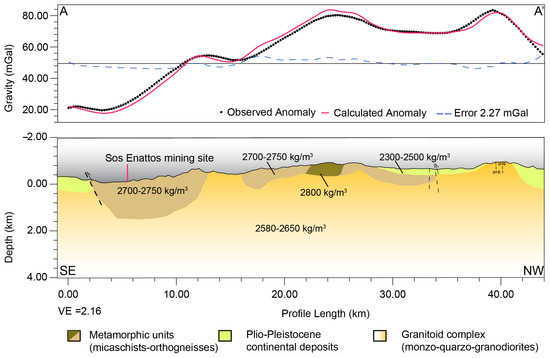
Figure 10.
A 2.5D gravity forward model of the Sos Enattos region and surrounding areas. The observed gravity profile is obtained by sampling every approximate 220 m the gridded gravity disturbance along the track A-A’ (see its location in Figure 1B and Figure 4A). The main structural/tectonic elements are derived from planar tracks reported in Figure 1B (data from Castamagna [46]).
The results of the forward model reveal the presence of causative bodies extending to depths of approximately 3500 m, in agreement with findings from the spectral analysis. As a general observation, the model reveals a configuration in which granitic complexes are underlain by older, higher density metamorphic units; a set-up consistent with a general compressive tectonic regime (i.e., see cross-section in [47]).
The best fit was obtained by modeling a granitic basement characterized by densities ranging from 2580 to 2650 kg/m3. This density range is consistent with the values reported for monzogranites/mylonites from central Sardinia (Monte Ghirri; [70]), as well as for granitic rocks associated with the Alpine system and Precambrian assemblages [52,53]
In the southern sector, the model includes an upper layer of high-density rocks (approximately 2700–2750 kg/m3) attributed to the metamorphic unit of the Lula province (see Figure 1B). Near the Sos Enattos site, this layer reaches a maximum thickness of approximately 1500–1800 m. In this sector, the contact between the metamorphic units and the granites is characterized by a transpressive fault system. This structural feature represents a major tectonic element, named north Nuoro Fault, which bounds the north portion of Nuoro nappe [49]. Its planar expression is visible in Figure 1B.
The 2.5D gravity model suggests a vertical extension of the lithological contact of approximately 1.5 km, which may correspond to the vertical displacement associated with the reverse fault. Although the model resolution does not allow for detailed crustal reconstruction at greater depths, it is important to note that this tectonic/lithological boundary appears sub-vertical and is located at a considerable distance from the Sos Enattos target site. This suggests that the area of interest is not affected by intense deformation associated with major fault systems.
Toward the center of the profile, granite outcrops are alternately overlain by the metamorphic units, with narrow intervening enclaves of orthogneiss (2800 kg/m3, see also Figure 1B).
In the northern sector, the granitoid units reach near-surface levels, with an overlying low-density tabular unit interpreted as a Plio-Pleistocene sedimentary cover (2300–2500 kg/m3). In this region, high density bodies are interpreted as metamorphic enclaves embedded within the granitic basement. The two units appear to be in contact due to another fault system (the junction between the Tavolara and Posada faults), which exhibits both transcurrent and compressive movements [45]. Similar to the Nuoro fault, this structural element deforms the basement by laterally juxtaposing lithologies of different ages, compositions, and significant density contrasts. This results in gravity signal variations, which are also detected through the modeling.
The inferred distribution of causative sources allows for a good fit between the observed and modeled gravity data, with a residual misfit ranging from −4.03 to 3.51 mGal, a mean of −0.014 mGal, and a standard deviation of 2.27 mGal.
This misfit indicates a reasonably good agreement between the observed and calculated gravity profiles. However, the error distribution reflects an integrated measure of uncertainty, encompassing both lateral density variations and vertical structural ambiguities. As is typical in potential field methods (e.g., gravity and magnetics), the spatial resolution decreases with depth, and this limitation is also reflected in forward modeling outcomes.
In our case, the model is best constrained in the upper 3 km, where lateral density variations can be more reliably resolved. Based on sensitivity tests, we estimate that density variations below ~3 km depth have only a minor impact on the modeled gravity response, and therefore, these deeper structures may remain poorly constrained. A more accurate fit could be achieved but this would require a finer-scale distribution of causative bodies (i.e., increase the scattering of density distribution) and a highly detailed knowledge of the local geology, particularly in the depth, which is not easily feasible.
6. Conclusions
In this study, we present the results of an airborne gravity survey conducted in winter 2024 in the Sos Enattos region, the Italian candidate site for the potential installation of the Einstein Telescope infrastructure. The iCORUS-02 strapdown gravity system has successfully captured high-resolution gravity anomalies that reflect the complex mid-to-shallow crustal structure associated with the tectonic and geological framework of northeastern Sardinia. The comparison between the airborne dataset and the EGM2008 gravity field model shows that, while both datasets reveal consistent large-scale gravity trends, the strapdown survey provides a significantly higher resolution. This allows it to resolve short-wavelength gravity anomalies that are not captured by the lower-resolution global model, underlining the enhanced capability of the iCORUS-02 system. Moreover, the comparison between airborne and ground-based gravity data reveals strong consistency, with only minor differences attributable to the varying spectral sensitivities of the two approaches.
Spectral analysis of the strapdown dataset has provided insight about the depth distribution of gravity sources, indicating that the proposed strapdown survey is optimized for resolving anomalies within the upper 3 km of the crust, with a particular focus on sources in the 1–2 km depth range. Interpretative forward modeling indicates that the observed gravity patterns are primarily controlled by the alternation of lithologies belonging into the Variscan basement, the main geologic–tectonic structure of the entire eastern Sardinia.
Advancements, Limitations and Future Developments
This study represents the first airborne gravity survey ever conducted over NE Sardinia, and the only one documented in the literature. The acquisition was performed using a modern strapdown gravimetric system, representing a significant technological advancement over earlier gravity studies in the region, which relied exclusively on ground-based measurements from the 1980s. The instrumental accuracy, at 1 mGal, is among the best currently achievable for airborne gravity, and the estimated noise floor of ~0.3 mGal/√Hz indicates a stable and high-quality acquisition.
One of the key strengths of this survey lies in its ability to provide regional-scale gravity coverage, including areas previously inaccessible by ground methods, such as Monte Albo. This improved spatial coverage offers new insights into the subsurface structure of the study region, filling critical data gaps left by older (other type) surveys.
Moreover, the airborne gravity data exhibit a good consistency with the EGM 2008 global models, while also showing enhanced resolution. This suggests that the new dataset can be used to the existent geoid model, which are essential for geodetic and geophysical applications.
From a structural interpretation perspective, the survey data allow mapping of crustal features down to approximately 3 km depth, providing new information on the lateral and vertical variability of subsurface units. The forward model provides a crustal reconstruction that also aligns with the structural setting, highlighting the presence of major tectonic elements such as the north Nuoro fault system. This fault places granitic and metamorphic units in contact just south of the Sos Enattos area. The model identifies a sub-vertical fault geometry, with an estimated vertical displacement of 1–1.5 km, and a lithological contact that deepens and flattens at approximately 1.8 km depth. These findings suggest a thick, compact, and structurally stable geological setting for the Sos Enattos mining site, which does not appear to be significantly affected (at depth) by intense deformation related to major fault systems.
This supports the conclusion that the site is located in a regionally stable geological setting, reinforcing its candidacy for hosting the Einstein Telescope (ET) from a geophysical point of view.
Despite these achievements, the study also has inherent limitations. The survey was conducted at an altitude of approximately 1800 m with moderate aircraft velocity, leading to an effective spatial resolution (spectral bandwidth) of around 3 km. While sufficient for regional-scale interpretation, this limits the ability to resolve fine-scale subsurface features, especially at shallow depths. Terrestrial gravity data were used to validate the airborne measurements and support regional interpretation. However, the limited spatial extent of this survey area does not allow for detailed modeling at the depth level (approximately 200–300 m) which is directly relevant for ET tunnel excavation planning.
Several future activities are thus planned to improve the knowledge of the site:
- −
- Expand the ground gravity survey to provide higher-resolution coverage in critical zones;
- −
- Conduct additional airborne gravity flights at lower altitude and slower speed, to increase spatial resolution;
- −
- Integrate complementary geophysical methods, including electrical resistivity tomography (ERT) and magnetic surveys using UAV-based platforms, to enhance geological modeling.
The integration of these new data will enable a more comprehensive interpretation of the subsurface geological structures, strengthening the scientific background supporting this region as a candidate site for the Einstein Telescope infrastructure.
Supplementary Materials
The following supporting information can be downloaded at: https://www.mdpi.com/article/10.3390/rs17132309/s1, Supplementary Text: Noise Level Estimation; Figure S1: Power Spectra density of Line number 10; Figure S2: Histogram of noise floor levels across all gravity survey lines; Table S1: Cross over error estimation of the airborne gravity data in the Sos Enattos region.
Author Contributions
Conceptualization, F.M., L.C., F.G. and M.M.; methodology, L.C. and F.M.; formal analysis, L.C., F.M., F.G., A.B. and P.J.V.D.; investigation, F.M., F.G., L.F., A.A.M., L.T.M., M.C. (Matteo Cagnizi) and D.C. (Danilo Contrafatto); resources, F.G., M.M., M.C. (Mauro Coltelli), A.Z., E.R. and M.N.; data curation, L.C. and F.M.; writing—original draft preparation, L.C., F.M., F.G., A.B., A.Z., M.M. and M.N.; supervision, L.C., M.M., F.G. and F.M.; project administration, M.M., F.G. and A.Z.; funding acquisition, F.G., M.M., A.Z., E.R., M.N. and D.C. (Daniele Carbone). All authors have read and agreed to the published version of the manuscript.
Funding
This research was funded by the project PRIN2022 nr. 2022JLJ54N-01 (P.I. Filippo Greco).
Data Availability Statement
The data are subject to two years of embargo.
Acknowledgments
Authors would to thank personnel of CGR Spa for their support on the airborne acquisition.
Conflicts of Interest
The authors declare no conflicts of interest.
References
- Aghajani, H.; Moradzadeh, A.; Zeng, H. Detection of High-Potential Oil and Gas Fields Using Normalized Full Gradient of Gravity Anomalies: A Case Study in the Tabas Basin, Eastern Iran. Pure Appl. Geophys. 2011, 168, 1851–1863. [Google Scholar] [CrossRef]
- Lv, Q.; Zheng, A.; Liang, X.; Chen, H.; Ju, S.; Meng, Y.; Zhang, H.; He, G.; Deng, S.; Li, J. Research on Remaining Oil Characterization in Superheavy Oil Reservoir by Microgravity Exploration. Geofluids 2022, 2022, 1–10. [Google Scholar] [CrossRef]
- Huang, X.; Chen, Q.; Chen, H.; Zhu, J.; Li, G. Features of Gravity Anomalies and Oil-Gas Distribution Rules in Central and Western Sichuan Basin, China. Processes 2023, 11, 1200. [Google Scholar] [CrossRef]
- Mather, R.S. The role of the geoid in four-dimensional geodesy. Mar. Geod. 1978, 1, 217–252. [Google Scholar] [CrossRef]
- Sansò, F.; Sideris, M.G. Geoid Determination: Theory and Methods, 1st ed.; Springer Science & Business Media: Berlin/Heidelberg, Germany, 2013. [Google Scholar]
- Johannessen, J.A.; Balmino, G.; Le Provost, C.; Rummel, R.; Sabadini, R.; Sünkel, H.; Tscherning, C.; Visser, P.; Woodworth, P.; Hughes, C.; et al. The European Gravity Field and Steady-State Ocean Circulation Explorer Satellite Mission: Its Impact on Geophysics. Surv. Geophys. 2003, 24, 339–386. [Google Scholar] [CrossRef]
- Tapley, B.D.; Bettadpur, S.; Watkins, M.; Reigber, C. The gravity recovery and climate experiment: Mission overview and early results. Geophys. Res. Lett. 2004, 31, L09607. [Google Scholar] [CrossRef]
- Han, S.-C.; Shum, C.K.; Bevis, M.; Ji, C.; Kuo, C.-Y. Crustal Dilatation Observed by GRACE After the 2004 Sumatra-Andaman Earthquake. Science 2006, 313, 658–662. [Google Scholar] [CrossRef]
- Panet, I.; Pajot-Métivier, G.; Greff-Lefftz, M.; Métivier, L.; Diament, M.; Mandea, M. Mapping the mass distribution of Earth’s mantle using satellite-derived gravity gradients. Nat. Geosci. 2014, 7, 131–135. [Google Scholar] [CrossRef]
- Khorrami, M.; Shirzaei, M.; Ghobadi-Far, K.; Werth, S.; Carlson, G.; Zhai, G. Groundwater Volume Loss in Mexico City Constrained by InSAR and GRACE Observations and Mechanical Models. Geophys. Res. Lett. 2023, 50, e2022GL101962. [Google Scholar] [CrossRef]
- Abdelmohsen, K.; Sultan, M.; Yan, E.; Abotalib, A.Z.; Save, H.; Emil, M.; Elhaddad, H.; Abdelmalik, K.; Romanowicz, B. Watching the Grand Ethiopian Renaissance Dam from a distance: Implications for sustainable water management of the Nile water. PNAS Nexus 2024, 3, pgae219. [Google Scholar] [CrossRef]
- Ferraccioli, F.; Finn, C.A.; Jordan, T.A.; Bell, R.E.; Anderson, L.M.; Damaske, D. East Antarctic rifting triggers uplift of the Gamburtsev Mountains. Nature 2011, 479, 388–392. [Google Scholar] [CrossRef] [PubMed]
- Novák, P.; Kern, M.; Schwarz, K.-P.; Sideris, M.; Heck, B.; Ferguson, S.; Hammada, Y.; Wei, M. On geoid determination from airborne gravity. J. Geodesy 2003, 76, 510–522. [Google Scholar] [CrossRef]
- Wang, Y.M.; Sánchez, L.; Ågren, J.; Huang, J.; Forsberg, R.; Abd-Elmotaal, H.A.; Ahlgren, K.; Barzaghi, R.; Bašić, T.; Carrion, D.; et al. Colorado geoid computation experiment: Overview and summary. J. Geod. 2021, 95, 1–21. [Google Scholar] [CrossRef]
- Barzaghi, R.; Borghi, A.; Keller, K.; Forsberg, R.; Giori, I.; Loretti, I.; Olesen, A.V.; Stenseng, L. Airborne gravity tests in the Italian area to improve the geoid model of Italy. Geophys. Prospect. 2009, 57, 625–632. [Google Scholar] [CrossRef]
- LaCoste, L.; Ford, J.; Bowles, R.; Archer, K. Gravity measurements in an airplane using state-of-the-art navigation and altimetry. Geophysics 1982, 47, 832–838. [Google Scholar] [CrossRef]
- Brozena, J.M. The Greenland Aerogeophysics Project: Airborne Gravity, Topographic and Magnetic Mapping of an Entire Continent. In From Mars to Greenland: Charting Gravity With Space and Airborne Instruments; Colombo, O.L., Ed.; International Association of Geodesy Symposia; Springer: New York, NY, USA, 1992; Volume 110, pp. 203–214. ISBN 978-0-387-97857-4. [Google Scholar]
- Forsberg, R.; Kenyon, S. Evaluation and Downward Continuation of Airborne Gravity Data-the Greenland Example. In Proceedings of the International Symposium on Kinematic Systems in Geodesy, Geomatics and Navigation (KIS94), Banff, AB, Canada, 30 August–2 September 1994; pp. 531–538. [Google Scholar]
- Gumert, W.R. An historical review of airborne gravity. Lead. Edge 1998, 17, 113–116. [Google Scholar] [CrossRef]
- Bell, R.E.; Coakley, B.J.; Stemp, R.W. Airborne gravimetry from a small twin engine aircraft over the Long Island Sound. Geophysics 1991, 56, 1486–1493. [Google Scholar] [CrossRef]
- Bell, R.E.; Childers, V.A.; Arko, R.A.; Blankenship, D.D.; Brozena, J.M. Airborne gravity and precise positioning for geologic applications. J. Geophys. Res. 1999, 104, 15281–15292. [Google Scholar] [CrossRef]
- Wei, M.; Schwarz, K.P. Flight test results from a strapdown airborne gravity system. J. Geod. 1998, 72, 323–332. [Google Scholar] [CrossRef]
- Glennie, C.L.; Schwarz, K.P.; Bruton, A.M.; Forsberg, R.; Olesen, A.V.; Keller, K. A comparison of stable platform and strapdown airborne gravity. J. Geod. 2000, 74, 383–389. [Google Scholar] [CrossRef]
- Ayres-Sampaio, D.; Deurloo, R.; Bos, M.; Magalhães, A.; Bastos, L. A Comparison Between Three IMUs for Strapdown Airborne Gravimetry. Surv. Geophys. 2015, 36, 571–586. [Google Scholar] [CrossRef]
- Jensen, T.E.; Forsberg, R. Helicopter Test of a Strapdown Airborne Gravimetry System. Sensors 2018, 18, 3121. [Google Scholar] [CrossRef]
- Jensen, T.E.; Olesen, A.V.; Forsberg, R.; Olsson, P.-A.; Josefsson, Ö. New Results from Strapdown Airborne Gravimetry Using Temperature Stabilisation. Remote. Sens. 2019, 11, 2682. [Google Scholar] [CrossRef]
- Kwon, J.H.; Jekeli, C. A new approach for airborne vector gravimetry using GPS/INS. J. Geod. 2001, 74, 690–700. [Google Scholar] [CrossRef]
- Zhao, L.; Forsberg, R.; Wu, M.; Olesen, A.V.; Zhang, K.; Cao, J. A Flight Test of the Strapdown Airborne Gravimeter SGA-WZ in Greenland. Sensors 2015, 15, 13258–13269. [Google Scholar] [CrossRef]
- Jordan, T.A.; Becker, D. Investigating the distribution of magmatism at the onset of Gondwana breakup with novel strapdown gravity and aeromagnetic data. Phys. Earth Planet. Inter. 2018, 282, 77–88. [Google Scholar] [CrossRef]
- Tinto, K.J.; Padman, L.; Siddoway, C.S.; Springer, S.R.; Fricker, H.A.; Das, I.; Tontini, F.C.; Porter, D.F.; Frearson, N.P.; Howard, S.L.; et al. Ross Ice Shelf response to climate driven by the tectonic imprint on seafloor bathymetry. Nat. Geosci. 2019, 12, 441–449. [Google Scholar] [CrossRef]
- Villani, F.; Maraio, S.; Improta, L.; De Martini, P.; Cavallaro, D.; Carlino, M.F.; Brunori, C.; Longo, V.; Casini, L.; Caradonna, M.; et al. Subsurface characterization of crystalline rocks at the Einstein Telescope candidate site (Italy): Insights from seismic tomography, geoelectrical and morphostructural analyses. Tectonophysics 2025, 911, 230830. [Google Scholar] [CrossRef]
- Saccorotti, G.; Giunchi, C.; D’aMbrosio, M.; Gaviano, S.; Naticchioni, L.; D’uRso, D.; Rozza, D.; Cardini, A.; Contu, A.; Dordei, F.; et al. Array analysis of seismic noise at the Sos Enattos mine, the Italian candidate site for the Einstein Telescope. Eur. Phys. J. Plus 2023, 138, 793. [Google Scholar] [CrossRef]
- Di Giovanni, M.; Giunchi, C.; Saccorotti, G.; Berbellini, A.; Boschi, L.; Olivieri, M.; De Rosa, R.; Naticchioni, L.; Oggiano, G.; Carpinelli, M.; et al. A Seismological Study of the Sos Enattos Area—The Sardinia Candidate Site for the Einstein Telescope. Seism. Res. Lett. 2021, 92, 352–364. [Google Scholar] [CrossRef]
- Punturo, M.; Abernathy, M.; Acernese, F.; Allen, B.; Andersson, N.; Arun, K.; Barone, F.; Barr, B.; Barsuglia, M.; Beker, M.; et al. The third generation of gravitational wave observatories and their science reach. Class. Quantum Gravity 2010, 27, 084007. [Google Scholar] [CrossRef]
- Abbott, B.P.; Abbott, R.; Abbott, T.D.; Abernathy, M.R.; Acernese, F.; Ackley, K.; Adams, C.; Adams, T.; Addesso, P.; Adhikari, R.X.; et al. Observation of Gravitational Waves from a Binary Black Hole Merger. Phys. Rev. Lett. 2016, 116, 061102. [Google Scholar] [CrossRef]
- Naticchioni, L.; Boschi, V.; Calloni, E.; Capello, M.; Cardini, A.; Carpinelli, M.; Cuccuru, S.; D’aMbrosio, M.; de Rosa, R.; Di Giovanni, M.; et al. Characterization of the Sos Enattos Site for the Einstein Telescope. J. Phys. Conf. Ser. 2020, 1468, 012242. [Google Scholar] [CrossRef]
- Janssens, K.; Boileau, G.; Christensen, N.; van Remortel, N.; Badaracco, F.; Canuel, B.; Cardini, A.; Contu, A.; Coughlin, M.W.; Decitre, J.-B.; et al. Correlated 0.01–40 Hz seismic and Newtonian noise and its impact on future gravitational-wave detectors. Phys. Rev. D 2024, 109, 102002. [Google Scholar] [CrossRef]
- Rovida, A.N.; Albini, P.; Locati, M.; Antonucci, A. Insights into Preinstrumental Earthquake Data and Catalogs in Europe. Seism. Res. Lett. 2020, 91, 2546–2553. [Google Scholar] [CrossRef]
- Gorshkov, A.; Panza, G.F.; Soloviev, A.; Brandmayr, E. On the seismic potential of the Corsica–Sardinia block. Rend. Lincei Sci. Fis. Nat. 2021, 32, 715–728. [Google Scholar] [CrossRef]
- Sartori, R. Corsica—Sardinia Block and the Tyrrhenian Sea. In Anatomy of an Orogen: The Apennines and Adjacent Mediterranean Basins; Vai, G.B., Martini, I.P., Eds.; Springer: Dordrecht, The Netherlands, 2001; pp. 367–374. ISBN 978-90-481-4020-6. [Google Scholar]
- Rosenbaum, G.; Lister, G.S.; Duboz, C. Relative motions of Africa, Iberia and Europe during Alpine orogeny. Tectonophysics 2002, 359, 117–129. [Google Scholar] [CrossRef]
- Faccenna, C.; Speranza, F.; Caracciolo, F.D.; Mattei, M.; Oggiano, G. Extensional tectonics on Sardinia (Italy): Insights into the arc–back-arc transitional regime. Technophysics 2002, 356, 213–232. [Google Scholar] [CrossRef]
- Carmignani, L.; Oggiano, G.; Barca, S.; Conti, P.; Salvadori, I.; Eltrudis, A.; Funedda, A.; Pasci, S. Geologia Della Sardegna: Note Illustrative Della Carta Geologica Della Sardegna in Scala 1: 200,000. Mem. Descr. Della Carta Geol. Ital. 2001, 60, 1–283. [Google Scholar]
- Carmignani, L.; Oggiano, G.; Funedda, A.; Conti, P.; Pasci, S. The geological map of Sardinia (Italy) at 1:250,000 scale. J. Maps 2016, 12, 826–835. [Google Scholar] [CrossRef]
- Conti, P.; Carmignani, L.; Oggiano, G. From thickening to extension in the Variscan belt—kinematic evidence from Sardinia (Italy). Terra Nova 1999, 11, 93–99. [Google Scholar] [CrossRef]
- Conte, A.M.; Cuccuru, S.; D’ANtonio, M.; Naitza, S.; Oggiano, G.; Secchi, F.; Casini, L.; Cifelli, F. The post-collisional late Variscan ferroan granites of southern Sardinia (Italy): Inferences for inhomogeneity of lower crust. Lithos 2017, 294-295, 263–282. [Google Scholar] [CrossRef]
- Cocco, F.; Oggiano, G.; Funedda, A.; Loi, A.; Casini, L. Stratigraphic, magmatic and structural features of Ordovician tectonics in Sardinia (Italy): A review. J. Iber. Geol. 2018, 44, 619–639. [Google Scholar] [CrossRef]
- Oggiano, G.; Funedda, A.; Carmignani, L.; Pasci, S. The Sardinia-Corsica microplate and its role in the Northern ApennineGeodynamics: New insights from the Tertiary intraplate strike-slip tectonics of Sardinia. Ital. J. Geosci. 2009, 128, 527–539. [Google Scholar] [CrossRef]
- Costamagna, L.G. Sardinia and the Alpine cycle: A tectono-sedimentary history at the Western Tethys edge. Earth Sci. Rev. 2023, 247, 104591. [Google Scholar] [CrossRef]
- Allocca, A.; Avino, S.; Calloni, E.; Caprara, S.; Carpinelli, M.; D’uRso, D.; De Laurentis, M.; De Rosa, R.; Errico, L.; Gagliardi, G.; et al. Picoradiant tiltmeter and direct ground tilt measurements at the Sos Enattos site. Eur. Phys. J. Plus 2021, 136, 1069. [Google Scholar] [CrossRef]
- Smithson, S.B. Densities of metamorphic rocks. Geophysics 1971, 36, 690–694. [Google Scholar] [CrossRef]
- Wenk, H.-R.; Wenk, E. Physical constants of alpine rocks (density, porosity, specific heat, thermal diffusivity and conductivity). ETH Zurich 1969, 49, 343–357. [Google Scholar] [CrossRef]
- Subrahmanyam, C.; Verma, R. Densities and Magnetic Susceptibilities of Precambrian Rocks of Different Metamorphic Grade (Southern Indian Shield). J. Geophys. 1981, 49, 101–107. [Google Scholar]
- Ferri, F.; Ventura, R.; Coren, F.; Zanolla, C. Gravity Map of Italy and Surrounding Seas, Carta Gravimetrica d’Italia 1:1.250.000; APAT: Rome, Italy, 2005. [Google Scholar]
- Greco, F.; Berrino, G.; Riguzzi, F.; Mazzoni, A.; Amendola, M.; Carbone, D.; Contrafatto, D.; Dardanelli, G.; Brutto, M.L.; Maltese, A.; et al. The first absolute gravity and height reference network in Sicily. Sci. Data 2024, 11, 357. [Google Scholar] [CrossRef]
- Jekeli, C. Inertial Navigation Systems with Geodetic Applications; Walter de Gruyter GmbH & Co KG: Berlin, Germany, 2001. [Google Scholar]
- Torge, W.; Müller, J. Geodesy, 4th ed.; Walter de Gruyter GmbH & Co KG: Berlin, Germany, 2012; ISBN 978-3-11-020718-7. [Google Scholar]
- Parker, R.L. The Rapid Calculation of Potential Anomalies. Geophys. J. Int. 1973, 31, 447–455. [Google Scholar] [CrossRef]
- Pavlis, N.K.; Holmes, S.A.; Kenyon, S.C.; Factor, J.K. The development and evaluation of the Earth Gravitational Model 2008 (EGM2008). J. Geophys. Res. Solid Earth 2012, 117, 2011JB008916. [Google Scholar] [CrossRef]
- Cocchi, L.; Masetti, G.; Muccini, F.; Carmisciano, C. Geophysical mapping of Vercelli Seamount: Implications for Miocene evolution of the Tyrrhenian back arc basin. Geosci. Front. 2016, 7, 835–849. [Google Scholar] [CrossRef]
- Cocchi, L.; Passaro, S.; Caratori Tontini, F.; Ventura, G. Volcanism in slab tear faults is larger than in island-arcs and back-arcs. Nat. Commun. 2017, 8, 1451. [Google Scholar] [CrossRef] [PubMed]
- Spector, A.; Grant, F.S. Statistical Models for Interpreting Aeromagnetic Data. Geophysics 1970, 35, 293–302. [Google Scholar] [CrossRef]
- Hildenbrand, T.G.; Rosenbaum, J.G.; Kauahikaua, J.P. Aeromagnetic study of the Island of Hawaii. J. Geophys. Res. 1993, 98, 4099–4119. [Google Scholar] [CrossRef]
- Okubo, Y.; Matsunaga, T. Curie point depth in northeast Japan and its correlation with regional thermal structure and seismicity. J. Geophys. Res. 1994, 99, 22363–22371. [Google Scholar] [CrossRef]
- Chiozzi, P.; Matsushima, J.; Okubo, Y.; Pasquale, V.; Verdoya, M. Curie-point depth from spectral analysis of magnetic data in central–southern Europe. Phys. Earth Planet. Inter. 2005, 152, 267–276. [Google Scholar] [CrossRef]
- Kelemework, Y.; Fedi, M.; Milano, M. A review of spectral analysis of magnetic data for depth estimation. Geophysics 2021, 86, J33–J58. [Google Scholar] [CrossRef]
- Maus, S.; Dimri, V.P. Scaling properties of potential fields due to scaling sources. Geophys. Res. Lett. 1994, 21, 891–894. [Google Scholar] [CrossRef]
- Shamim, S.; Khan, P.K.; Mohanty, S.P.; Mohanty, M. Andaman–Nicobar–Sumatra Margin Revisited: Analysis of the Lithospheric Structure and Deformation Based on Gravity Modeling and Distribution of Seismicity. Surv. Geophys. 2021, 42, 239–275. [Google Scholar] [CrossRef]
- Root, B.; Novák, P.; Dirkx, D.; Kaban, M.; van der Wal, W.; Vermeersen, L. On a spectral method for forward gravity field modelling. J. Geodyn. 2016, 97, 22–30. [Google Scholar] [CrossRef]
- Columbu, S.; Cruciani, G.; Fancello, D.; Franceschelli, M.; Musumeci, G. Petrophysical properties of a granite-protomylonite-ultramylonite sequence: Insight from the Monte Grighini shear zone, central Sardinia, Italy. Eur. J. Miner. 2015, 27, 471–486. [Google Scholar] [CrossRef]
Disclaimer/Publisher’s Note: The statements, opinions and data contained in all publications are solely those of the individual author(s) and contributor(s) and not of MDPI and/or the editor(s). MDPI and/or the editor(s) disclaim responsibility for any injury to people or property resulting from any ideas, methods, instructions or products referred to in the content. |
© 2025 by the authors. Licensee MDPI, Basel, Switzerland. This article is an open access article distributed under the terms and conditions of the Creative Commons Attribution (CC BY) license (https://creativecommons.org/licenses/by/4.0/).