Abstract
Guangxi is among China’s regions most severely affected by karst rocky desertification (KRD). Over the past two decades, global climate change and human activities have jointly led to significant changes in the extent and intensity of KRD in Guangxi. Given this context, it is crucial to comprehensively analyze the spatiotemporal evolution of KRD in Guangxi and its driving forces. This study proposed a novel three-dimensional feature space model for monitoring KRD in Guangxi. We then applied transition matrices, dynamic degree indices, and landscape metrics to analyze the spatiotemporal evolution of KRD. We also proposed a Spatiotemporal Interaction Intensity Index (STII) to quantify mutual influences among KRD patches. Finally, we used GeoDetector to analyze the driving factors of KRD. The results indicate the following: (1) The three-dimensional model showed high applicability for large-scale KRD monitoring, with an overall accuracy of 92.86%. (2) KRD in Guangxi exhibited an overall recovery–deterioration–recovery trend from 2000 to 2023. The main recovery phases were 2005–2015 and 2020–2023. During these phases, both severe and moderate KRD showed strong signals of recovery, including significant declines in area, number of patches, and Landscape Shape Index, along with persistently low STII values. In contrast, from 2015 to 2020, KRD predominantly deteriorated, primarily characterized by transitions from no KRD to potential KRD and from potential KRD to light KRD. (3) For severe KRD patches, the intensity of interaction required from neighboring patches to promote recovery exceeded that which led to deterioration, indicating the difficulty of reversing severe KRD. (4) Slope, land use, and elevation were the main drivers of KRD in Guangxi from 2000 to 2023. Erosive rainfall exhibited a higher explanatory power for KRD than average precipitation. Two-factor interactions significantly enhanced the driving forces of KRD. These findings provide a scientific basis for KRD management.
1. Introduction
Karst rocky desertification (KRD) is one form of desertification and refers to the process whereby a karst region, originally covered by vegetation and soil, becomes an almost barren rock surface with minimal soil and vegetation cover [1]. KRD is often called the “cancer of the Earth”. It not only causes severe damage to the ecological environment and significantly increases the risk of disasters, such as floods, droughts, and landslides [2], but also adversely affects agricultural and forestry production and exacerbates poverty issues [1]. KRD has become a critical global ecological and socioeconomic challenge. The karst landscape in southwestern China covers approximately 540,000 km2, making it one of the three largest karst regions in the world [3,4,5]. The combination of natural processes and human activities has led to severe KRD in the region, greatly jeopardizing ecological security and sustainable development [4,6,7]. Therefore, it is imperative to accurately monitor KRD and comprehensively analyze its spatiotemporal evolution and driving factors, thereby providing the data and theoretical support necessary for formulating effective KRD control policies.
Extensive studies have been conducted on the monitoring of KRD, its spatiotemporal evolution, and its driving factors [8,9]. With regard to the monitoring of KRD, early research primarily relied on field investigations. While this method provides precise and reliable data, it suffers from limitations, such as restricted line-of-sight, poor accessibility, and prohibitive labor and time costs, rendering it unsuitable for multi-temporal, large-scale KRD monitoring [10,11]. Against this background, remote sensing has gradually become the dominant technique for KRD monitoring due to its wide coverage, diverse detection methods, minimal terrain constraints, and cost-effectiveness [11]. The evolution from field investigations to remote sensing has significantly improved the efficiency and scalability of KRD monitoring. Currently, remote-sensing-based monitoring methods mainly include the evaluation index method, spectral mixture analysis (SMA), machine learning methods, and feature space methods. Each of these exhibits distinct advantages, limitations, and applicability. The evaluation index method typically establishes hierarchical indices based on spectral characteristics and then iteratively adjusts thresholds to extract targets. This method is easy to implement and interpret, making it suitable for large-scale monitoring [7]. However, its accuracy is limited. SMA is recognized as an effective approach for addressing mixed-pixel challenges [12]. However, the accuracy of SMA depends heavily on the selection of endmembers. In karst areas, factors such as discontinuous topography distribution, anthropogenic activities, and weathering contribute to widespread endmember variability. Obtaining a sufficient number of characteristic endmembers remains challenging under these conditions. Consequently, SMA cannot easily be used to monitor KRD in highly heterogeneous karst areas [11,13]. Machine learning methods can automatically handle complex nonlinear relationships and are widely used in remote sensing classification. However, they often exhibit high computational complexity, and constructing robust models typically requires large amounts of high-quality and balanced training data [14,15]. This poses challenges in karst regions, where field-labeled samples are often scarce and imbalanced across different KRD severity levels. Feature space models offer a potential solution to these challenges. In contrast, feature space models are more interpretable, computationally efficient, require fewer labeled samples, and allow for intuitive understanding of the relationships among indicators. Recent years have witnessed growing scholarly interest in feature space methods for monitoring KRD. For example, Wen et al. [16] established the albedo-LST feature space model for monitoring KRD in Dafang County, Guizhou Province, from 1986 to 2019. Guo et al. [17] developed the kNDVI-BLI feature space to monitor KRD in Qixingguan District, Guizhou Province, from 2018 to 2022. However, the following two limitations persist in current research: (1) Research predominantly operates at the KRD pilot and county levels, with limited application to large-scale macro provinces. (2) Conventional two-dimensional feature spaces, relying on linear assumptions between paired feature parameters, inadequately capture the complex interactions among vegetation, bare rock, and soil, which are key factors in KRD. These limitations often result in reduced classification accuracy and poor performance in highly heterogeneous karst regions, highlighting the necessity of developing advanced three-dimensional feature space models to enhance the accuracy of KRD monitoring across large and heterogeneous karst regions.
With regard to the spatiotemporal evolution of KRD, current research commonly utilizes transition matrices and dynamic degree indices to investigate areal changes and intensity variations in KRD processes across distinct temporal phases. For example, Wu et al. [7] analyzed the spatiotemporal evolution of KRD in Panzhou city, Guizhou Province, from 2000 to 2020, utilizing transition matrices and dynamic degree indices. Similarly, Guo et al. [6] examined the spatiotemporal patterns of KRD in Bijie city, Guizhou Province, from 1985 to 2020, employing transition matrices. However, current research primarily exhibits the following two limitations: (1) Relatively little attention has been paid to landscape pattern analysis [18]. Landscapes are shaped by the combined influence of ecological processes [19], and their spatial configurations are closely linked to KRD processes. Landscape metrics can quantitatively characterize the spatial heterogeneity of KRD, such as patch aggregation degree (quantified by the Aggregation Index, AI) and edge complexity (represented by the Landscape Shape Index, LSI) [20]. Incorporating landscape pattern analysis methods is expected to facilitate a deeper understanding of the spatiotemporal patterns in KRD evolution. (2) Existing studies predominantly focus on attribute changes of KRD pixels while neglecting spatiotemporal interactions among KRD patches. Such interactions are critical for understanding ecological connectivity and restoration potential. Thus, a new index capable of quantifying patch-level interactions is needed to deepen insights into landscape-scale KRD dynamics.
With regard to the driving factors of KRD, early studies primarily focused on a single natural or anthropogenic factor, such as lithology, soil, precipitation, temperature, or population density, and were mostly qualitative in nature [1,21]. As research progressed, scholars gradually transitioned from the initial qualitative phase to a more quantitative approach, simultaneously considering multiple natural and anthropogenic factors and comparing their relative contributions to KRD [22]. Commonly used methods include correlation analysis, principal component analysis (PCA), and random forest models [23,24]. Correlation analysis is simple and intuitive, and can quantify the strength and direction of linear relationships. PCA integrates information through dimensionality reduction, helping to minimize multicollinearity and improve analytical efficiency. Random forest models can handle high-dimensional datasets and automatically evaluate the importance of each factor. These methods each have their own advantages. However, they share the following two main limitations: they tend to overlook spatial heterogeneity, which may lead to biased conclusions, and they struggle to effectively quantify interactions between factors [25,26]. In recent years, the GeoDetector method has emerged as a promising approach. Based on spatial heterogeneity theory, GeoDetector does not rely on linear or distributional assumptions; it can directly quantify the explanatory power of individual factors and their interactions on KRD, effectively overcoming the limitations of the aforementioned methods. Consequently, it has become a powerful tool for in-depth investigation of the driving factors of KRD. For example, Gao et al. [26] applied GeoDetector to analyze the driving factors of KRD in Qujing city, Yunnan Province, and found slope, vegetation coverage, and land use to be the primary drivers. Chen et al. [27] used GeoDetector to examine the drivers of KRD in Yinjiang County, Guizhou Province, identifying lithology and population density as the main influencing factors. Li et al. [28] employed GeoDetector to investigate the driving factors of KRD in Pingguo County from 1989 to 2017. Nonetheless, most existing studies are confined to single time periods and limited geographic scales (e.g., city or county level). Few have explored how the influence of driving factors changes over time at the provincial scale, which is essential for assessing long-term human and climate impacts and informing adaptive policy [29,30,31].
In summary, despite substantial progress in KRD monitoring, spatiotemporal analysis, and driving factor analysis, several key challenges remain unresolved. First, existing KRD monitoring methods suffer from limited accuracy and scale constraints when applied to large-scale, highly heterogeneous karst regions. Second, studies on the spatiotemporal evolution of KRD have paid insufficient attention to landscape pattern dynamics and the spatiotemporal interactions among KRD patches, both of which are essential for understanding ecological processes. Third, while GeoDetector has improved the analysis of KRD drivers, there is a lack of systematic, long-term, and province-scale investigations that track the evolution of driving factors over multiple periods. To address these issues, this study introduces the following three innovations: (1) a three-dimensional feature space model that integrates vegetation, rock, and soil characteristics to improve large-scale KRD classification; (2) an ecologically meaningful Spatiotemporal Interaction Intensity Index (STII) to quantify patch-level interactions and enhance landscape dynamic analysis; and (3) the application of GeoDetector for multi-period analysis of driving factors at the provincial scale.
Guangxi is among the regions in southwestern China most severely affected by KRD. Over the past two decades, the combined impacts of climate change and human activities have led to significant changes in the extent and intensity of KRD in this region. Therefore, this study takes Guangxi as a case study to monitor KRD and to analyze its spatiotemporal evolution and driving factors. Our objectives are to (1) develop a three-dimensional feature space model suitable for large-scale KRD monitoring; (2) generate KRD distribution maps for Guangxi from 2000 to 2023, thereby providing a long-term dataset to support regional KRD research; (3) analyze the spatiotemporal evolution of KRD using landscape metrics, transition matrices, dynamic degree indices, and the proposed STII; and (4) investigate the drivers of KRD under climatic and anthropogenic influences using GeoDetector. This study provides data and methodological support for monitoring KRD, and offers a scientific basis for policy formulation and ecological restoration efforts.
2. Materials and Methods
2.1. Study Area
Guangxi (20°54′–26°23′N, 104°27′–112°03′E), located in southern China, covers an area of 237,600 km2 (Figure 1a). Guangxi is characterized by well-developed karst landforms and is among the regions most severely affected by KRD in China. The region exhibits diverse topography, encompassing mountains, hills, karst peak-cluster depressions, plains, and tablelands, with karst landscapes accounting for 40.72% of its territory (Figure 1b). The terrain slopes from the northwestern highlands to the southeastern lowlands, forming a distinct topographic gradient (Figure 1c). Climatically, Guangxi experiences a subtropical monsoon climate, with a mean annual temperature of 17–23 °C and annual precipitation ranging from 1250 to 1750 mm, primarily concentrated during the summer monsoon [32,33]. Forest land is the dominant land use type in the region. The major soil types include lateritic red soil, calcareous soil, red soil, and brick-red soil. The region exhibits complex geological structures and diverse rock types, including limestone, dolomite, and sandstone.
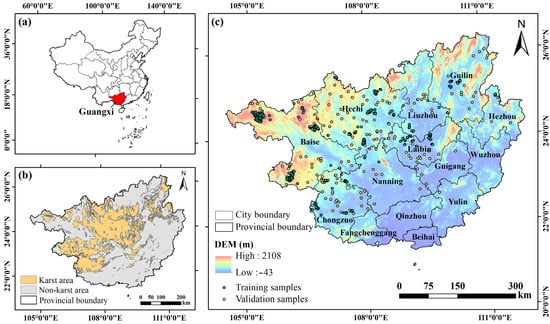
Figure 1.
Overview of the study area: (a) location of Guangxi within China; (b) karst distribution map of Guangxi; (c) DEM map of Guangxi and sampling point distribution map.
2.2. Data
The remote sensing data used in this study were derived from MODIS Surface Reflectance products (MODIS/061/MOD09GA) hosted on the Google Earth Engine (GEE) platform. The temporal resolution of the data is 1 day, and the spatial resolution is 500 m. Phenological variation can impair the consistency of image classification across different scenes [34]. The same KRD level exhibits distinct spectral characteristics across different seasons. Therefore, the selection of appropriate time phases is critical for monitoring KRD. In autumn, the lower cloud cover and vegetation coverage make it suitable for monitoring KRD [4]. In this study, autumn (September–November) images were processed with cloud masking and median compositing on the GEE platform to derive annual-scale data for the years 2000, 2005, 2010, 2015, 2020, and 2023.
The sample data were obtained through field surveys and visual interpretation of high-resolution Google Earth imagery, with the interpretation criteria detailed in Table A1. In total, 700 samples were collected in 2015, including 490 for model training and 210 for validation. The validation samples were distributed across KRD levels as follows: 49 for no KRD, 57 for potential KRD, 41 for light KRD, 35 for moderate KRD, and 28 for severe KRD. These samples effectively cover the main KRD areas in the karst region of Guangxi and exhibit a good degree of spatial coverage and relative uniformity both within and between KRD severity levels. Therefore, they adequately represent the spatial distribution characteristics of various KRD levels. Their spatial distribution is shown in Figure 1c.
The environmental and socioeconomic data used in this study are shown in Table 1. Elevation and slope were derived from the SRTM DEM provided by the United States Geological Survey (USGS). Soil and lithologic data were obtained from the International Soil Reference and Information Centre (ISRIC) and the China Geological Survey (CGS). Since KRD exclusively occurs in karst regions, non-karst regions were masked using the karst distribution map. Land use data were sourced from the 30 m dataset of Jie Yang and Xin Huang (Wuhan University). Climate data were obtained from the National Tibetan Plateau Data Center (TPDC). GDP density and population density data were obtained from the Resource and Environmental Science Data Platform (RESDP) and LandScan Global Population Database, respectively.

Table 1.
Summary of environmental and socioeconomic data.
2.3. Methods
In this study, we first calculated KRD-sensitive surface parameters, including the kernel normalized difference vegetation index (kNDVI), karst bare-rock index (KBRI), and mean annual soil erosion (SE). Next, we proposed a novel three-dimensional feature space model (kNDVI-KBRI-SE) to monitor KRD in Guangxi and compared its accuracy with two-dimensional models (kNDVI-KBRI, kNDVI-SE, and KBRI-SE) and a conventional evaluation index method. The optimal method was selected to map the distribution of KRD at different severity levels in Guangxi from 2000 to 2023. Following this, we analyzed the spatiotemporal evolution of KRD in Guangxi using transition matrices, dynamic degree indices, and landscape metrics, and we further proposed the STII to quantify the influence of neighboring KRD patches on focal patches. Finally, we analyzed the driving factors of KRD in Guangxi using GeoDetector. The overall framework is shown in Figure 2.
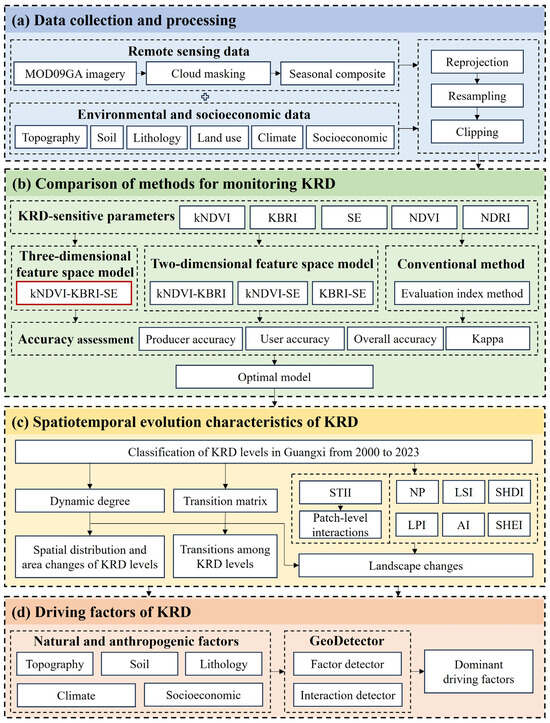
Figure 2.
Overall framework.
2.3.1. Calculation of kNDVI, KBRI, and SE
In feature space models, the selection of feature parameters is critical. KRD is a complex integrated system composed of vegetation, bare rock, and soil. We selected kNDVI, KBRI, and SE to characterize the information of these three element types.
kNDVI integrates multi-scale information through a kernel function [35,36,37]. Compared to conventional vegetation indices, this index maximizes the utilization of spectral information, exhibits enhanced stability and robustness, and provides more accurate vegetation information [38,39]. The formula is expressed as follows:
where σ is the length-scale parameter. Following Camps-Valls et al. [35], we used the generalization σ = 0.5(NIR + red).
KBRI improves the discrimination between exposed rock and other land cover types through nonlinear processing. This index is particularly effective for identifying bare rock in highly heterogeneous karst environments and has proven superior to traditional indices such as the normalized difference rock indices (NDRI1 and NDRI2) and the carbonate-rock indices (CRI1 and CRI2) [40]. The formula is expressed as follows:
Soil erosion is intrinsically linked to the initiation and progression of KRD. Prior studies have investigated the relationship between soil erosion and KRD [30,41,42]. Incorporating SE into feature space models aims to enhance the classification accuracy for potential and light KRD. In this study, the Revised Universal Soil Loss Equation (RUSLE) model was employed to calculate SE. The formula is expressed as follows:
where SE represents the mean annual soil erosion (t∙ha−1∙a−1); R represents the rainfall erosivity factor (MJ∙mm∙ha−1∙h−1∙a−1); K represents the soil erodibility factor (t∙ha∙h∙ha−1∙MJ−1∙mm−1); LS represents the slope length–slope gradient factor; C represents the cover and management factor; P represents the support practice factor [43].
Due to the inconsistencies in magnitudes and dimensions among kNDVI, KBRI, and SE, all parameters were normalized as shown in Equation (4).
where Mi represents the i-th normalized feature parameter; MIi denotes the original value of the i-th feature parameter before normalization; and MIi,max and MIi,min are its maximum and minimum values, respectively.
2.3.2. Feature Space Model
Existing KRD studies predominantly employ two-dimensional feature space models that map pairs of KRD-sensitive surface parameters onto a two-dimensional plane defined by the horizontal (x) and vertical (y) axes. Each point in this plane represents a sample, with samples of the same category clustering together to form distinct point clusters [38]. This study developed three two-dimensional feature space models (kNDVI-KBRI, kNDVI-SE, and KBRI-SE).
In the kNDVI-KBRI feature space (Figure 3a), a significant negative correlation was observed between KBRI and kNDVI, prompting the establishment of their regression relationship (Equation (5)). Following the methodology of Ma et al. [44], we developed the Karst Rocky Desertification Index 1 (KRDI1), which is formally expressed in Equation (6).
where a1 and b1 represent the slope and intercept of the regression equation between KBRI and kNDVI, respectively; k1 = −1/a1. In this study, the derived parameters were a1 = −1.7741 and k1 = 0.5637.
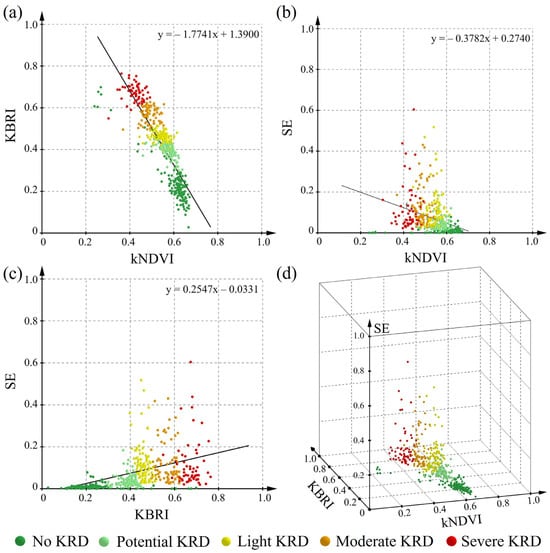
Figure 3.
Feature space models constructed for monitoring KRD: (a) kNDVI-KBRI feature space; (b) kNDVI-SE feature space; (c) KBRI-SE feature space; (d) kNDVI-KBRI-SE feature space.
In the kNDVI-SE feature space (Figure 3b), a negative correlation was observed between SE and kNDVI, mirroring the pattern identified in the kNDVI-KBRI feature space. This consistent relationship drove the derivation of their regression model (Equation (7)), through which the Karst Rocky Desertification Index 2 (KRDI2) was developed, as defined in Equation (8).
where a2 and b2 represent the slope and intercept of the regression equation between SE and kNDVI, respectively; k2 = −1/a2. In this study, the derived parameters were a2 = −0.3782 and k2 = 2.6441.
In the KBRI-SE feature space (Figure 3c), it was observed that as proximity to the origin increases, KBRI and SE values increase, indicating higher KRD intensity. This relationship motivated the adoption of Euclidean distance from any given point to the origin as a quantifiable metric for KRD assessment. Employing the fundamental distance formula between two Cartesian coordinates, we established the Karst Rocky Desertification Index 3 (KRDI3), as defined in Equation (9).
Based on the Jenks natural breaks classification method, KRDI1, KRDI2, and KRDI3 were categorized into the following five distinct severity levels: no KRD, potential KRD, light KRD, moderate KRD, and severe KRD [45,46].
Given the complex diversity of topography, geomorphology, and other environmental factors in Guangxi, the accuracy of KRD monitoring based on two-dimensional models remains limited. To address this constraint, this research proposed a three-dimensional feature space model (kNDVI-KBRI-SE) by incorporating a third KRD-sensitive surface parameter (SE) as the z-axis, extending the two-dimensional framework. In the three-dimensional feature space (Figure 3d), distinct spatial segregation of sample points corresponding to different KRD levels was observed. Building upon the clustering characteristics of each KRD level within this feature space, we developed a multi-criteria classification framework using compound inequality systems. Through this approach, the following five KRD categories were quantitatively delineated: severe KRD (Equation (10)), moderate KRD (Equation (11)), light KRD (Equation (12)), potential KRD (Equation (13)), and no KRD (areas not meeting the criteria for the above categories).
2.3.3. Evaluation Index Method
The evaluation index method is widely applied in KRD research. When utilizing this method for monitoring KRD, scholars commonly employ vegetation coverage, bedrock exposure rate, and slope gradient as classification indicators. The specific classification criteria are presented in Table 2 [7].
Table 2.
Classification criteria of KRD.
2.3.4. Accuracy Assessment
This study employed the confusion matrix to assess the model’s classification accuracy, which primarily involved the following four evaluation metrics: overall accuracy (OA), kappa coefficient, producer’s accuracy (PA), and user’s accuracy (UA), as detailed in the following equations [11]:
where PAi and UAi represent the producer’s and user’s accuracy for class i, respectively; n is the number of classes; N is the total number of validation samples; Xii is the number of correctly classified samples for class i; Xi+ is the marginal total of row i; and X+i is the marginal total of column i [11,25].
2.3.5. Landscape Metrics
Landscape metrics offer a comprehensive portrayal of landscape patterns by describing their structural components alongside their spatial configuration [47,48]. This study analyzed the evolution of KRD landscape patterns in Guangxi from 2000 to 2023 at both class and landscape levels. At the class level, the following four representative metrics were employed: number of patches (NP), Largest Patch Index (LPI), Landscape Shape Index (LSI), and Aggregation Index (AI) [49,50]. At the landscape level, LSI, AI, Shannon’s Diversity Index (SHDI), and Shannon’s Evenness Index (SHEI) were employed to characterize overall pattern dynamics [48,51,52]. The combined application of these metrics enables a multidimensional characterization of KRD landscape dynamics across spatial distribution, morphological configuration, quantitative composition, and landscape diversity. These metrics are detailed in Table 3, with calculations conducted using Fragstats 4.2 software.
Table 3.
Description of landscape metrics.
The evolution of KRD involves spatiotemporal interactions among KRD patches. This study proposes the STII to quantify the influence of neighboring KRD patches on a focal KRD patch during a specific period. The fundamental concept underlying the definition of this index is to calculate the reciprocal of the distance from the centroid of each neighboring patch to the centroid of the focal patch (as influence diminishes with increasing distance), multiply this value by the comprehensive change in KRD level of the neighboring patch from time t to t + 1, and then sum the contributions from all neighboring patches to derive the STII. The formula is expressed as follows:
where n denotes the number of neighboring KRD patches located within a defined spatial threshold surrounding the focal KRD patch; Pi represents the i-th neighboring patch; di is the distance from the centroid of the i-th neighboring patch to the centroid of the focal patch; and represents the change in the comprehensive KRD level of the i-th neighboring patch from time t to t+1. The comprehensive KRD level is characterized by the Comprehensive KRD Index (CKI), which is quantified by summing the product of the area of each KRD level and its corresponding weight. Specifically, m denotes the KRD level, with integer values 1 to 5 corresponding to no KRD, potential KRD, light KRD, moderate KRD, and severe KRD, respectively; ωm is the weight assigned to KRD level m. Based on prior studies, the weights are defined as ω1 = 0.10, ω2 = 0.15, ω3 = 0.40, ω4 = 0.60, and ω5 = 0.80 [53]; and denotes the area of the i-th neighboring patch (Pi) classified as KRD level m at time t.
2.3.6. Transition Matrix and Dynamic Degree
This study employed the transition matrix to quantify the areas transitioning into and out of each KRD level in Guangxi from 2000 to 2023, thereby elucidating the overall evolutionary processes and trends. The transition matrix is defined as follows:
where S is area; i and j denote the KRD levels during the initial and final periods of a given time interval; and Snn indicates the transferred area of KRD during this period (unit:km2) [54].
In KRD studies, the dynamic degree is typically used to characterize the rate of change for different KRD levels over time, with the single indicator calculation formula shown in Equation (20). In this research, the dynamic degree was employed to quantify the change rates of both the area and landscape metrics associated with different KRD levels over time.
where K is the dynamic degree; U1 and U2 represent the areas (km2) at the initial and terminal years, respectively, and T indicates the study duration (in years) [55].
2.3.7. GeoDetector
The Geodetector is a widely used method for the analysis of driving forces. It investigates the explanatory power of independent variables on a dependent variable based on spatial differentiation theory [56]. If an independent variable significantly influences the dependent variable, their spatial distributions should be similar. In this study, we used GeoDetector’s factor and interaction detectors to quantify the effects of the driving factors on KRD.
The factor detector employs the q-statistic to quantify the extent to which factor X explains the spatial heterogeneity of dependent variable Y [57]. A higher q-value indicates a stronger explanatory power of X on Y. The q-value ranges from 0 to 1. It is computed as follows:
where h = 1, 2, …, L refers to the stratification of Y or X; Nh and N denote the numbers of units in stratum h and in the entire region, respectively; and and denote the variances of Y in stratum h and in the entire region, respectively [56].
The interaction detector is primarily used to quantify the changes in explanatory power when different factors jointly influence the spatial heterogeneity of a dependent variable (Table 4) [55].
Table 4.
Types of interaction between a pair of factors.
GeoDetector requires explanatory variables to be categorical. Therefore, continuous variables such as elevation, slope, and precipitation were discretized into five categories using the Jenks natural breaks classification method, which maximizes between-group variance while minimizing within-group variance [56]. To assess the statistical significance of each factor’s explanatory power, significance tests were conducted on the calculated q-values. Factors with p-values less than 0.05 were considered statistically significant contributors to the spatial heterogeneity of KRD.
3. Results
3.1. Comparison of Methods for Monitoring KRD
This study constructed three two-dimensional feature space models (kNDVI-KBRI, kNDVI-SE, and KBRI-SE), one three-dimensional feature space model (kNDVI-KBRI-SE), and an evaluation index method to monitor KRD. The spatial distribution of KRD in Guangxi in 2015, obtained using these methods, is shown in Figure 4.
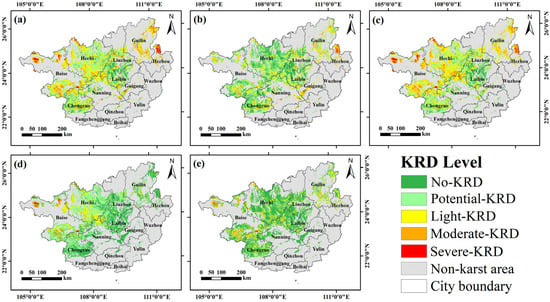
Figure 4.
Spatial distribution of KRD in Guangxi in 2015 based on different methods: (a) kNDVI-KBRI feature space; (b) kNDVI-SE feature space; (c) KBRI-SE feature space; (d) kNDVI-KBRI-SE feature space; (e) evaluation index method.
To assess their accuracy, 210 validation samples from 2015 were selected based on field surveys and visual interpretation of Google Earth imagery. Confusion matrices were subsequently constructed for each method by comparing the predicted classes with the actual ground truth classes. Taking the kNDVI-KBRI-SE model as an example, Table 5 presents its confusion matrix for 2015. In the confusion matrix, each row represents the actual ground truth class, and each column represents the predicted class. Values along the diagonal indicate the number of correctly classified samples.
Table 5.
Confusion matrix for monitoring KRD using the kNDVI-KBRI-SE model in 2015.
Based on the confusion matrices, the producer’s accuracy, user’s accuracy, overall accuracy, and kappa coefficient were calculated for each method. The results are shown in Table 6. The three-dimensional kNDVI-KBRI-SE model achieved the highest performance, with an overall accuracy of 92.86% and a kappa coefficient of 0.91. The user’s accuracies for all KRD levels exceeded 90%. As for the producer’s accuracies, all categories surpassed 90% except for light KRD (88.37%), demonstrating the model’s strong capability in distinguishing different KRD levels. The kNDVI-KBRI model exhibited moderately high accuracy, with an overall accuracy of 77.14% and a kappa coefficient of 0.71. However, its performance in identifying potential and light KRD was relatively poor. The KBRI-SE model followed, with an overall accuracy of 69.52% and a kappa coefficient of 0.62. The model showed noticeably lower classification accuracy for light and moderate KRD compared with the other levels. The kNDVI-SE model and the evaluation index method showed a relatively lower performance, with overall accuracies of only 60.95% and 61.90%, respectively.
Table 6.
Accuracy comparison of different KRD monitoring methods in 2015.
To verify the stability of the kNDVI-KBRI-SE model, we determined the corresponding KRD levels of the 2015 validation samples in 2010 and 2020 through visual interpretation of Google Earth imagery. These interpreted labels were then compared with the classification results of the respective years. The accuracy assessment results are presented in Table 7. As shown, the model achieved overall accuracies above 90% in 2010, 2015, and 2020, with both producer’s and user’s accuracies for each KRD level exceeding 85%, confirming the model’s effectiveness in multi-year applications.
Table 7.
Accuracy assessment of the kNDVI-KBRI-SE model across multiple years (2010, 2015, and 2020) for stability verification.
3.2. Spatiotemporal Evolution Characteristics of KRD from 2000 to 2023
3.2.1. Spatial Distribution and Area Changes in KRD Levels
Based on the model accuracy validation results, the kNDVI-KBRI-SE model was selected to monitor KRD in Guangxi from 2000 to 2023. Figure 5 illustrates the spatial distribution of KRD for the years 2000, 2005, 2010, 2015, 2020, and 2023. Significant regional heterogeneity in the distribution of KRD was observed. Severe and moderate KRD were primarily distributed in Hechi city, Baise city, the northern part of Chongzuo city, the northern part of Nanning city, the western part of Laibin city, the central and northeastern parts of Guilin city, and the central and southern parts of Liuzhou city. Light KRD was concentrated in Hechi city, the southern and eastern parts of Baise city, the northern part of Nanning city, the western part of Laibin city, and the central part of Guilin city. Potential and no KRD were widely distributed across all karst-developed cities in Guangxi.
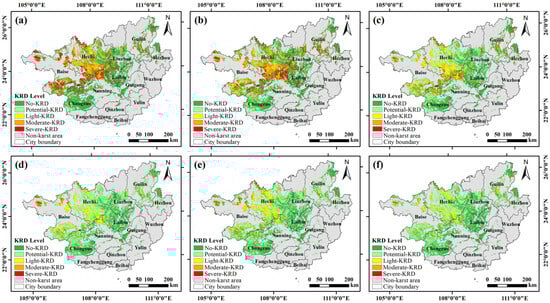
Figure 5.
Spatial distribution of KRD in Guangxi from 2000 to 2023: (a) 2000; (b) 2005; (c) 2010; (d) 2015; (e) 2020; (f) 2023.
Figure 6a presents the area and proportion of KRD. The area of severe KRD showed a decreasing trend from 2000 to 2015 and remained stable thereafter. The area of moderate KRD slightly increased from 2000 to 2005, significantly declined from 2005 to 2015, and remained relatively stable from 2015 to 2023. Notably, the areas of both moderate and severe KRD reached their historical lows (3490 km2 and 697 km2, respectively) during 2010–2020. The area of light KRD exhibited a growth trend from 2000 to 2020, with a much smaller magnitude than that of potential KRD, followed by a slight decline thereafter. The area of potential KRD increased substantially from 5473 km2 in 2000 to 30,977 km2 in 2015, followed by slight fluctuations thereafter. Among all KRD levels, the area of no KRD consistently accounted for the highest proportion from 2000 to 2023, reaching a minimum of 45.16% during 2010–2020, possibly attributable to the rapid urbanization in Guangxi during this period.
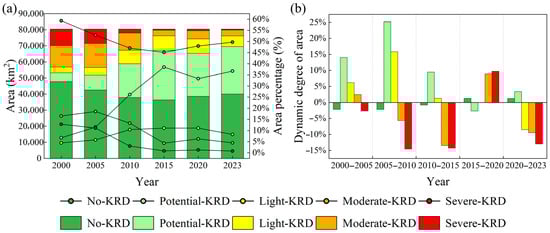
Figure 6.
Dynamic changes in the area of different KRD levels in Guangxi from 2000 to 2023: (a) area and proportion of each KRD level; (b) dynamic degree of each KRD level.
To assess the rate of change in the area of different KRD levels over time, the dynamic degree of each KRD level was calculated (Figure 6b). From 2005 to 2015, severe and moderate KRD exhibited strong negative dynamic degrees of area. This trend reversed during 2015–2020, with both categories showing significantly positive dynamic degrees, before returning to negative values during 2020–2023. In contrast, light and potential KRD exhibited positive dynamic degrees of area from 2000 to 2015. Throughout the study period, no KRD category maintained consistently low dynamic degrees.
3.2.2. Transitions Among KRD Levels
We classified the evolution of KRD in Guangxi from 2000 to 2023 into the following five categories: significant recovery (KRD level decreased by more than one level), slight recovery (KRD level decreased by one level), stabilization (KRD level remained unchanged), slight deterioration (KRD level increased by one level), and significant deterioration (KRD level increased by more than one level) [25,55].
Figure 7 illustrates the transitions among KRD levels in Guangxi from 2000 to 2023. From 2000 to 2005, KRD recovery primarily occurred in Hechi city, Baise city, and northern Nanning, characterized mainly by transitions from potential KRD to no KRD (1086 km2). Conversely, deteriorated regions were widespread, spanning Hechi city, Baise city, Guilin city, Laibin city, the northern and central parts of Chongzuo city, the southern and central parts of Liuzhou city, and the northeastern part of Nanning city. The most significant deterioration involved transitions from moderate to severe KRD (1650 km2). From 2005 to 2010, KRD in Guangxi was predominantly recovering. The recovery zones were mainly distributed in Hechi, Baise, the northern part of Chongzuo, the northern part of Nanning, the western and central parts of Laibin, the southern and central parts of Liuzhou, and the southern and central parts of Guilin. The areas of significant recovery and slight recovery during this period were 7535 km2 and 13,775 km2, respectively. Between 2010 and 2015, KRD continued to recover, with recovery areas primarily in Hechi, Guilin, the southern and central parts of Baise, the northern part of Chongzuo, the northern part of Nanning, the western and central parts of Laibin, the southwestern part of Liuzhou, and the central part of Hezhou. The corresponding areas of significant and slight recovery were 5708 km2 and 14,041 km2. From 2015 to 2020, KRD was predominantly deteriorating, mainly manifested as the transition from no KRD to potential KRD (3615 km2) and from potential KRD to light KRD (3471 km2). Deterioration was particularly pronounced in Hechi city, where 5512 km2 of land underwent degradation during this period. From 2020 to 2023, recovery reemerged as the primary trend, concentrated in Hechi city and Baise city. However, deterioration was notably observed in Guilin city. A review of relevant literature revealed that Guilin city experienced an extreme drought in 2022, which may have been a significant factor contributing to the worsening of KRD in that area [58].
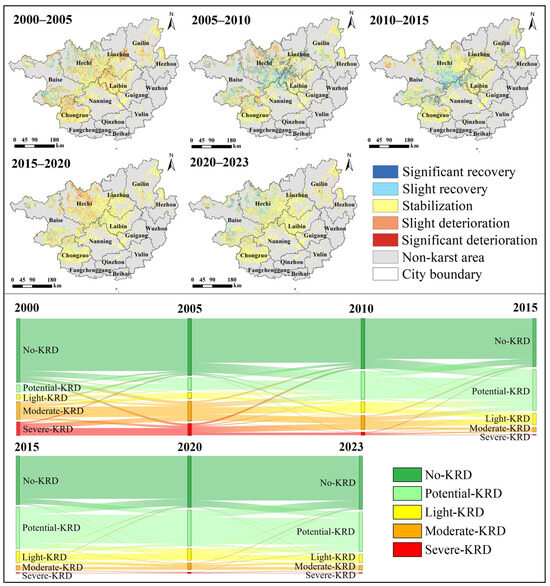
Figure 7.
Transitions among KRD levels in Guangxi from 2000 to 2023.
3.2.3. Landscape Changes
This study analyzed changes in KRD landscape patterns in Guangxi from 2000 to 2023 at the following two scales: the class and landscape levels.
At the class level, no KRD and potential KRD patches exhibited similar variation trends in NP values, with an increase from 2000 to 2015, followed by a decrease from 2020 to 2023. Similarly, moderate and severe KRD patches demonstrated comparable patterns, as follows: both exhibited a declining trend from 2000 to 2015, followed by an increasing trend between 2015 and 2020, and then decreased again from 2020 to 2023 (Figure 8a).
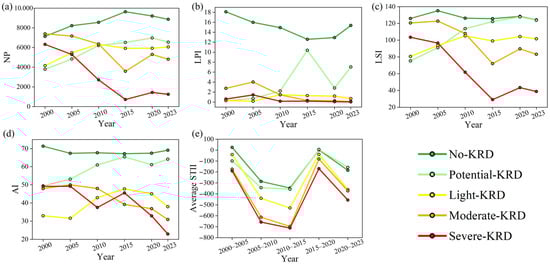
Figure 8.
Changes in landscape metrics at the class level from 2000 to 2023: (a) NP; (b) LPI; (c) LSI; (d) AI; (e) average STII.
The LPI helps identify dominant patch types. No KRD remained the dominant patch type in Guangxi from 2000 to 2023. The LPI values of moderate and severe KRD declined significantly between 2005 and 2010, subsequently stabilizing at relatively low levels (Figure 8b).
During the study period, the LSI values of no KRD remained consistently high, and those of potential KRD exhibited an overall upward trend, suggesting progressive shape complexity in this category. Notably, both moderate and severe KRD exhibited substantial and similar fluctuations in LSI values, as follows: a pronounced decline from 2005 to 2015, followed by a marked increase from 2015 to 2020, and a subsequent decrease from 2020 to 2023. All patch types exhibited an increase in LSI values during 2015–2020 (Figure 8c), which may be attributed to intensified human activities such as agricultural expansion and urbanization during this period.
The AI quantifies the degree of aggregation of patches. During the study period, both no KRD and potential KRD patches exhibited relatively high AI values, reflecting strong spatial aggregation. Notably, the AI values of potential and light KRD patches increased significantly from 2005 to 2015, followed by a marked decline between 2015 and 2020. In contrast, moderate and severe KRD patches exhibited an overall downward trend in AI throughout the study period (Figure 8d).
The STII reflects the degree of influence of neighboring KRD patches on the focal KRD patch during a specific period. A negative STII value indicates that neighboring patches exerted an ameliorative effect on the focal patch during that period, whereas a positive value suggests an aggravating effect. The average STII values of all KRD patch types exhibited broadly similar trends during the study period, as follows: a significant decline from 2000 to 2015, indicating strengthened ameliorative effects from neighboring patches; followed by a marked increase from 2015 to 2020 and another pronounced decrease from 2020 to 2023 (Figure 8e). Notably, moderate and severe KRD patches consistently exhibited lower average STII values than other patch types across all periods, implying that neighboring patches exerted stronger ameliorative effects on these two categories. However, an intriguing contradiction emerged during 2015–2020, as follows: although severe KRD patches exhibited negative average STII values, their total area increased. This apparent paradox may stem from asymmetric thresholds for recovery versus deterioration in severe KRD patches. Specifically, even minor aggravating influences may trigger deterioration, whereas substantial ameliorative forces are required for recovery.
Figure 9 illustrates dynamic degrees of landscape metrics at the class level. Severe and moderate KRD exhibited high negative dynamic degrees of NP and LSI from 2005 to 2015, likely reflecting the effectiveness of Guangxi’s KRD control policies. Subsequently, these two metrics exhibited significant positive dynamic degrees from 2015 to 2020, possibly due to ecological degradation driven by population growth and the expansion of construction land. Negative dynamic degrees recurred from 2020 to 2023. Light and potential KRD exhibited positive dynamic degrees of four metrics during 2005–2010. This pattern likely reflects substantial conversion of land from severe and moderate KRD levels to lower-intensity KRD categories during this period. From 2010 to 2015, potential KRD maintained positive dynamic degrees, and light KRD exhibited a positive dynamic degree of AI but slight negative dynamic degrees of NP, LPI, and LSI. From 2015 to 2020, light KRD exhibited minimal change, with a near-zero dynamic degree of NP. From 2020 to 2023, it exhibited strong negative dynamic degrees of LPI and AI, a weak negative dynamic degree of LSI, and a slight positive dynamic degree of NP. Concurrently, potential KRD exhibited positive dynamic degrees of LPI and AI, and weak negative dynamic degrees of NP and LSI. No KRD areas maintained relatively stable and low dynamic degrees across all metrics throughout the study period.

Figure 9.
Dynamic degrees of landscape metrics at the class level from 2000 to 2023: (a) dynamic degree of NP; (b) dynamic degree of LPI; (c) dynamic degree of LSI; (d) dynamic degree of AI.
At the landscape level, the LSI exhibited a rising trend from 2000 to 2005, followed by a decline from 2005 to 2015, a subsequent increase from 2015 to 2020, and a final decrease from 2020 to 2023. The AI showed trends directly inverse to those of the LSI across all corresponding periods (Figure 10a). This inverse relationship may be attributed to patch aggregation reducing landscape boundary complexity (i.e., a relative decrease in total perimeter), thereby diminishing shape complexity. The SHDI and SHEI exhibited parallel changes in both trend direction and magnitude throughout the study period. From 2000 to 2010, both metrics showed an overall upward trend, with a marked increase from 2000 to 2005 followed by a more gradual rise from 2005 to 2010. A sharp decline occurred between 2010 and 2015, possibly due to the substantial conversion of severe and moderate KRD into lower-intensity categories, which increased the disparity in the distribution of KRD classes. Both metrics then rebounded significantly between 2015 and 2020, before experiencing a pronounced decline from 2020 to 2023 (Figure 10b).
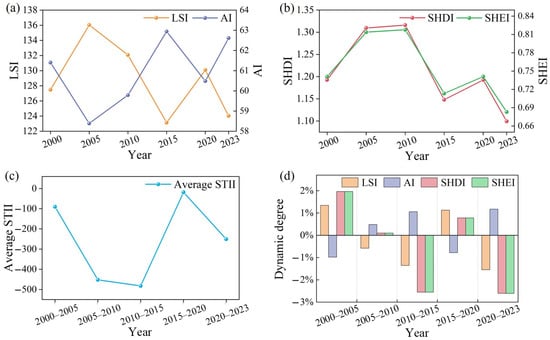
Figure 10.
Changes in landscape metrics at the landscape level from 2000 to 2023: (a) LSI and AI; (b) SHDI and SHEI; (c) average STII; (d) dynamic degrees of LSI, AI, SHDI, and SHEI.
The average value of the STII remained relatively low from 2005 to 2015, suggesting that neighboring KRD patches exerted considerable improvement effects on adjacent focal patches during this period. This finding is consistent with the earlier conclusion that KRD recovery dominated the study area at that time. The highest average STII value was observed during 2015–2020, followed by a decrease to lower levels from 2020 to 2023. These trends align well with previous results indicating that KRD deterioration was predominant from 2015 to 2020, whereas recovery predominated again between 2020 and 2023 (Figure 10c).
3.3. Driving Factors of KRD from 2000 to 2023
3.3.1. Single Factor Analysis
KRD is jointly influenced by natural and anthropogenic factors [6]. To investigate the driving factors of KRD in Guangxi over the period 2000–2023, this study first selected ten potential drivers—elevation (EL), slope (SLP), soil type (ST), lithology (LITH), annual erosive rainfall (AER), mean annual precipitation (MAP), mean annual temperature (MAT), land use (LU), GDP density (GDP), and population density (POP). Then, we used the factor detector of GeoDetector to quantify the influence of each factor. The results are shown in Figure 11. All driving factors exhibited statistically significant influences on the spatial differentiation of KRD (p < 0.05). Overall, the distribution of KRD in Guangxi from 2000 to 2023 was predominantly influenced by natural factors. Specifically, SLP, LU, and EL emerged as the primary driving factors, with their q-values ranging from 0.19 to 0.36, underscoring their critical roles in the KRD process. ST, LITH, and MAT exhibited a moderate influence, with q-values between 0.11 and 0.20. Among these, ST and LITH showed very similar and relatively stable q-values across all time intervals, whereas the q-value of MAT varied considerably; it declined from 2000 to 2010, rose from 2010 to 2020, and declined again from 2020 to 2023. A comparison of the two rainfall-related factors revealed that the q-value of AER consistently exceeded that of MAP throughout the study period, indicating that erosive rainfall exerts a stronger explanatory power on the spatial differentiation of KRD than does average rainfall—implying that intense, concentrated storm events have a more direct and pronounced impact on KRD than uniformly distributed precipitation. In addition, POP and GDP had relatively minor effects on KRD, with q-values below 0.10.
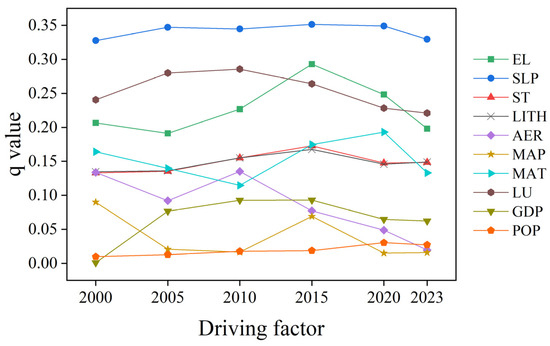
Figure 11.
Single forces of KRD in Guangxi from 2000 to 2023.
3.3.2. Interactive Factor Analysis
In this study, we employed the interaction detector of GeoDetector to quantify the strength of the influence exerted by pairwise interactions between the various driving factors on the KRD process. The results are shown in Figure 12. In the ten selected driving factors, every pairwise combination exhibited either bivariate enhancement or nonlinear enhancement, indicating that the explanatory power of two-factor interactions for KRD exceeds that of individual factors. We further observed that, over the period 2000–2023, the frequency of bivariate enhancement was higher than that of nonlinear enhancement, and nonlinear enhancement predominantly occurred in the interactions involving MAP with the other factors.
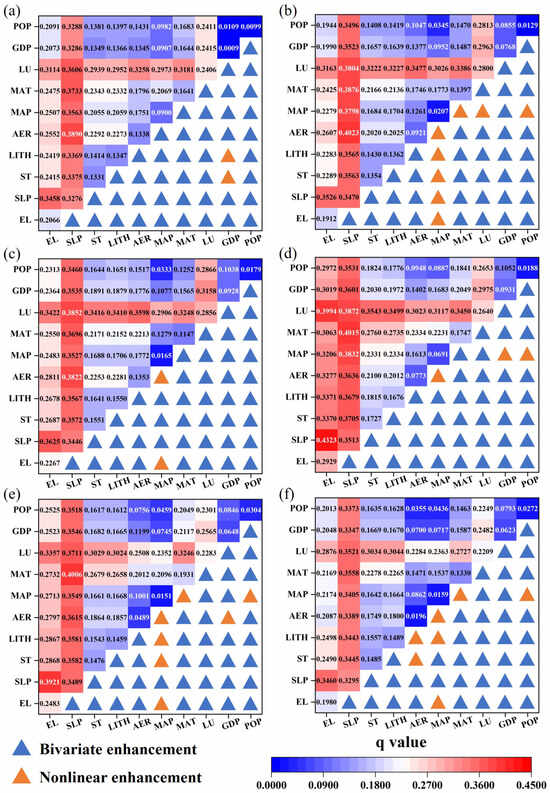
Figure 12.
Interactive effect between pairs of driving factors from 2000 to 2023: (a) 2000; (b) 2005; (c) 2010; (d) 2015; (e) 2020; (f) 2023.
The q-values of all two-factor interactions were ranked for each of the years 2000, 2005, 2010, 2015, 2020, and 2023. Table 8 shows the top five two-factor combinations and their corresponding q-values for each study year. In both 2000 and 2005, the interaction AER ∩ SLP showed the highest explanatory power for KRD, followed by MAT ∩ SLP and LU ∩ SLP; however, by 2010, LU ∩ SLP had surpassed both AER ∩ SLP and MAT ∩ SLP to become the dominant driver. It is noteworthy that, although AER and MAT each exerted only a moderate individual influence on KRD between 2000 and 2010, their interactions with SLP had a pronounced combined effect. In 2015, EL ∩ SLP exhibited the highest explanatory power, followed by MAT ∩ SLP and LU ∩ EL. In both 2020 and 2023, MAT ∩ SLP showed the highest explanatory power for KRD. Throughout the study period, the explanatory powers of ST ∩ SLP and LITH ∩ SLP remained very similar (their q-values differing by less than 0.0030) and relatively stable.
Table 8.
Dominant interactions between pairs of driving factors from 2000 to 2023.
To further explore the temporal dynamics of factor interactions, we compared the q-values of key factor pairs between the recovery periods (2005–2015 and 2020–2023) and the deterioration period (2015–2020). During the first recovery phase (2005–2015; Figure 12b–d), the interaction strength between LU and most other factors exhibited an upward trend. For example, the q-value of LU ∩ SLP increased from 0.3804 in 2005 to 0.3852 in 2010, and further to 0.3872 in 2015. Similarly, the q-value of LU ∩ ST increased from 0.3222 in 2005 to 0.3416 in 2010, and to 0.3543 in 2015. However, during the deterioration period (2015–2020; Figure 12d,e), these interaction effects generally weakened, indicating a decline in the synergistic relationships among factors. Notably, although 2020–2023 was also identified as a recovery phase, the interaction strength of most factor pairs either declined or remained stable (Figure 12e,f). This divergence may suggest that the post-2020 recovery was more reliant on short-term policy interventions or engineering-based measures. In addition, external disturbances such as extreme weather events may have disrupted the coherence of inter-factor coupling during this period.
4. Discussion
4.1. Advantages of the Three-Dimensional kNDVI-KBRI-SE Model in Monitoring KRD
Traditional two-dimensional feature space methods for monitoring KRD typically rely on combinations of vegetation and bedrock indicators. While such approaches have demonstrated reasonable performance in small-scale or localized studies, they often suffer from reduced classification accuracy when applied to large-scale, heterogeneous regions such as Guangxi Province. One key limitation lies in their insufficient dimensionality, which constrains the models’ ability to capture the multifaceted environmental characteristics associated with KRD.
To overcome these limitations, this study proposes a novel three-dimensional feature space model, which for the first time integrates vegetation condition (kNDVI), bedrock exposure (KBRI), and soil erosion intensity (SE) into a unified classification framework. By adding soil erosion as a third dimension, the model is better equipped to capture the environmental complexity of KRD, particularly during its early stages. Previous research has rarely incorporated erosion intensity as a core feature. Our preliminary analysis suggests that soil erosion tends to intensify during the potential and light KRD stages, making it a valuable indicator for early detection of KRD. Our results further suggest that two-dimensional models (e.g., kNDVI-KBRI) exhibit limited performance in identifying potential and light KRD areas. In contrast, the three-dimensional model significantly improves both producer’s and user’s accuracy for these categories.
This improvement is not merely numerical but structural. The three-dimensional model enables a more flexible partitioning of class boundaries. In contrast to linear decision lines in two-dimensional space, class boundaries in the three-dimensional model can be defined as planes. This added flexibility allows the classifier to more effectively accommodate the nonlinear and stage-specific relationships between KRD indicators. For example, soil erosion intensity tends to increase with KRD severity in the potential and light stages, but this relationship becomes weaker or inconsistent in the moderate and severe stages. The three-dimensional model captures these nonlinear and stage-specific characteristics by enabling each class to occupy a more cohesive and representative volume in feature space, thereby reducing class overlap and enhancing inter-class separability. In terms of performance, the kNDVI-KBRI-SE model consistently outperformed all tested two-dimensional models and the evaluation index method across multiple metrics, including overall accuracy, kappa coefficient, producer’s accuracy, and user’s accuracy. Moreover, its strong and stable performance over multiple years highlights the model’s robustness and temporal transferability, which are crucial for reliable long-term environmental monitoring.
Building on its methodological strengths, the kNDVI-KBRI-SE model shows promise for informing adaptive management strategies for KRD. Its enhanced capability to accurately identify potential and light KRD areas provides a scientific basis for early warning systems and targeted interventions. These interventions are essential for preventing further degradation at an early stage. By integrating information on vegetation, bedrock exposure, and soil erosion intensity, the model provides a more comprehensive understanding of the degradation process and supports the development of site-specific management strategies. For instance, regions classified as light KRD with high erosion intensity can be prioritized for immediate implementation of soil and water conservation measures, while areas with moderate or severe KRD but low current erosion may be more suitable for long-term restoration-oriented management strategies. Moreover, when integrated into a long-term monitoring framework, the model can assist in tracking changes in KRD severity over time, thereby indirectly supporting the evaluation of management outcomes and contributing to timely adjustments to control strategies.
4.2. Causes of the Spatial Distribution and Evolution of KRD
The combination of lithology, geomorphology, climate and anthropogenic factors contributes to the spatial heterogeneity of KRD severity in Guangxi. Severe KRD is mainly concentrated in Hechi city and Baise city, due to several key factors. First, these areas are characterized by the widespread presence of high-purity carbonate rocks. Second, the topography is dominated by peak-cluster depressions and peak-forest valleys, with numerous mountains, limited flat land, and generally steep slopes. Such steep terrain accelerates surface runoff and enhances erosive forces [59]. Coupled with the region’s concentrated rainfall and frequent heavy storms, the thin soil layer is highly susceptible to water erosion, resulting in rapid soil depletion and even bedrock exposure. Third, these areas have historically undergone long-term, high-intensity human activities, including steep-slope cultivation, excessive logging, and overgrazing. In contrast, some other karst regions in Guangxi (e.g., parts of Guilin and Liuzhou) exhibit relatively lower levels of KRD, possibly due to slightly lower carbonate rock purity, gentler terrain (e.g., karst plains), and less intensive human activity.
The evolution of KRD in Guangxi is the result of the combined effects of climate change and human activities, which is consistent with previous research findings [1,6]. From 2005 to 2015, KRD in Guangxi exhibited a predominant trend of recovery, consistent with the findings of Zhang et al. [60]. This recovery was mainly driven by land use changes and region-specific ecological restoration efforts. In the mountainous karst areas of Guangxi, natural vegetation regeneration is typically constrained by shallow soils and exposed rocky substrates. To address this challenge, Guangxi has actively implemented large-scale KRD control measures since the early 21st century, particularly in regions severely affected by KRD, such as Baise and Hechi [61,62,63]. For example, the Grain-to-Green Program (GTGP) restored over 1278.67 km2 of land in Baise city by promoting vegetation regrowth on previously cultivated slopes and abandoned farmlands, thereby significantly improving land cover [61,64]. Additionally, KRD restoration projects that integrate innovative technologies have been carried out through collaboration among the government, research institutions, and local communities [62,63]. These region-specific land-use interventions played a critical role in promoting KRD recovery during this period.
As climate change and human disturbances have intensified, the dominant factors driving the evolution of KRD have gradually shifted. From 2015 to 2020, KRD in Guangxi predominantly deteriorated. During this period, the explanatory power of MAT and POP for KRD increased significantly, whereas that of the other factors declined. These findings suggest that the deterioration of KRD may have been closely associated with rising temperatures and increasing population pressure [65,66]. In the fragile karst regions, rising temperatures exacerbate evapotranspiration from the thin soil layers, leading to accelerated loss of scarce soil moisture. This, in turn, weakens vegetation resilience and aggravates soil degradation. Meanwhile, growing population pressure, when coupled with limited livelihood alternatives and inadequate management, tends to trigger unsustainable practices such as excessive fuelwood collection, cultivation on steep slopes, and overgrazing. These activities reduce vegetation cover and expose the soil surface. Under the influence of intense rainfall and surface runoff, the exposed land is more susceptible to erosion and dissolution, resulting in accelerated soil loss and further progression of KRD.
From 2020 to 2023, KRD in Guangxi returned to a recovery trend. However, during this period, Guangxi experienced rising average temperatures and more frequent extreme climate events [58,67]. Such climatic conditions are generally considered unfavorable for the recovery of KRD. Despite these adverse climatic factors, the extent of KRD significantly decreased, indicating a recovery trend that cannot be fully attributed to natural factors alone. This apparent paradox may be primarily explained by the positive effects of anthropogenic intervention. During this period, the Guangxi government adhered to the principles of ecological priority and green development, and continuously advanced comprehensive KRD control projects. Forest and grassland regeneration measures, such as mountain closure, afforestation, and grass planting, have been widely implemented. Such anthropogenic interventions play a critical role in mitigating the adverse impacts of climate change and promoting ecological restoration.
4.3. Measures and Recommendations for the Prevention and Control of KRD
Based on the analysis of the spatiotemporal evolution of KRD and its driving factors in Guangxi, this study proposes the following measures and recommendations for the prevention and control of KRD:
- (1)
- The strengthening of early warning and intervention for potential KRD areas. Based on the spatiotemporal evolution characteristics of KRD, the period from 2015 to 2020 was marked by an overall trend of deterioration, with the dominant transitions being from no KRD to potential KRD and from potential KRD to light KRD. This indicates the urgent need to shift the focus of prevention and control efforts toward regions that have not yet experienced significant degradation. To this end, it is recommended to strengthen dynamic monitoring and establish an early warning system for potential KRD areas. However, effective implementation requires sustained financial investment, adequate technical capacity, and cross-sectoral coordination. The proposed three-dimensional model in this study demonstrates strong performance in monitoring potential KRD areas, with low operational costs, thereby offering a technically feasible and cost-effective tool for early intervention. Once potential KRD zones are identified, preventive ecological measures, such as restricting cultivation on sloped farmland and implementing soil and water conservation practices, should be implemented in these regions to curb further degradation.
- (2)
- The implementation of spatially integrated KRD control strategies. On the one hand, given the characteristics of severe KRD patches—difficult to restore and easy to degradation—priority should be given to implementing large-scale, contiguous ecological restoration in these patches and their surrounding areas. This strategy can improve ecological connectivity, enhance positive diffusion effects, and promote systemic ecological recovery. On the other hand, potential or light KRD patches in close proximity to severe KRD patches are more likely to experience further degradation due to the degradation pressure from nearby severe KRD patches. Therefore, it is recommended to establish ecological buffer zones between such patches and severe KRD areas in order to mitigate negative interactions and prevent further degradation.
- (3)
- The implementation of differentiated KRD control strategies based on slope zoning. This study identifies slope as a key driving factor influencing the spatial distribution of KRD in Guangxi. Therefore, slope should be fully considered in KRD control, and it is recommended that differentiated, site-specific management strategies be adopted accordingly. In steep-slope areas (slope greater than 25°), where the ecological environment is extremely fragile and natural recovery capacity is limited, mountain closure for afforestation should be prioritized, aiming to minimize human disturbance and promote natural regeneration. In moderate-slope areas (slope between 15° and 25°), it is advisable to plant cold- and drought-tolerant tree and shrub species that offer both ecological and economic benefits. In practice, the promotion of such ecological-economic species requires complementary support in the form of stable market channels and technical guidance. These efforts should be complemented by soil and water conservation measures, such as slope stabilization and the construction of small-scale water conservancy facilities. In gentle-slope areas (slope less than 15°), where conditions are more suitable for agricultural production, priority should be given to ecological agriculture. Measures such as terracing, constructing field ridges, and excavating interception ditches can improve land-use efficiency, reduce soil erosion, and enhance both farmland ecosystem functions and land productivity.
- (4)
- The enhancement of adaptive capacity to erosive rainfall events. This study finds that erosive rainfall has a stronger explanatory power for KRD than average annual precipitation, highlighting the critical influence of rainfall intensity on KRD processes. Therefore, we recommend the establishment of a regional monitoring system for erosive rainfall. It is also recommended that erosive rainfall be included as a key criterion in delineating priority KRD management zones and in formulating ecological compensation standards. In areas prone to intense rainfall, a series of targeted soil and water conservation measures, such as contour terraces, drainage ditches, and vegetation buffer strips, should be implemented to reduce the erosive power of surface runoff and mitigate land degradation.
4.4. Limitations and Future Directions
In this study, the driving factors were selected based on the natural and anthropogenic conditions specific to Guangxi. In other geographical regions, particularly those with distinct climatic, geological, or socioeconomic contexts, additional or alternative factors may need to be considered to fully capture the mechanisms underlying KRD. For instance, in arid karst regions, factors such as groundwater table fluctuations or prolonged drought conditions may play a more significant role in shaping KRD dynamics. Moreover, this study focused on retrospective analysis rather than predictive modeling. To enhance the practical utility of KRD monitoring and management, future research should incorporate predictive approaches, such as machine learning algorithms or scenario-based simulations, to anticipate potential trajectories of KRD under varying climate and socioeconomic scenarios.
5. Conclusions
This study first proposed a three-dimensional feature space model (kNDVI-KBRI-SE) to monitor KRD in Guangxi and validated its performance against two-dimensional feature space models and an evaluation index method. We then applied transition matrices, dynamic degree indices, and landscape metrics to analyze the spatiotemporal evolution characteristics of KRD in Guangxi from 2000 to 2023. Finally, we utilized GeoDetector to analyze the driving factors of KRD. The main conclusions are summarized as follows:
- (1)
- The three-dimensional kNDVI-KBRI-SE feature space model exhibited the highest performance, with an overall accuracy of 92.86%. Both the user’s and producer’s accuracies in distinguishing different KRD levels were stable, indicating the model’s potential for large-scale KRD monitoring. In contrast, the kNDVI-SE feature space model and the evaluation index method exhibited relatively lower performance.
- (2)
- KRD in Guangxi exhibited an overall recovery–deterioration–recovery trend from 2000 to 2023. The main recovery phases were 2005–2015 and 2020–2023. During these intervals, both severe and moderate KRD showed high negative dynamic degrees of area, NP, and LSI, and their mean STII remained relatively low. In contrast, between 2015 and 2020, KRD predominantly deteriorated, primarily via transitions from no KRD to potential KRD and from potential KRD to light KRD.
- (3)
- The critical thresholds of interaction intensity required between severe KRD patches and their neighboring patches differed significantly between recovery and deterioration processes. Specifically, the interaction intensity threshold triggering patch recovery was substantially higher than that leading to deterioration.
- (4)
- For single factors, slope, land use, and elevation were the primary drivers of KRD in Guangxi from 2000 to 2023. Annual erosive rainfall explained the distribution of KRD better than mean annual precipitation. Moreover, two-factor interactions significantly enhanced the driving forces of KRD. In particular, the interactions between slope and annual erosive rainfall, mean annual temperature, land use, and elevation each exhibited substantial explanatory power for KRD.
Several promising directions merit further exploration. First, incorporating additional potential drivers such as subsurface hydrological processes and underground karst development could enhance the comprehensiveness of KRD analyses. Second, simulating and projecting KRD dynamics under different climate and socioeconomic scenarios would provide stronger support for adaptive policy and planning.
Author Contributions
Conceptualization, J.S., M.L., X.L. and Y.W.; methodology, J.S. and M.L.; software, J.S., M.L. and X.L.; validation, J.S., Q.Y. and X.L.; formal analysis, J.S. and M.L.; investigation, J.S., Q.Y., X.L. and Z.W.; resources, M.L., X.L. and Z.W.; data curation, J.S. and M.L.; writing—original draft preparation, J.S.; writing—review and editing, J.S., M.L. and Q.Y.; visualization, J.S., Q.Y. and Y.W.; supervision, M.L.; project administration, M.L.; funding acquisition, M.L. and X.L. All authors have read and agreed to the published version of the manuscript.
Funding
This research was funded by the National Key Research and Development Program of China (2022YFF1300702) and Key Laboratory of Spatial Data Mining & Information Sharing of Ministry of Education, Fuzhou University (2022LSMDIS08).
Data Availability Statement
The original contributions presented in the study are included in the article, further inquiries can be directed to the corresponding author.
Acknowledgments
The authors are grateful to the anonymous reviewers for their constructive comments and to the editor for their assistance with this article.
Conflicts of Interest
The authors declare no conflicts of interest.
Appendix A
Table A1.
Visual interpretation criteria for KRD.
Table A1.
Visual interpretation criteria for KRD.
| KRD Level | Remote Sensing Imagery | Interpretation Indicator |
|---|---|---|
| No-KRD |  | Vegetation is continuously distributed with high coverage and no exposed bedrock, appearing as a saturated green tone in remote sensing imagery. |
| Potential-KRD |  | Vegetation exhibits high coverage, with dominant green or light green tones and no apparent bedrock exposure. |
| Light-KRD |  | The area is characterized by low vegetation coverage and exposed bedrock, which appears as grayish-white spots or small patches in remote sensing imagery. |
| Moderate-KRD |  | Bedrock and bare soil are exposed in patches, with sparse vegetation cover, appearing as dark gray or gray tones in remote sensing imagery. |
| Severe-KRD |  | Bedrock is extensively exposed in patches, largely devoid of vegetation, and appears bright white in remote sensing imagery. |
References
- Jiang, Z.; Lian, Y.; Qin, X. Rocky desertification in Southwest China: Impacts, causes, and restoration. Earth-Sci. Rev. 2014, 132, 1–12. [Google Scholar] [CrossRef]
- Gutiérrez, F.; Parise, M.; De Waele, J.; Jourde, H. A review on natural and human-induced geohazards and impacts in karst. Earth-Sci. Rev. 2014, 138, 61–88. [Google Scholar] [CrossRef]
- Wang, S.J.; Liu, Q.M.; Zhang, D.F. Karst rocky desertification in southwestern China: Geomorphology, landuse, impact and rehabilitation. Land Degrad. Dev. 2004, 15, 115–121. [Google Scholar] [CrossRef]
- Zhang, J.; Liu, M.; Liu, X.; Luo, W.; Wu, L.; Zhu, L. Spectral analysis of seasonal rock and vegetation changes for detecting karst rocky desertification in southwest China. Int. J. Appl. Earth Obs. Geoinf. 2021, 100, 102337. [Google Scholar] [CrossRef]
- Chang, J.; Li, Q.; Zhai, L.; Liao, C.; Qi, X.; Zhang, Y.; Wang, K. Comprehensive assessment of rocky desertification treatment in Southwest China karst. Land Degrad. Dev. 2024, 35, 3461–3476. [Google Scholar] [CrossRef]
- Guo, B.; Yang, F.; Fan, Y.; Zang, W. The dominant driving factors of rocky desertification and their variations in typical mountainous karst areas of Southwest China in the context of global change. Catena 2023, 220, 106674. [Google Scholar] [CrossRef]
- Wu, X.; Zhou, Z.; Zhu, M.; Huang, D.; Zhu, C.; Feng, Q.; Luo, W. Study on the coupling relationship between relocation for poverty alleviation and spatiotemporal evolution of rocky desertification in karst areas of Southwest China. Sustainability 2022, 14, 8037. [Google Scholar] [CrossRef]
- Li, Y.; Yu, M.; Zhang, H.; Xie, Y. From expansion to shrinkage: Exploring the evolution and transition of karst rocky desertification in karst mountainous areas of Southwest China. Land Degrad. Dev. 2023, 34, 5662–5672. [Google Scholar] [CrossRef]
- Wang, K.; Han, L.; Liao, J. Threshold analysis of the key factors of rocky desertification evolution in the typical karst region of China. All Earth 2025, 37, 1–14. [Google Scholar] [CrossRef]
- Jiang, Z.; Ni, X.; Xing, M. A study on spatial and temporal dynamic changes of desertification in northern China from 2000 to 2020. Remote Sens. 2023, 15, 1368. [Google Scholar] [CrossRef]
- Cai, J.; Yu, W.; Fang, Q.; Zi, R.; Fang, F.; Zhao, L. Extraction of rocky desertification information in the karst area based on the red-NIR-SWIR spectral feature space. Remote Sens. 2023, 15, 3056. [Google Scholar] [CrossRef]
- Zhang, X.; Shang, K.; Cen, Y.; Shuai, T.; Sun, Y. Estimating ecological indicators of karst rocky desertification by linear spectral unmixing method. Int. J. Appl. Earth Obs. Geoinf. 2014, 31, 86–94. [Google Scholar] [CrossRef]
- Xie, X.; Tian, S.; Du, P.; Zhan, W.; Samat, A.; Chen, J. Quantitative estimation of carbonate rock fraction in karst regions using field spectra in 2.0–2.5 μm. Remote Sens. 2016, 8, 68. [Google Scholar] [CrossRef]
- Ball, J.E.; Anderson, D.T.; Chan, C.S. Comprehensive survey of deep learning in remote sensing: Theories, tools, and challenges for the community. J. Appl. Remote Sens. 2017, 11, 042609. [Google Scholar] [CrossRef]
- Benkendorf, D.J.; Schwartz, S.D.; Cutler, D.R.; Hawkins, C.P. Correcting for the effects of class imbalance improves the performance of machine-learning based species distribution models. Ecol. Model. 2023, 483, 110414. [Google Scholar] [CrossRef]
- Wen, Y.; Guo, B.; Zang, W.; Lai, J.; Li, R. Quantitative discrimination of the influences of climate change and human activity on rocky desertification based on a novel feature space model. Open Geosci. 2022, 14, 367–381. [Google Scholar] [CrossRef]
- Guo, B.; Xu, M.; Zhang, R.; Lu, M. Dynamic monitoring of rocky desertification utilizing a novel model based on Sentinel-2 images and KNDVI. Geomat. Nat. Hazards Risk 2024, 15, 2399659. [Google Scholar] [CrossRef]
- Wu, X.; Zhou, Z.; Zhu, M.; Wang, J.; Liu, R.; Zheng, J.; Wan, J. Quantifying Spatiotemporal Characteristics and Identifying Influential Factors of Ecosystem Fragmentation in Karst Landscapes: A Comprehensive Analytical Framework. Land 2024, 13, 278. [Google Scholar] [CrossRef]
- Wu, Z.; Zhu, D.; Xiong, K.; Wang, X. Dynamics of landscape ecological quality based on benefit evaluation coupled with the rocky desertification control in South China Karst. Ecol. Indic. 2022, 138, 108870. [Google Scholar] [CrossRef]
- Wu, S.; Wang, D.; Yan, Z.; Wang, X.; Han, J. Spatiotemporal dynamics of urban green space in Changchun: Changes, transformations, landscape patterns, and drivers. Ecol. Indic. 2023, 147, 109958. [Google Scholar] [CrossRef]
- Zhang, J.; Dai, M.; Wang, L.; Zeng, C.; Su, W. The challenge and future of rocky desertification control in karst areas in southwest China. Solid Earth 2016, 7, 83–91. [Google Scholar] [CrossRef]
- Pu, J.; Zhao, X.; Ran, Y.; Huang, P.; Gu, Z.; Zhang, Y.; Wu, B.; Qu, G. Relative forces of anthropogenic and natural factors on the evolution of “ecological cancer”—Rocky desertification under different man-land relationships. Environ. Monit. Assess. 2025, 197, 174. [Google Scholar] [CrossRef]
- Jiang, M.; Lin, Y.; Chan, T.O.; Yao, Y.; Zheng, G.; Luo, S.; Zhang, L.; Liu, D. Geologic factors leadingly drawing the macroecological pattern of rocky desertification in southwest China. Sci. Rep. 2020, 10, 1440. [Google Scholar] [CrossRef]
- Wang, Y.; Tang, X.; Huang, Y.; Yang, J.; Lu, J. Identification and factor analysis of rocky desertification severity levels in large-scale karst areas based on deep learning image segmentation. Ecol. Indic. 2024, 167, 112565. [Google Scholar] [CrossRef]
- Xu, S.; Wang, J.; Altansukh, O.; Chuluun, T. Spatiotemporal evolution and driving mechanisms of desertification on the Mongolian Plateau. Sci. Total Environ. 2024, 941, 173566. [Google Scholar] [CrossRef]
- Gao, W.; Zhou, S.; Yin, X. Spatio-Temporal Evolution Characteristics and Driving Factors of Typical Karst Rocky Desertification Area in the Upper Yangtze River. Sustainability 2024, 16, 2669. [Google Scholar] [CrossRef]
- Chen, F.; Wang, S.; Bai, X.; Liu, F.; Zhou, D.; Tian, Y.; Luo, G.; Li, Q.; Wu, L.; Zheng, C. Assessing spatial-temporal evolution processes and driving forces of karst rocky desertification. Geocarto Int. 2021, 36, 262–280. [Google Scholar] [CrossRef]
- Xiaoqing, L.; Xiuqiao, X.; Binggeng, X.; Ru, L.; Kaichun, Z. Influence of rural residential areas on the evolution of rocky desertification in Karst area. Econ. Geogr. 2020, 40, 154–163. [Google Scholar]
- Guo, B.; Yang, F.; Fan, J.; Lu, Y. The changes of spatiotemporal pattern of rocky desertification and its dominant driving factors in typical karst mountainous areas under the background of global change. Remote Sens. 2022, 14, 2351. [Google Scholar] [CrossRef]
- Chen, S.; Wei, X.; Cai, Y.; Li, H.; Li, L.; Pu, J. Spatiotemporal evolution of rocky desertification and soil erosion in karst area of Chongqing and its driving factors. Catena 2024, 242, 108108. [Google Scholar] [CrossRef]
- Luo, X.; Shen, C.; Chen, F.; Ran, C.; Chen, H.; Zhang, Y.; Zhu, G. Evolution of rocky desertification and its response to land use change in Karst area. Environ. Earth Sci. 2024, 83, 511. [Google Scholar] [CrossRef]
- Nie, C.; Li, H.; Yang, L.; Ye, B.; Dai, E.; Wu, S.; Liu, Y.; Liao, Y. Spatial and temporal changes in extreme temperature and extreme precipitation in Guangxi. Quat. Int. 2012, 263, 162–171. [Google Scholar] [CrossRef]
- Huang, J.; Li, X.; Tian, Y.; Sun, J.; Yang, Q.; Yang, M.; Wang, S. A novel evaluation method-based effect analysis of urbanization on extreme precipitation in Guangxi, South China. Theor. Appl. Climatol. 2024, 155, 5957–5971. [Google Scholar] [CrossRef]
- Shi, Z.-H.; Li, L.; Yin, W.; Ai, L.; Fang, N.-F.; Song, Y.-T. Use of multi-temporal Landsat images for analyzing forest transition in relation to socioeconomic factors and the environment. Int. J. Appl. Earth Obs. Geoinf. 2011, 13, 468–476. [Google Scholar] [CrossRef]
- Camps-Valls, G.; Campos-Taberner, M.; Moreno-Martínez, Á.; Walther, S.; Duveiller, G.; Cescatti, A.; Mahecha, M.D.; Muñoz-Marí, J.; García-Haro, F.J.; Guanter, L. A unified vegetation index for quantifying the terrestrial biosphere. Sci. Adv. 2021, 7, eabc7447. [Google Scholar] [CrossRef]
- Wang, X.; Biederman, J.A.; Knowles, J.F.; Scott, R.L.; Turner, A.J.; Dannenberg, M.P.; Köhler, P.; Frankenberg, C.; Litvak, M.E.; Flerchinger, G.N. Satellite solar-induced chlorophyll fluorescence and near-infrared reflectance capture complementary aspects of dryland vegetation productivity dynamics. Remote Sens. Environ. 2022, 270, 112858. [Google Scholar] [CrossRef]
- Wang, Q.; Moreno-Martínez, Á.; Muñoz-Marí, J.; Campos-Taberner, M.; Camps-Valls, G. Estimation of vegetation traits with kernel NDVI. ISPRS J. Photogramm. Remote Sens. 2023, 195, 408–417. [Google Scholar] [CrossRef]
- Guo, B.; Zhang, R.; Lu, M.; Xu, M.; Liu, P.; Wang, L. A new large-scale monitoring index of desertification based on kernel normalized difference vegetation index and feature space model. Remote Sens. 2024, 16, 1771. [Google Scholar] [CrossRef]
- Lu, Y.; Li, J.; Song, Z.; Lu, M. Evaluating Sustainable Development in the Middle and Lower Reaches of the Yellow River Basin Using Multiple Data Sources. IEEE Trans. Geosci. Remote Sens. 2024, 63, 1–18. [Google Scholar] [CrossRef]
- Pei, J.; Wang, L.; Huang, N.; Geng, J.; Cao, J.; Niu, Z. Analysis of Landsat-8 OLI imagery for estimating exposed bedrock fractions in typical karst regions of Southwest China using a karst bare-rock index. Remote Sens. 2018, 10, 1321. [Google Scholar] [CrossRef]
- Dai, Q.; Peng, X.; Yang, Z.; Zhao, L. Runoff and erosion processes on bare slopes in the Karst Rocky Desertification Area. Catena 2017, 152, 218–226. [Google Scholar] [CrossRef]
- Cao, Z.; Zhang, K.; He, J.; Yang, Z.; Zhou, Z. Linking rocky desertification to soil erosion by investigating changes in soil magnetic susceptibility profiles on karst slopes. Geoderma 2021, 389, 114949. [Google Scholar] [CrossRef]
- Guo, L.; Liu, R.; Men, C.; Wang, Q.; Miao, Y.; Shoaib, M.; Wang, Y.; Jiao, L.; Zhang, Y. Multiscale spatiotemporal characteristics of landscape patterns, hotspots, and influencing factors for soil erosion. Sci. Total Environ. 2021, 779, 146474. [Google Scholar] [CrossRef]
- Ma, Z.; Xie, Y.; Jiao, J.; Li, L.; Wang, X. The construction and application of an Aledo-NDVI based desertification monitoring model. Procedia Environ. Sci. 2011, 10, 2029–2035. [Google Scholar] [CrossRef]
- Song, Z.; Lu, Y.; Yuan, J.; Lu, M.; Qin, Y.; Sun, D.; Ding, Z. Research on Desertification Monitoring and Vegetation Refinement Extraction Methods Based on the Synergy of Multi-Source Remote Sensing Imagery. IEEE Trans. Geosci. Remote Sens. 2025, 63, 1–19. [Google Scholar]
- Zhi, Y.; Liu, S.; Wang, T.; Duan, H.; Kang, W. Extraction of Desertification Information and Spatiotemporal Change in the Qinghai-Tibetan Plateau Based on Optimal Feature Space Combination. Land Degrad. Dev. 2025, 36, 2746–2763. [Google Scholar] [CrossRef]
- Alhamad, M.N.; Alrababah, M.A.; Feagin, R.A.; Gharaibeh, A. Mediterranean drylands: The effect of grain size and domain of scale on landscape metrics. Ecol. Indic. 2011, 11, 611–621. [Google Scholar] [CrossRef]
- Wu, C.; Gao, P.; Xu, R.; Mu, X.; Sun, W. Influence of landscape pattern changes on water conservation capacity: A case study in an arid/semiarid region of China. Ecol. Indic. 2024, 163, 112082. [Google Scholar] [CrossRef]
- Liu, M.; Liu, X.; Wu, L.; Tang, Y.; Li, Y.; Zhang, Y.; Ye, L.; Zhang, B. Establishing forest resilience indicators in the hilly red soil region of southern China from vegetation greenness and landscape metrics using dense Landsat time series. Ecol. Indic. 2021, 121, 106985. [Google Scholar] [CrossRef]
- Zhou, Z.; Zhang, L.; Wu, T.; Luo, D.; Wu, L.; Chen, Q.; Feng, Q. Changes in ecosystem service values of forests in southwest China’s karst regions from 2001–2020. Forests 2023, 14, 1534. [Google Scholar] [CrossRef]
- Li, M.; Li, X.; Liu, S.; Lyu, X.; Dang, D.; Dou, H.; Wang, K. Analysis of the spatiotemporal variation of landscape patterns and their driving factors in inner Mongolia from 2000 to 2015. Land 2022, 11, 1410. [Google Scholar] [CrossRef]
- Chen, X.; Wei, F. Impact of territorial spatial landscape pattern on PM2.5 and O3 concentrations in the Yangtze River delta urban agglomeration: Exploration and planning strategies. J. Clean. Prod. 2024, 452, 142172. [Google Scholar] [CrossRef]
- Xu, E.; Zhang, H. Human–desertification coupling relationship in a karst region of China. Land Degrad. Dev. 2021, 32, 4988–5003. [Google Scholar] [CrossRef]
- Yang, D.; Yang, Q.; Tong, Z.; Du, W.; Zhang, J. Coupling coordination analysis of production, living, and ecological spaces in wetlands: A case study of Xianghai Wetland nature reserve, China. Ecol. Indic. 2024, 158, 111578. [Google Scholar] [CrossRef]
- Shao, W.; Li, L.; Yan, M.; Meng, Z.; Zhang, L.; Zhang, Q.; Chen, Y. Thirty years’ spatio-temporal evolution of desertification degrees and driving factors in Turpan–Hami Basin, Xinjiang, China. Ecol. Indic. 2024, 166, 112484. [Google Scholar] [CrossRef]
- Zhao, P.; He, S.; Wang, D.; Qi, Y.; Pei, Z.; Yang, Y.; Zhang, Z. Unraveling the impacts of geomorphic indicators on sediment connectivity in a typical debris-flow prone small watershed. J. Hydrol. 2025, 659, 133256. [Google Scholar] [CrossRef]
- Song, Y.; Wang, J.; Ge, Y.; Xu, C. An optimal parameters-based geographical detector model enhances geographic characteristics of explanatory variables for spatial heterogeneity analysis: Cases with different types of spatial data. GIScience Remote Sens. 2020, 57, 593–610. [Google Scholar] [CrossRef]
- Wang, L.; Sun, L.; Li, W.; Chen, X.; Li, Y.; Zou, X.; Jiang, Y. State of China’s climate in 2022. Atmos. Ocean. Sci. Lett. 2023, 16, 100356. [Google Scholar] [CrossRef]
- Yang, Q.-q.; Wang, K.-l.; Zhang, C.; Yue, Y.-m.; Tian, R.-c.; Fan, F.-d. Spatio-temporal evolution of rocky desertification and its driving forces in karst areas of Northwestern Guangxi, China. Environ. Earth Sci. 2011, 64, 383–393. [Google Scholar] [CrossRef]
- Zhang, Y.; Tian, Y.; Li, Y.; Wang, D.; Tao, J.; Yang, Y.; Lin, J.; Zhang, Q.; Wu, L. Machine learning algorithm for estimating karst rocky desertification in a peak-cluster depression basin in southwest Guangxi, China. Sci. Rep. 2022, 12, 19121. [Google Scholar] [CrossRef]
- Feng, X.; Fu, B.; Lu, N.; Zeng, Y.; Wu, B. How ecological restoration alters ecosystem services: An analysis of carbon sequestration in China’s Loess Plateau. Sci. Rep. 2013, 3, 2846. [Google Scholar] [CrossRef]
- Qiu, S.; Peng, J.; Zheng, H.; Xu, Z.; Meersmans, J. How can massive ecological restoration programs interplay with social-ecological systems? A review of research in the South China karst region. Sci. Total Environ. 2022, 807, 150723. [Google Scholar] [CrossRef]
- Wang, K.; Zhang, C.; Chen, H.; Yue, Y.; Zhang, W.; Zhang, M.; Qi, X.; Fu, Z. Karst landscapes of China: Patterns, ecosystem processes and services. Landsc. Ecol. 2019, 34, 2743–2763. [Google Scholar] [CrossRef]
- Luo, D.; Zhou, Z.; Zhang, L.; Chen, Q.; Huang, D.; Feng, Q.; Wu, T.; Wu, L. Evolution and driver analysis of forest carbon stocks in karst mountainous areas of southwest China in the context of rocky desertification management. Catena 2024, 246, 108335. [Google Scholar] [CrossRef]
- Qiu, H.; Hu, B.; Zhang, Z. Impacts of land use change on ecosystem service value based on SDGs report—Taking Guangxi as an example. Ecol. Indic. 2021, 133, 108366. [Google Scholar] [CrossRef]
- Li, L.; Zhao, K.; Wang, X.; Zhao, S.; Liu, X.; Li, W. Spatio-temporal evolution and driving mechanism of urbanization in small cities: Case study from Guangxi. Land 2022, 11, 415. [Google Scholar] [CrossRef]
- Sheng, B.; Dong, B.; Wang, H.; Zhang, M.; Liu, Y.; Li, Q. Extremely persistent precipitation events during April–June 2022 in the southern China: Projected changes at different global warming levels and associated physical processes. Clim. Dyn. 2025, 63, 217. [Google Scholar] [CrossRef]
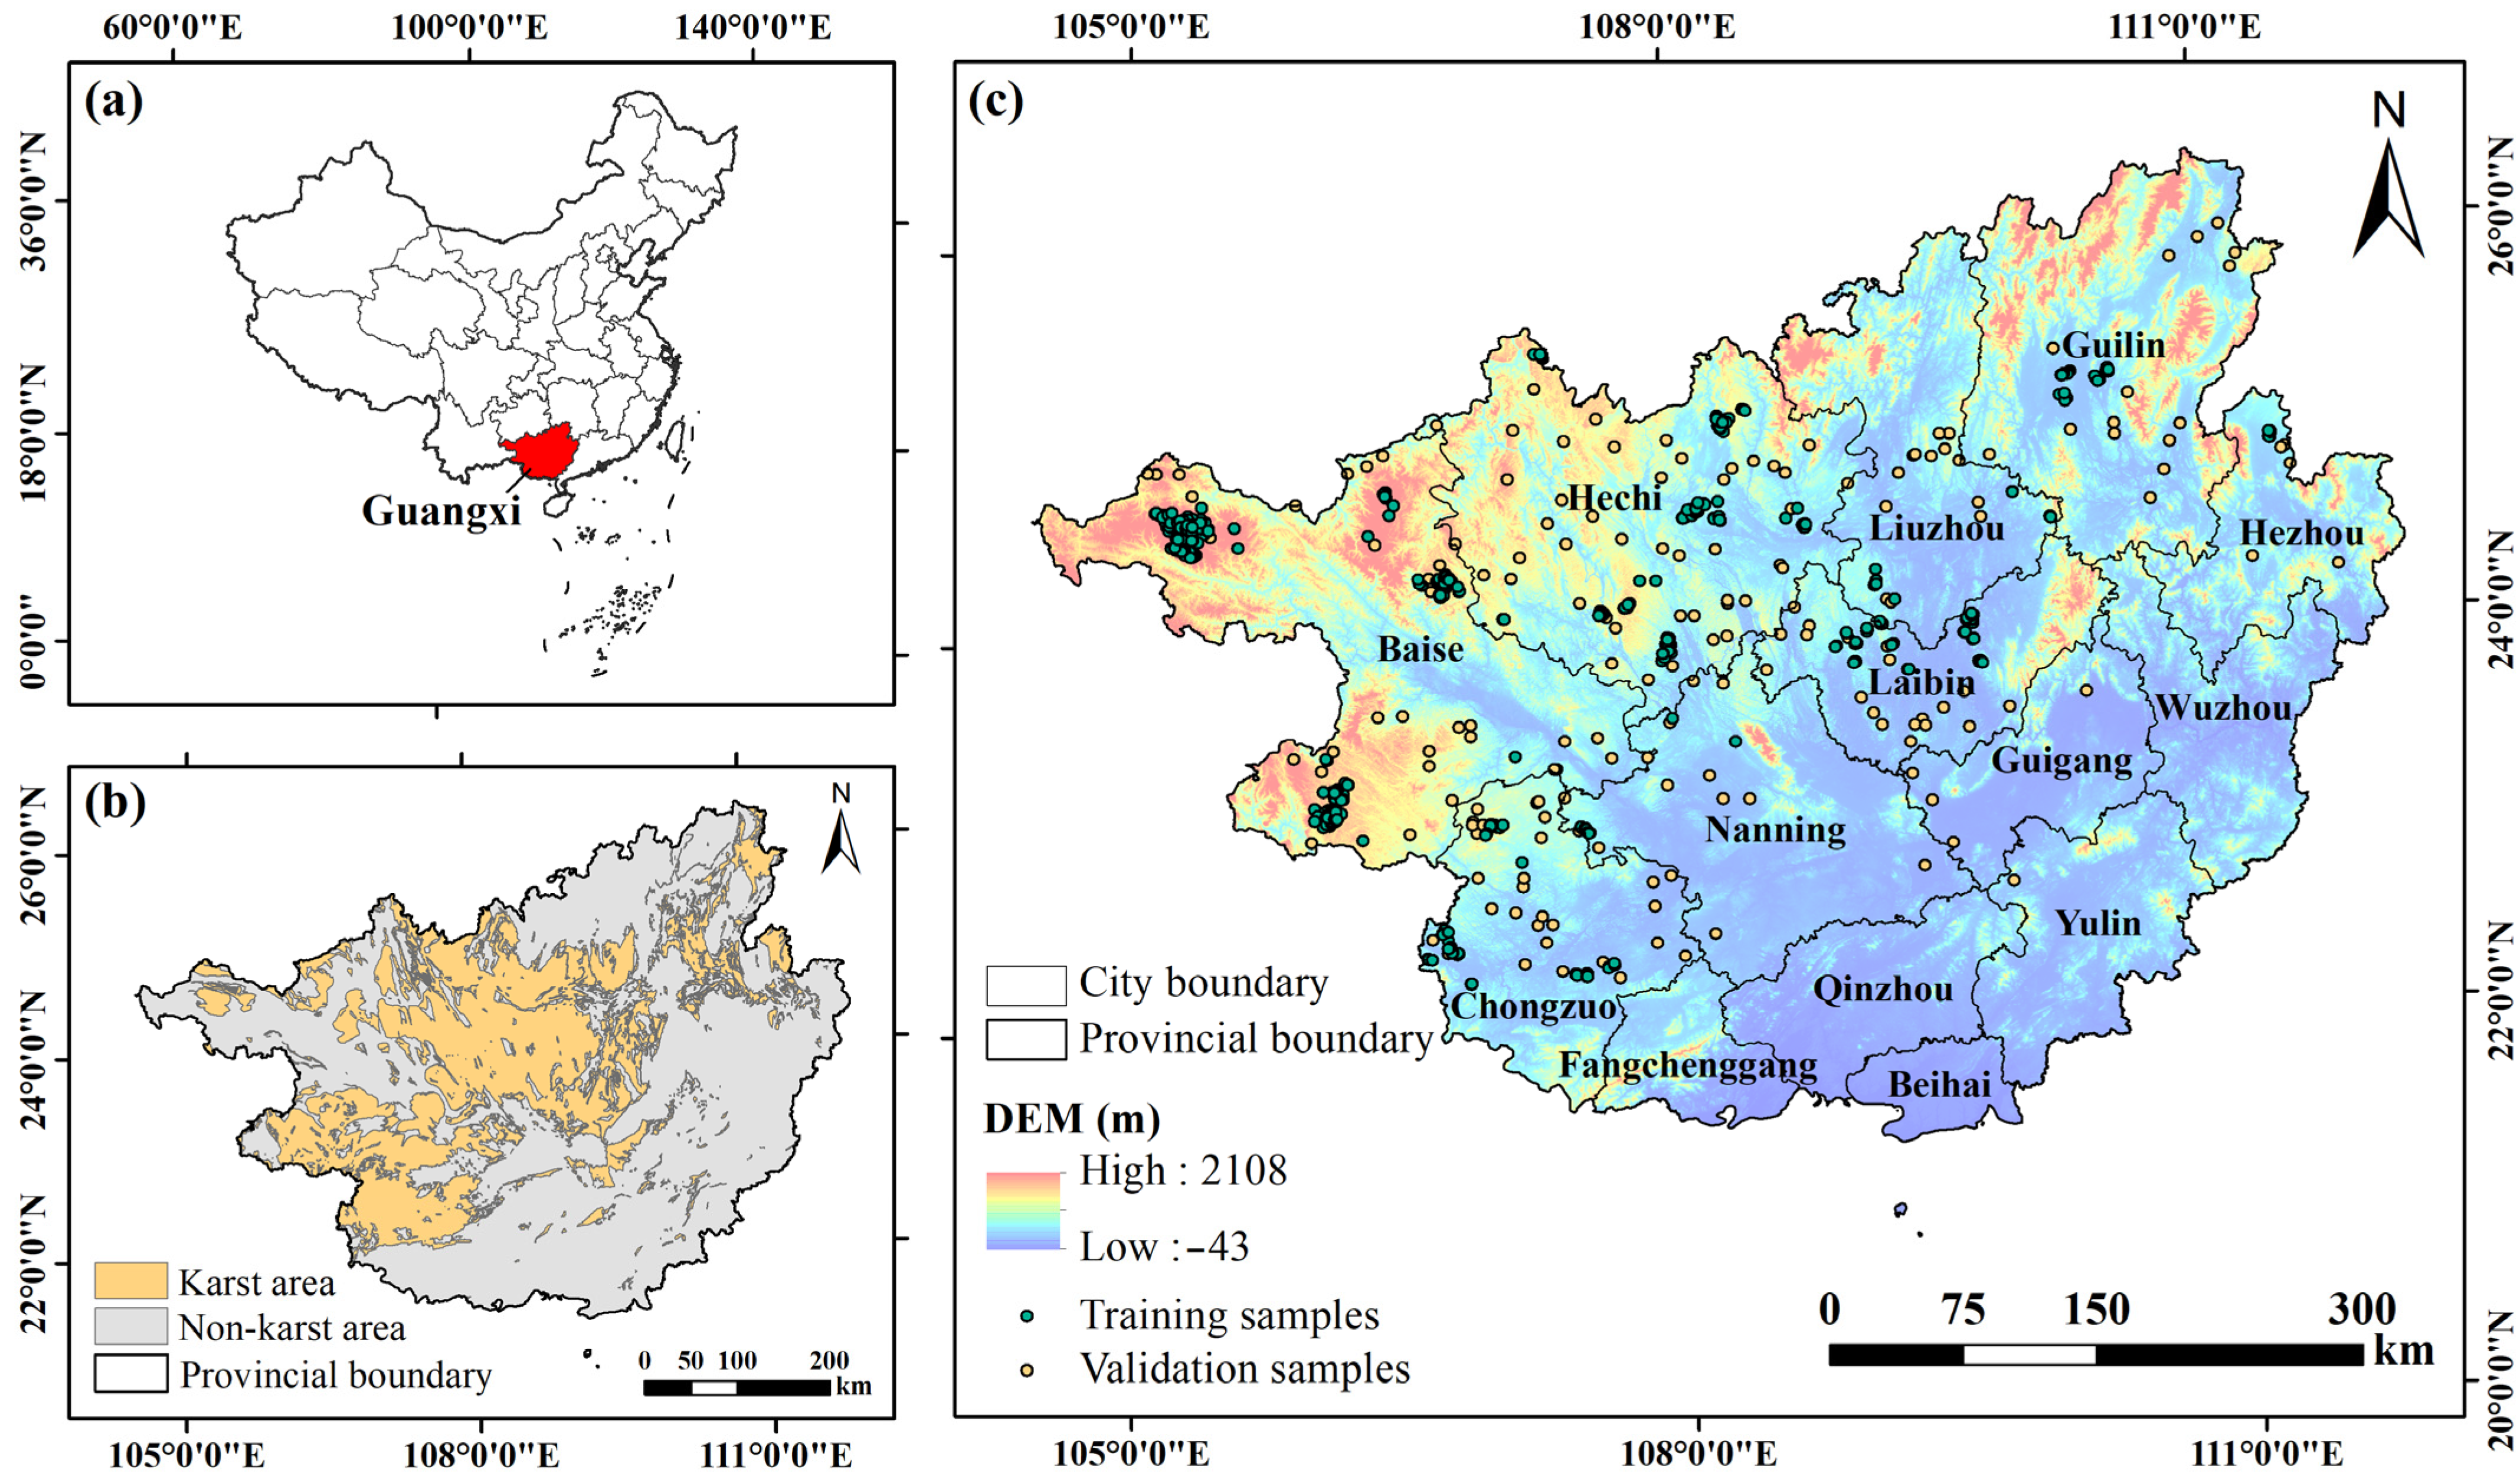
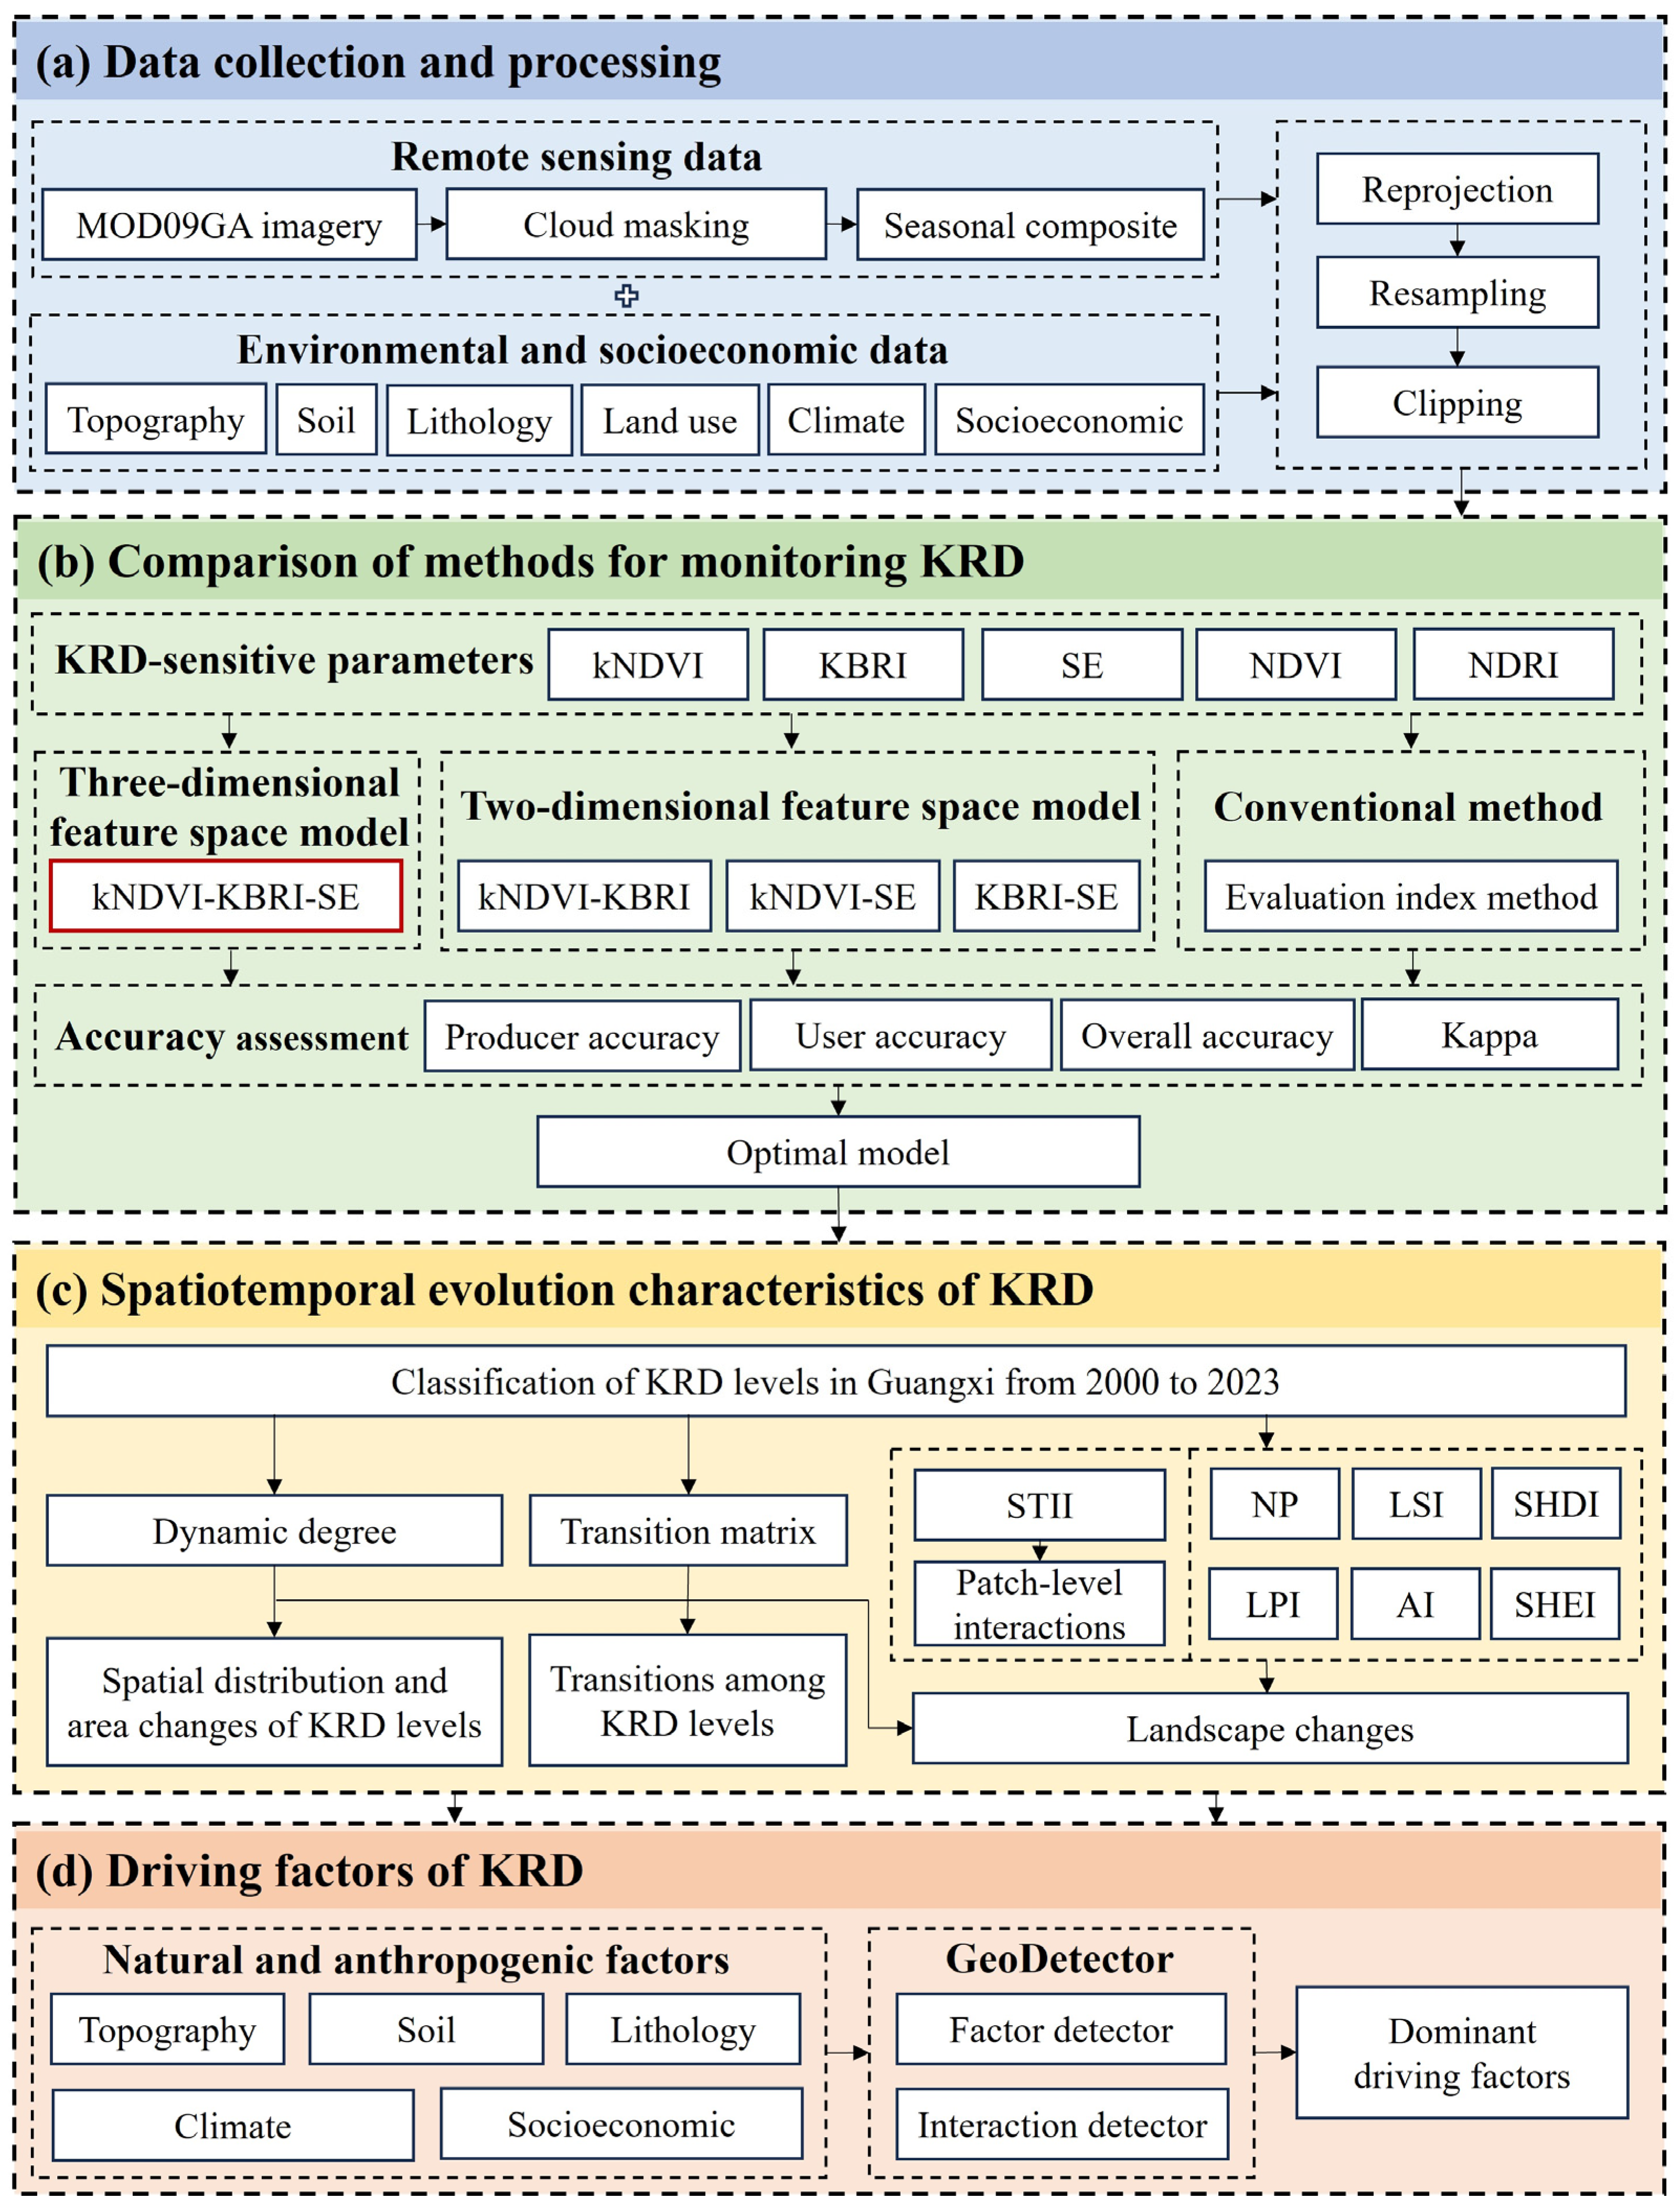
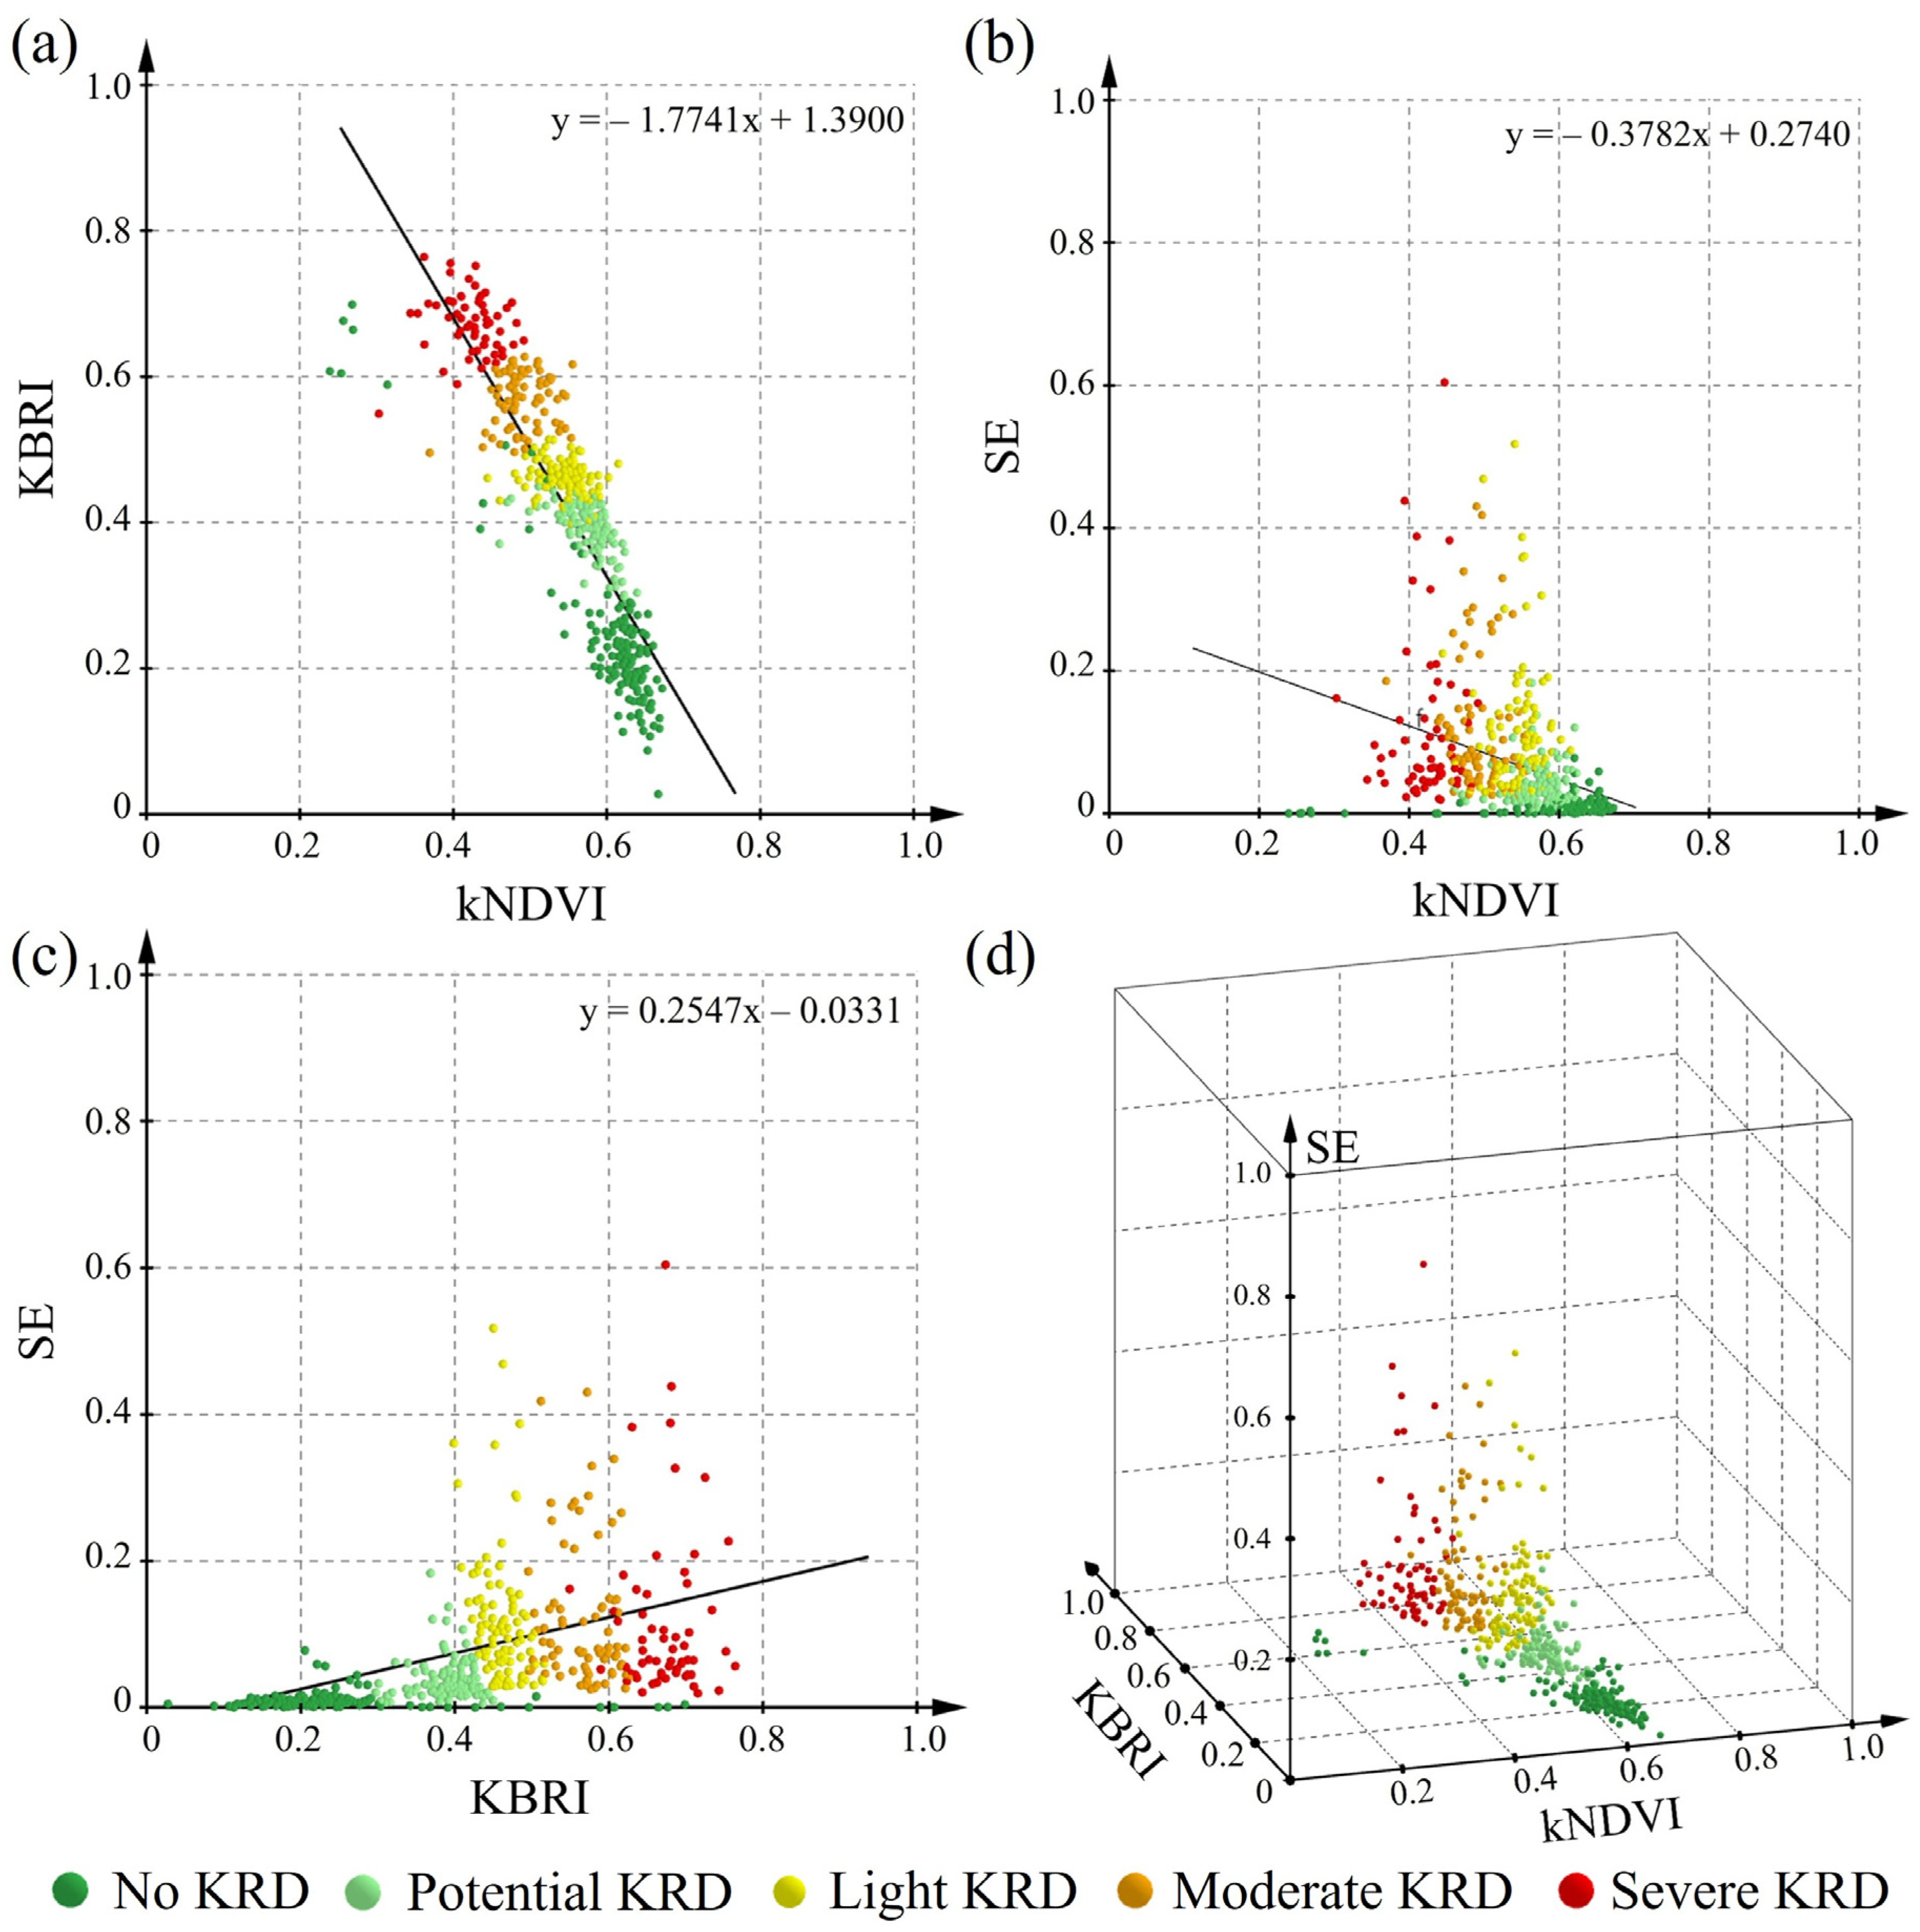
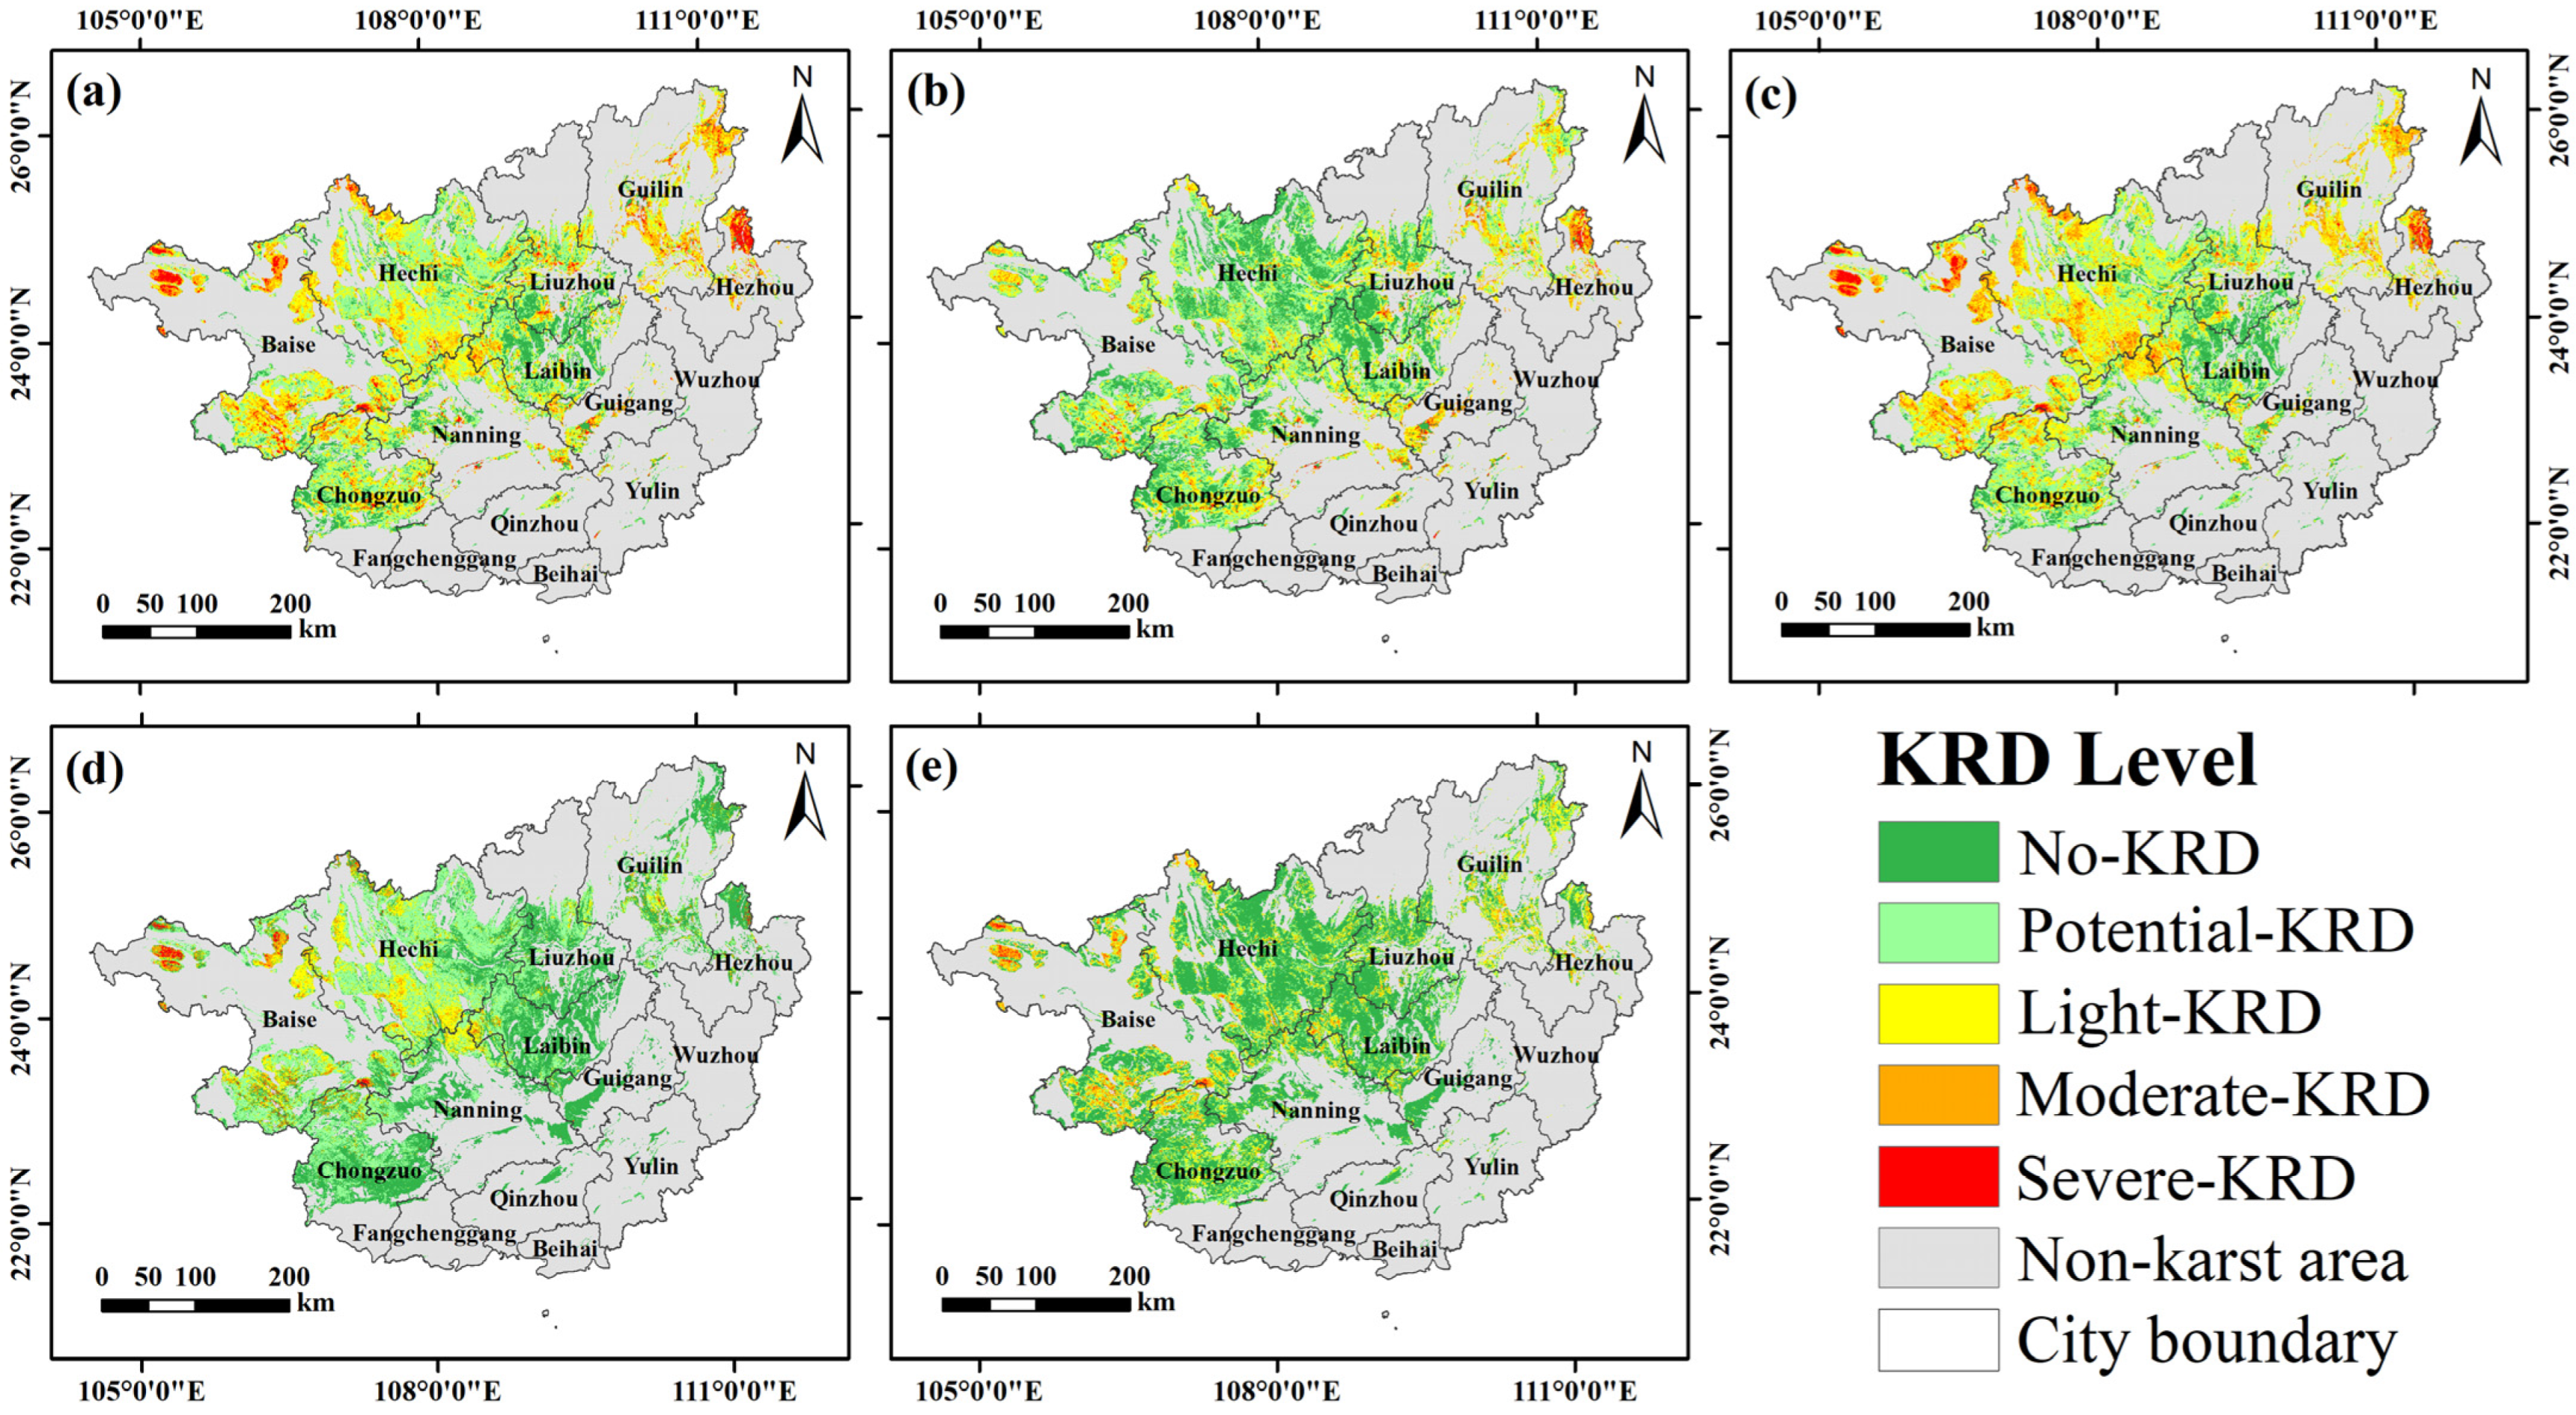
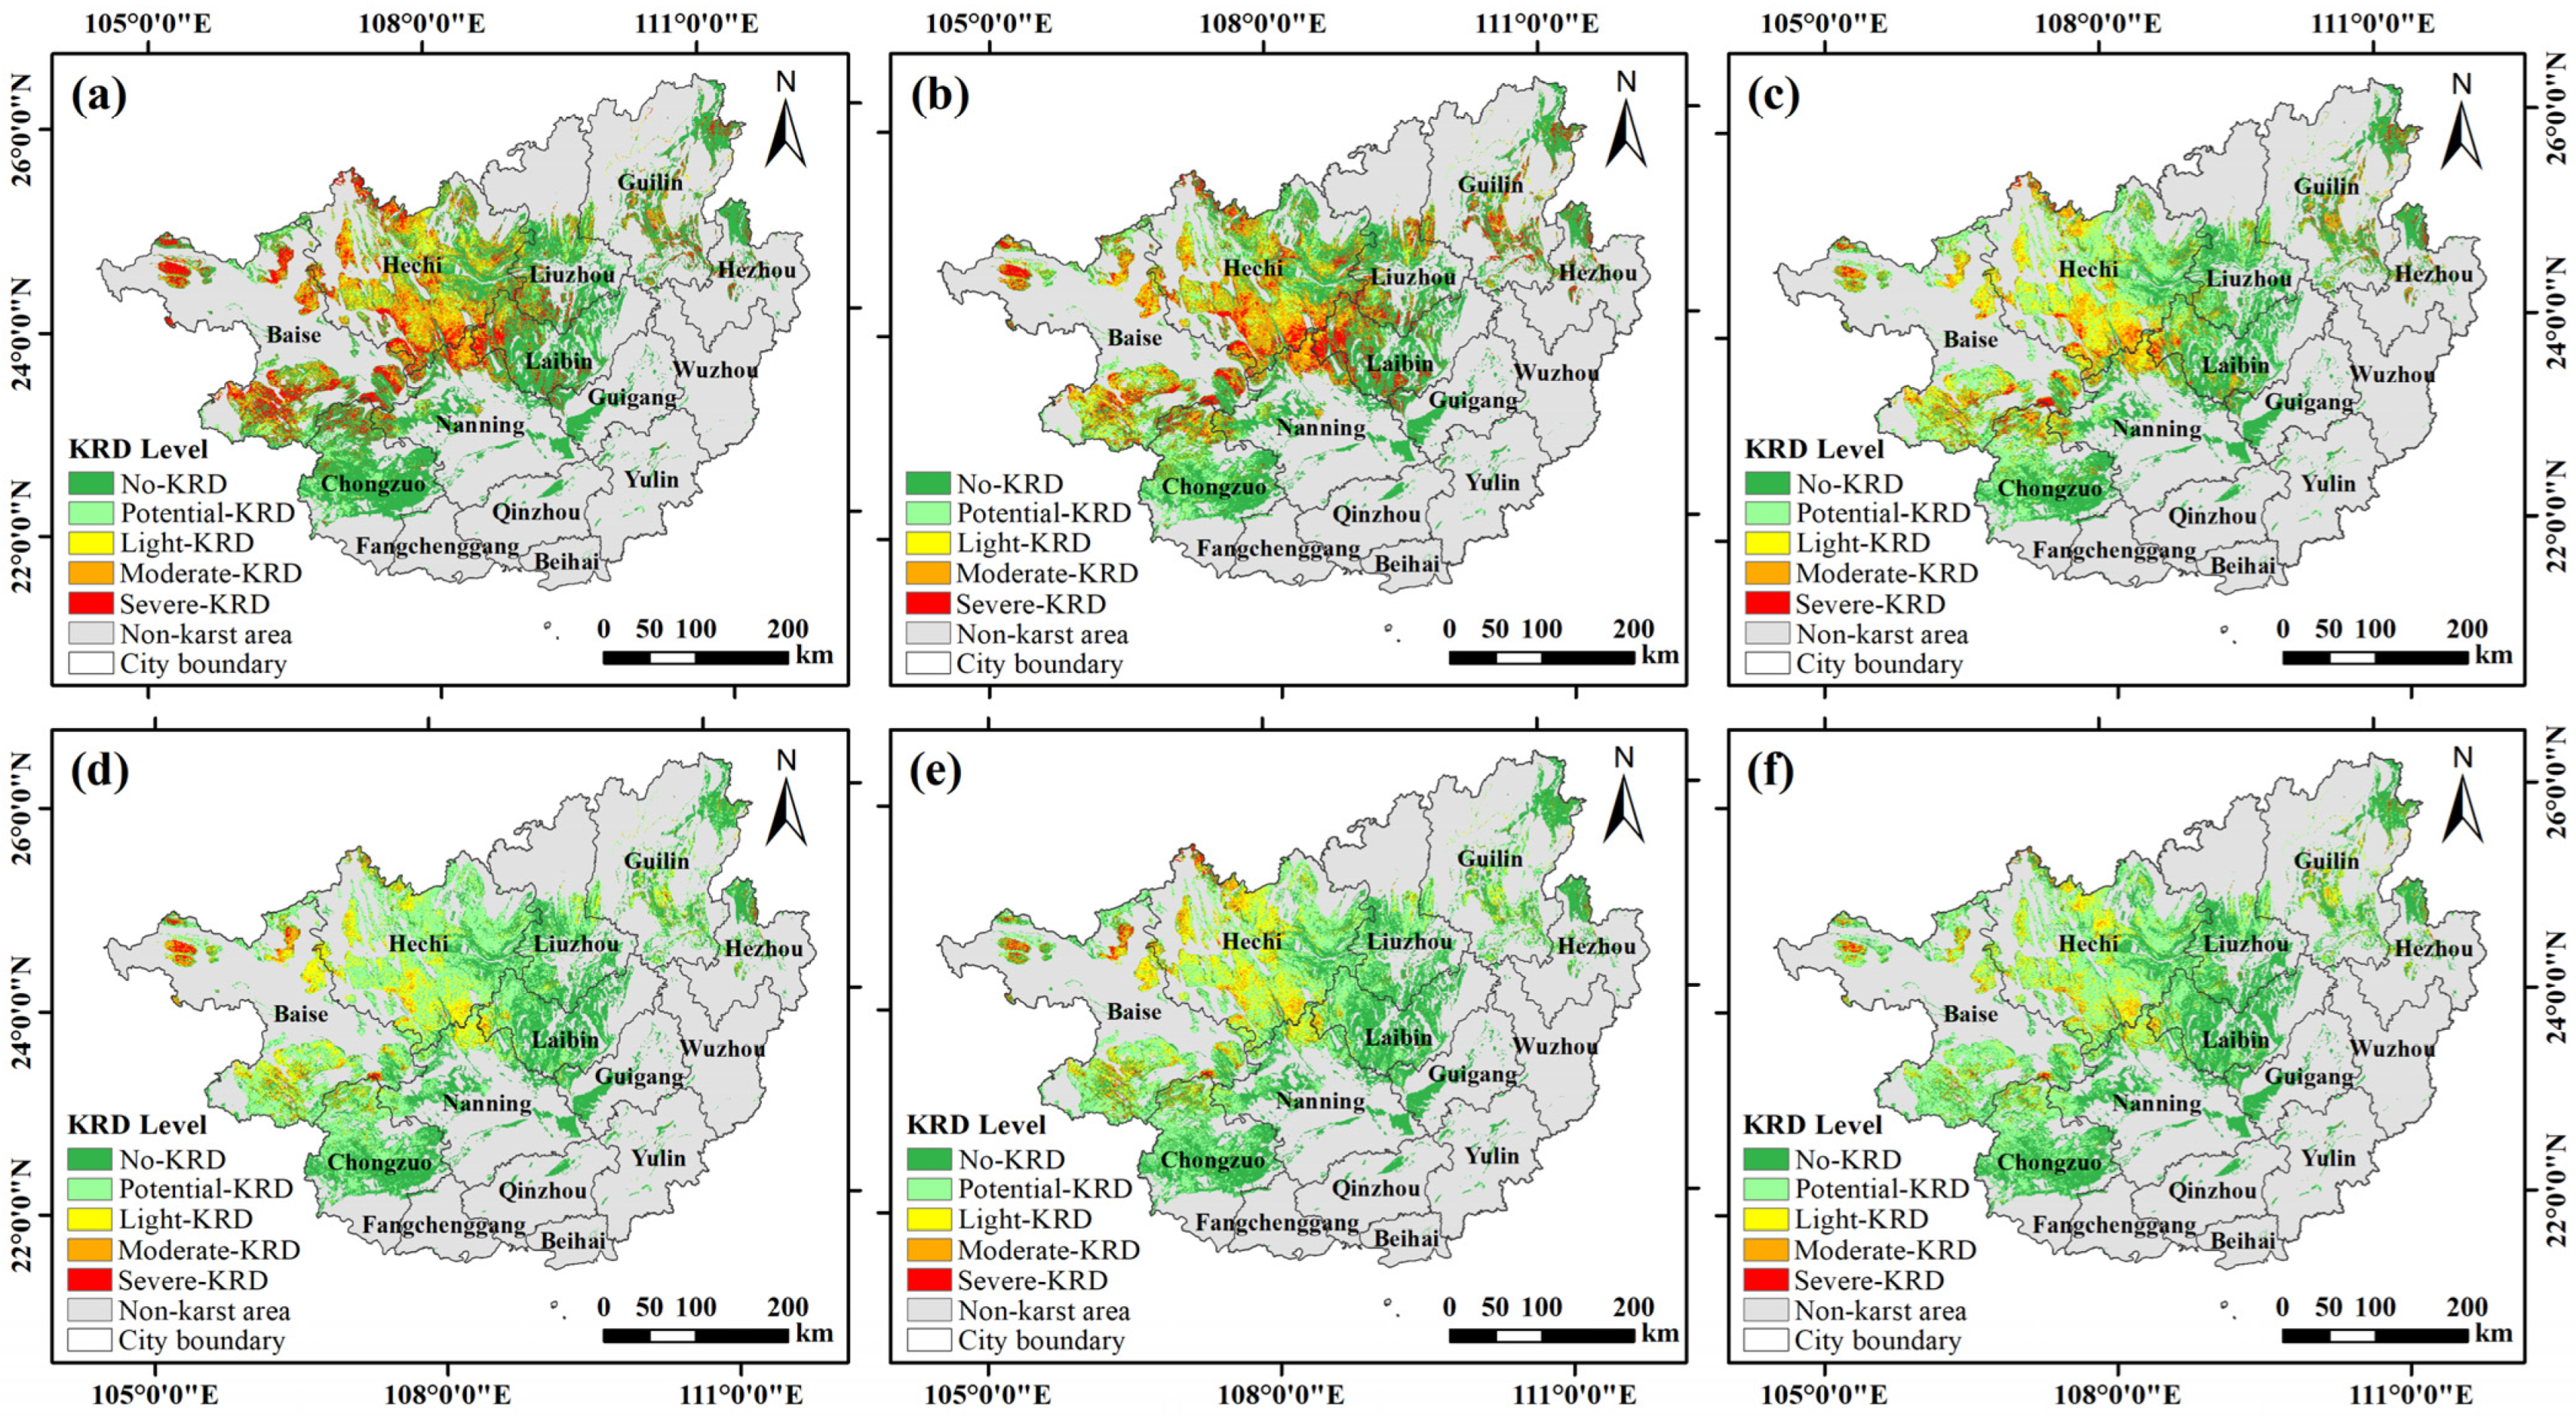
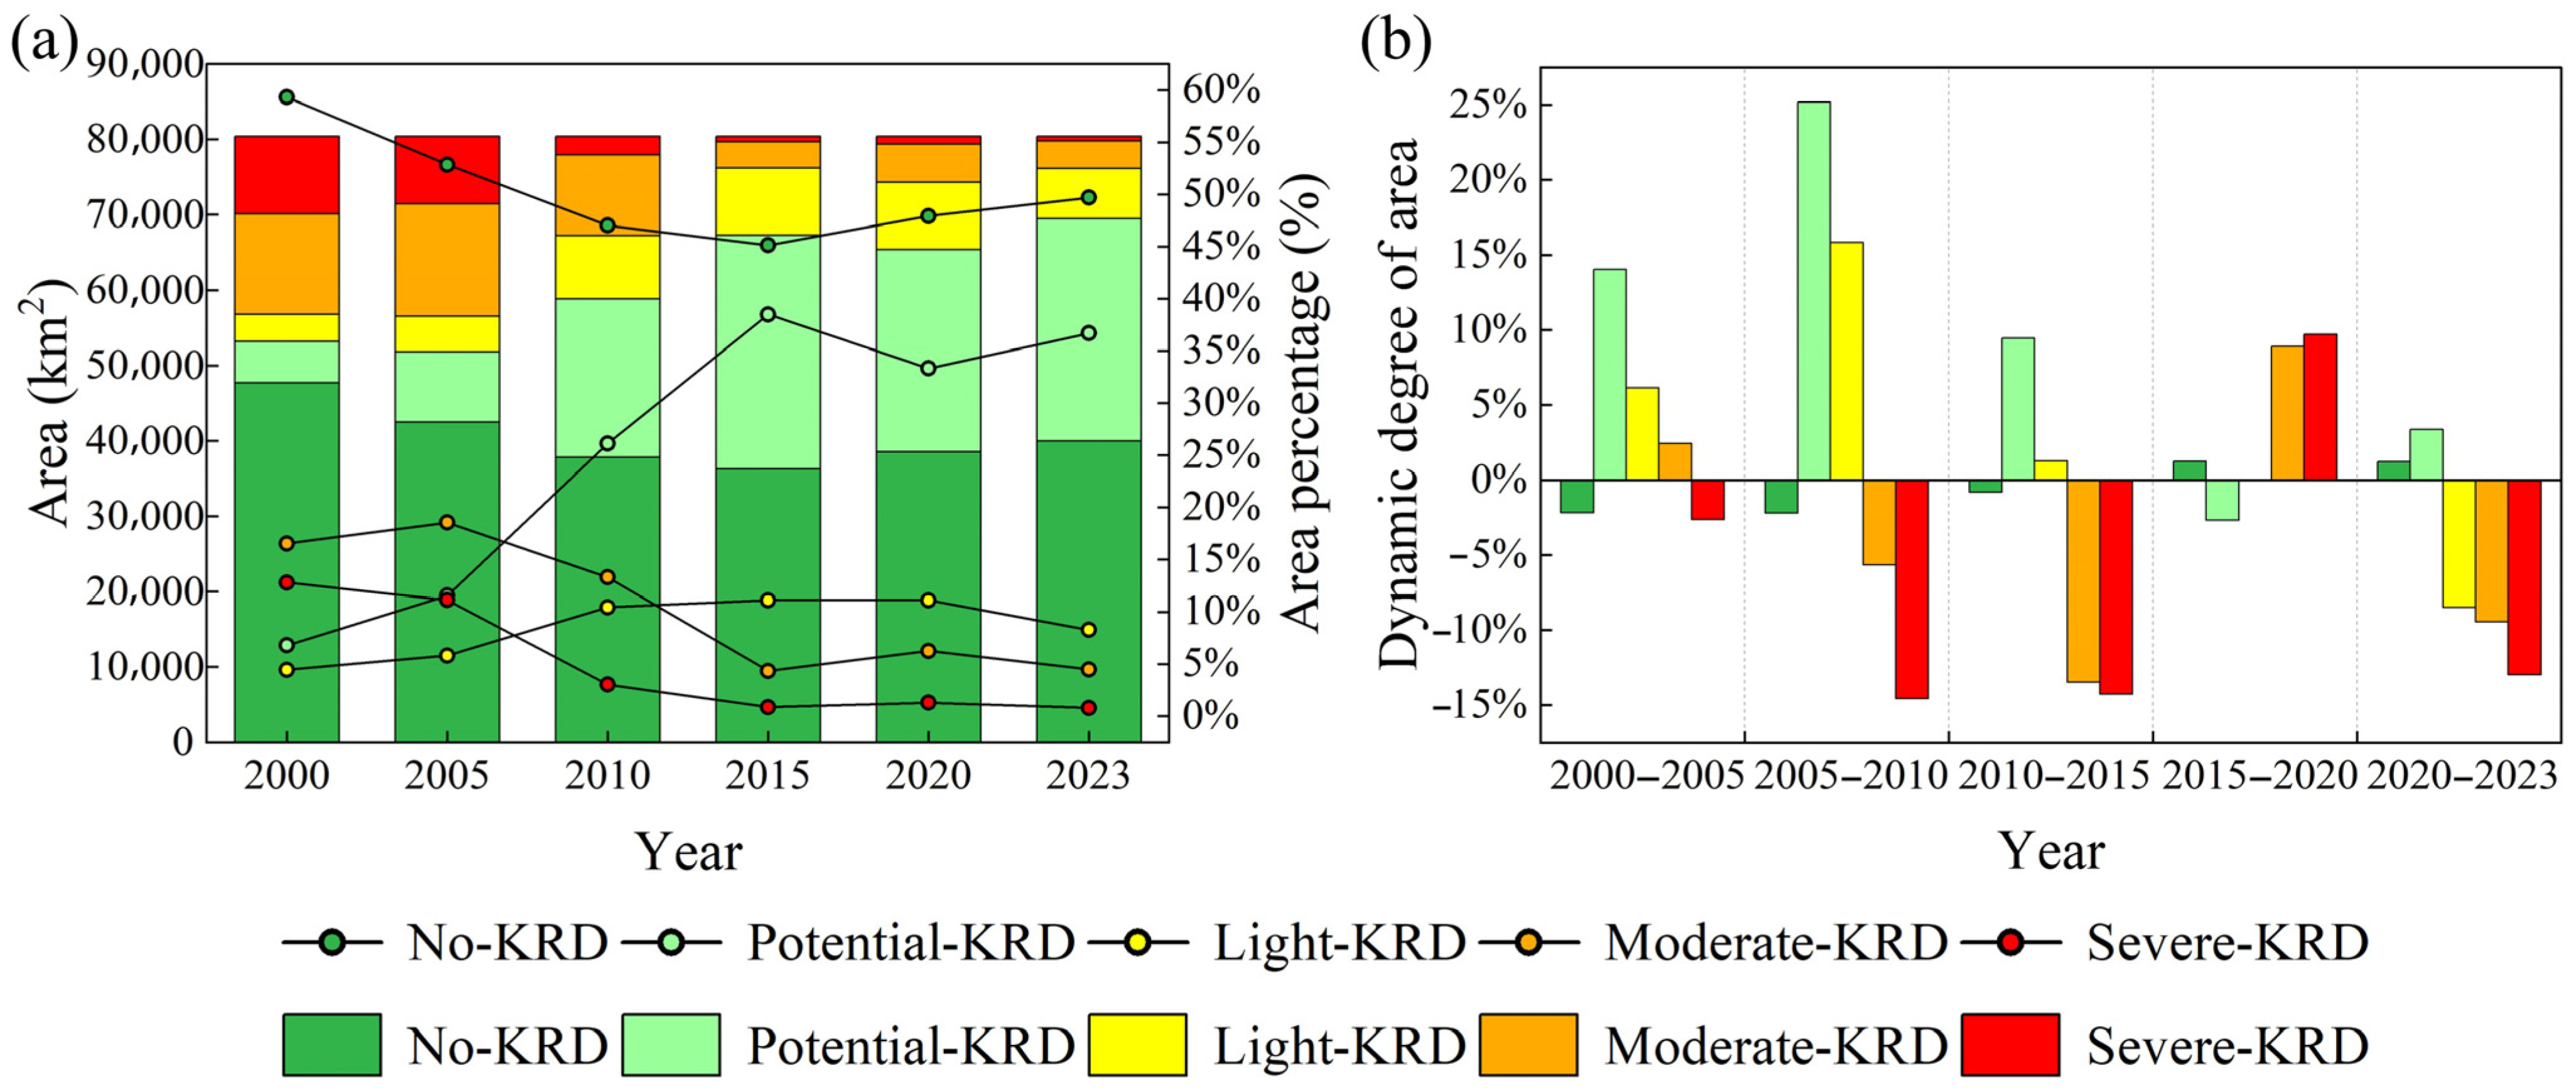
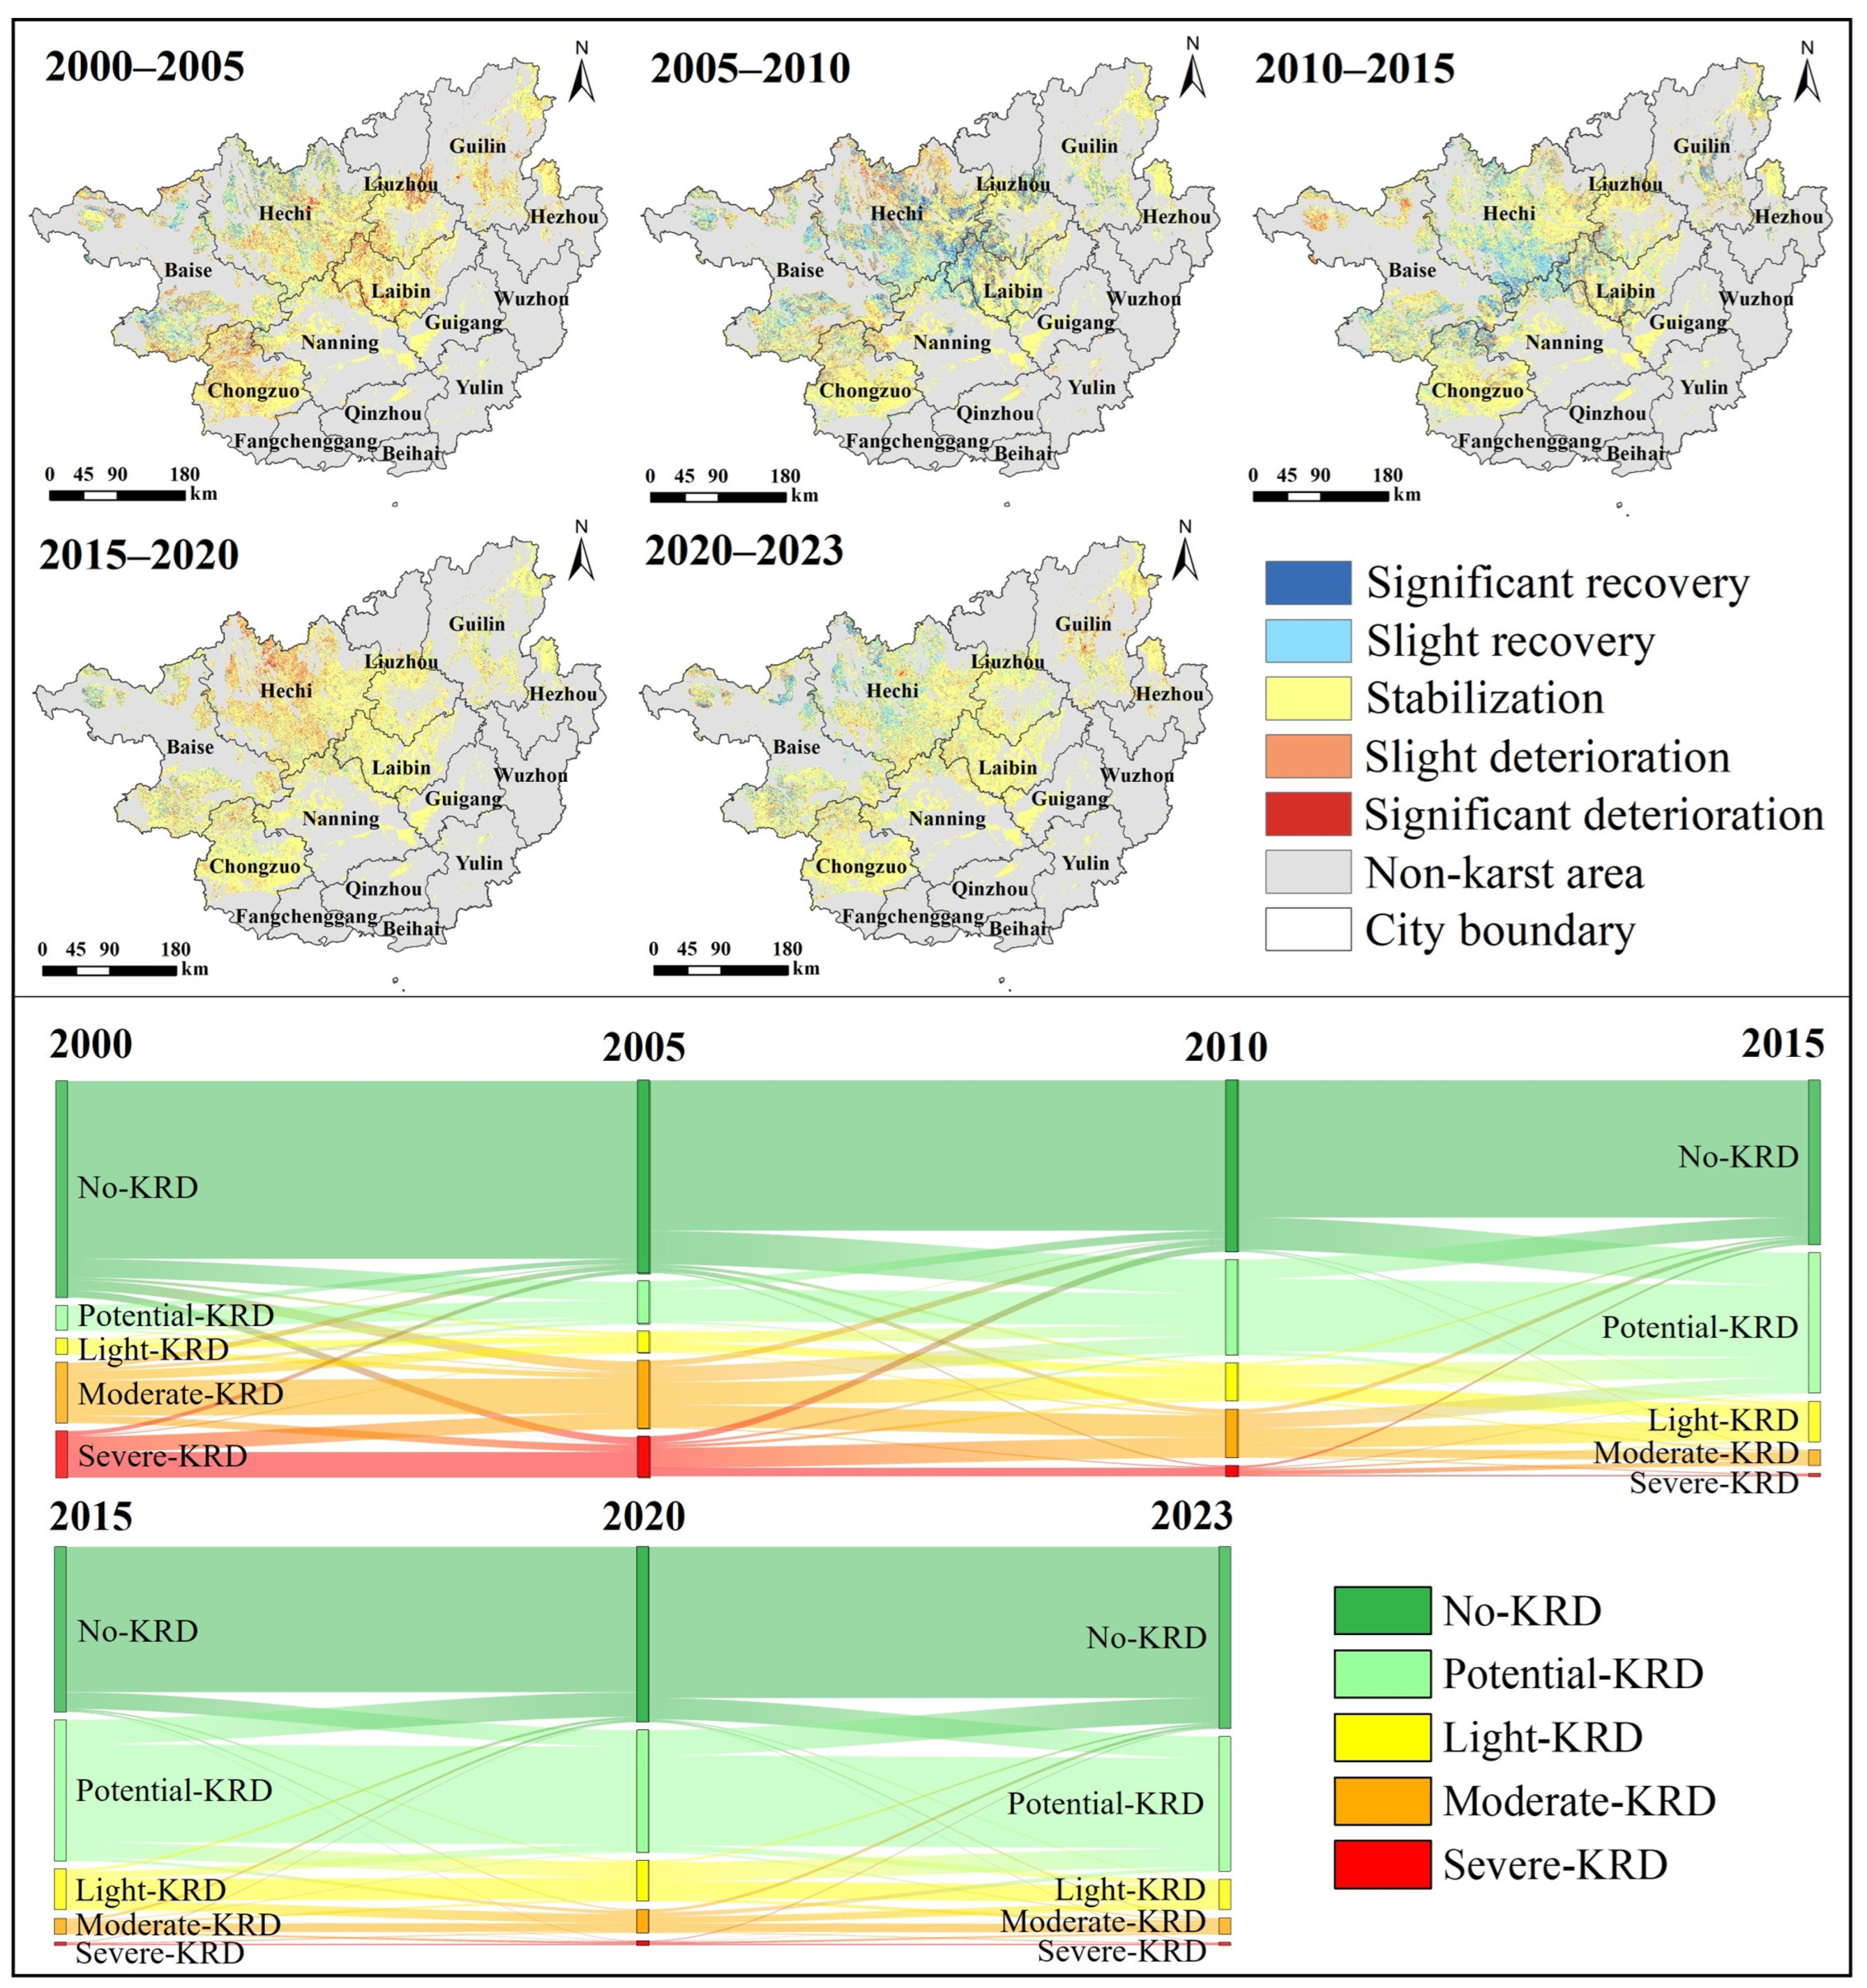
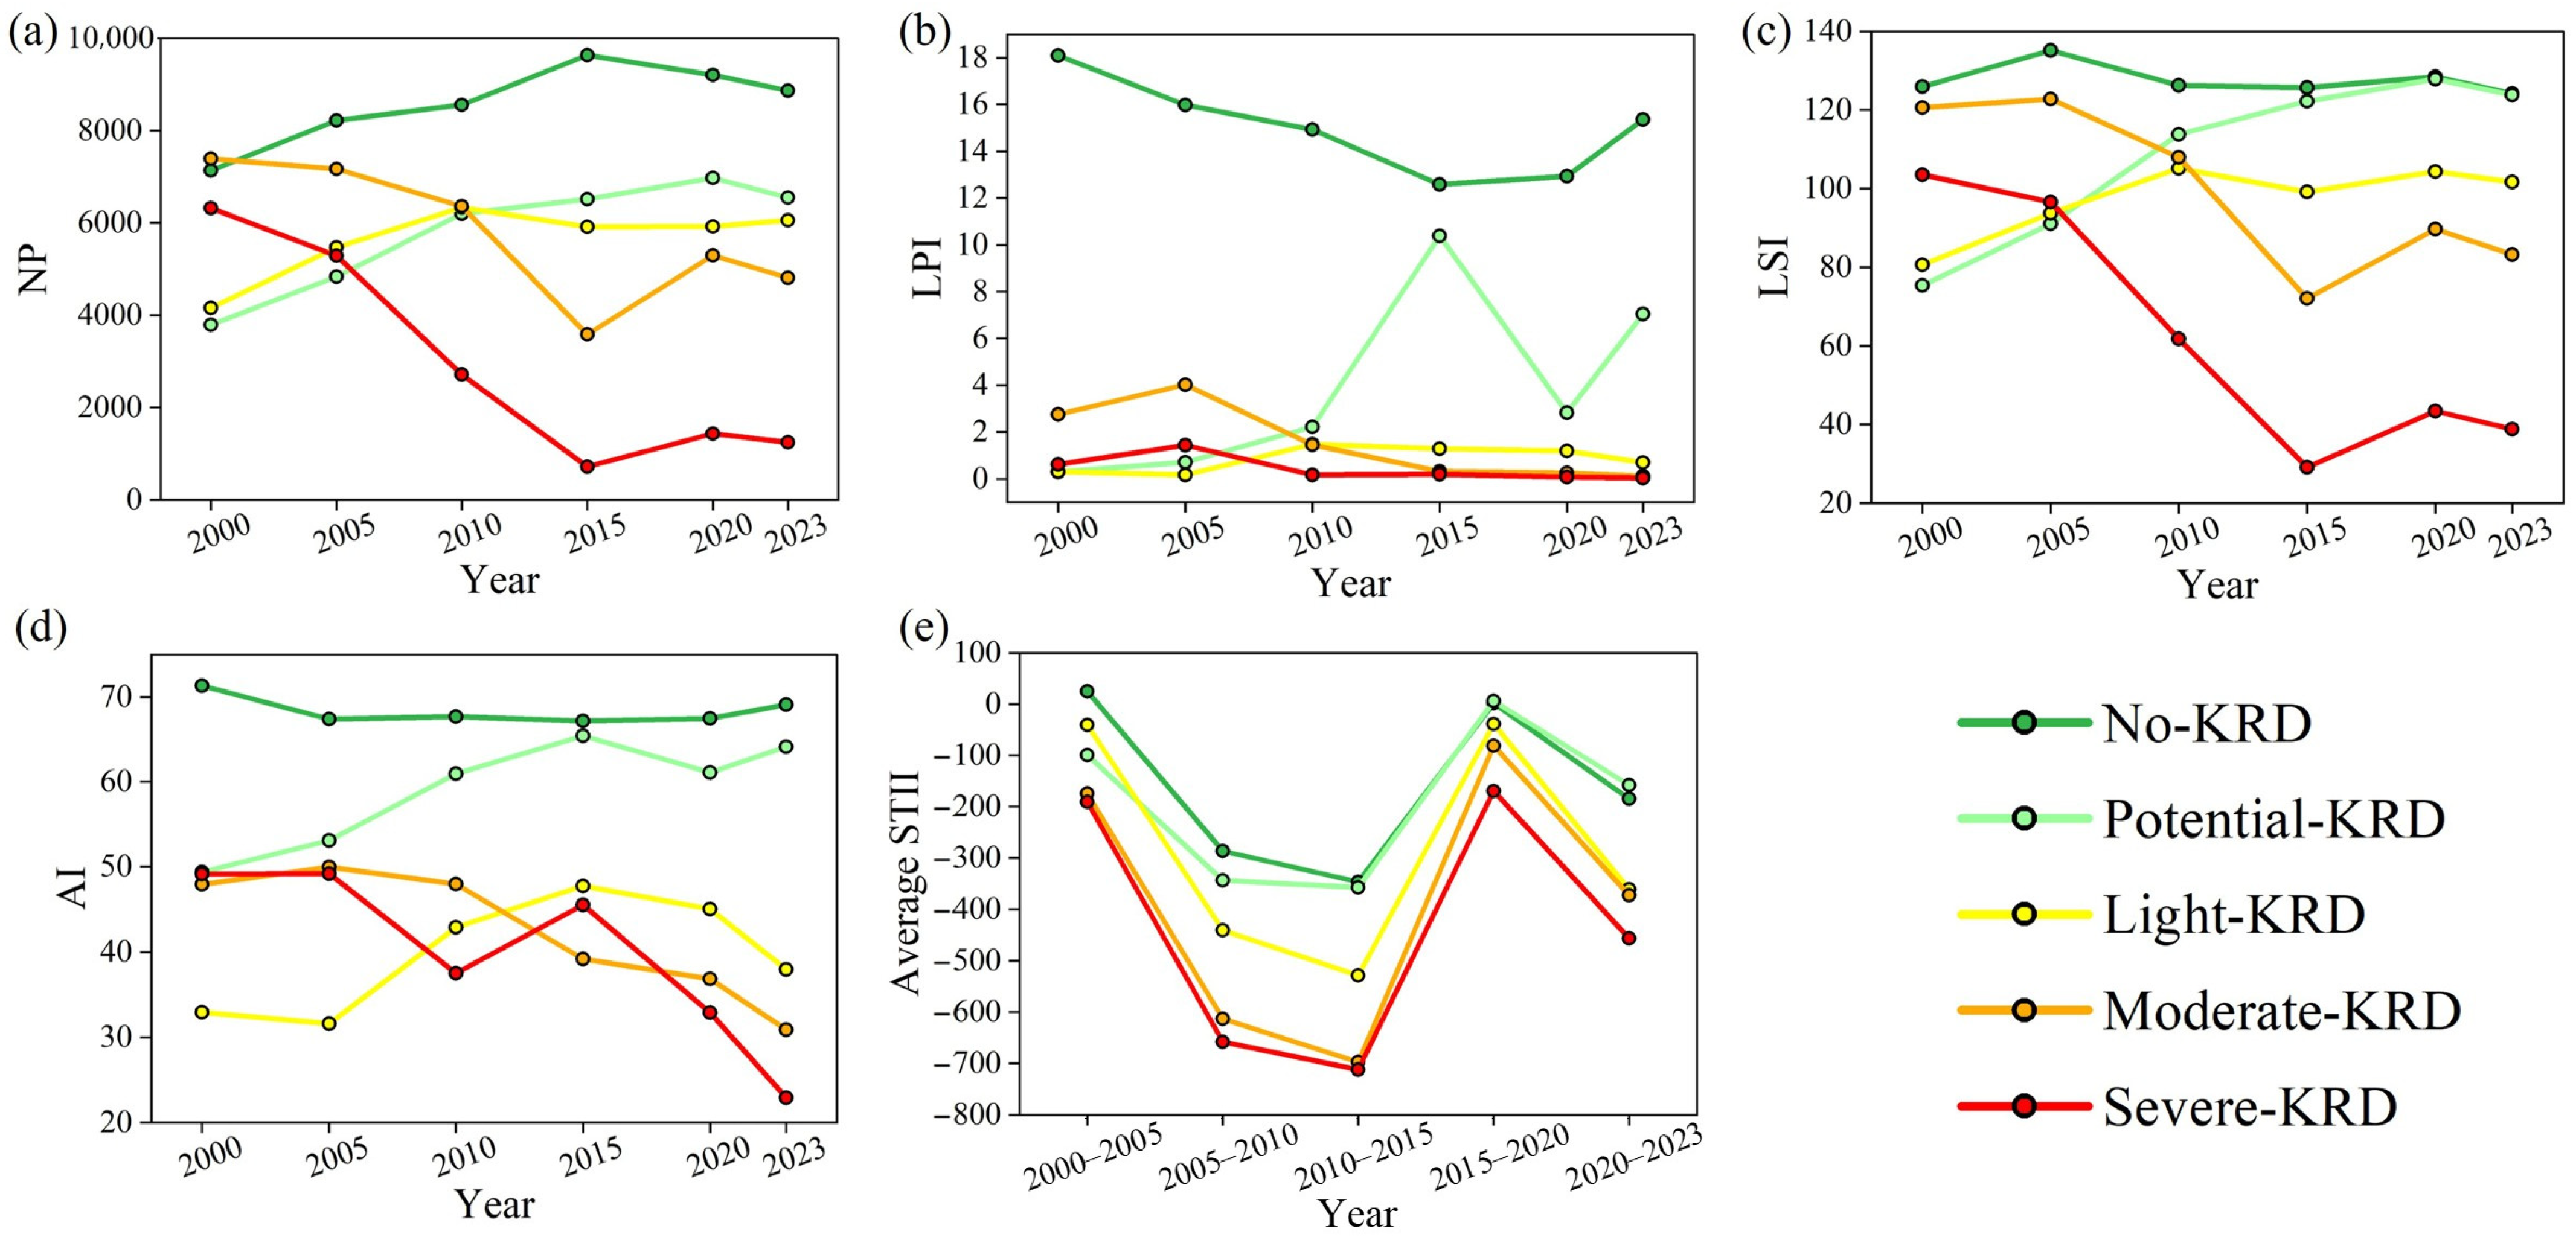
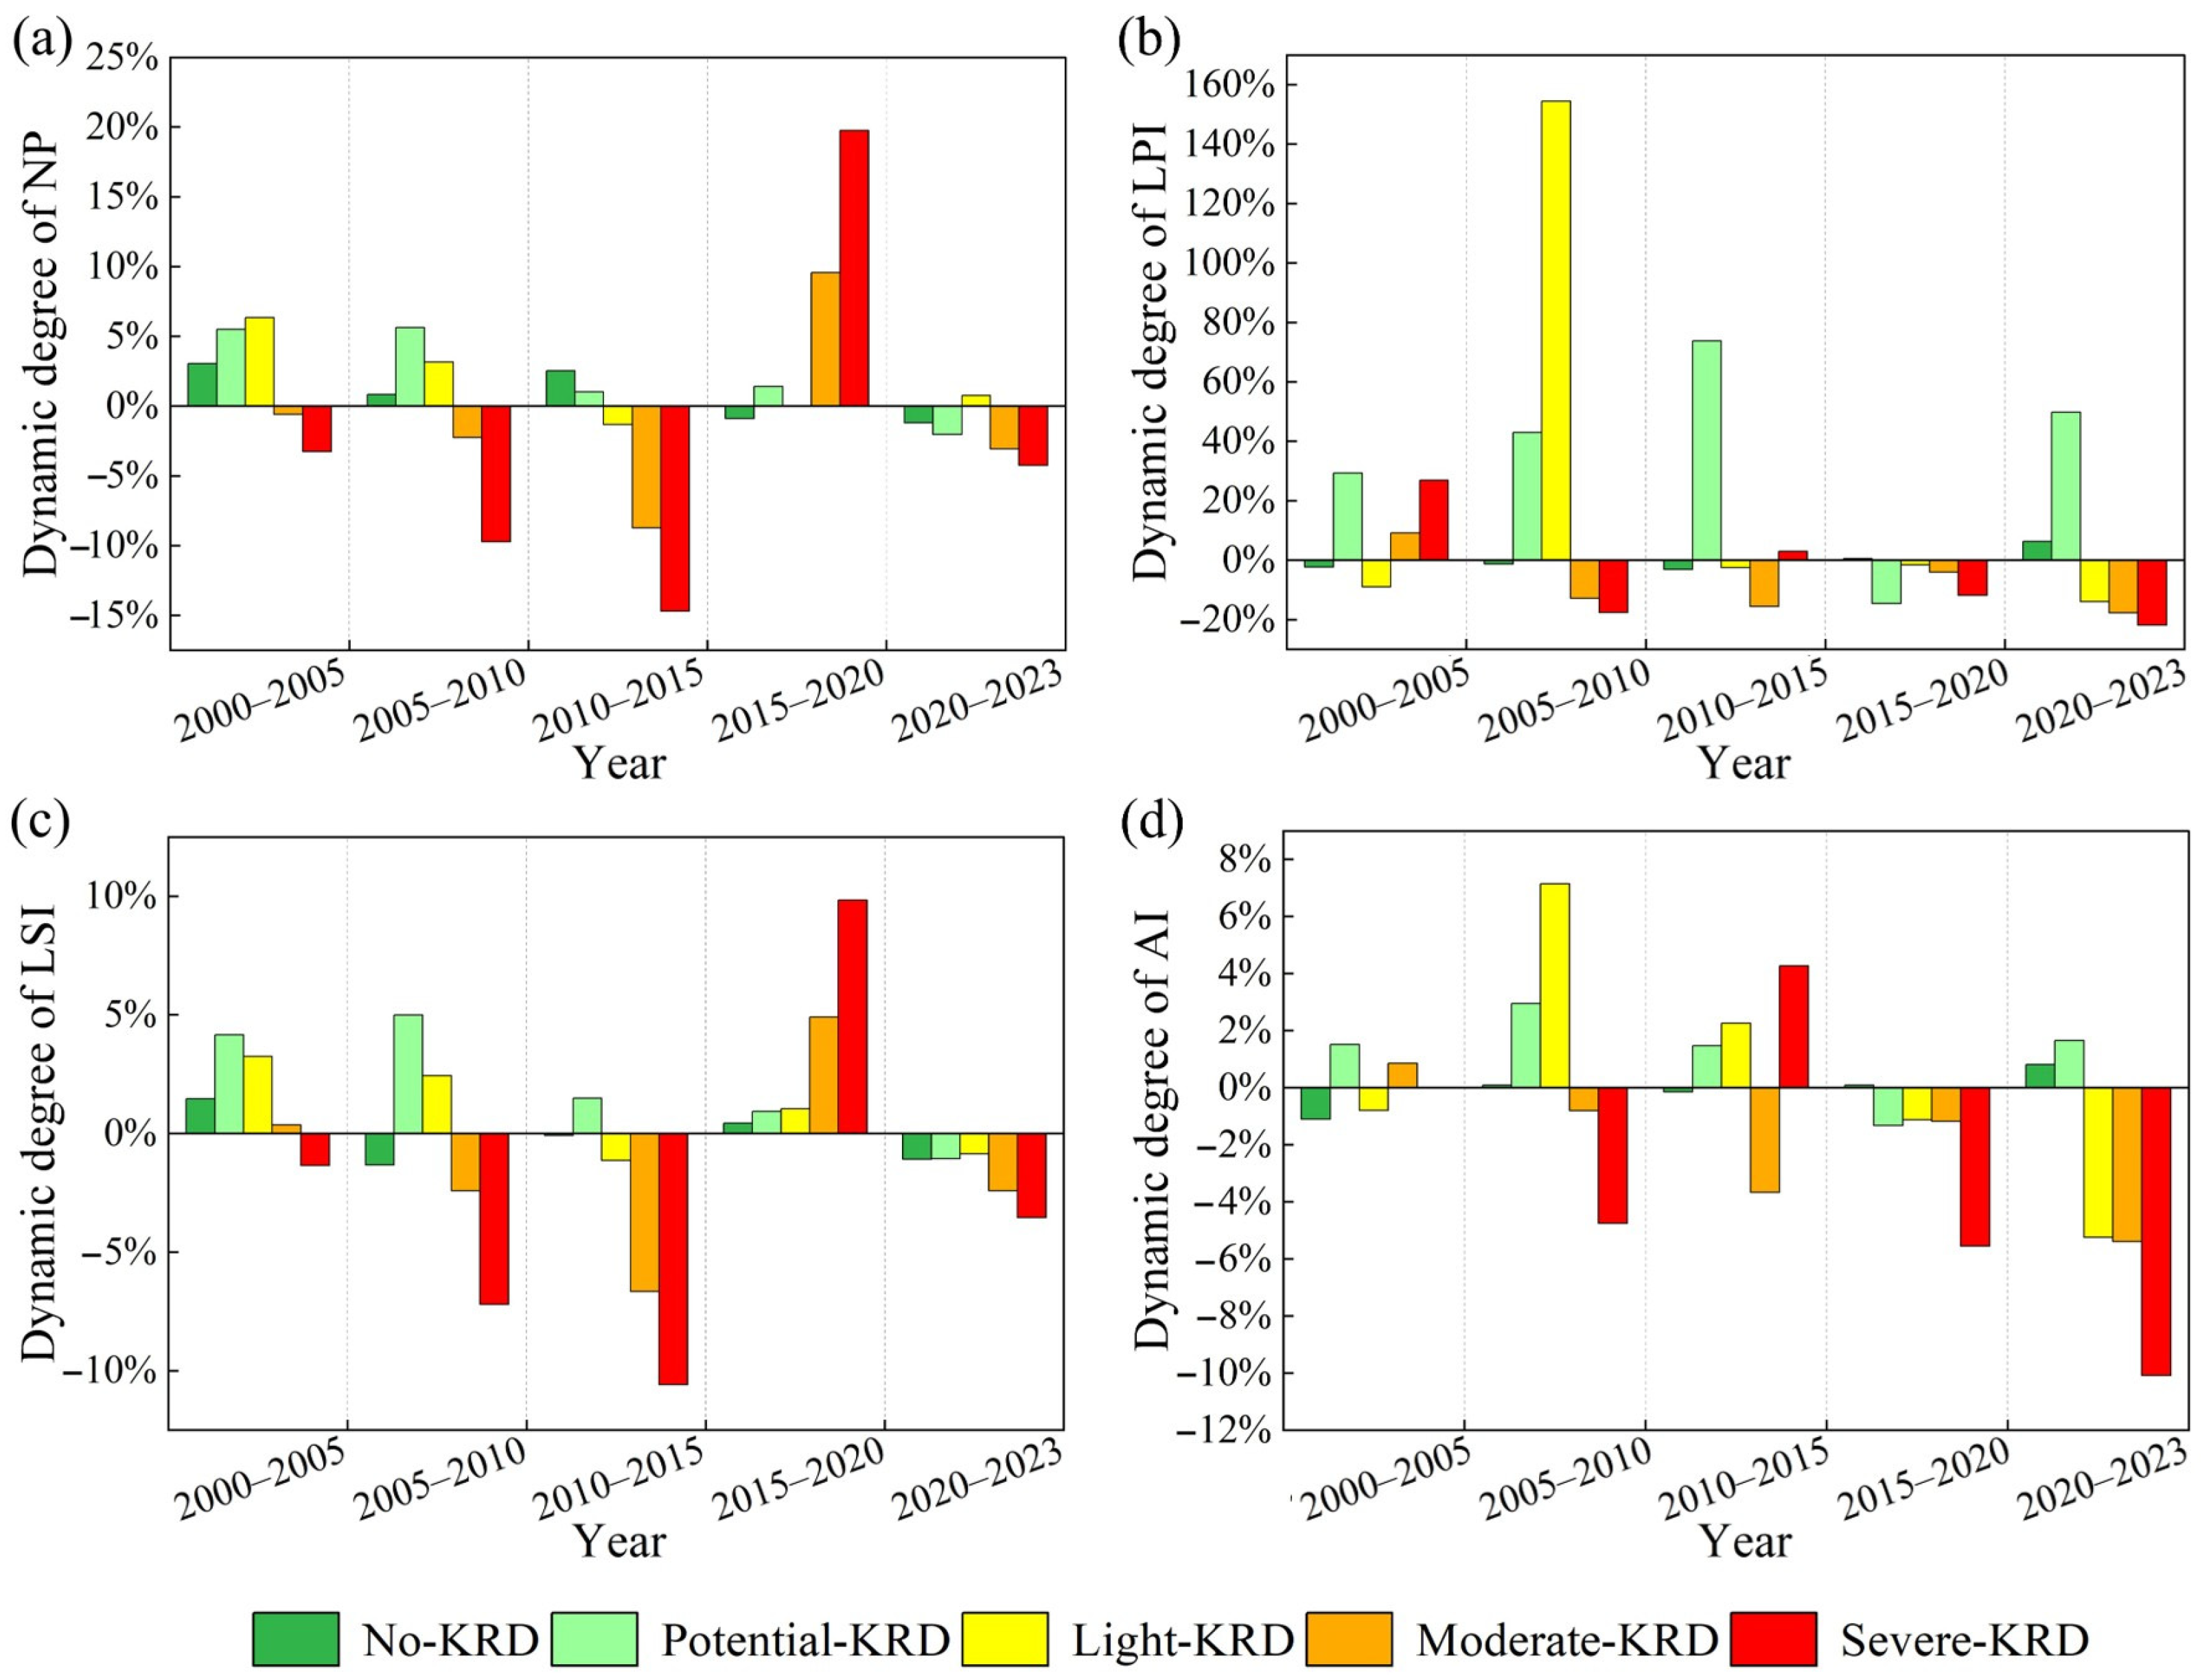
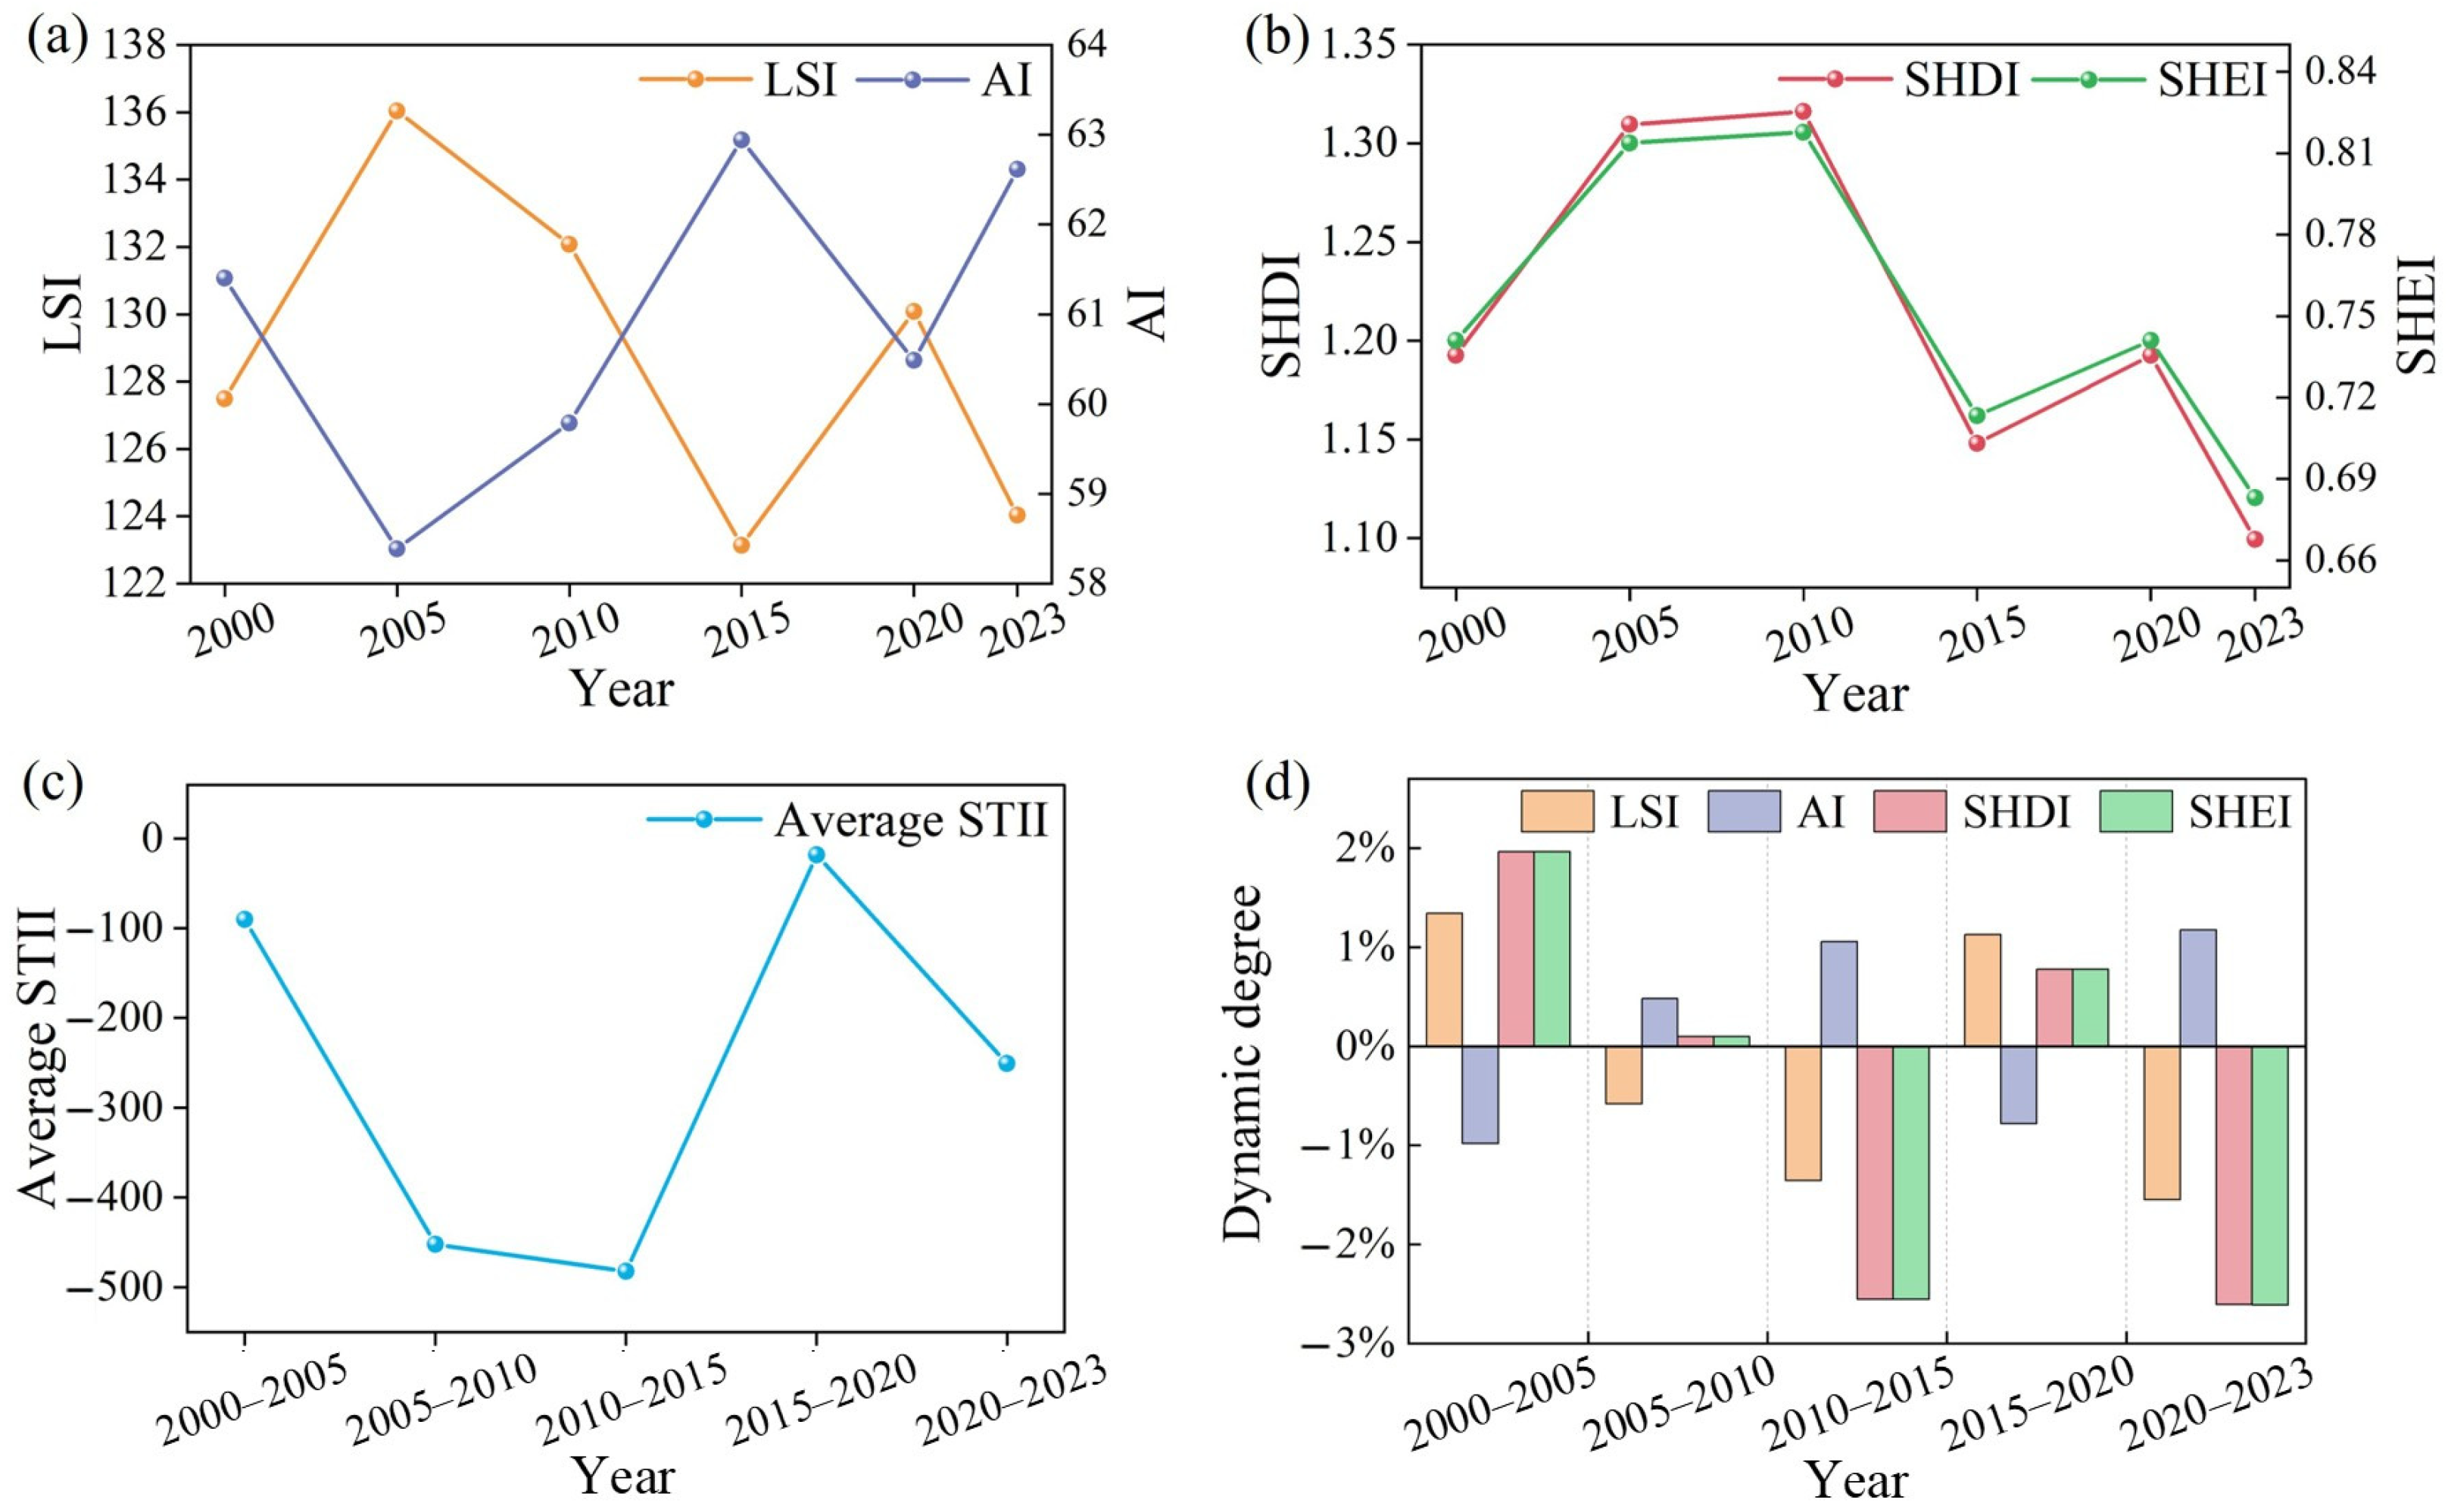
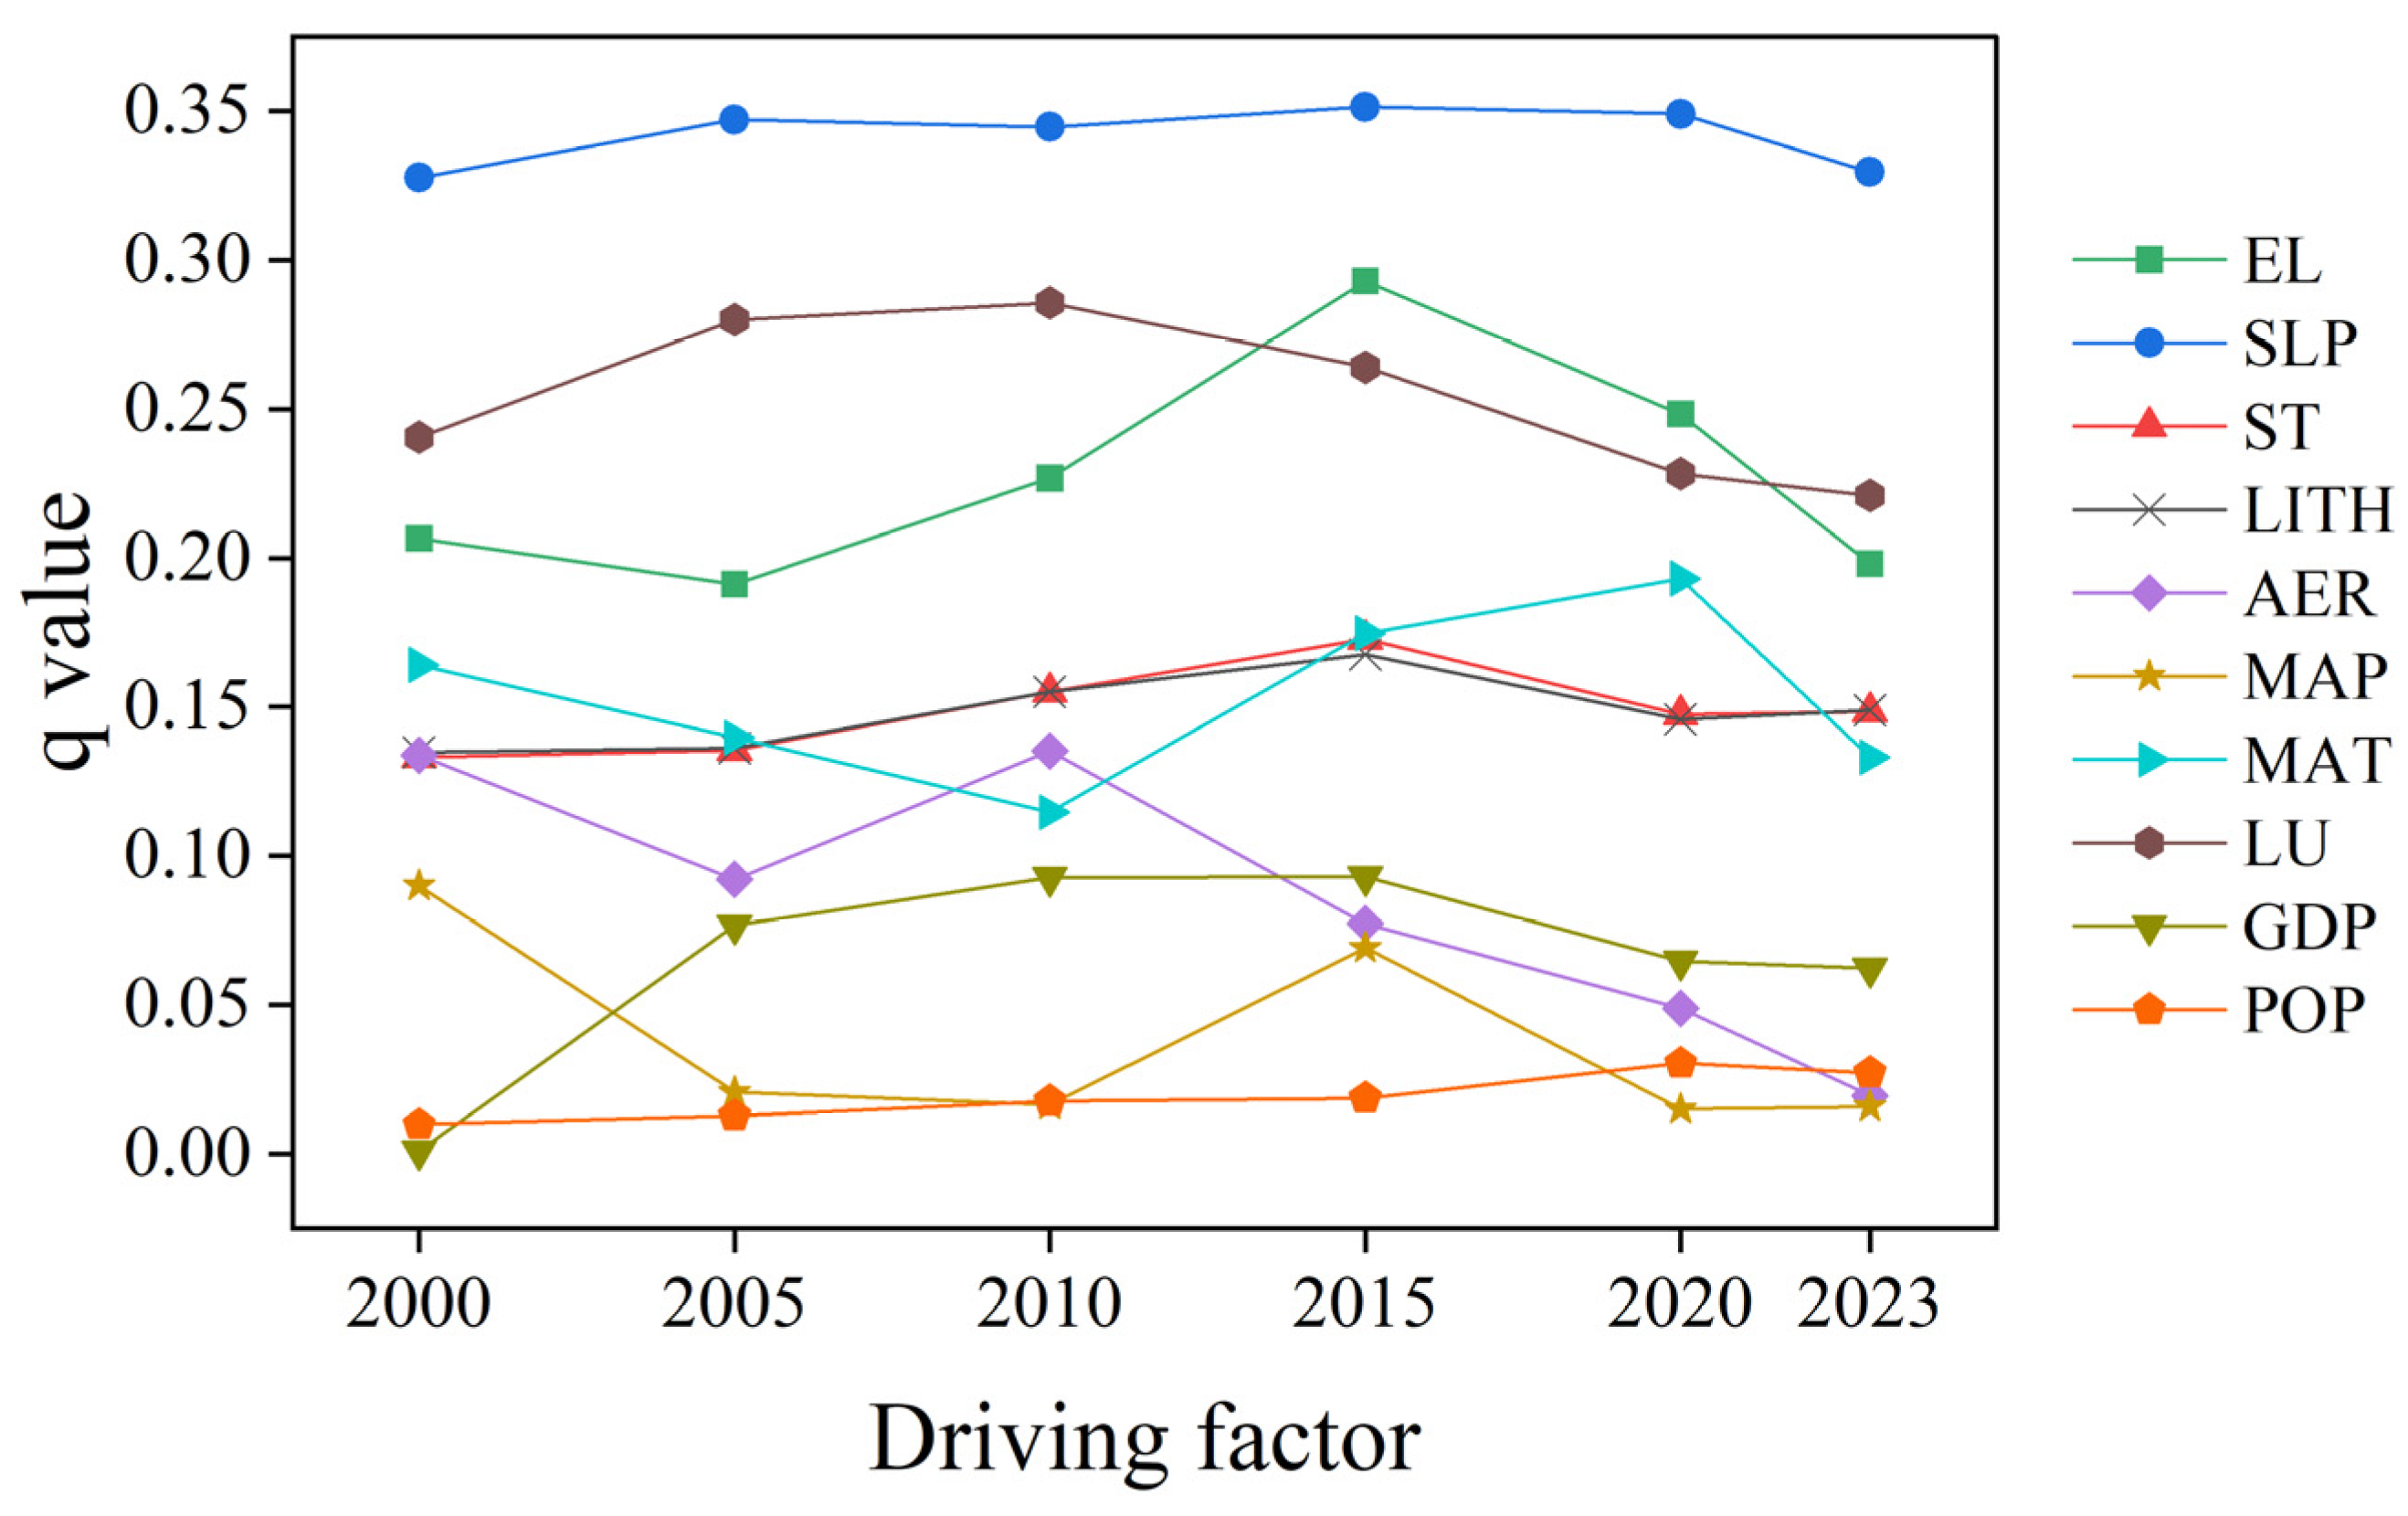
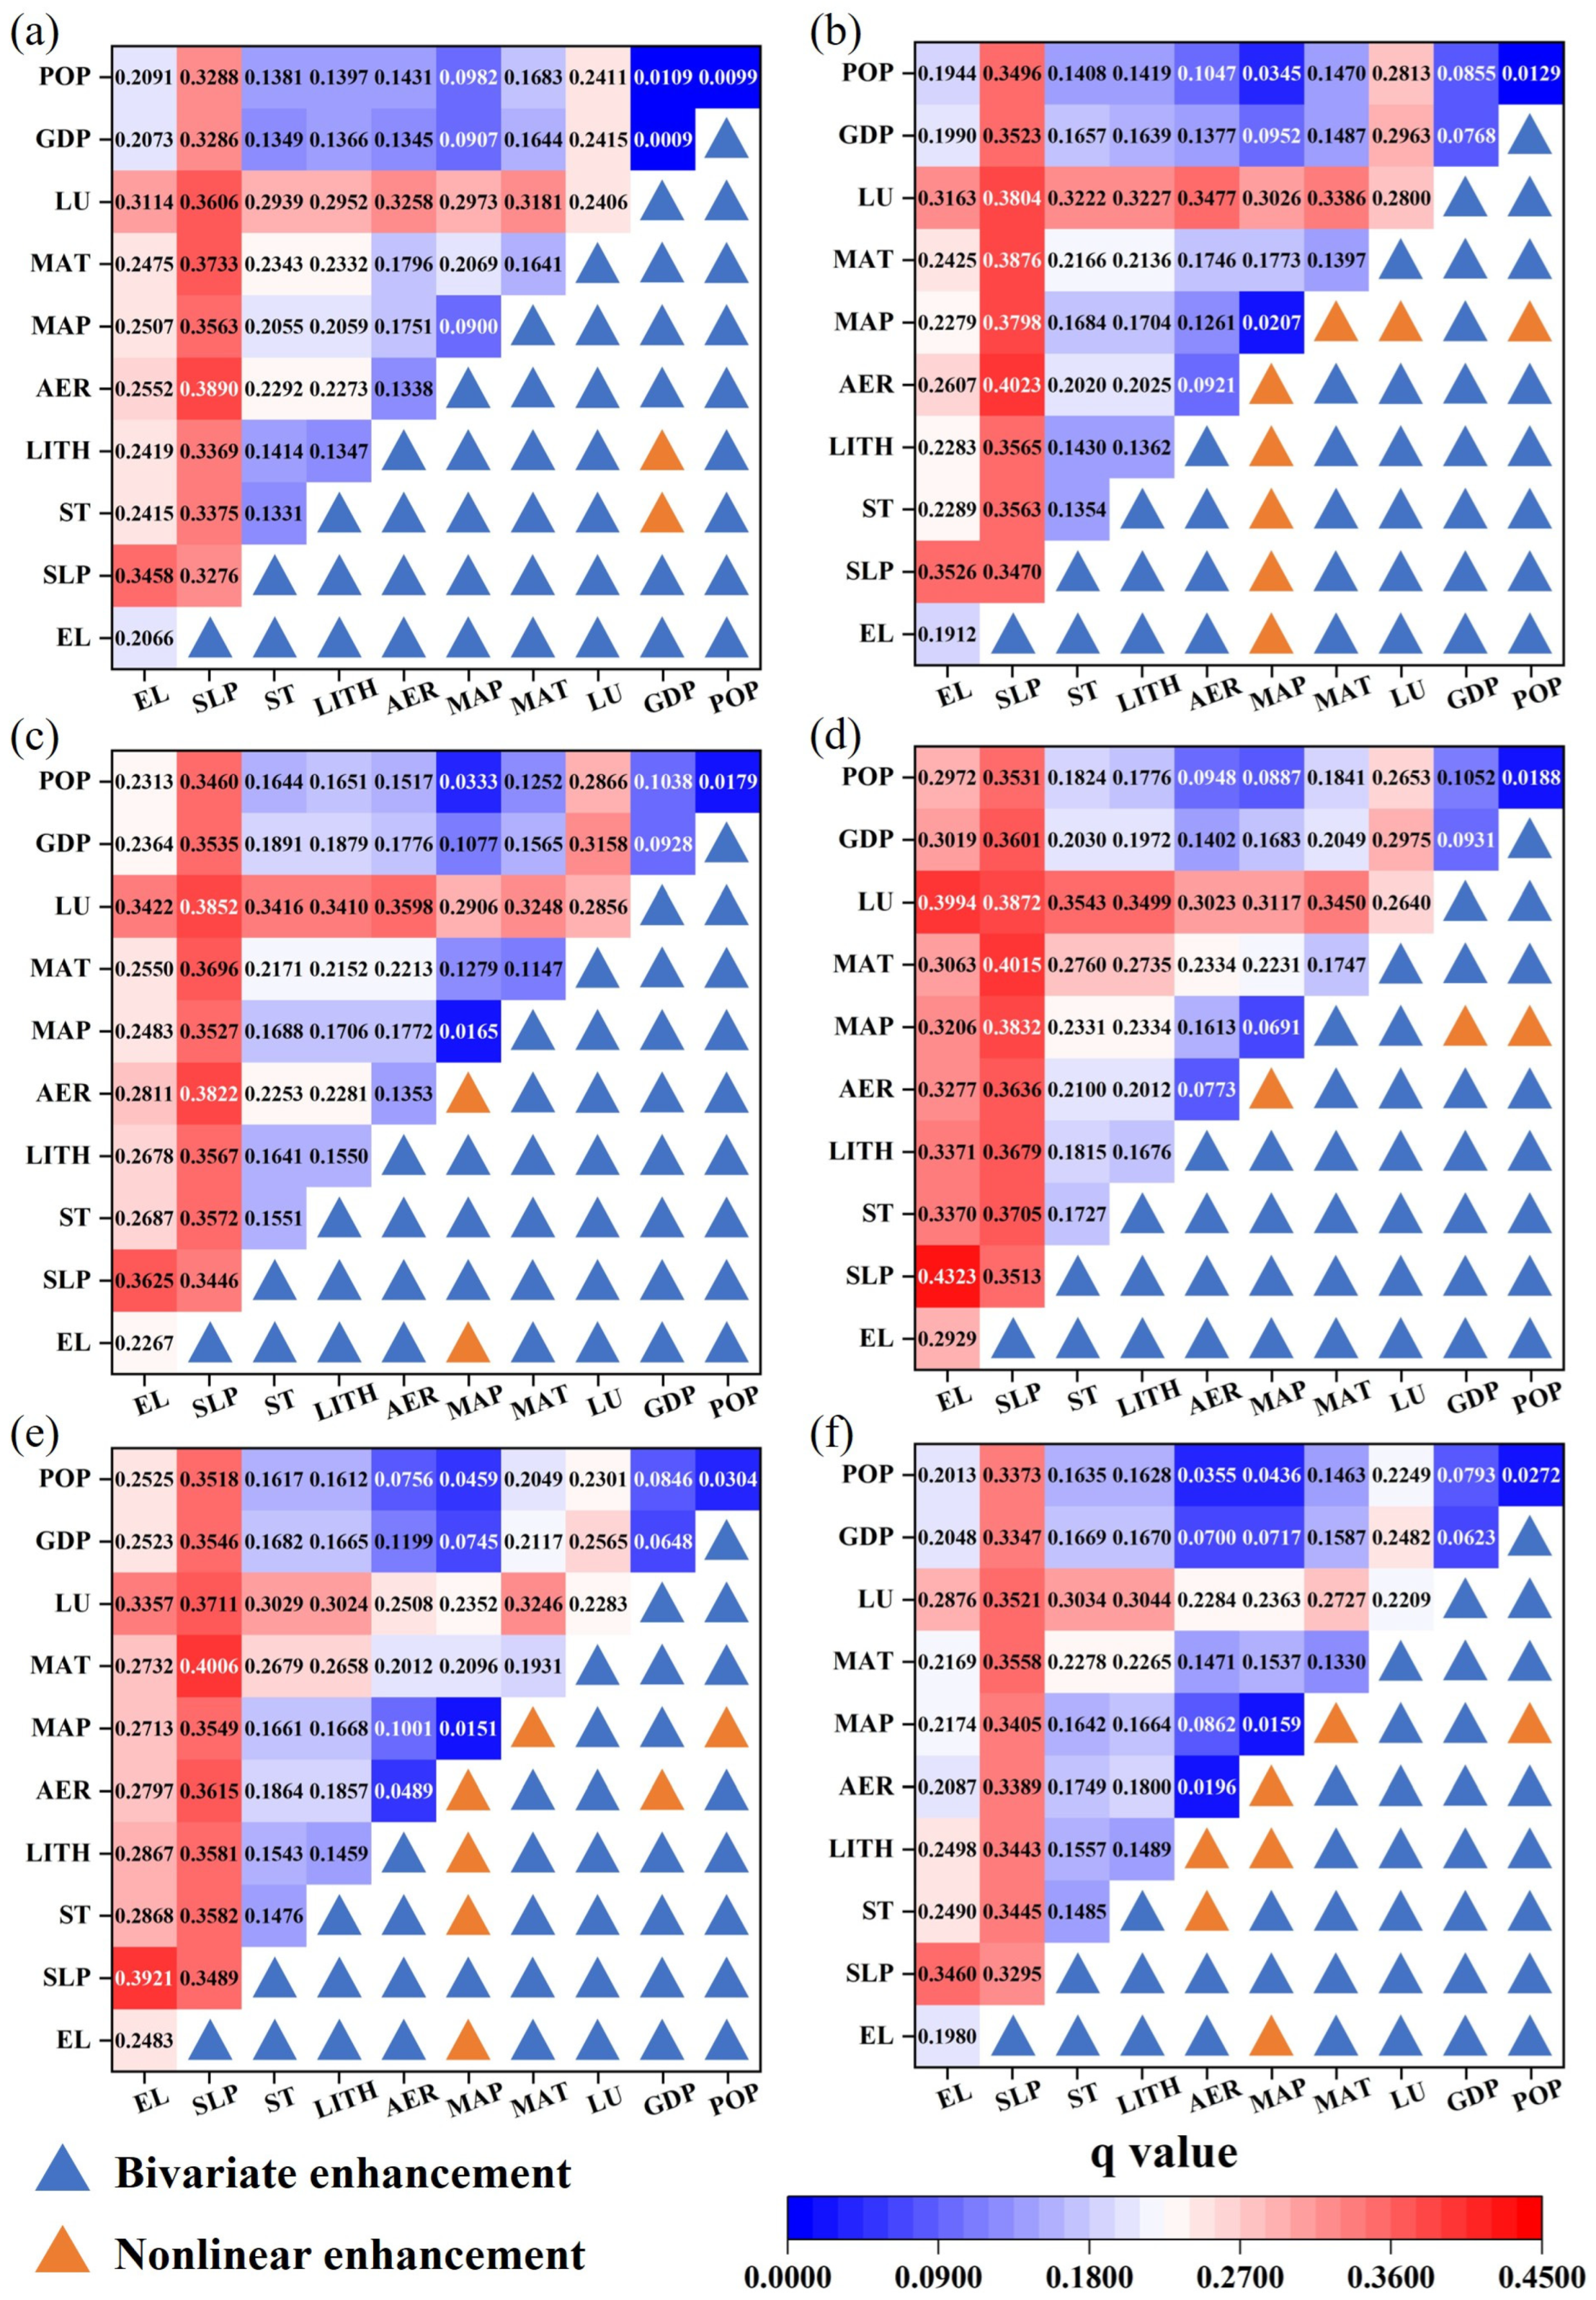
Disclaimer/Publisher’s Note: The statements, opinions and data contained in all publications are solely those of the individual author(s) and contributor(s) and not of MDPI and/or the editor(s). MDPI and/or the editor(s) disclaim responsibility for any injury to people or property resulting from any ideas, methods, instructions or products referred to in the content. |
© 2025 by the authors. Licensee MDPI, Basel, Switzerland. This article is an open access article distributed under the terms and conditions of the Creative Commons Attribution (CC BY) license (https://creativecommons.org/licenses/by/4.0/).