1. Introduction
With the rapid advancement of satellite remote sensing technology, high-resolution satellite imagery has been extensively adopted in land planning, natural disaster risk assessments, environmental monitoring, and various domains including territorial resource management, urban planning, and agricultural resource surveys. Over the past five years, satellite remote sensing imagery has provided enhanced guidance solutions for power line inspection [
1]. For power grid inspection applications, satellite remote sensing data primarily originates from two sources: optical remote sensing satellites and synthetic aperture radar (SAR) satellites [
2]. Remote sensing images are further categorized into high-, medium-, and low-resolution based on their spatial resolution. High-resolution images are more widely utilized due to their superior precision and shorter revisit times. Each data source exhibits distinct characteristics in acquired high-resolution remote sensing imagery.
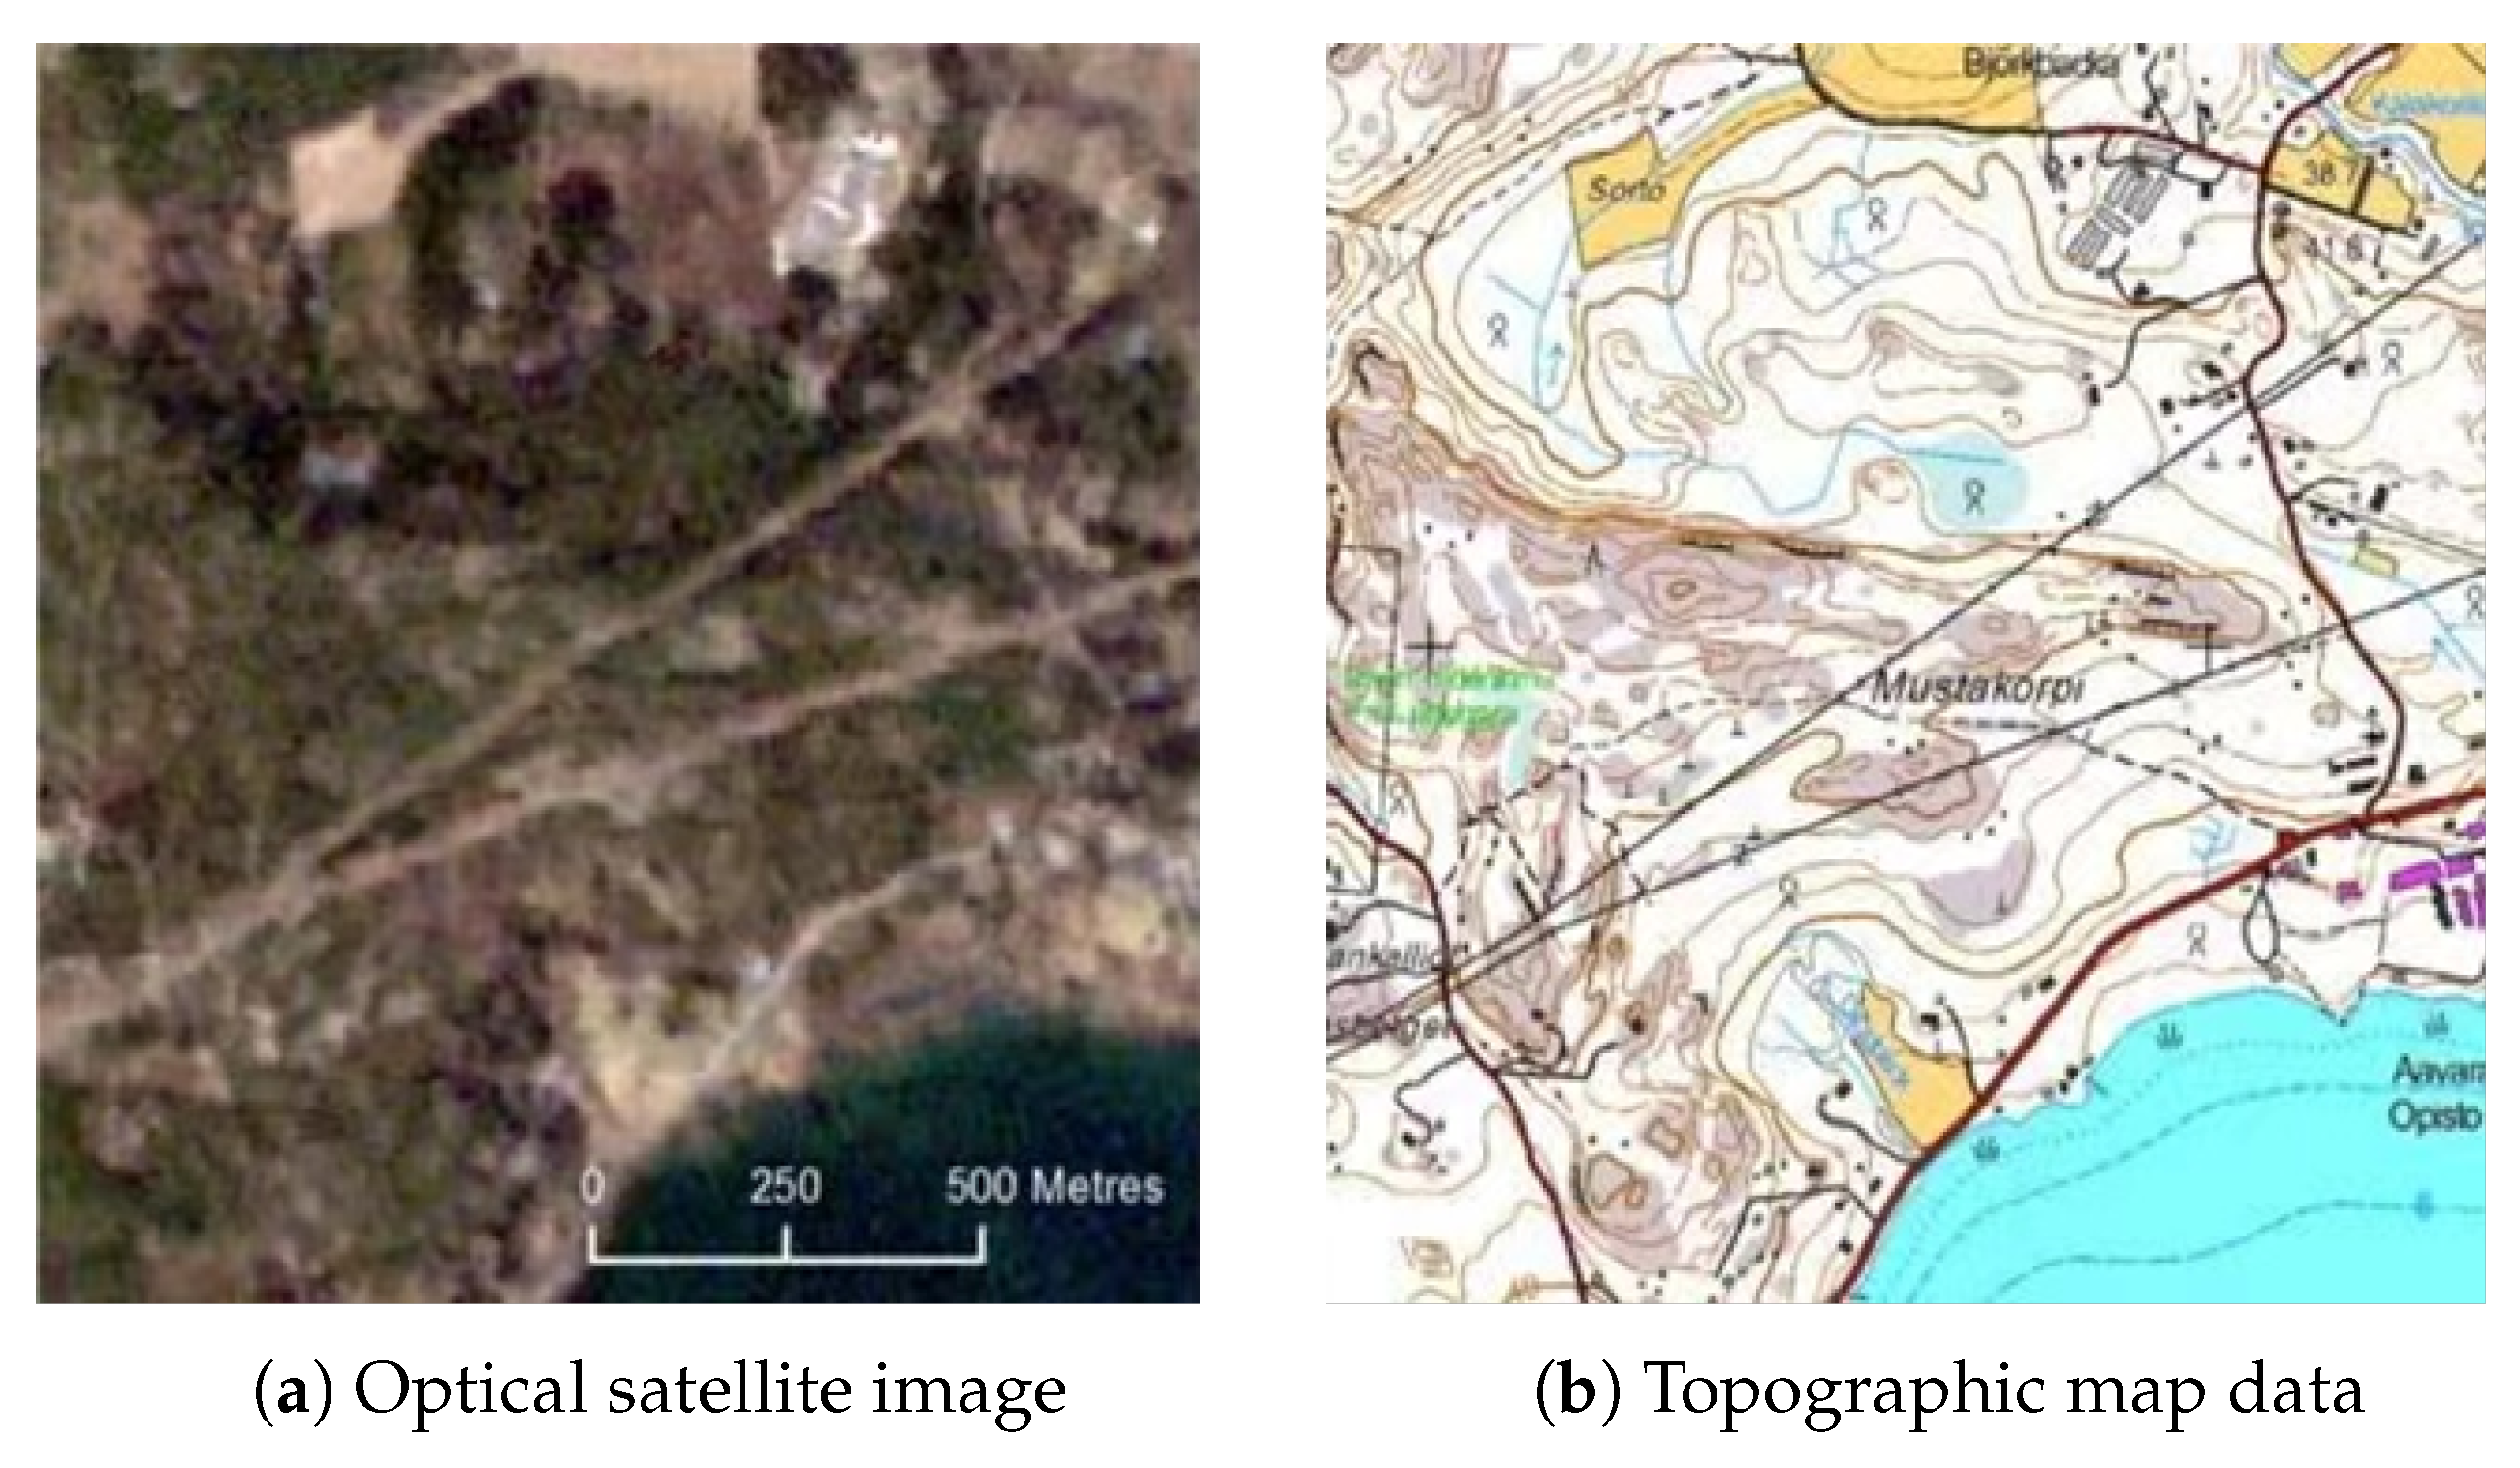
Optical remote sensing satellites operate similarly to human vision by passively capturing reflected sunlight from Earth’s surface. The optical satellite image is shown in
Figure 1. While their imagery offers intuitive visualization and clear interpretability, it suffers from significant meteorological constraints, such as obstruction by clouds, fog, or darkness. In power line inspection, sub-meter-level high-resolution optical satellite imagery enables the precise identification of typical objects near transmission lines. This capability facilitates object extraction and distance measurement between targets and power towers, thereby supporting safety hazard assessments.
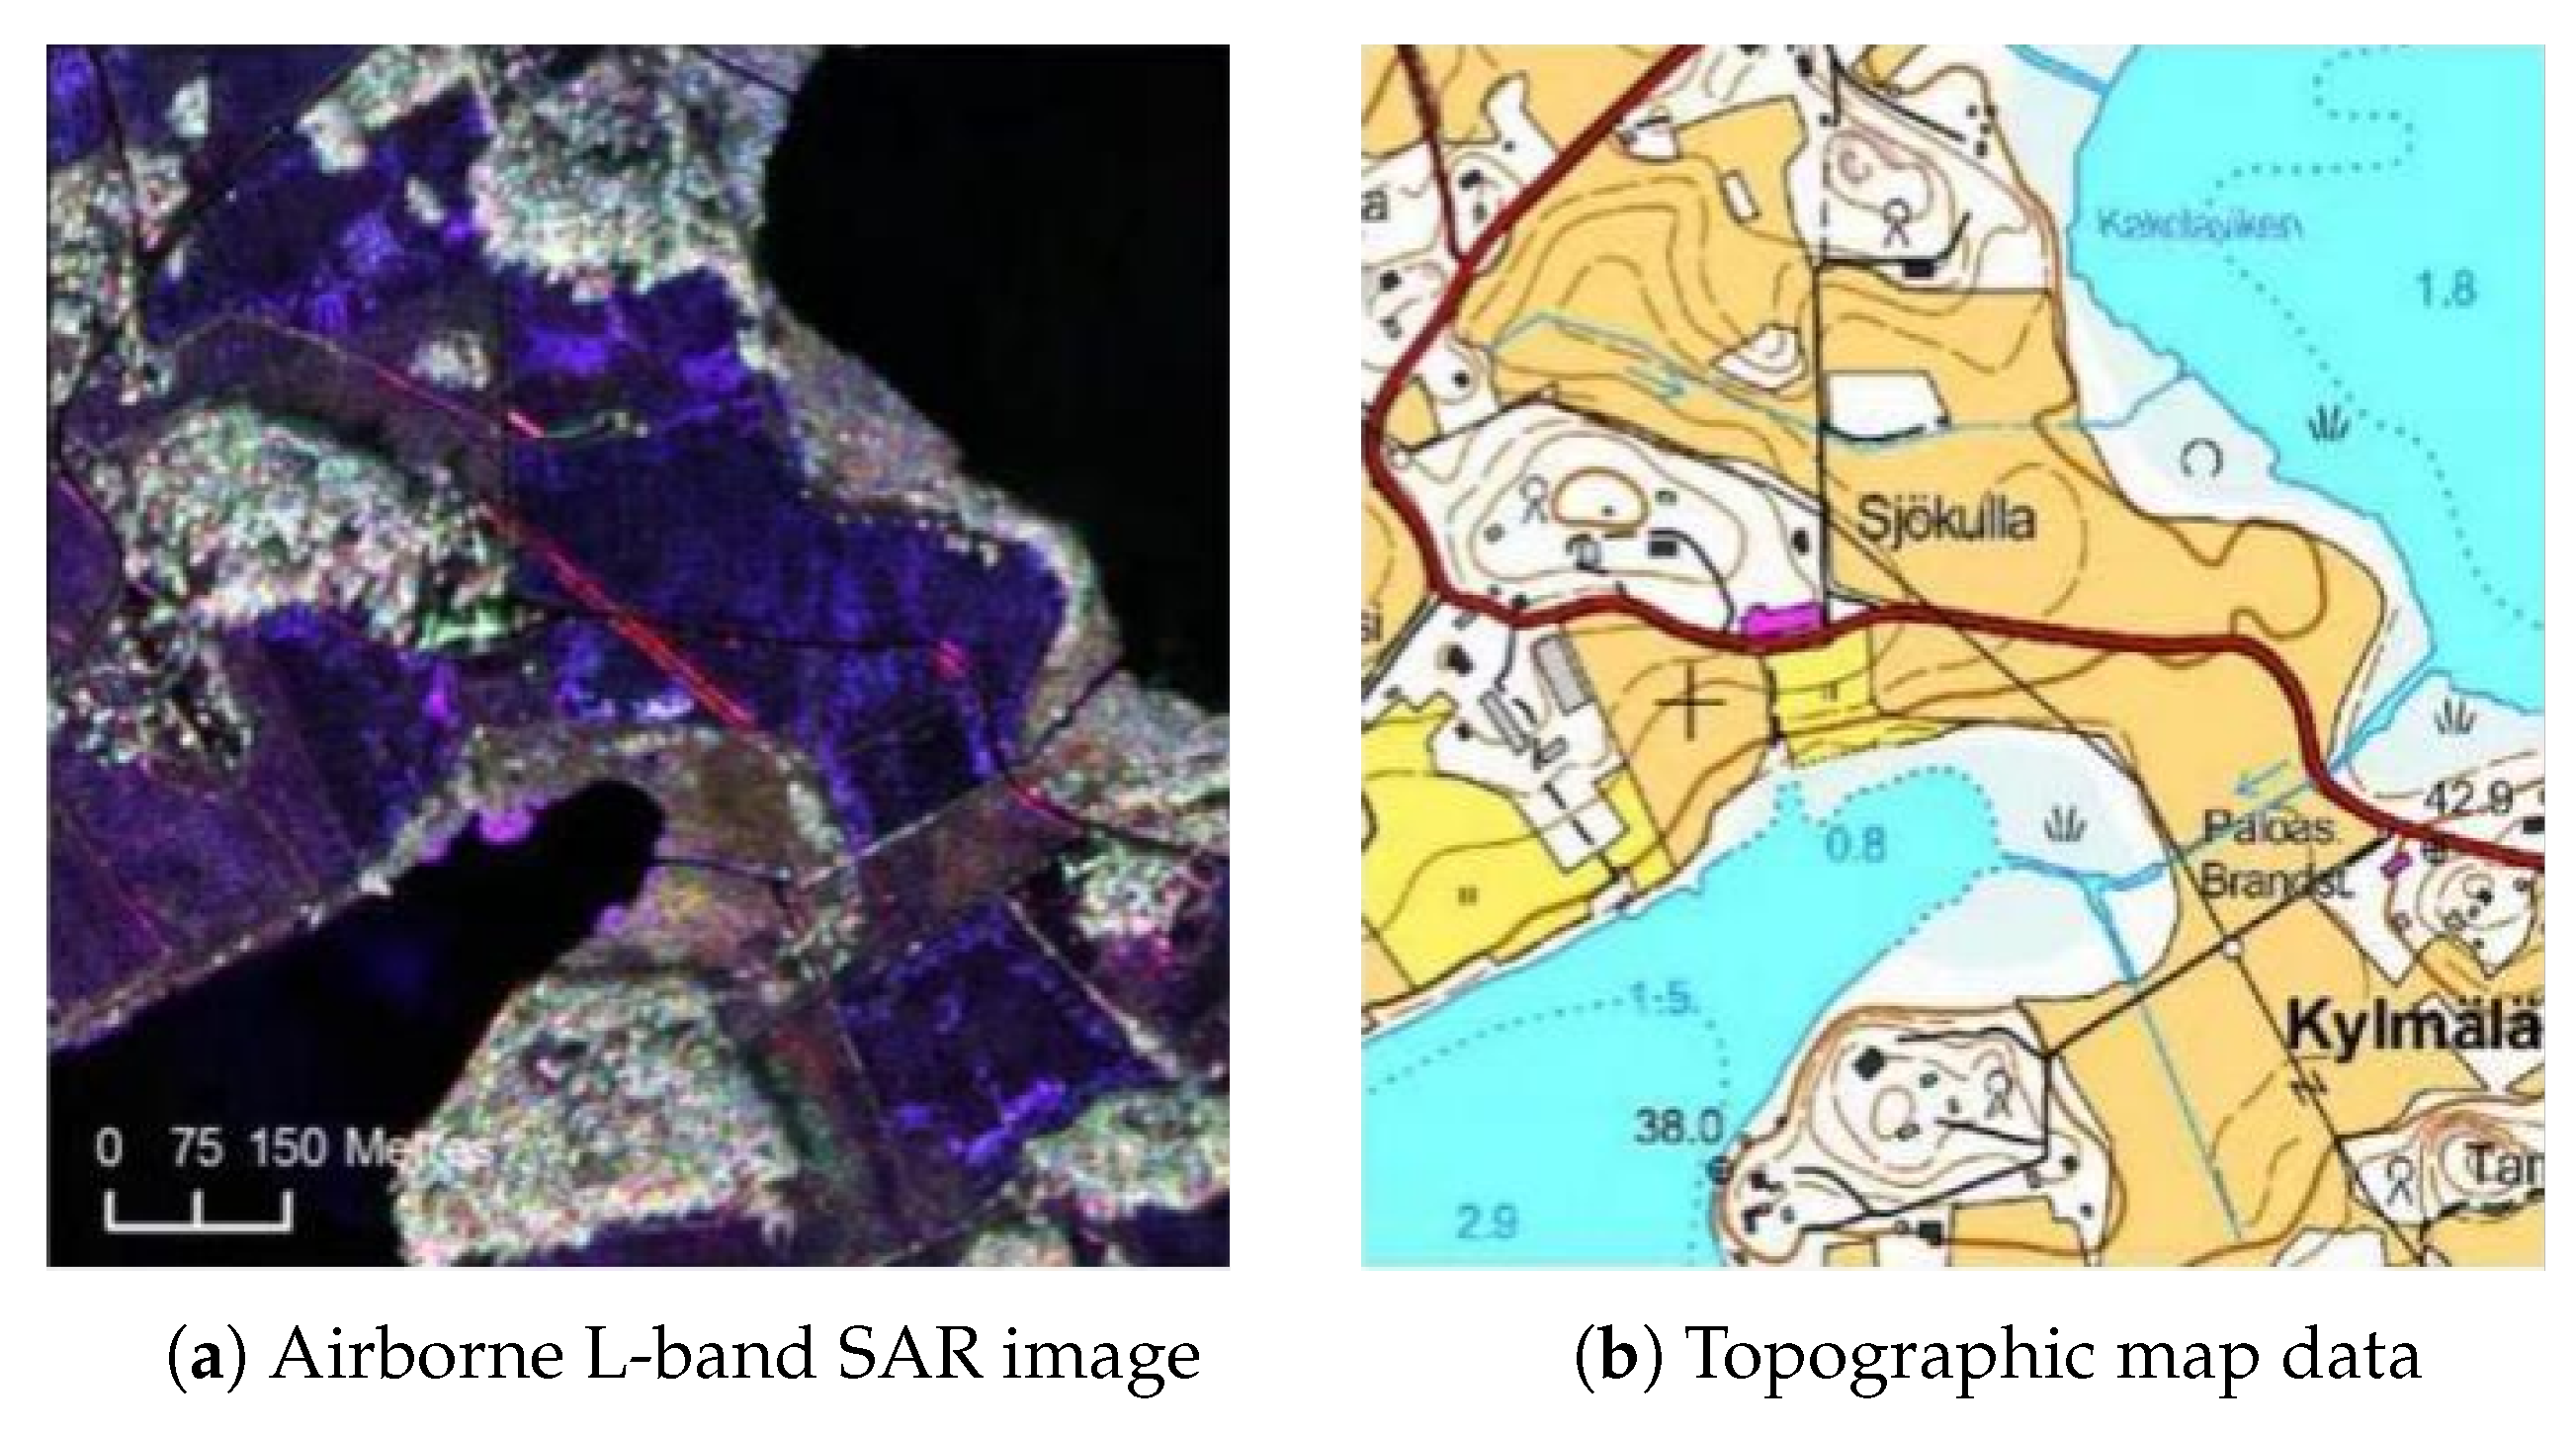
Compared to optical satellites, synthetic aperture radar (SAR) satellites represent a later-developed active remote sensing modality [
3]. They operate by transmitting electromagnetic waves multiple times toward Earth’s surface and imaging through echo signal processing, enabling the indirect measurement of target characteristics. The SAR image is shown in
Figure 2. SAR satellites demonstrate distinct advantages in all-weather and day–night operational capabilities, coupled with partial ground penetration capacity, thereby compensating for limitations inherent in optical and infrared remote sensing systems. However, conventional SAR satellites typically operate on a weekly revisit cycle with lower data refresh rates, making them particularly suitable for long-term large-scale surveys. Their technical strengths prove advantageous for monitoring vast or remote geographical areas [
4].
Power towers, as critical components of power transmission systems, require the precise detection of their spatial distribution and operational status to ensure grid stability and maintain national energy security. Remote sensing-based power tower detection technology provides innovative approaches for monitoring tower distribution patterns and structural variations, offering substantial support for transmission line inspection workflows. This methodology enhances field inspection efficiency by delivering systematic decision-making assistance to maintenance personnel through automated feature extraction and spatial analysis.
Traditional power tower monitoring methods primarily rely on manual inspections and low-resolution image analysis, which are constrained by inefficiency, high operational costs, and limited accuracy. Manual inspections are not only labor-intensive but also restricted by geographical obstacles and meteorological conditions, often resulting in delayed or incomplete data acquisition. Furthermore, low-resolution imaging fails to meet modern requirements for refined tower management, demonstrating insufficient capability in precise localization and condition assessments. With the industry’s transition from digital to intelligent inspection frameworks, unmanned aerial vehicle (UAV)-based inspection has become the dominant paradigm due to its high efficiency, operational safety, and deployment flexibility [
5]. UAVs enable real-time acquisition of high-resolution imagery and multispectral data, significantly improving inspection accuracy and throughput. However, technical limitations such as vulnerability to meteorological conditions and limited endurance restrict UAVs’ scalability for large-scale power line monitoring, introducing potential risks to grid stability during long-term surveillance operations [
6].
With the continuous improvement of the spatial resolution of satellite remote sensing images and the shortening of revisit cycles, researchers have found that it is now possible to detect and recognize large-scale power infrastructure such as power poles and substations from sub-meter optical satellite remote sensing images. Compared to drone inspections, satellite-based intelligent inspection of power lines can achieve large-scale, business-oriented inspections of power corridors, greatly improving the efficiency and specificity of inspections. However, most current research has focused on using satellite remote sensing images for tasks such as vegetation erosion and disaster monitoring in power corridors, with less attention paid to the identification of targets such as power poles. Therefore, deep learning-based power pole detection technology for high-resolution satellite remote sensing images is expected to break through the bottlenecks of traditional detection methods and provide a better option for power inspections.
This paper conducts in-depth research and improves the transmission line power pole detection task based on the YOLOv9 model. By applying the GPA attention mechanism in the YOLOv9 network, embedding the Diversity Branch Block (DBB) in the core module RepNCSPELAN, and using VMPDIoU to improve the model’s loss function, we design an efficient and robust power pole detection model for transmission lines. The main contributions of this paper include the following:
(1) A power pole detection model for transmission lines based on YOLOv9 is proposed, where improvements are made to the network architecture and attention mechanism of the baseline model YOLOv9. A new attention mechanism, GPA, is introduced into the YOLOv9 network, which brings global representation capabilities to the model.
(2) A Diversity Branch Block (DBB) is embedded in the core module RepNCSPELAN of YOLOv9 to enhance the representation capability of individual convolutions, enrich the feature space, and improve the model’s feature extraction ability.
(3) The VMPDIoU is proposed to improve the model’s loss function. By varying inputs and directly calculating the key point distances between the predicted boxes and ground-truth boxes, this method can more accurately reflect the differences between the predicted and true boxes, thus enhancing the model’s mean accuracy.
2. Related Works
Over the past few years, satellite remote sensing imagery has provided valuable research insights for power line inspection. Scholars have explored numerous new approaches and methodologies for power line inspection by utilizing satellite remote sensing data. Regarding the application of satellite remote sensing data in power line inspection, it primarily involves two data sources: optical remote sensing satellites and synthetic aperture radar (SAR) satellites.
For the application of optical remote sensing satellite imagery in power line inspection, notable examples include the following: Mikhalap et al. (2019) [
7] adopted the NDVI threshold as a vegetation encroachment detection method, inspecting overhead power line corridors spanning approximately 550 km in the Pskov region of Russia. Through GIS systems, they identified that 84% of the power line corridors required management. The study by [
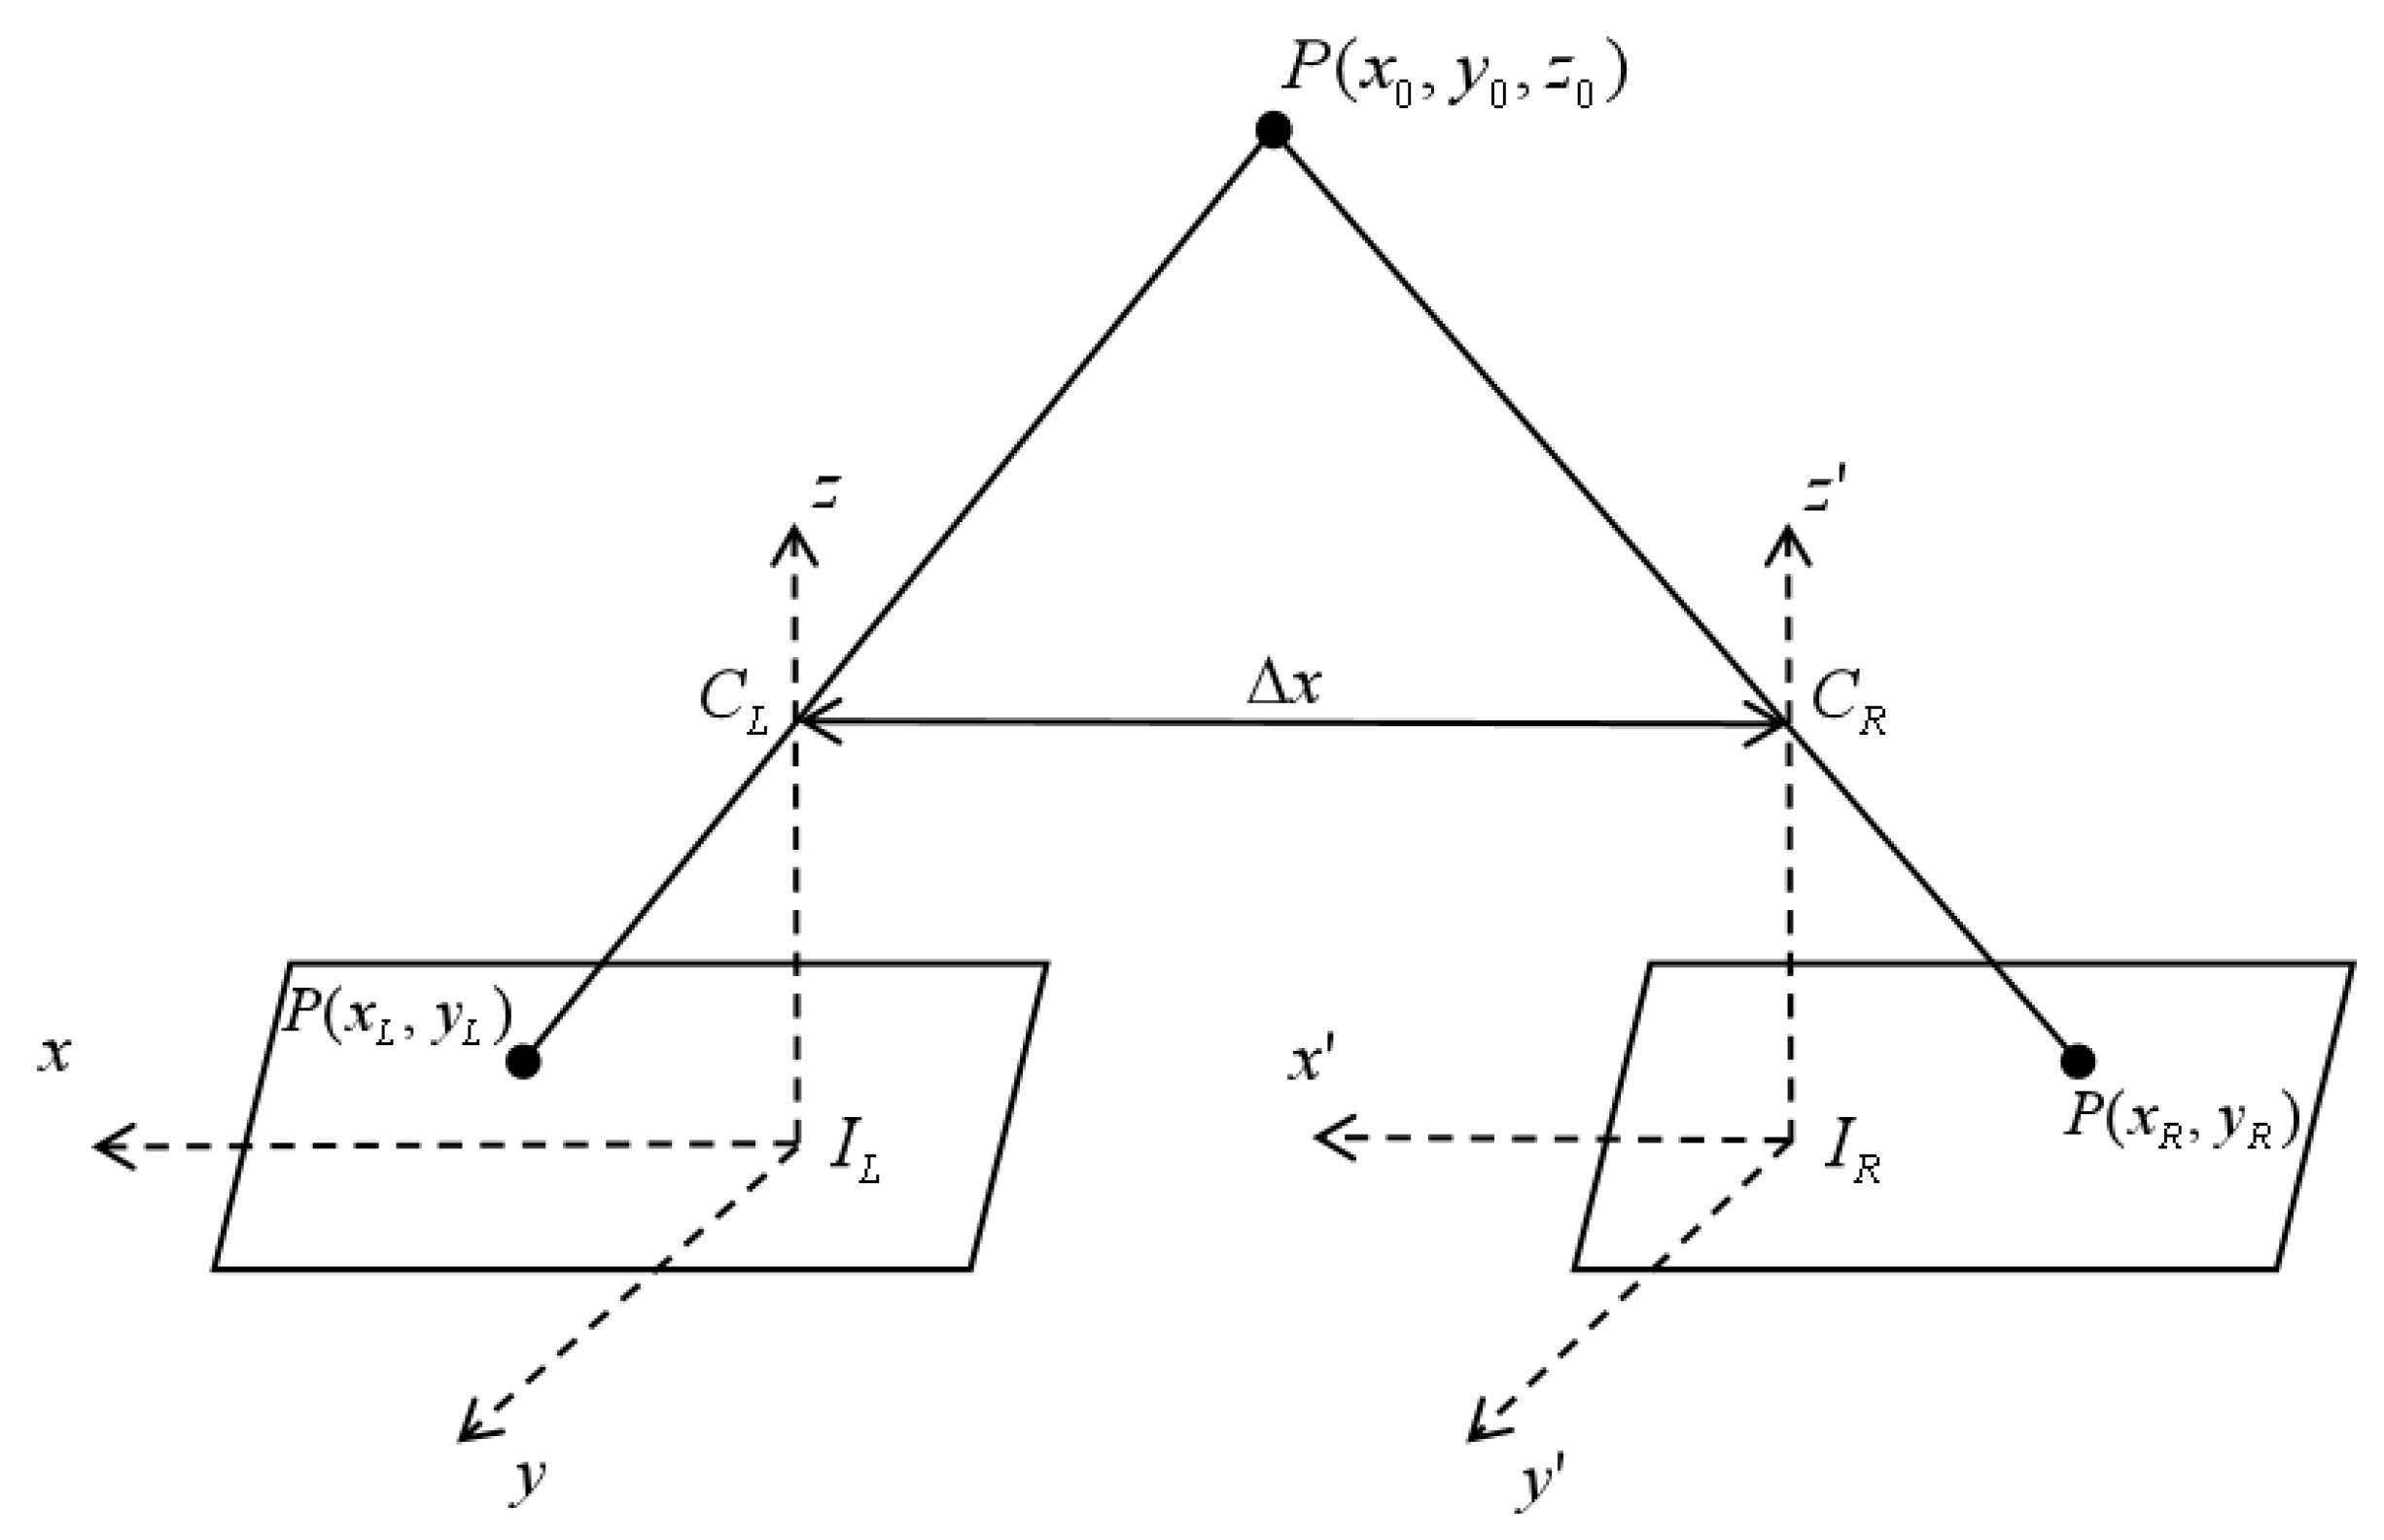
8] combined NDVI with GIS information analysis. First, satellite images were classified into different regions based on NDVI values. Then, the stereo matching method was employed to estimate tree heights around transmission towers.
Figure 3 shows two distinct left and right images with positional coordinates (x, y, z), both corresponding to the same ground point P(x, y, z). This method generates a depth map and integrates GIS information technology. Since GIS data contains the geographic coordinates of transmission towers, analyzing the GIS information of the images enables vegetation height estimation.
Another method for detecting vegetation encroachment in power line corridors is the object detection-based (ODB) approach, where the targets are typically power line corridors or transmission tower bases. The study by [
9] implements the ODB method on Google Map images to extract and detect power line corridors. The process involves loading target images containing all relevant information, converting them to grayscale, and applying filtering. To eliminate irrelevant data, a transmission tower library is created by separately extracting the average histogram of each tower. Finally, targets are extracted pixel by pixel and matched with the tower library. Bounding boxes are then generated around the detected transmission towers, and paths between towers are plotted to extract the corridor from the image.
The applications of SAR imagery primarily focus on two aspects: deformation detection of power towers using SAR data [
10] and disaster monitoring around power lines. Prior to 2015, SAR satellites were primarily employed to investigate the scattering characteristics of transmission towers. As early as 2000, Sarabandi et al. [
11] proposed a statistical polarization detection algorithm that significantly improves the signal-to-clutter ratio. This algorithm uses the coherence between co-polarized and cross-polarized backscatter components as the detection parameter. In addition to using SAR satellites for studying the scattering characteristics of transmission line towers, SAR satellite imagery has also been applied for the indirect monitoring of infrastructure safety, including power lines. In 2025, the study by [
12] proposed a hybrid method that combines large-scale vision models and improved small models for few-shot detection of collapsed transmission towers.
Traditional optical satellite remote sensing image target detection primarily relies on machine learning and image processing technologies, with a workflow that includes region selection, feature extraction, and classifiers. The feature extraction phase involves information such as image grayscale values, textures, and ground object spectral data, all of which play crucial roles in target detection. Machine learning algorithms are currently being applied in power line inspection based on satellite remote sensing imagery. Uehara et al. [
9] utilized higher-order local autocorrelation image features to extract spatial and spectral relationships from multispectral satellite images while employing AdaBoost as a classifier for patch images, achieving approximately 90% precision and 80% recall. Prakash et al. [
13] used an active learning technique on 150,000 square kilometers of multispectral imagery from World-View2 in southeastern Australia, employing supervised pre-labeled data to detect transmission towers, ultimately achieving 80% precision and 50% recall for the transmission tower detector. Rohrer et al. [
14] proposed an automated method that estimates power line locations in images using indirect indicators of electrical infrastructure such as MODIS land cover data and nighttime light data. However, traditional optical satellite remote sensing target detection algorithms are only suitable for specific environments and backgrounds, demonstrating poor generalization capability. They are mainly used for detecting larger targets like transmission towers with little coverage of distribution towers and struggle to effectively address challenges in satellite remote sensing imagery such as high noise levels, complex backgrounds, and varying target scales.
With the rapid development of deep learning, researchers have found that applying deep learning-based target detection methods can better achieve the extraction of electrical targets in satellite remote sensing imagery. Deep learning-based target detection methods automatically extract features from images through convolutional neural networks (CNNs), enabling hierarchical and high-dimensional feature representations.
Current mainstream target detection methods are mainly divided into two categories. The first category consists of region-based two-stage object detection algorithms represented by R-CNN [
15], Fast R-CNN [
16], and Faster R-CNN [
17]. Their core idea involves first generating region proposals using selective search methods, followed by regression and classification on these proposals. The second category includes one-stage detection algorithms represented by SSD [
18], RetinaNet [
19], and the YOLO series [
20,
21,
22,
23,
24,
25,
26,
27,
28]. These approaches formulate the detection problem as a regression task, generating anchor boxes of varying sizes and aspect ratios at each position on specific feature maps to predict target class probabilities and locations. The YOLO algorithm has evolved through multiple generations, from the initial YOLOv1 to the YOLOv9 used in this paper, offering richer functionality, higher classification accuracy, and faster detection speeds.
The application of deep learning-based target detection methods in satellite remote sensing imagery has achieved significant progress. Hu et al. [
29] constructed four power tower subsets from different geographic locations based on the power transmission and distribution infrastructure image dataset [
30] and explored the performance differences of Faster R-CNN, YOLOv2, and RetinaNet in automatically detecting power towers from satellite remote sensing images. RetinaNet ultimately demonstrated the best performance, achieving 47% precision and 60% recall. The study also revealed that the satellite imagery resolution must reach at least 0.3m to detect at least half of the power towers. Haroun F. et al. [
31] employed the RetinaNet deep learning model to detect transmission tower locations in satellite imagery, achieving a mean Average Precision (mAP) of 72.45% at an IoU threshold of 0.5. They further developed a routing algorithm that extracts power corridor areas by creating virtual paths between each pair of detected adjacent transmission towers. Current deep learning-based power tower detection algorithms in satellite remote sensing imagery primarily leverage the advantages of typical detection models but still fail to adequately address challenges such as small target sizes, multi-scale characteristics, and complex backgrounds specific to power towers in satellite imagery.
The features of optical satellite remote sensing images can generally be divided into high-level features and low-level features. High-level features represent abstract semantic information, while low-level features contain detailed information such as spectral and texture characteristics. In CNN networks, the distribution of features across different layers is related to the scale of the targets. In satellite remote sensing imagery of power towers, the significant scale differences between distribution towers and transmission towers make it challenging to synchronize their feature propagation to deeper network layers. Additionally, deep learning-based target detection models primarily use the final layer features extracted by convolutional neural networks for classification and localization, resulting in reduced small-target information in the final network output. This leads to lower detection accuracy for small targets like distribution towers. Therefore, leveraging multi-scale feature maps and designing multi-scale feature fusion modules becomes particularly critical.
Hou et al. [
32] designed a feature fusion strategy through cascading to integrate high-level semantic information with low-level detailed information, enhancing multi-scale feature representation and mitigating the information loss of small targets during CNN propagation. Fu et al. [
33] proposed a feature fusion architecture to generate multi-scale feature hierarchies, incorporating top-down and bottom-up pathways to blend shallow-layer features with high-level features. Zhu et al. [
34] introduced the TPH-YOLO model, which enhances YOLOv5’s prediction network using transformers and self-attention mechanisms to achieve effective multi-scale target detection. Zhou et al. [
35] developed an attention multi-hop graph and multi-scale convolution fusion network (AMGCFN), which includes a full multi-scale CNN and a multi-hop GCN, to extract hierarchical information from hyperspectral images.
Another challenge in object detection of power tower satellite remote sensing images lies in the interference from complex backgrounds. Power towers are highly susceptible to false detection due to the color, shape, and other characteristics of similar objects. Hong et al. [
36] proposed a high-resolution domain adaptation network (HighDAN), which captures multi-scale image representations from parallel high-to-low resolution subnetworks. This network efficiently generates repetitive information across resolutions and bridges differences between remote sensing images under varying backgrounds through adversarial learning, effectively mitigating background interference. To better handle multi-source remote sensing data, Hong et al. [
37] further designed a universal remote sensing foundation model, SPectralGPT. This model adapts to input images with diverse sizes, resolutions, temporal sequences, and regions through a progressive training strategy while employing multi-objective reconstruction to capture spectral sequential patterns for the comprehensive utilization of remote sensing data across scenarios.To address issues such as insufficient feature representation and background confusion, Zhang et al. [
38] proposed an efficient algorithm called FFCA-YOLO. It improves the network’s capabilities in local area awareness, multi-scale feature fusion, and global association across channels and space, enhancing the feature representation of small objects in remote sensing images and suppressing confusing background interference.To address complex background interference, Zhang et al. [
39] proposed a context-aware detection network (CAD-Net). This network integrates attention-modulated features with global and local contextual information to adapt to environmental variations around targets. Wang et al. [
40] developed a representation-enhanced state replay network, which jointly optimizes parameters across different branches to enhance the interactive fusion of information between heterogeneous remote sensing images.
In addition, remote sensing image generation models have gradually become a widely recognized research direction. In 2025, Yang et al. [
41] proposed a multi-class and multi-scale object (MMO) image generator called MMO-IG, based on deep generative models (DGMs). This model is capable of generating remote sensing images with supervised object labels from both global and local perspectives. MMO-IG achieves precise modeling, rational spatial distribution, and global guidance of object instances through the collaborative use of ISIM, SCDKG, and SODI. This not only expands the dataset size but also significantly enhances the effectiveness and representational quality of the data, thereby improving the performance of remote sensing object detection.
In summary, multi-scale detection and complex background interference hinder the development of power tower object detection algorithms in satellite remote sensing images. Most existing power tower detection methods still rely on basic single-stage or two-stage mainstream object detection models, which perform poorly in small object detection and fail to adequately address challenges such as multi-scale feature fusion and model generalization in complex backgrounds.
3. Methods
To address the aforementioned challenges, prior to the formal commencement of this study, we compared and evaluated various mainstream object detection models. The baseline YOLOv9 model demonstrated relatively strong performance in terms of accuracy, recall, and robustness. As the latest iteration of the YOLO series, YOLOv9 inherits the efficiency and accuracy of its predecessors while introducing several innovations in model architecture. Therefore, this study ultimately selected the YOLOv9 network as the foundational framework to implement modifications tailored for power tower targets in remote sensing imagery, aiming to further enhance its detection performance under the specified research conditions.
3.1. Architecture of the YOLOv9 Model
The YOLOv9 model’s core concept is to predict object categories, locations, and confidence scores across multi-scale feature maps through a single forward pass. The model incorporates the Programmable Gradient Information (PGI) framework to address the diverse variations required by deep networks for multi-objective optimization. PGI provides complete input information for target tasks to compute loss functions, thereby deriving reliable gradient information for updating network weights. Additionally, based on gradient path planning, the model introduces a novel lightweight network architecture—the generalized efficient layer aggregation network (GELAN). Its design validates that PGI achieves superior results on lightweight models.
YOLOv9’s architecture draws inspiration from YOLOv5, YOLOv6, YOLOv7, and YOLOv8. Its core module, RepNCSPELAN, integrates the CSPNet Block from YOLOv5, the Rep module from YOLOv6, and the ELAN module from YOLOv7. For training, the task-aligned assigner from YOLOv8 is adopted for positive/negative sample selection, while the DFLLoss function is referenced for loss computation.
3.2. YOLOv9-GDV Model Architecture
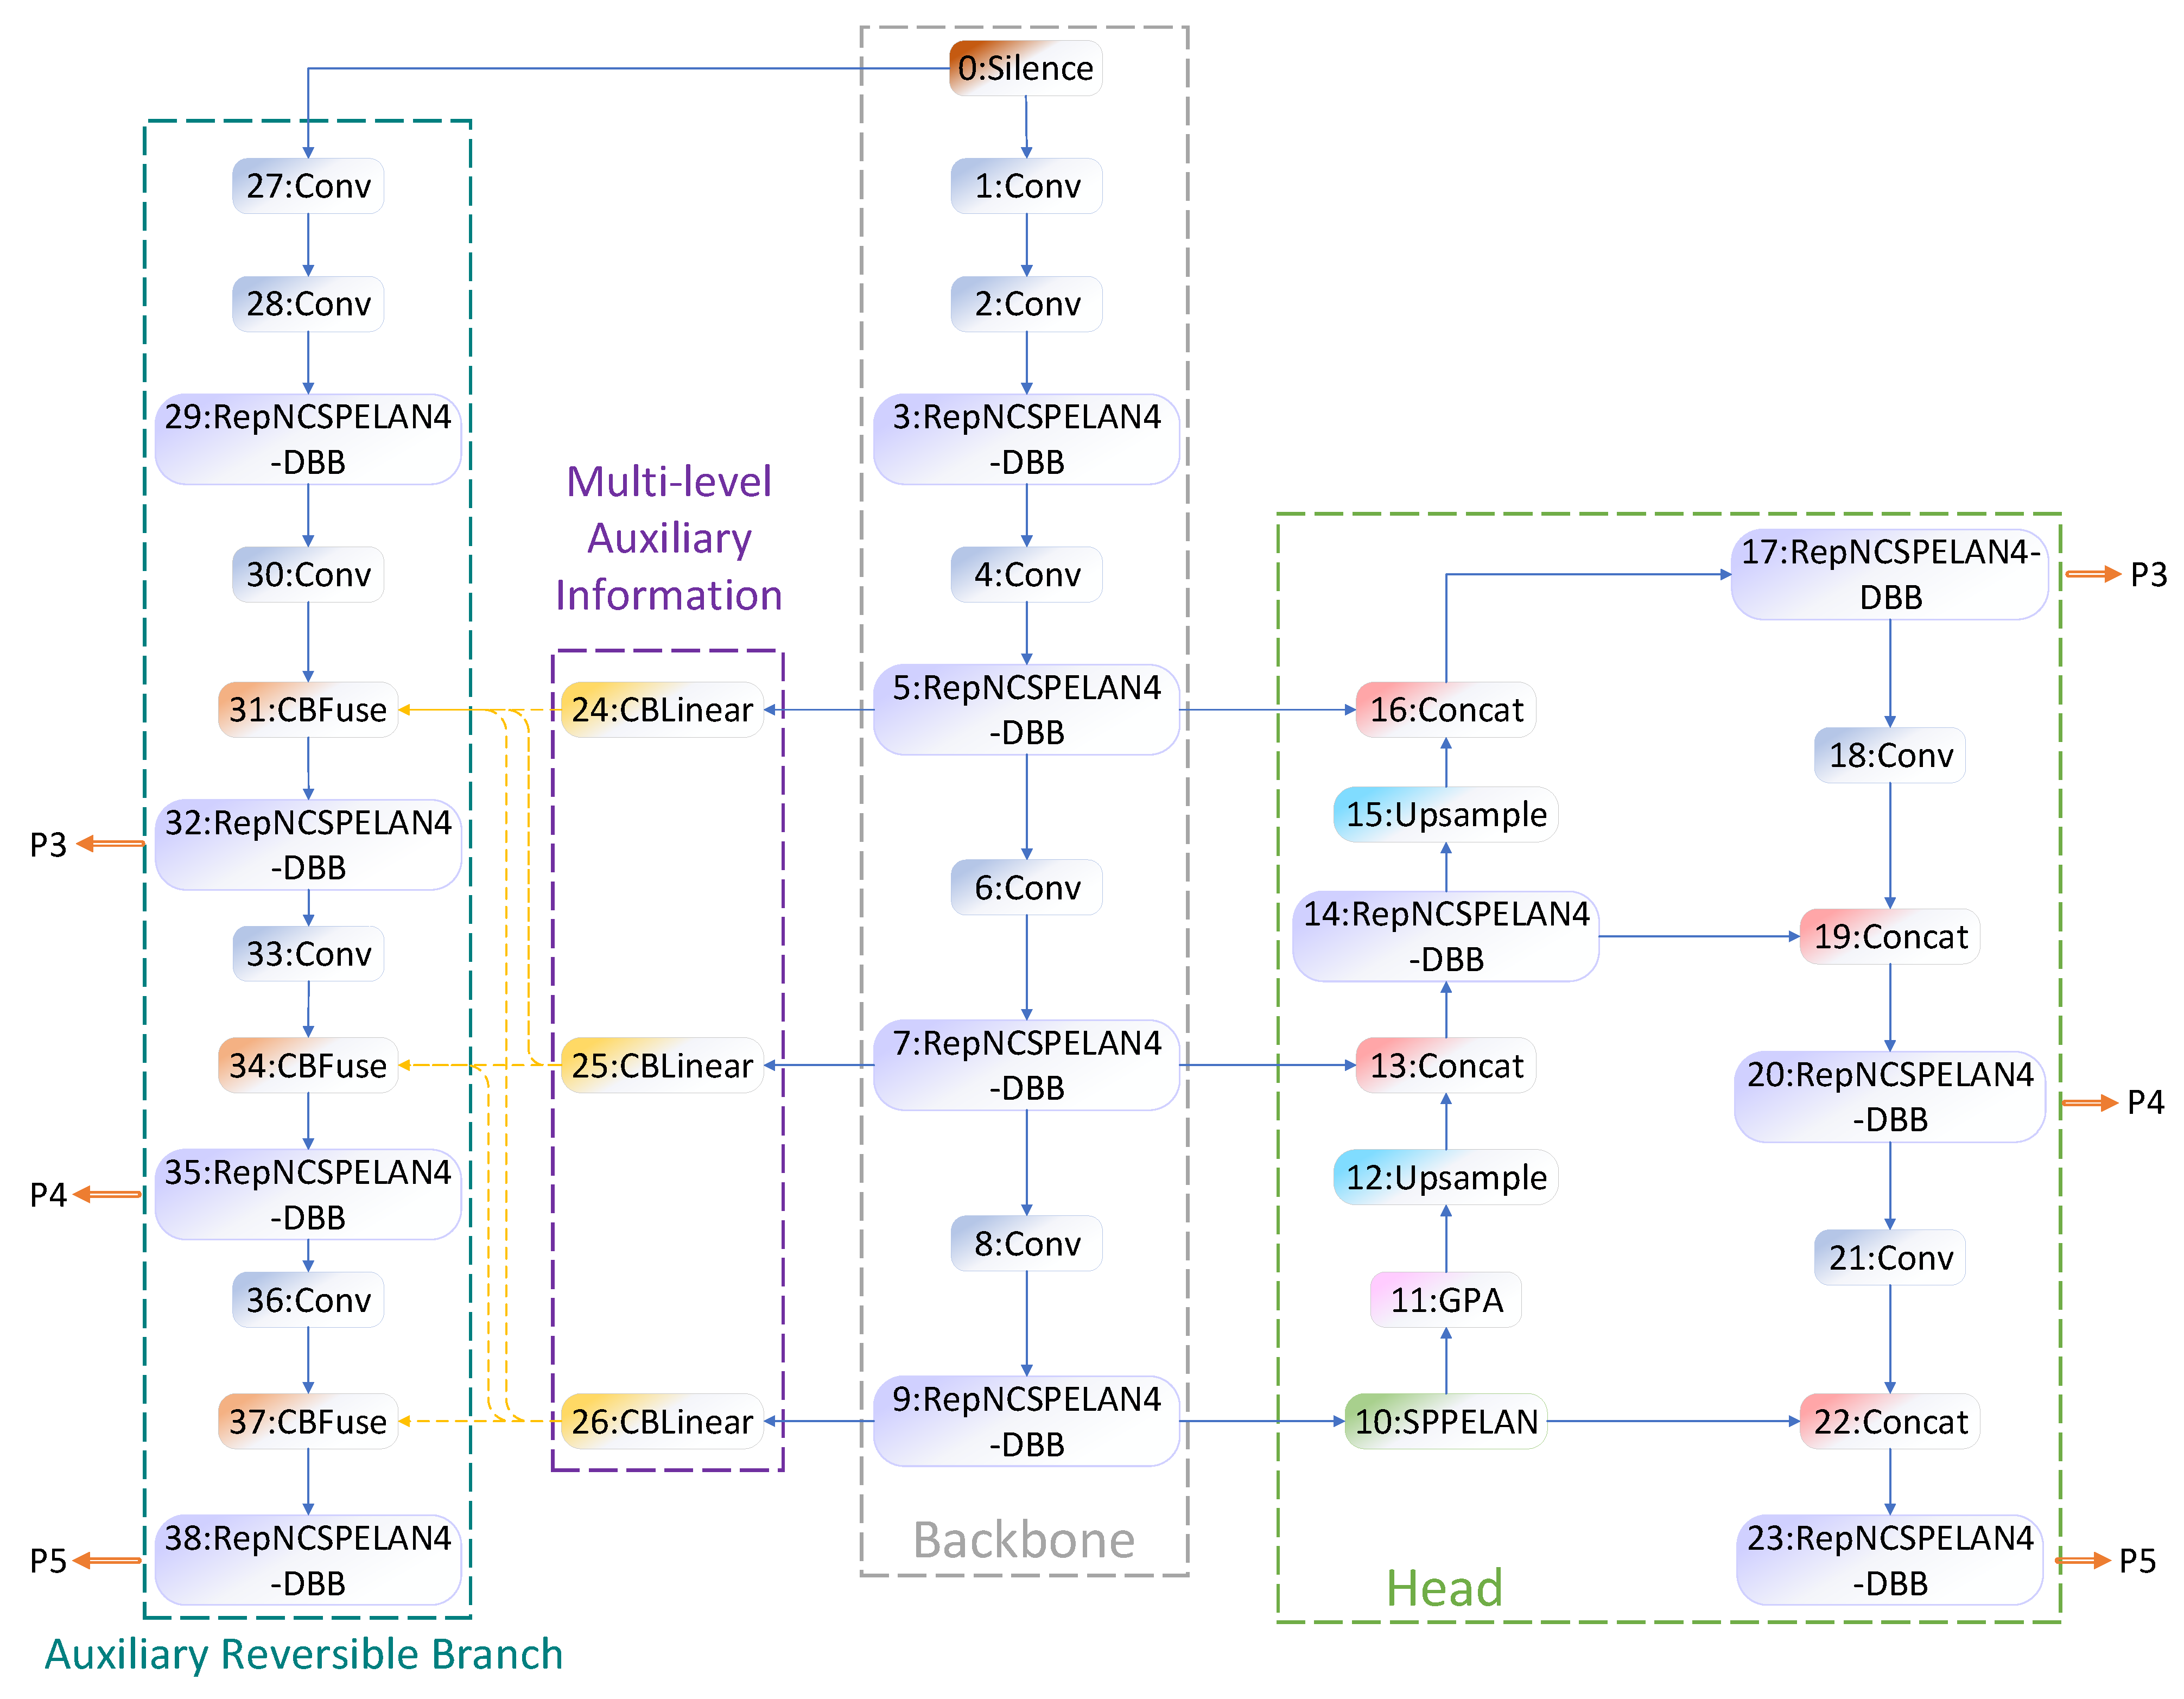
This paper presents an improved version of the YOLOv9 baseline model, resulting in the enhanced YOLOv9-GDV network architecture shown in
Figure 4. The improvements include (1) the integration of the GPA attention mechanism into the YOLOv9 baseline network to enhance global representation capabilities; (2) the incorporation of the Diverse Branch Block (DBB) into the core RepNCSPELAN module; and (3) the adoption of the VMPDIoU loss to refine the model. By directly computing key point distances between predicted and ground-truth bounding boxes, this loss function more accurately reflects their discrepancies, thereby improving the model’s average accuracy.
3.3. Global Pyramid Attention
For remote sensing image object detection models, introducing global representation capabilities is crucial. In remote sensing images, detection targets are typically small, and the detection scenarios are often complex, with occlusions, overlaps, or multi-category objects. Without understanding and distinguishing background information, numerous interference factors may arise. Global representation capability helps the model comprehend the relationship between objects and the background, enabling the effective separation and identification of different targets in complex visual environments, thereby improving detection accuracy. Models with global representation capabilities can better integrate information from different scales and locations, enhancing detection performance and robustness.
Given high-resolution satellite remote sensing images of power towers, this study improves the network architecture and attention mechanism of the baseline model YOLOv9 by designing an efficient multi-scale attention mechanism module. This introduces global representation capability to the model, helping it understand the relationship between objects and the background. As a result, the model can better process remote sensing image data and separate detection targets from complex backgrounds. The specific structure is shown in
Figure 5.
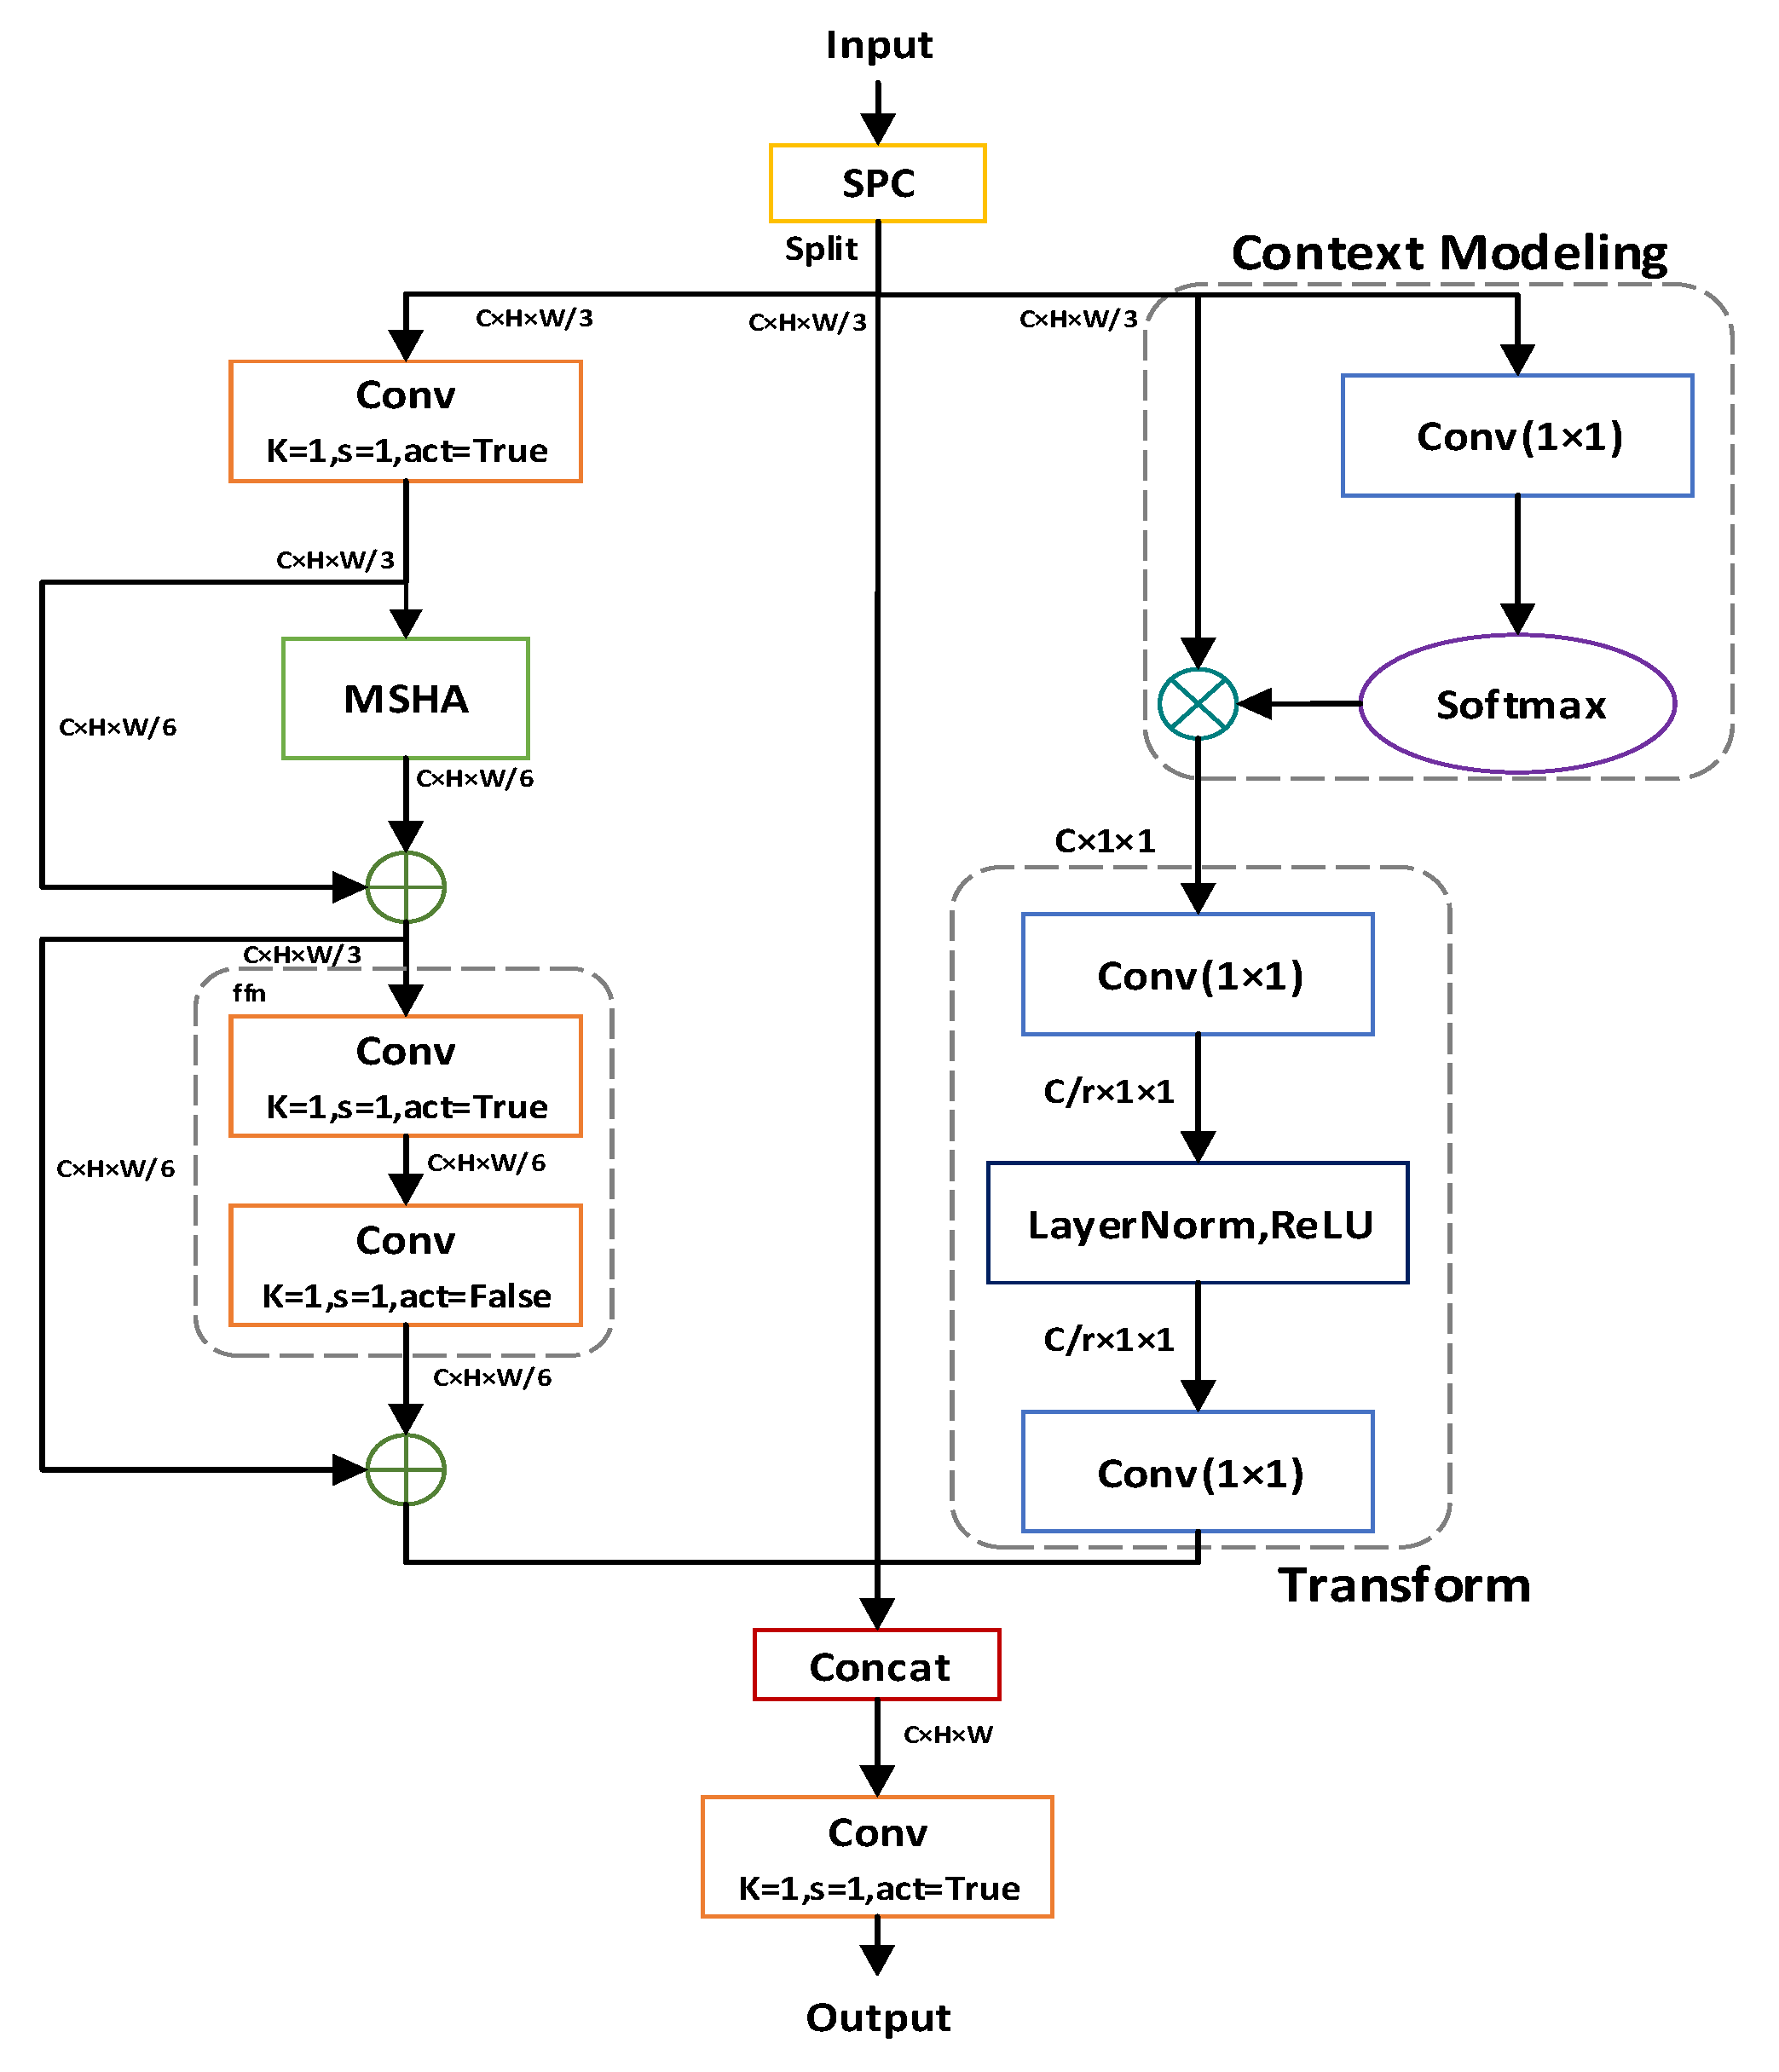
We name this partial self-attention mechanism Global Pyramid Attention (GPA), which can be applied to tasks such as image classification and object detection. GPA works by concatenating convolution results from kernels of different sizes to form a pyramid-shaped feature map, then applying attention mechanisms on this feature map. Simultaneously, a global context module captures global information by performing global average pooling on the original input feature map, enhancing its representational capacity to produce a globally weighted feature map. The two weighted feature maps are then connected to the original feature map via residual connections to extract richer feature information.
The GPA module is implemented through the following steps:
1. Feature Partitioning: Use the SPC module to uniformly divide the input features into three parts via a 1 × 1 convolution.
2. Take one partitioned feature and apply global average pooling to obtain a global context vector. Perform feature transformation: Reduce channel dimensions via a 1 × 1 convolution, introduce non-linearity with ReLU activation, restore channels with another 1 × 1 convolution, and generate channel attention weights using a Sigmoid function. Enhance features by multiplying the weights with the input features to produce a weighted feature map.
3. Feed another partitioned feature into the NPSA block, which consists of a multi-head self-attention (MHSA) module and a feed-forward network (FFN).
4. Concatenate the three partitioned features and fuse them via a 1 × 1 convolution to generate the final output.
The PSA module is only placed after SPPELAN to avoid excessive computational overhead caused by the quadratic complexity of self-attention. This design introduces global representation learning to the YOLO model at a low computational cost, enhancing model capability and performance.
Through these precision-driven designs, the YOLO model’s performance is improved without significantly increasing computational costs.
The specific derivation process is as follows:
1. First, let the input feature map be
. The input feature map is partitioned into three components by the channel-splitting SPC module.
Part 1 performs local feature enhancement. Part 2 preserves the original information to avoid feature shift, and Part 3 conducts global context modeling. Finally, the three feature branches are concatenated and fused through a convolution to produce the output.
2. The input to the local feature enhancement branch is
. First, convolutional dimensionality reduction is performed by applying a
convolution to a
convolution, with the ReLU activation function:
The MSHA module (multi-scale attention) fuses multi-scale features by dividing the feature map into two levels and applying two different scale-specific feature processing functions
:
After concatenating the feature maps of the two scales, a sigmoid function is applied to obtain the attention map:
Then it is applied to the original feature map:
The feed-forward neural network (FFN) consists of two
convolutions:
Adding a residual connection, we obtain
3. The input to the original information branch is . It is directly fed into the Concat operation to ensure that while the model focuses on attention regions, it also retains basic features such as original textures and edges, maintaining semantic balance between the branches.
4. The input to the global context modeling branch is
. First, a
convolution is applied to obtain the attention logits, which are then passed through a Softmax function to produce the spatial attention map
A:
Softmax normalization is performed over the spatial dimensions
to obtain global receptive field context weights. The attention map is used to perform global context weighting on the input features:
Channel modeling is performed through two layers of
convolutions followed by LayerNorm and ReLU nonlinear mappings:
5. For concatenation and fusion, the three feature branches are
After concatenation, the features are fused and output through a
convolution:
3.4. RepNCSPELAN-DBB Feature Extraction and Fusion Module
During the experimental phase, the feature extraction performance for power towers in remote sensing imagery was largely unsatisfactory, exhibiting insufficient feature learning effectiveness. To enhance the applicability of the designed object detection model for power transmission line equipment, this study improves the RepNCSPELAN feature extraction–fusion module in the YOLOv9 network architecture. A Diverse Branch Block (DBB) is introduced to reconstruct the module structure, forming a novel feature extraction–fusion module named RepNCSPELAN-DBB. This enhancement aims to improve the feature extraction network’s capability in capturing distinctive features of power tower targets.
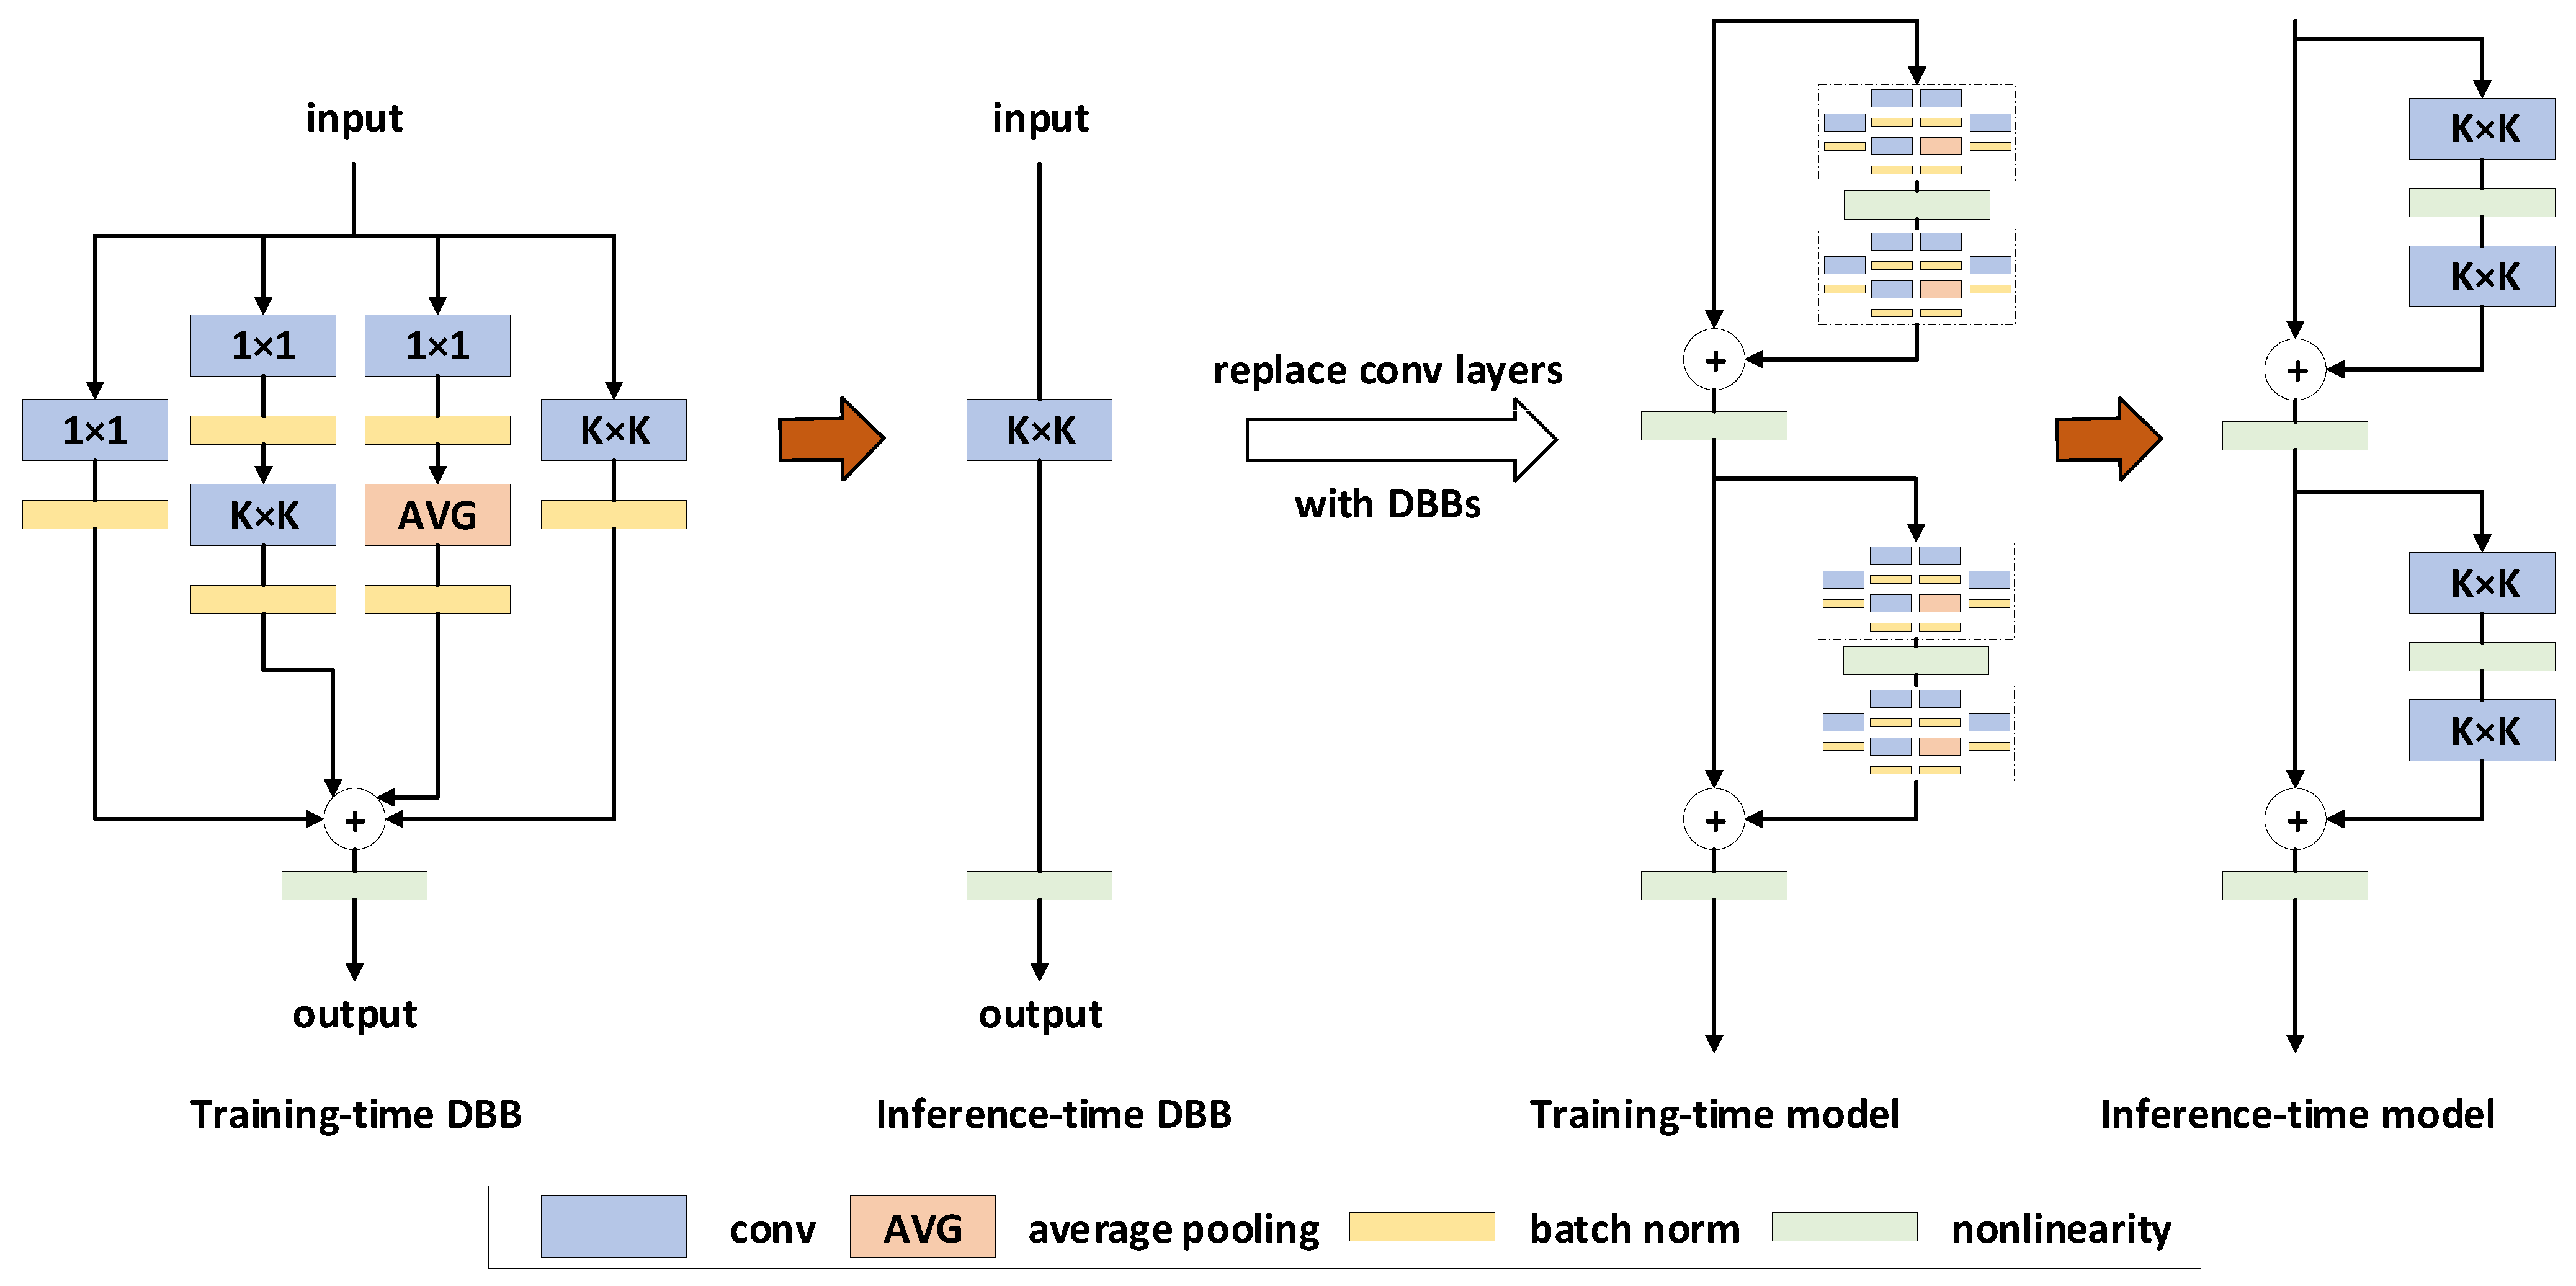
A Diverse Branch Block (DBB) is a universal convolutional neural network (ConvNet) building block that enhances performance without increasing inference-time costs. The DBB strengthens the representational capacity of a single convolution by incorporating diverse branches with varying scales and complexities, enriching the feature space through components such as convolutional sequences, multi-scale convolutions, and average pooling. After training, the DBB can be equivalently converted into a single convolutional layer for deployment. Unlike advances in novel ConvNet architectures, the DBB complicates the microstructure during training while preserving the macroarchitecture, enabling it to serve as a plug-and-play replacement for standard convolutional layers in any architecture. This approach allows models to achieve higher performance during training and then revert to the original inference-time structure for deployment.
The core principles of the DBB involve increasing the complexity of convolutional layers during the training phase by introducing branches of different sizes and structures to enrich the network’s feature representation capabilities. These principles can be summarized as follows:
1. Diverse Branch Structures: The DBB enhances the complexity of convolutional layers during training by introducing branches with varying kernel sizes and architectures (e.g., different-sized convolution kernels and average pooling). This diversifies the feature representation capabilities of a single convolutional layer.
2. Training–Inference Decoupling: During the training phase, DBB employs complex multi-branch structures to enrich feature learning. During the inference phase, these branches are equivalently converted into a single convolutional layer, ensuring efficient deployment without the computational overhead.
3. Macroarchitecture Preservation: The DBB acts as a drop-in replacement for standard convolutional layers, enabling seamless integration into existing networks without altering their macroarchitecture.
Figure 6 illustrates the structure of the Diverse Branch Block (DBB) during training (left); the DBB consists of convolutional layers of varying sizes and average pooling layers arranged in parallel in a complex configuration, which are merged to produce the final output; after training, these intricate structures are equivalently converted into a single convolutional layer for the inference phase (right), preserving deployment efficiency. This transformation enables the DBB to enhance microstructural complexity during training while maintaining the macroarchitecture.
The concept of training–inference decoupling refers to using the complex DBB structure during the model’s training phase and converting it into a simplified convolutional structure during inference. This design allows the model to leverage the diversity of the DBB to enhance feature extraction and learning capabilities during training while maintaining efficiency during inference by reducing the computational load. As a result, the model achieves high performance while ensuring operational speed and resource efficiency.
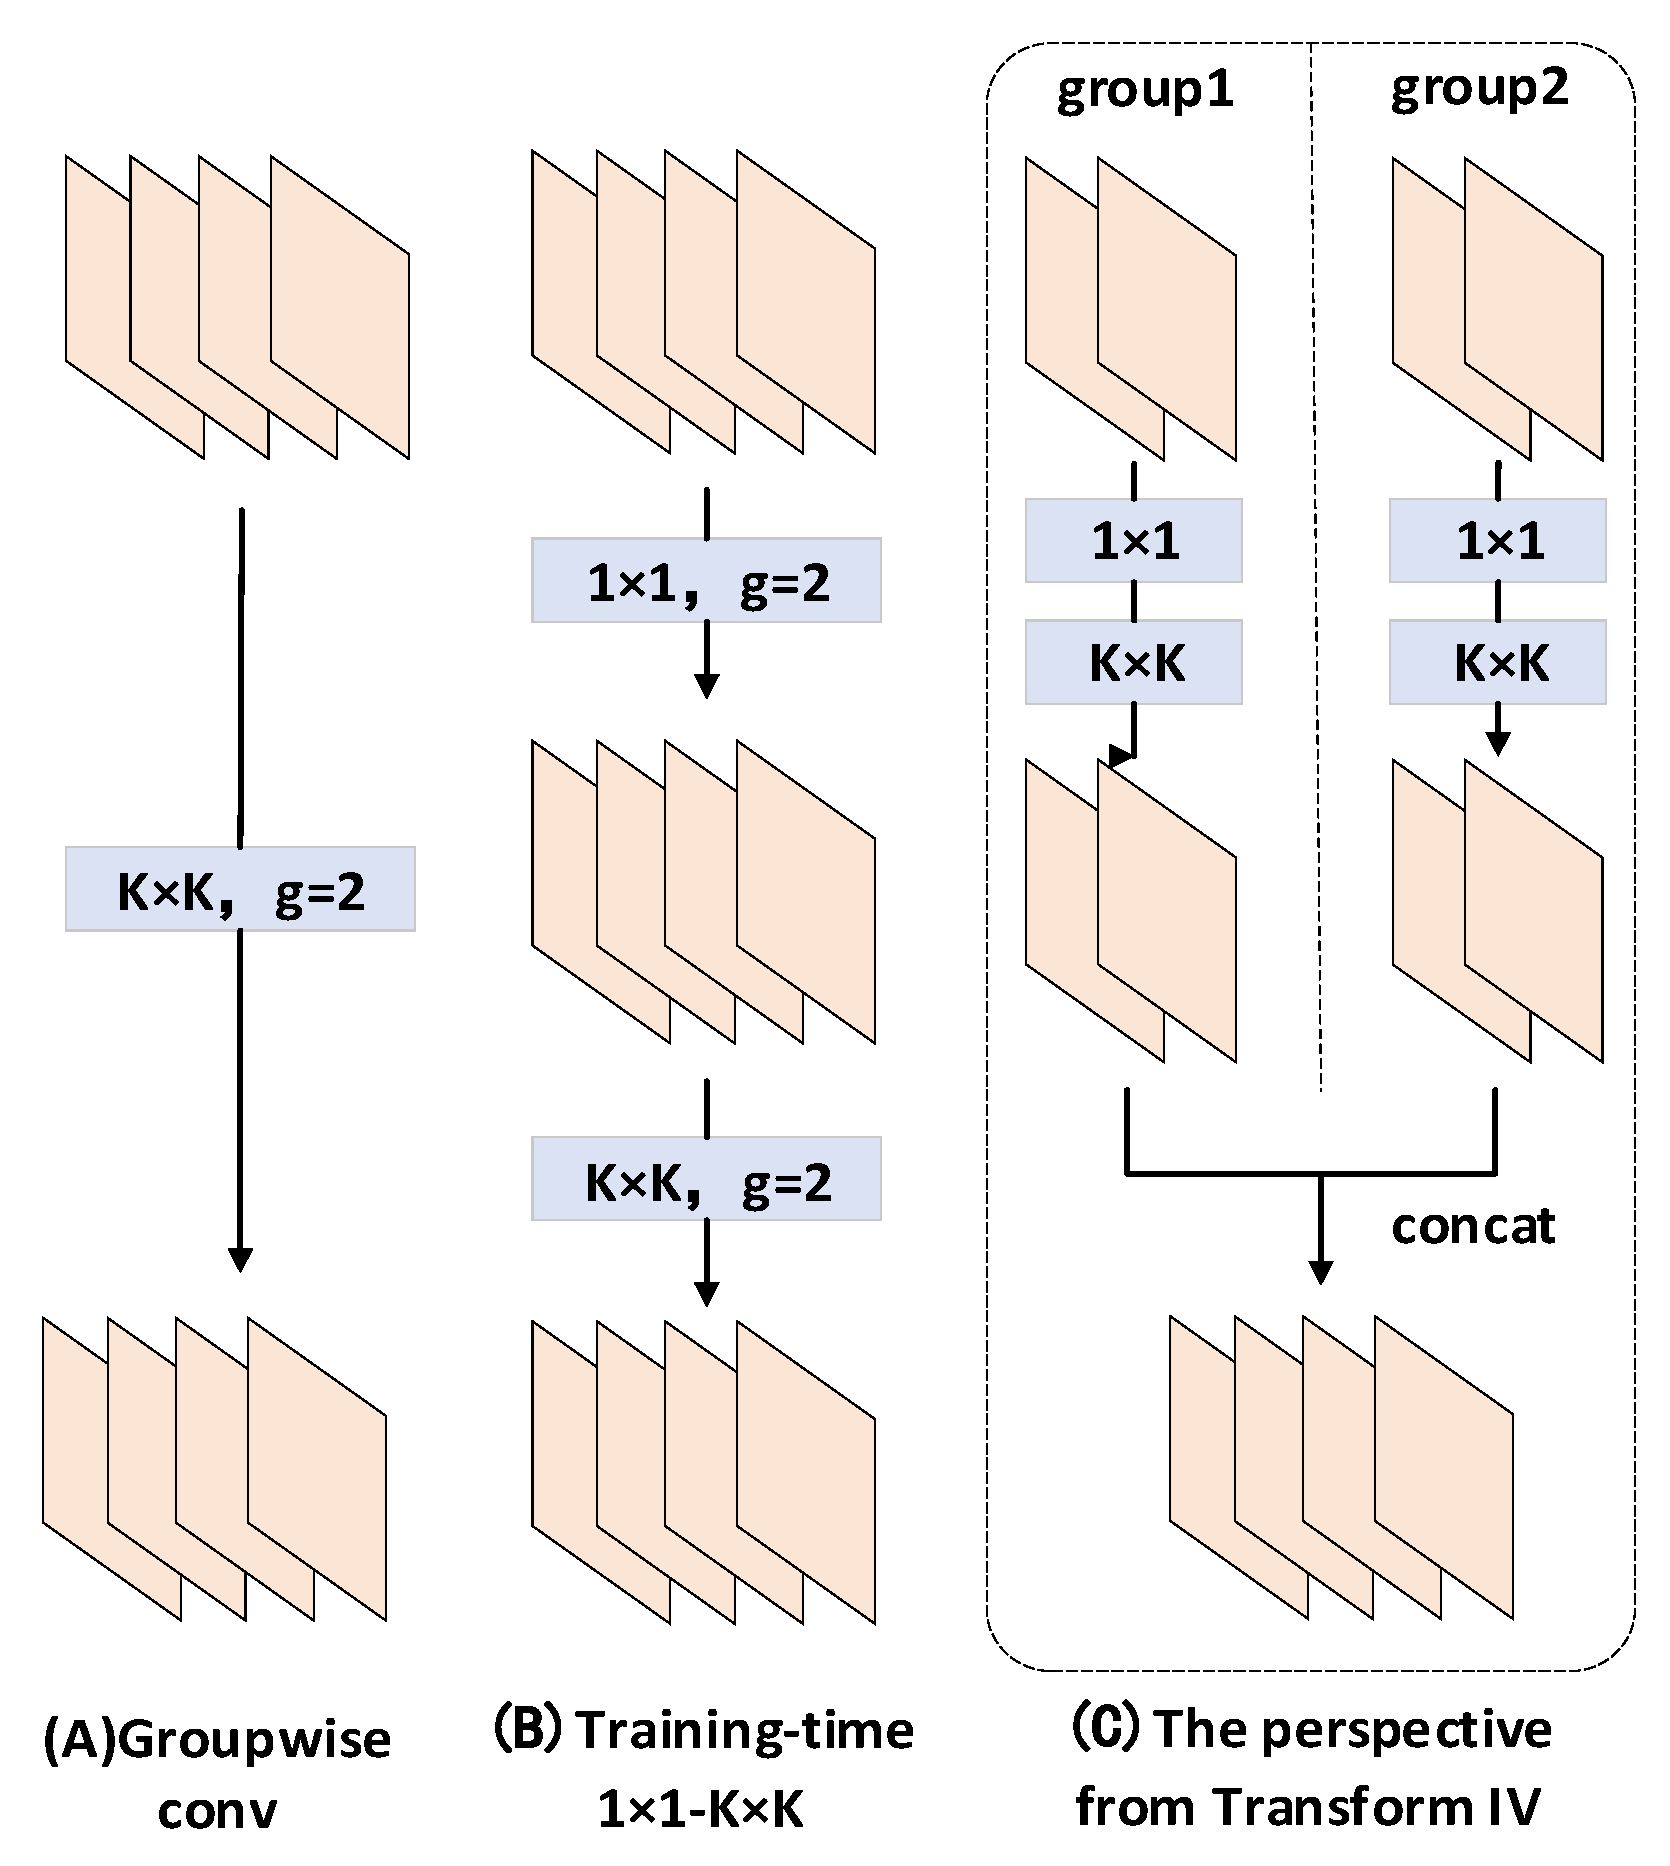
Figure 7 illustrates how different convolutional combinations (e.g., the 1 × 1 and K × K convolutions shown in the figure) are employed during the training phase and how these combinations are equivalently converted into a simplified structure (e.g., the concatenation operation represented by Transformation I in the figure) during the inference phase.
(A) Group-wise Convolution: It divides the input into multiple groups, each processed with distinct convolution kernels.
(B) 1×1-K×K Structure During Training: It first applies a 1 × 1 convolution (to reduce feature dimensionality), followed by grouped K × K convolutions.
(C) From the Perspective of Transformation I: This illustrates the merging of outputs from multiple grouped convolutions. Here, feature maps after group-wise convolutions are first processed through 1 × 1 convolutions, then concatenated.
3.5. VMPDIoU Loss
In object detection, the bounding box regression loss function is critical as it quantifies the discrepancy between ground-truth and predicted boxes. Traditional bounding box regression (BBR) loss functions struggle to optimize scenarios where predicted and ground-truth boxes share the same aspect ratio but differ in specific dimensions. To address this limitation, this study introduces MPDIoU_Loss and proposes an enhancement tailored for remote sensing imagery by defining width (w) and height (h) as multiples of the ground-truth box’s dimensions, naming this improved loss VMPDIoU (Variable Minimum Point Distance Intersection over Union).
MPDIoU (Minimum Point Distance Intersection over Union [
42]) is a novel bounding box similarity metric based on the minimum point distance of axis-aligned rectangles, which integrates overlap area, center point distance, and width/height deviations into a unified measure while simplifying the computational process.
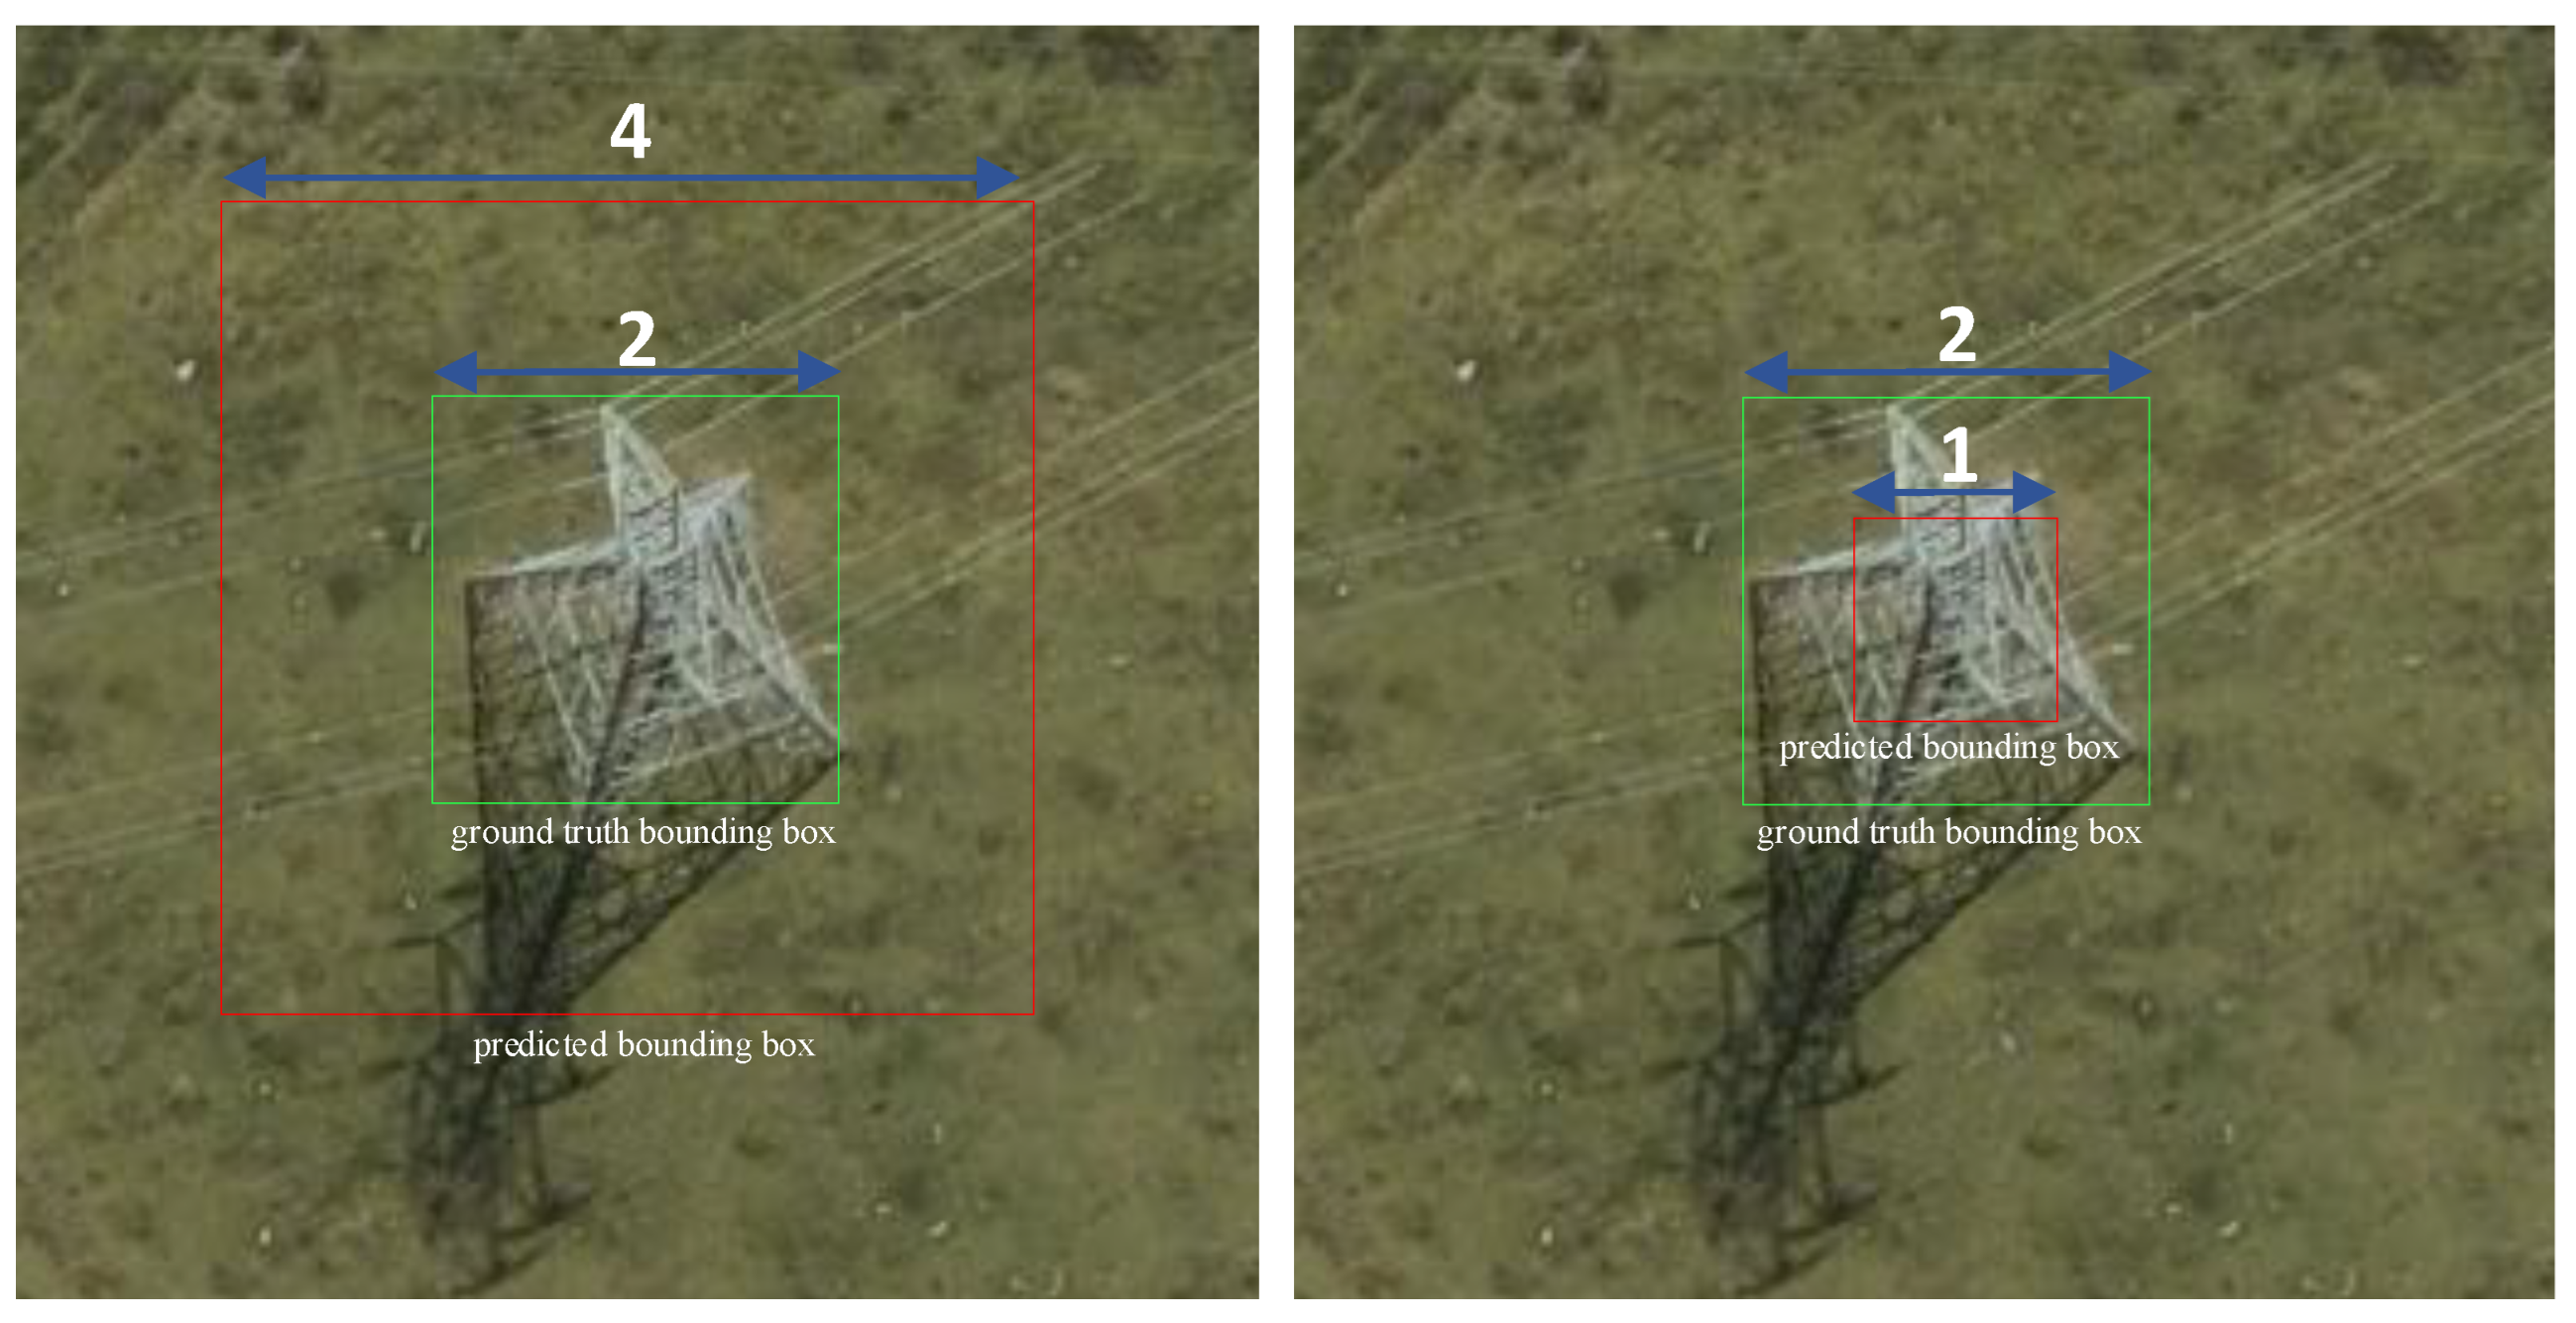
The
Figure 8 illustrates two distinct bounding box regression results. The green boxes represent ground-truth bounding boxes, while the red boxes represent predicted bounding boxes. In the left image, the predicted box has a length of 4 units and the ground-truth box has a length of 2 units, resulting in a ratio of 2:1. In the right image, the predicted box has a length of 1 unit and the ground-truth box has a length of 2 units, resulting in a ratio of 1:2. In both cases, traditional loss functions (e.g., Generalized Intersection over Union [
43], Distance Intersection over Union [
44], Complete Intersection over Union [
44], and Efficient Intersection over Union [
45]) yield identical loss values, whereas the MPDIoU method produces distinct loss values. This demonstrates that traditional approaches may fail to differentiate between certain prediction scenarios, while MPDIoU more accurately reflects discrepancies between predicted and ground-truth boxes. This highlights MPDIoU’s superiority in bounding box regression, particularly in distinguishing boxes with identical aspect ratios but differing sizes or positions. By directly calculating the critical point distances between predicted and ground-truth boxes, MPDIoU provies a more precise loss metric for such cases.
Inspired by the geometric properties of bounding boxes, MPDIoU compels each predicted bounding box to converge toward its ground-truth counterpart during training by minimizing the loss function. It employs the coordinates of the four corner points to represent all components of existing bounding box regression loss functions.
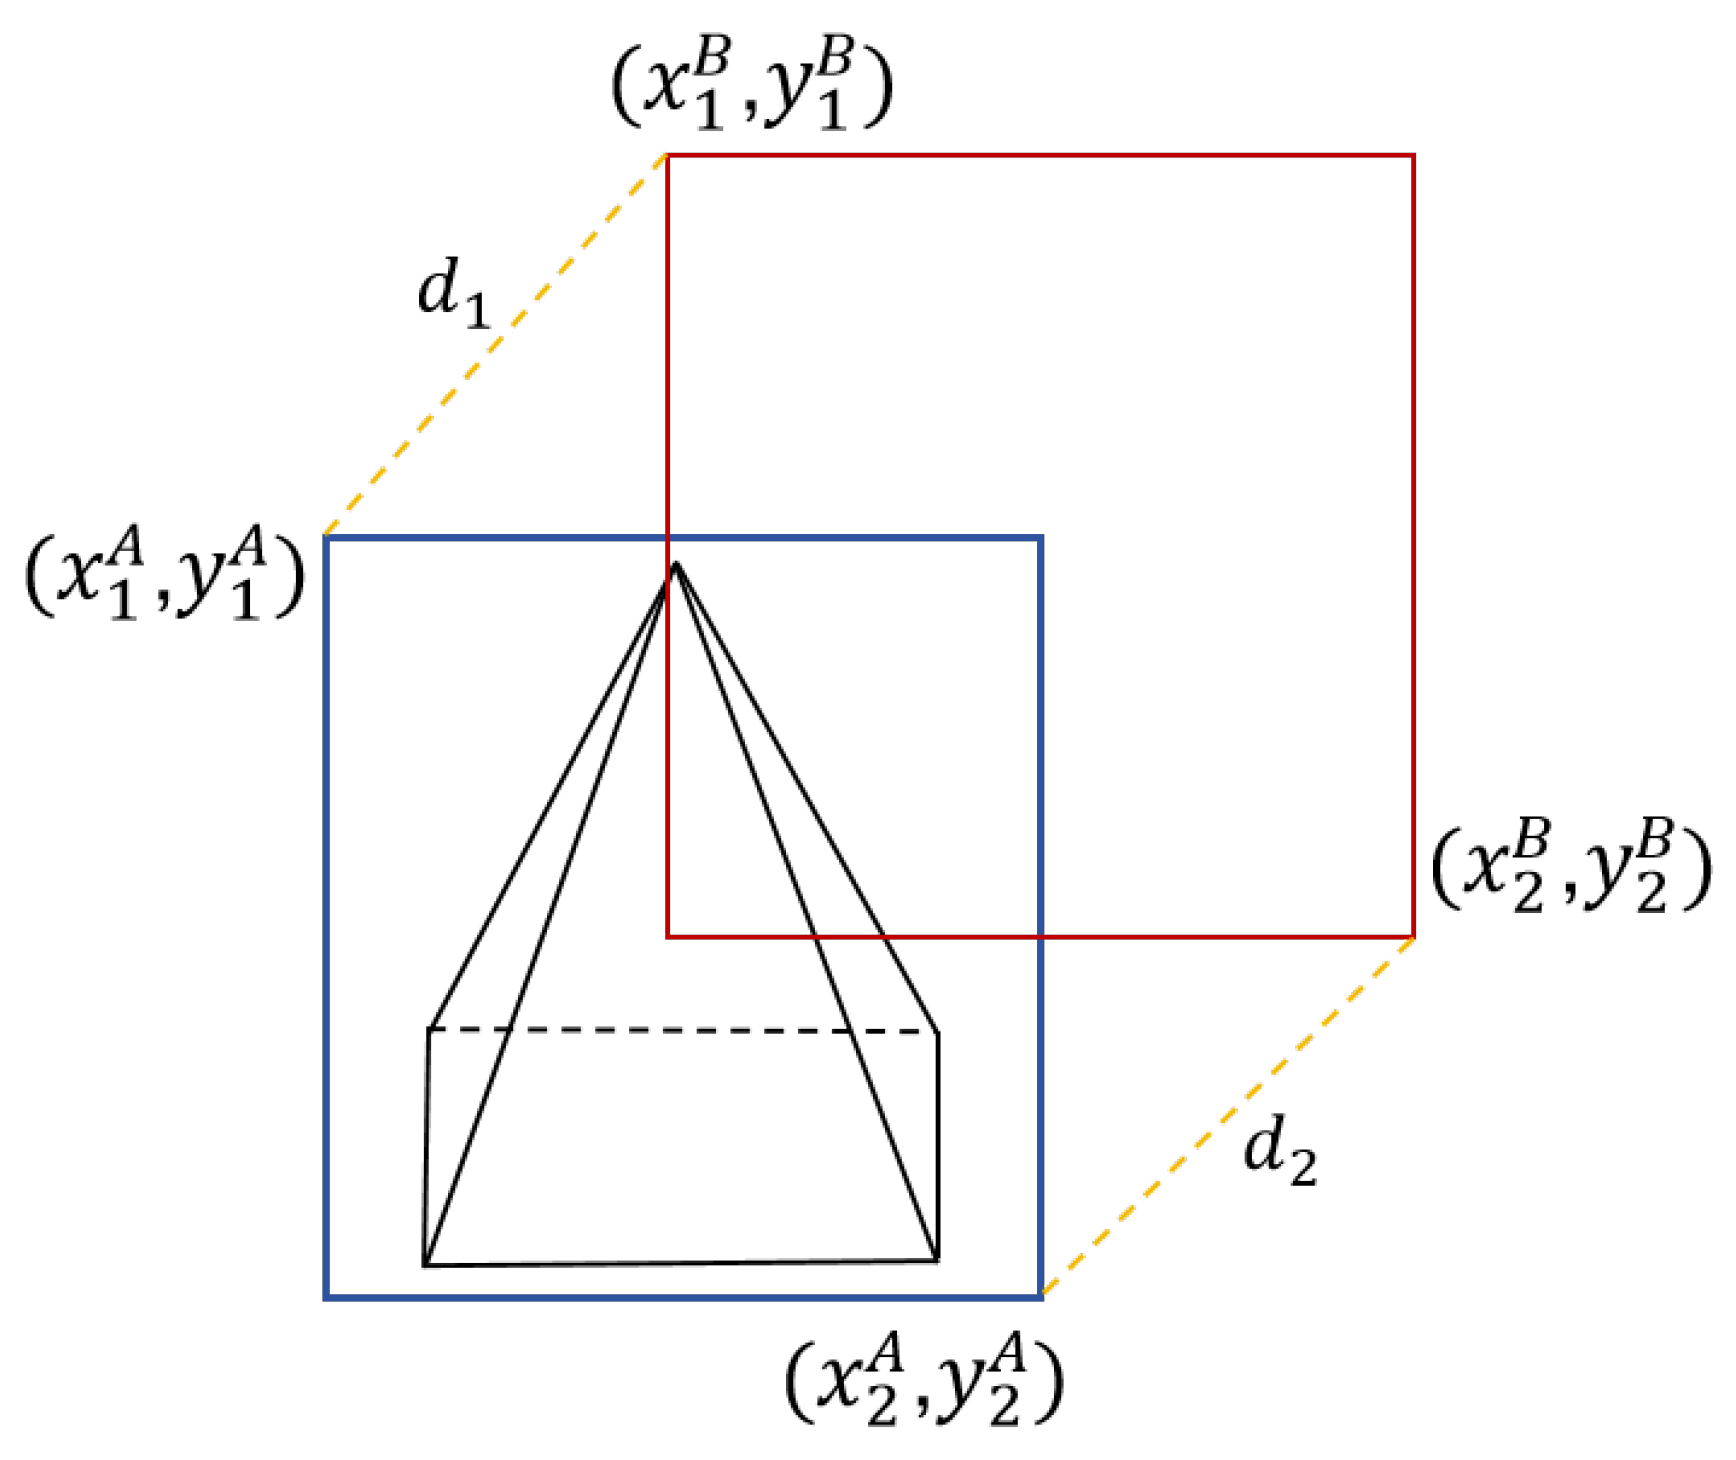
The schematic diagram is shown in
Figure 9. The blue borders indicate the annotation boxes, while the red borders represent the prediction boxes. Assuming the input image has a width of
a and a height of
b, the top-left and bottom-right coordinates of the ground-truth box and the predicted box are represented as
,
,
, and
. Then, the distances between the top-left corners and the bottom-right corners of the two bounding boxes can be expressed as follows:
where
represents the distance of the top-left corner and
represents the distance of the bottom-right corner. MPDIoU and MPDIoU_Loss can be expressed as
Therefore, all components of existing bounding box regression loss functions can be derived from the coordinates of the four corner points. The conversion formulas are as follows:
represents the area of the minimum enclosing rectangle that covers both A and B. and represent the coordinates of the center points of the ground-truth box and the predicted box, respectively. and represent the width and height of the ground-truth box. and represent the width and height of the predicted box.
In Equation (
17),
represents the distance between the top-left corners of the two bounding boxes, while
represents the distance between their bottom-right corners.
a denotes the width of the input image, and
b denotes its height. In remote sensing images, power tower targets are relatively small, and both the annotated ground-truth boxes and the predicted boxes occupy only a small portion of the image. Therefore,
and
are very small compared to
a and
b. As a result, when the position of the predicted box changes, the computed MPDIoU value changes only slightly, making it difficult to clearly reflect the deviation between the predicted box and the ground-truth box.
Moreover, most remote sensing datasets are processed to highlight the target objects, often through image cropping. This creates an issue when using the original input image width a and height b in the MPDIoU calculation. Suppose the predicted box remains unchanged: after cropping the image, the distances and between the two boxes remain the same, but the input image’s width and height change, which leads to inconsistencies in the computed MPDIoU.
To ensure consistency in MPDIoU_Loss calculations before and after data processing, we have modified the definitions of a and b in the formula. Specifically, a and b are redefined as multiples of the ground-truth box’s width and height , respectively. This adjustment ensures that even if the image is cropped, the computed MPDIoU_Loss remains stable and unaffected by the change.
4. Experiment
4.1. Experimental Setup
All experiments in this study were conducted on a computer equipped with an AMD EPYC 7453 CPU, an NVIDIA GeForce RTX 4090 GPU, and a Linux operating system. Python (version 3.9) was used as the programming language, with PyTorch (version 1.11.0) as the deep learning framework and CUDA 12.2 for GPU acceleration. For hyperparameter settings, a batch size of 16 was selected, while training proceeded for 200 epochs, and the learning rate was dynamically adjusted using cosine annealing. The input resolution for the network was set to 512 × 512 pixels. Other settings remained at their default configurations. To evaluate model performance, the metrics mAP@0.5 and mAP@0.5:0.95 were employed to assess detection accuracy.
4.2. Dataset
This paper employs two satellite remote sensing power tower detection datasets to validate the effectiveness of the proposed method. The first is the Satellite Remote Sensing Power Tower Dataset (SRSPTD) curated by Professor Ke Zhang’s team at North China Electric Power University, while the second is the multi-scenario high-resolution satellite remote sensing transmission tower dataset (GFTD) developed by Dean Xiaojin Yan’s research group at North China Institute Of Aerospace Engineering.
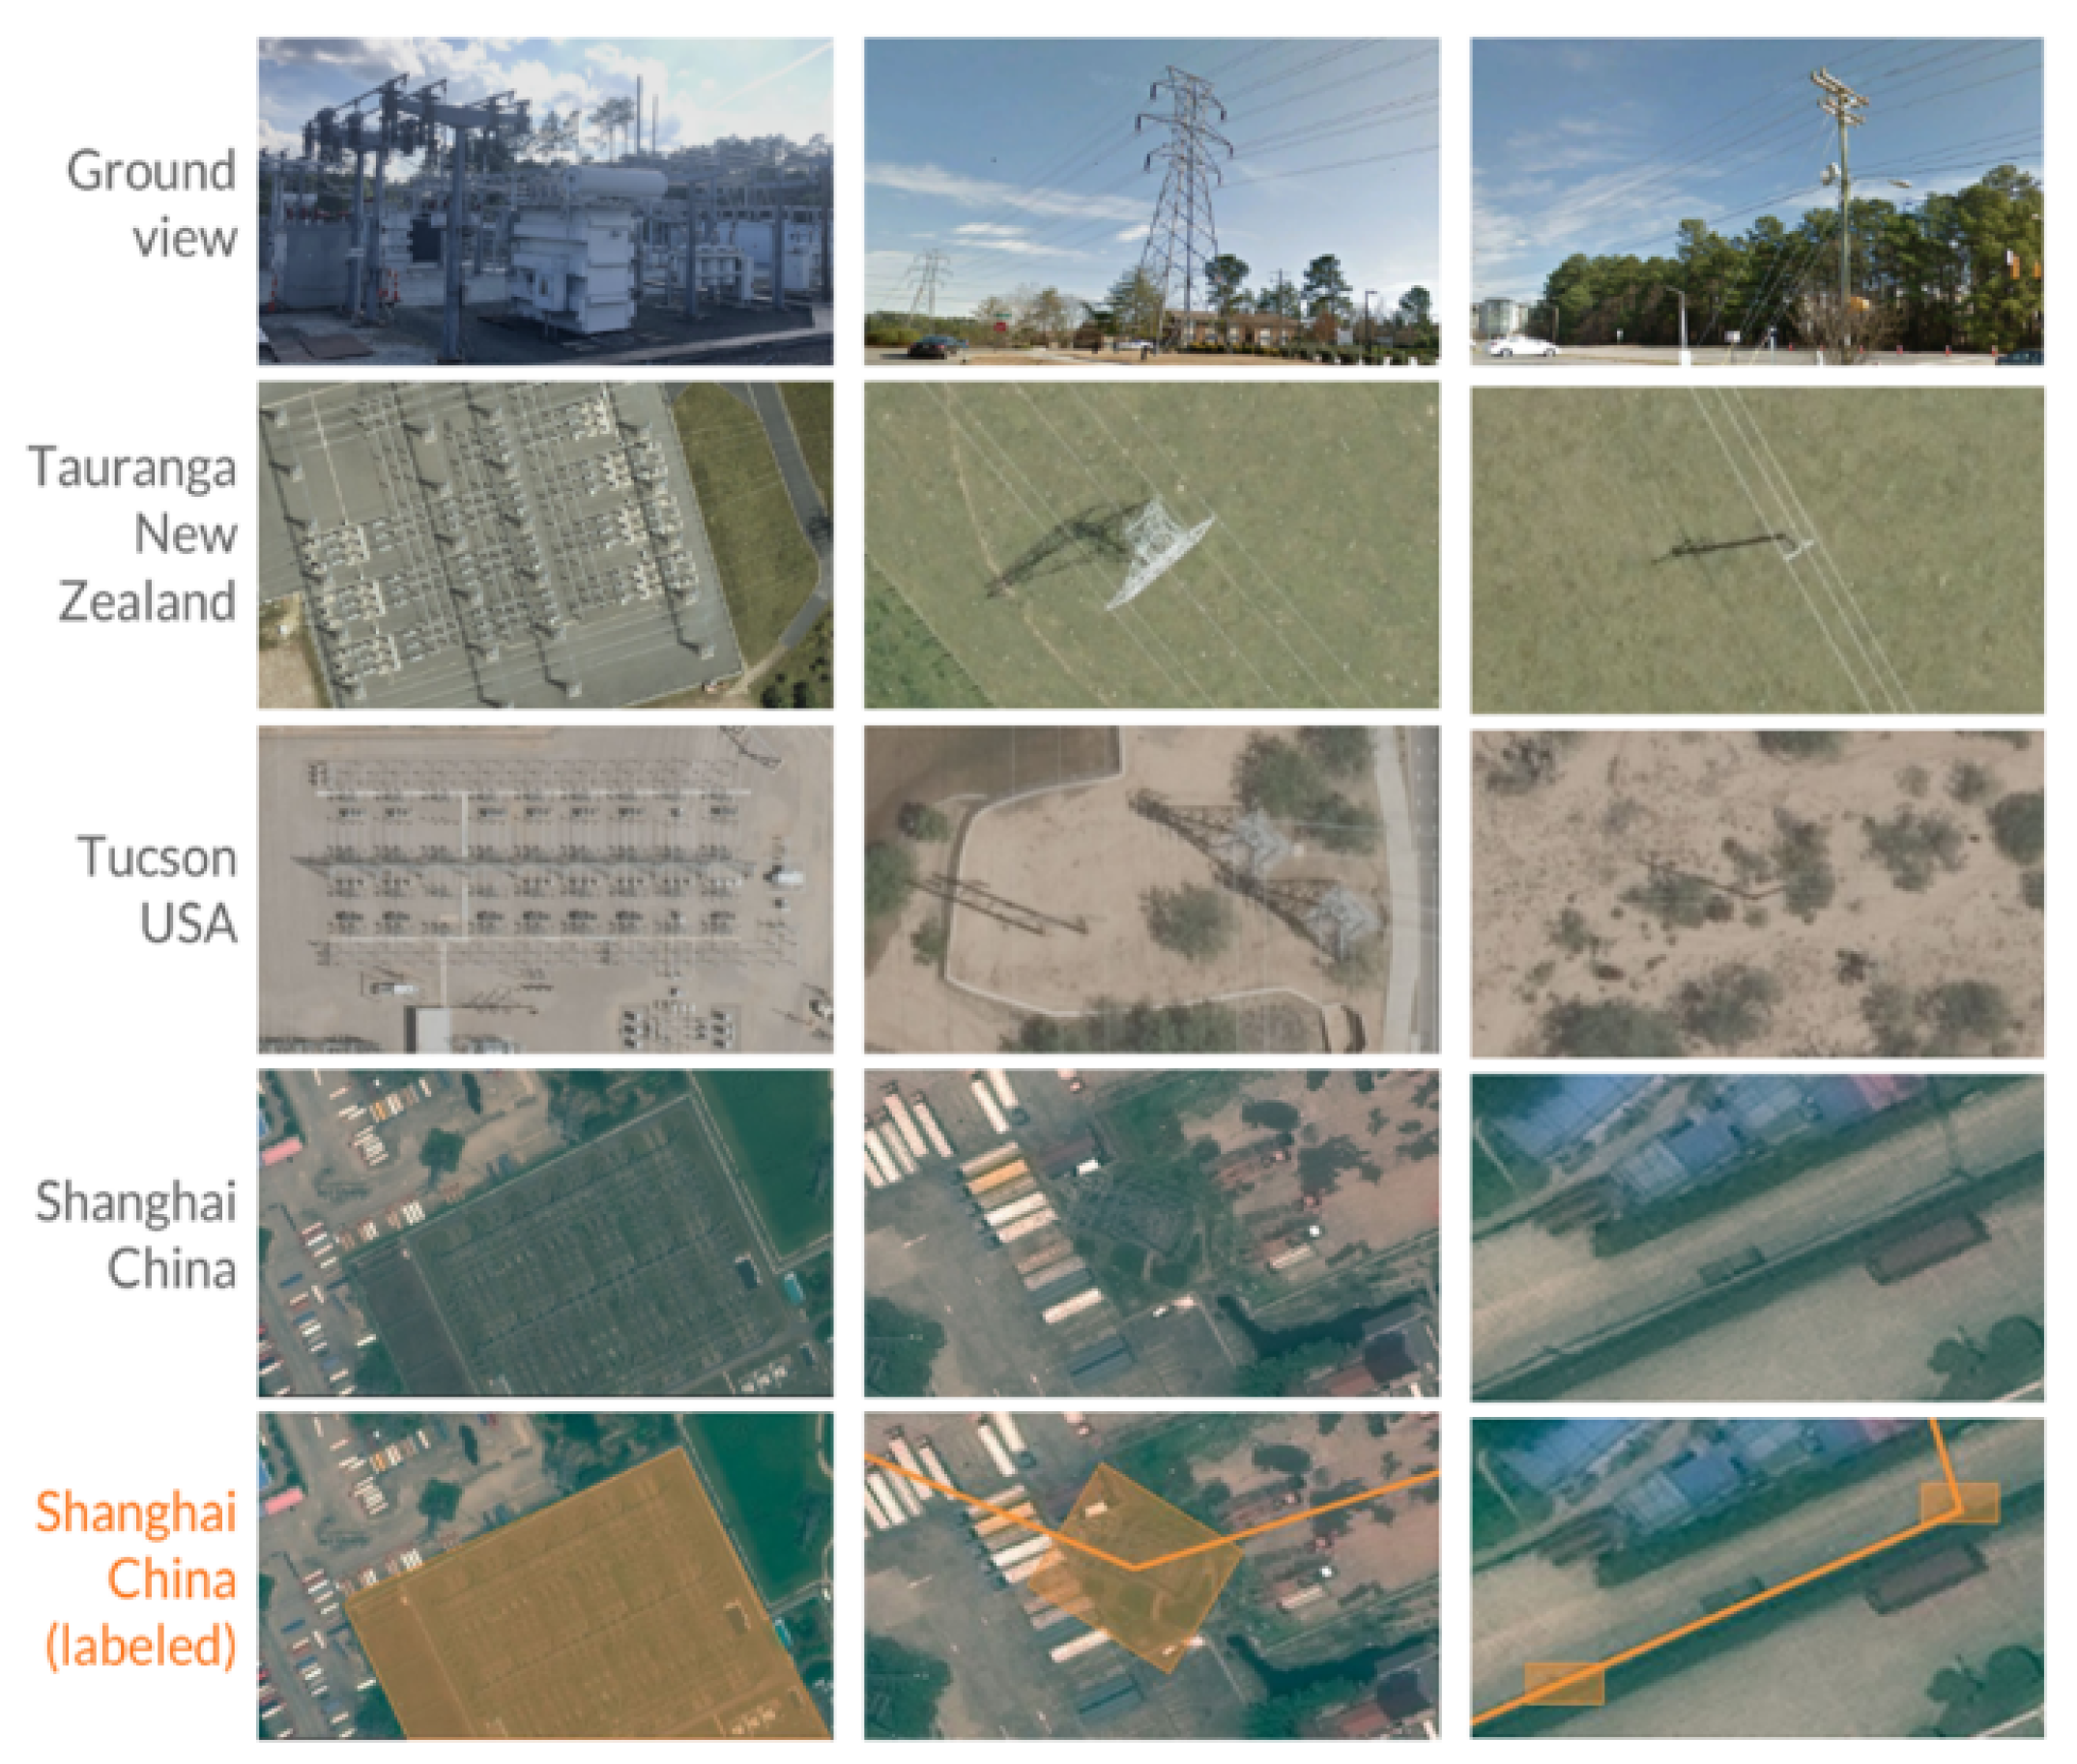
The SRSPTD dataset was constructed based on power transmission and distribution infrastructure images collected by Duke University’s Bass Connections Project in the United States. The data sources span six regions across two countries—Arizona (AZ), Connecticut (CT), Kansas (KS), and North Carolina (NC) in the United States, along with Taranga and Dunedin in Austria—encompassing four distinct geographical environments (desert, plains, forests, and coastal areas) and three human settlement density zones (suburban, rural, and urban). Satellite remote sensing images of power towers from these six regions were selected as data subsets. After re-cropping, annotation, and processing, the final dataset comprises 2740 annotated images of satellite remote sensing power towers, including 2760 distribution towers and 284 transmission towers. As illustrated in
Figure 10, the dataset includes examples of power transmission and distribution infrastructure across varying human activity density areas and diverse terrain conditions. The dataset is partitioned into an 80% training set, with 10% each allocated to the testing and validation sets.
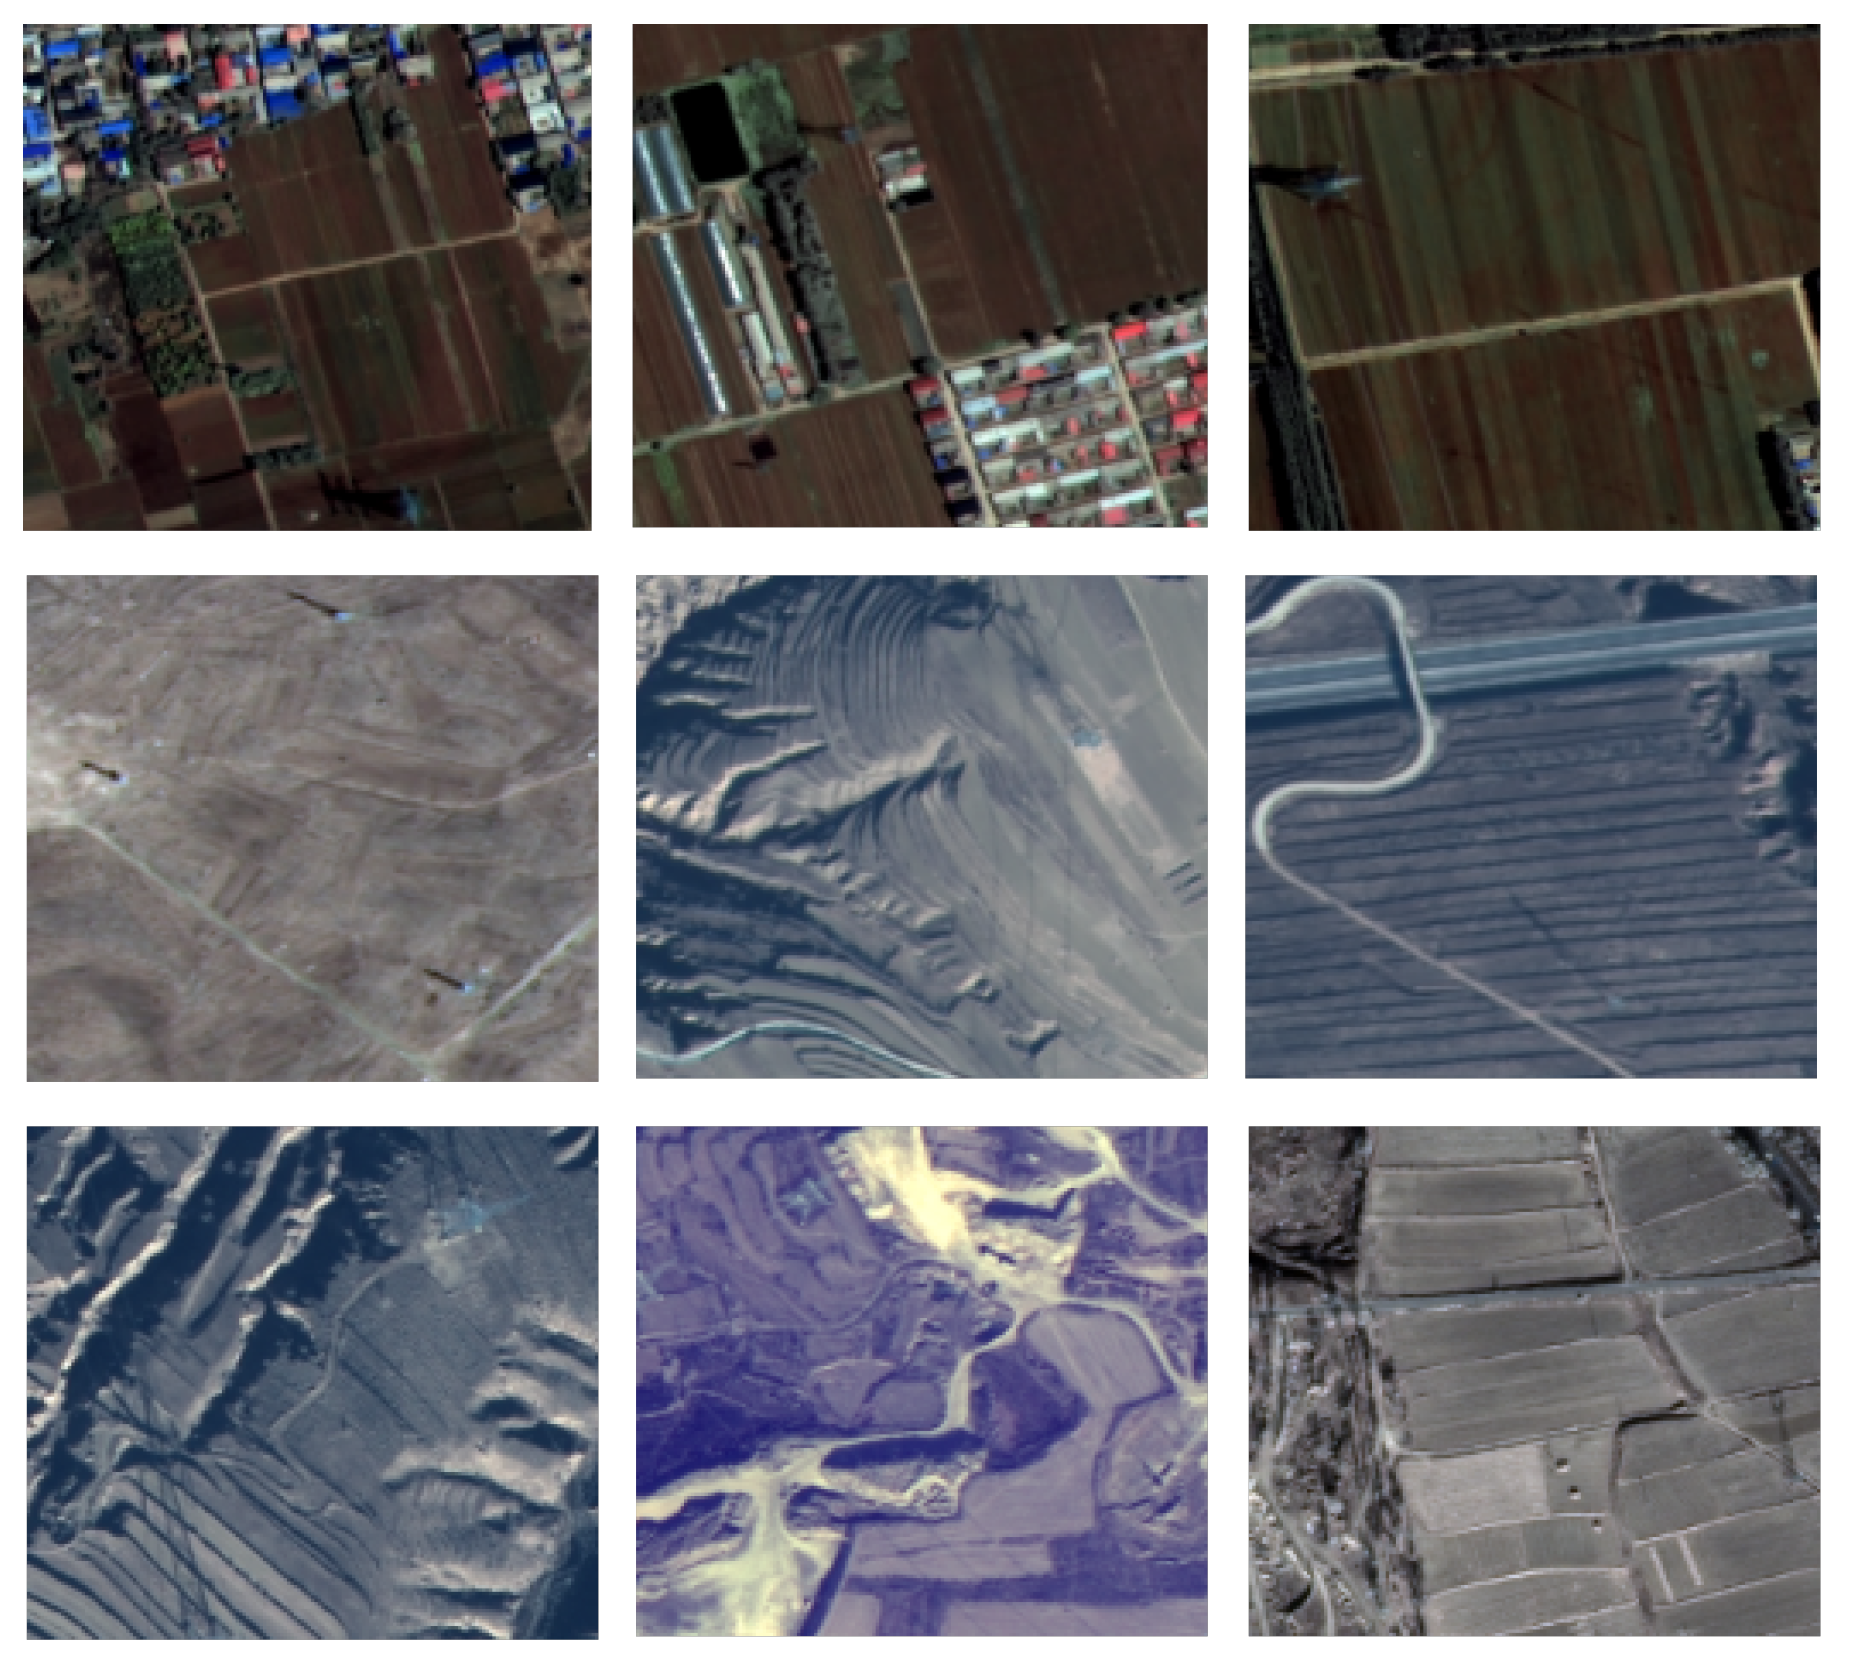
The GFTD is derived from satellite remote sensing imagery captured by the GaoFen-2 and GaoFen-7 satellites, as illustrated in
Figure 11. It primarily focuses on three high-voltage transmission lines: from Zhangjiakou (Hebei) to Beijing West, from Beijing West to Baoding (Hebei), and from Zhalute (Inner Mongolia) to Qingzhou (Shandong). The imagery spans all four seasons of 2023 and 2024, covering six distinct scenarios: built-up environments, coastal areas, deserts, plains, woodlands, and mountainous regions. The dataset was constructed by fusing 4 m resolution multispectral imagery with 1 m resolution panchromatic imagery to achieve 1 m resolution composite images, which were then cropped to 512 × 512 pixels. The Labelme annotation software was employed for labeling, with transmission towers and their geometrically distinctive shadows annotated as integrated entities to provide richer feature information for the model and lay the groundwork for subsequent tower-type classification. The dataset comprises 3000 images including 2870 towers, which were divided into the training, validation, and test sets at a 7:2:1 ratio. To enhance model robustness across diverse environmental conditions, data augmentation techniques including random cropping, translation, rotation, Mosaic, and Mixup were applied during preprocessing.
4.3. Controlled Experiment
In our work, we selected representative baselines based on the following considerations: (1) popularity and wide usage in the remote sensing or small object detection community; (2) performance on our standard benchmarks; and (3) architectural diversity, including both one-stage and two-stage detectors.
To validate the effectiveness of our algorithm, comparative experiments were conducted with mainstream object detection models including SSD, Faster R-CNN, RetinaNet, Deformable-DETR, and various YOLO-series algorithms on both the Satellite Remote Sensing Power Tower Dataset (SRSPTD) and the multi-scenario high-resolution satellite remote sensing transmission tower dataset (GFTD). Additionally, comparisons were incorporated with TPH-YOLO—a specialized model for small object detection—and LSKF-YOLO, the current state-of-the-art (SOTA) model in power tower detection for remote sensing imagery.
The comparative results on the SRSPTD are presented in
Table 1. As shown in the table, among various baseline algorithms, the YOLOv9 model achieves a mean Average Precision (mAP@0.5) of 75.5% while maintaining relatively few parameters, making it more suitable as the foundational model for this study. The improved YOLOv9-GDV model demonstrates significant enhancements over baseline algorithms, with mAP@0.5 improvements of 7.6%, 6.3%, 4.7%, 5.4%, 5.5%, 8.0%, 9.7%, and 12.9% compared to YOLOv11, YOLOv10, YOLOv9, Deformable-DETR, YOLOv8, RetinaNet, SSD512, and Faster R-CNN, respectively. Furthermore, it outperforms the domain-specific enhanced models LSKF-YOLO and TPH-YOLO—specialized for power line detection in remote sensing imagery—by 2.8% and 5.3%, respectively. In summary, the YOLOv9-GDV model achieves a state-of-the-art mAP@0.5 of 80.2%.
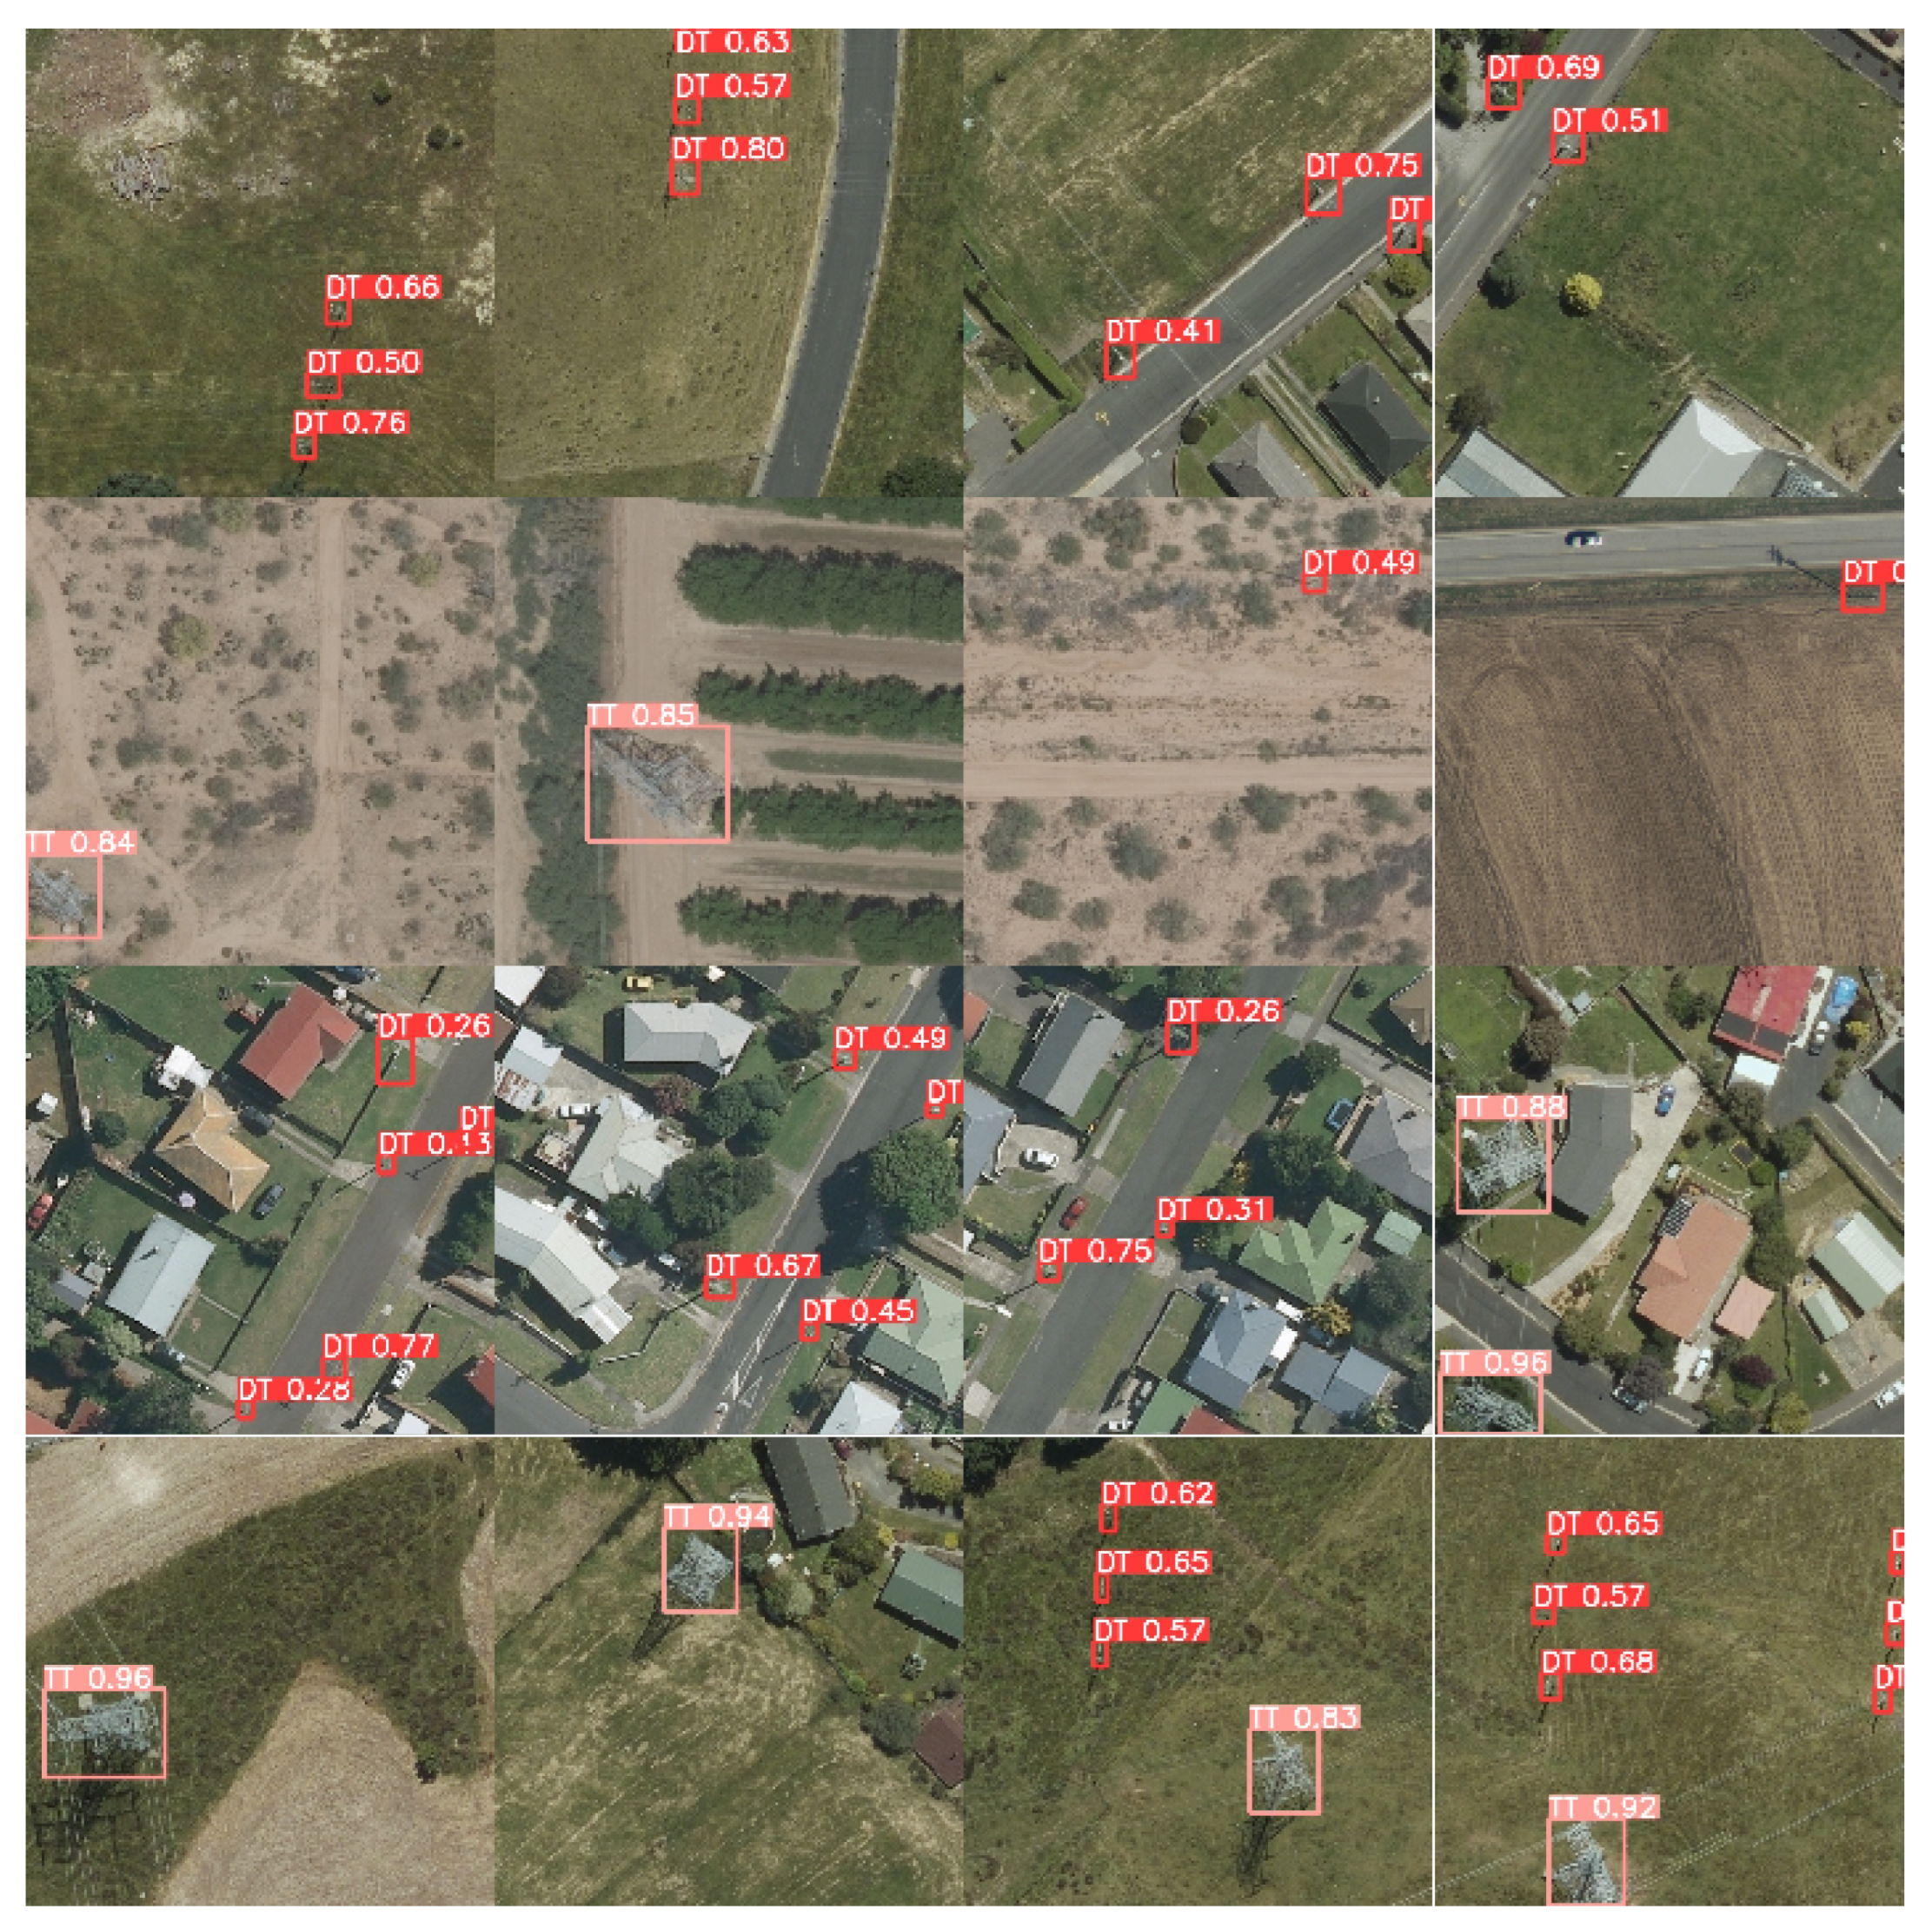
In practical testing scenarios, the proposed method demonstrates refined recognition capabilities for power towers in remote sensing images, achieving robust detection performance. Specific visual detection results are illustrated in
Figure 12. The figure reveals that even under challenging conditions—where background colors closely resemble target hues and numerous interfering elements are present—the system maintains reliable identification accuracy with minimal occurrences of false positives or missed detections. Furthermore, the prediction boxes exhibit precise alignment with the actual targets.
The comparative results on the GFTD are presented in
Table 2. As indicated in the table, the enhanced YOLOv9-GDV model demonstrates superior accuracy and detection performance among baseline algorithms. Compared to baseline models including YOLOv11, YOLOv10, YOLOv9, Deformable-DETR, YOLOv8, RetinaNet, SSD512, and Faster R-CNN, the mAP@0.5 improvements are 1.9%, 3.0%, 2.3%, 4.2%, 5.7%, 14.4%, 16.1%, and 21.4%, respectively. Additionally, it outperforms LSKF-YOLO—a specialized model for power line detection in remote sensing imagery—by 1.7%. While the dataset’s limited data diversity and the inclusion of target shadows during annotation contribute to generally elevated detection accuracy across all models, YOLOv9-GDV still achieves significantly higher precision compared to its counterparts. In summary, the YOLOv9-GDV model attains a state-of-the-art mean Average Precision (mAP@0.5) of 94.6%.
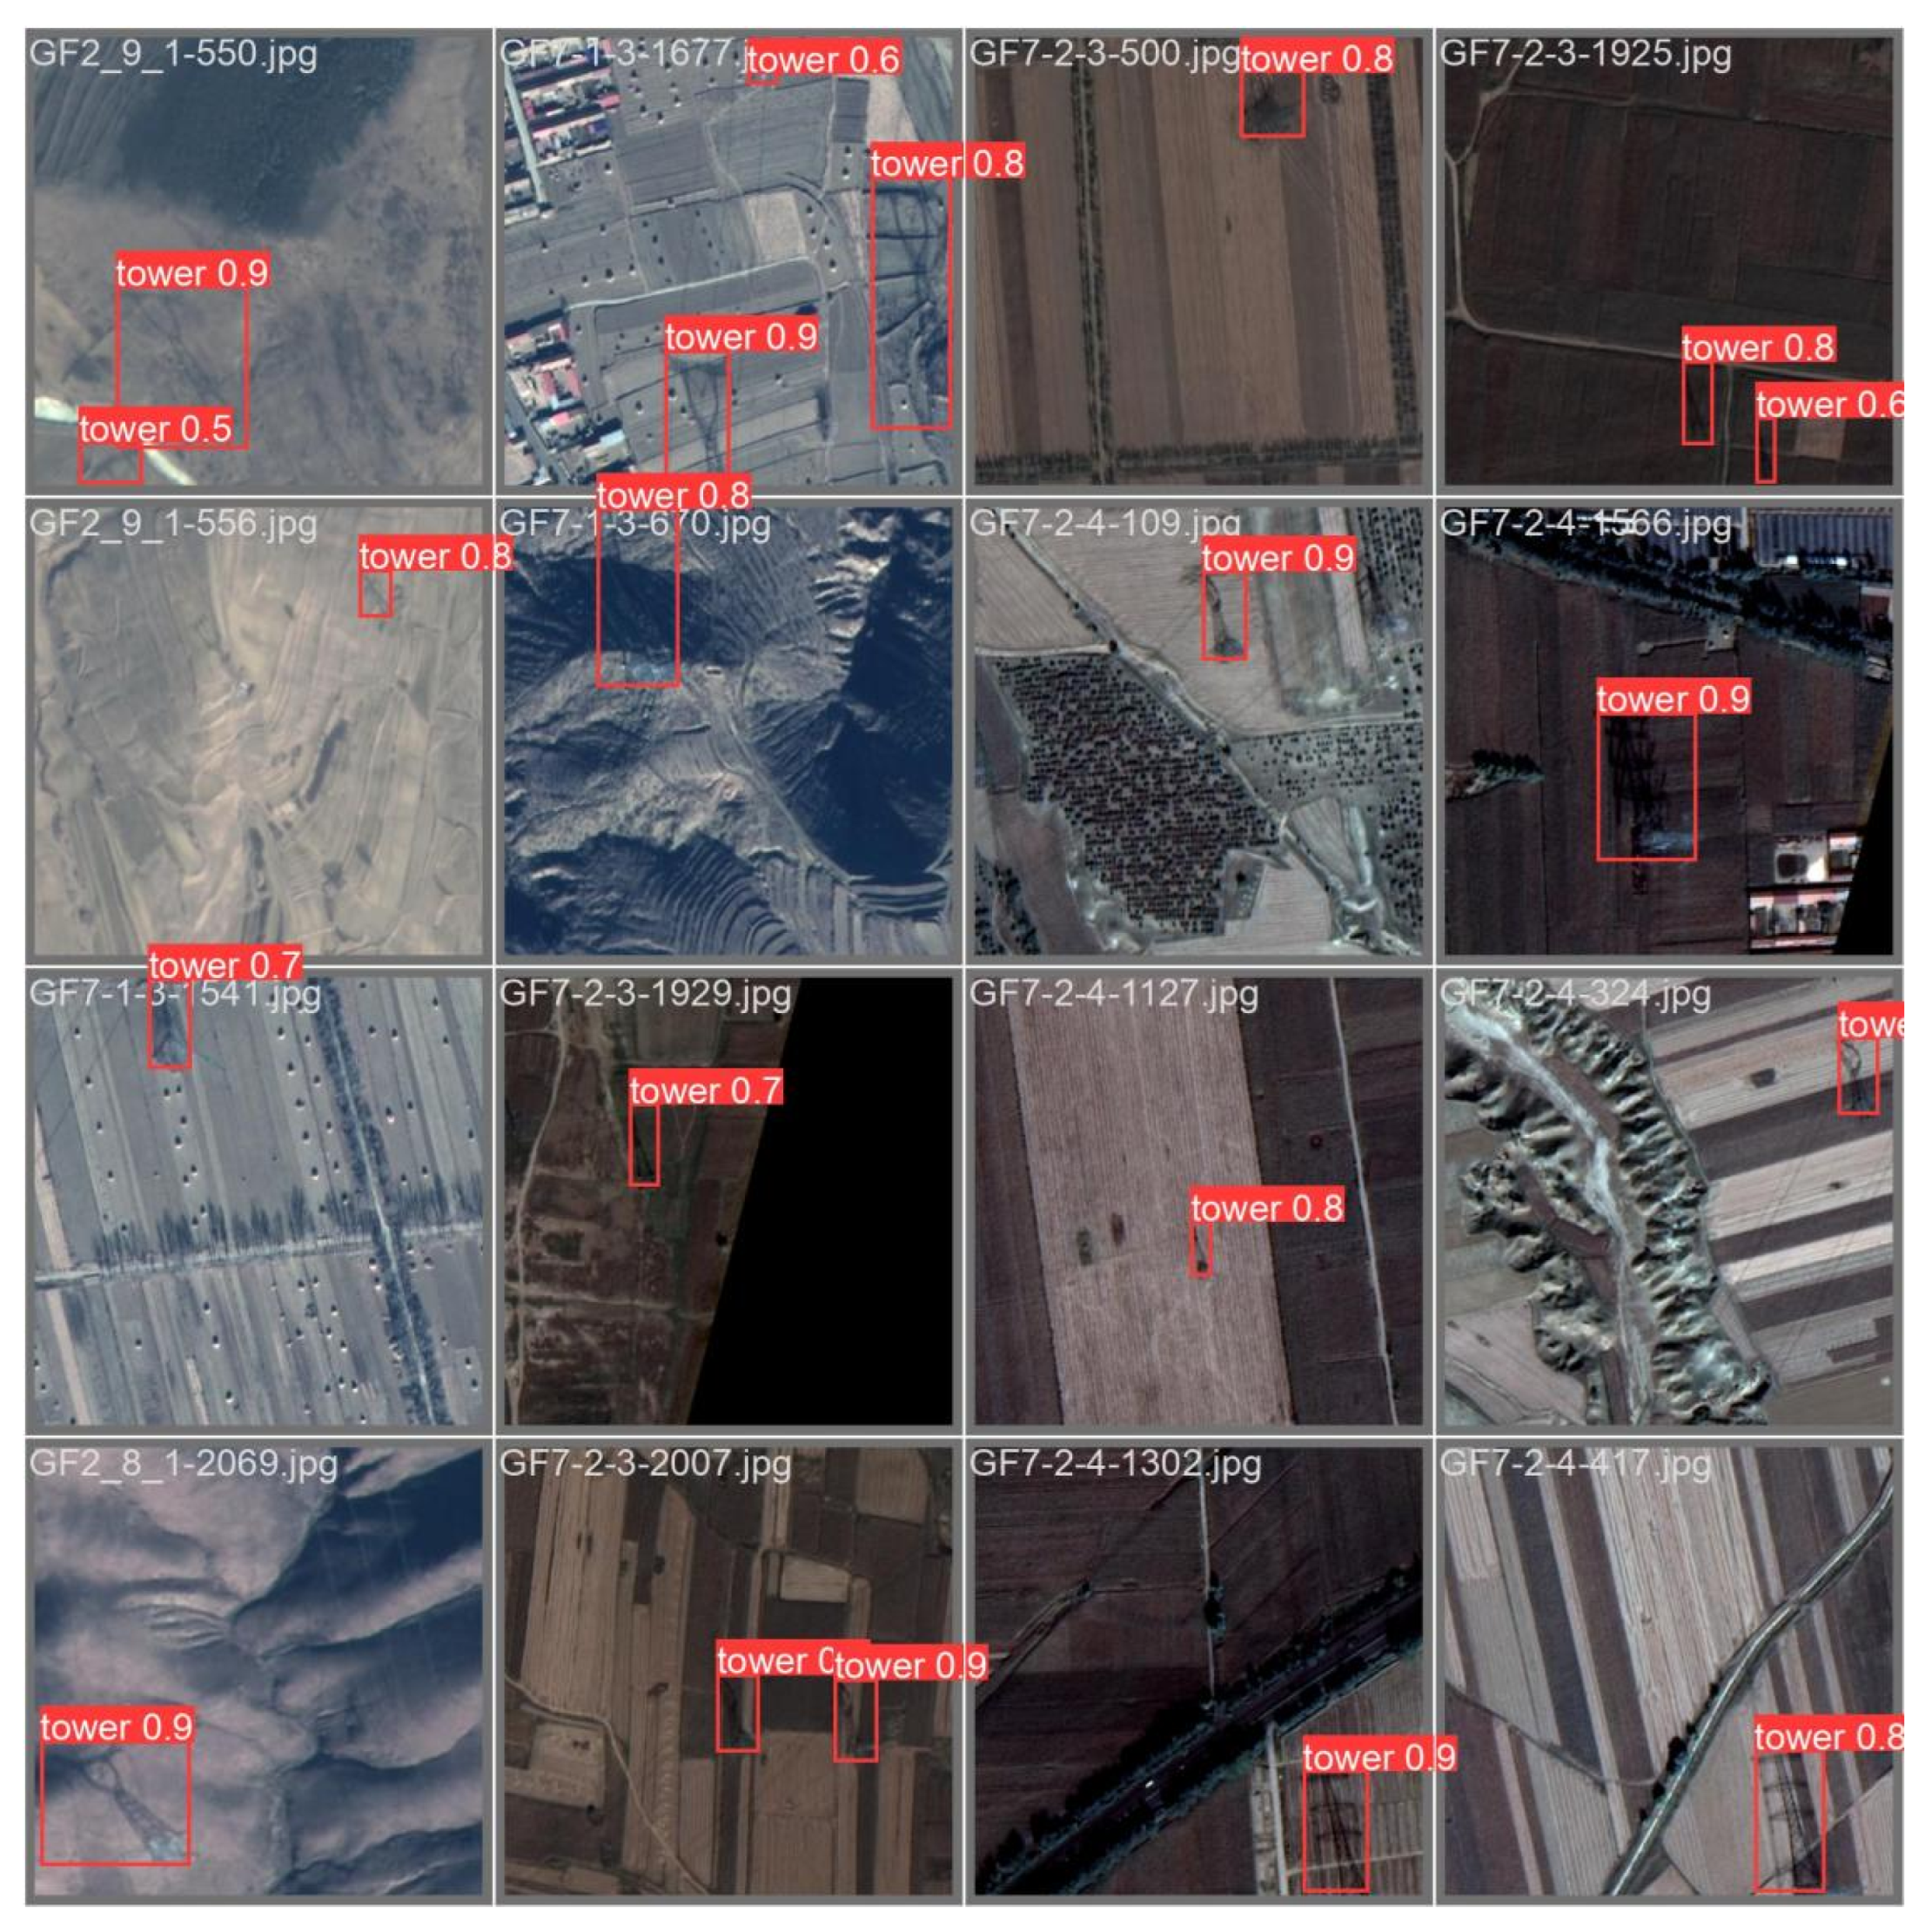
In practical testing, the proposed model achieves detailed recognition of power towers in remote sensing images with satisfactory detection performance. Specific visualized detection results are shown in
Figure 13. We selected detection outcomes under multiple complex backgrounds, including variations in terrain, dominant colors, and other conditions. As shown in the figure, our model delivers highly accurate identification of targets, with prediction bounding boxes tightly fitting the detected objects and their shadows, aligning well with the annotation boxes.
4.4. Ablation Study
To validate the effectiveness of individual modules, this study conducted ablation experiments for comparative analysis. These experiments were designed to investigate the impact of different improvement strategies on model detection performance, providing critical insights for model design and optimization. Throughout the experiments, identical parameter configurations were maintained. The ablation study results are summarized in
Table 3, where “Y” indicates the inclusion of a specific enhancement and “N” denotes its exclusion.
The GPA attention mechanism is applied in the network to introduce global representation capability, and the Diversity Branch Block (DBB) is embedded into the core module RepNCSPELAN. Additionally, VMPDIoU is utilized as the model’s loss function.
Experimental analysis of
Table 3 reveals the following insights: The incorporation of the Global Pyramid Attention (GPA) mechanism into YOLOv9 (Improved Model 1) elevates the mAP@0.5 by 1.2% compared to the baseline, demonstrating that GPA enhances global contextual representation by modeling object–background relationships and integrating multi-scale spatial information. Improved Model 2, which embeds the Diverse Branch Block (DBB) into the RepNCSPELAN core module, achieves a 2.6% mAP@0.5 improvement, attributed to the DBB’s ability to strengthen convolutional representational diversity and enrich feature hierarchies.The experimental results demonstrate that Improved Model 3, which employs the enhanced VMPDIoU (Minimum Point Distance IoU) as the loss function, achieves a 2.3% increase in mAP@0.5. This improvement validates that VMPDIoU more accurately quantifies discrepancies between predicted and ground-truth bounding boxes by directly minimizing keypoint distances, thereby refining localization precision. Furthermore, the integrated YOLOv9-GDV model proposed in this study exhibits the most significant performance gain, with a 4.7% enhancement in mAP@0.5 compared to the original YOLOv9 model, underscoring the synergistic efficacy of the proposed architectural optimizations.
Based on the comprehensive analysis above, it has been proven that the combination of the proposed improvements effectively enhances the model’s detection accuracy. Compared to the original YOLOv9 model, the refined YOLOv9-GDV model demonstrates a significant improvement in detection precision.
4.5. Robustness Experiment
Remote sensing data are often susceptible to factors such as illumination intensity and the degree of haze during the imaging process, which may result in indistinct features of target objects. This issue becomes more pronounced when the targets are small, making feature extraction even more difficult. To evaluate the robustness of YOLOv9-GDV under low-light and hazy conditions, we simulated the degradation of remote sensing images to generate a series of test datasets, each using the same original images but under different degradation settings.
The hazy image test sets were generated using the atmospheric scattering model by setting different atmospheric light parameters A. The mathematical formulation of the atmospheric scattering model is as follows:
where
is the observed hazy image,
is the scene without haze, and A is the atmospheric light parameter, representing the color of the haze or smoke. As A increases, the hazy effect becomes more pronounced, resulting in a more blurred and distorted visual appearance. The term
, known as the transmission, indicates the extent to which light travels through the atmosphere. As the distance increases, more light is scattered and absorbed. The transmission can be expressed as
Here, represents the depth information of the scene, and is the scattering coefficient, which controls the density of the haze.
The low-light image test sets were generated using OpenCV by adjusting different brightness values b based on the following formula:
where
is the transformed pixel value,
is the original pixel value,
a is the contrast gain factor, and
b is the brightness offset.
We selected YOLOv9-GDV and YOLOv9s for robustness testing. The experimental results indicate that both algorithms exhibit a certain degree of robustness to hazy and low-light images. As shown in
Table 4, YOLOv9-GDV model performs slightly better than YOLOv9s.
Although both algorithms demonstrate a certain degree of robustness to hazy and low-light images, accuracy degradation and an increase in false positives and false negatives inevitably occur during training. To mitigate these issues, we recommend applying image preprocessing to some extent before detecting small targets in remote sensing images to alleviate the effects of haze and low illumination.
5. Conclusions
With the advancement of satellite remote sensing technology, the application of high-resolution satellite remote sensing data in power line inspection has gradually become a critical research focus. This paper proposes a power pylon detection algorithm for high-resolution satellite remote sensing images, named YOLOv9-GDV. First, we improve the network architecture and attention mechanism of the baseline model YOLOv9 by integrating the global position-aware (GPA) attention mechanism. This enhancement introduces global representation capabilities to the model, enabling it to better understand the relationships between objects and backgrounds, integrate multi-scale and positional information, and thereby improve detection accuracy and robustness. Second, we embed the Diverse Branch Block (DBB) into the RepNCSPELAN4 module, constructing a novel feature extraction and fusion module called RepNCSPELAN4-DBB. This modification enhances the representational capacity of individual convolutions, enriches the feature space, and improves the model’s feature extraction performance without significantly increasing the computational overhead. Finally, we employ VMPDIoU as the improved loss function, which directly calculates the keypoint distances between predicted and ground-truth bounding boxes to more accurately reflect their discrepancies, further boosting the model’s mean Average Precision.
Experiments on the Satellite Remote Sensing Power Pylon Dataset (SRSPTD) and the general-scene high-resolution satellite remote sensing transmission tower dataset (GFTD) demonstrate the effectiveness of YOLOv9-GDV. The model achieves significant improvements in mean Average Precision (mAP), validating the feasibility of the proposed enhancements.
However, the algorithm has limitations in dataset diversity, such as the lack of remote sensing images under extreme weather conditions (e.g., fog, rain, or cloud occlusion), leading to suboptimal detection performance in such scenarios. Future work should focus on expanding the dataset to enhance the model’s generalization ability. Through this research, we believe that applications of remote sensing image data will continue to advance, and deep learning-based power pylon detection technologies will play an increasingly vital role in the intelligent operation and maintenance of power transmission lines, providing robust support for ensuring the safety and stability of power grids.


 ,
, 
