Article

Rising Net Shortwave Radiation and Land Surface Temperature Drive Snow Cover Phenology Shifts Across the Mongolian Plateau During the 2000–2022 Hydrological Years

by
Xiaona Chen
1,2,* and
Shiqiu Lin
1,3
1
State Key Laboratory of Resources and Environmental Information System, Institute of Geographic Sciences and Natural Resources Research, Chinese Academy of Sciences, Beijing 100101, China
2
National Earth System Science Data Center, Beijing 100101, China
3
College of Resources and Environment, University of Chinese Academy of Sciences, Beijing 101408, China
*
Author to whom correspondence should be addressed.
Remote Sens. 2025, 17(13), 2221; https://doi.org/10.3390/rs17132221 (registering DOI)
Submission received: 28 April 2025 / Revised: 17 June 2025 / Accepted: 26 June 2025 / Published: 28 June 2025
(This article belongs to the Section Remote Sensing in Geology, Geomorphology and Hydrology)

Abstract

Snow cover phenology (SCP) serves as a critical regulator of hydrological cycles and ecosystem stability across the Mongolian Plateau (MP). Despite its importance, the spatiotemporal patterns of SCP and their climatic drivers remain poorly quantified, constrained by persistent gaps in satellite snow cover observations. Leveraging a high-resolution (500 m) daily gap-filled Moderate Resolution Imaging Spectroradiometer (MODIS) snow cover dataset combined with reanalysis climate datasets, we systematically quantified SCP dynamics and identified the dominant controls during the 2000–2022 hydrological years using trend analysis and ridge regression. Our results reveal a significant divergence in SCP parameters: snow end dates (De) advanced markedly across the entire plateau (0.29 days yr−1, p < 0.01), accounting for 90.39% of SCP anomalies. In contrast, snow onset date (Do) exhibited unnoticeable changes, explaining 9.58% of SCP changes. Attribution analysis demonstrates that 47.72% of De variability stems from increased net shortwave radiation (+0.38 Wm−2 yr−1) and rising temperatures (+0.06 °C yr−1) during the melting season, with net shortwave radiation exerting stronger control (R2 = 0.73) than temperature (R2 = 0.63). This study establishes the first continuous, high-resolution SCP climatology for the MP, providing mechanistic insights into cryosphere–atmosphere interactions that inform adaptive water resource strategies for climate-vulnerable arid ecosystems in this region.

1. Introduction

As a critical freshwater reservoir, snow cover profoundly influences hydrological cycles, ecosystem stability, and socio-economic systems across the Mongolian Plateau (MP). Firstly, snowmelt serves as a primary recharge source for surface water and groundwater systems, sustaining the MP’s hydrological balance [1,2]. This meltwater also regulates soil moisture availability, directly controlling vegetation phenology and productivity [3,4]. The MP spans approximately 515 million acres of rangeland, accounting for 12% of the total rangeland area in Asia. Herding serves as the primary income source in this region, relying on grassland natural resources [5], which are significantly influenced by snow cover dynamics [6]. Moreover, snowpack duration modulates microbial activity and nutrient cycling, indirectly shaping ecosystem resilience. Secondly, the high albedo of snow cover significantly alters surface energy budgets by reflecting solar radiation, which suppresses land surface temperatures and mitigates soil evaporation [7,8]. This negative feedback mechanism helps stabilize regional climate patterns, particularly during early spring transitions. Thirdly, while beneficial, snow variability also poses hazards. Rapid spring snowmelt frequently triggers floods that disrupt agriculture, pastoralism, and infrastructure [9]. Concurrently, extreme snowfall events exacerbate livestock mortality and humanitarian crises [10]. According to Tachiiri et al. [11], the livestock mortality was closely related with high December snow water equivalent in the preceding year. Given its dual role as a resource and a risk factor, systematic monitoring of spatiotemporal snow dynamics is imperative for advancing climate adaptation strategies, optimizing water resource management, and safeguarding ecological integrity on the MP.
The intensifying scientific interest in snow cover variability and attribution stems from its critical role in climate change assessments, particularly in water-stressed arid and semi-arid regions. Snow cover phenology (SCP), comprising snow onset date (Do), snow end date (De), and snow duration days (Dd), has emerged as a sensitive proxy for tracking seasonal snow dynamics and long-term climatic shifts in the past few decades [1,12]. Utilizing satellite-derived snow cover datasets, published research has documented pronounced SCP changes globally and regionally, including a marked shortened Dd [13,14,15], an earlier snowmelt onset date [16], an advanced De [14,15], and noteworthy shifts in Do [13,15]. However, most hemispheric-scale SCP studies rely on satellite data with coarse spatial resolutions (5–25 km) and low temporal resolution, introducing significant uncertainty in SCP parameter identification. For instance, key input datasets include a weekly product at 24 km resolution [13] and an 8-day composite at 5 km resolution [14]. This inherent data limitation makes regional-scale SCP information both scarce and highly uncertain. In addition, due to the shortage of high-quality fine-resolution snow cover datasets, critical knowledge gaps persist regarding the MP-specific SCP patterns and their mechanistic responses to rapid climate warming. In addition, while multi-scale analyses identify temperature, precipitation anomalies, and radiative forcing as primary SCP drivers [13,17,18,19,20,21], the relative contributions of these factors remain unresolved for the MP. The conflicting driver effects observed across hemispheric versus local studies require more in-depth exploration of SCP in this climate-sensitive region.
Recent studies have documented substantial climatic transformations across the MP, characterized by pronounced temperature fluctuations and precipitation regime shifts during recent decades [22,23,24]. These environmental changes pose significant impacts on the spatiotemporal dynamics of SCP in the region. Considering the significance of SCP and the pressing need for comprehensive understanding of snow cover responses to climate change, it is crucial to quantify and understand the spatial and temporal anomalies of SCP and identify the driving forces behind them.
Therefore, the aim of this study is to explore the distribution patterns of SCP and determine its influencing factors in the MP, against the backdrop of rapid climate change. To accomplish this goal, we first extracted the key SCP parameters from the latest version of the daily cloud-gap-filled Moderate Resolution Imaging Spectroradiometer (MODIS) snow cover dataset, covering the 2000–2022 hydrological years (from September 2000 to August 2023). Subsequent spatiotemporal analysis employed time-series decomposition and trend detection algorithms to characterize SCP patterns across elevational and ecological gradients. Finally, we implemented a ridge regression framework incorporating four primary climatic covariates including temperature, precipitation, snow depth, and net shortwave radiation. This multivariate approach effectively addresses multicollinearity while quantifying relative driver contributions to observed SCP variations.

2. Materials and Methods

2.1. Study Area

The MP represents one of Earth’s largest contiguous dryland systems, strategically positioned at the intersection of three major atmospheric circulations: the winter Siberian–Mongolian High, East Asian Summer Monsoon, and mid-latitude westerlies, which exhibits exceptional climate sensitivity and ranks among Asia’s most vulnerable terrestrial ecosystems. The location of the MP is displayed in Figure 1, which encompasses the entirety of Mongolia, the Inner Mongolia Autonomous Region of China, and south of Russia. The altitude of the MP varies dramatically from 31 to 4176 m, featuring mountainous terrain in the northwest, expansive steppes and rolling hills in the east and center, and Gobi deserts in the south. To focus on the SCP changes in this region, this study confined the study area to stable seasonal snow-covered regions; temporary snow cover in low latitudes and permanent snow cover in high altitudes are excluded in this study.

2.2. Dataset

2.2.1. MODIS Snow Cover Dataset

Satellite remote sensing has revolutionized snow cover monitoring since the 1970s, with MODIS emerging as the preeminent sensor for SCP analysis due to its unique combination of daily temporal resolution (500 m nominal spatial resolution) and continuous operation since 2000 [14,25]. This study employs the latest MODIS daily cloud-gap-filled (CGF) snow cover product (MOD10A1F), which addresses the critical limitations of earlier versions through advanced spectral unmixing and a temporal interpolation algorithm [26].
The MODIS snow detection algorithm capitalizes on the distinct spectral signature of snow cover: high visible reflectance coupled with strong near-infrared absorption. These properties enable calculation of the Normalized Difference Snow Index (NDSI), with NDSI ≥ 0.4 traditionally indicating snow presence [27]. MOD10A1F introduces three critical advancements: (1) pixels with NDSI < 0.1 are excluded to mitigate false positives from low-reflectance surfaces; (2) continuous NDSI values (0–100 scale) replace binary classification, enabling probabilistic snow cover estimation; (3) a backward-looking 7-day window replaces cloud-obscured pixels with the most recent valid observation [28]. Compared to legacy versions, the updated MOD10A1F product introduces a gap-filled daily NDSI snow cover layer (CGF_NDSI_Snow_Cover). This layer mitigates cloud obstruction by replacing cloudy pixels with temporally proximate cloud-free observations. Where temporal interpolation is unavailable, spatial filtering of adjacent pixels provides snow cover estimates for these regions [28]. This multi-layered approach reduces cloud-induced data gaps from >30% in standard MODIS products to <10% in MOD10A1F while maintaining 89–92% validation accuracy against ground stations [15,29]. In this study, we adopted the conservative 0.1 NDSI threshold to minimize seasonal snow misclassification in arid environments [30].

2.2.2. Temperature, Precipitation, and Snow Depth Datasets

SCP dynamics are governed by complex cryosphere–atmosphere interactions, with cold-season thermal regimes (temperature), hydrometeorological inputs (precipitation amount), and snowpack evolution (snow depth anomalies) identified as dominant controls [14,17,19]. To quantify these relationships, we utilized 2 m air temperature (monthly mean, °C), total precipitation (monthly cumulative, mm), and snow depth (daily mean, snow water equivalent, mm) from the European Center for Medium-Range Weather Forecasts (ECMWF) Reanalysis v5-Land (ERA5-Land), https://www.ecmwf.int/en/forecasts/dataset/ecmwf-reanalysis-v5-land (accessed on 25 June 2025).
ERA5-Land constitutes a state-of-the-art land surface reanalysis integrating advanced data assimilation with the Hydrology Tiled ECMWF Scheme for Surface Exchanges over Land (HTESSEL) model [31]. ERA5-Land is widely considered suitable for ground-level applications, which provides a superior accuracy in simulating surface air temperature and precipitation across the MP, in comparison to other reanalysis products [32,33]. Furthermore, the snow depth retrievals from ERA-Interim align more closely with in situ observations compared to passive microwave (AMSR-E/AMSR2) and other reanalysis datasets through a hybrid assimilation framework [34]. Compared to its predecessor ERA-Interim, ERA5-Land’s enhanced capabilities stem from spatiotemporal resolution (from 0.75° to 0.10°), observation integration, and snow density parameterization. This combination of high-resolution forcing and validated land surface representation makes it particularly suited for diagnosing SCP–climate linkages in heterogeneous dryland environments.

2.2.3. Solar Radiation Dataset

Emerging evidence highlights surface radiative flux as a critical yet underexplored driver of snow cover anomalies, operating through snow–albedo feedback loops that amplify cryosphere changes [1,21]. This self-reinforcing mechanism initiates when increased surface net shortwave radiation (SNSW) accelerates snowmelt, subsequently reducing surface albedo by 40–60% as snow-covered terrain transitions to bare ground or vegetation [35]. The absorbed radiative surplus drives localized warming of 1.5–3.0 °C per snow cover loss decade at high latitudes, accounting for 46.2 ± 5.8% of Northern Hemisphere (NH) cryosphere retreat in the sixth phase of the Coupled Model Intercomparison Project (CMIP6) projections [36]. To investigate the potential connection between surface radiation and SCP, we incorporated monthly surface net shortwave flux from the Clouds and the Earth’s Radiant Energy System (CERES) Energy Balanced and Filled (EBAF) dataset [37] in the attribution analysis, where net shortwave flux is defined as the difference between downward and upward shortwave fluxes. The CERES-EBAF product demonstrates superior accuracy over comparable gridded radiation budget datasets [38], establishing it as the predominant reference standard in radiative flux validation. This status derives from its rigorous energy balance closure framework, decadal-scale stability, and regionally verified performance metrics [39].

2.2.4. Data Preparation
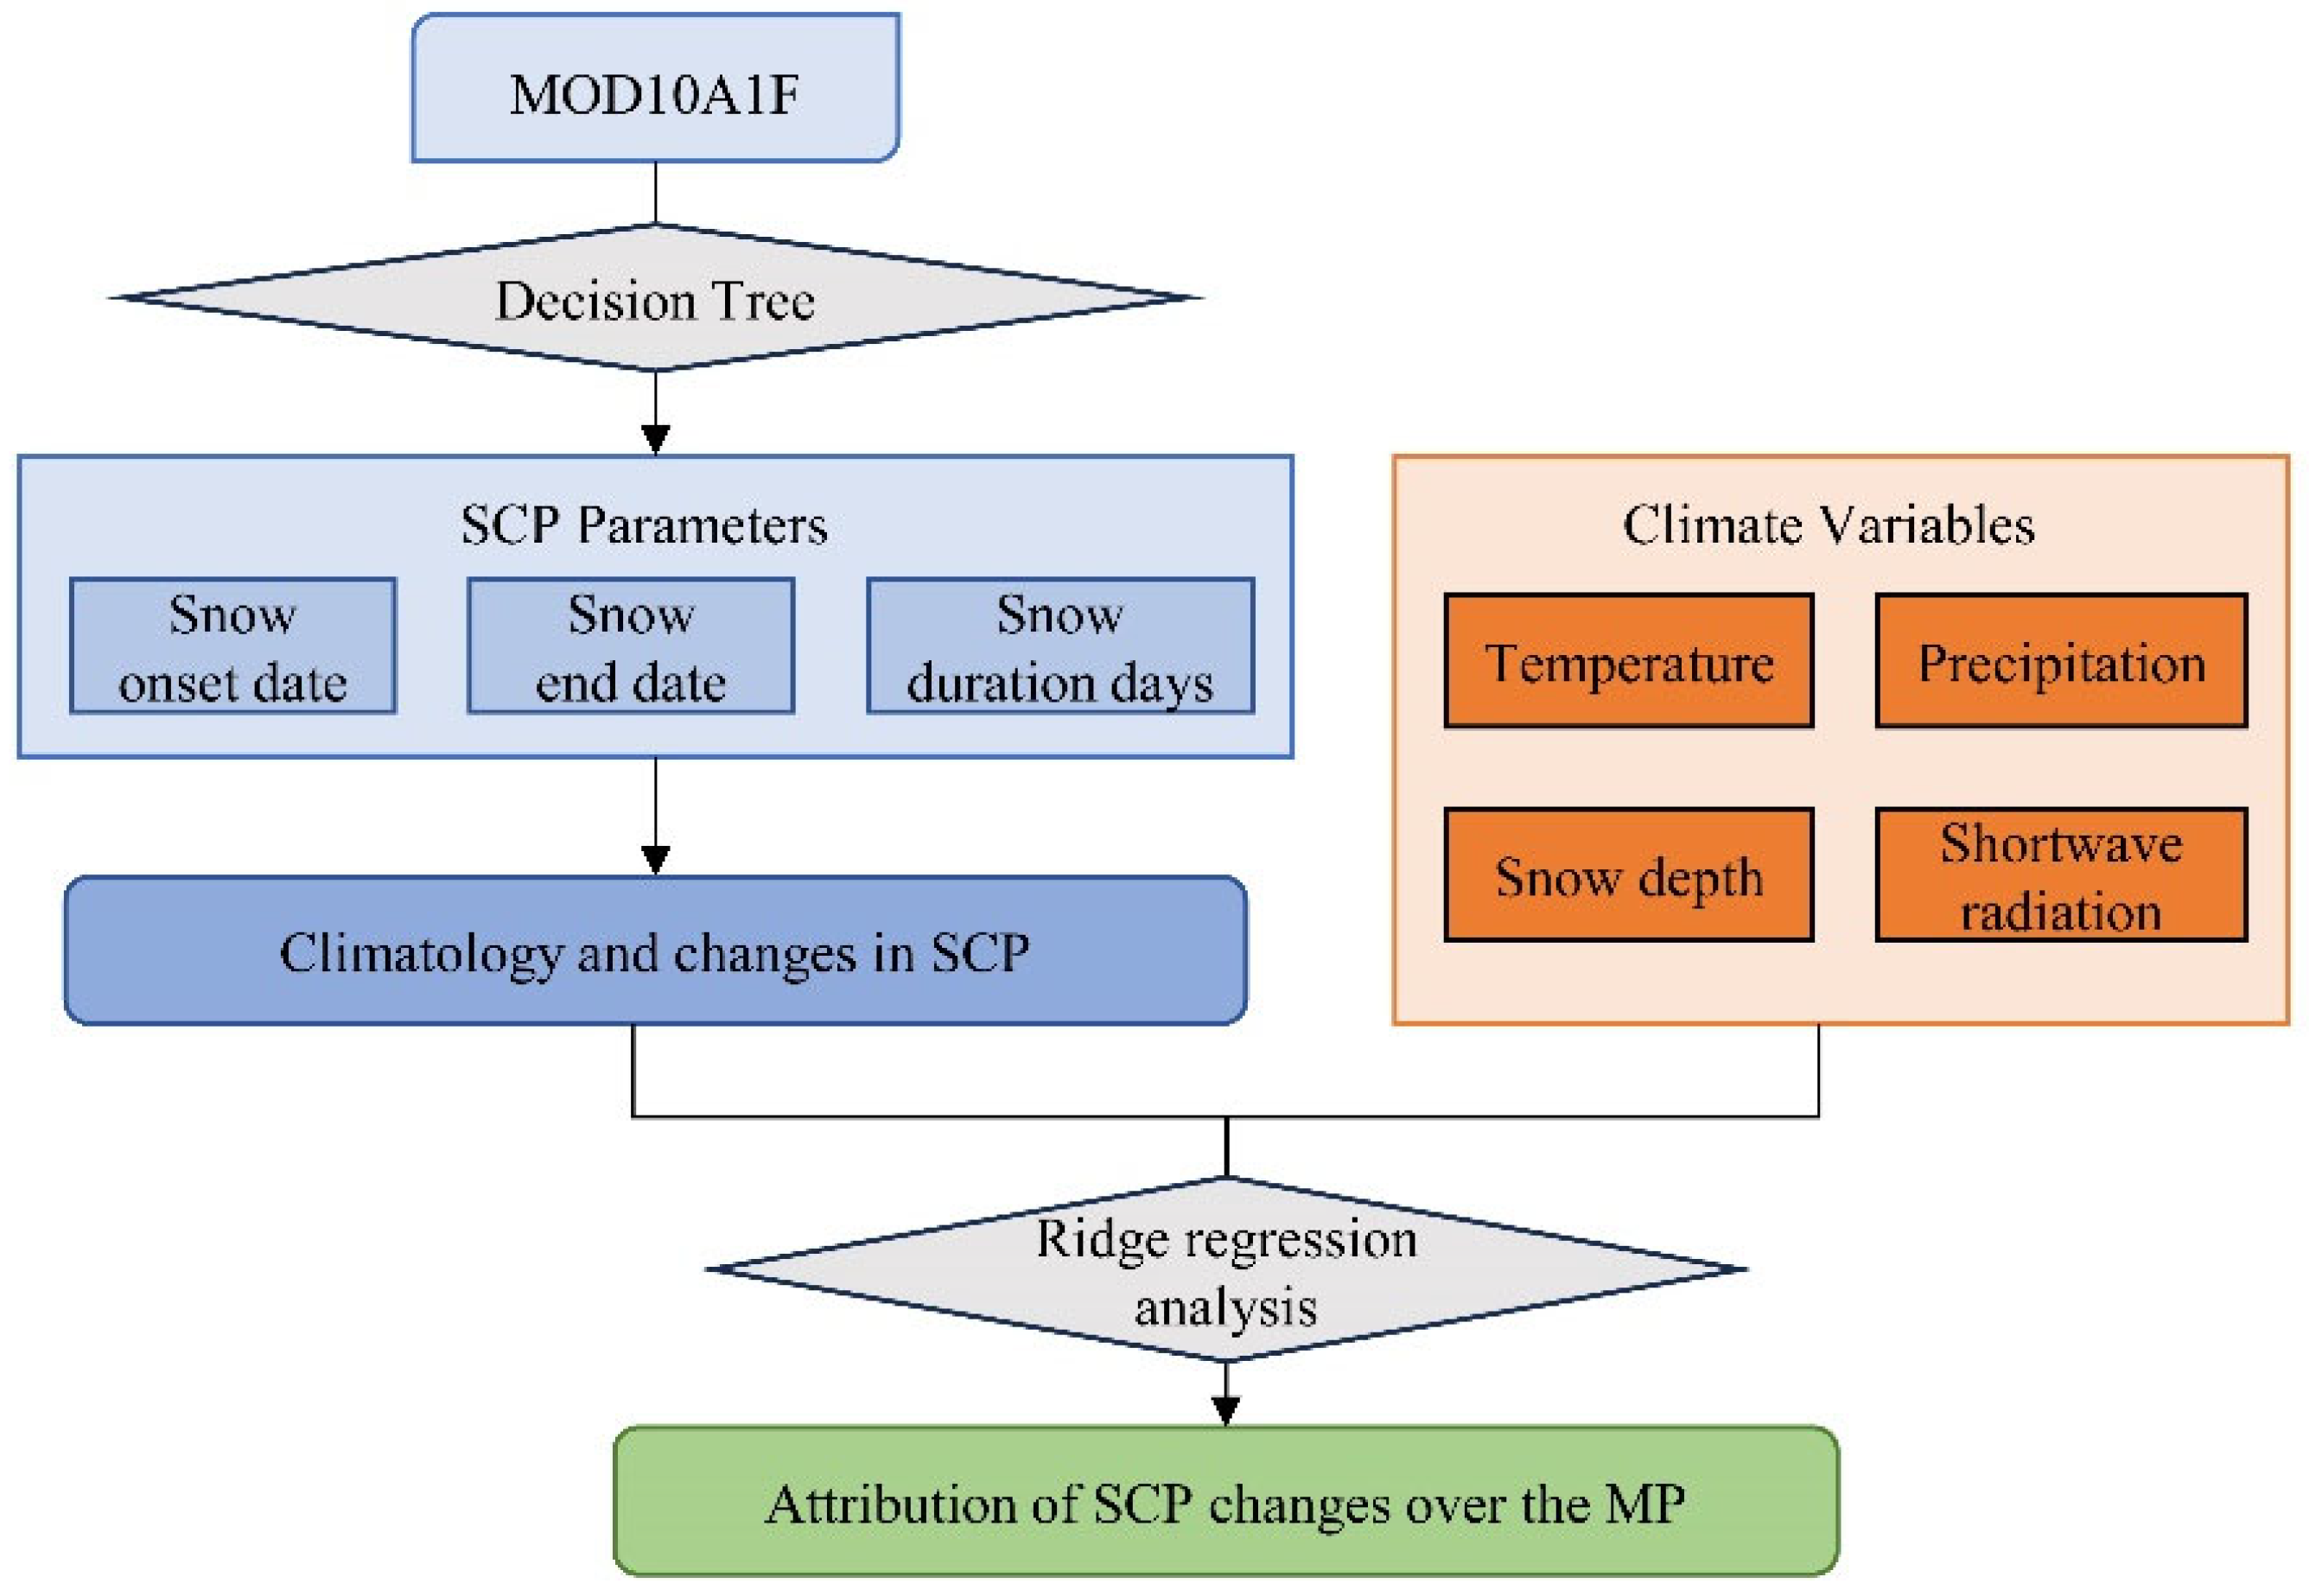
To maintain dimensional consistency across diverse datasets used in the attribution analysis, all input variables were standardized to a uniform 0.10° geographic grid utilizing the gdalwarp utility. The choice of resampling method was determined by the resolution of the data to prioritize geophysical integrity: For high-resolution SCP parameters derived from MOD10A1F, the “average” method was employed during resampling. This method computes the mean of all contributing non-NODATA pixels. For variables from ERA5-Land, the “nearest-neighbor” method was selected, as it retains the inherent land–atmosphere coupling present in HTESSEL model outputs. For surface net shortwave radiation data from the CERES, the “Cubic spline interpolation” method was chosen, which refines coarse-resolution radiative fluxes while ensuring energy balance conservation.
In accordance with the cryospheric hydrological cycles in northern Eurasia [40], this study adopted a hydrological year framework in the SCP derivation. The hydrological year (t) is delineated from September of the previous year (t1) to August of the current year (t). Within this framework, the accumulation season is identified as September to December of the previous year (t − 1), while the melting season is pinpointed as March to June of the preceding year (t1). To attribute changes in Do and De, we derived seasonal composites by averaging 2 m air temperature, total precipitation, snow depth, and net shortwave radiation separately for accumulation (September–December) and melting seasons (March–June). This temporal partitioning enhances attribution robustness by isolating climate variable influences during critical phenological phases.

2.3. Methods

The flowchart of this study is illustrated in Figure 2. Firstly, the snow cover was identified using NDSI thresholds of 0.1. The value of 0.1 represents the minimum NDSI value of MOD10A1F V6. Secondly, the SCP retrieval process over the MP was carried out. Thirdly, changes in SCP were attributed to various climate variables, such as land surface temperature, precipitation, snow depth, and net shortwave radiation.

2.3.1. SCP Parameter Detection

The SCP parameters were extracted utilizing the MOD10A1F via a decision trees methodology. For a given grid cell, Do was designated as the date of the initial five consecutive images exhibiting an NDSI ≥ 0.1, while De was allocated as the date of the terminal five consecutive images with an NDSI < 0.1. Furthermore, Dd represents the days elapsed between Do and De. This methodology mitigates the impact of transient snow cover on the SCP retrieval, ensuring that persistent snow is consistently captured for analysis. To scrutinize the climatology and dynamic evolution of long-term SCP across the MP, this study concentrated on areas characterized by stable snow cover, defined as regions where Dd ≥ 30 days.

2.3.2. Attribution Analysis Method

Given the direct thermodynamic coupling between Dd and its phenological endpoints Do and De, this study primarily focuses on identifying dominant controls over Do and De. The influences of four climatic drivers (2 m air temperature, total precipitation, snow depth, and net shortwave radiation) on SCP were meticulously examined using ridge regression analysis. Ridge regression analysis effectively mitigates collinearity among covarying climatic drivers of SCP via L2-norm regularization. By penalizing coefficient magnitudes, this approach reduces inflation and instability caused by multicollinearity—a methodology successfully applied in SCP attribution studies, as demonstrated by Chen et al. [18] and Peng et al. [19].
Firstly, the drivers were normalized to facilitate cross-comparison of variables with disparate units and magnitudes. Normalizing predictors enables the evaluation of their influence without being skewed by their respective magnitudes, thereby ensuring a more robust regression analysis. For a given variable Xi, its z-score (Xiz) was computed using Equation (1) as per [41]:
X i z = X i μ X δ X
where μx represents the average value of the variable Xi, while δx denotes the standard deviation of the same variable Xi.
Secondly, a ridge regression analysis was conducted to evaluate the sensitivity of Do and De to the four presumed drivers using Equations (2) and (3). The hypothesis is that the interannual variability of Do is governed by the competing influences of accumulation-season averaged 2 m temperature (Ta), total precipitation (Pa), and net shortwave radiation (SWa). To attribute changes in Do, a regression was performed with Do serving as the dependent variable and Ta, Pa, and SWa acting as independent variables using Equation (2):
D o = β 1 × T a + β 2 × P a + β 3 × S W a + ε 1
Here, β1, β2, and β3 are the regression coefficients for Ta, Pa, and SWa, while ε1 is the residual. Therefore, the impact of Ta, Pa, and SWa on Do anomalies is captured by the terms β1 × Ta, β2 × Pa, and β3 × SWa, respectively. To determine the contributions of Ta, Pa, and SWa to Do, we regressed the annual time series of Do z-scores against the corresponding time series of Ta, Pa, and SWa z-scores. Then, the regression coefficients β1, β2, and β3 were applied to the Ta, Pa, and SWa z-scores to compute their contributions to the Do z-scores.
Additionally, De is affected by the accumulation-season averaged snow depth (SDa) and the melting-season averaged 2 m air temperature (Tm) and net shortwave radiation (SWm). Consequently, we hypothesized that the interannual variability of De is influenced by Tm, SDa, and SWm. In our analysis, we employed Equation (3) to regress De as the dependent variable against the independent variables Tm, SDa, and SWm.
D e = β 4 × T m + β 5 × S D a + β 6 × S W m + ε 2
Here, β4, β5, and β6 are the regression coefficients for Tm, SDa, and SWm, while ε2 is the residual. The contributions of Tm, SDa, and SWm to De anomalies are reflected by the terms β4 × Tm, β5 × SDa, and β6 × SWm, respectively. Similarly, the contributions of Tm, SDa, and SWm to De were ascertained by regressing the z-scores of De against the z-scores of Tm, SDa, and SWm. Subsequently, the derived regression coefficients were multiplied by the corresponding z-scores of Tm, SDa, and SWm to infer their individual contributions to the De z-scores.

3. Results

To systematically investigate the SCP dynamics across the MP during the 2000–2022 hydrological years, we first extracted the key SCP parameters, including Do, De, and Dd, from the MOD10A1F using a decision tree approach. Then, we analyzed the climatology and spatiotemporal trend of SCP. Finally, we conducted multivariate attribution modeling to diagnose the underlaying drivers of SCP during this corresponding period.

3.1. Climatology of SCP
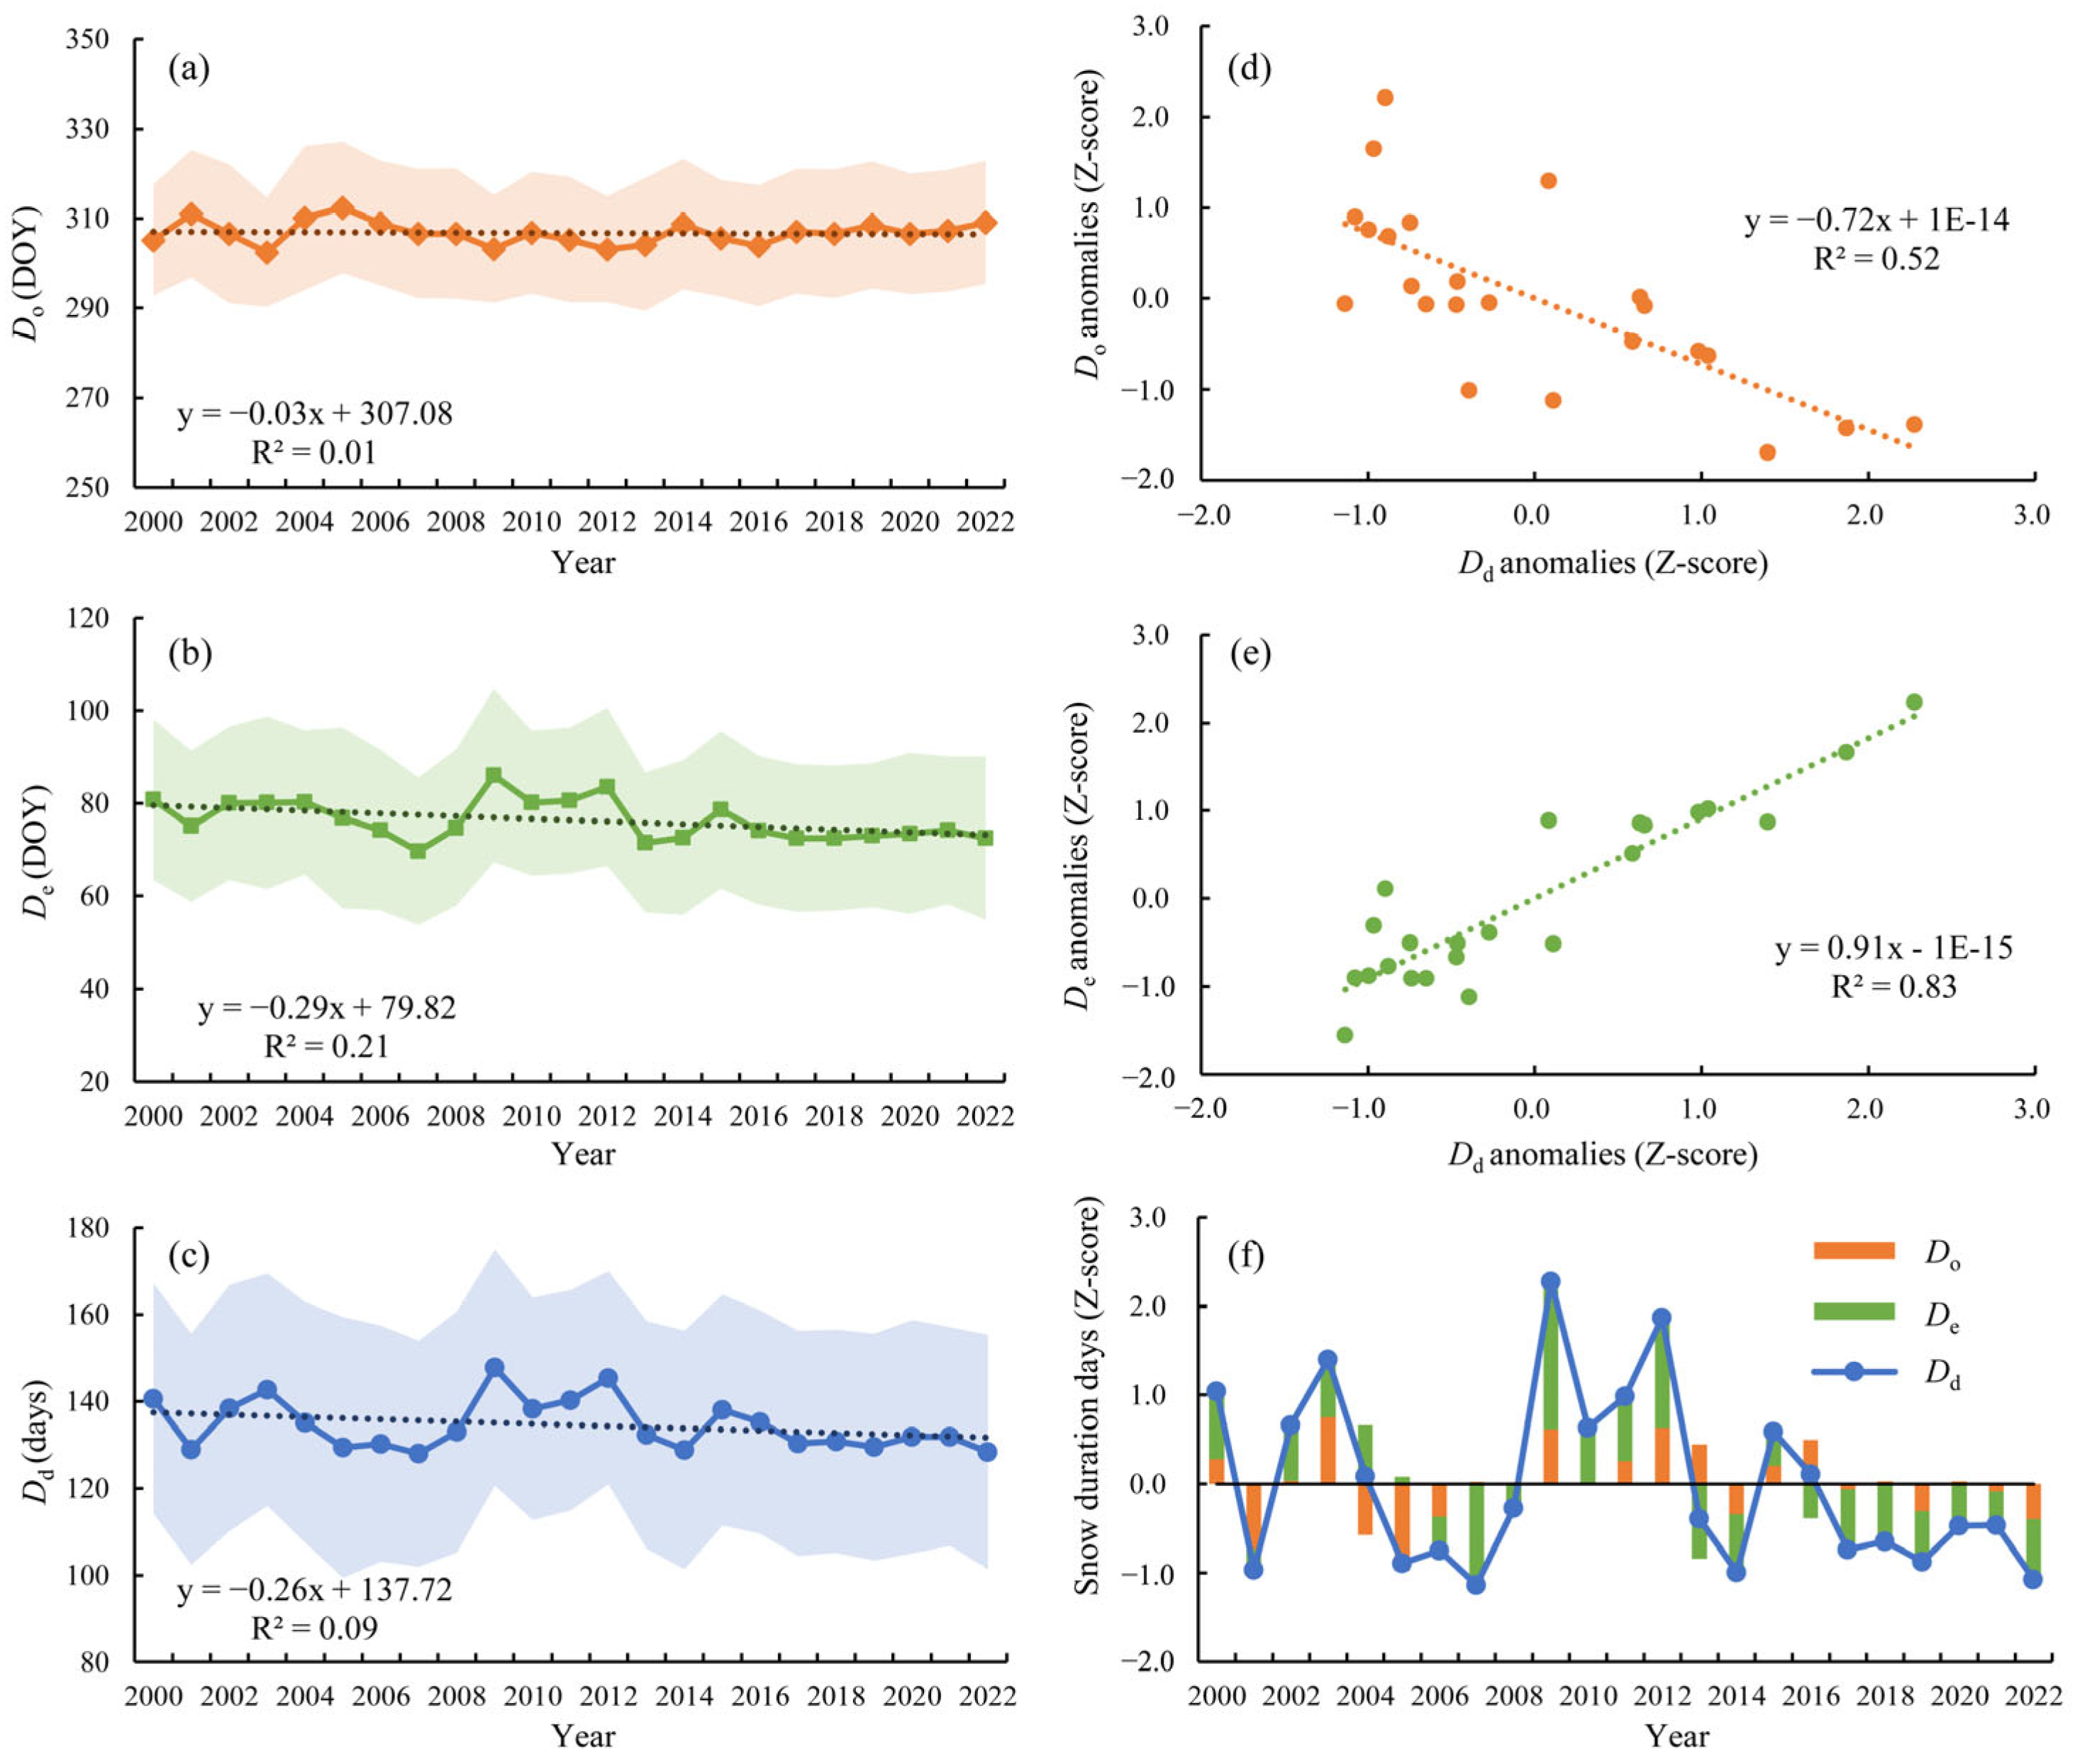
To investigate the spatial distribution of SCP across the MP, 23-year averages of Do, De, and Dd were computed spanning the hydrological years from 2000 to 2022. These spatial distributions of the mean values are depicted in Figure 3.
As shown in Figure 3, the SCP across the MP is characterized by pronounced spatial heterogeneity, driven by the interactive effects of latitude, topography, and elevation. The spatial patterns of Do, De, and Dd exhibit a clear latitudinal gradient from south to north, with additional modulation by mountainous terrain. Thermal gradients across the MP act as the primary driver of SCP dynamics. High-latitude areas surrounding Lake Baikal, together with elevated regions such as the Sayan Mountains, northern Hangai Mountains, western Altai Mountains, and northeastern Kalar Mountains, exhibit an earlier Do due to lower mean annual temperatures. For example, the Sayan Mountains (average elevation > 2000 m) experience Do in early October, nearly 4–6 weeks earlier than the southern MP plains (e.g., Gobi–Altai Plateau) where Do typically occurs in late November. Conversely, low-elevation zones in the southern MP, influenced by the Siberian high-pressure system and continental aridity, show delayed Do and earlier De, resulting in a truncated snow season. Moreover, the spatial distribution of De (Figure 3b) demonstrates a significant inverse correlation with Do, a pattern supported by statistical analysis: regions with an earlier Do exhibit a later De, reflecting a compensatory mechanism in SCP. This relationship implies that areas with prolonged snow cover (e.g., northern MP) maintain snow until late April to early May, whereas southern regions experience snowmelt by mid-March. Consequently, Dd shows a strong latitudinal gradient, with high-latitude/high-altitude zones exceeding 180 days (e.g., Altai Mountains) and southern plateaus averaging < 90 days (Figure 3c).
Comparative analysis with the NH SCP matrices reported by Chen et al. [14] revealed significant regional disparities. The MP exhibited a distinctive SCP pattern, characterized by a delayed Do, an earlier De, and a truncated Dd relative to the hemispheric average. This divergence in SCP dynamics highlights the MP’s unique climatological and topographical influences on snow cover processes, which are likely mediated by factors such as local temperature gradients, elevation, and atmospheric circulation patterns. These differences can be attributed to the unique geographical location and climate regime of the MP. The MP is situated in a continental climate zone, which experiences strong seasonal temperature fluctuations. The lack of moderating effects from large water bodies, as compared to coastal regions in the NH, leads to more extreme temperature changes. In winter, cold air masses can rapidly cool the surface, but the relatively dry atmosphere may also result in less snowfall and a later onset of significant snow cover. In spring, the continental climate warms quickly, causing an earlier melting of the snowpack and a shorter overall Dd. In addition, different with previous studies by Chen et al. [14] and Choi et al. [13] focusing on broad-scale SCP dynamics, the present study leverages high-resolution datasets to offer a granular examination of SCP variability across the MP. This enhanced spatial resolution enables a more nuanced understanding of the intricate relationships between climate change, topography, and snow hydrology, which are conducive to more accurate hydrological modeling and climate change impact assessments in the MP.

3.2. Changes in SCP

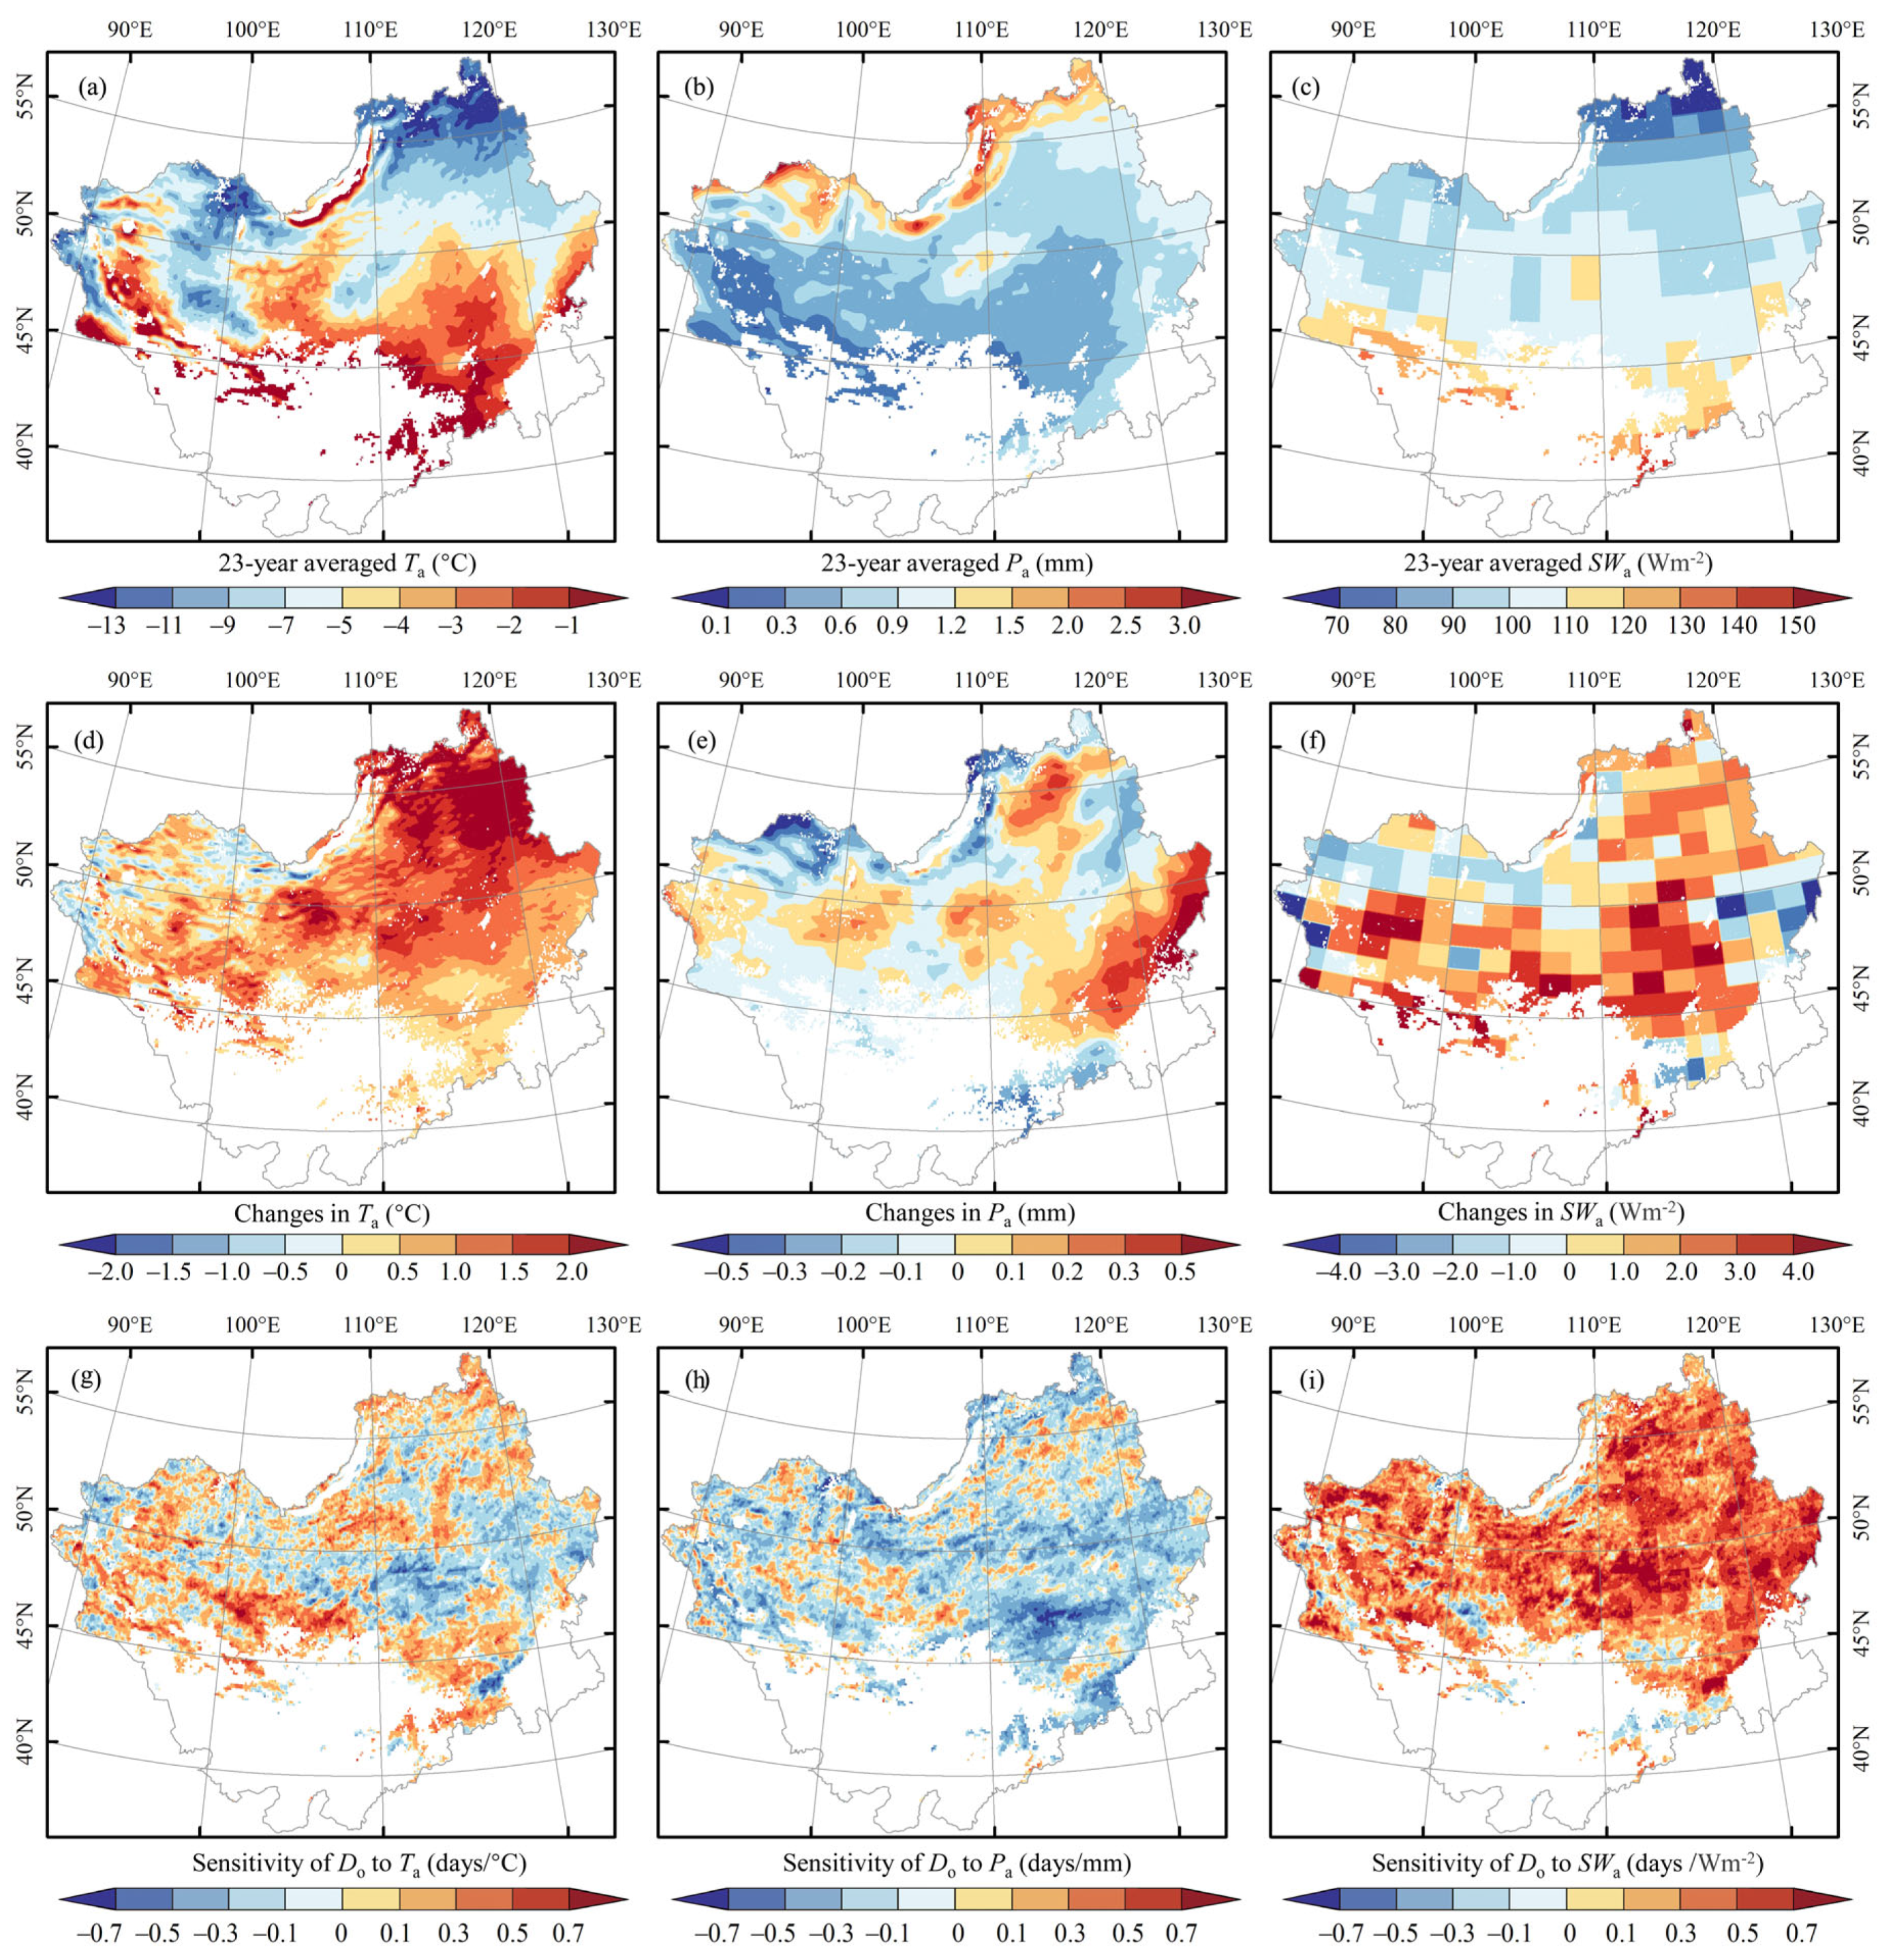
3.2.1. Spatial Variation

Figure 4 illustrates the spatial distribution of the trends in Do, De, and Dd across the MP during the 2000–2022 hydrological years. In this analysis, the magnitude of change for each parameter was quantified by multiplying the estimated linear slope of the trend by the time interval spanning the study period.
During the hydrological years from 2000 to 2022, significant spatial heterogeneity was observed in the trends in Do across the MP, as shown in Figure 4a. Spatially, the changes in Do were inconsistent. In the northeastern region of Inner Mongolia, Do showed a notable advance, whereas in the northeastern part of Mongolia, a substantial delay was detected. Histogram analysis (Figure 4d) reveals that pixels with advanced and delayed Do accounted for 48.92% and 51.08% of the Do anomalies during this period, indicating a nearly balanced spatial distribution of opposite trends. In contrast to Do, De exhibited a widespread and significant advance across the MP throughout the study period. The most pronounced advancement in De occurred in the eastern MP around 50°N, while slight delays were observed at the southern edge of the stable snow area in the MP (Figure 4b). As shown in the histogram (Figure 4e), 79.27% of the pixels on the MP displayed an advancing trend in De, with the largest proportion (36.25%) comprising pixels where De advanced by 0−10 days (negative values denote earlier occurrence). In contrast, only a small fraction of pixels (15.37%) showed a delayed trend in De, highlighting the dominance of early-ending patterns for the hydrological period 2000−2022 across most of the plateau. In addition, as illustrated in Figure 4c,f, the combined effect of anomalies in Do and De led to a reduction in Dd across the MP in this period. Histogram analysis shows that 69.03% of grid cells in the study area exhibited shortened Dd during this period, highlighting a dominant trend toward shorter snow cover durations. In contrast, regions with lengthened Dd accounted for approximately 30.99% of the study area, indicating a minority but still notable countertrend.

3.2.2. Temporal Variation

The temporal variations in SCP changes across the MP during the 2000–2022 hydrological years are illustrated in Figure 5. The trend in Do, De, and Dd over the MP during this period was estimated to be −0.03 days yr−1 (p > 0.05), −0.29 days yr−1 (p < 0.0), and −0.26 days yr−1 (p > 0.0), respectively, which suggests a statistically insignificant advance in Do, a significant forward in De, and a marked shortening of Dd in this specific period. This temporal variation in Do across the MP is consistent with the reported noteworthy shifts in Do over the NH [13,14] and high-mountain Asia [15] in the similar period. Meanwhile, the forward speed of De on the MP is greater than the average value in the NH (−1.12 days decade−1, p < 0.05) [14], but less than that in high-mountain Asia (−1.69 days yr−1) [15] within a similar time interval.
A detailed exploration is conducted to clarify the inter-relationships between Do, De, and Dd. Pearson correlation analysis reveals a high correlation between De and Dd (R2 = 0.83, p < 0.05), with a moderate yet statistically significant correlation between Do and Dd (R2 = 0.52, p < 0.05). Variance decomposition analysis further demonstrates that temporal changes in Do account for 9.58% of the observed variability in Dd, whereas changes in De explain 90.39% of this variability. Given the statistically insignificant trend in Do (−0.03 days yr−1, p > 0.05), we conclude that the recent decadal shortening of Dd (−0.26 days yr−1, p < 0.05) is predominantly driven by the advancing trend in De (−0.29 days yr−1, p < 0.05).

3.3. Attribution Analysis

3.3.1. Attribution Analysis of Changes in Do

To determine the key factors influencing Do anomalies over the MP, a sensitivity analysis was conducted using Equation (2), as shown in Figure 6. The spatial distributions of the 23-year mean Ta, Pa, and SWa over the MP during the 2000–2022 hydrological years are presented in Figure 6a–c. Influenced by solar radiation, both Ta (Figure 6a) and SWa (Figure 6c) exhibit a distinct decreasing trend from the southern to the northern part of the MP. Significantly, this pattern stands in stark contrast to the distribution of Pa (Figure 6b), which reveals an increasing trend from south to north across the MP.
Changes in Ta, Pa, and SWa, along with the sensitivities of Do to variations in Ta, Paand SWa, are displayed in Figure 6d–f. A 23-year linear trend analysis shows that most grid cells in the snow-covered areas of the MP exhibit a significant warming trend in Ta (Figure 6d), with the most pronounced warming occurring in the northeastern region and sporadic cooling observed in the northwestern region. He et al. [42] analyzed data from 16 meteorological stations in the typical grassland areas of the MP from 1978–2020 and found an overall warming trend, consistent with our findings on the spatial pattern of temperature change. Meanwhile, SWa increases in southern areas but decreases in both eastern and western regions (Figure 6f). The warming of the MP and the increase in net radiation are inherently linked to phase transitions of the Pacific Decadal Oscillation (IPO) and Atlantic Multidecadal Oscillation (AMO). Cai et al. [43] revealed that the combined phase changes in IPO and AMO since the late 1980s have triggered a mid-latitude atmospheric teleconnection wave train, inducing an anticyclonic circulation tendency over the MP. This enhances downward solar radiation and land–atmosphere feedback in the region, driving the observed warming phenomenon [43]. Concurrently, the Pa over the MP shows an overall decreasing trend during the 2000–2022 hydrological years (Figure 6e), with notable exceptions in regions such as the Greater Khingan Mountains in northeastern China and Russia’s Yablonovy Mountains, which exhibit increasing precipitation trends [42]. This finding is consistent with station-based analysis results, which suggest that winter precipitation on the MP has significantly increased in recent years [44].
The sensitivities of Do to variations in Ta, Pa, and SWa are displayed in Figure 6g–i. The sensitivity analysis derived from Equation (3) demonstrates a positive correlation between Do and Ta across the MP during the 2000–2022 hydrological years, with a sensitivity coefficient of 0.17 (±0.21) days °C−1 (Figure 6g). This indicates that a 1 °C increase in Ta delays Do by 0.17 (±0.21) days. In contrast, a negative correlation exists between Do and Pa, with a sensitivity of −0.22 (±0.21) days mm−1, meaning a 1 cm increase in Pa advances Do by 0.48 (±0.18) days (Figure 6h). Notably, the sensitivity of Do to SWa is the most pronounced among the three variables, at 0.33 (±0.27) days per Wm−2, signifying that a 1 Wm−2 increase in SWa accelerates Do advance by 0.33 (±0.27) days (Figure 6i).
The attribution analysis of Do across the MP during the 2000–2022 hydrological years is presented in Figure 7. Temporal variation analysis shows that Ta, Pa, and SWa displayed no significant trends on the MP over this period. However, linear correlation analysis revealed that anomalies in Do anomalies were statistically correlated with Ta (R2 = 0.23, p < 0.05) and SWa (R2 = 0.42, p < 0.05), though the correlation with Pa (R2 = 0.16, p > 0.05) was not significant. Contribution analysis further indicates that SWa contributed 61.07% to Do anomalies, followed by Pa (31.27%) and Ta (0.49%). This predominance arises because radiative flux provides direct phase-change energy to the snowpack, whereas ambient air warming alone drives inefficient melting. Heat transfer via conduction/convection—mediated by turbulent energy fluxes—constitutes an indirect and thermodynamically slower pathway [45,46]. Thus, the Do anomalies on the MP during the 2000–2022 hydrological years were predominantly driven by SWa changes.

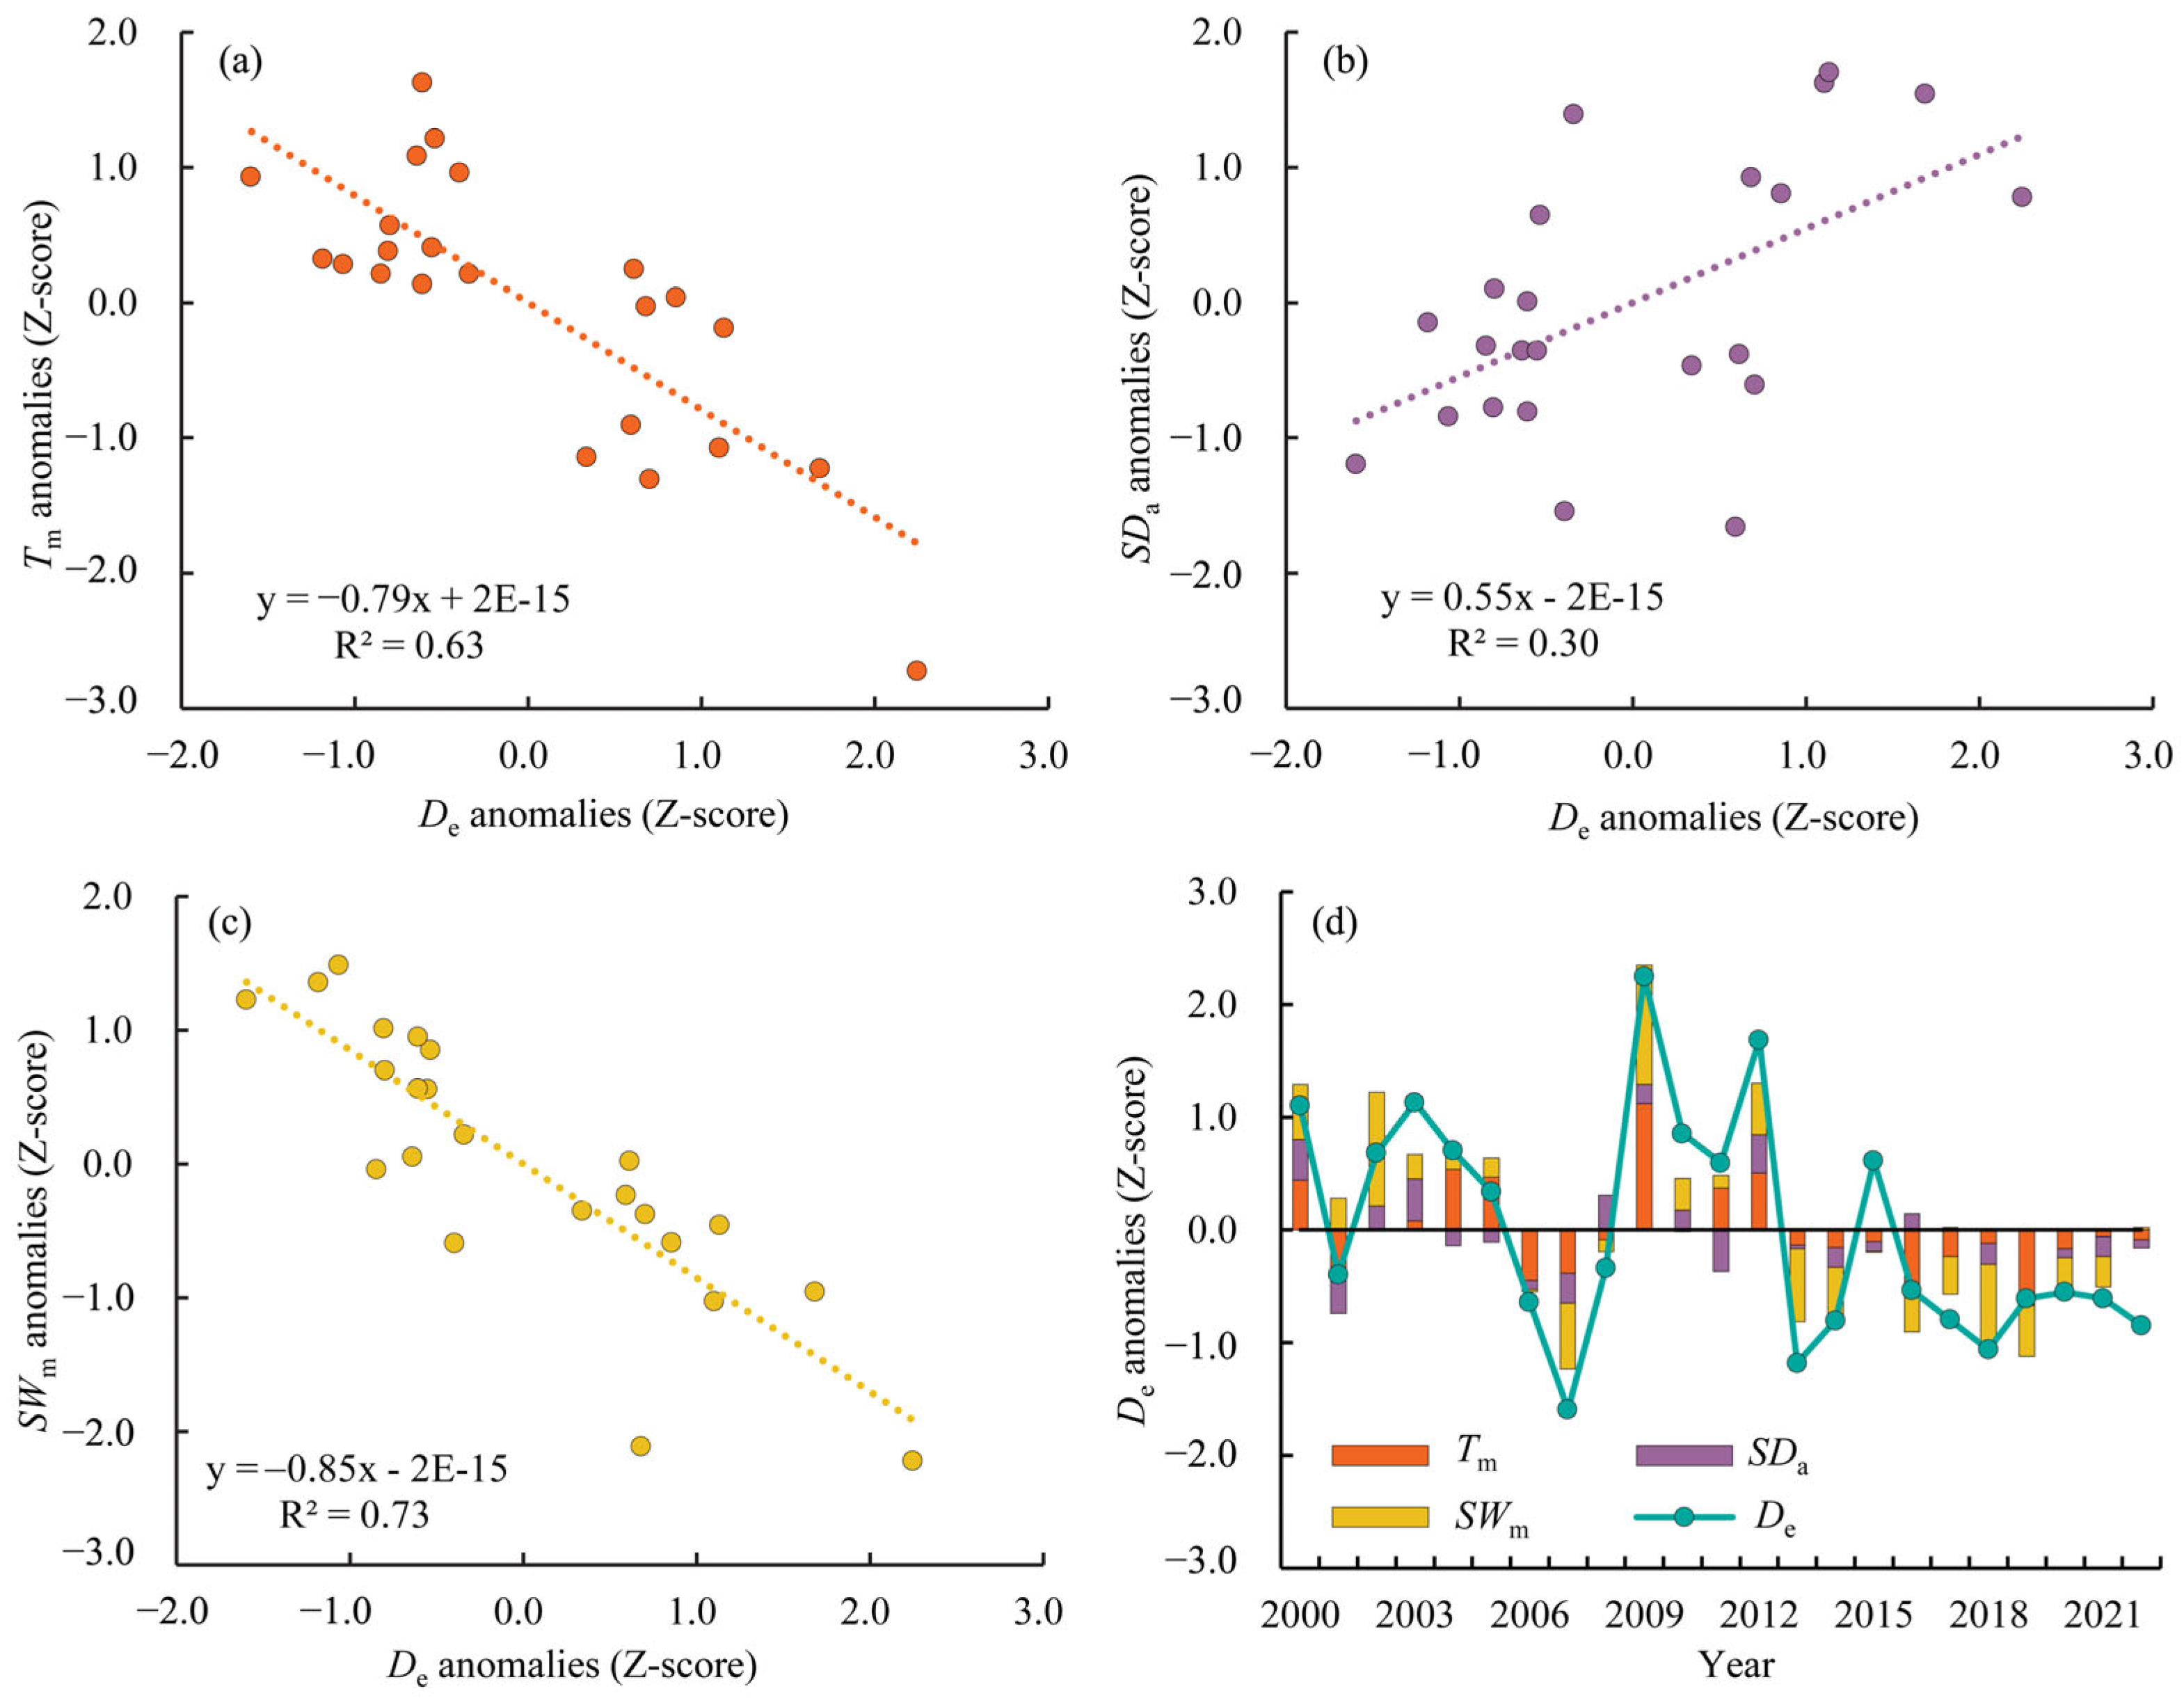
3.3.2. Attribution Analysis of Changes in De

To identify the dominant drivers of De anomalies across the MP during the 2000–2022 hydrological years, a sensitivity analysis was performed using Equation (4), as shown in Figure 8. The spatial distributions of the 23-year mean of Tm, SDa, and SWm across the MP in this period are presented in Figure 8a–c. Changes in Tm, SDa, and SWm, along with the sensitivity of De to variations in these variables, are illustrated in Figure 8d–f and Figure 8g–i, respectively.
Similar to the spatial distribution patterns of Ta and SWa, the 23-year mean values of Tm (Figure 8a) and SWm (Figure 8c) exhibit a south-to-north decreasing trend across the MP during the 2000–2022 hydrological years, primarily regulated by solar radiation. In contrast, SDa shows a south-to-north increasing trend over the same period (Figure 8b). Driven by phase transitions in the IPO and AMO, the 23-year trends (2000–2022) in Tm (Figure 8d) and SWm (Figure 8f) exhibit significant upward trends across the MP [42,43]. This warming and radiation intensification are closely linked to the combined influence of IPO-/AMO-induced atmospheric teleconnections, which enhance downward solar radiation and land–atmosphere energy feedback over the MP [43]. Concurrently, SDa has undergone a general decline across the MP, with the most pronounced decreases observed in the northeastern region. Notable exceptions include the Greater Khingan Mountains in the east and the Altai Mountains in the west, where SDa has remained relatively stable or experienced minor increases, likely due to localized topographic effects on snow accumulation and regional moisture circulation patterns [47].
The sensitivity analysis based on Equation (4) indicates that De exhibits a negative sensitivity of −0.22 (±0.21) days °C−1 to Tm, suggesting that a 1 °C increment in Tm would lead to a delay in De by 0.17 (±0.21) days (Figure 8g). Meanwhile, the sensitivity of De to SDa is estimated to be 0.17 (±0.19) days cm−1, indicating that a 1 cm increase in SDa would cause a delay in De by 0.17 (±0.19) days (Figure 8h). In comparison, the sensitivity of De to SWm is the highest, registering at −0.48 (±0.25) days per Wm−2, suggesting that a 1 Wm−2 rise in SWm would prompt an advance in De by 0.48 (±0.25) days (Figure 8i). Temporal variation analysis reveals that SWm increased at a rate of 0.38 Wm−2 yr⁻¹ (p < 0.05), while Tm rose at 0.06 °C yr⁻¹ (p < 0.05) across the MP during the 2000–2022 hydrological years. In contrast, SDa exhibited no significant trends over the same period. Moreover, a comprehensive contribution analysis demonstrated significant correlations (at the 95% confidence level) between changes in De and Tm (Figure 9a), SDa (Figure 9b), and SWm (Figure 9c). Consistent with the attribution analysis for Do, SWm emerged as the primary driver of De variability, accounting for 47.72% of De anomalies. Tm ranked as the second most influential factor, contributing 41.22% to De changes, while SDa had a less pronounced but still notable impact, explaining 22.15% of the variability. Given the lack of significant temporal changes in SDa over this period, SWm and Tm dominated the control over De anomalies, highlighting its critical role in modulating snowmelt-driven hydrological processes across the MP.
Notably, this finding contrasts with prior attribution analyses of De in the NH, which predominantly identified Tm as the primary climatic driver of earlier snowmelt across the NH [14]. However, our results align partially with Wang et al. [48], who emphasized that spring snow cover reduction is driven by intraseasonal variability in surface energy fluxes. This discrepancy may stem from the distinct spatial scale and climatic context of the MP, where atmospheric teleconnections (e.g., IPO/AMO phase transitions) and regional radiation patterns exert stronger control over snowmelt dynamics than mean temperature alone. While NH studies often focus on broad temperature trends, our regional analysis reveals that shortwave radiation, as a key component of surface energy balance, plays a dominant role in modulating snowmelt timing and discharge anomalies on the MP.

4. Discussion

Given the MP is one of the largest arid and inland plateaus in East Asia, accurate estimates of SCP are critical for improving atmospheric reanalysis [49], climate predictions [50], and understanding vegetation dynamics [4,51]. Leveraging the latest version of MODIS snow cover products, this study investigates the spatial–temporal distribution and driving mechanisms of SCP across the MP at the highest achievable resolution compared to prior research. The high temporal frequency (daily revisit) and near-complete spatial coverage of MOD10A1F significantly reduce uncertainties in SCP retrievals—challenges commonly associated with low temporal resolution and fragmented coverage in other optical snow products. This advancement is particularly valuable for local climate modeling, ecological monitoring, and hydrological forecasting in the MP, where snow cover exerts profound impacts on energy balance, water resources, and vegetation phenology.
Employing MOD10A1F-derived SCP parameters at refined spatiotemporal resolutions, this study reveals statistically insignificant trends in Do, significant advancement in De, and consequent shortening of Dd across the MP during the hydrological years 2000–2022. These findings partially align with continental-scale SCP studies by Choi et al. [13] and Chen et al. [14], which identified De anomalies as the primary driver of SCP changes during 1967–2008 and 2001–2020, respectively. However, these results contrast with Allchin and Déry [52], who attributed NH SCP variations from 1972–2017 primarily to shifting spatiotemporal patterns of Do. The discrepancy may stem from differences in temporal coverage, as attribution analyses are highly sensitive to the study period selected. For instance, shorter-term trends (e.g., our 23-year dataset) may reflect localized climatic drivers like SWm intensification, whereas longer-term hemispheric studies emphasize broader teleconnections linked to Do. This highlights the importance of temporal scale in interpreting snow cover–climate relationships across heterogeneous regions like the MP.
The findings of this study rely on the latest version of MOD10A1F snow cover products and are therefore inherently subject to the limitations of this dataset. MOD10A1F has well-documented imperfections, primarily arising from challenges in cloud–snow discrimination and snow detection under conditions such as low illumination, high solar zenith angles, shadowed surfaces, and complex mountainous terrain [53,54]. These limitations were not addressed in this study and will require advancements in snow detection algorithms, cloud–snow discrimination techniques, and sensor optimization in future research. Nevertheless, within the current technical framework, MOD10A1F remains the most reliable dataset for SCP monitoring across the MP, balancing spatial–temporal resolution and coverage for large-scale hydrological and climatic analyses. Furthermore, our attribution analysis relied on ridge regression, which inherently assumes linear relationships between SCP and climate variables. While this approach mitigates multicollinearity, it may overlook complex non-linear interactions among drivers. Future studies could enhance this by incorporating polynomial features or integrating ridge regression with non-linear transformations to better capture these intricate relationships.
Recent climate projections indicate that a sustained reduction in seasonal snow cover extent is highly likely under continued global warming. This trend is amplified by a positive snow–albedo feedback loop in the Earth’s climate system, where declining snow cover reduces surface reflectivity and enhances land–atmosphere energy absorption. Consequently, future research must deepen our understanding of how SCP will respond to projected warming, particularly in regions like the MP that are highly sensitive to climate change. Additionally, snow cover fluctuations exert profound impacts on natural vegetation phenology, especially in grassland and forest ecosystems. To address these complexities, future studies should employ integrated approaches that link snow cover dynamics, vegetation phenology, and climate models, enabling a more holistic understanding of biophysical interactions under escalating global temperatures. Such research is critical for improving ecosystem vulnerability assessments and adaptive management strategies in snow-dominated regions.

5. Conclusions

This study analyzed the spatial–temporal distribution, trends, and driving forces of SCP across the MP during the 2000–2022 hydrological years, leveraging the latest gap-filled MODIS snow cover dataset and multi-source climate variables. The findings provide critical scientific insights into snow cover dynamics over the MP, offering a foundational reference for water resources management, ecosystem conservation, and climate adaptation strategies amid rapid regional climate change.
Utilizing MOD10A1F snow cover products and a decision tree algorithm, this study revealed pronounced spatiotemporal heterogeneity in SCP across the MP during the 2000–2022 hydrological years. Do, De, and Dd exhibited significant regional variations, with 23-year average values of 279.69 (±81.87) DOY for Do, 109.13 (±45.25) DOY for De, and 166.29 (±71.79) days for Dd across the MP in this period. Trend analysis revealed a negligible advance in Do (−0.03 days yr−1, p > 0.05), a significant advancement in De (−0.29 days yr−1, p < 0.01), and a notable shortening of Dd (−0.26 days yr−1, p < 0.05) over the period. Among these, De emerged as the primary driver of SCP changes, with its trend magnitude and statistical significance underscoring its dominant role in shaping SCP dynamics and hydrological responses across the MP.
Comprehensive attribution analysis reveals that variations in temperature, precipitation, snow depth, and net shortwave radiation significantly influenced SCP across the MP during the 2000–2022 hydrological years. Specifically, changes in Do were primarily driven by SWa (61.07%), Pa (31.27%), and Ta (0.49%), while fluctuations in De stemmed predominantly from SWm (47.72%), Tm (41.22%), and SDa (22.15%). A cross-comparison of Do and De attribution analyses confirms that shortwave net radiation emerges as the key determinant of SCP anomalies across the MP, underscoring its dominant role in modulating both Do and De dynamics. While precipitation, snow depth, and temperature also exerted significant influences, their effects were secondary to radiation-driven processes. The interplay of these factors introduces complexity and uncertainty into SCP projections, highlighting the need for multi-factor modeling to improve predictive accuracy in this climatically sensitive region.
While previous studies [13,14,18] have investigated the distribution and drivers of SCP at continental scales, this research advances our understanding by resolving recent SCP dynamics across the MP at unprecedented regional and subregional scales (500 m spatial resolution; daily temporal coverage) amid rapid climate change (2000–2022). Moreover, the attribution analysis results of SCP changes on the MP are significantly different from those in the NH. The study identifies that phase transitions of the IPO and AMO trigger mid-latitude atmospheric teleconnection pathways, which favor the development of persistent anticyclonic circulation over the MP. This circulation regime reduces cloud cover by 15–20% and enhances downward shortwave radiation by 0.38 Wm−2 yr−1 (p < 0.01), directly accelerating De and suppressing snow depth trends. These mechanisms contrast with NH studies, which often emphasize melt-season temperature as the primary driver [52]. This divergence highlights the unique sensitivity of the MP to radiation–teleconnection feedback, where anticyclonic circulation amplifies solar energy absorption via reduced albedo, creating a self-reinforcing cycle of warming and snow cover decline. The findings not only resolve the fundamental discrepancy in SCP attribution between regional and continental scales but also underscore the necessity of integrating local-scale radiation processes and large-scale climate oscillations in future SCP research. For instance, incorporating IPO/AMO indices into regional climate models could improve predictions of snowmelt timing and water resource availability in data-sparse arid regions.

Author Contributions

Conceptualization, X.C.; methodology, X.C.; software, X.C. and S.L.; validation, X.C. and S.L.; formal analysis, X.C.; investigation, X.C.; resources, S.L.; data curation, X.C. and S.L.; writing—original draft preparation, X.C.; writing—review and editing, X.C. and S.L.; visualization, X.C. and S.L.; supervision, X.C.; project administration, X.C.; funding acquisition, X.C. All authors have read and agreed to the published version of the manuscript.

Funding

This research was jointly supported by the Comprehensive Survey of Biodiversity over the Mongolian Plateau (No. 2019FY102001) and the National Key R&D Program of China (2022YFF0711603).

Data Availability Statement

The snow cover data are openly available at https://nsidc.org/data/mod10a1f/versions/61 (accessed on 30 June 2020); the snow depth observations are openly available at https://www.ncei.noaa.gov/access/metadata/landing-page/bin/iso?id=gov.noaa.ncdc:C00516 (accessed on 30 June 2020). Other data will be made available on request.

Acknowledgments

We greatly appreciate the efforts of the National Snow and Ice Data Center and National Centers for Environmental Information in making MOD10A1F and daily snow depth observations publicly accessible.

Conflicts of Interest

The authors declare no conflicts of interest.

Abbreviations

The following abbreviations are used in this manuscript:
MPMongolian Plateau
NHNorthern Hemisphere
MODISModerate Resolution Imaging Spectroradiometer
MOD10A1FMODIS daily cloud-gap-filled snow cover product
NDSINormalized Difference Snow Index
CGFCloud-gap-filled
CERESClouds and the Earth’s Radiant Energy System
ERA5-LandEuropean Center for Medium-Range Weather Forecasts Reanalysis v5-Land
SCPSnow cover phenology
DoSnow onset date
DeSnow end date
DdSnow duration days
DOYDay of Year
IPOPacific Decadal Oscillation
AMOAtlantic Multidecadal Oscillation
TaAccumulation-season averaged 2 m air temperature
PaAccumulation-season averaged total precipitation
SWaAccumulation-season averaged net shortwave radiation
SDaAccumulation-season averaged snow depth
TmMelting-season averaged 2 m air temperature
SWmMelting-season averaged net shortwave radiation

References

  1. Barnett, T.; Adam, J.; Lettenmaier, D. Potential impacts of a warming climate on water availability in snow-dominated regions. Nature 2005, 438, 303–309. [Google Scholar] [CrossRef] [PubMed]
  2. Zaremehrjardy, M.; Victor, J.; Park, S.; Smerdon, B.; Alessi, D.S.; Faramarzi, M. Assessment of snowmelt and groundwater-surface water dynamics in mountains, foothills, and plains regions in northern latitudes. J. Hydrol. 2022, 606, 127449. [Google Scholar] [CrossRef]
  3. Zhang, X.; Sa, C.; Hai, Q.; Meng, F.; Luo, M.; Gao, H.; Zhang, H.; Yin, C.; Zhang, Y.; Sun, H. Quantifying the Effects of Snow on the Beginning of Vegetation Growth in the Mongolian Plateau. Remote Sens. 2023, 15, 1245. [Google Scholar] [CrossRef]
  4. Chen, X.; Yang, Y. Observed earlier start of the growing season from middle to high latitudes across the Northern Hemisphere snow-covered landmass for the period 2001–2014. Environ. Res. Lett. 2020, 15, 034042. [Google Scholar] [CrossRef]
  5. Miao, L.; Liu, Q.; Fraser, R.; He, B.; Cui, X. Shifts in vegetation growth in response to multiple factors on the Mongolian Plateau from 1982 to 2011. Phys. Chem. Earth. 2015, 87-88, 50–59. [Google Scholar] [CrossRef]
  6. Li, C.; Xu, X.; Du, H.; Du, D.; Leal Filho, W.; Wang, J.; Bao, G.; Ji, X.; Yin, S.; Bao, Y.; et al. Potential impacts of climate extremes on snow under global warming conditions in the Mongolian Plateau. Int. J. Clim. Change Str. 2022, 14, 425–439. [Google Scholar] [CrossRef]
  7. Chen, X.; Yang, Y.; Yin, C. Contribution of Changes in Snow Cover Extent to Shortwave Radiation Perturbations at the Top of the Atmosphere over the Northern Hemisphere during 2000–2019. Remote Sens. 2021, 13, 4938. [Google Scholar] [CrossRef]
  8. Chen, X.; Liang, S.; Cao, Y. Satellite observed changes in the Northern Hemisphere snow cover phenology and the associated radiative forcing and feedback between 1982 and 2013. Environ. Res. Lett. 2016, 11, 084002. [Google Scholar] [CrossRef]
  9. Wayand, N.; Lundquist, J.; Clark, M. Modeling the influence of hypsometry, vegetation, and storm energy on snowmelt contributions to basins during rain-on-snow floods. Water Resour. Res. 2015, 51, 8551–8569. [Google Scholar] [CrossRef]
  10. Di Marco, N.; Avesani, D.; Righetti, M.; Zaramella, M.; Majone, B.; Borga, M. Reducing hydrological modelling uncertainty by using MODIS snow cover data and a topography-based distribution function snowmelt model. J. Hydrol. 2021, 599, 126020. [Google Scholar] [CrossRef]
  11. Tachiiri, K.; Shinoda, M.; Klinkenberg, B.; Morinaga, Y. Assessing Mongolian snow disaster risk using livestock and satellite data. J. Arid Environ. 2008, 72, 2251–2263. [Google Scholar] [CrossRef]
  12. Ma, N.; Yu, K.; Zhang, Y.; Zhai, J.; Zhang, Y.; Zhang, H. Ground observed climatology and trend in snow cover phenology across China with consideration of snow-free breaks. Clim. Dynam. 2020, 55, 2867–2887. [Google Scholar] [CrossRef]
  13. Choi, G.; Robinson, D.A.; Kang, S. Changing Northern Hemisphere Snow Seasons. J. Clim. 2010, 23, 5305–5310. [Google Scholar] [CrossRef]
  14. Chen, X.; Yang, Y.; Ma, Y.; Li, H. Distribution and Attribution of Terrestrial Snow Cover Phenology Changes over the Northern Hemisphere during 2001–2020. Remote Sens. 2021, 13, 1843. [Google Scholar] [CrossRef]
  15. Tang, Z.; Deng, G.; Hu, G.; Zhang, H.; Pan, H.; Sang, G. Satellite observed spatiotemporal variability of snow cover and snow phenology over high mountain Asia from 2002 to 2021. J. Hydrol. 2022, 61, 128438. [Google Scholar] [CrossRef]
  16. Wang, L.; Derksen, C.; Brown, R.; Markus, T. Recent changes in pan-Arctic melt onset from satellite passive microwave measurements. Geophys. Res. Lett. 2013, 40, 522–528. [Google Scholar] [CrossRef]
  17. Brown, R.; Derksen, C.; Wang, L. A multi-data set analysis of variability and change in Arctic spring snow cover extent, 1967–2008. J. Geophys. Res. 2010, 115, D16111. [Google Scholar] [CrossRef]
  18. Chen, X.; Liang, S.; Cao, Y.; He, T.; Wang, D. Observed contrast changes in snow cover phenology in northern middle and high latitudes from 2001–2014. Sci. Rep. 2015, 5, 16820. [Google Scholar] [CrossRef]
  19. Peng, S.; Piao, S.; Ciais, P.; Friedlingstein, P.; Zhou, L.; Wang, T. Change in snow phenology and its potential feedback to temperature in the Northern Hemisphere over the last three decades. Environ. Res. Lett. 2013, 8, 014008. [Google Scholar] [CrossRef]
  20. Brown, R.D.; Robinson, D.A. Northern Hemisphere spring snow cover variability and change over 1922–2010 including an assessment of uncertainty. Cryosphere 2011, 5, 219–229. [Google Scholar] [CrossRef]
  21. Song, Y.; Li, Z.; Zhou, Y.; Bi, X.; Sun, B.; Xiao, T.; Suo, L.; Zhang, W.; Xiao, Z.; Wang, C. The Influence of Solar Activity on Snow Cover over the Qinghai–Tibet Plateau and Its Mechanism Analysis. Atmosphere 2022, 13, 1499. [Google Scholar] [CrossRef]
  22. Xia, Y.-Y.; Chun, X.; Dan, D.; Liu, H.-Y.; Zhou, H.-J.; Wan, Z.-Q. Abrupt change of winter temperature over the Mongolian Plateau during 1961–2017. J. Mt. Sci. 2023, 20, 996–1009. [Google Scholar] [CrossRef]
  23. Li, Y.; Gong, H.; Chen, W.; Wang, L.; Wu, R.; Dong, Z.; Piao, J.; Ma, K. Summer precipitation variability in the Mongolian Plateau and its possible causes. Global Planet. Change 2023, 228, 104189. [Google Scholar] [CrossRef]
  24. Xia, Y.; Dan, D.; Liu, H.; Zhou, H.; Wan, Z. Spatiotemporal Distribution of Precipitation over the Mongolian Plateau during 1976–2017. Atmosphere 2022, 13, 2132. [Google Scholar] [CrossRef]
  25. Frei, A.; Tedesco, M.; Lee, S.; Foster, J.; Hall, D.K.; Kelly, R.; Robinson, D.A. A review of global satellite-derived snow products. Adv. Space Res. 2012, 50, 1007–1029. [Google Scholar] [CrossRef]
  26. Hall, D.; Riggs, G. MODIS/Terra CGF Snow Cover Daily L3 Global 500m SIN Grid, Version 61. Available online: https://nsidc.org/data/mod10a1/versions/61 (accessed on 15 June 2023).
  27. Riggs, G.; Hall, D.; Salomonson, V. MODIS Snow Products User Guide Collection 5. Available online: https://modis-snow-ice.gsfc.nasa.gov/uploads/sug_c5.pdf (accessed on 15 June 2023).
  28. Riggs, G.; Hall, D.; Román, M. MODIS Snow Products Collection 6.1 User Guide. Available online: https://nsidc.org/data/documentation/modis-snow-products-collection-61-user-guide (accessed on 10 July 2024).
  29. Wang, X.; Wu, C.; Peng, D.; Gonsamo, A.; Liu, Z. Snow cover phenology affects alpine vegetation growth dynamics on the Tibetan Plateau: Satellite observed evidence, impacts of different biomes, and climate drivers. Agr. Forest Meteorol. 2018, 256–257, 61–74. [Google Scholar] [CrossRef]
  30. Tomaszewska, M.; Nguyen, L.; Henebry, G. Land surface phenology in the highland pastures of montane Central Asia: Interactions with snow cover seasonality and terrain characteristics. Remote Sens. Environ. 2020, 240, 11167. [Google Scholar] [CrossRef]
  31. Muñoz-Sabater, J.; Dutra, E.; Agustí-Panareda, A.; Albergel, C.; Arduini, G.; Balsamo, G.; Boussetta, S.; Choulga, M.; Harrigan, S.; Hersbach, H.; et al. ERA5-Land: A state-of-the-art global reanalysis dataset for land applications. Earth Syst. Sci. Data 2021, 13, 4349–4383. [Google Scholar] [CrossRef]
  32. Xin, Y.; Yang, Y.; Chen, X.; Yue, X.; Liu, Y.; Yin, C. One-kilometre monthly air temperature and precipitation product over the Mongolian Plateau for 1950–2020. Int. J. Climatol. 2023, 43, 3877–3891. [Google Scholar] [CrossRef]
  33. Xin, Y.; Yang, Y.; Chen, X.; Yue, X.; Liu, Y.; Yin, C. Evaluation of IMERG and ERA5 precipitation products over the Mongolian Plateau. Sci. Rep. 2022, 12, 21776. [Google Scholar] [CrossRef]
  34. Xiao, L.; Che, T.; Dai, L. Evaluation of Remote Sensing and Reanalysis Snow Depth Datasets over the Northern Hemisphere during 1980–2016. Remote Sens. 2020, 12, 3253. [Google Scholar] [CrossRef]
  35. Fukami, H.; Kojima, K.; Aburakawa, H. The Extinction and Absorption of Solar Radiation Within a Snow Cover. Ann. Glaciol. 1985, 6, 118–122. [Google Scholar] [CrossRef]
  36. Qu, X.; Hall, A. Assessing Snow Albedo Feedback in Simulated Climate Change. J. Clim. 2006, 19, 2617–2630. [Google Scholar] [CrossRef]
  37. Loeb, N.; Doelling, D.; Wang, H.; Su, W.; Nguyen, C.; Corbett, J.; Liang, L.; Mitrescu, C.; Rose, F.; Kato, S. Clouds and the Earth’s Radiant Energy System (CERES) Energy Balanced and Filled (EBAF) Top-of-Atmosphere (TOA) Edition-4.0 Data Product. J. Clim. 2018, 31, 895–918. [Google Scholar] [CrossRef]
  38. Ma, Q.; Wang, K.; Wild, M. Impact of geolocations of validation data on the evaluation of surface incident shortwave radiation from Earth System Models. J. Geophys. Res. Atmos. 2015, 120, 6825–6844. [Google Scholar] [CrossRef]
  39. Zhang, X.; Lu, N.; Jiang, H.; Yao, L. Evaluation of Reanalysis Surface Incident Solar Radiation Data in China. Sci. Rep. 2020, 10, 3494. [Google Scholar] [CrossRef] [PubMed]
  40. Brutel-Vuilmet, C.; Ménégoz, M.; Krinner, G. An analysis of present and future seasonal Northern Hemisphere land snow cover simulated by CMIP5 coupled climate models. Cryosphere 2013, 7, 67–80. [Google Scholar] [CrossRef]
  41. Kreyszig, E. Advanced Engineering Mathematics; Wiley: Jefferson City, MO, USA, 1979; pp. 1014–1015. [Google Scholar]
  42. He, B.; Tuya, W.; Qinchaoketu, S.; Nanzad, L.; Yong, M.; Kesi, T.; Sun, C. Climate Change Characteristics of Typical Grassland in the Mongolian Plateau from 1978 to 2020. Sustainability 2022, 14, 16529. [Google Scholar] [CrossRef]
  43. Cai, Q.; Chen, W.; Chen, S.; Xie, S.; Piao, J.; Ma, T.; Lan, X. Recent pronounced warming on the Mongolian Plateau boosted by internal climate variability. Nat. Geosci. 2024, 17, 181–188. [Google Scholar] [CrossRef]
  44. Na, Y.T.; Qin, F.Y.; Jia, G.S.; Yang, J.; Bao, Y. Change trend and regional differentiation of precipitation over the Mongolian Plateau in recent 54 years. Arid Land Geogr. 2019, 42, 1253–1261. [Google Scholar]
  45. Brun, E.; Vionnet, V.; Boone, A.; Decharme, B.; Peings, Y.; Valette, R.; Karbou, F.; Morin, S. Simulation of Northern Eurasian Local Snow Depth, Mass, and Density Using a Detailed Snowpack Model and Meteorological Reanalyses. J. Hydrometeor. 2013, 14, 203–219. [Google Scholar] [CrossRef]
  46. Feld, S.I.; Cristea, N.C.; Lundquist, J.D. Representing atmospheric moisture content along mountain slopes: Examination using distributed sensors in the Sierra Nevada, California. Water Resour. Res. 2013, 49, 4424–4441. [Google Scholar] [CrossRef]
  47. Zhang, P.; Jeong, J.; Yoon, J.; Kim, H.; Wang, S.; Linderholm, H.; Fang, K.; Wu, X.; Chen, D. Abrupt shift to hotter and drier climate over inner East Asia beyond the tipping point. Science 2020, 370, 1095–1099. [Google Scholar] [CrossRef] [PubMed]
  48. Wang, T.; Peng, S.; Ottlé, C.; Ciais, P. Spring snow cover deficit controlled by intraseasonal variability of the surface energy fluxes. Environ. Res. Lett. 2015, 10, 024018. [Google Scholar] [CrossRef]
  49. Batrak, Y.; Muller, M. On the warm bias in atmospheric reanalyses induced by the missing snow over Arctic sea-ice. Nat. Commun. 2019, 10, 4170. [Google Scholar] [CrossRef]
  50. Peers, M.; Majchrzak, Y.; Menzies, A.; Studd, E.; Bastille-Rousseau, G.; Boonstra, R.; Humphries, M.; Jung, T.; Kenney, A.; Krebs, C.; et al. Climate change increases predation risk for a keystone species of the boreal forest. Nat. Clim. Change 2020, 10, 1149–1153. [Google Scholar] [CrossRef]
  51. Wang, X.; Wang, T.; Guo, H.; Liu, D.; Zhao, Y.; Zhang, T.; Liu, Q.; Piao, S. Disentangling the mechanisms behind winter snow impact on vegetation activity in northern ecosystems. Glob. Chang. Biol. 2018, 24, 1651–1662. [Google Scholar] [CrossRef] [PubMed]
  52. Allchin, M.I.; Déry, S.J. Shifting Spatial and Temporal Patterns in the Onset of Seasonally Snow-Dominated Conditions in the Northern Hemisphere, 1972–2017. J. Clim. 2019, 32, 4981–5001. [Google Scholar] [CrossRef]
  53. Hall, D.K.; Riggs, G.A.; DiGirolamo, N.E.; Román, M.O. Evaluation of MODIS and VIIRS cloud-gap-filled snow-cover products for production of an Earth science data record. Hydrol. Earth Syst. Sc. 2019, 23, 5227–5241. [Google Scholar] [CrossRef]
  54. Yuan, Y.; Li, B.; Gao, X.; Liu, W.; Li, Y.; Li, R. Validation of Cloud-Gap-Filled Snow Cover of MODIS Daily Cloud-Free Snow Cover Products on the Qinghai–Tibetan Plateau. Remote Sens. 2022, 14, 5642. [Google Scholar] [CrossRef]
Figure 1. Location of the Mongolian Plateau.
Remotesensing 17 02221 g001
Figure 2. Flowchart of this study.
Remotesensing 17 02221 g002
Figure 3. Spatial distribution of 23-year mean values for (a) snow onset date (Do), (b) snow end date (De), and (c) snow duration days (Dd) across the Mongolian Plateau during 2000–2022 hydrological years; (df) histogram distributions of (d) Do, (e) De, and (f) Dd over the same period.
Remotesensing 17 02221 g003
Figure 4. Changes in (a) snow onset date (Do), (b) snow end date (De), and (c) snow duration days (Dd) across the Mongolian Plateau during 2000–2022 hydrological years; (df) histograms of trend magnitudes for (d) Do, (e) De, and (f) Dd over the same period.
Remotesensing 17 02221 g004
Figure 5. The 23-year variation in (a) snow onset date (Do), (b) snow end date (De), and (c) snow duration days (Dd) across the Mongolian Plateau during 2000–2022 hydrological years; (d,e) linear correlation analyses between (d) Do and Dd, (e) De and Dd over the same period; (f) contributions of Do and De to Dd.
Remotesensing 17 02221 g005
Figure 6. Spatial distributions of 23-year mean accumulation-season (a) temperature (Ta), (b) precipitation (Pa), and (c) net shortwave radiation (SWa) across the Mongolian Plateau (MP) during 2000–2022 hydrological years; (df) 23-year trends in Ta, Pa, and SWa, respectively; (gi) sensitivity of Do to variations in Ta, Pa, and SWa across the MP.
Remotesensing 17 02221 g006
Figure 7. Linear correlations between snow onset date (Do) and accumulation-season (a) temperature (Ta), (b) precipitation (Pa), and (c) net shortwave radiation (SWa) across the Mongolian Plateau during 2000–2022 hydrological years; (d) contributions of Ta, Pa, and SWa to Do changes across the MP over the same period.
Remotesensing 17 02221 g007
Figure 8. Spatial distributions of 23-year mean (a) melting-season temperature (Tm), (b) accumulation-season snow depth (SDa), and (c) melting-season net shortwave radiation (SWm) across the Mongolian Plateau (MP) during 2000–2022 hydrological years; (df) 23-year trends in Tm, SDa, and SWm, respectively; (gi) sensitivity of De to variations in Tm, SDa, and SWm across the MP.
Remotesensing 17 02221 g008
Figure 9. Linear correlations between snow end date (De) and (a) melting-season temperature (Tm), (b) accumulation-season snow depth (SDa), and (c) melting-season net shortwave radiation (SWm) across the Mongolian Plateau during 2000–2022 hydrological years; (d) contributions of Tm, SDa, and SWm to De changes across the MP over the same period.
Remotesensing 17 02221 g009
Disclaimer/Publisher’s Note: The statements, opinions and data contained in all publications are solely those of the individual author(s) and contributor(s) and not of MDPI and/or the editor(s). MDPI and/or the editor(s) disclaim responsibility for any injury to people or property resulting from any ideas, methods, instructions or products referred to in the content.

