
Exploring the Spatio-Temporal Dynamics and Factors Influencing PM2.5 in China’s Prefecture-Level and Above Cities


Abstract
1. Introduction
2. Materials and Methods
2.1. Data Sources
2.1.1. PM2.5 Satellite-Derived Data
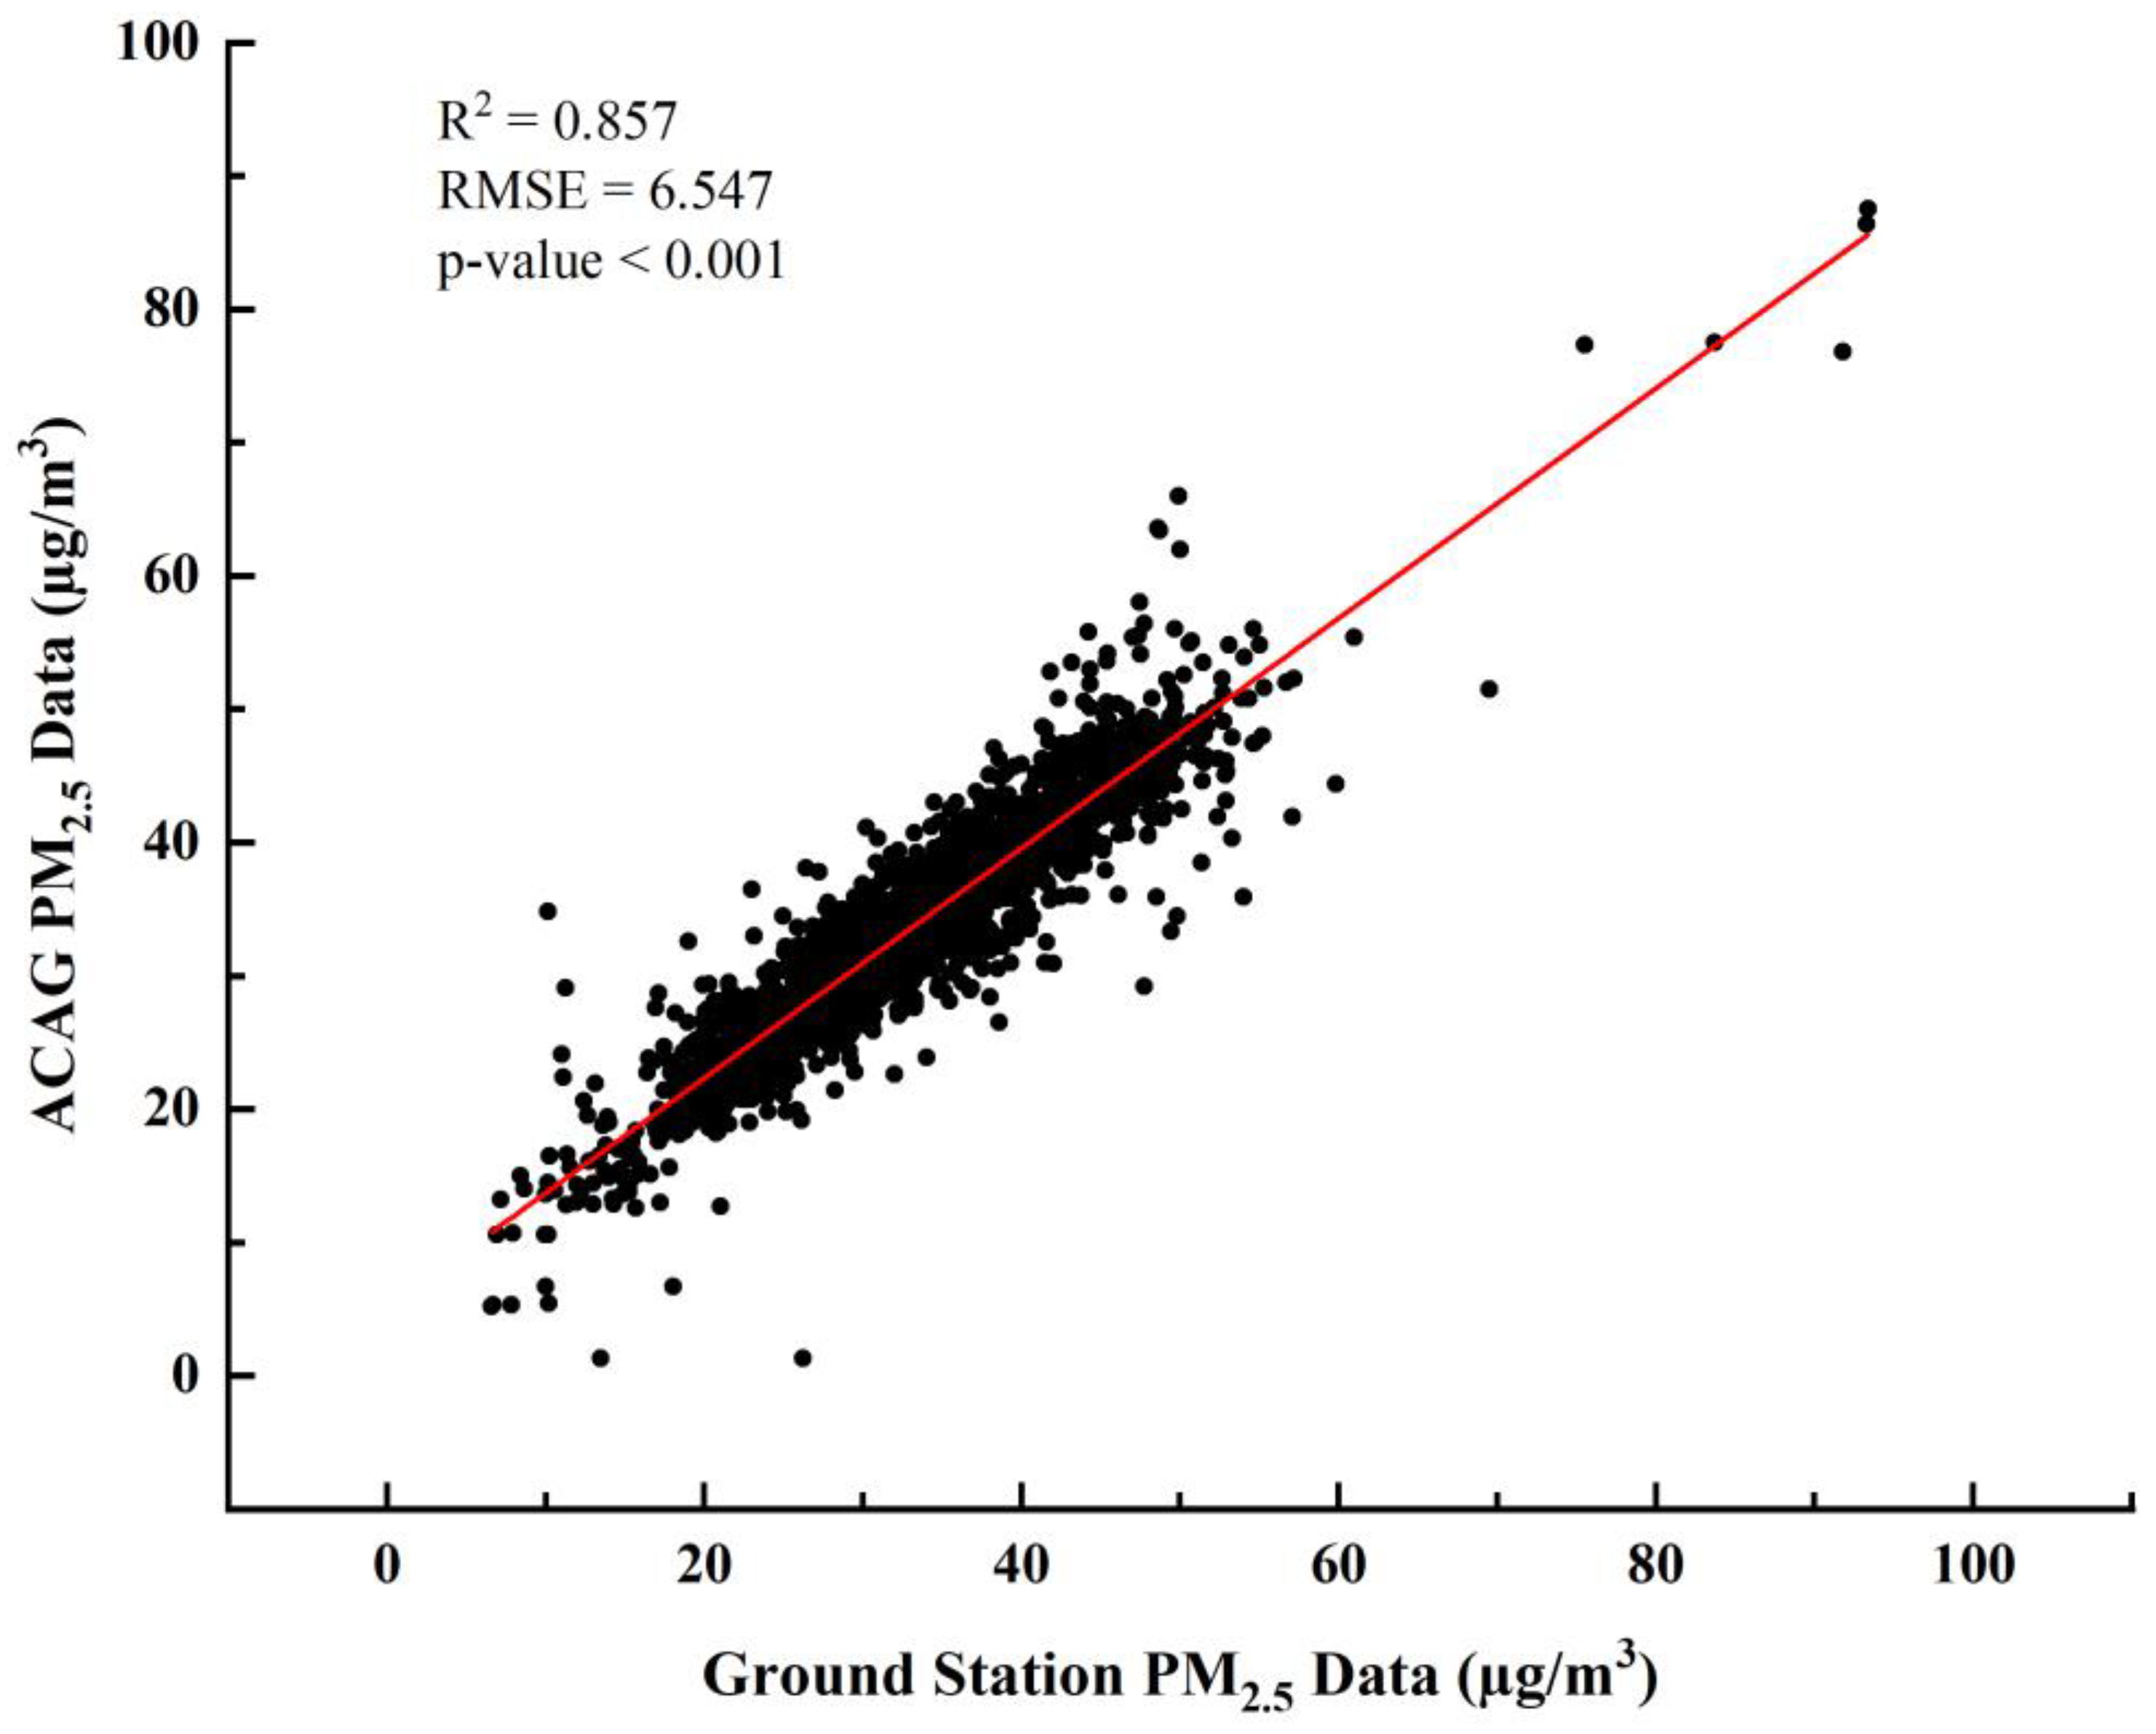
2.1.2. PM2.5 Monitoring Station Data
2.1.3. Natural Environment Data
2.1.4. Socioeconomic Data
2.2. ESTDA
2.2.1. Global Spatial Autocorrelation
2.2.2. Local Indicators of Spatial Association (LISA) Time Path
2.2.3. LISA Spatio-Temporal Transition
2.3. Spatial Weight Matrix
2.3.1. Adjacency Matrix (W1)
2.3.2. Geographical Distance Matrix (W2)
2.3.3. Economic–Geographical Matrix (W3)
2.4. Spatial Econometric Model
2.5. GTWR
3. Results
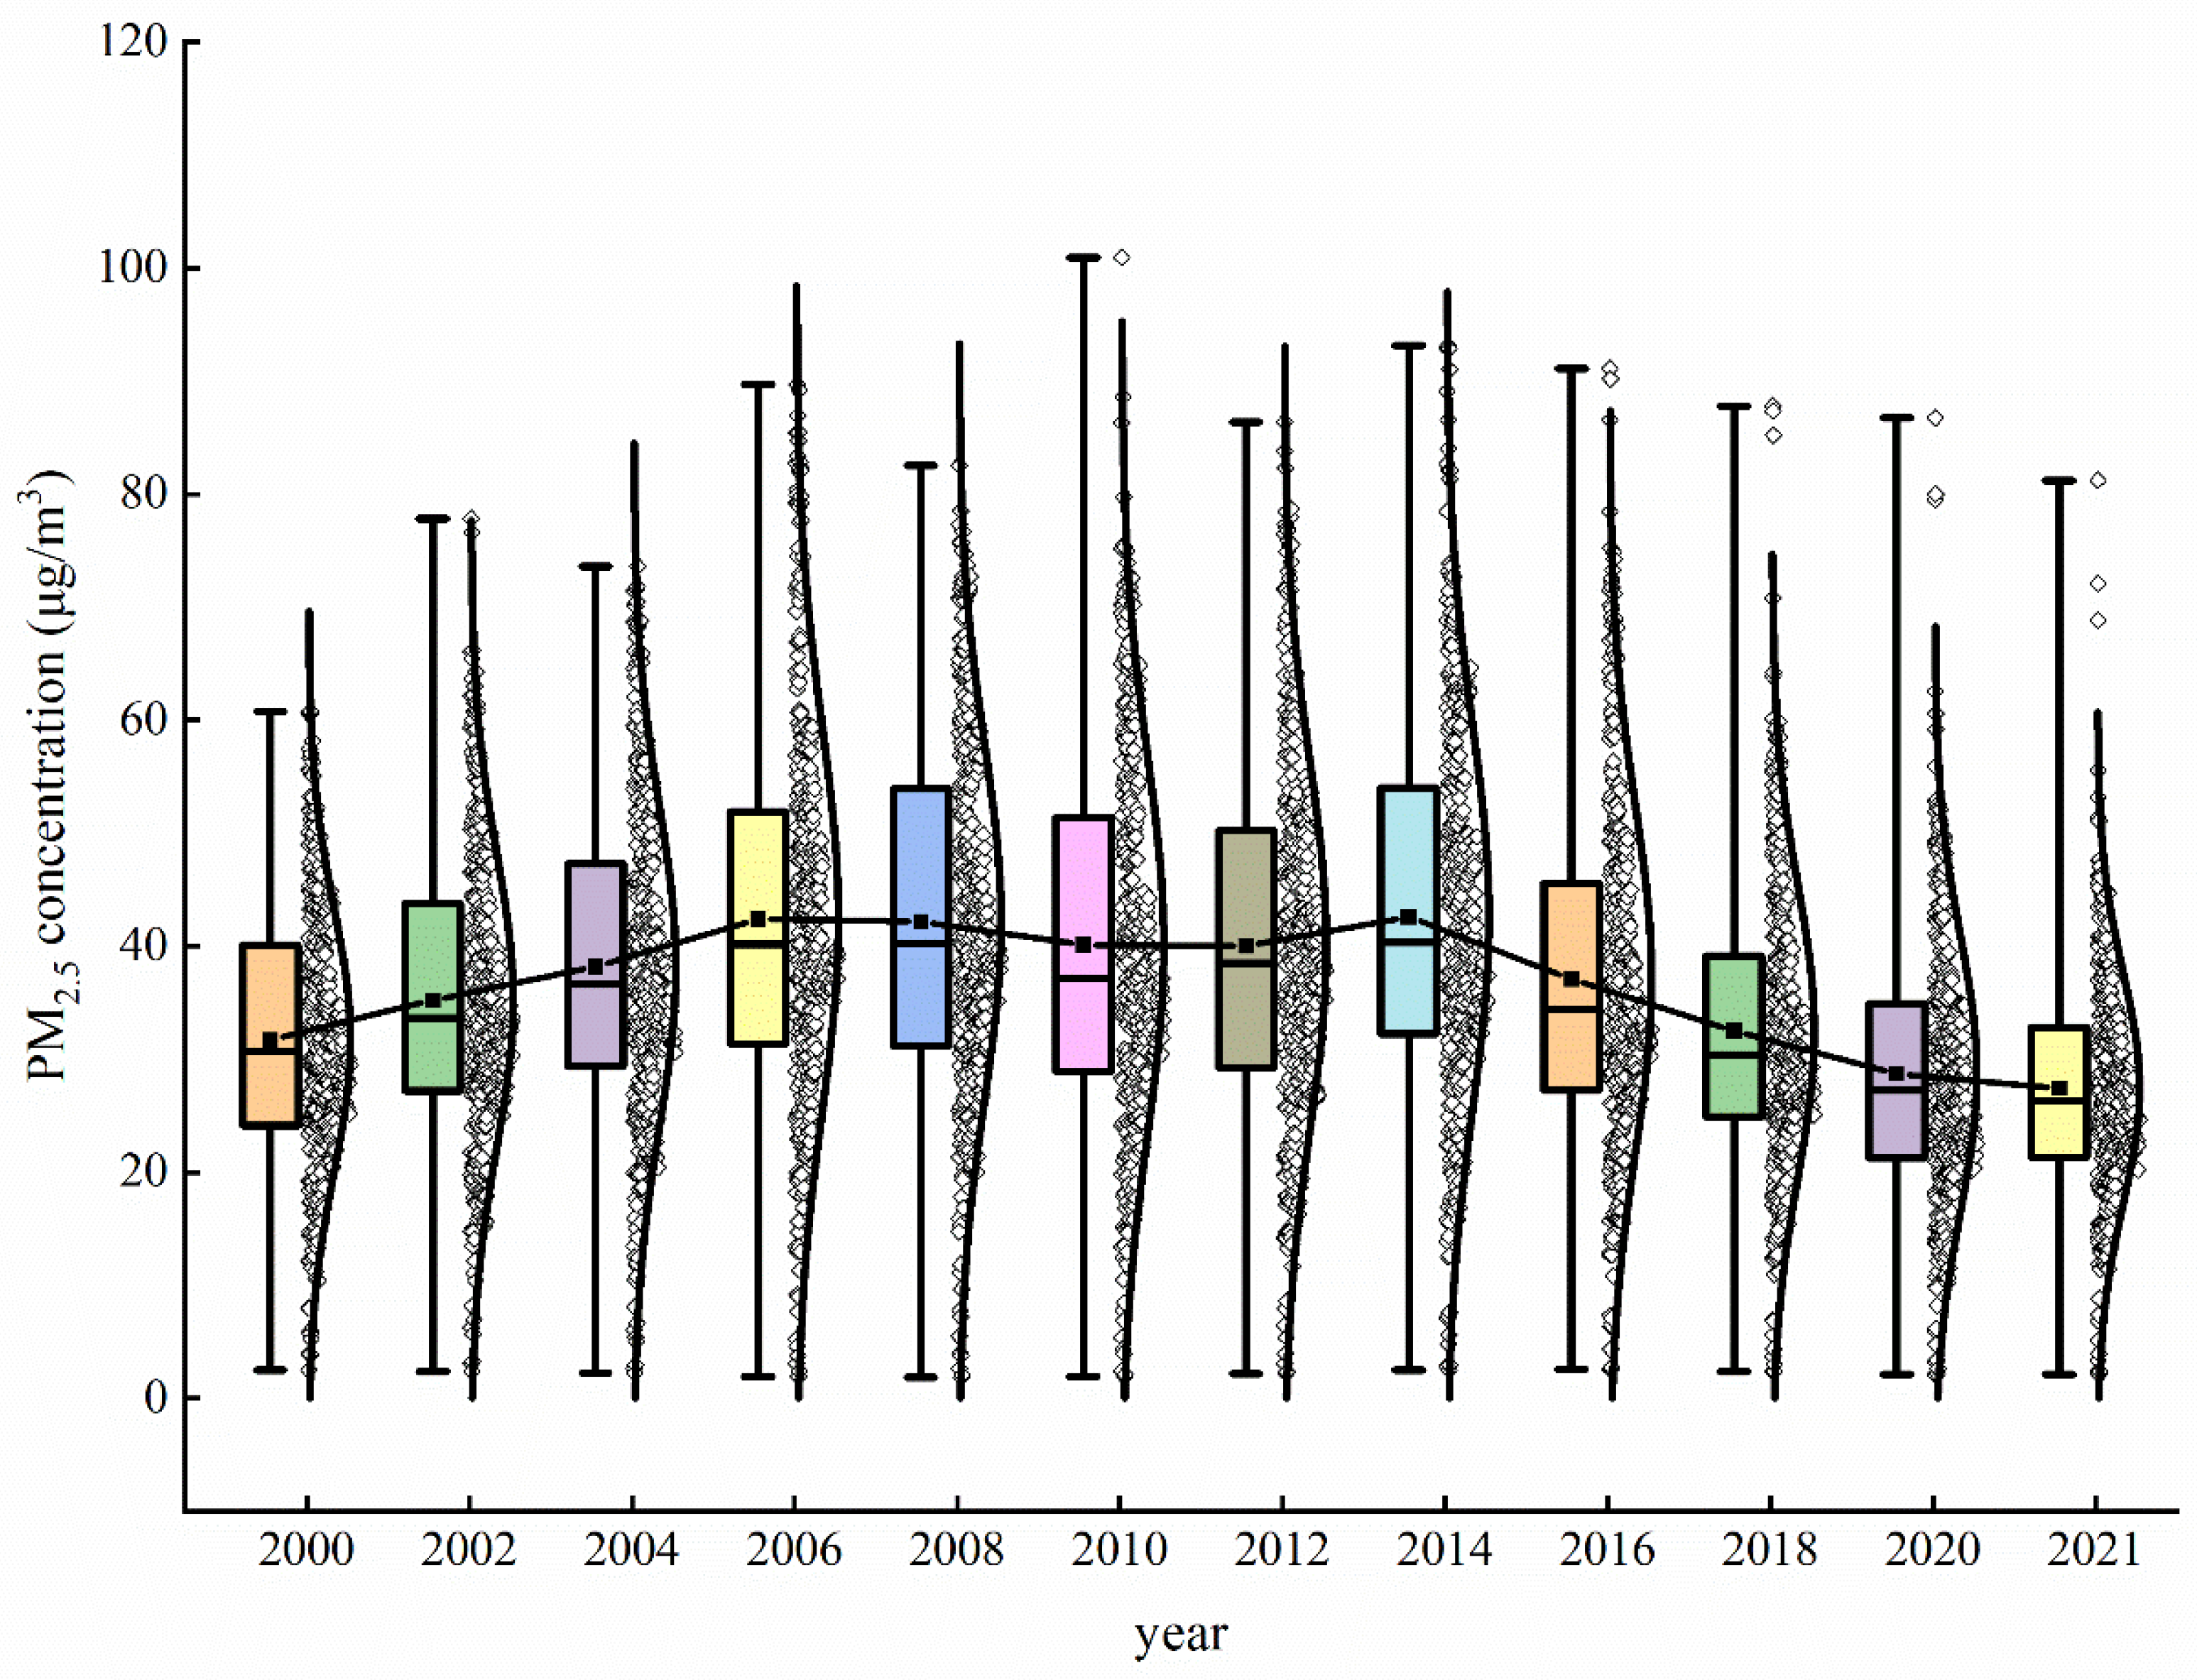
3.1. Temporal Evolution of PM2.5
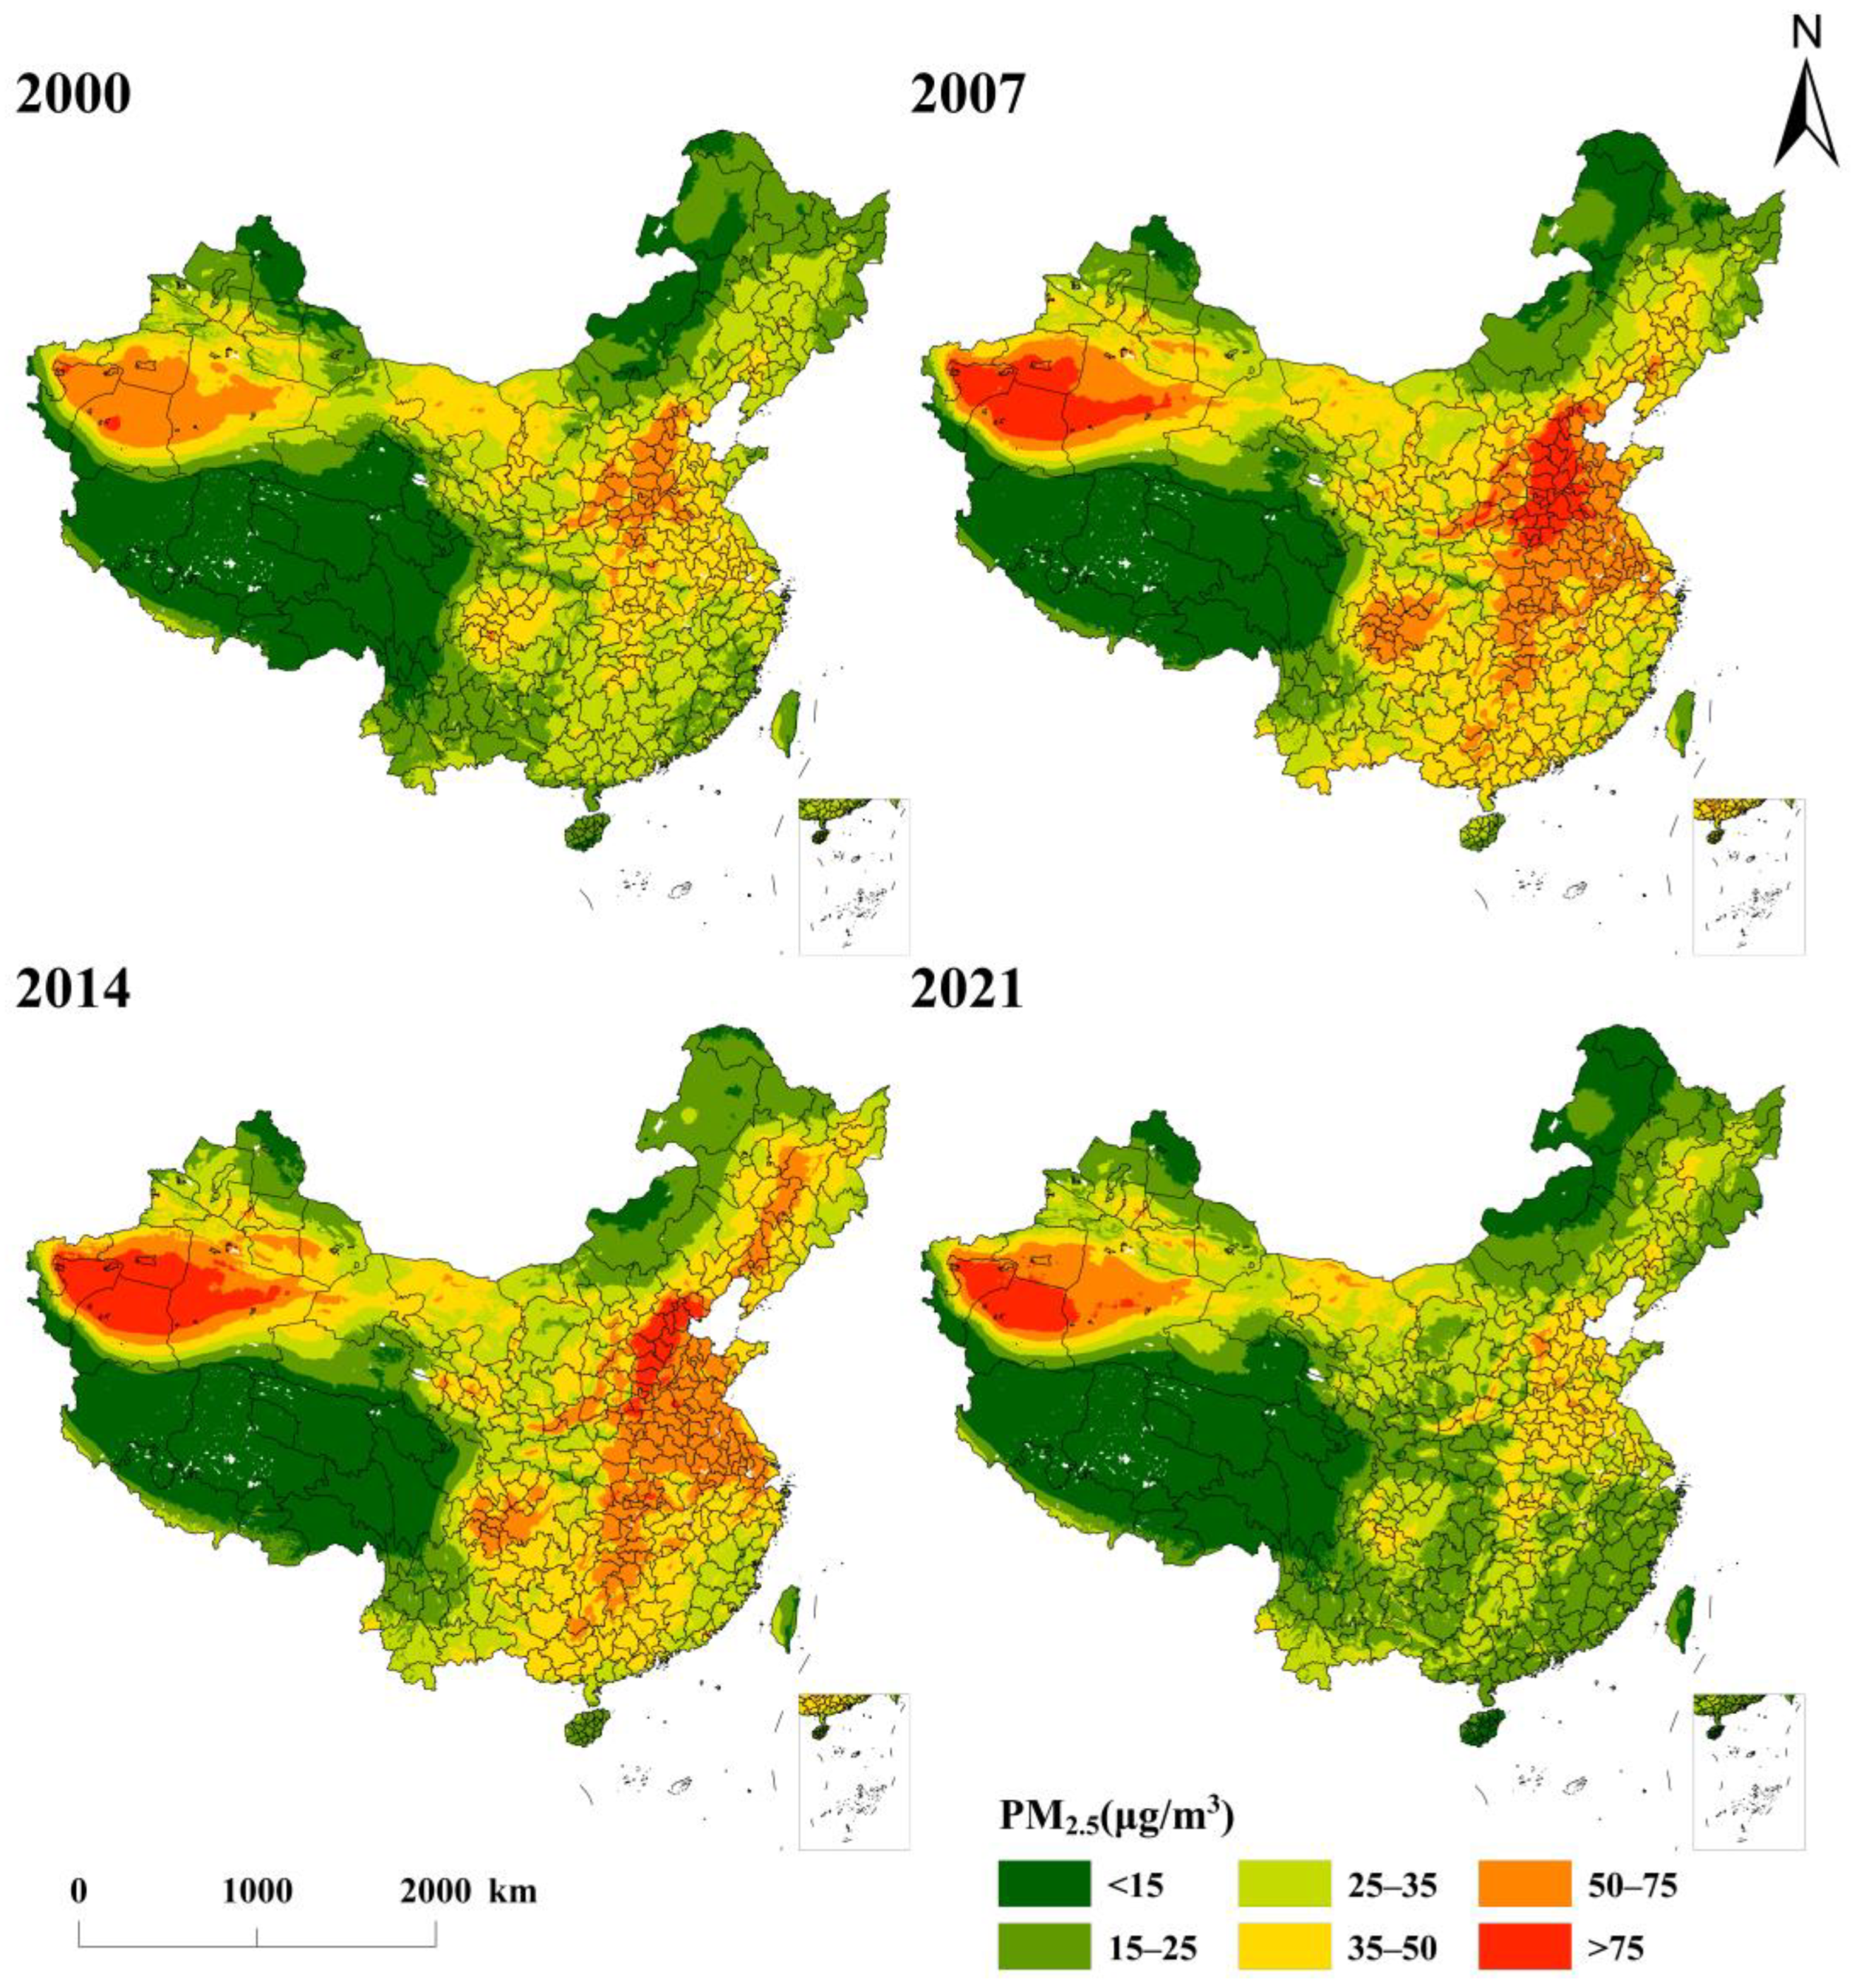
3.2. Spatial Distribution of PM2.5
3.3. Local Spatio-Temporal Dependence of PM2.5
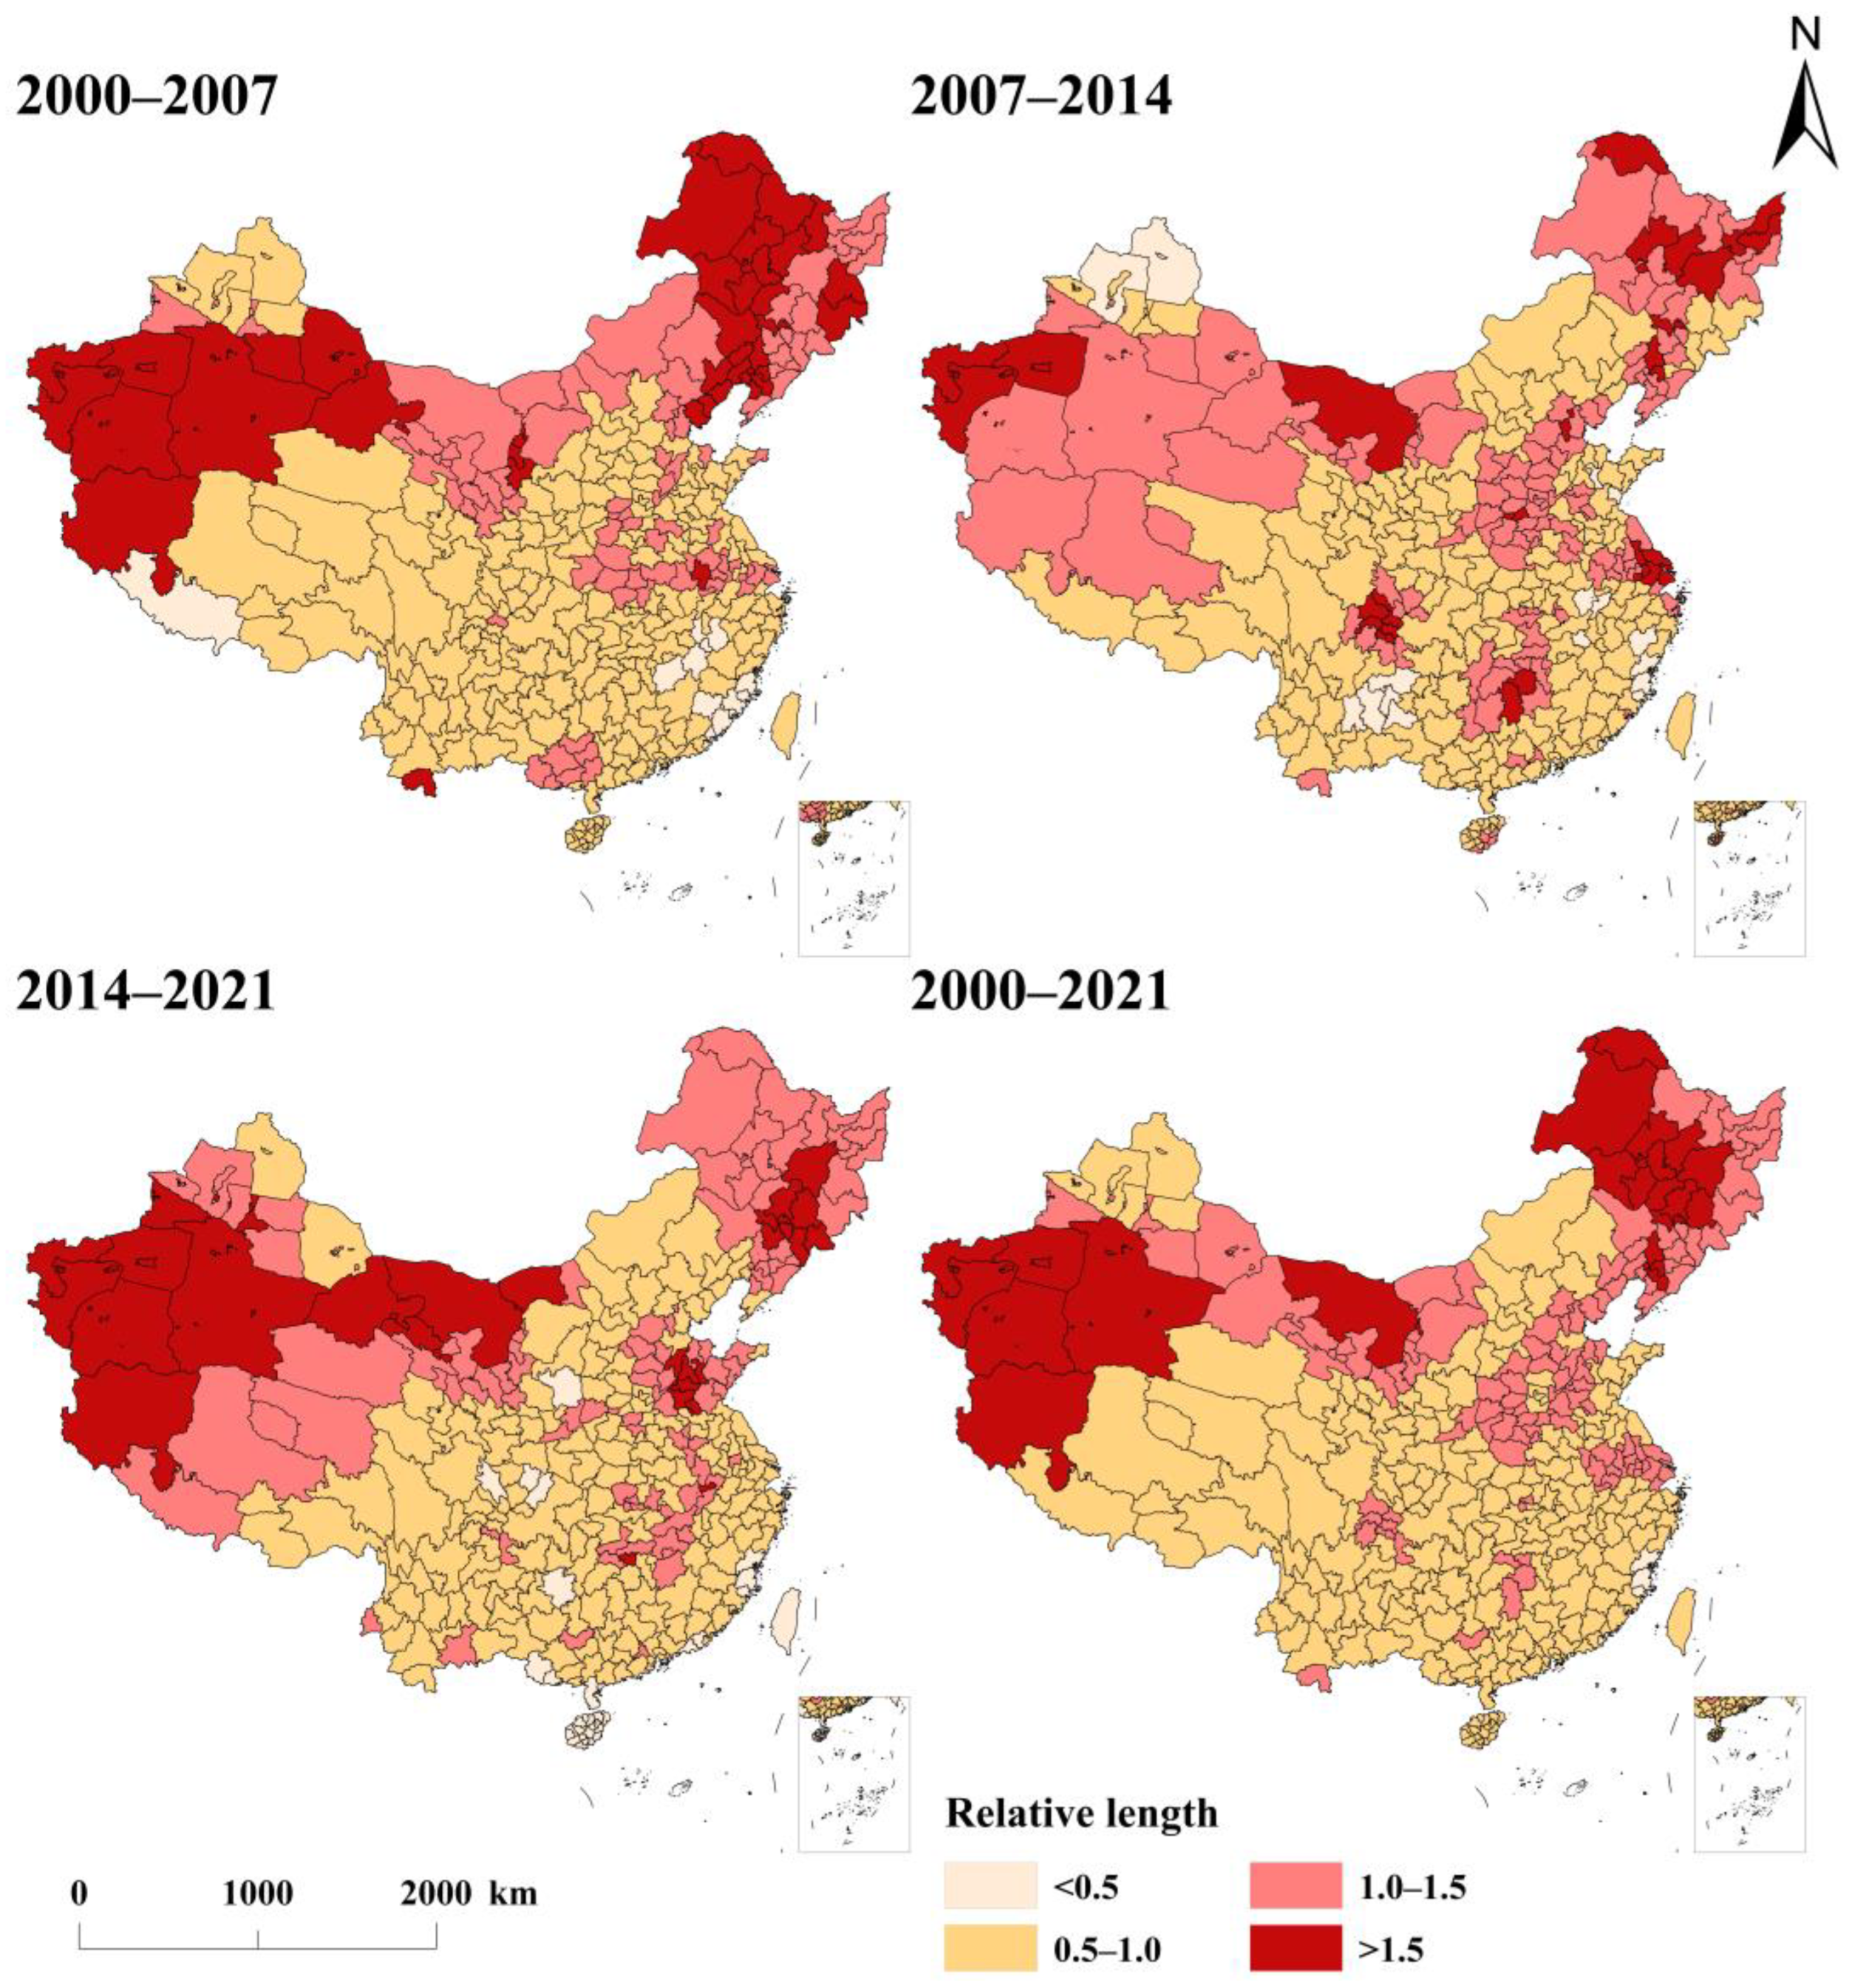
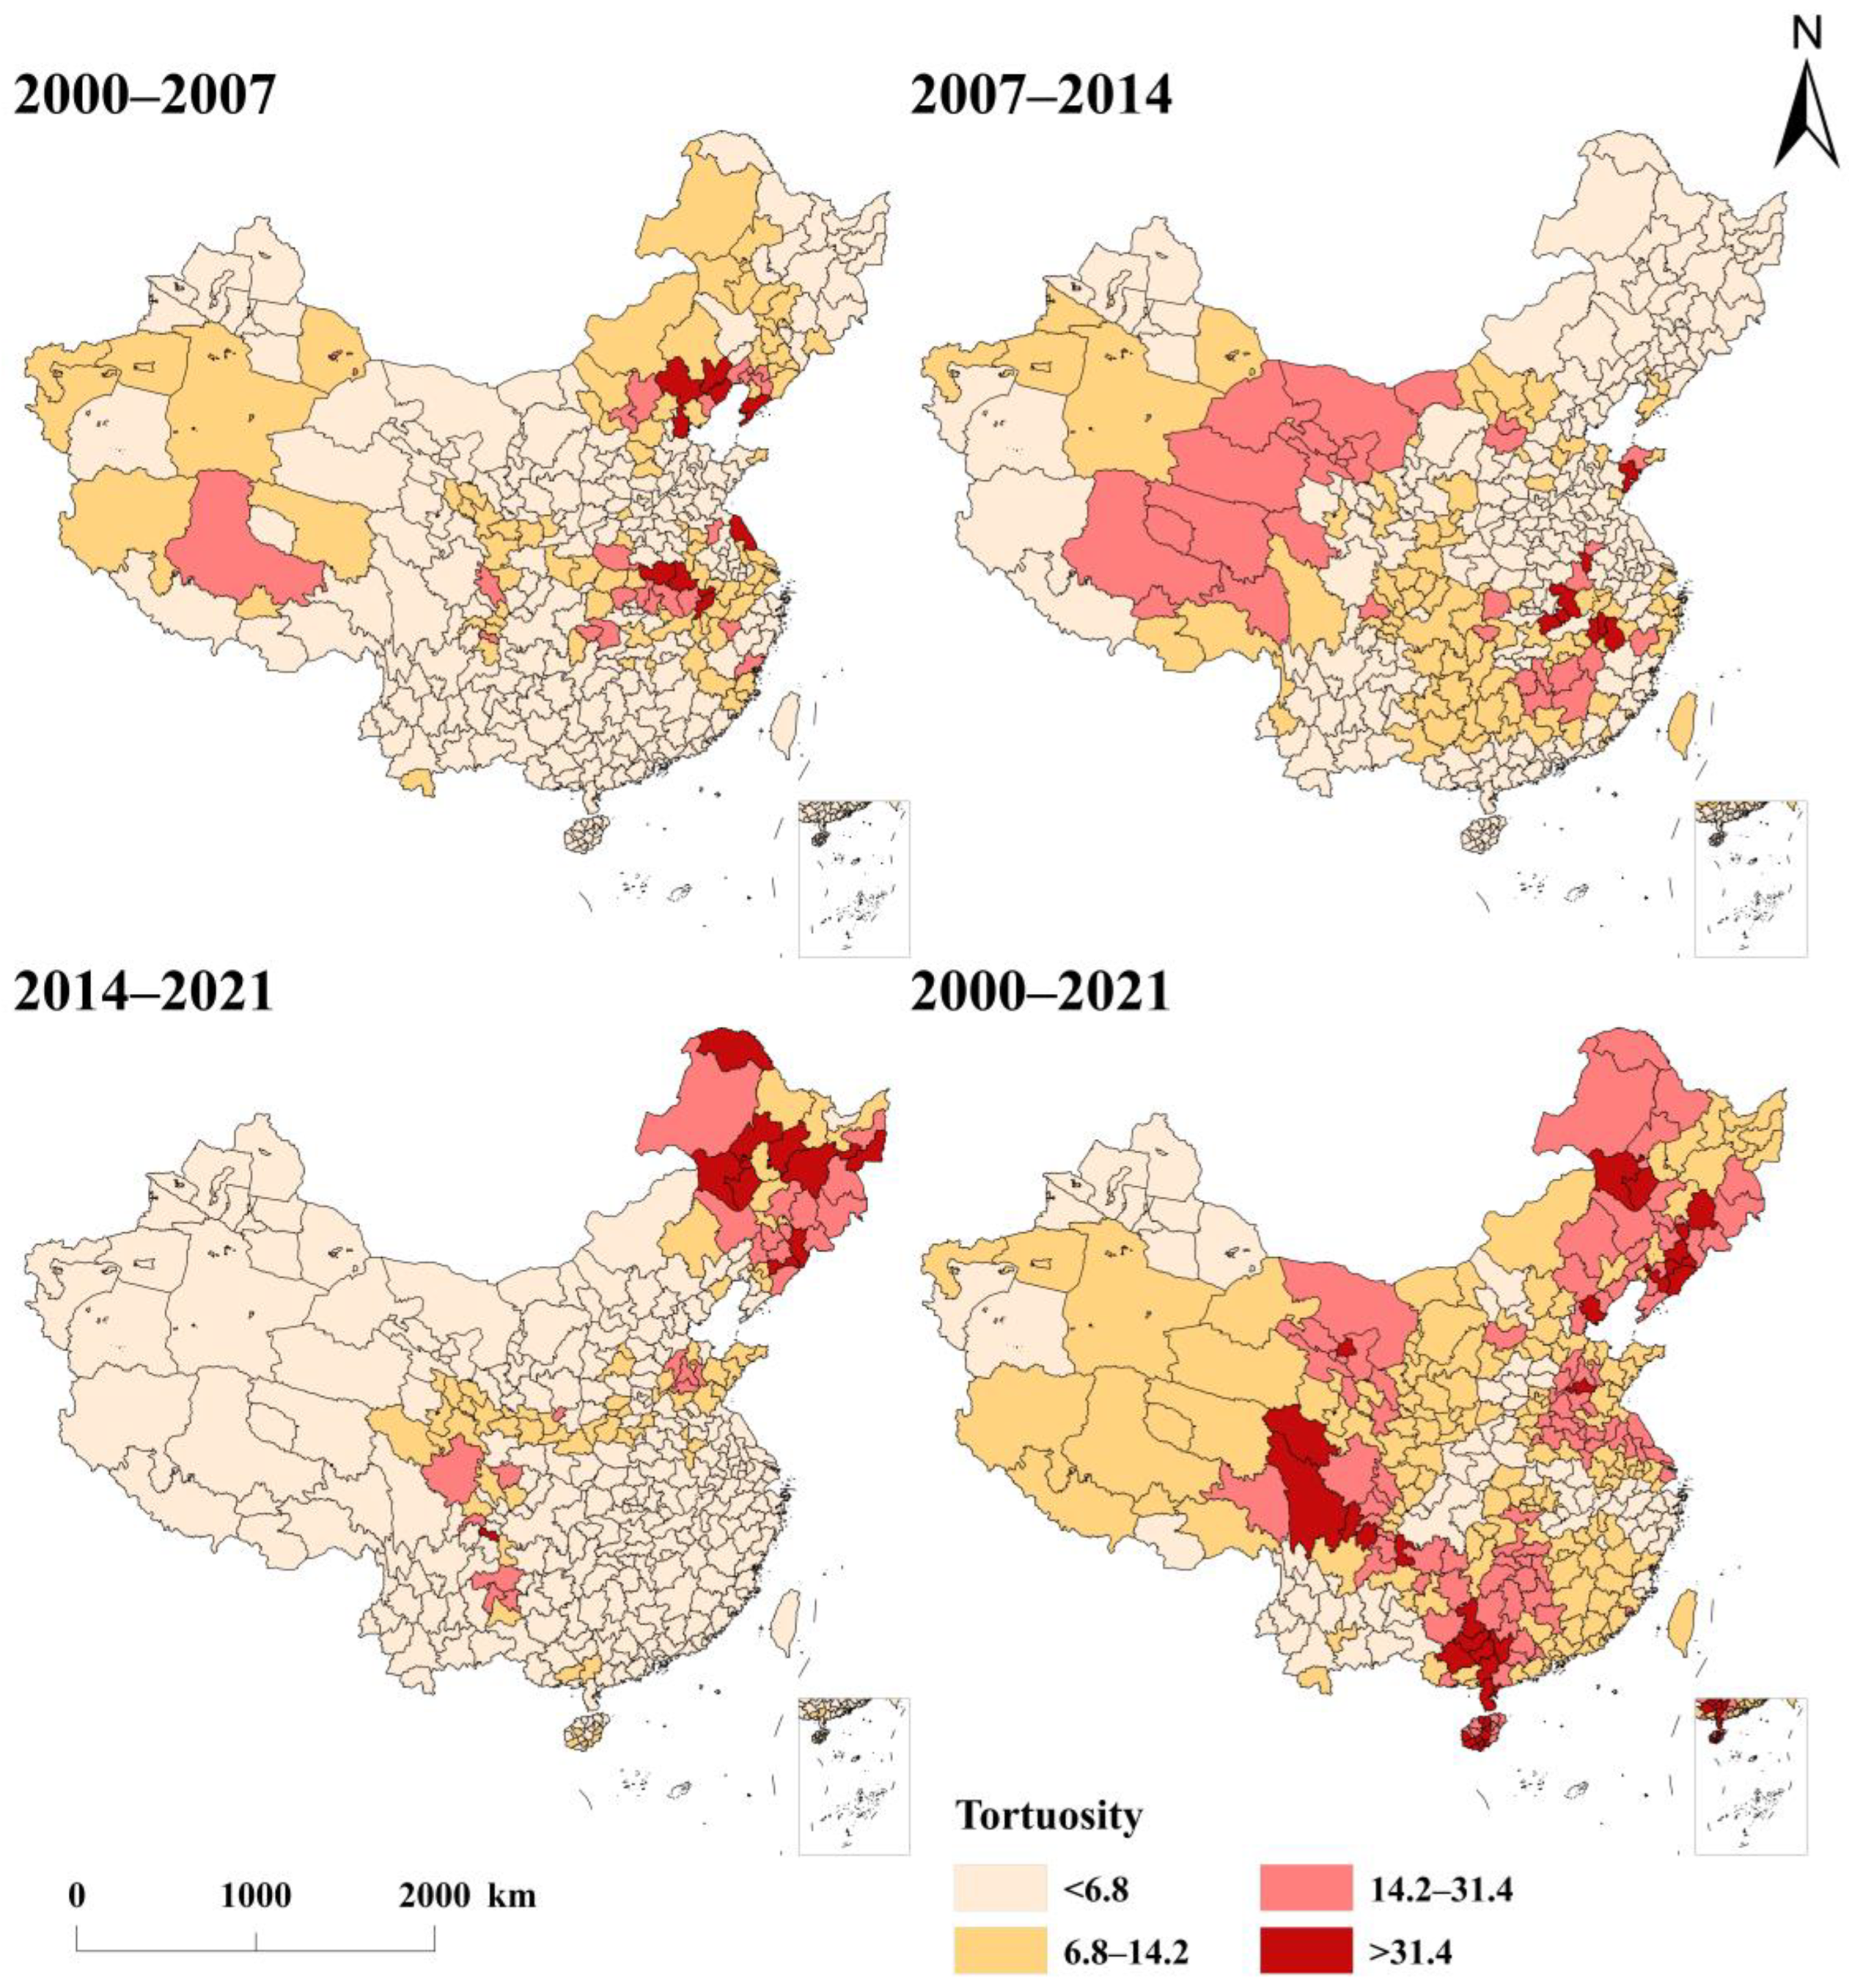
3.3.1. Relative Length and Tortuosity
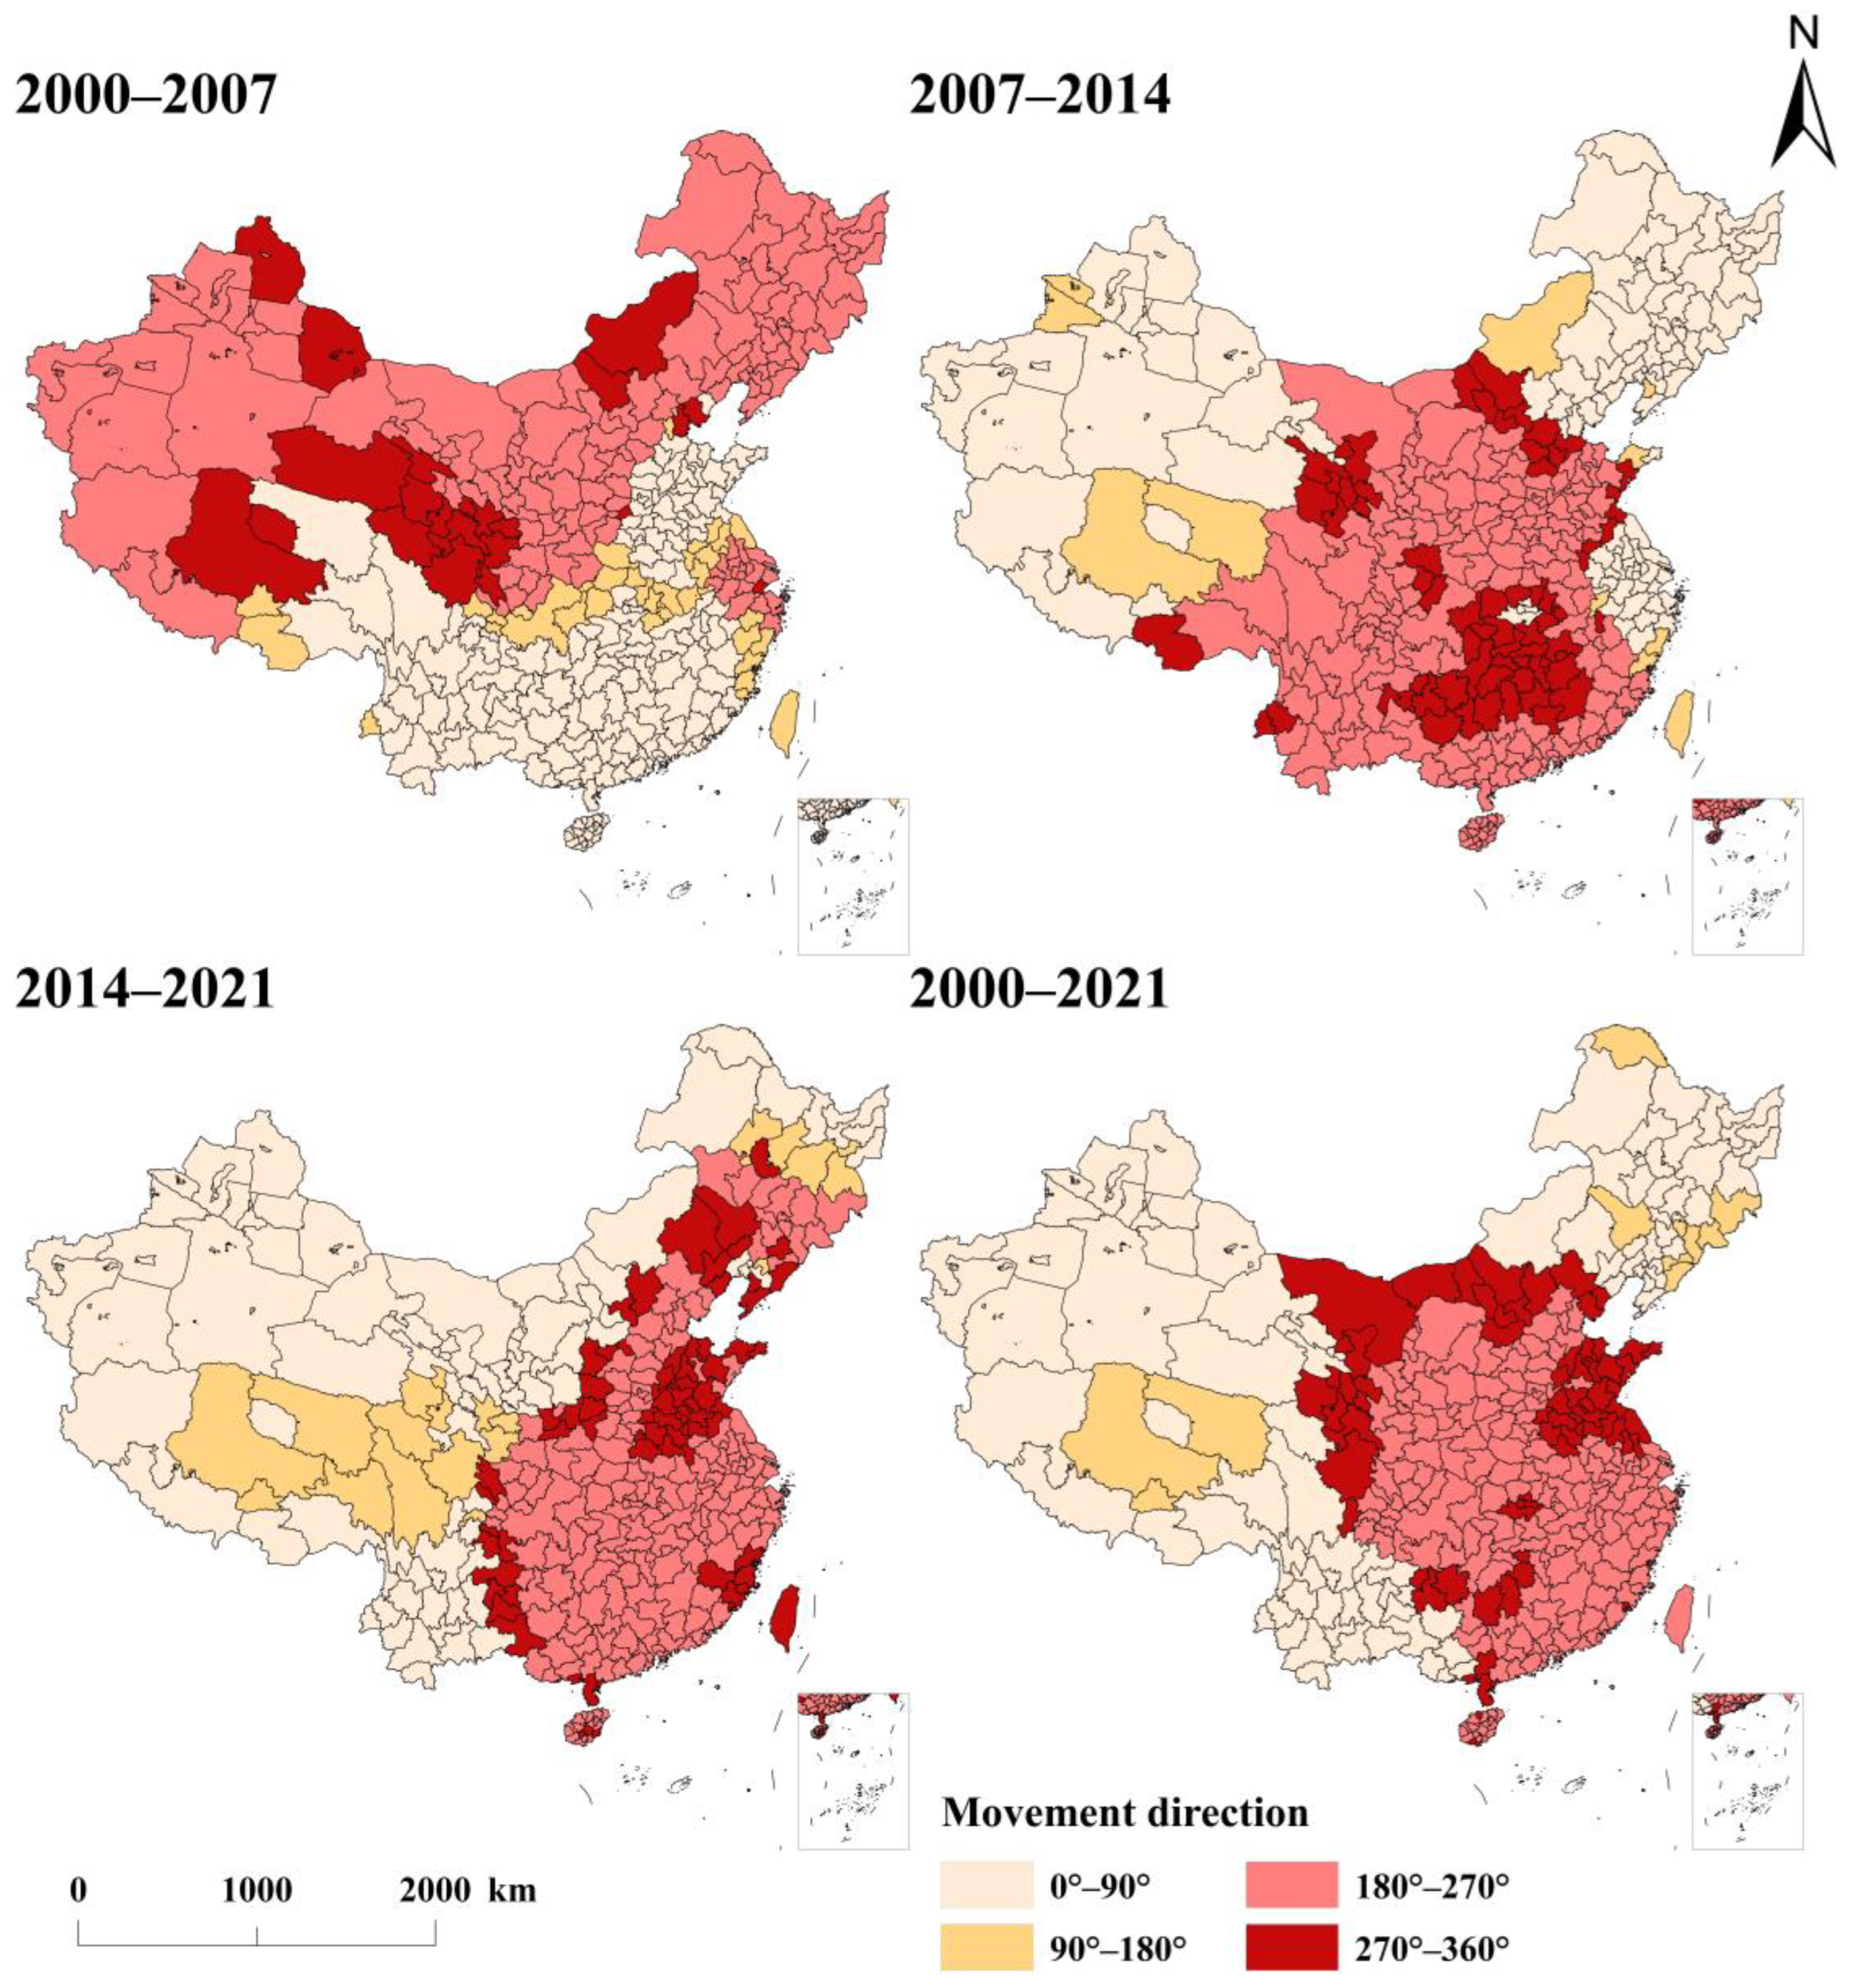
3.3.2. Movement Direction
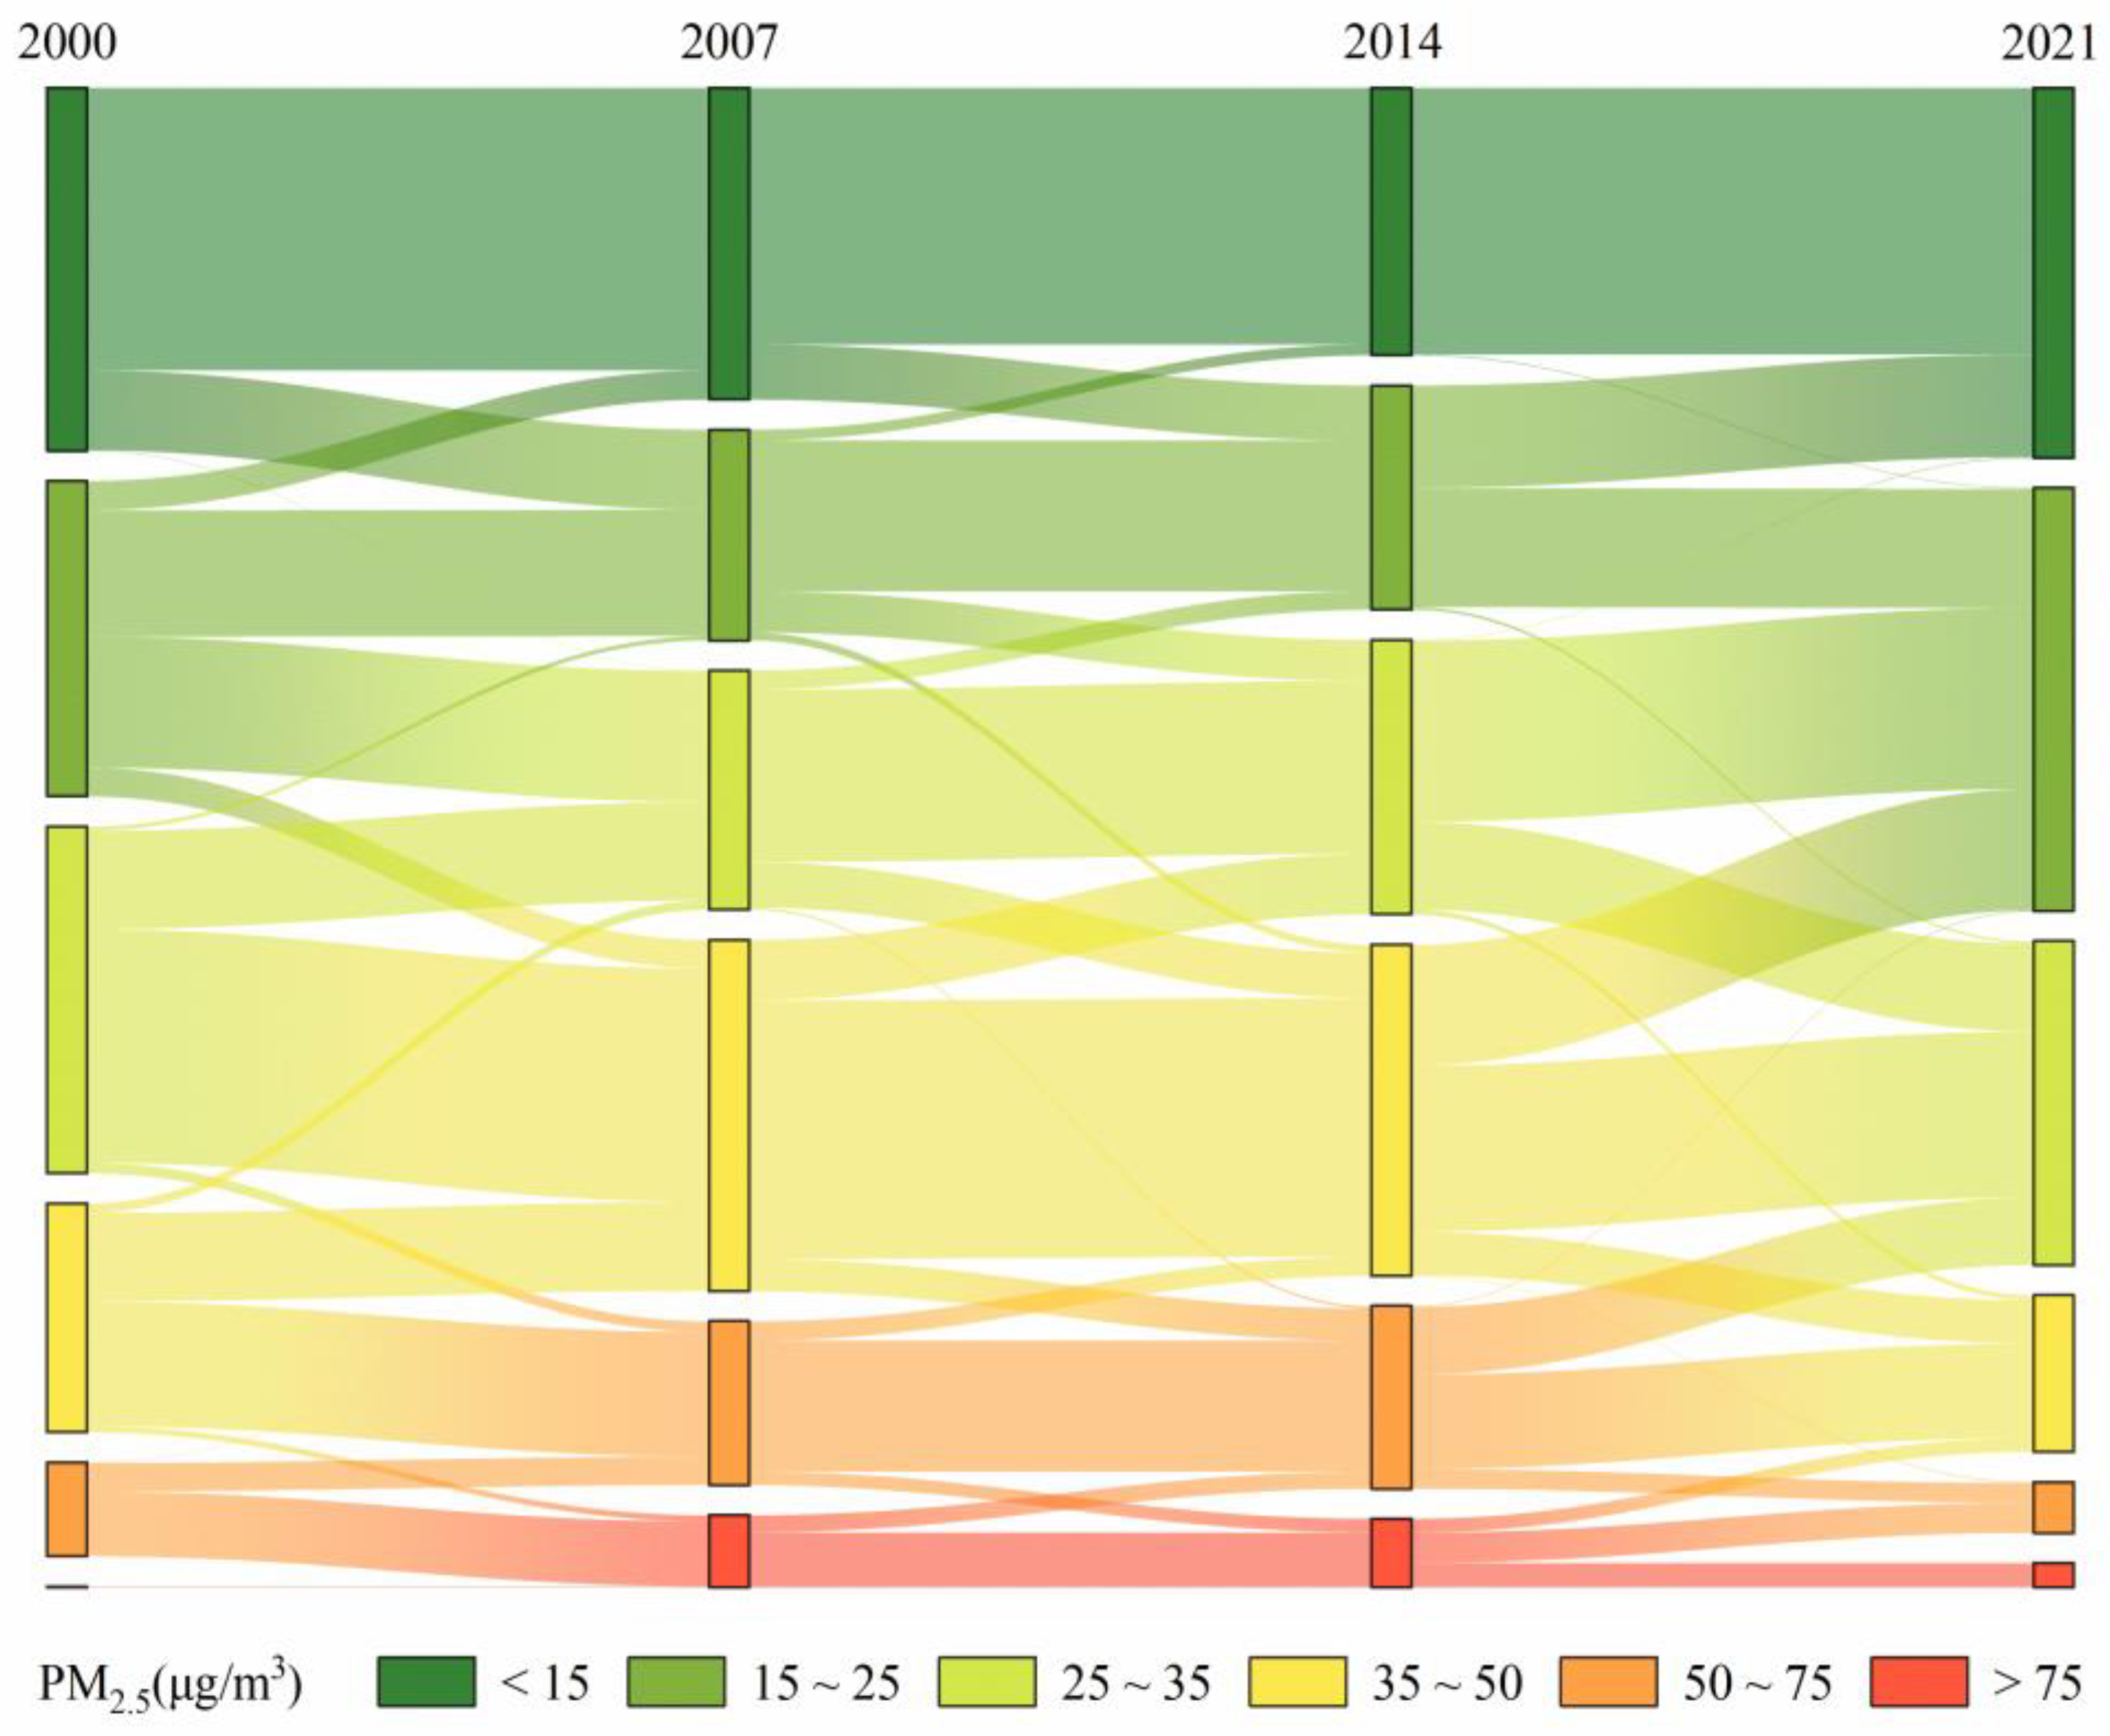
3.4. Spatio-Temporal Transition
3.5. Analysis of Factors Influencing PM2.5
3.5.1. Preprocessing of Independent Variables
3.5.2. Test Results of Model Selection
3.5.3. Estimated Results of SDM
3.5.4. Decomposition of Spatial Effects
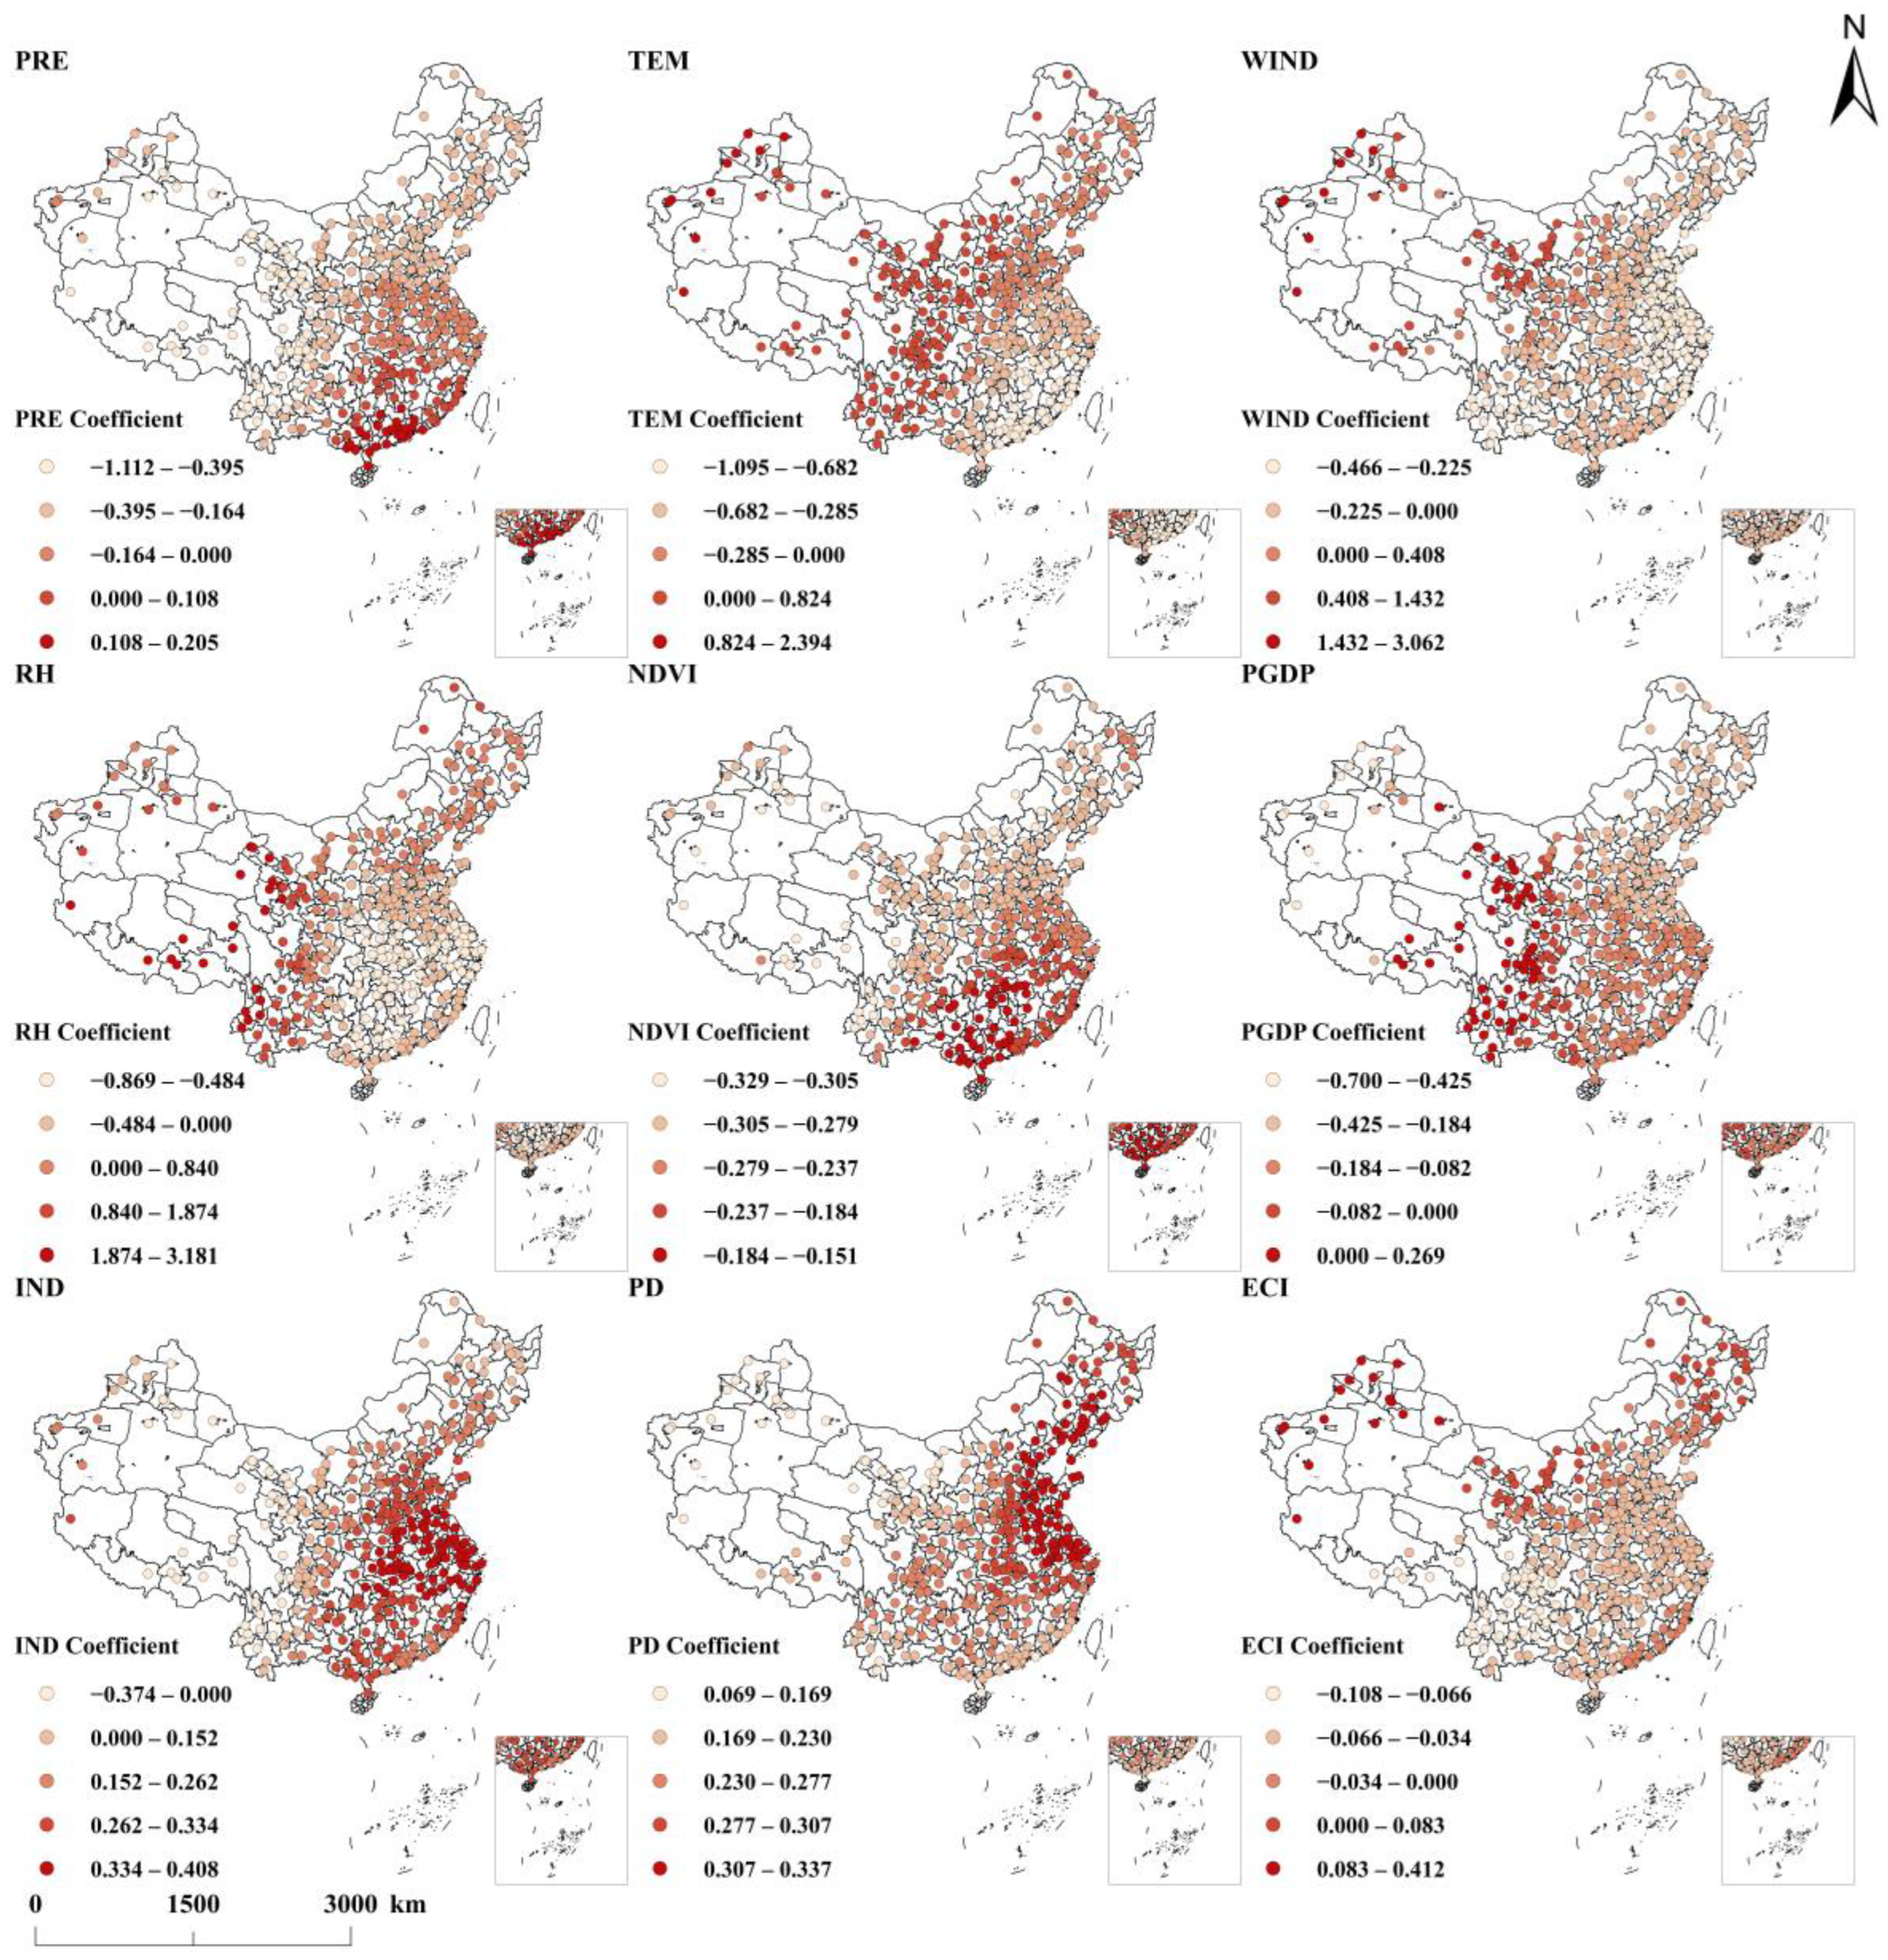
3.5.5. Estimated Results of GTWR
4. Discussion
5. Conclusions and Policy Implications
Supplementary Materials
Author Contributions
Funding
Data Availability Statement
Conflicts of Interest
References
- Geng, G.; Zheng, Y.; Zhang, Q.; Xue, T.; Zhao, H.; Tong, D.; Zheng, B.; Li, M.; Liu, F.; Hong, C.; et al. Drivers of PM2.5 Air Pollution Deaths in China 2002–2017. Nat. Geosci. 2021, 14, 645–650. [Google Scholar] [CrossRef]
- Xia, S.; Liu, X.; Liu, Q.; Zhou, Y.; Yang, Y. Heterogeneity and the Determinants of PM2.5 in the Yangtze River Economic Belt. Sci. Rep. 2022, 12, 4189. [Google Scholar] [CrossRef] [PubMed]
- Ulpiani, G. On the Linkage between Urban Heat Island and Urban Pollution Island: Three-Decade Literature Review towards a Conceptual Framework. Sci. Total Environ. 2021, 751, 141727. [Google Scholar] [CrossRef]
- Liu, Q.; Son, Y.J.; Li, L.; Wood, N.; Senerat, A.M.; Pantelic, J. Healthy Home Interventions: Distribution of PM2.5 Emitted during Cooking in Residential Settings. Build. Environ. 2022, 207, 108448. [Google Scholar] [CrossRef]
- Zaini, N.; Ean, L.W.; Ahmed, A.N.; Abdul Malek, M.; Chow, M.F. PM2.5 Forecasting for an Urban Area Based on Deep Learning and Decomposition Method. Sci. Rep. 2022, 12, 17565. [Google Scholar] [CrossRef]
- Wang, N.; Zhou, L.; Liu, L.; Song, T.; Luo, Q.; Li, Y.; Yang, F. Chemical Characteristics and Formation Mechanisms of PM2.5 during Wintertime in Two Cities with Different Industrial Structures in the Sichuan Basin, China. J. Clean. Prod. 2024, 462, 142618. [Google Scholar] [CrossRef]
- Huang, R.-J.; Zhang, Y.; Bozzetti, C.; Ho, K.-F.; Cao, J.-J.; Han, Y.; Daellenbach, K.R.; Slowik, J.G.; Platt, S.M.; Canonaco, F.; et al. High Secondary Aerosol Contribution to Particulate Pollution during Haze Events in China. Nature 2014, 514, 218–222. [Google Scholar] [CrossRef]
- Yang, F.; Yu, J.; Zhang, C.; Li, L.; Lei, Y.; Wu, S.; Wang, Y.; Zhang, X. Spatio-Temporal Differentiation Characteristics and the Influencing Factors of PM2.5 Emissions from Coal Consumption in Central Plains Urban Agglomeration. Sci. Total Environ. 2024, 945, 173778. [Google Scholar] [CrossRef] [PubMed]
- Sui, X.; Qi, K.; Nie, Y.; Ding, N.; Shi, X.; Wu, X.; Zhang, Q.; Wang, W. Air Quality and Public Health Risk Assessment: A Case Study in a Typical Polluted City, North China. Urban Clim. 2021, 36, 100796. [Google Scholar] [CrossRef]
- Sun, X.; Zhao, T.; Xu, X.; Bai, Y.; Zhao, Y.; Ma, X.; Shu, Z.; Hu, W. Identifying the Impacts of Warming Anomalies in the Arctic Region and the Tibetan Plateau on PM2.5 Pollution and Regional Transport over China. Atmos. Res. 2023, 294, 106966. [Google Scholar] [CrossRef]
- Zhou, W.; Wu, X.; Ding, S.; Ji, X.; Pan, W. Predictions and Mitigation Strategies of PM2.5 Concentration in the Yangtze River Delta of China Based on a Novel Nonlinear Seasonal Grey Model. Environ. Pollut. 2021, 276, 116614. [Google Scholar] [CrossRef]
- Wang, X.; Zhang, Q.; Chang, W.-Y. Does Economic Agglomeration Affect Haze Pollution? Evidence from China’s Yellow River Basin. J. Clean. Prod. 2022, 335, 130271. [Google Scholar] [CrossRef]
- Zhang, Y.-L.; Cao, F. Fine Particulate Matter (PM2.5) in China at a City Level. Sci. Rep. 2015, 5, 14884. [Google Scholar] [CrossRef] [PubMed]
- World Health Organization. WHO Global Air Quality Guidelines: Particulate Matter (PM2.5 and PM10), Ozone, Nitrogen Dioxide, Sulfur Dioxide and Carbon Monoxide; World Health Organization: Geneva, Switzerland, 2021. [Google Scholar]
- Greenstone, M.; Hasenkopf, C.; Lee, K. Air Quality Life Index (AQLI): Annual Update; Energy Policy Institute at the University of Chicago: Chicago, IL, USA, 2022. [Google Scholar]
- Wang, S.; Li, G.; Gong, Z.; Du, L.; Zhou, Q.; Meng, X.; Xie, S.; Zhou, L. Spatial Distribution, Seasonal Variation and Regionalization of PM2.5 Concentrations in China. Sci. China Chem. 2015, 58, 1435–1443. [Google Scholar] [CrossRef]
- van Donkelaar, A.; Martin, R.V.; Li, C.; Burnett, R.T. Regional Estimates of Chemical Composition of Fine Particulate Matter Using a Combined Geoscience-Statistical Method with Information from Satellites, Models, and Monitors. Environ. Sci. Technol. 2019, 53, 2595–2611. [Google Scholar] [CrossRef] [PubMed]
- Hammer, M.S.; van Donkelaar, A.; Li, C.; Lyapustin, A.; Sayer, A.M.; Hsu, N.C.; Levy, R.C.; Garay, M.J.; Kalashnikova, O.V.; Kahn, R.A.; et al. Global Estimates and Long-Term Trends of Fine Particulate Matter Concentrations (1998–2018). Environ. Sci. Technol. 2020, 54, 7879–7890. [Google Scholar] [CrossRef] [PubMed]
- Li, K.; Li, C.; Hu, Y.; Xiong, Z.; Wang, Y. Quantitative Estimation of the PM2.5 Removal Capacity and Influencing Factors of Urban Green Infrastructure. Sci. Total Environ. 2023, 867, 161476. [Google Scholar] [CrossRef]
- Wu, H.; Guo, B.; Guo, T.; Pei, L.; Jing, P.; Wang, Y.; Ma, X.; Bai, H.; Wang, Z.; Xie, T.; et al. A Study on Identifying Synergistic Prevention and Control Regions for PM2.5 and O3 and Exploring Their Spatiotemporal Dynamic in China. Environ. Pollut. 2024, 341, 122880. [Google Scholar] [CrossRef]
- Pongpiachan, S.; Kositanont, C.; Palakun, J.; Liu, S.; Ho, K.F.; Cao, J. Effects of Day-of-Week Trends and Vehicle Types on PM2.5-Bounded Carbonaceous Compositions. Sci. Total Environ. 2015, 532, 484–494. [Google Scholar] [CrossRef]
- Liu, H.; Gong, Y.; Li, S. Nonlinear Impact and Spatial Spillover Effect of New Urbanization on PM2.5 from a Multi-Dimensional Perspective. Ecol. Indic. 2024, 166, 112360. [Google Scholar] [CrossRef]
- Yan, D.; Kong, Y.; Jiang, P.; Huang, R.; Ye, B. How Do Socioeconomic Factors Influence Urban PM2.5 Pollution in China? Empirical Analysis from the Perspective of Spatiotemporal Disequilibrium. Sci. Total Environ. 2021, 761, 143266. [Google Scholar] [CrossRef] [PubMed]
- Zhu, W.; Wang, M.; Zhang, B. The Effects of Urbanization on PM2.5 Concentrations in China’s Yangtze River Economic Belt: New Evidence from Spatial Econometric Analysis. J. Clean. Prod. 2019, 239, 118065. [Google Scholar] [CrossRef]
- Rey, S.J.; Janikas, M.V. STARS: Space–Time Analysis of Regional Systems. Geogr. Anal. 2006, 38, 67–86. [Google Scholar] [CrossRef]
- Rey, S.J.; Murray, A.T.; Anselin, L. Visualizing Regional Income Distribution Dynamics. Lett. Spat. Resour. Sci. 2011, 4, 81–90. [Google Scholar] [CrossRef]
- Pateraki, S.; Asimakopoulos, D.N.; Flocas, H.A.; Maggos, T.; Vasilakos, C. The Role of Meteorology on Different Sized Aerosol Fractions (PM10, PM2.5, PM2.5–10). Sci. Total Environ. 2012, 419, 124–135. [Google Scholar] [CrossRef] [PubMed]
- He, J.; Gong, S.; Yu, Y.; Yu, L.; Wu, L.; Mao, H.; Song, C.; Zhao, S.; Liu, H.; Li, X.; et al. Air Pollution Characteristics and Their Relation to Meteorological Conditions during 2014–2015 in Major Chinese Cities. Environ. Pollut. 2017, 223, 484–496. [Google Scholar] [CrossRef]
- Earl, N.; Dorling, S.; Starks, M.; Finch, R. Subsynoptic-Scale Features Associated with Extreme Surface Gusts in UK Extratropical Cyclone Events. Geophys. Res. Lett. 2017, 44, 3932–3940. [Google Scholar] [CrossRef]
- Lin, B.; Zhu, J. Changes in Urban Air Quality during Urbanization in China. J. Clean. Prod. 2018, 188, 312–321. [Google Scholar] [CrossRef]
- He, L.; Duan, Y.; Zhang, Y.; Yu, Q.; Huo, J.; Chen, J.; Cui, H.; Li, Y.; Ma, W. Effects of VOC Emissions from Chemical Industrial Parks on Regional O3-PM2.5 Compound Pollution in the Yangtze River Delta. Sci. Total Environ. 2024, 906, 167503. [Google Scholar] [CrossRef]
- Wu, W.; Zhang, M.; Ding, Y. Exploring the Effect of Economic and Environment Factors on PM2.5 Concentration: A Case Study of the Beijing-Tianjin-Hebei Region. J. Environ. Manag. 2020, 268, 110703. [Google Scholar] [CrossRef]
- Han, S.; Sun, B.; Zhang, T. Mono- and Polycentric Urban Spatial Structure and PM2.5 Concentrations: Regarding the Dependence on Population Density. Habitat Int. 2020, 104, 102257. [Google Scholar] [CrossRef]
- Yu, C.; Deng, Y.; Qin, Z.; Yang, C.; Yuan, Q. Traffic Volume and Road Network Structure: Revealing Transportation-Related Factors on PM2.5 Concentrations. Transp. Res. Part Transp. Environ. 2023, 124, 103935. [Google Scholar] [CrossRef]
- Xue, W.; Zhang, J.; Zhong, C.; Li, X.; Wei, J. Spatiotemporal PM2.5 Variations and Its Response to the Industrial Structure from 2000 to 2018 in the Beijing-Tianjin-Hebei Region. J. Clean. Prod. 2021, 279, 123742. [Google Scholar] [CrossRef]
- Tian, Y.; Zhang, Y.; Zhang, T.; Zhu, Y. Co-Agglomeration, Technological Innovation and Haze Pollution: An Empirical Research Based on the Middle Reaches of the Yangtze River Urban Agglomeration. Ecol. Indic. 2024, 158, 111492. [Google Scholar] [CrossRef]
- Jia, W.; Li, L.; Zhu, L.; Lei, Y.; Wu, S.; Dong, Z. The Synergistic Effects of PM2.5 and CO2 from China’s Energy Consumption. Sci. Total Environ. 2024, 908, 168121. [Google Scholar] [CrossRef]
- An, Z.; Huang, R.-J.; Zhang, R.; Tie, X.; Li, G.; Cao, J.; Zhou, W.; Shi, Z.; Han, Y.; Gu, Z.; et al. Severe Haze in Northern China: A Synergy of Anthropogenic Emissions and Atmospheric Processes. Proc. Natl. Acad. Sci. USA 2019, 116, 8657–8666. [Google Scholar] [CrossRef]
- Xu, B.; Lin, B. What Cause Large Regional Differences in PM2.5 Pollutions in China? Evidence from Quantile Regression Model. J. Clean. Prod. 2018, 174, 447–461. [Google Scholar] [CrossRef]
- Wang, W.; Chen, C.; Liu, D.; Wang, M.; Han, Q.; Zhang, X.; Feng, X.; Sun, A.; Mao, P.; Xiong, Q.; et al. Health Risk Assessment of PM2.5 Heavy Metals in County Units of Northern China Based on Monte Carlo Simulation and APCS-MLR. Sci. Total Environ. 2022, 843, 156777. [Google Scholar] [CrossRef]
- Chen, X.; Li, F.; Zhang, J.; Zhou, W.; Wang, X.; Fu, H. Spatiotemporal Mapping and Multiple Driving Forces Identifying of PM2.5 Variation and Its Joint Management Strategies across China. J. Clean. Prod. 2020, 250, 119534. [Google Scholar] [CrossRef]
- Chen, J.; Gao, M.; Li, D.; Li, L.; Song, M.; Xie, Q. Changes in PM2.5 Emissions in China: An Extended Chain and Nested Refined Laspeyres Index Decomposition Analysis. J. Clean. Prod. 2021, 294, 126248. [Google Scholar] [CrossRef]
- Huang, B.; Wu, B.; Barry, M. Geographically and Temporally Weighted Regression for Modeling Spatio-Temporal Variation in House Prices. Int. J. Geogr. Inf. Sci. 2010, 24, 383–401. [Google Scholar] [CrossRef]
- Dong, K.; Sun, R.; Jiang, H.; Zeng, X. CO2 Emissions, Economic Growth, and the Environmental Kuznets Curve in China: What Roles Can Nuclear Energy and Renewable Energy Play? J. Clean. Prod. 2018, 196, 51–63. [Google Scholar] [CrossRef]
- Ding, Y.; Zhang, M.; Chen, S.; Wang, W.; Nie, R. The Environmental Kuznets Curve for PM2.5 Pollution in Beijing-Tianjin-Hebei Region of China: A Spatial Panel Data Approach. J. Clean. Prod. 2019, 220, 984–994. [Google Scholar] [CrossRef]
- Özokcu, S.; Özdemir, Ö. Economic Growth, Energy, and Environmental Kuznets Curve. Renew. Sustain. Energy Rev. 2017, 72, 639–647. [Google Scholar] [CrossRef]
- Li, W.; Qiao, Y.; Li, X.; Wang, Y. Energy Consumption, Pollution Haven Hypothesis, and Environmental Kuznets Curve: Examining the Environment–Economy Link in Belt and Road Initiative Countries. Energy 2022, 239, 122559. [Google Scholar] [CrossRef]
- Cheng, Z. The Spatial Correlation and Interaction between Manufacturing Agglomeration and Environmental Pollution. Ecol. Indic. 2016, 61, 1024–1032. [Google Scholar] [CrossRef]
- Jin, H.; Chen, X.; Zhong, R.; Liu, M. Influence and Prediction of PM2.5 through Multiple Environmental Variables in China. Sci. Total Environ. 2022, 849, 157910. [Google Scholar] [CrossRef]
- Xiao, H.; Ma, Z.; Mi, Z.; Kelsey, J.; Zheng, J.; Yin, W.; Yan, M. Spatio-Temporal Simulation of Energy Consumption in China’s Provinces Based on Satellite Night-Time Light Data. Appl. Energy 2018, 231, 1070–1078. [Google Scholar] [CrossRef]
- Qi, G.; Wei, W.; Wang, Z.; Wang, Z.; Wei, L. The Spatial-Temporal Evolution Mechanism of PM2.5 Concentration Based on China’s Climate Zoning. J. Environ. Manag. 2023, 325, 116671. [Google Scholar] [CrossRef]
- Wu, H.; Fang, S.; Zhang, C.; Hu, S.; Nan, D.; Yang, Y. Exploring the Impact of Urban Form on Urban Land Use Efficiency under Low-Carbon Emission Constraints: A Case Study in China’s Yellow River Basin. J. Environ. Manag. 2022, 311, 114866. [Google Scholar] [CrossRef]
- Zhou, K.; Yang, J.; Yang, T.; Ding, T. Spatial and Temporal Evolution Characteristics and Spillover Effects of China’s Regional Carbon Emissions. J. Environ. Manag. 2023, 325, 116423. [Google Scholar] [CrossRef] [PubMed]
- Zhao, J.; Jiang, Q.; Dong, X.; Dong, K.; Jiang, H. How Does Industrial Structure Adjustment Reduce CO2 Emissions? Spatial and Mediation Effects Analysis for China. Energy Econ. 2022, 105, 105704. [Google Scholar] [CrossRef]
- Lee, L.; Yu, J. Estimation of Spatial Autoregressive Panel Data Models with Fixed Effects. J. Econom. 2010, 154, 165–185. [Google Scholar] [CrossRef]
- Elhorst, J.P. Applied Spatial Econometrics: Raising the Bar. Spat. Econ. Anal. 2010, 5, 9–28. [Google Scholar] [CrossRef]
- Li, G.; Fang, C.; Wang, S.; Sun, S. The Effect of Economic Growth, Urbanization, and Industrialization on Fine Particulate Matter (PM2.5) Concentrations in China. Environ. Sci. Technol. 2016, 50, 11452–11459. [Google Scholar] [CrossRef] [PubMed]
- Zhang, L.; Zhao, N.; Zhang, W.; Wilson, J.P. Changes in Long-Term PM2.5 Pollution in the Urban and Suburban Areas of China’s Three Largest Urban Agglomerations from 2000 to 2020. Remote Sens. 2022, 14, 1716. [Google Scholar] [CrossRef]
- Geng, X.; Hu, J.; Zhang, Z.; Li, Z.; Chen, C.; Wang, Y.; Zhang, Z.; Zhong, Y. Exploring Efficient Strategies for Air Quality Improvement in China Based on Its Regional Characteristics and Interannual Evolution of PM2.5 Pollution. Environ. Res. 2024, 252, 119009. [Google Scholar] [CrossRef] [PubMed]
- Zhang, X.; Tang, M.; Guo, F.; Wei, F.; Yu, Z.; Gao, K.; Jin, M.; Wang, J.; Chen, K. Associations between Air Pollution and COVID-19 Epidemic during Quarantine Period in China. Environ. Pollut. 2021, 268, 115897. [Google Scholar] [CrossRef]
- Ma, J.; Xu, J.; Qu, Y. Evaluation on the Surface PM2.5 Concentration over China Mainland from NASA’s MERRA-2. Atmos. Environ. 2020, 237, 117666. [Google Scholar] [CrossRef]
- Geng, G.; Zhang, Q.; Martin, R.V.; van Donkelaar, A.; Huo, H.; Che, H.; Lin, J.; He, K. Estimating Long-Term PM2.5 Concentrations in China Using Satellite-Based Aerosol Optical Depth and a Chemical Transport Model. Remote Sens. Environ. 2015, 166, 262–270. [Google Scholar] [CrossRef]
- Ali, M.A.; Bilal, M.; Wang, Y.; Nichol, J.E.; Mhawish, A.; Qiu, Z.; de Leeuw, G.; Zhang, Y.; Zhan, Y.; Liao, K.; et al. Accuracy Assessment of CAMS and MERRA-2 Reanalysis PM2.5 and PM10 Concentrations over China. Atmos. Environ. 2022, 288, 119297. [Google Scholar] [CrossRef]
- Lu, X.; Zhang, S.; Xing, J.; Wang, Y.; Chen, W.; Ding, D.; Wu, Y.; Wang, S.; Duan, L.; Hao, J. Progress of Air Pollution Control in China and Its Challenges and Opportunities in the Ecological Civilization Era. Engineering 2020, 6, 1423–1431. [Google Scholar] [CrossRef]
- Zheng, J.; Mi, Z.; Coffman, D.; Milcheva, S.; Shan, Y.; Guan, D.; Wang, S. Regional Development and Carbon Emissions in China. Energy Econ. 2019, 81, 25–36. [Google Scholar] [CrossRef]
- Yun, G.; Zhao, S. The Imprint of Urbanization on PM2.5 Concentrations in China: The Urban-Rural Gradient Study. Sustain. Cities Soc. 2022, 86, 104103. [Google Scholar] [CrossRef]
- Cheng, Z.; Li, L.; Liu, J. Identifying the Spatial Effects and Driving Factors of Urban PM2.5 Pollution in China. Ecol. Indic. 2017, 82, 61–75. [Google Scholar] [CrossRef]
- Liu, L.; Liu, Y.; Cheng, F.; Yu, Y.; Wang, J.; Wang, C.; Nong, L.; Deng, H. Remote Sensing Estimation of Regional PM2.5 Based on GTWR Model -A Case Study of Southwest China. Environ. Pollut. 2024, 351, 124057. [Google Scholar] [CrossRef]
- Hao, Y.; Liu, Y.-M. The Influential Factors of Urban PM2.5 Concentrations in China: A Spatial Econometric Analysis. J. Clean. Prod. 2016, 112, 1443–1453. [Google Scholar] [CrossRef]
- Elhorst, J.P. Spatial Panel Data Models. In Spatial Econometrics: From Cross-Sectional Data to Spatial Panels; Elhorst, J.P., Ed.; Springer: Berlin/Heidelberg, Germany, 2014; pp. 37–93. ISBN 978-3-642-40340-8. [Google Scholar]
- Hu, W.; Zhao, T.; Bai, Y.; Kong, S.; Xiong, J.; Sun, X.; Yang, Q.; Gu, Y.; Lu, H. Importance of Regional PM2.5 Transport and Precipitation Washout in Heavy Air Pollution in the Twain-Hu Basin over Central China: Observational Analysis and WRF-Chem Simulation. Sci. Total Environ. 2021, 758, 143710. [Google Scholar] [CrossRef] [PubMed]
- Yang, Z.; Wang, Y.; Xu, X.-H.; Yang, J.; Ou, C.-Q. Quantifying and Characterizing the Impacts of PM2.5 and Humidity on Atmospheric Visibility in 182 Chinese Cities: A Nationwide Time-Series Study. J. Clean. Prod. 2022, 368, 133182. [Google Scholar] [CrossRef]
- Li, J.; Chen, H.; Li, Z.; Wang, P.; Cribb, M.; Fan, X. Low-Level Temperature Inversions and Their Effect on Aerosol Condensation Nuclei Concentrations under Different Large-Scale Synoptic Circulations. Adv. Atmospheric Sci. 2015, 32, 898–908. [Google Scholar] [CrossRef]
- Liu, C.-N.; Lin, S.-F.; Tsai, C.-J.; Wu, Y.-C.; Chen, C.-F. Theoretical Model for the Evaporation Loss of PM2.5 during Filter Sampling. Atmos. Environ. 2015, 109, 79–86. [Google Scholar] [CrossRef]
- Zhang, H.; Wang, Y.; Hu, J.; Ying, Q.; Hu, X.-M. Relationships between Meteorological Parameters and Criteria Air Pollutants in Three Megacities in China. Environ. Res. 2015, 140, 242–254. [Google Scholar] [CrossRef]
- Xu, G.; Ren, X.; Xiong, K.; Li, L.; Bi, X.; Wu, Q. Analysis of the Driving Factors of PM2.5 Concentration in the Air: A Case Study of the Yangtze River Delta, China. Ecol. Indic. 2020, 110, 105889. [Google Scholar] [CrossRef]
- Liu, X.; Zou, B.; Feng, H.; Liu, N.; Zhang, H. Anthropogenic Factors of PM2.5 Distributions in China’s Major Urban Agglomerations: A Spatial-Temporal Analysis. J. Clean. Prod. 2020, 264, 121709. [Google Scholar] [CrossRef]
- Chen, Z.; Chen, D.; Zhao, C.; Kwan, M.; Cai, J.; Zhuang, Y.; Zhao, B.; Wang, X.; Chen, B.; Yang, J.; et al. Influence of Meteorological Conditions on PM2.5 Concentrations across China: A Review of Methodology and Mechanism. Environ. Int. 2020, 139, 105558. [Google Scholar] [CrossRef]
- Xu, S.-C.; Li, Y.-W.; Miao, Y.-M.; Gao, C.; He, Z.-X.; Shen, W.-X.; Long, R.-Y.; Chen, H.; Zhao, B.; Wang, S.-X. Regional Differences in Nonlinear Impacts of Economic Growth, Export and FDI on Air Pollutants in China Based on Provincial Panel Data. J. Clean. Prod. 2019, 228, 455–466. [Google Scholar] [CrossRef]
- Ali, M.A.; Huang, Z.; Bilal, M.; Assiri, M.E.; Mhawish, A.; Nichol, J.E.; de Leeuw, G.; Almazroui, M.; Wang, Y.; Alsubhi, Y. Long-Term PM2.5 Pollution over China: Identification of PM2.5 Pollution Hotspots and Source Contributions. Sci. Total Environ. 2023, 893, 164871. [Google Scholar] [CrossRef]
- Wang, J.; Wang, S.; Li, S. Examining the Spatially Varying Effects of Factors on PM2.5 Concentrations in Chinese Cities Using Geographically Weighted Regression Modeling. Environ. Pollut. 2019, 248, 792–803. [Google Scholar] [CrossRef]


| Period of Time | t/t + 1 | HH | LH | LL | HL | Type | Quantity | Proportion | St |
|---|---|---|---|---|---|---|---|---|---|
| 2000–2007 | HH | 0.927 | 0.048 | 0.009 | 0.015 | I | 151 | 0.058 | 0.902 |
| LH | 0.094 | 0.845 | 0.061 | 0.000 | II | 81 | 0.031 | ||
| LL | 0.012 | 0.025 | 0.931 | 0.032 | III | 22 | 0.008 | ||
| HL | 0.137 | 0.000 | 0.265 | 0.598 | IV | 2350 | 0.902 | ||
| 2007–2014 | HH | 0.927 | 0.051 | 0.007 | 0.015 | I | 172 | 0.066 | 0.900 |
| LH | 0.115 | 0.836 | 0.049 | 0.000 | II | 72 | 0.028 | ||
| LL | 0.010 | 0.024 | 0.935 | 0.030 | III | 17 | 0.007 | ||
| HL | 0.092 | 0.000 | 0.321 | 0.587 | IV | 2343 | 0.900 | ||
| 2014–2021 | HH | 0.915 | 0.054 | 0.012 | 0.019 | I | 174 | 0.067 | 0.886 |
| LH | 0.115 | 0.811 | 0.074 | 0.000 | II | 101 | 0.039 | ||
| LL | 0.011 | 0.031 | 0.922 | 0.037 | III | 23 | 0.009 | ||
| HL | 0.122 | 0.000 | 0.216 | 0.662 | IV | 2306 | 0.886 | ||
| 2000–2021 | HH | 0.923 | 0.051 | 0.009 | 0.016 | I | 497 | 0.064 | 0.896 |
| LH | 0.108 | 0.830 | 0.061 | 0.000 | II | 254 | 0.033 | ||
| LL | 0.011 | 0.027 | 0.929 | 0.033 | III | 62 | 0.008 | ||
| HL | 0.117 | 0.000 | 0.263 | 0.620 | IV | 6999 | 0.896 |
| Variable | Unit | Min | Max | Mean | Std.Dev. | VIF |
|---|---|---|---|---|---|---|
| PRE | mm | 3.96 | 275.91 | 98.32 | 55.71 | 4.35 |
| TEM | °C | 0.09 | 25.65 | 13.78 | 5.46 | 3.31 |
| WIN | m/s | 0.98 | 4.16 | 2.12 | 0.48 | 1.36 |
| RH | % | 33.62 | 84.56 | 67.79 | 10.81 | 6.19 |
| NDVI | - | 0.09 | 0.89 | 0.69 | 0.17 | 2.46 |
| PGDP | CNY/person | 5035.00 | 215,488.00 | 48,783.35 | 31,319.84 | 2.18 |
| IND | % | 6.54 | 89.75 | 45.32 | 11.69 | 1.24 |
| PD | person/km2 | 0.28 | 8830.25 | 417.61 | 598.60 | 1.74 |
| ECI | - | 63.72 | 490,701.49 | 34,182.80 | 50,656.96 | 2.12 |
| W1 | W2 | W3 | |
|---|---|---|---|
| LM-lag | 1551.17 *** | 522.04 *** | 552.76 *** |
| Robust LM-lag | 269.74 *** | 327.13 *** | 368.47 *** |
| LM-err | 4738.45 *** | 5601.85 *** | 4453.11 *** |
| Robust LM-err | 3457.02 *** | 5406.93 *** | 4268.81 *** |
| LR-spatial fixed | 67.59 *** | 59.07 *** | 60.37 *** |
| LR-time fixed | 10,427.39 *** | 10,287.87 *** | 10,649.38 *** |
| Hausman test | 124.18 *** | 189.21 *** | 298.75 *** |
| Wald-lag | 119.42 *** | 322.32 *** | 331.52 *** |
| LR-lag | 120.48 *** | 309.28 *** | 319.22 *** |
| Wald-err | 149.85 *** | 458.19 *** | 468.27 *** |
| LR-err | 40.87 *** | 416.23 *** | 458.81 *** |
| Variable | W1 | W2 | W3 | Spatial Lag Term | W1 | W2 | W3 |
|---|---|---|---|---|---|---|---|
| lnPRE | −0.054 *** | −0.026 ** | −0.028 *** | W × lnPRE | −0.076 ** | −0.223 *** | −0.045 * |
| (−6.270) | (−2.238) | (−2.826) | (−2.043) | (−3.864) | (−1.893) | ||
| lnTEM | −0.051 *** | −0.019 ** | −0.014 ** | W × lnTEM | 0.057 * | 0.691 *** | 0.526 *** |
| (−2.879) | (−2.353) | (−2.269) | (1.742) | (5.287) | (4.304) | ||
| lnWIN | −0.219 *** | −0.032 ** | −0.060 *** | W × lnWIN | −0.307 ** | −0.876 *** | −0.299 ** |
| (−11.973) | (−2.026) | (−2.948) | (−2.491) | (−6.145) | (−2.435) | ||
| lnRH | 0.140 ** | 0.070 * | 0.046 * | W × lnRH | −0.158 | 0.126 | −0.278 * |
| (2.443) | (1.735) | (1.696) | (−1.141) | (0.462) | (−1.857) | ||
| lnNDVI | −0.054 ** | −0.132 *** | −0.120 *** | W × lnNDVI | −0.401 *** | −2.267 *** | −1.129 *** |
| (−2.315) | (−2.907) | (−3.085) | (−2.923) | (−9.032) | (−5.956) | ||
| lnPGDP | 0.142 ** | 0.196 ** | 0.314 *** | W × lnPGDP | 1.628 *** | 1.506 ** | 1.135 ** |
| (1.981) | (2.093) | (3.756) | (3.908) | (2.499) | (2.207) | ||
| ln2PGDP | −0.005 * | −0.008 * | −0.014 *** | W × ln2PGDP | −0.075 *** | −0.072 ** | −0.051 ** |
| (−1.702) | (−1.797) | (−3.460) | (−3.683) | (−2.467) | (−2.174) | ||
| lnIND | 0.043 *** | 0.020 ** | 0.036 ** | W × lnIND | −0.565 * | −0.041 | −0.339 * |
| (3.357) | (1.862) | (2.155) | (−1.808) | (−0.354) | (−1.691) | ||
| lnPD | −0.017 | 0.019 | 0.032 | W × lnPD | −0.343 * | 0.206 | 0.191 |
| (−0.624) | (0.731) | (1.415) | (−1.736) | (1.565) | (1.408) | ||
| lnECI | 0.033 *** | 0.012 ** | 0.018 *** | W × lnECI | −0.101 *** | −0.165 *** | −0.107 *** |
| (7.356) | (2.187) | (4.027) | (−3.244) | (−6.710) | (−4.112) | ||
| ρ | 1.240 *** | 0.981 *** | 2.275 *** | Adjusted R2 | 0.635 | 0.682 | 0.711 |
| (48.613) | (171.304) | (144.694) | Log L | 4811.361 | 4979.180 | 5493.324 |
| Variable | Direct Effect | Indirect Effect |
|---|---|---|
| lnPRE | −0.029 *** | −0.014 |
| (−3.066) | (−0.428) | |
| lnTEM | −0.032 *** | 0.450 *** |
| (−2.758) | (4.546) | |
| lnWIN | −0.064 *** | 0.342 *** |
| (−3.126) | (3.960) | |
| lnRH | 0.055 * | −0.193 |
| (2.109) | (−1.158) | |
| lnNDVI | −0.082 ** | −0.716 *** |
| (−2.335) | (−5.364) | |
| lnPGDP | 0.421 *** | −1.592 *** |
| (4.739) | (−3.265) | |
| ln2PGDP | −0.018 *** | −0.037 * |
| (−4.448) | (−1.809) | |
| lnIND | 0.028 ** | −0.226 |
| (2.021) | (−1.479) | |
| lnPD | 0.035 | 0.179 |
| (1.492) | (1.254) | |
| lnECI | 0.023 *** | −0.072 *** |
| (4.640) | (−4.732) |
| Parameter | Statistical Value | Parameter | Statistical Value |
|---|---|---|---|
| Bandwidth | 0.155 | R2 | 0.863 |
| Residual Squares | 10.211 | Adjusted R2 | 0.860 |
| Sigma | 0.174 | Spatio-temporal Distance Ratio | 1.972 |
Disclaimer/Publisher’s Note: The statements, opinions and data contained in all publications are solely those of the individual author(s) and contributor(s) and not of MDPI and/or the editor(s). MDPI and/or the editor(s) disclaim responsibility for any injury to people or property resulting from any ideas, methods, instructions or products referred to in the content. |
© 2025 by the authors. Licensee MDPI, Basel, Switzerland. This article is an open access article distributed under the terms and conditions of the Creative Commons Attribution (CC BY) license (https://creativecommons.org/licenses/by/4.0/).
Share and Cite
Chen, L.; Nian, Y.; Che, M.; Wang, C.; Wang, H. Exploring the Spatio-Temporal Dynamics and Factors Influencing PM2.5 in China’s Prefecture-Level and Above Cities. Remote Sens. 2025, 17, 2212. https://doi.org/10.3390/rs17132212
Chen L, Nian Y, Che M, Wang C, Wang H. Exploring the Spatio-Temporal Dynamics and Factors Influencing PM2.5 in China’s Prefecture-Level and Above Cities. Remote Sensing. 2025; 17(13):2212. https://doi.org/10.3390/rs17132212
Chicago/Turabian StyleChen, Long, Yanyun Nian, Minglu Che, Chengyao Wang, and Haiyuan Wang. 2025. "Exploring the Spatio-Temporal Dynamics and Factors Influencing PM2.5 in China’s Prefecture-Level and Above Cities" Remote Sensing 17, no. 13: 2212. https://doi.org/10.3390/rs17132212
APA StyleChen, L., Nian, Y., Che, M., Wang, C., & Wang, H. (2025). Exploring the Spatio-Temporal Dynamics and Factors Influencing PM2.5 in China’s Prefecture-Level and Above Cities. Remote Sensing, 17(13), 2212. https://doi.org/10.3390/rs17132212