1. Introduction
The precise diagnosis of faults in aero-engines is a core link to enhance their operational reliability and reduce operation and maintenance costs, which is of profound significance to the safety and efficiency of the aviation field. Compared with traditional detection equipment, the Fourier transform infrared spectrometer has significant advantages: it does not require cumbersome sampling operations or complex pretreatment of samples and it can monitor target substances in real time and at a distance. Furthermore, this device can also conduct rapid analysis of multiple components simultaneously, significantly enhancing the detection efficiency [
1,
2,
3]. Particularly in passive remote sensing mode, the Fourier transform infrared spectrometer does not require additional active infrared light sources and can directly receive infrared radiation signals from the environment, which makes the selection of detection locations more flexible. In practical applications, its detection range can reach several kilometers at the farthest, which can meet the detection requirements of various complex scenarios. When the Fourier transform infrared spectrometer is working, the broadband infrared light emitted by the light source is divided into two beams by the beam splitter, and after interference, it illuminates the sample. The sample selectively absorbs light of specific frequencies [
4,
5]. The detector acquires the interference pattern, and then through the computer’s Fourier transform it is converted from the time domain to the frequency domain to obtain the infrared spectrum, based on which the elements, components, and molecular structure of the substance can be analyzed.
In recent years, with the rapid development of artificial intelligence technology, deep learning, due to its powerful feature extraction and pattern recognition capabilities, has gradually become a leading technical means for fault diagnosis in this field. Seiari et al. proposed a fault diagnosis method for aero-engine actuators using a combination of model observers. They designed a Luneberger model observer, which can detect actuator faults through the observer residuals [
6]. However, this method overly relies on the accuracy of the established aero-engine model. Moreover, it can only detect some relatively obvious actuator faults. For complex, multi-factor-induced faults or those with mild fault severity, relying solely on the observer residuals for detection may not be sensitive and accurate enough, making it difficult to precisely diagnose the specific type and severity of the fault. Chen et al. proposed an improved SUKF algorithm and applied it to the estimation of engine performance degradation. This effectively improved the estimation accuracy of the onboard adaptive model for the actual health parameters and performance parameters of the engine degradation [
7]. However, although their improved SUKF algorithm increased the estimation accuracy, it usually increased the computational load. In the onboard environment, computing resources are often limited, which may affect the real-time performance of the algorithm and prevent it from quickly providing the estimation results of engine performance degradation, thereby posing certain obstacles to taking timely maintenance measures. Fan et al. designed an adaptive law based on the interval observer theory, which can effectively reduce the error range of the output estimation and enhance the sensitivity to sudden failures. Based on the adaptive interval observer (AIO), a flexible event-triggered fault detection mechanism was designed [
8]. Although the adaptive law based on the interval observer theory can compress the error range of the output estimation, the design of the adaptive law may be relatively complex, and it may require a large number of parameter adjustments and optimizations for different engine models and operating conditions.
Feature extraction can reduce dimensionality, remove noise, enhance data interpretability and model performance [
9], and also help uncover hidden information in the data. It is an important step in data analysis [
10,
11,
12]. Yang et al. combined the adaptive spectral pattern extraction (ASPE) theory and proposed a fast Fourier transform (FFT) method to quantitatively assess the degree of bearing damage. They established an early fault identification mechanism to determine the optimal time for the first prediction [
13]. Gao et al. proposed an autocorrelation multi-head attention transformer algorithm for infrared spectral sequence deconvolution. They used the attention mechanism for feature extraction and the autocorrelation function for attention calculation. The autocorrelation attention model was used to utilize the inherent sequential properties of spectral data and effectively restore the spectrum by capturing the autocorrelation patterns in the sequence. This model was trained using supervised learning and showed good performance in infrared spectral restoration [
14]. Sun et al. proposed a HAD background reconstruction method based on contrast self-supervised learning. By constructing a self-supervised pre-training model based on a pixel-block-level masking strategy and a dual attention network (DAN) encoder, this pre-training model can learn general background representations without generating labeled samples. The DAN encoder consists of a visual transformer and a channel attention module, extracting global context information and the correlation between the spectrum [
15].
During the process of extracting features using deep learning, some original information may be compressed, filtered, or lost, making it difficult to restore the details of the data. Moreover, redundant features may be extracted, increasing the complexity of the model, reducing the training efficiency, and easily leading to overfitting, causing the model to perform well on the training data but have poor generalization ability on new data and be unable to accurately extract effective features. In the field of spectral data analysis, spectral peaks [
16,
17,
18] serve as key characteristic parameters, which can intuitively reflect the advantages of the absorption or emission properties of substances, and they have become one of the most representative and widely applied features. They are commonly used in important research and practical scenarios such as substance composition identification, concentration determination, and structural analysis. Kurtosis and skewness are two important statistical quantities used to describe the distribution characteristics of data. Kurtosis is used to describe the peak shape of the data distribution, that is, the degree of concentration of the data around the mean value, and is usually used to measure the steepness or flatness of the distribution compared to a normal distribution [
19,
20]. Skewness is a statistical quantity used to describe the symmetry of the data distribution, and it measures the degree to which the data distribution deviates from a symmetrical distribution (such as a normal distribution) [
21,
22]. Through cluster analysis, the hidden natural grouping structure in the data can be discovered, revealing the intrinsic connections and similarities between data points [
23,
24,
25,
26].
The main contents of this article can be summarized as follows:
FTIR spectroscopy was employed to conduct precise field measurements of hot jets from two types of aero-engines, obtaining spectral data independently generated by each engine model.
A multi-stage refinement-based peak feature extraction algorithm is proposed. This algorithm establishes a four-level processing architecture of “coarse detection—local optimization—dynamic screening—intelligent merging,” providing a basis for hot jet characteristic analysis of different types of engines.
By integrating the statistical measures of kurtosis and skewness, this study proposes a multi-dimensional feature vector-based algorithm for feature construction. This algorithm systematically integrates the fundamental attributes and distribution patterns of spectral data, enabling structured, high-dimensional, and comprehensively representative feature extraction for hot jet data from two distinct aero-engine models. The proposed method establishes a robust data foundation for subsequent research, including a hot jet characteristic comparison and fault diagnosis.
This paper consists of five main sections.
Section 1 reviews the current state of aero-engine fault diagnosis and deep learning-based feature extraction methods and briefly introduces the proposed approach, contributions, and framework.
Section 2 presents the field experimental design for aero-engine hot jet spectral measurements and details the structure and methodology of the multi-dimensional feature extraction approach.
Section 3 elaborates on the experimental procedures and results, followed by a comprehensive analysis of the findings.
Section 4 discusses the implications of the experimental results, analyzing the strengths and limitations of the proposed method, along with potential directions for future improvements.
Section 5 provides a systematic summary of the entire study.
3. Experiment and Results
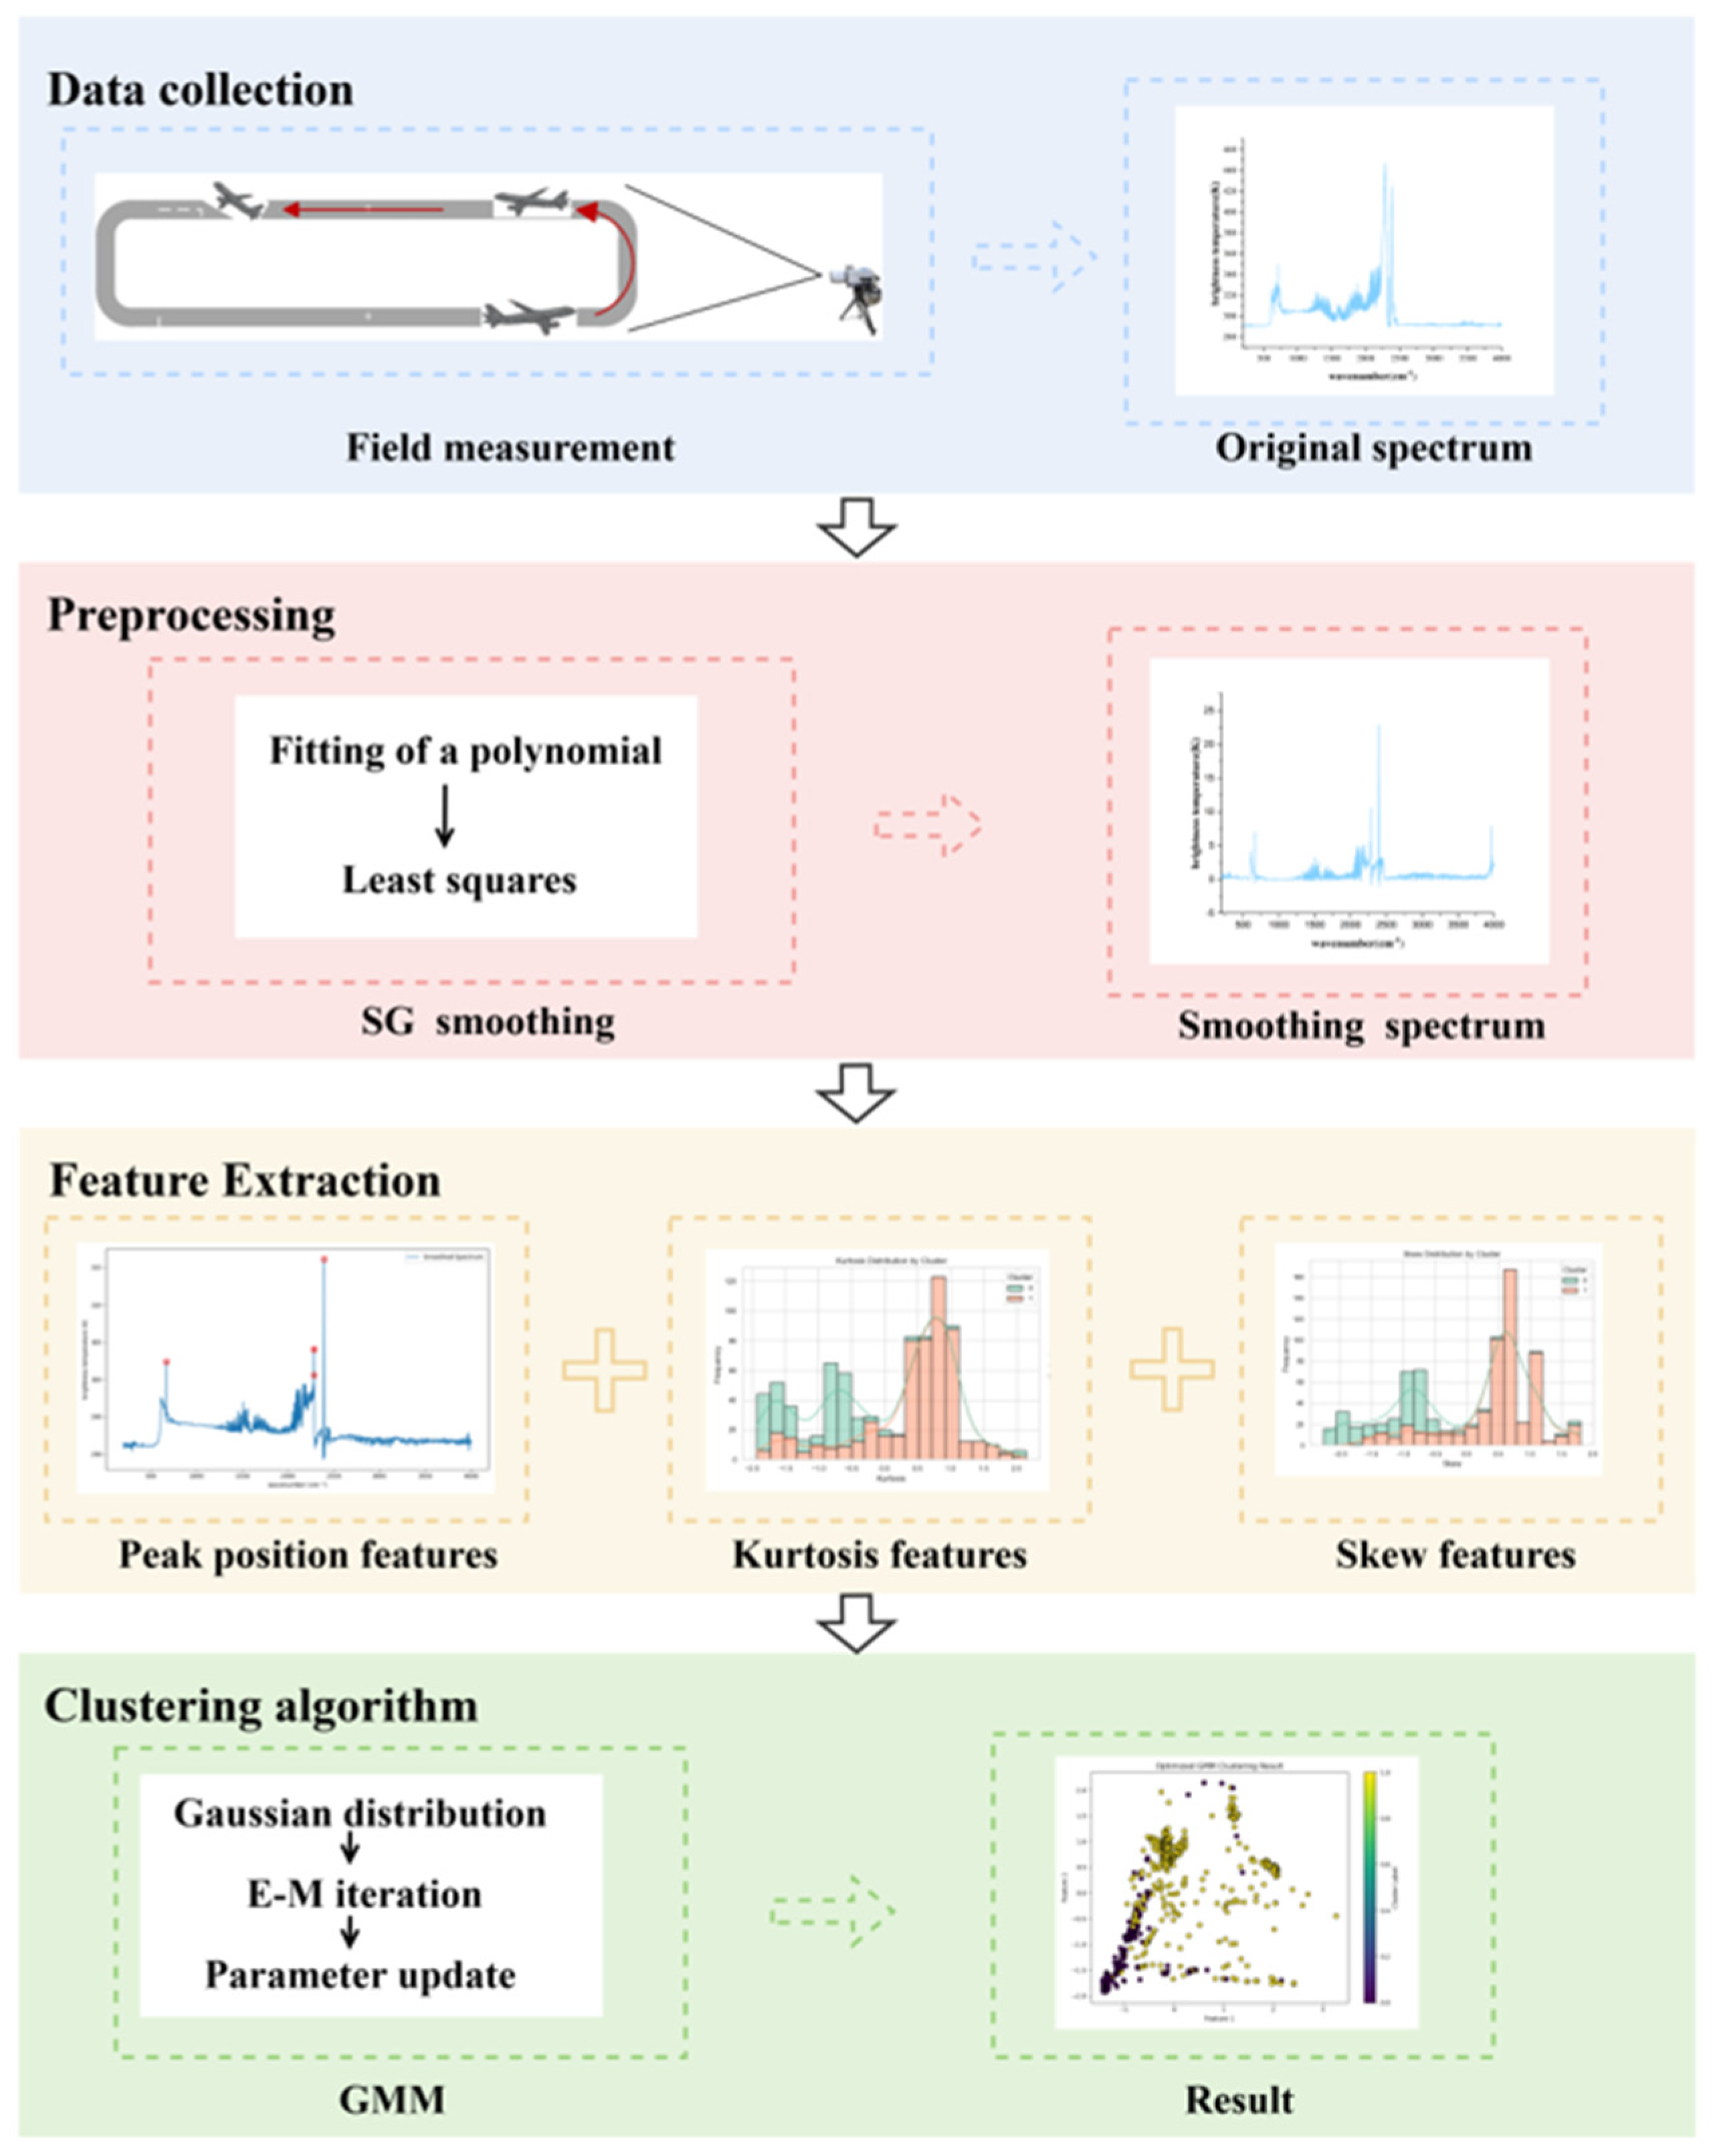
The overall experimental process of this article is shown in
Figure 3. The experiment is mainly divided into four parts: collection of hot jet spectral data of the aero-engine, data preprocessing, construction of multi-dimensional features, and clustering.
3.1. Spectral Analysis
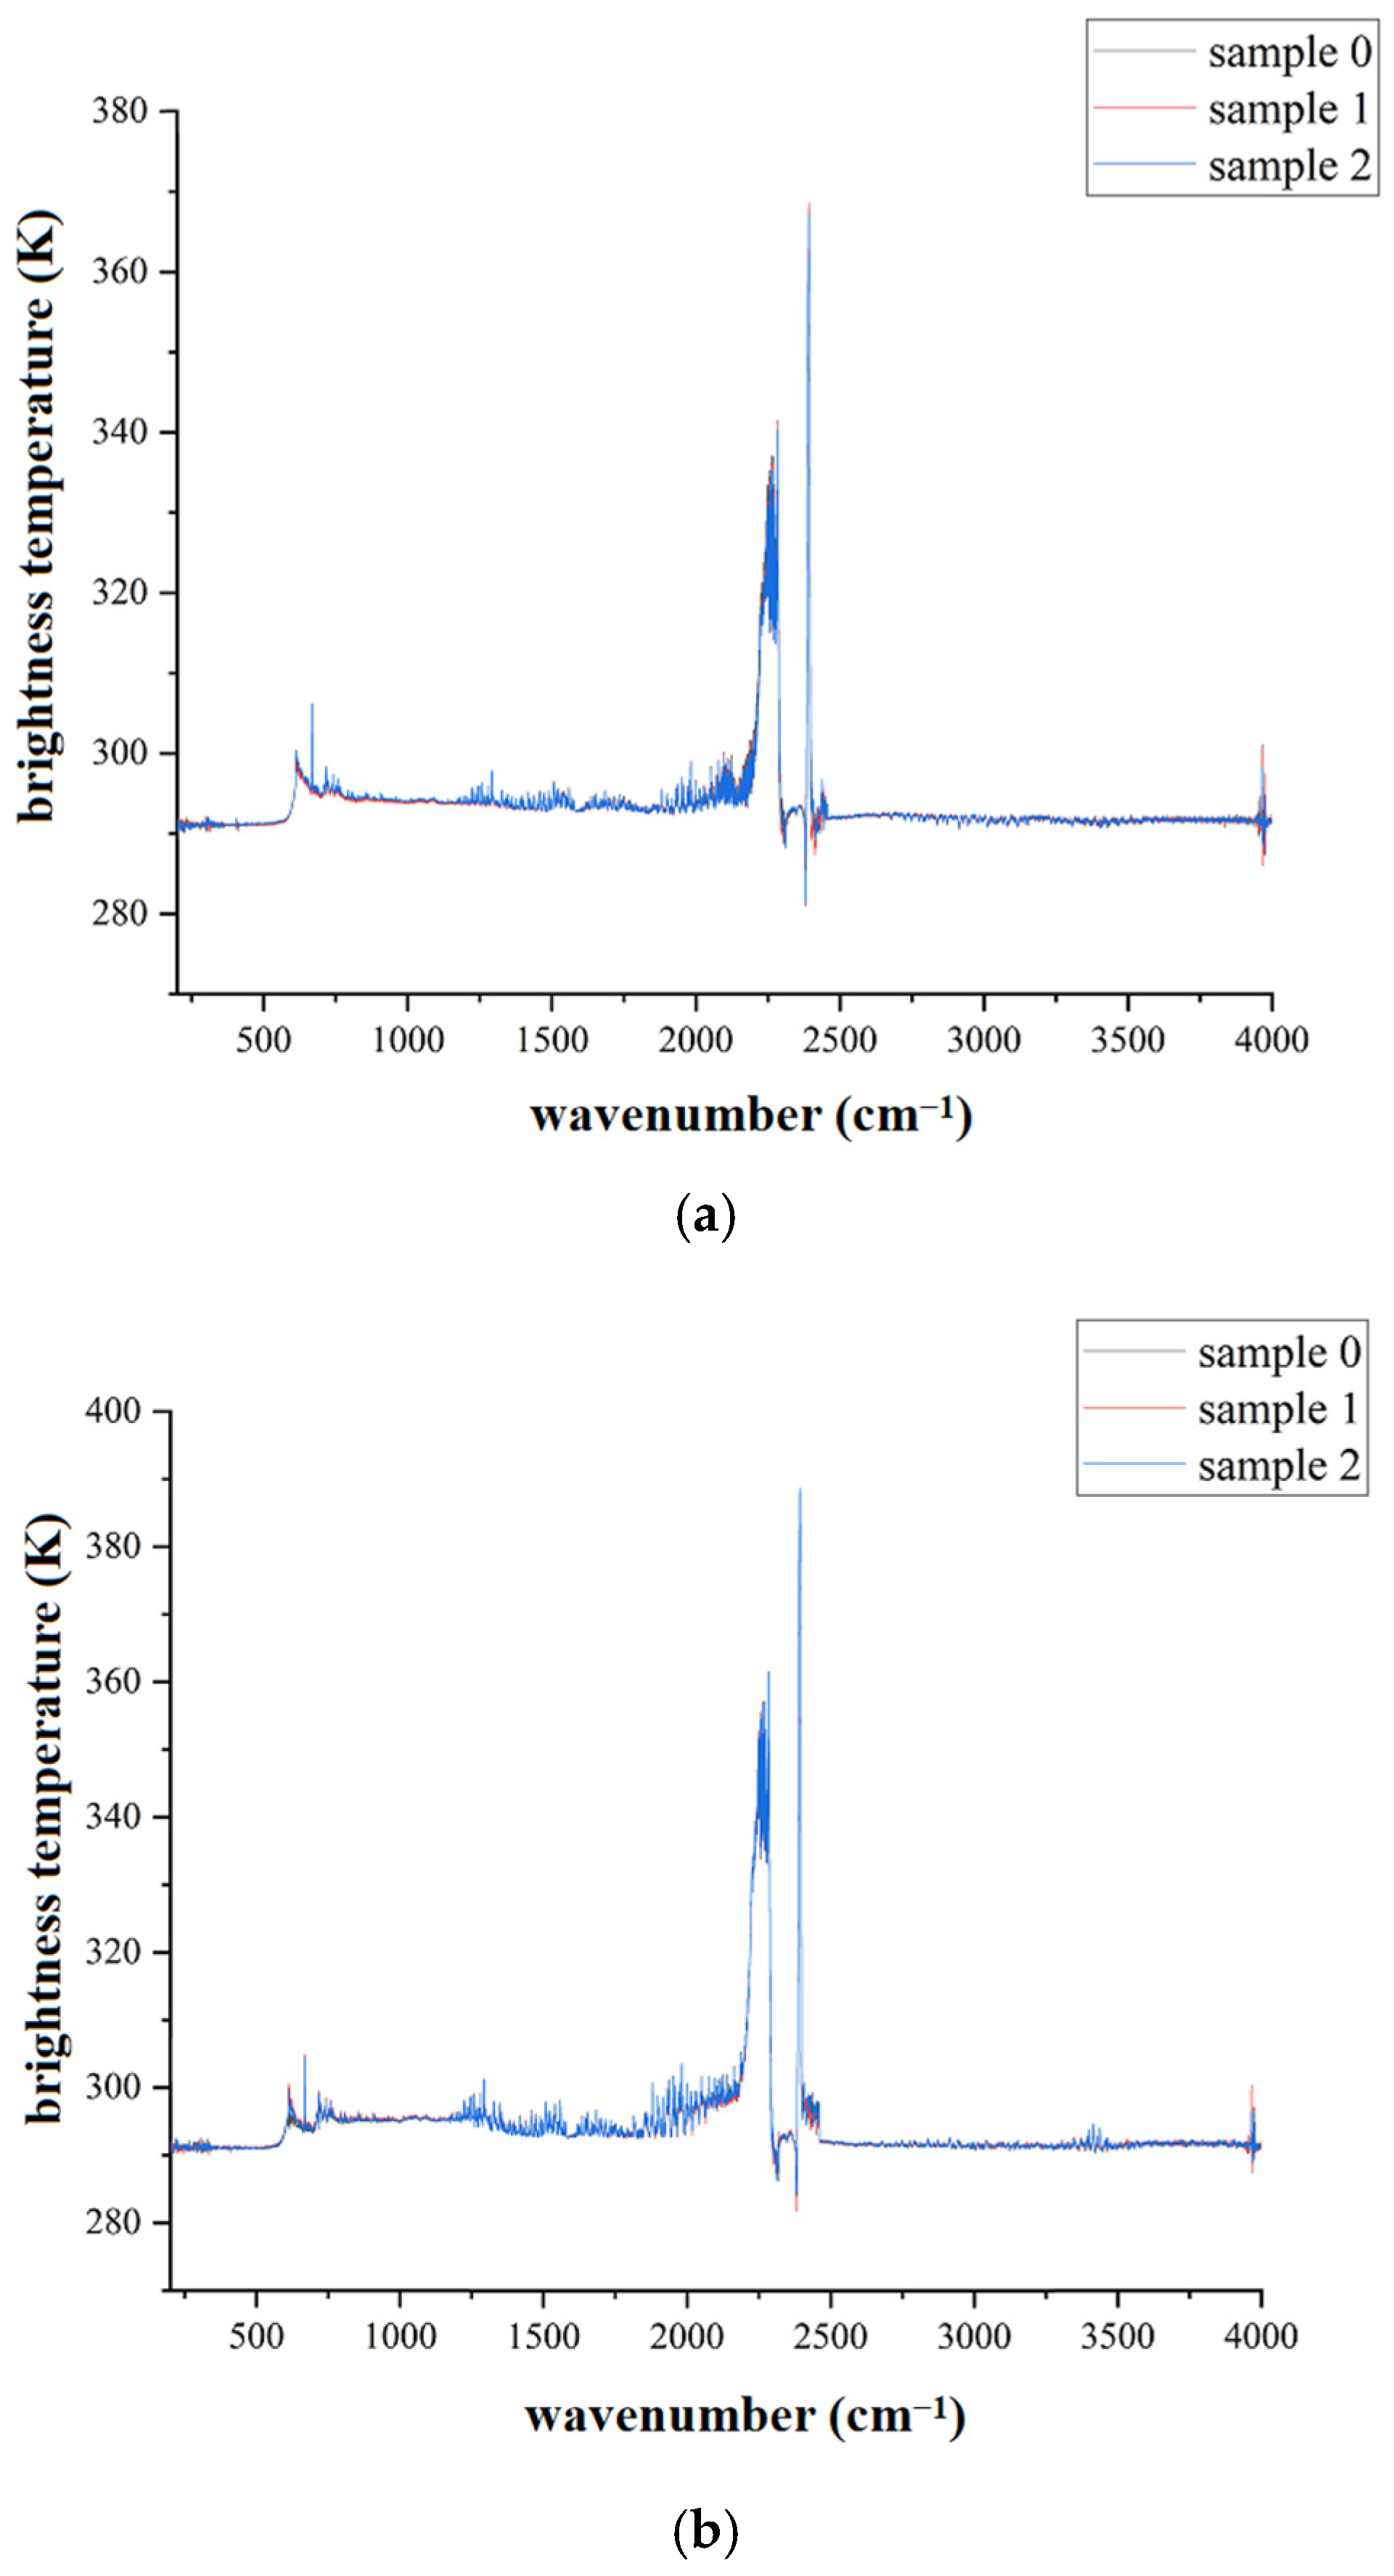
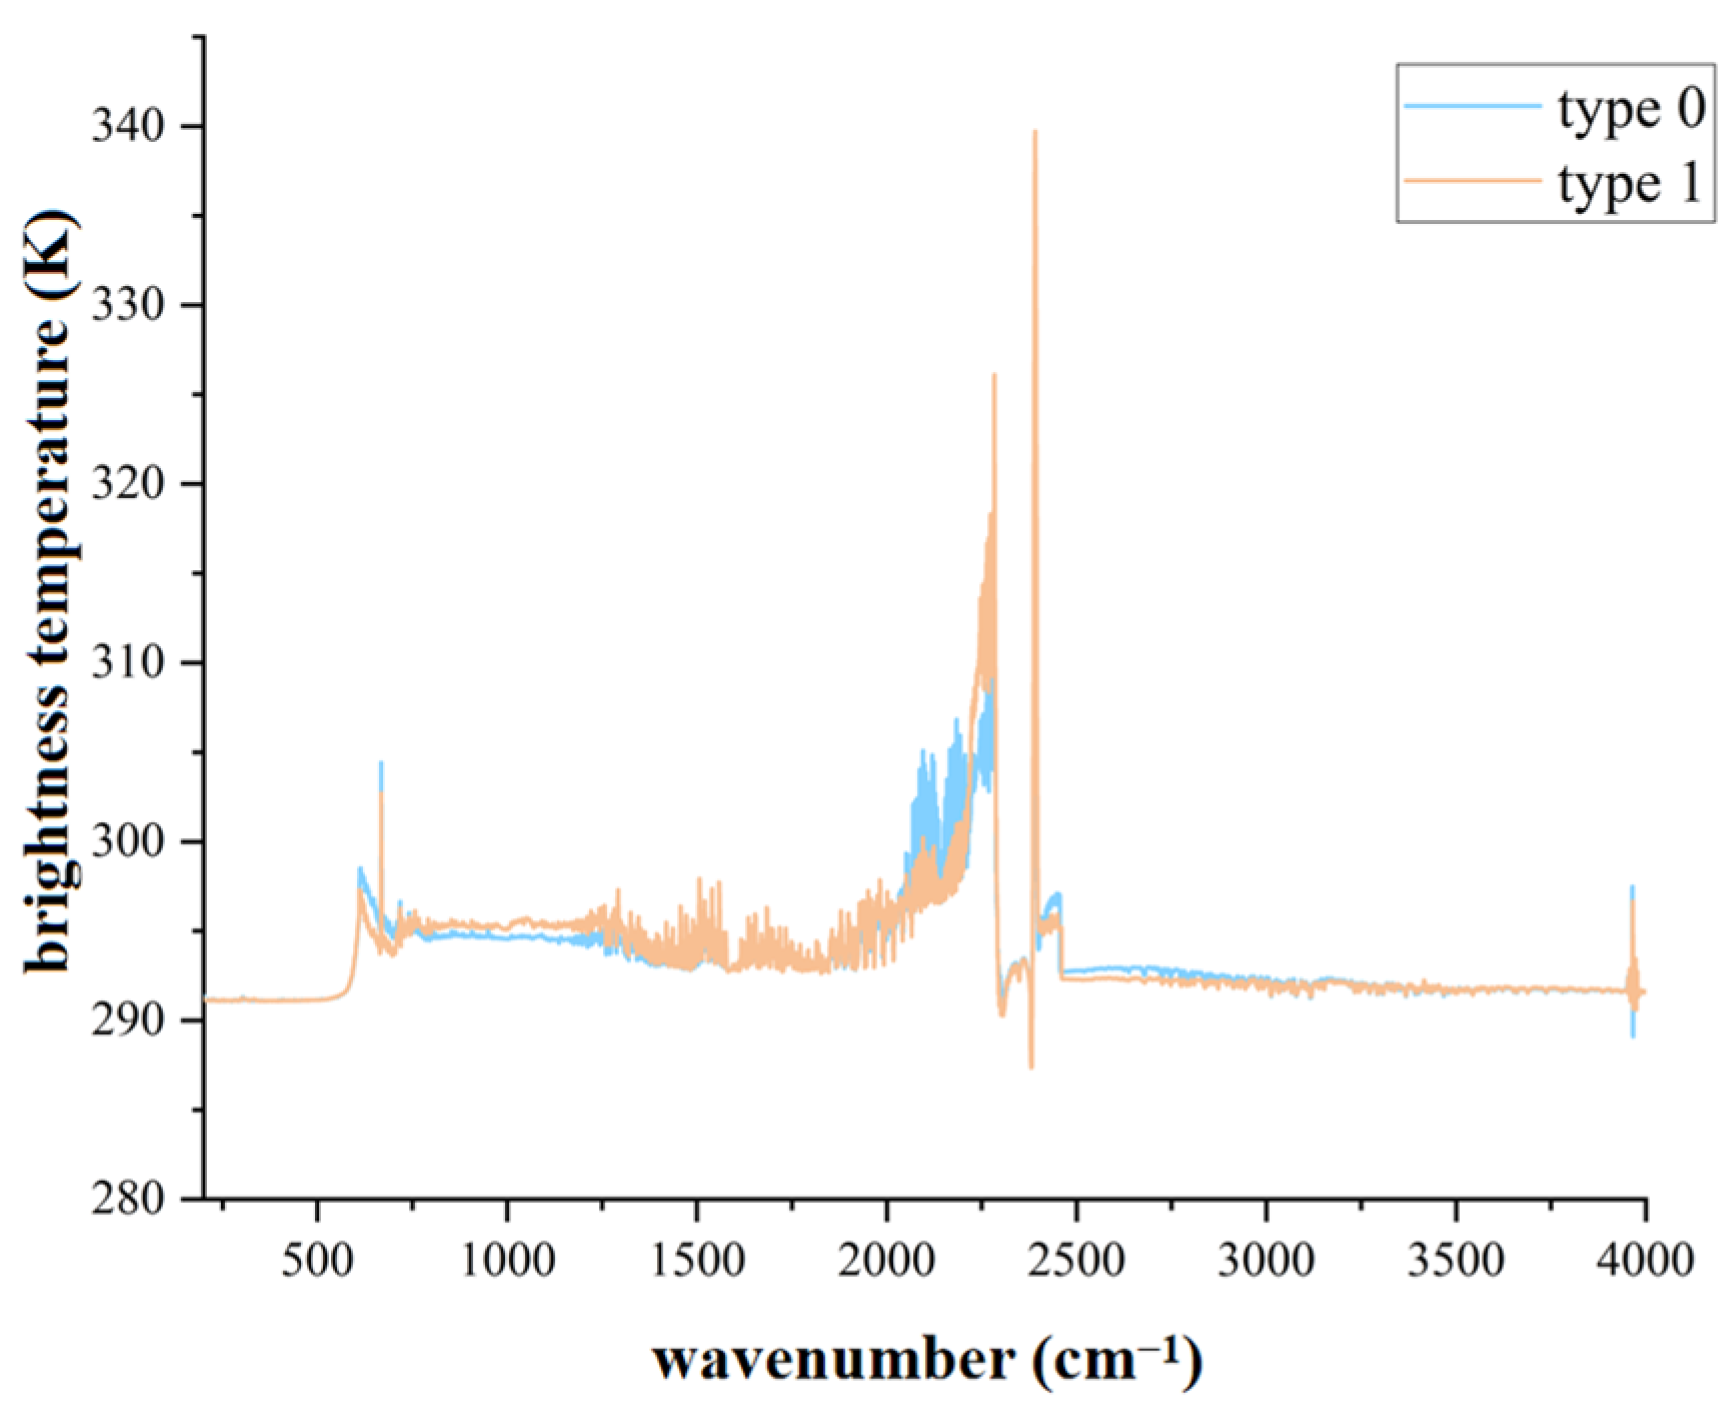
We calculated the average values for the hot jet spectral data of each type of engine. The average spectral diagrams of the hot jets of the two types of aero-engines are shown in
Figure 4. In the spectral diagrams, the curve trends reflect the changes in brightness temperature of different types of substances at various wave numbers. From the overall trend of the spectral curves, in the vast majority of wave number intervals, the brightness temperature curves of the hot jets of the two types of aero-engines are almost overlapping, indicating that their radiation characteristics at these frequencies are highly similar. This means that in most wavelength ranges, the material composition, content ratio, and physical and chemical states of the hot jets of the two types of aero-engines are similar, resulting in a consistent interaction with electromagnetic radiation. For example, in the low wave number region (such as 500–1500 cm
−1), the differences between the two curves are within the measurement error range, indicating that the hot jet radiation in this wavelength range is not significantly affected by the differences in engine types, and may be dominated by common basic substances (such as carbon dioxide, water, common combustion products, etc.). Around 2000–2500 cm
−1, the differences between the two curves are obvious. The hot jet radiation of the type 1 aero-engine in this wavelength range significantly increases, possibly due to the generation of specific high-temperature radiation substances (such as isocyanate-based compounds, nitrogen oxides, etc.) during the combustion process, or because its combustion efficiency is higher, generating more high-temperature gases, causing these substances to exhibit intense spectral absorption and re-radiation phenomena at the frequency corresponding to the 2000–2500 cm
−1 wavelength range. In contrast, the radiation of the type 0 engine in this wavelength range is relatively weak, possibly indicating that the content of such radiation substances in its combustion products is lower or the energy distribution characteristics during the combustion process result in a lower radiation efficiency in this wavelength range.
3.2. Data Preprocessing
The Savitzky–Golay filter was selected to smooth the spectral data collected from the external field experiment. The Savitzky–Golay filter smooths the spectral data by fitting polynomials within a local window, eliminating noise while retaining the features of the data well, providing a more reliable data basis for subsequent analyses (such as peak detection and feature extraction). The window parameter of the filter was set to 11, meaning that the current data point and the preceding and following five data points were selected for each smoothing operation. The order of the polynomial used for fitting was set to 3, that is, a third-order polynomial was used to fit the data points within the window. The coefficients of the polynomial were determined using the least squares method to achieve data smoothing.
3.3. Multi-Dimensional Feature Construction Experiment
A multi-stage refined processing algorithm for extracting peak features was employed to identify the characteristic peaks in the FTIR spectral data of the two types of aero-engines. Due to the spectral resolution of 1 cm
−1, considering the influence of instrument noise during the measurement and to avoid excessive merging, both
and
are set to 3 when detecting the peaks. Different vibration–rotation transition lines of the same component may produce adjacent peaks. When the combustion of the aero-engine is incomplete, new weak peaks may appear, and it is necessary to avoid merging the peaks of different components. We set
to 10. The settings of each parameter are shown in
Table 1.
The results of the peak feature extraction algorithm are shown in
Figure 5. The FTIR spectrum of the type 0 engine hot jet has a distinct and stable characteristic peak at 668 cm
−1. This peak matches the specific out-of-plane bending vibration mode of the benzene ring, thus inferring that the type 0 engine hot jet contains aromatic compounds with benzene ring structures such as benzene, toluene, and phenol. At the same time, the spectrum shows the strongest characteristic absorption peak at 2391 cm
−1, which is highly consistent with the typical absorption peak position of carbon dioxide gas, indicating that carbon dioxide is one of the main gas components of the hot jet. Additionally, in the 2281–2283 cm
−1 wavelength range, two relatively concentrated characteristic absorption peaks appeared; combined with spectral analysis theory, this absorption feature is consistent with the asymmetric stretching vibration of the isocyanate group (–N=C=O), indicating that there may be compounds containing isocyanate groups in the hot jet. In the FTIR spectrum of the type 1 engine hot jet, the positions of the characteristic peaks are relatively concentrated. They mainly appear at 2276 cm
−1, 2287 cm
−1, and 2290 cm
−1, and the stretching vibration of the carbon–nitrogen triple bond in the amide compounds is generally around 2240–2280 cm
−1; 2276 cm
−1 is within this range, which may indicate a compound containing an amide group, such as hexanediamide. The peaks at 2287 cm
−1 and 2290 cm
−1 indicate that compounds containing isocyanate groups also exist in the hot jet of type 1 engines. The peak at 2386–2387 cm
−1 indicates that carbon dioxide also exists in the hot jet of type 1 engines.
The results after extracting the features based on the peak height of the wave are shown in
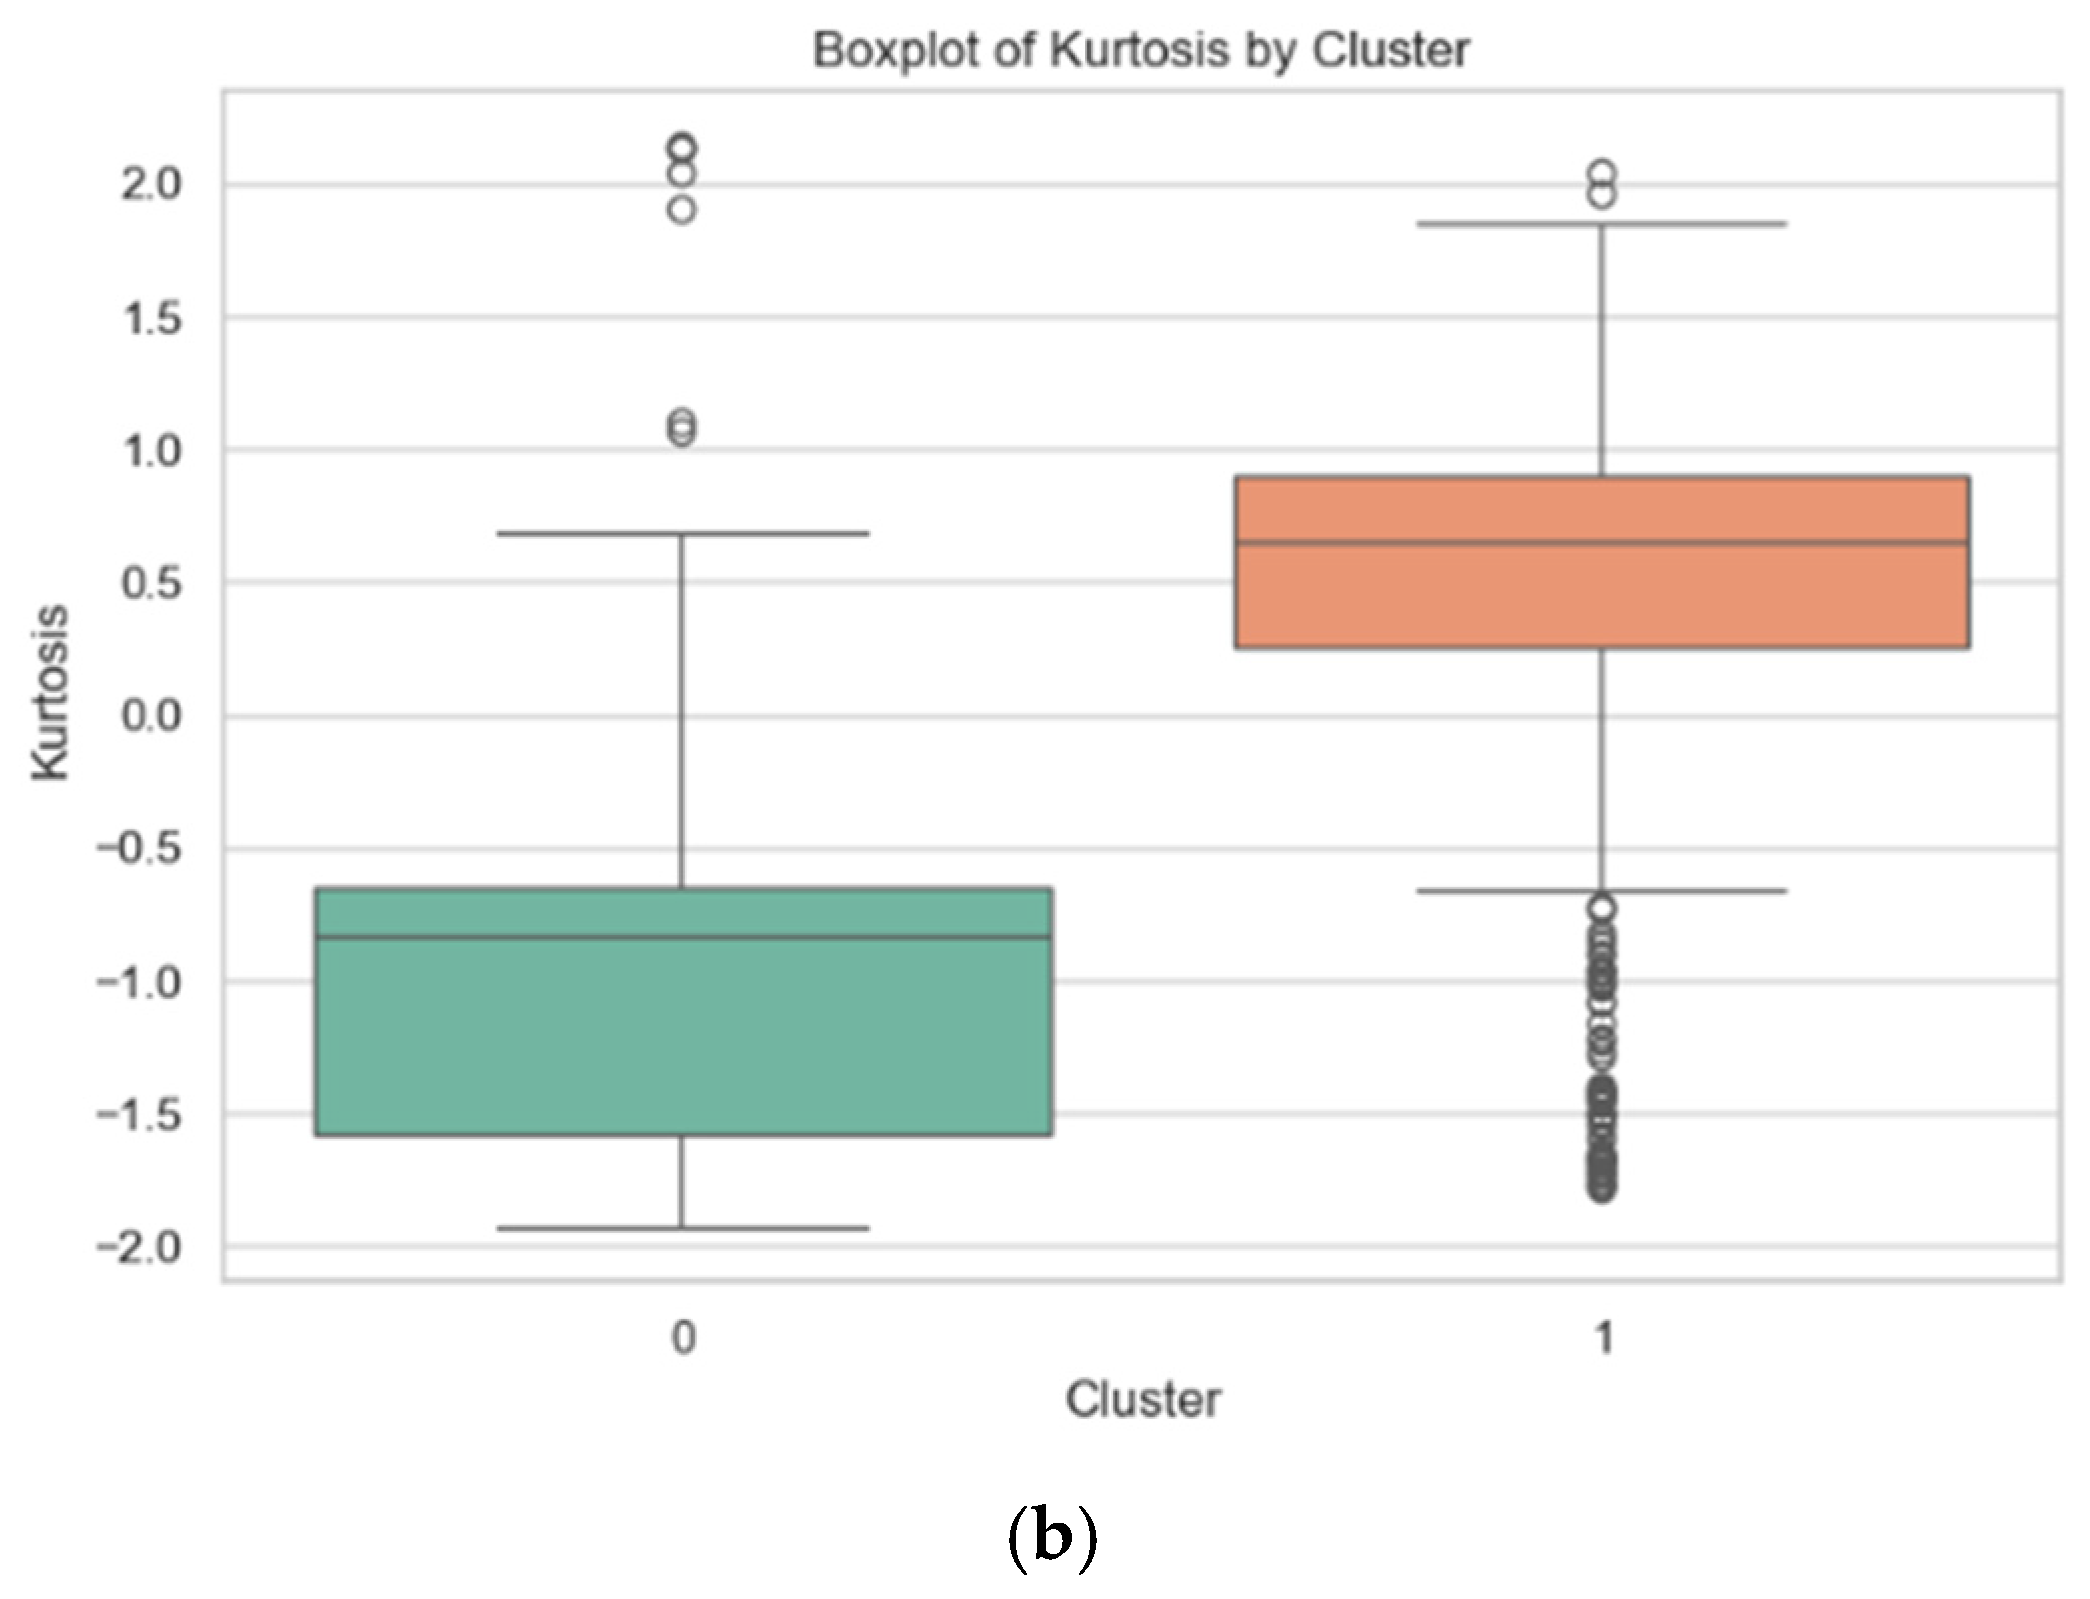
Figure 6.
Figure 6a presents the frequency distribution of the peak height values of the hot jets of the two types of aero-engines, and the KDE curve smoothly depicts the probability density distribution of the peak height values. It can be seen that there are differences in the peak height distribution of the hot jets of the two types of aero-engines. The distribution of the peak height values of type 0 is more scattered, and the spectral characteristics have a broader and more complex distribution. The peak height values of type 1 are concentrated in the higher positive region, corresponding to the aggregation characteristics of spectral absorption peaks in specific substances or states. Through
Figure 6b, the distribution characteristics of the peak height data of the hot jets of the two types of aero-engines can be intuitively compared, such as the median position and the degree of data dispersion. The median of type 0 is lower and the data distribution is more scattered; the median of type 1 is higher and the data is relatively concentrated.
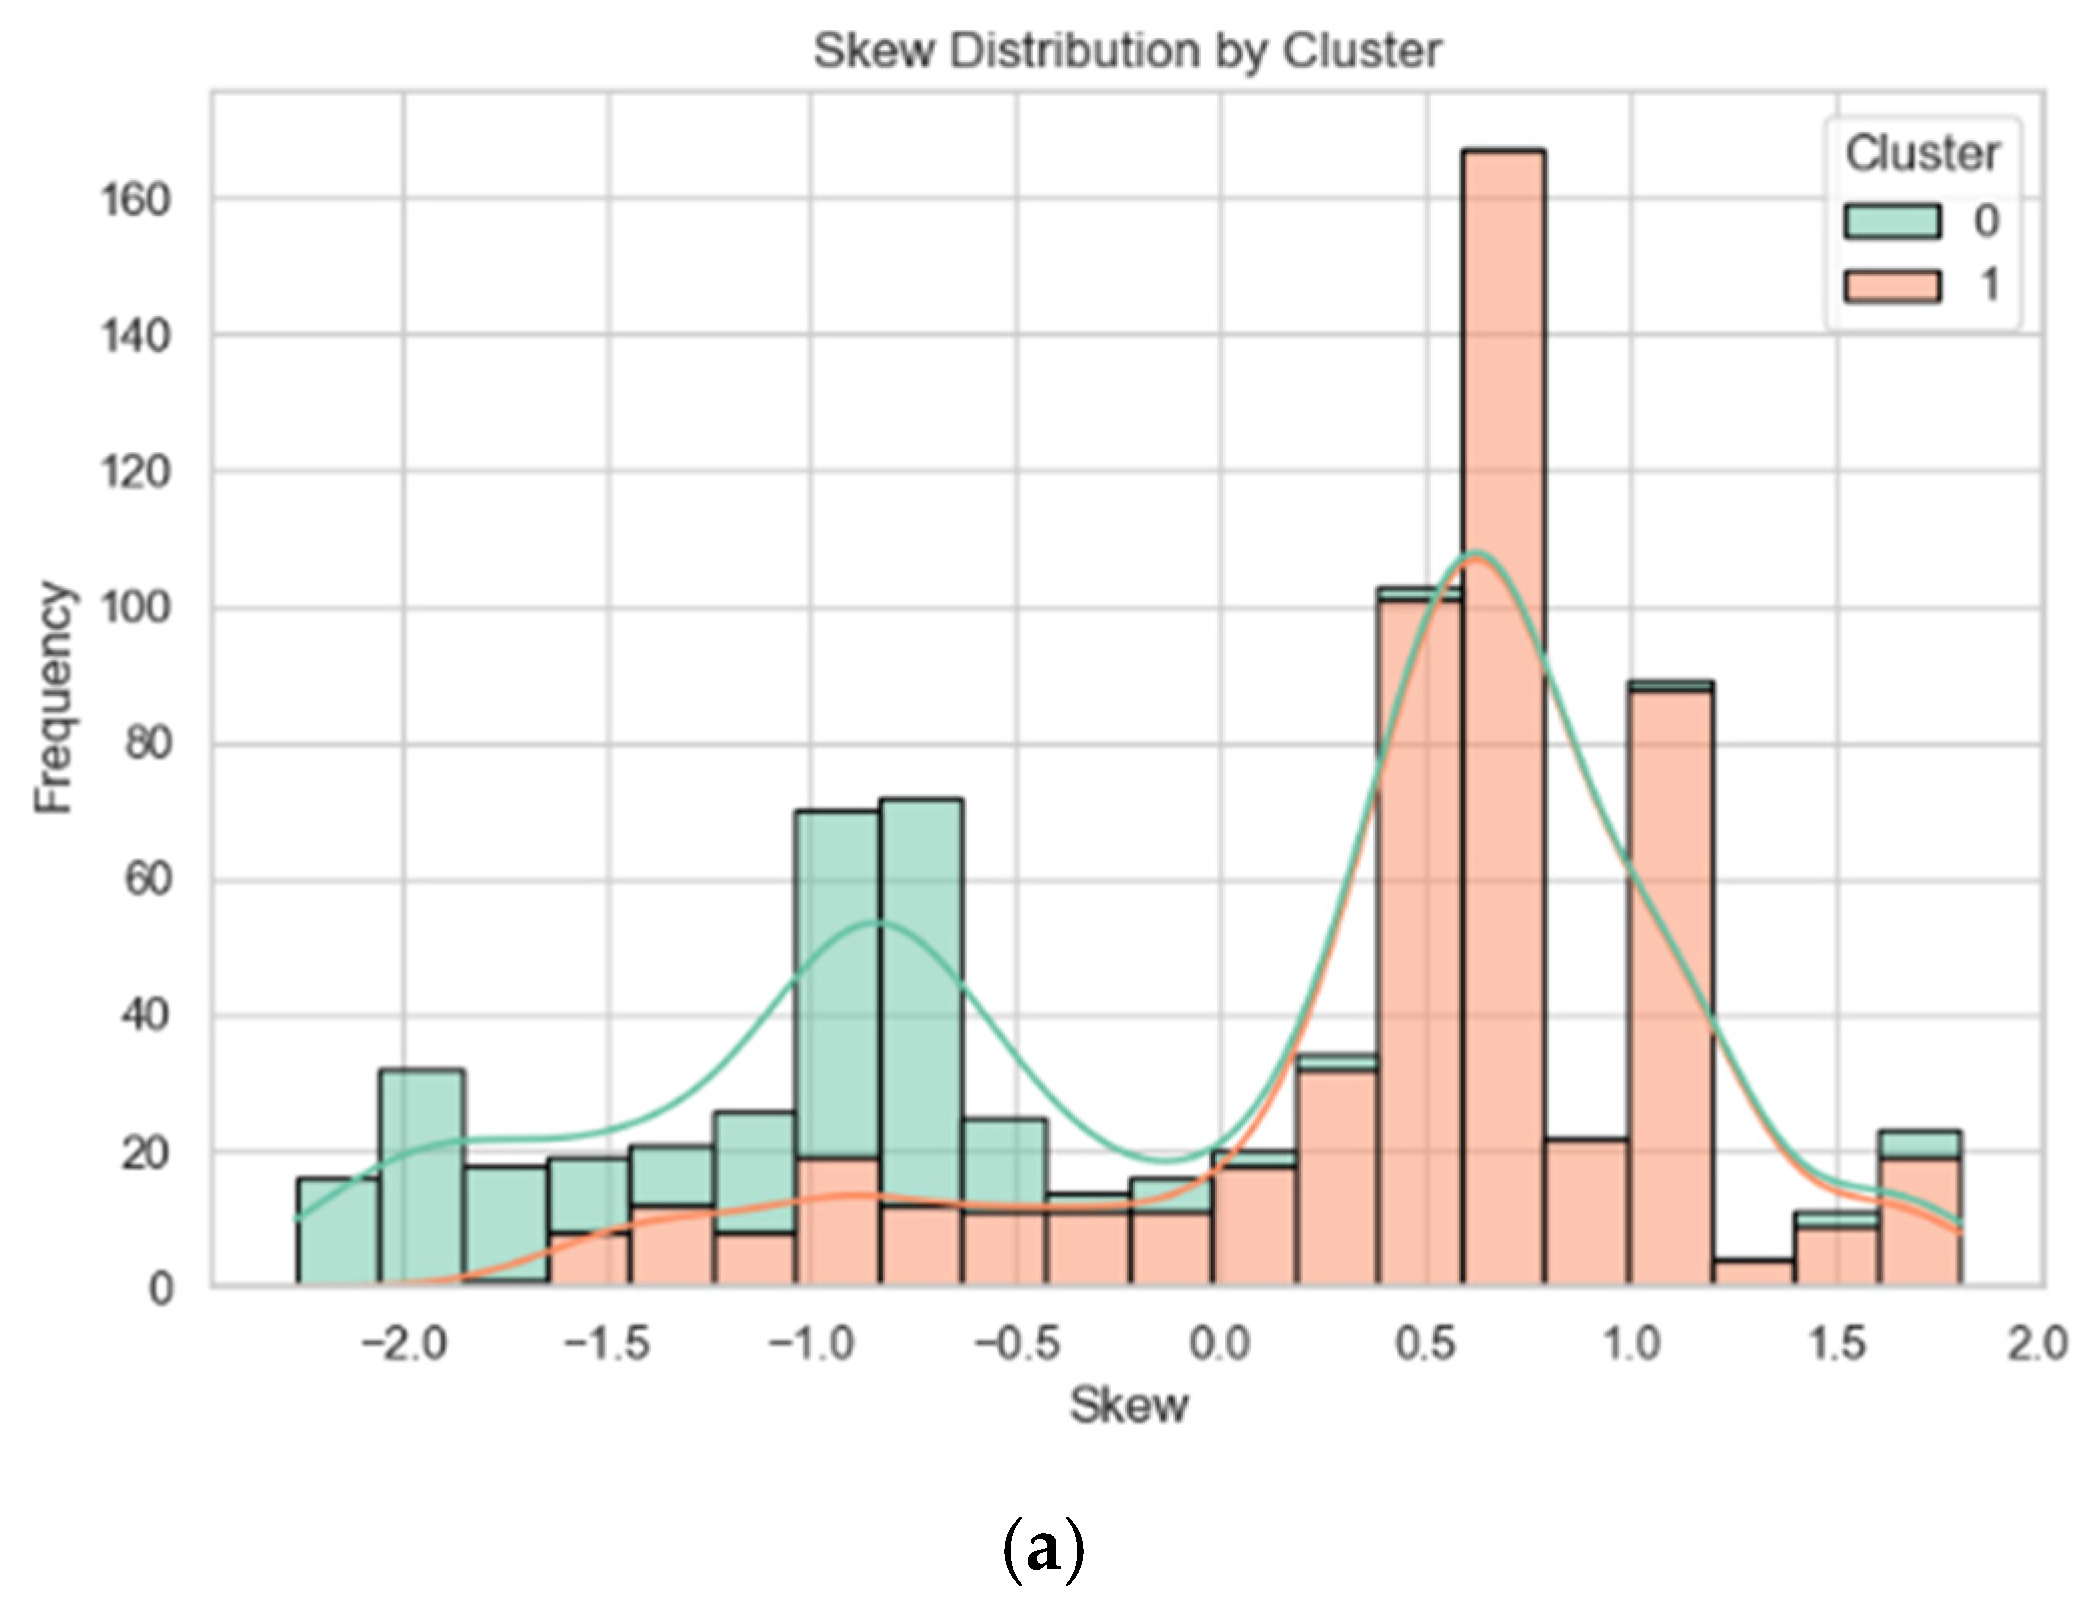
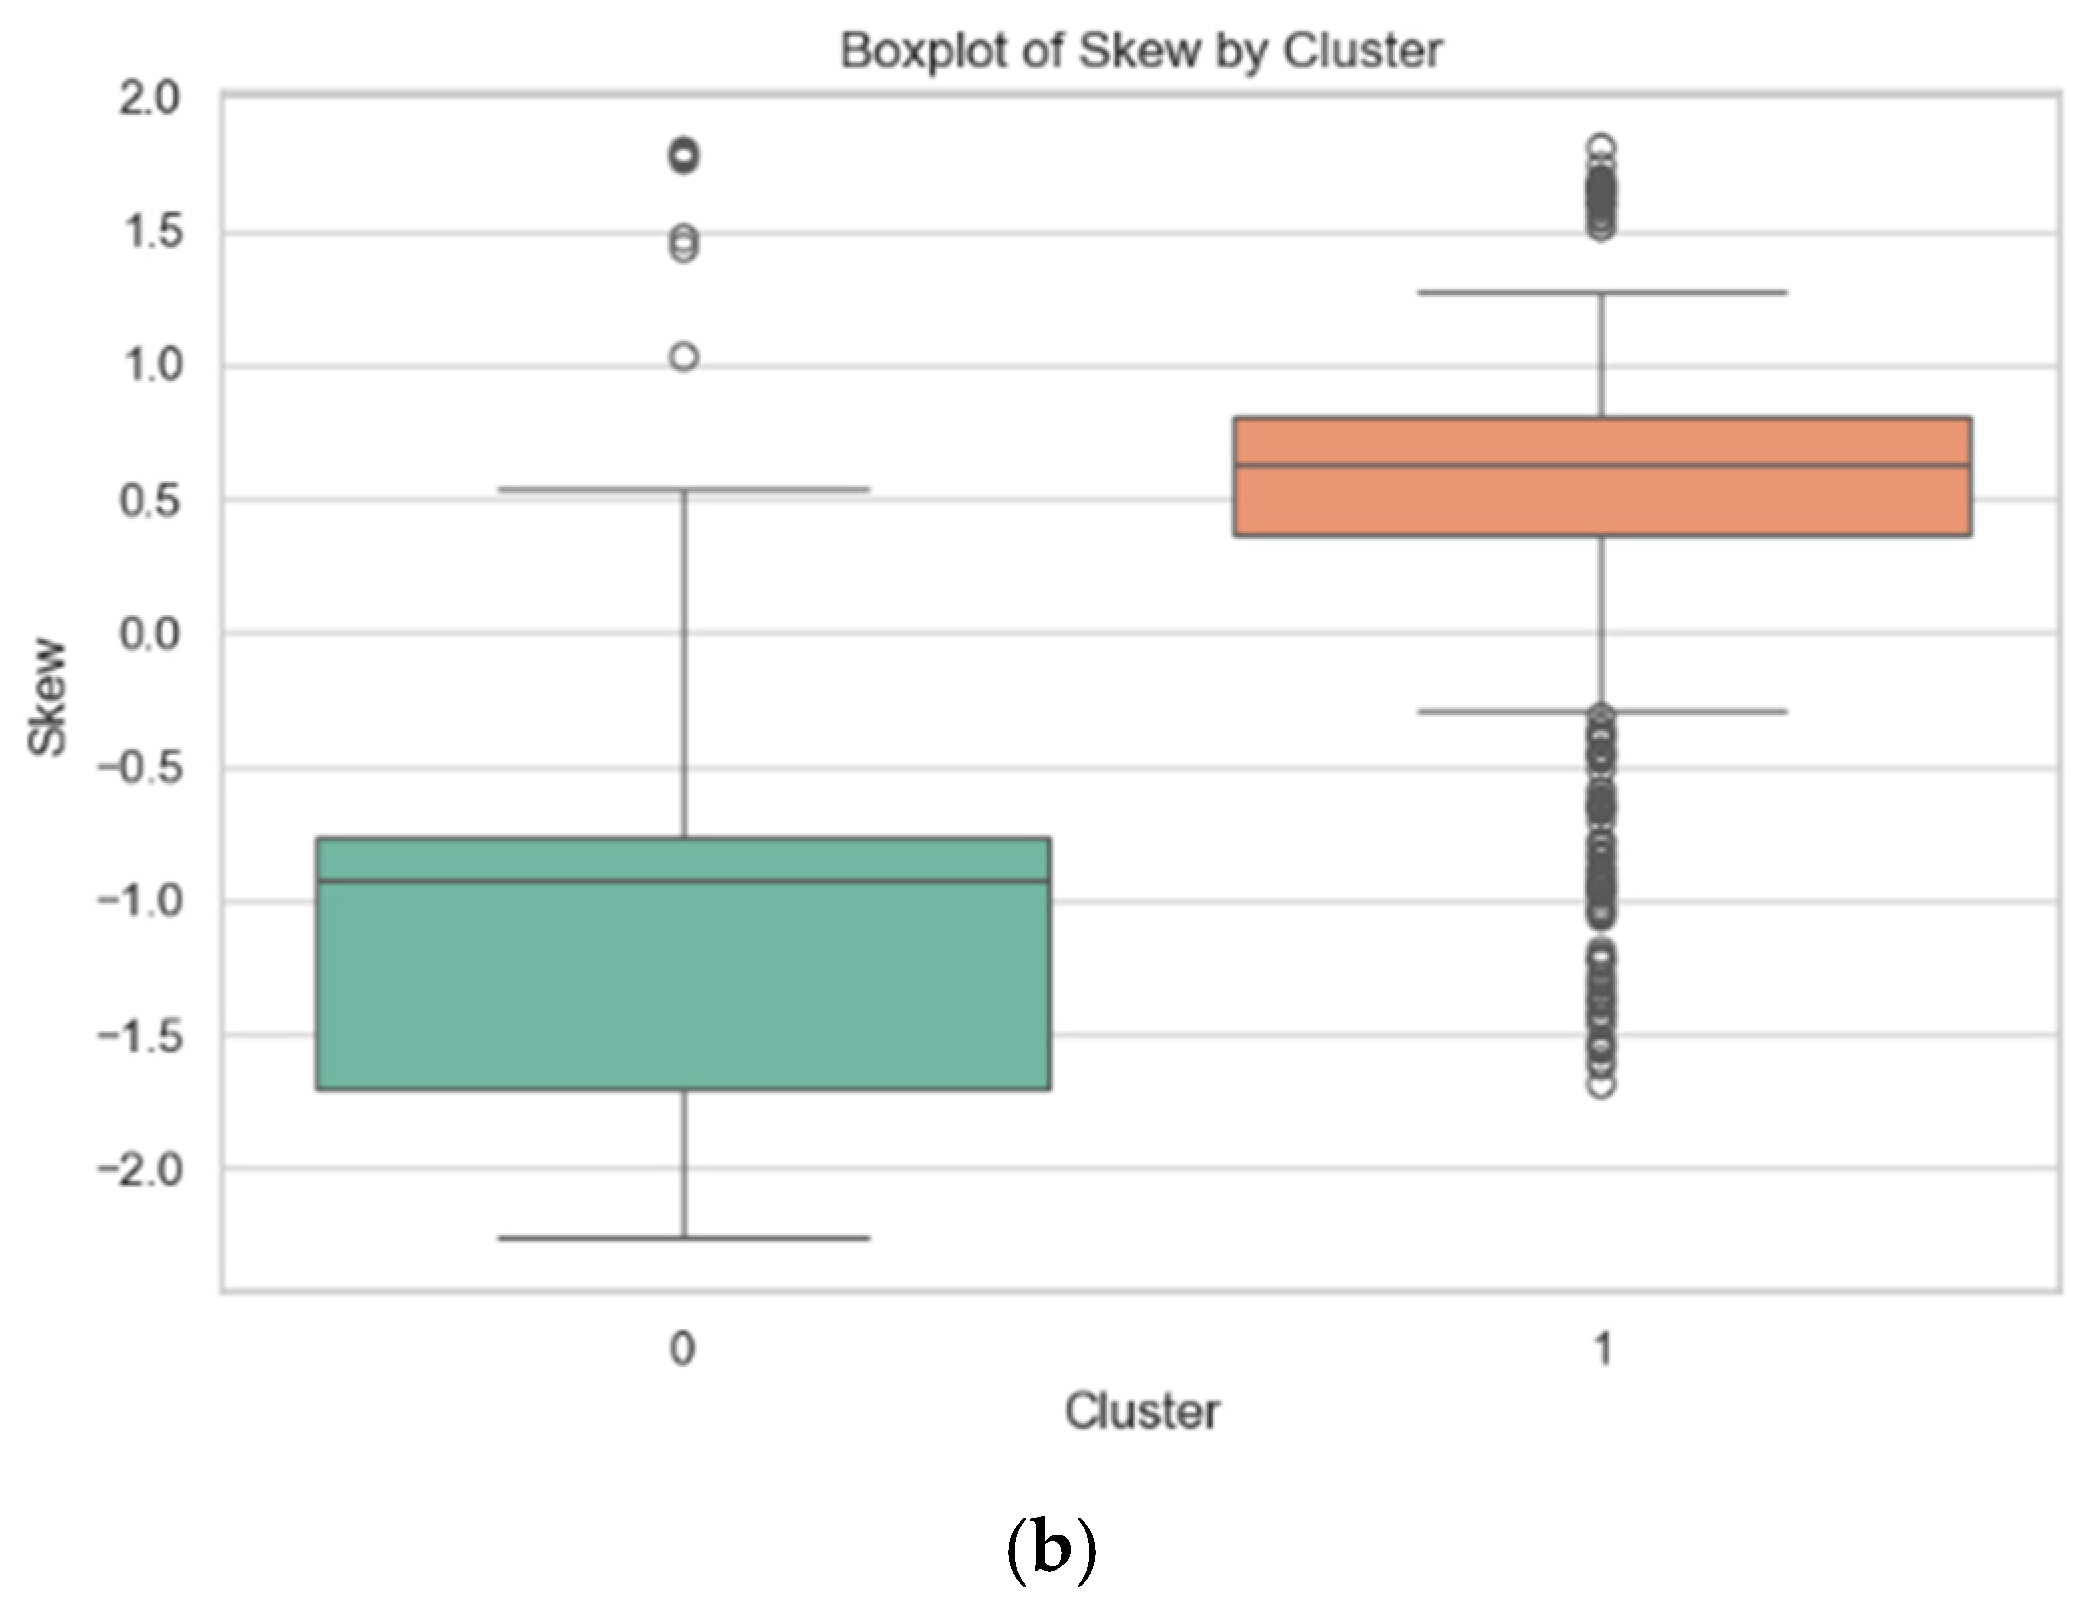
The results after extracting the features through the peak skewness are shown in
Figure 7.
Figure 7a presents the frequency distribution of the skewness values of the two types of engine hot jets, and the KDE curve depicts the probability density distribution of the skewness values. The skewness distributions of type 0 and type 1 are significantly different. The skewness distribution of type 0 is relatively dispersed, covering a wide range from negative values to positive values, indicating that the spectral data of this type of hot jet has greater diversity in the asymmetry of the peak shape. It suggests that type 0 includes various different engine operating states or hot jet components, resulting in different asymmetric manifestations of spectral features. For example, in some operating conditions, there may be more impurities or incompletely burned substances in the wake flow, causing the peak to show different degrees of left or right bias. As shown in
Figure 7b, in contrast, the skewness values of type 1 are mainly concentrated in the positive region, indicating that the data distribution is mostly right-skewed, and the distribution is relatively concentrated. This implies that the spectral data of type 1 hot jets has relatively similar peak asymmetry characteristics, possibly corresponding to the wake flow generated under a relatively stable engine operating condition, or the spectral characteristics of the main components in the wake flow are relatively consistent, causing the peak shape to tend towards a right-tailed distribution.
3.4. Multi-Dimensional Feature Verification Experiment
Extract the key features such as peak position, intensity, kurtosis, and skewness from the FTIR spectral data of the aero-engine tail flow and construct a multi-dimensional feature vector. To verify the effectiveness of the feature vector, we use the unsupervised clustering algorithm. Combine these features of each sample into a vector, thereby constructing a multi-dimensional feature matrix , where represents the number of samples and is the multi-dimensional feature vector of the i-th sample. After standardizing the extracted multi-dimensional feature matrix using StandardScaler, it is input into the GMM model for clustering.
The GMM model iteratively estimates the parameters (mean, covariance, and weight) of each Gaussian distribution through the EM algorithm, maximizing the likelihood function of the data. After the model is trained, it performs clustering predictions on new data points. Based on the probability that each aero-engine wake sample belongs to each Gaussian distribution, it is assigned to the cluster with the highest probability.
In this study, the probability distribution model of the multi-dimensional feature matrix
can be expressed as follows:
where
represents the number of Gaussian distributions, which is also the number of clusters.
denotes the coefficient of the k-th Gaussian distribution, satisfying
, indicating the contribution proportion of the k-th Gaussian distribution in the mixture model.
is the probability density function of the k-th Gaussian distribution,
, where
is the mean of the k-th Gaussian distribution and
is the standard deviation.
represents the parameters of the k-th Gaussian distribution.
Suppose the multi-dimensional feature matrix follows a Gaussian distribution with mean
and standard deviation
. Then, the implicit parameters of each spectrum in the feature matrix can be solved using the Expectation–Maximization (EM) algorithm. That is, for the multi-dimensional feature matrix
, the corresponding parameters are
. The Gaussian model parameters
can be estimated using the EM algorithm. First, initialize the model parameters. Using the current model parameters
, calculate the probability that the multi-dimensional feature matrix
comes from the k-th sub-model:
where
represents the probability of sample
belonging to the k-th cluster.
Then, update the model parameters and repeat the iterative calculation multiple times. Then, based on the results of each parameter, obtain the clustering results of the multi-dimensional feature moments.
where
represents the effective number of samples in the k-th cluster and
represents the proportion of the k-th cluster among all samples.
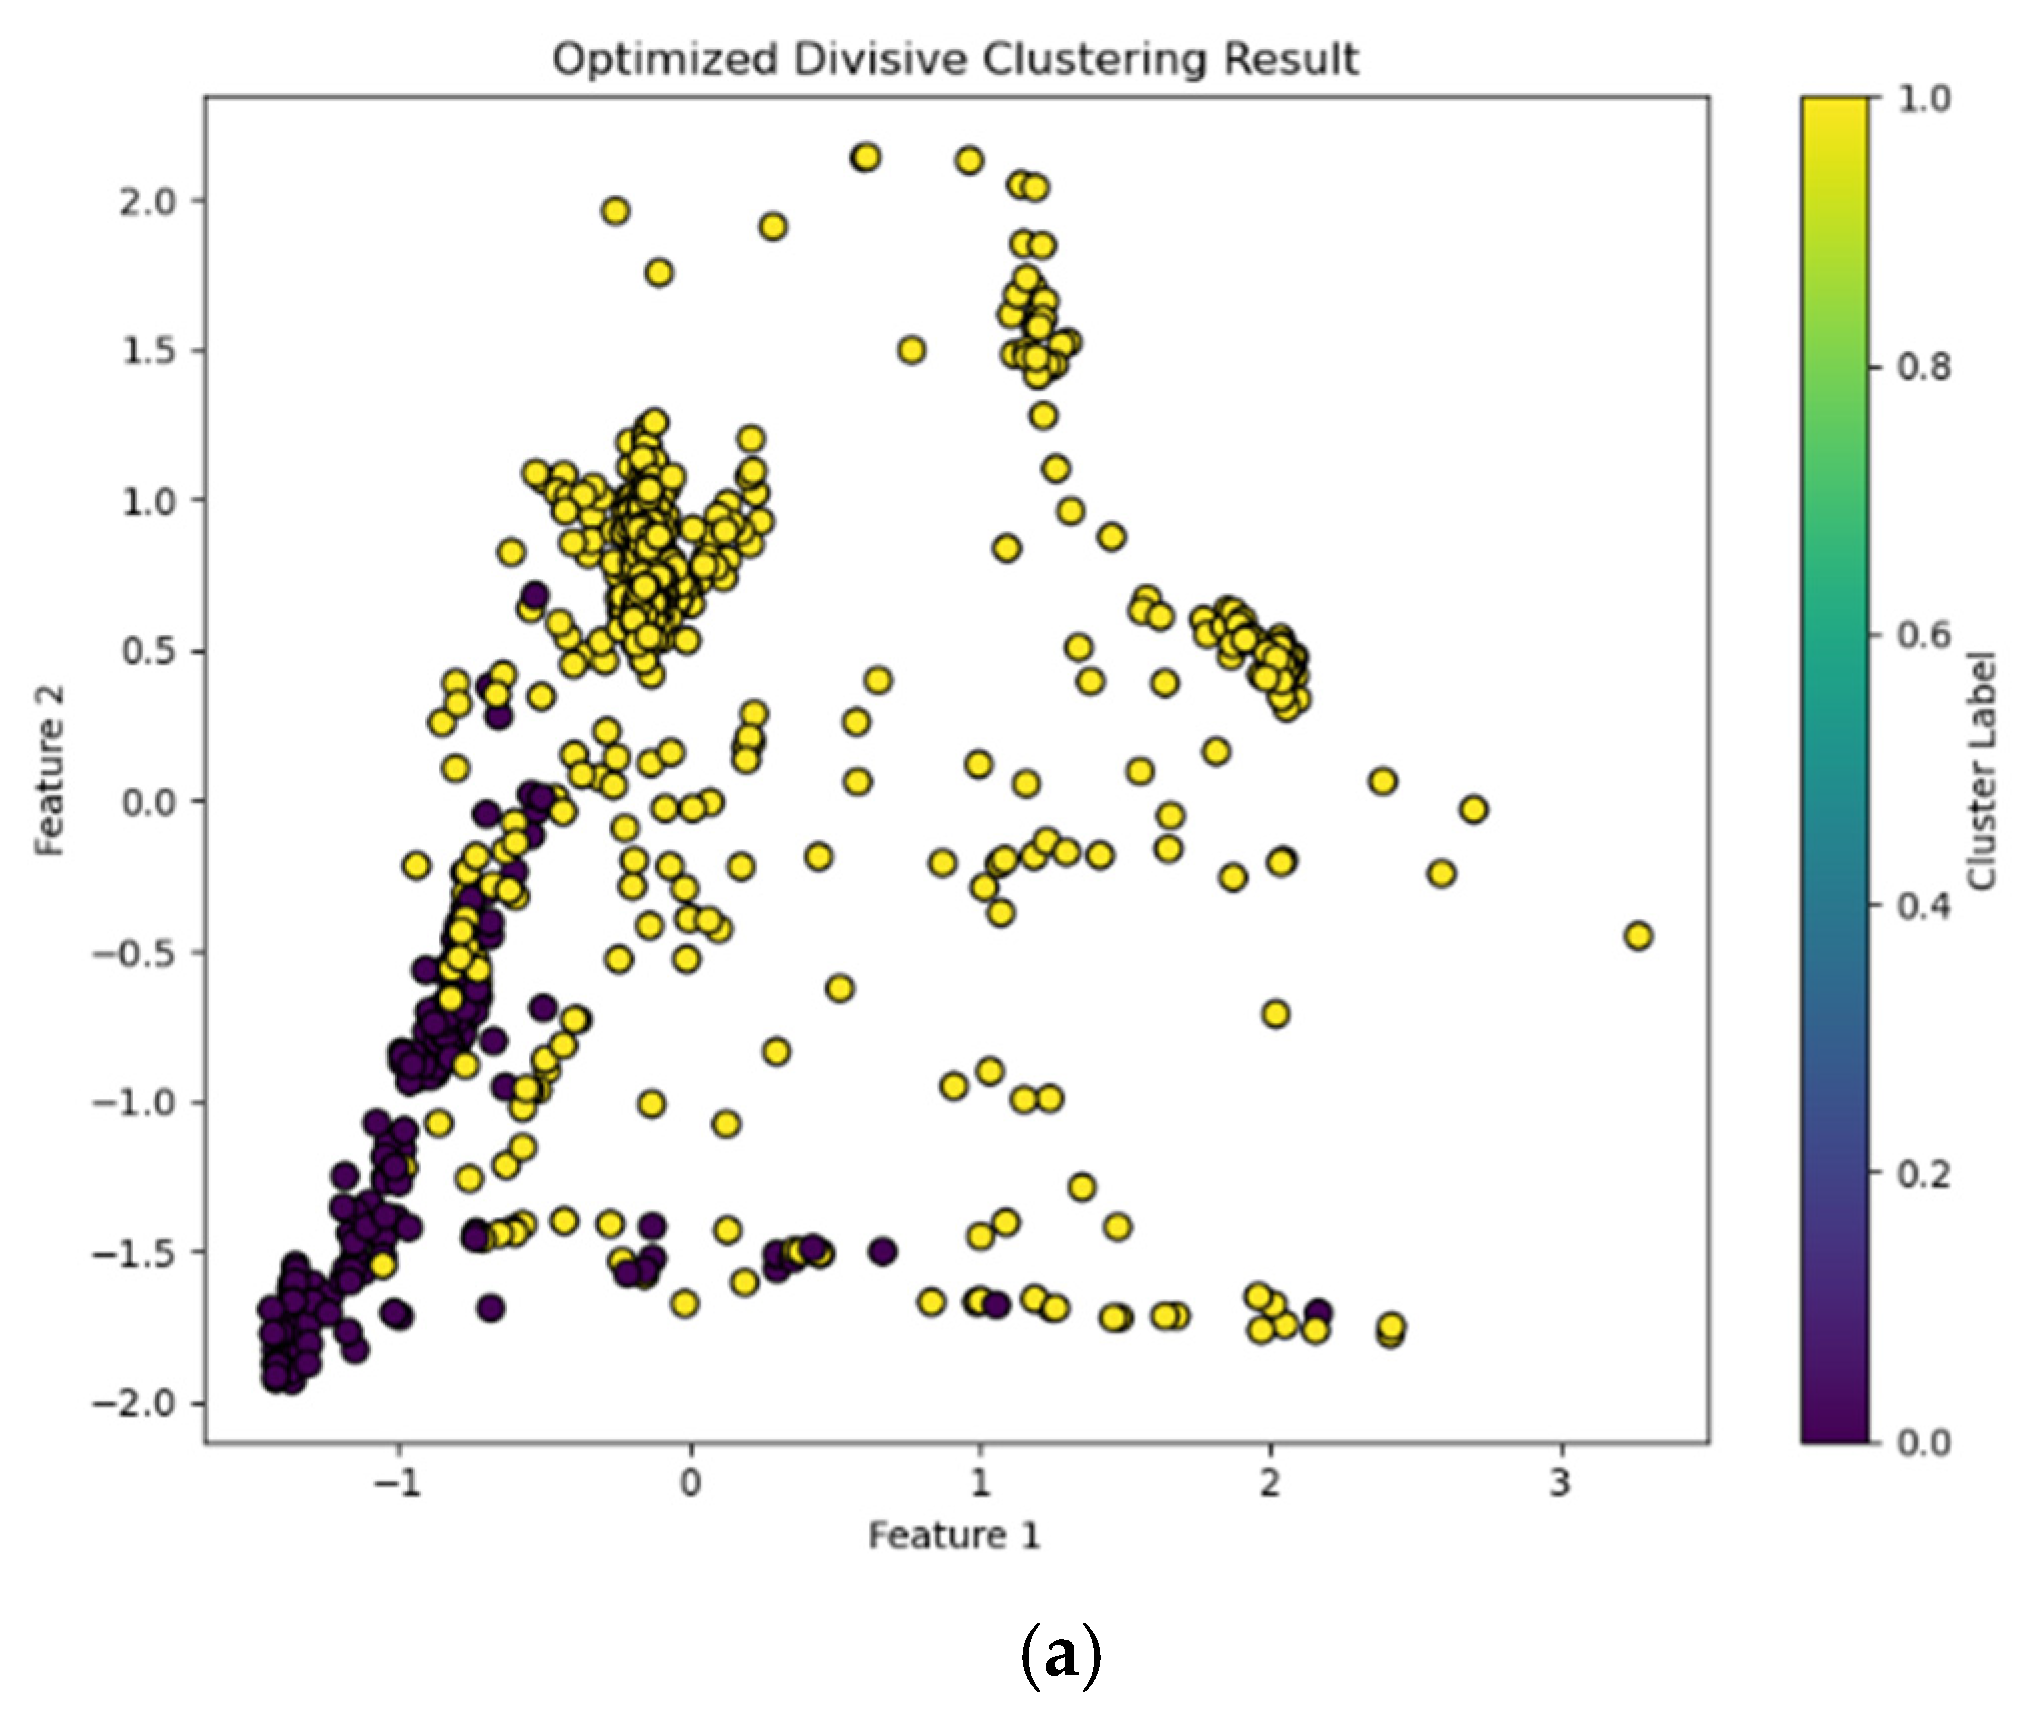
We compared the common other clustering models: divisive clustering and agglomerative clustering [
28].
Figure 8 shows the resulting graph after clustering. Compared with divisive clustering and agglomerative clustering, the GMM clustering algorithm can to some extent distinguish the two types of hot jets of the aero-engines, and the clustering effect is the most obvious.
We used the evaluation metrics of accuracy, AUC, and F1 score.
Table 2 shows the results of each clustering algorithm. It can be seen that GMM performed exceptionally well in these performance indicators, while divisive clustering and agglomerative clustering performed relatively poorly.
where TP represents true positive cases (where the prediction is correct and the actual outcome is positive), TN represents true negative cases (where the prediction is correct and the actual outcome is negative), FP represents false positive cases (where the prediction is incorrect and the actual outcome is negative), and FN represents false negative cases (where the prediction is incorrect and the actual outcome is positive).
4. Discussion
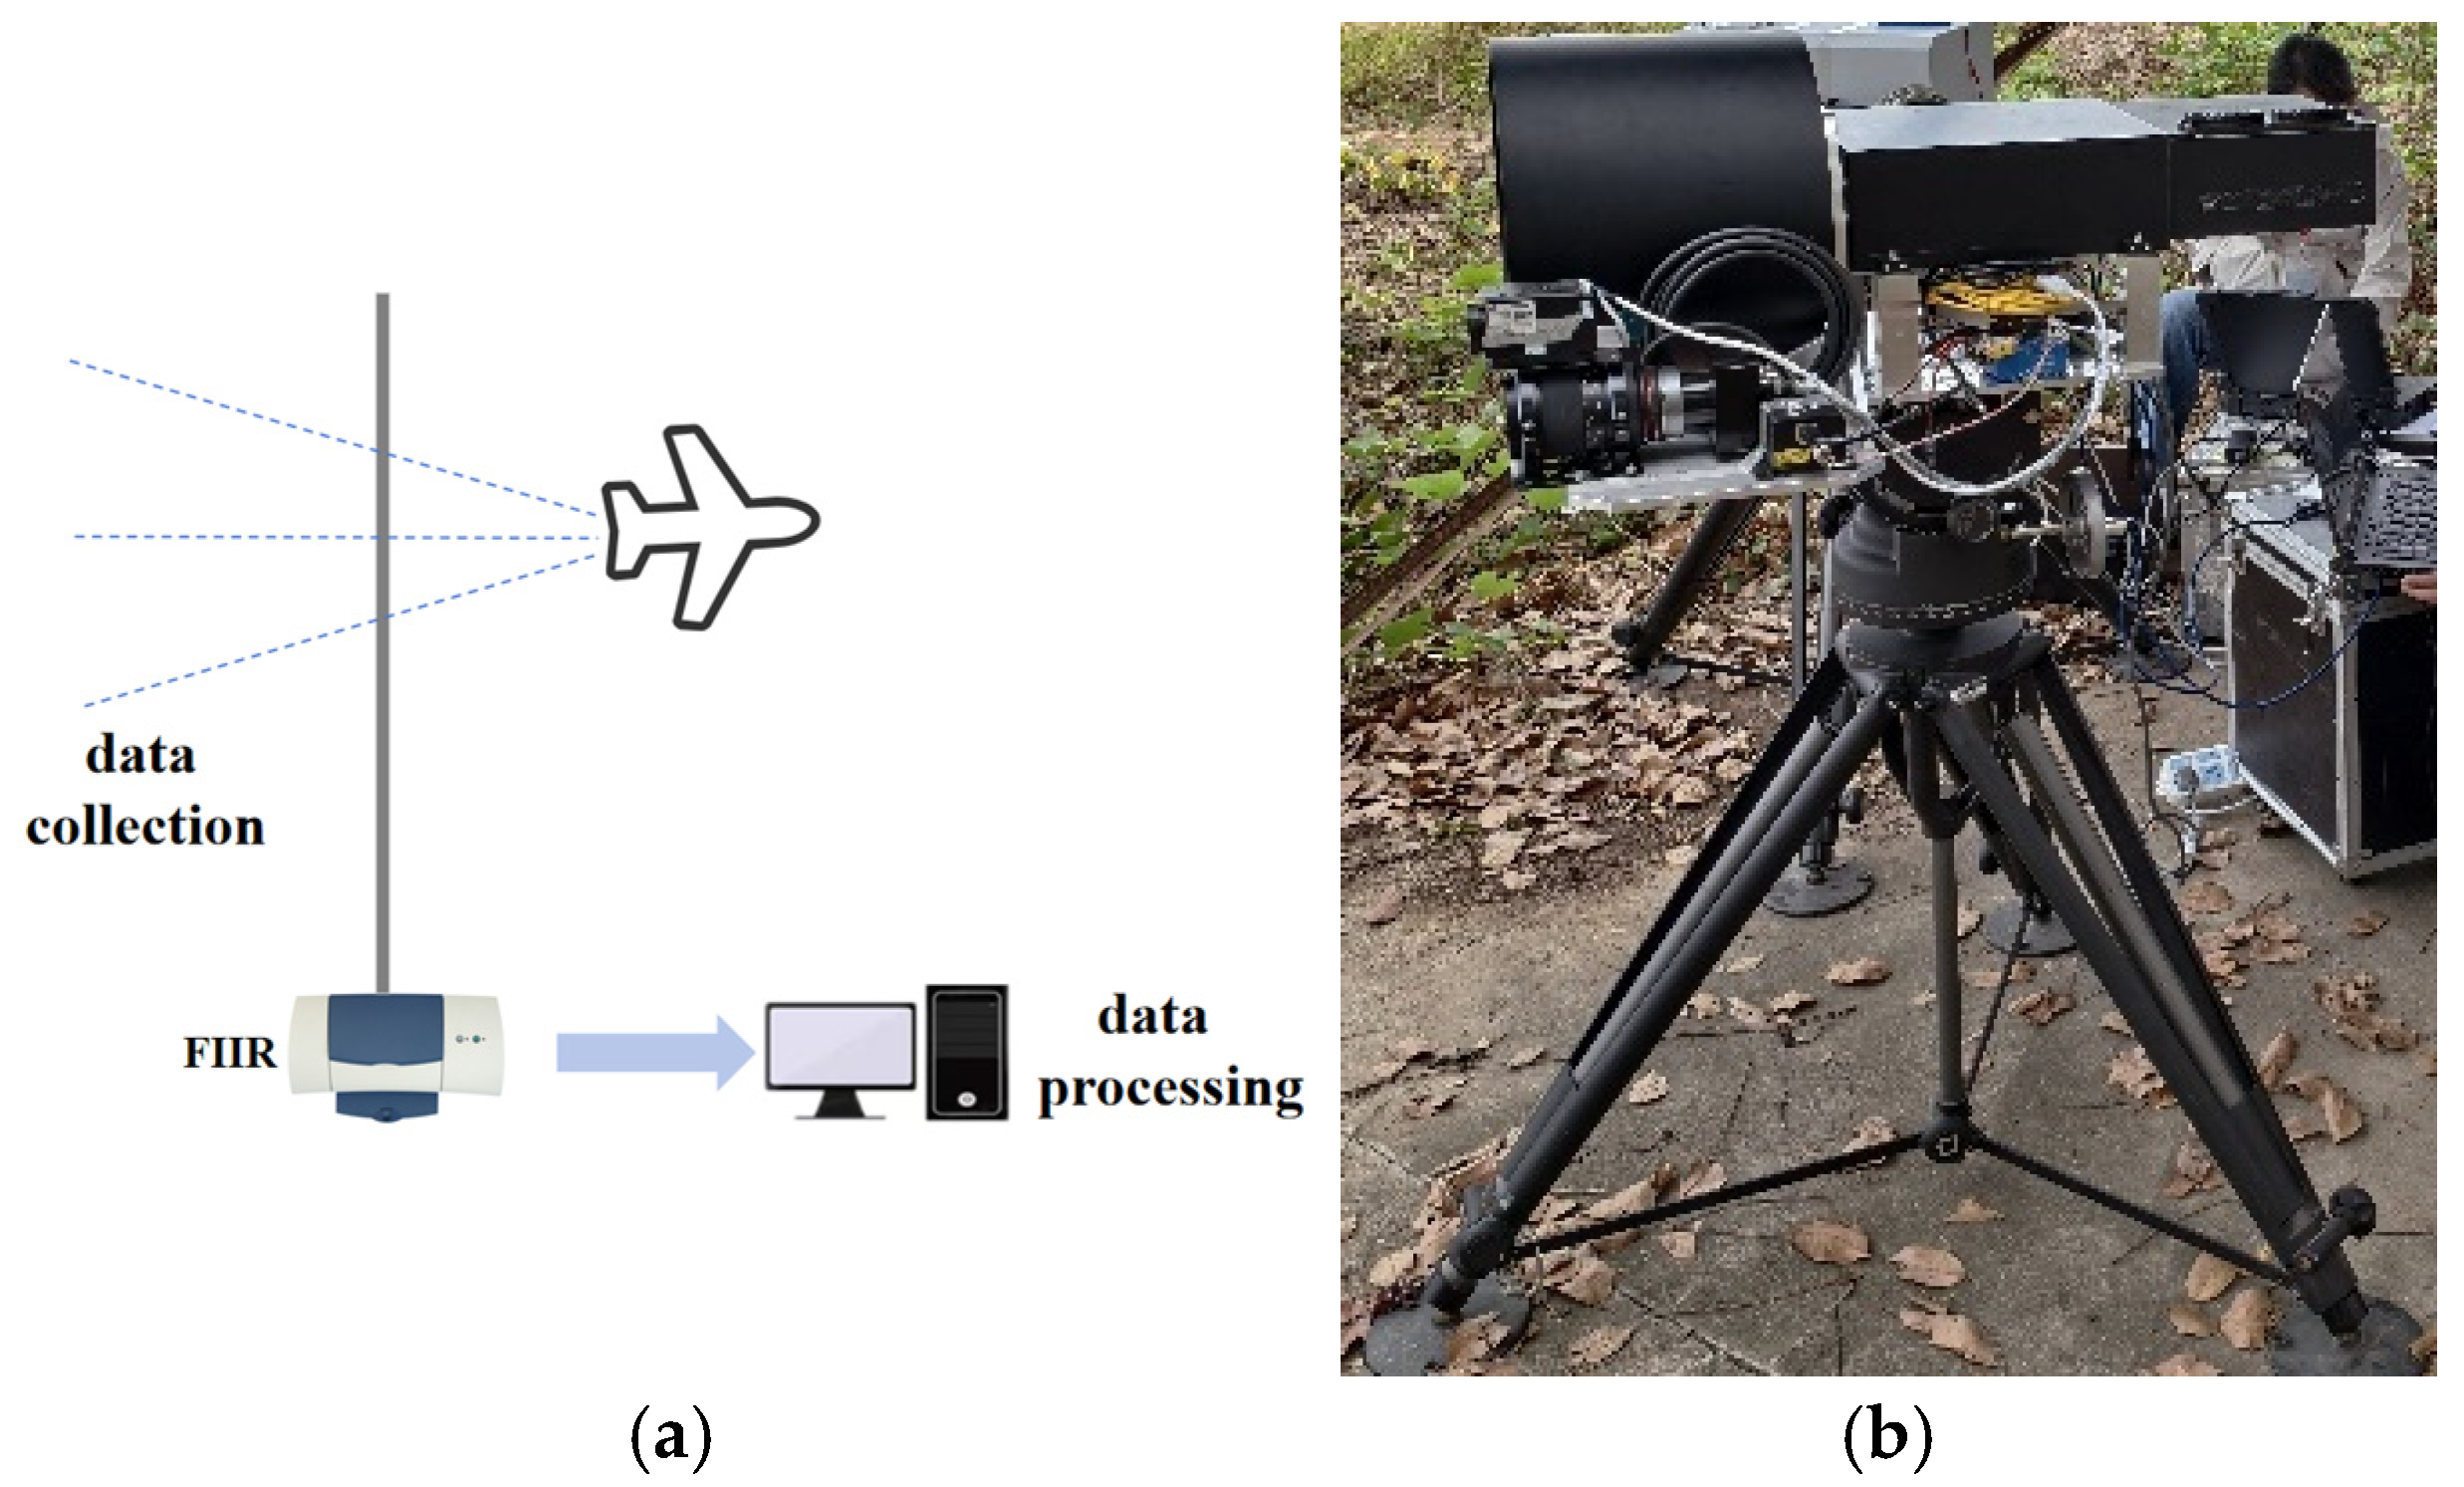
This study focuses on the issue of constructing the hot jet characteristics of two types of aero-engines and adopts the field measurement method for research. To ensure the comparability of data, the experiment strictly controls the measurement environmental parameters (temperature, humidity, etc.) and geometric conditions (measurement distance, angle, etc.), and uses a Fourier transform infrared spectrometer to collect spectral data from the center area of the engine’s tail nozzle. The temperature at the tail nozzle of an aero-engine is extremely high (ranging from 1500 to 2000 K), and direct measurement poses safety risks. In field experiments, considering the safety of the measurement personnel and the stability of the spectrometer, the spectrometer was deployed on the side of the aero-engine. The distance between the hot jet source and the spectrometer was within 127–280 m. Although the setting of the measurement angle and distance ensured operational safety, it also led to a certain degree of attenuation of the hot jet radiation signal. In particular, the atmospheric transmission along the measurement path would cause absorption and attenuation of the spectrum. During the field experiment collection, after the calibration was completed, the background spectrum was collected. When the instrument was obtaining the hot jet spectrum data of the aero-engine, it automatically completed the background subtraction. Given that the temperature difference between the hot jet and the background is significant, this method is currently used to achieve a rough background subtraction. In the data analysis stage, the radiation brightness temperature spectra in the 400–4000 cm−1 characteristic band are selected for modeling processing. This study employs a multi-stage refined peak extraction algorithm to analyze the FTIR spectral data of the hot jets of the two types of engines and successfully extracts the key characteristic peaks. The results show that the components of the hot jets of both types of engines are closely related to CO2 and isocyanate-based compounds, but there are significant differences in their content distribution. This difference may be attributed to multiple factors. At the combustion process level, the type and composition of the fuel and the combustion conditions (temperature, pressure, air–fuel ratio, etc.) directly affect the generation of combustion products; in terms of engine structural design, differences in the shape and size of the combustion chamber and nozzle design can alter the gas flow mixing and fuel injection effect, thereby interfering with combustion efficiency and product distribution; in terms of operating conditions, changes in load and speed cause alterations in fuel supply, air flow, combustion temperature and pressure, etc., affecting the combustion process; in addition, changes in environmental temperature and pressure, by influencing the intake state of the engine, indirectly affect the content distribution of combustion products.
This study extracts multiple key features from the FTIR spectral data of aero-engine exhaust plumes, including peak position, intensity, kurtosis, and skewness. These features describe the characteristics of the spectra from different perspectives and, when combined, form a multi-dimensional feature vector. The peak position reflects the specific location of the absorption peak in the spectrum, which is related to the absorption characteristics of specific substances; the peak intensity indicates the content or concentration of the substance in the exhaust gas; kurtosis describes the sharpness of the peak, reflecting the concentration or dispersion of the data distribution; and skewness characterizes the asymmetry of the peak, which helps to elucidate the direction of the influence of special substances on the spectrum. The kurtosis and skewness of the brightness temperature spectrum can be used to infer the component concentration gradient, temperature field symmetry, and flow state of the hot jet without direct contact, providing a spectralological basis for engine fault prediction. For example, during normal combustion, the radiation peak of the CO2 component shows a narrow band distribution and has a high kurtosis. If unburned kerosene mixes with the combustion products, the kurtosis will decrease. Under normal operating conditions, the overall distribution of the brightness temperature spectrum is approximately symmetrical. If the concentration of the oxidant (such as O2) in the hot jet decreases along the flow direction, the downstream combustion is insufficient, and the CO concentration increases. Correspondingly, the skewness of the brightness temperature at 2143 cm−1 is rightward. This multi-dimensional integration enhances the robustness of the model against noise and measurement fluctuations, providing a richer and more discriminative structured input for subsequent classifiers.
In this study, the dataset exhibits a significant class imbalance issue, with only 280 samples of type 0. To address this problem, white noise was added to the 0-type samples for data augmentation, increasing the sample size to 560. The feature processing method presented in this paper was then applied. The clustering results based on the Gaussian mixture model (GMM) showed that the model accuracy reached 77.08%, the AUC value was 0.77, and the F1 score was 76.79%. When attempting to use the generative adversarial network (GAN) for data augmentation, the clustering performance actually decreased. In-depth analysis revealed that the features of the two types of aero-engine hot jets have extremely small inter-class distances in the high-dimensional space, belonging to a low-discrimination feature scenario. Although the GAN-generated samples increased the number of 0-type samples, due to the high overlap of the feature manifolds of the two types, it was difficult to maintain inter-class discriminability of the generated samples, resulting in a large amount of pattern overlap in the feature space after expansion. The current research is limited by the sample size. If more hot jet data from different types of aero-engines can be obtained in the future, we will use the existing feature construction method to mine the data features and achieve precise classification and identification of different types of engines. This exploration is expected to open up a new path in the field of aero-engine fault diagnosis. Building a more comprehensive feature library and classification model will help improve the accuracy and timeliness of fault diagnosis and provide innovative solutions for aero-engine health management.
