Article

Mapping the Cerrado–Amazon Transition Using PlanetScope–Sentinel Data Fusion and a U-Net Deep Learning Framework

by
Chuanze Li
1,
Angela Harris
1,
Beatriz Schwantes Marimon
2,
Ben Hur Marimon Junior
2,
Matthew Dennis
1 and
Polyanna da Conceição Bispo
1,*
1
Department of Geography, School of Environment, Education and Development, University of Manchester, Oxford Road, Manchester M13 9PL, UK
2
Departamento de Ciências Biológicas, Universidade do Estado de Mato Grosso, Campus de Nova Xavantina, Nova Xavantina 78690-000, Brazil
*
Author to whom correspondence should be addressed.
Remote Sens. 2025, 17(13), 2138; https://doi.org/10.3390/rs17132138
Submission received: 14 April 2025 / Revised: 18 June 2025 / Accepted: 19 June 2025 / Published: 22 June 2025
(This article belongs to the Section Forest Remote Sensing)

Abstract

The Cerrado-Amazon Transition (CAT) in Brazil represents one of the most ecologically complex and dynamic tropical ecotones globally; however, it remains insufficiently characterized at high spatial resolution, primarily due to its intricate vegetation mosaics and the limited availability of reliable ground reference data. Accurate land cover maps are urgently needed to support conservation and sustainable land-use planning in this frontier region, especially for distinguishing critical vegetation types such as Amazon rainforest, Cerradão (dense woodland), and Savanna. In this study, we produce the first high-resolution land cover map of the CAT by integrating PlanetScope optical imagery, Sentinel-2 multispectral data, and Sentinel-1 SAR data within a U-net deep learning framework. This data fusion approach enables improved discrimination of ecologically similar vegetation types across heterogeneous landscapes. We systematically compare classification performance across single-sensor and fused datasets, demonstrating that multi-source fusion significantly outperforms single-source inputs. The highest overall accuracy was achieved using the fusion of PlanetScope, Sentinel-2, and Sentinel-1 (F1 = 0.85). Class-wise F1 scores for the best-performing model were 0.91 for Amazon Forest, 0.76 for Cerradão, and 0.76 for Savanna, indicating robust model performance in distinguishing ecologically important vegetation types. According to the best-performing model, 50.3% of the study area remains covered by natural vegetation. Cerradão, although ecologically important, covers only 8.4% of the landscape and appears highly fragmented, underscoring its vulnerability. These findings highlight the power of deep learning and multi-sensor integration for fine-scale land cover mapping in complex tropical ecotones and provide a critical spatial baseline for monitoring ecological changes in the CAT region.

1. Introduction

The Brazilian Cerrado-Amazon Transition (CAT) is one of the most important ecotones in the tropics. As a crossroads of multiple ecosystems, the CAT exhibits unique patterns in ecosystem functioning, carbon and nutrient cycling, and biodiversity [1,2,3,4,5]. However, the CAT is not only experiencing severe vegetation degradation due to frequent fires [6,7] and climatic changes [2,8,9,10] but also due to increased human activities such as agricultural expansion, overgrazing, and commercial timber harvesting [5,11,12]. Large-scale deforestation in the CAT has disrupted the ecological balance [13,14,15], leading to the loss and decline of many vegetation species [16,17,18,19,20]. These persistent environmental pressures significantly threaten the ecological integrity of the region. However, current land cover classifications often lack the spatial resolution and thematic detail necessary to capture the fine-scale distribution and heterogeneity of transitional vegetation types like Cerradão, limiting our ability to map their distribution, monitor their responses to disturbance, and evaluate their ecological functions within the CAT. Addressing this gap is crucial for improving our understanding of ecosystem dynamics across this ecotone.
Cerradão is a unique vegetation type found within the CAT, representing a dense, tall, closed woodland formation within the Cerrado biome [21,22,23]. Owing to its high ecological dynamism—marked by rapid turnover and strong climate sensitivity—Cerradão is especially vulnerable to environment change and disturbances [24,25]. In the absence of fire, Cerradão also demonstrates an ability to expand into open savanna areas, underscoring its hyperdynamic nature and strong colonization potential [24,26]. Simultaneously, it is increasingly threatened by deforestation and escalating ecological pressures from agricultural expansion, ranching activities, and illegal logging [27]. However, the absence of targeted legal protection, stemming from its frequent subsumption under the broader Cerrado classification, has intensified the pressures it faces from land-use change and resource exploitation [1,28,29]. Despite the critical ecological challenges Cerradão faces, its accurate identification and differentiation from other tropical forests and Cerrado biome phytophysiognomies remain challenging. For example, Cerradão has a high canopy cover and a rich variety of tree species [21,22,24,30,31,32], which are easily confused with forest land cover using traditional classification methods. In addition, the vegetation in the CAT is highly spatially heterogeneous, fragmented [27,33], and the boundaries between different vegetation types are often unclear [34]. Therefore, more effective classification methods are urgently needed, especially as recent economic and political pressures threaten to revise official land classifications in Mato Grosso, potentially reclassifying forested areas and opening them to legal deforestation [35,36]. For instance, Bill No. 337/2022 proposes changes to the classification criteria for areas defined as Legal Reserves, potentially reducing forest protection in the Cerrado by allowing for the reclassification of native vegetation as non-forest. Similarly, the Supplementary Bill to PLC No. 18/2024 seeks to alter environmental zoning frameworks, aiming to expand agricultural and infrastructure development in previously protected zones. These legislative proposals could significantly weaken environmental safeguards and accelerate land-use change in ecologically sensitive regions such as the Cerrado–Amazon transition zone [37,38]. Improved mapping not only reveals the CAT ecosystem spatial structure but also supports the formulation of informed conservation and management strategies.
Previous studies that have attempted to map the CAT region have predominantly used medium-resolution (30 m) remotely sensed imagery [29,34,39,40]. However, the region’s heterogeneous species composition and dynamic ecological processes pose significant challenges for accurately identifying dominant vegetation types using such data. This is particularly true for Cerradão, which has largely disappeared across much of its former extent, now persisting only as scattered and disconnected fragments [1]. In other tropical areas of Brazil, vegetation mapping efforts are increasingly turning to high spatial resolution optical imagery, which offers more detailed surface characterization and enhances the ability to distinguish between vegetation types [41,42,43,44]. Despite its great potential, the use of high-resolution data in the CAT region has so far been largely limited to mapping deforestation and agricultural crops [45,46,47].
While high spatial resolution imagery offers advantages, for accurate vegetation detection and monitoring, especially in areas with highly heterogeneous vegetation communities, spectral characteristics, as well as the spatial resolution of satellite imagery, are important [48]. To address these challenges, researchers have explored data fusion techniques, combining high-resolution imagery with multispectral data to improve classification outcomes [49]. Beyond optical data, Sentinel-1 synthetic aperture radar (SAR), operating in the C-band with a wavelength of approximately 5.6 cm, plays a pivotal role in monitoring tropical ecosystems such as the Cerrado (Brazilian savanna). Its cloud-penetrating capability and sensitivity to vegetation structure make it especially valuable in regions with persistent cloud cover. Sentinel-1 data have been widely applied in near-real-time, large-scale monitoring of forest degradation and deforestation across tropical environments [50]. Furthermore, polarimetric SAR measurements have demonstrated sensitivity to variations in vegetation cover and structure, reinforcing their utility for assessing heterogeneous landscapes like the Cerrado and adjacent tropical forest systems [51]. Integrating radar and optical datasets has shown significant improvements in distinguishing vegetation types in ecologically complex regions such as the Amazon and Cerrado [39,52,53]. This multi-source synergy presents new opportunities to overcome the mapping challenges in the CAT region.
Remote sensing classification accuracy is influenced not only by data characteristics and site-specific factors but also by the choice of classification methods. Deep learning techniques—particularly U-net—are emerging as powerful tools for tackling the classification of heterogeneous and complex landscapes [54,55,56]. U-net algorithms excel at capturing intricate spatial patterns, even when training samples are limited, which is especially beneficial given the high costs and logistical difficulties of field data collection [57,58]. The proven success of U-net in tropical vegetation classification and disturbance assessment [59,60,61,62,63] further emphasizes its potential to provide new opportunities and possibilities for distinguishing fine-scale vegetation heterogeneity in the CAT region under the constraint of limited field data availability.
This study examines the ability of Planet, Sentinel-1, and Sentinel-2 imagery to map complex land cover patterns across the Brazilian CAT region and determine how effectively single-sensor and multiple-sensor combinations of Planet, Sentinel-1, and Sentinel-2 imagery can distinguish key vegetation types within the CAT, namely Amazonian forest, Cerradão, and Savanna. The findings will enhance our understanding of the spatial distribution and ecological characteristics of dominant vegetation types in the CAT region, providing valuable insights to support conservation and management strategies.

2. Study Area

Our study area is located in the Brazilian state of Mato Grosso, between 54°W and 12.7°S and 51.8°W and 14.6°S (Figure 1) and spans the traditional boundary between the Amazon and Cerrado biomes, covering the primary vegetation types characteristic of the CAT. The climate is primarily classified as Aw (Köppen climate classification) [64], which has distinct wet and dry seasons, with a mean monthly temperature ranging from ~24 to 27 °C and an annual average precipitation from ~1500 to 2300 mm [65].
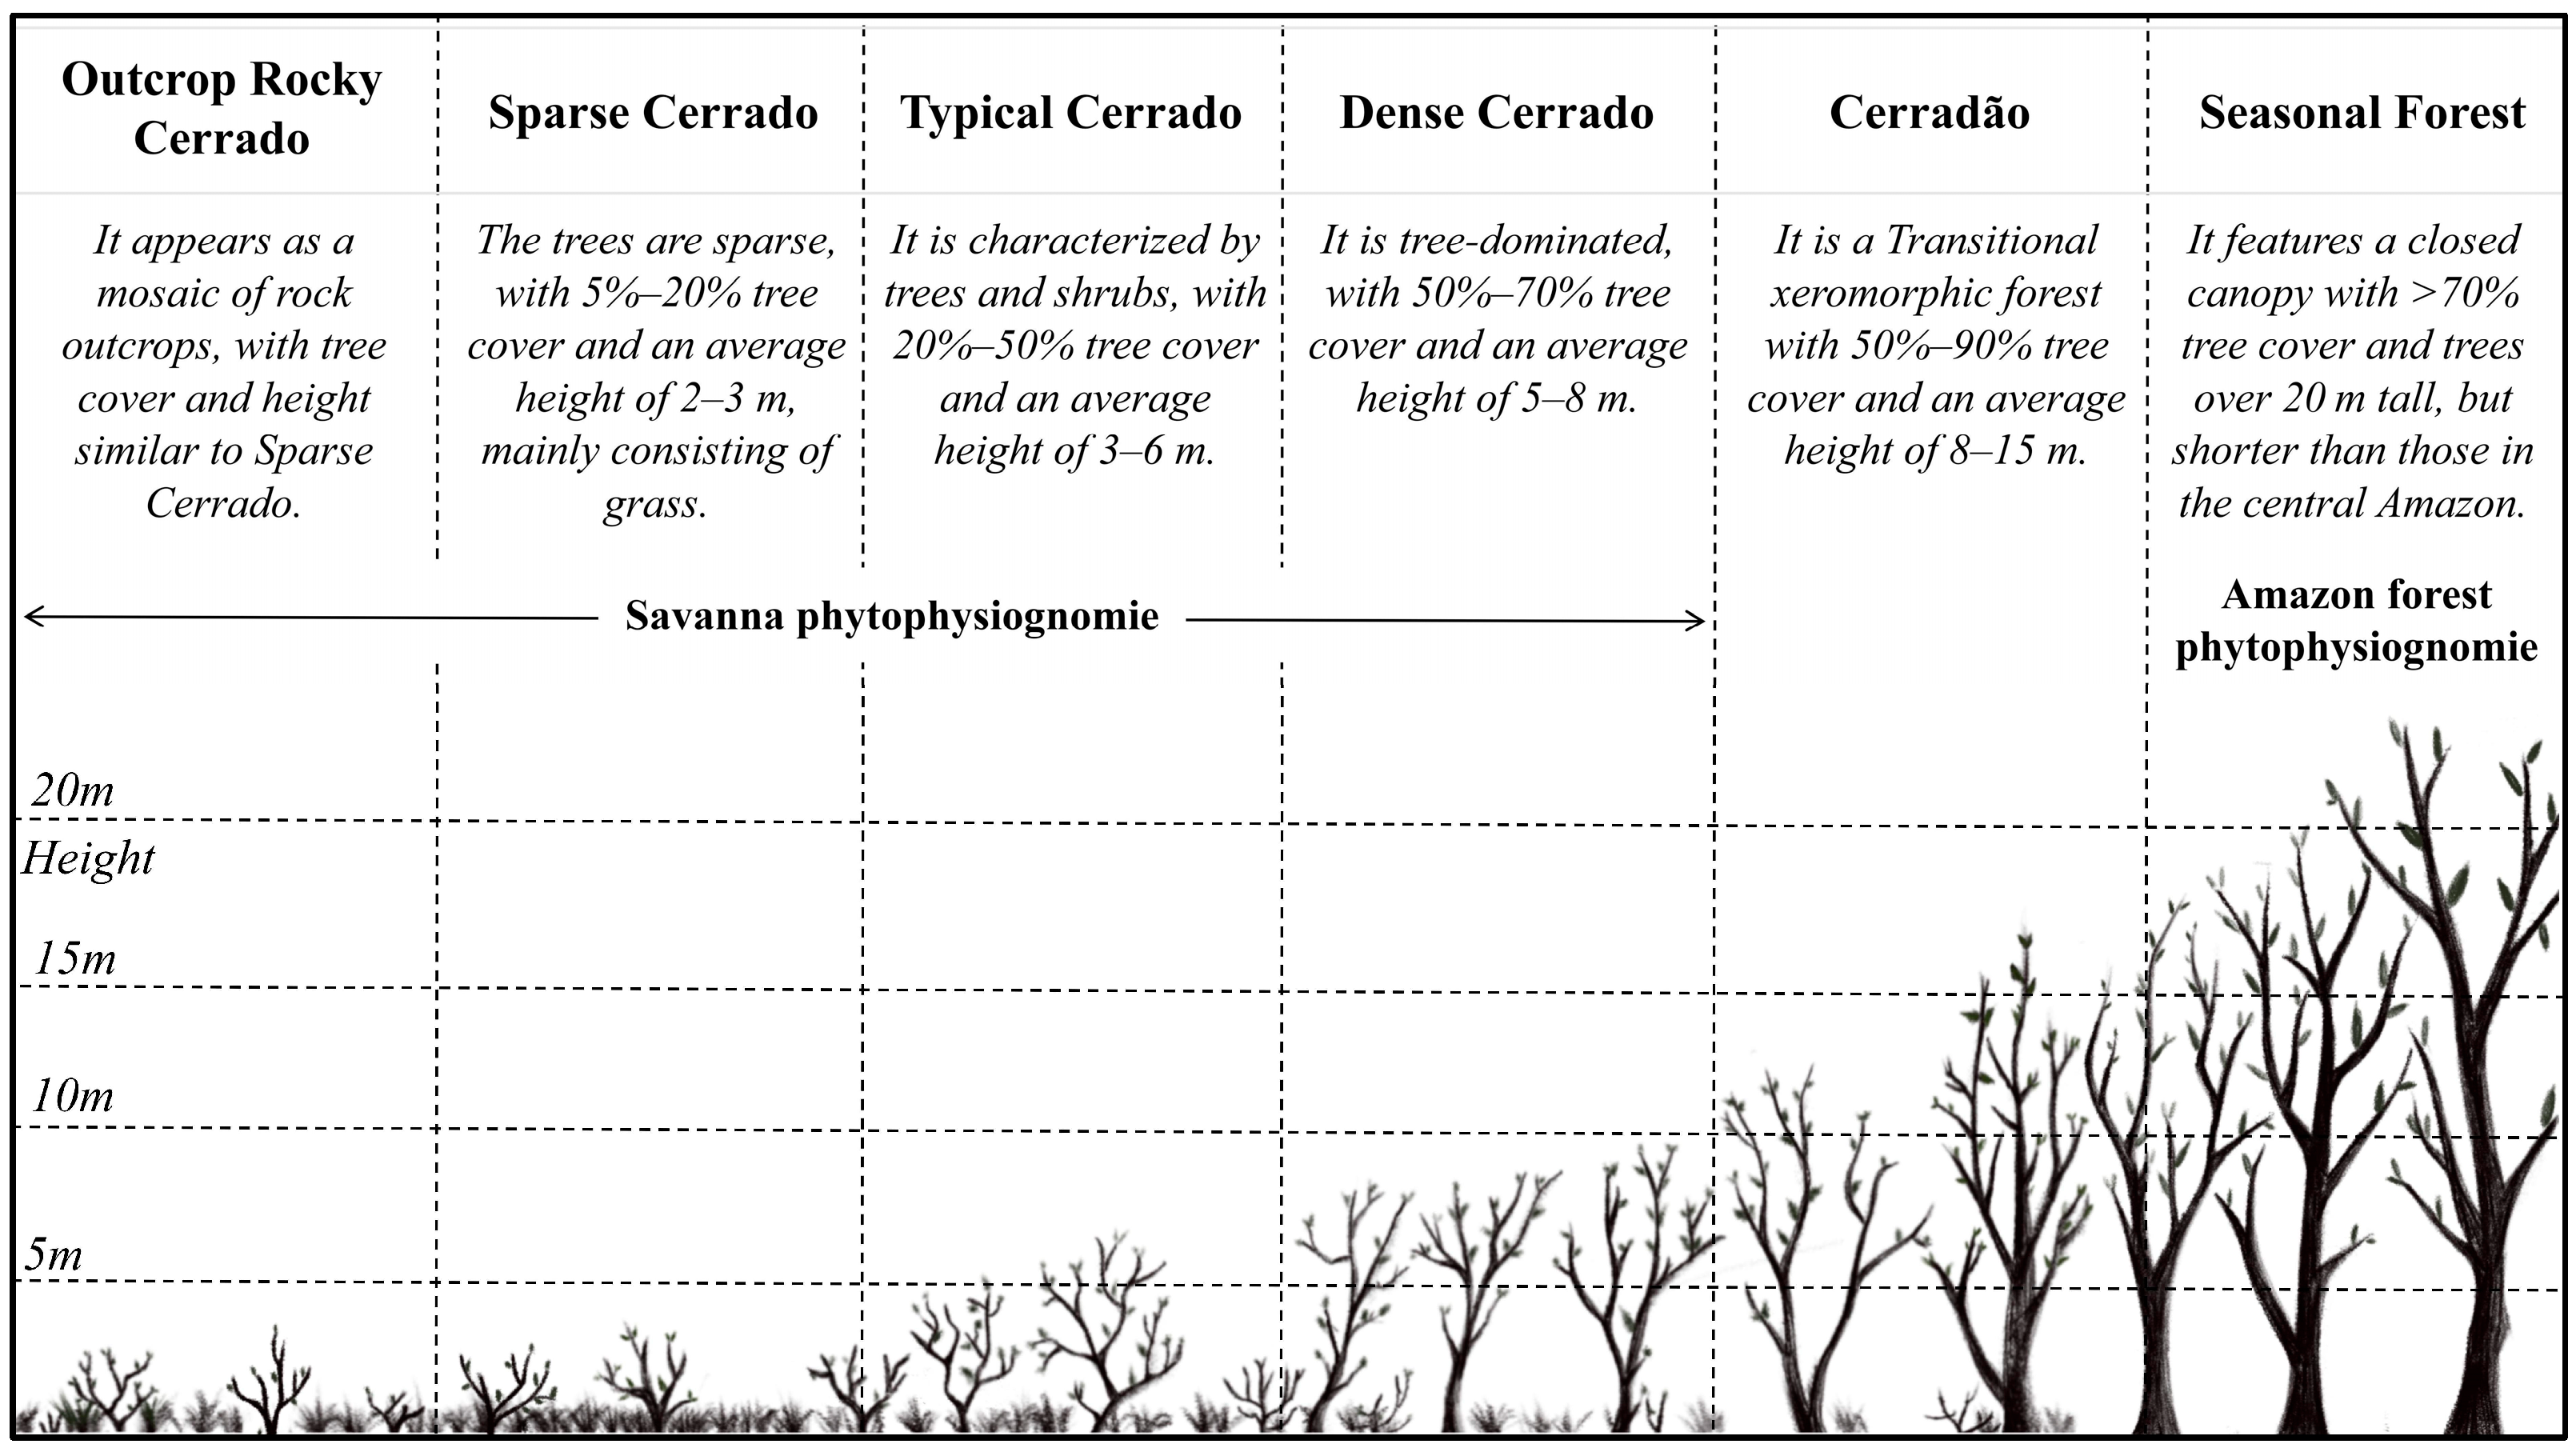
The vegetation in the northern part of the study area predominantly consists of tall, dense Amazon tropical forests (>70% cover and >20 m high), mainly including seasonal forests, along with some gallery and dry forests [29], which primarily grow on deep, highly weathered soils [67]. Moving southward, the vegetation gradually transitions into Cerradão and Savanna formations. Cerradão typically occurs in areas with dystrophic, low soil fertility [24,68,69], although canopy cover can range between 50% and 90%, and trees can be up to 15 m in height [22]. The savanna vegetation can be divided into 4 distinct phytophysiognomies (outcrop, sparse, typical, and dense cerrado) [2,10,21] is characterized by shorter trees (<8 m) and heterogeneous mixtures of trees, shrubs, and grassland [10,24,29] (Figure 2).

3. Data and Methods

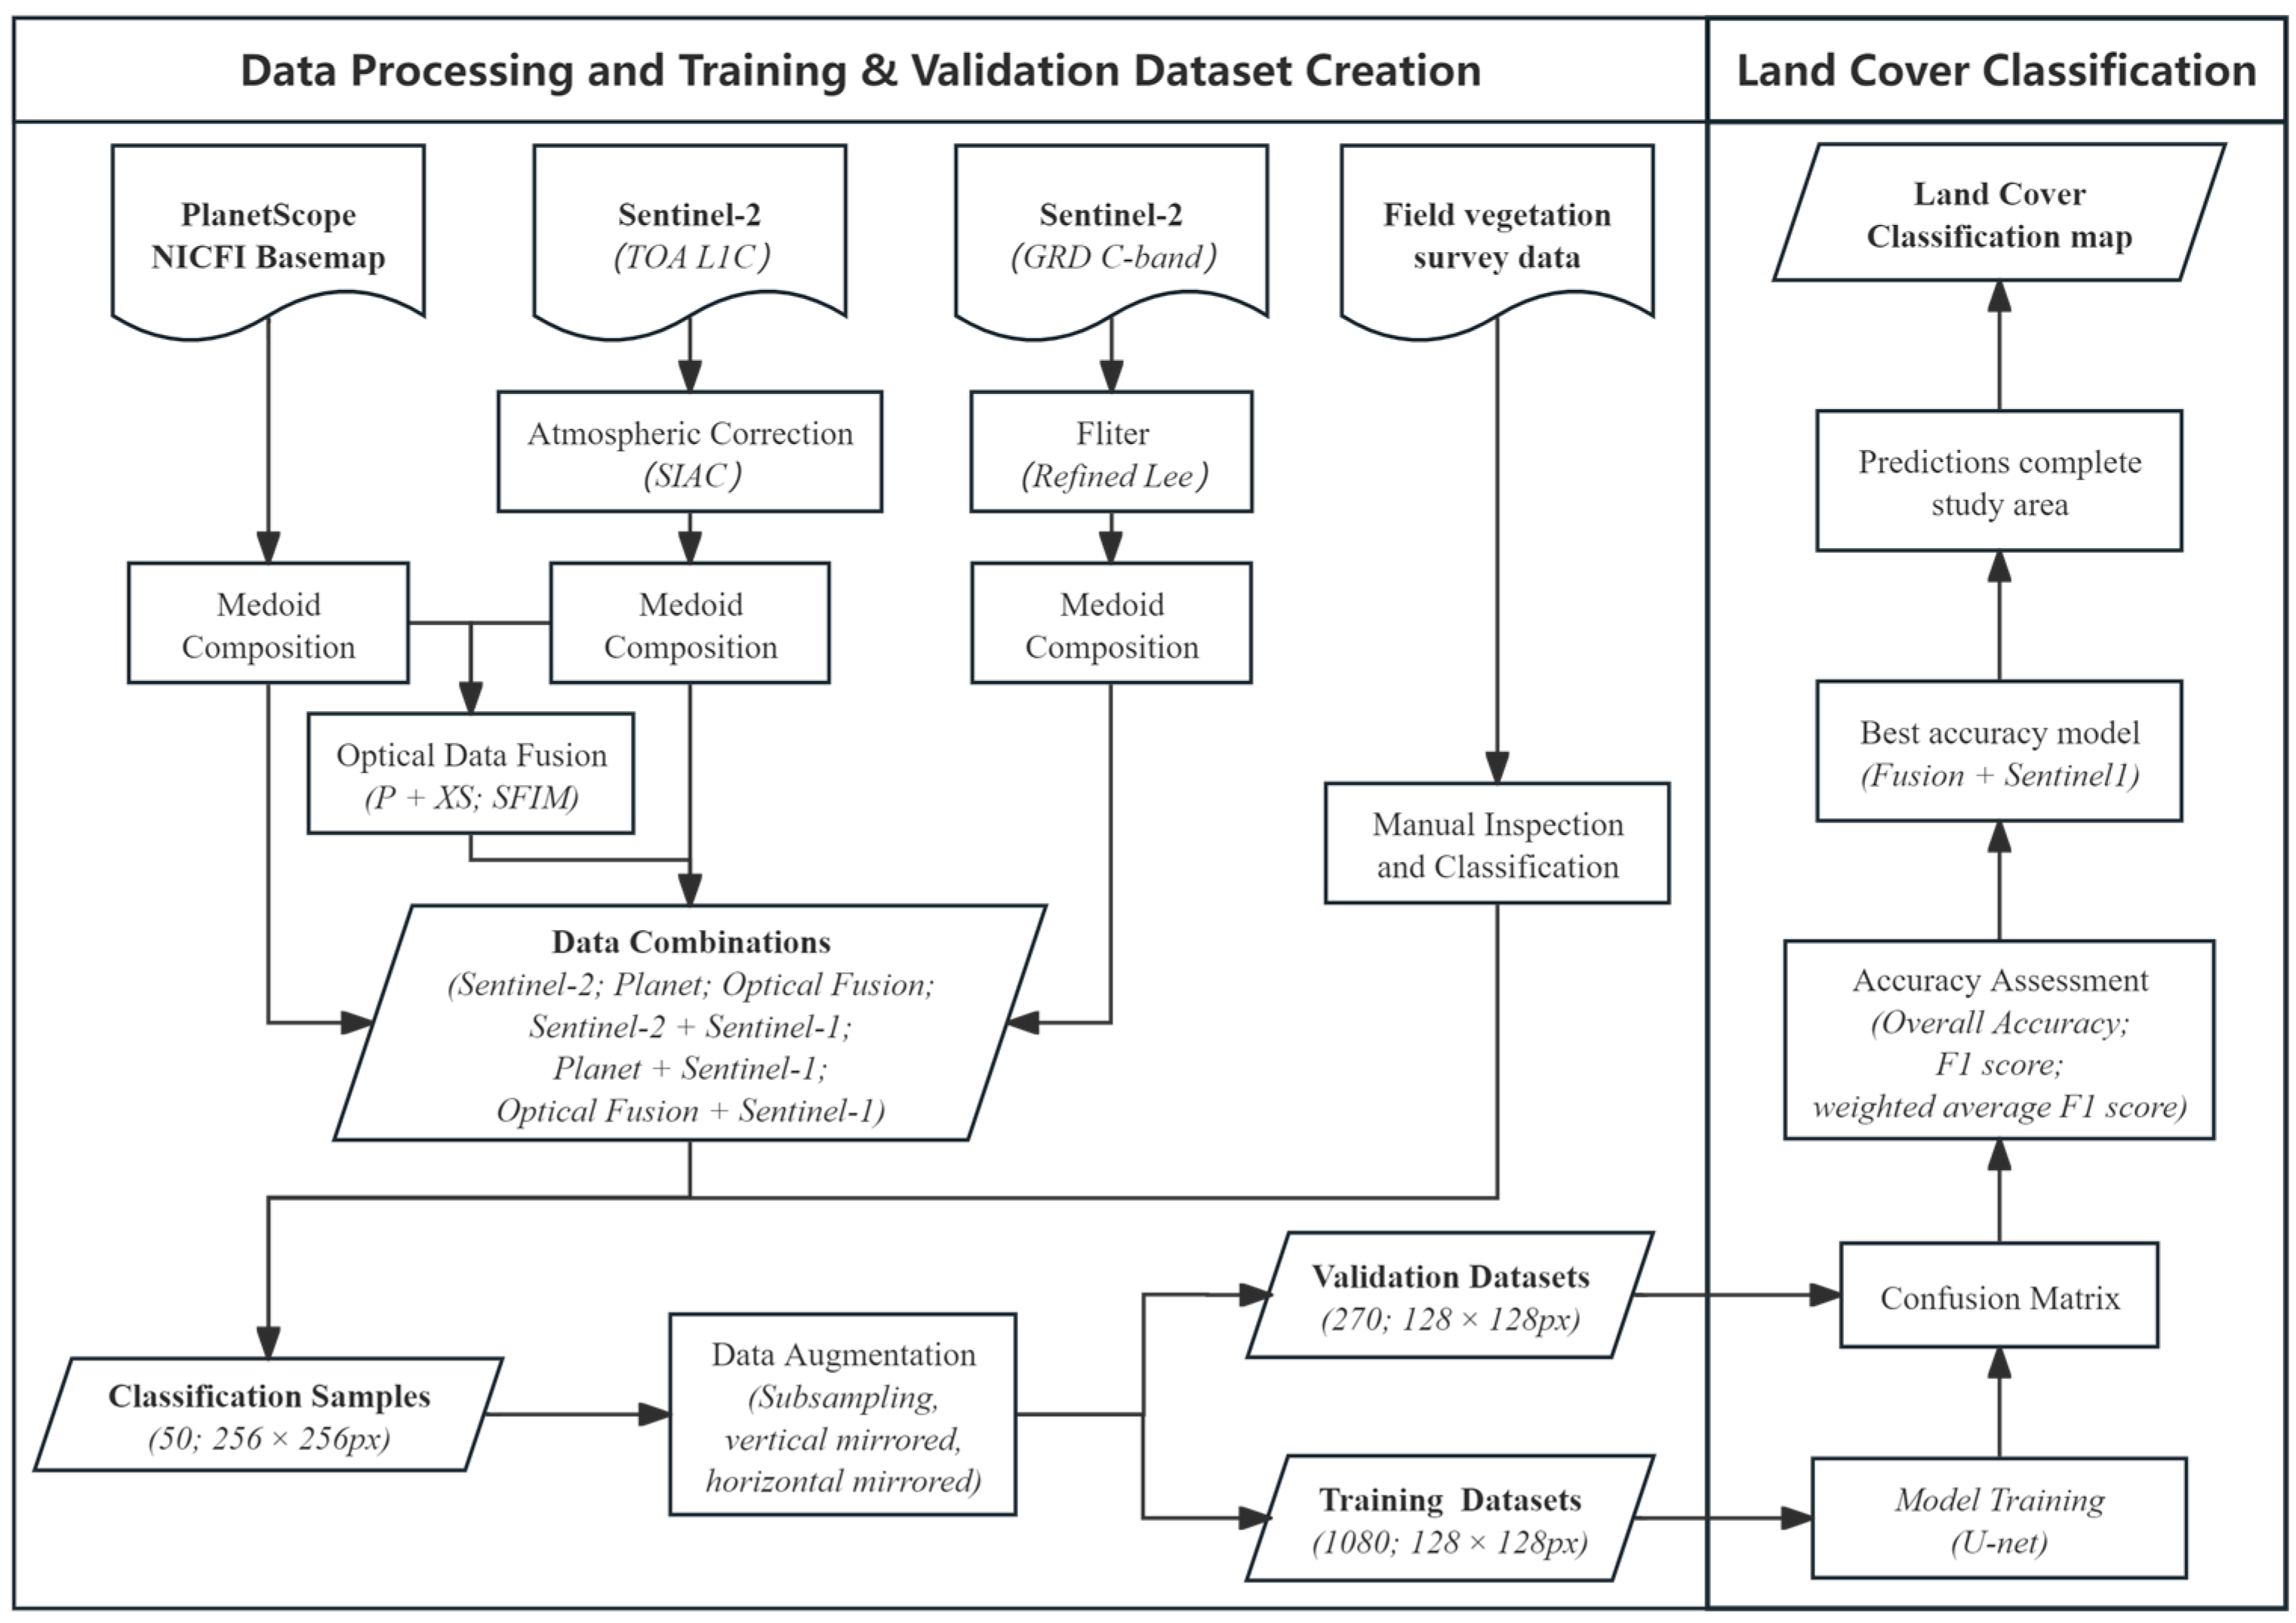
We used a combination of SAR Sentinel-1 [73], multispectral Sentinel-2 [74], and multispectral PlanetScope [75], covering the period from June to December 2023, together with the U-Net deep learning model, to map the land cover of the CAT. We compared the classification results of various combinations of imagery using the F1 score, which is a measure of the performance of a classification model by balancing precision and recall [76]. A flowchart summarizing the workflow is presented in Figure 3.

3.1. Data Collection

3.1.1. Satellite Data

We obtained PlanetScope, Sentinel-1, and Sentinel-2 imagery through Google Earth Engine (GEE) [77]. We obtained multi-temporal composites of atmospherically corrected PlanetScope surface reflectance imagery from the NICFI (Norway’s International Climate & Forests Initiative) satellite data program’s tropical forest monitoring monthly basemaps (https://university.planet.com/page/nicfi; accessed on 16 February 2024) available from GEE [78]. The PlanetScope NICFI basemaps undergo a series of preprocessing steps, including atmospheric correction, cloud masking, mosaicking, and seam line removal. The dataset comprises four bands—Red, Green, Blue, and Near-Infrared—with a spatial resolution of 4.77 m. We selected six basemaps from the dry season with low cloud cover (June to November) in 2023 and further generated an annual composite image using medoid compositing, which selects a real pixel from the image collection that minimizes the distance to all others, similar to a median but ensuring existing spectral values.
The Sentinel-2 data used in this study is sourced from the L1C (orthorectified top-of-atmosphere reflectance) dataset on GEE. Sentinel-2 consists of 13 spectral bands, including four visible and near-infrared bands at 10 m resolution, six red-edge and shortwave infrared bands at 20 m resolution, and three atmospheric bands at 60 m resolution. A single Sentinel-2 satellite has a revisit time of 10 days, which is reduced to 5 days when both satellites in the constellation are operational. To ensure temporal consistency, we first selected all images with <5% cloud cover within the study area from June to November 2023, resulting in a total of 325 images. These filtered images were atmospherically corrected using the SIAC method [79], and medoid composites were generated to produce annual Sentinel-2 composite images. We extracted ten bands from the dataset, excluding Aerosols, Water Vapor, and Cirrus bands, for subsequent classification tasks. To ensure consistent spatial resolution, all bands were resampled using cubic convolution to 4.77 m to align with the NICFI basemap pixels.
We selected Sentinel-1 10 m resolution Ground Range Detected (GRD) images from GEE, covering the period from June to November 2023, resulting in a total of 59 images. Sentinel-1 had a global revisit time of 12 days during the study period. The GRD images were radiometrically calibrated and orthorectified, with terrain correction applied using SRTM30. This study utilized two different polarization modes under the Interferometric Wide Swath (IW) mode: single co-polarization vertical transmit/receive (VV) and dual-band co-polarization vertical transmit and horizontal receive (VH). Sentinel-1’s IW mode provides a spatial resolution of approximately 5 m × 20 m for single polarization and 10 m × 20 m for dual polarization. In GEE, the GRD images are standardized to a 10 m spatial resolution for consistency with Sentinel-2. To reduce speckle noise inherent in SAR (Synthetic Aperture) images, we applied a 3 × 3 Refined Lee speckle filter [80]. This filter computes local statistics and selectively applies smoothing based on gradient and directional information, ensuring that image edges and details are preserved. Subsequently, medoid composites were generated for the VV and VH polarization images to create annual images, which were then resampled using cubic convolution to 4.77 m to align with the NICFI basemap pixels.

3.1.2. Ground Truth Data

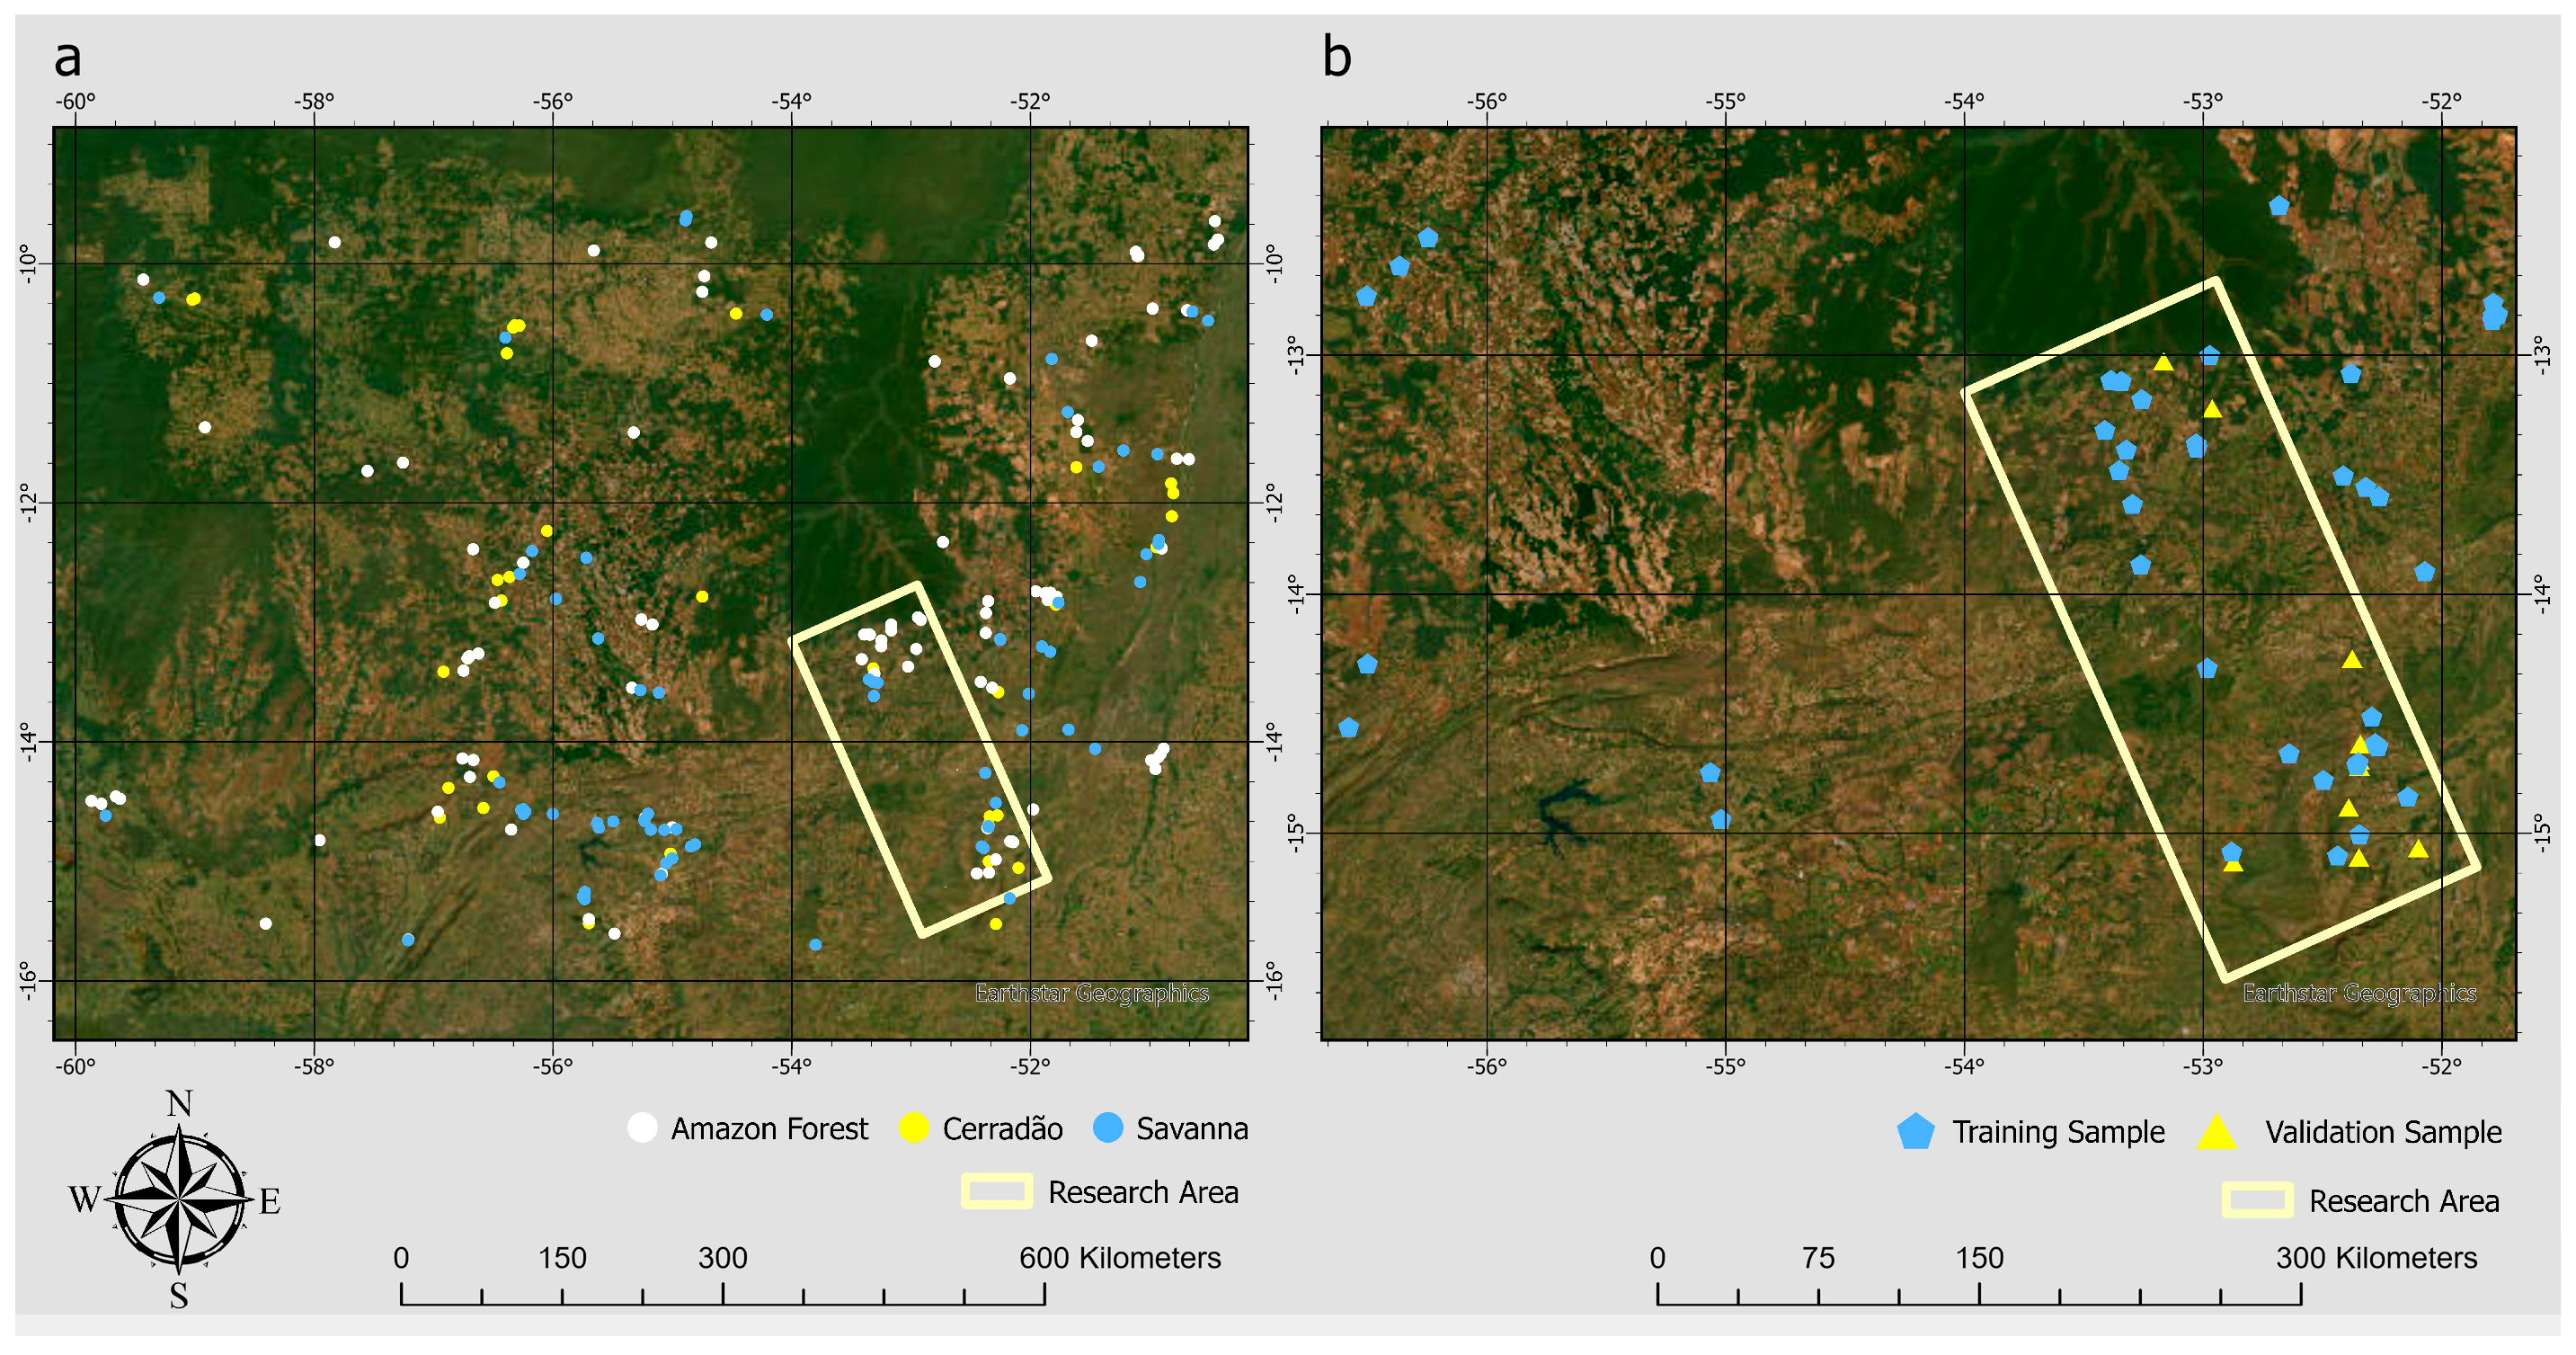
We used vegetation survey data collected from field campaigns, botanical collections, and vegetation inventories carried out by the team of researchers of the Plant Ecology Laboratory at the University of Mato Grosso State [2,12,24,27,31,65] as reference data to guide the creation of the training dataset for the U-net model. The survey data comprised 112 forest, 46 Cerradão, and 79 Savanna plots, of which 59 were located within the study region but still used in model training since they were located in vegetation types that were also found within the CAT (Figure 4a). The earliest of these plots was delineated in 1996, followed by periodic remeasurements. The collected information includes geographic coordinates, vegetation type, dominant species, tree diameter, soil type, etc. However, not all plots were remeasured every year, so we visually inspected annual high-resolution imagery from Google Earth between 1996 and 2023 to ensure that only plots exhibiting continuous stable vegetation cover throughout this period were considered. Since the areas of most surveyed plots are relatively small (~1 hectare) and their number is insufficient for direct use as training samples, we leveraged these plots to guide the manual creation and labeling of the training dataset for the classification model via visual interpretation.
Specifically, we produced 50 classified sample images, each measuring 256 × 256 pixels (Figure 4b). To enable reliable visual interpretation and labeling of vegetation types, sample areas were chosen near vegetation survey plots and in locations with clear remote sensing imagery. Land-cover classes within each sample image were manually delineated as vector polygons using reference data from vegetation plots, high-resolution imagery from Google Earth Pro, and multi-temporal Sentinel-2 and PlanetScope images. Each polygon corresponded to a specific land-cover type and was drawn to match clear visual boundaries observed in the imagery. These vector labels were then rasterized at a spatial resolution of 4.77 m—matching that of PlanetScope imagery—so that every pixel in the sample images was assigned a land-cover class based on the underlying polygon. To address data imbalance, particularly for underrepresented classes such as Cerradão, 19 of the 50 sample images were selected from outside the study area. These external samples were carefully chosen to include only land-cover types that were also commonly found within the study region.
In order to expand the training dataset, we applied data augmentation by extracting 128 × 128-pixel patches from the original 256 × 256-pixel sample images, using a 64-pixel offset. These patches were then mirrored vertically and horizontally, resulting in a total of 1350 training patches (128 × 128 pixels), which served as the direct input to the model. To ensure spatial independence between training and validation, 1080 patches derived from 40 labeled images were used exclusively for training, while the remaining 270 patches were extracted from 10 completely separate sample images for validation. This strategy follows widely adopted practices in deep learning-based land cover classification, where overlapping patches and mirroring are commonly used to increase sample quantity and spatial variability [62,81]. All validation patches were drawn from within the study area. The total number of pixels per land cover class in the final training and validation sets is summarized in Table 1. All processing steps were performed in Jupyter Notebook (v6.4.5) using the rasterio package [82].

3.2. Image Classification

Given the challenges posed by the region’s spectral similarity between vegetation classes, spatial fragmentation, and limited availability of ground truth data, the U-net architecture was selected for its robustness in learning complex spatial and spectral patterns with limited training samples. The entire study area is categorized into six classes (Table 2). The classification process integrates multi-source satellite imagery, including high-resolution PlanetScope data, multispectral Sentinel-2, and SAR-based Sentinel-1, to leverage complementary information across sensors. In order to examine the classification performance of different datasets, this study additionally prepared several training sets using various data combinations. Each training set was trained and evaluated for accuracy independently. The complete list of data combinations is provided in Table 3. The following section details the architecture, training process, and implementation of the U-net model used in this study.

U-Net

The U-net model is a CNN-based algorithm for image segmentation, which features an encoder–decoder architecture. The encoder extracts features using convolutional and max-pooling layers and the decoder upsamples the image through transposed convolutions and restores spatial resolution [83]. We used four convolution and pooling layers for both the encoder and decoder, together with four upsampling and merging layers, as illustrated in Figure 5. The input sample dimensions are 128 × 128 pixels (Section 3.1.2). To search for the optimal hyperparameters, the model was trained for up to 30 epochs with an early stopping procedure (patience = 15), selecting the epoch with the highest validation accuracy. A learning rate of 0.001 was used, along with a batch size of 16 to ensure training stability. Cross-entropy was used as the loss function, and the Adam optimizer was employed. All input data were batch-normalized to a range of 0–1 before being fed into the model. The entire training process was implemented in Jupyter Notebook using TensorFlow 2.0.

3.3. Optical Data Fusion

We combined eight spectral bands across the VIS-NIR regions from Sentinel-2 with the higher spatial resolution R, G, B, NIR, and synthesized bands from PlanetScope using the P + XS fusion method [84]. This image fusion technique enhances the spatial resolution of multispectral imagery by leveraging the finer spatial detail of high-resolution images (e.g., PlanetScope) while preserving the rich spectral information from lower-resolution sources (e.g., Sentinel-2). The core idea behind the P + XS method is that the high-resolution image provides detailed spatial patterns (such as edges and textures), while the low-resolution multispectral image provides accurate spectral information. The method linearly combines the high-resolution image with the resampled low-resolution image, transferring spatial detail from the former to the latter without significantly distorting the spectral characteristics. The Sentinel-2’s 20 m bands (bands 5, 6, and 7) were matched with a synthesized PlanetScope band (S), as detailed in the equation presented in Table 4, which approximates the spectral properties of these bands [84]. Table 4 outlines the spectral band matches between Sentinel-2 and PlanetScope imagery.
The P + XS method serves as a fusion design framework that guides the integration of high-resolution and low-resolution imagery. Within this framework, it is necessary to select a specific fusion algorithm to apply at the band level. We adopted the Smoothing Filter-based Intensity Modulation (SFIM) technique to perform the actual fusion.
SFIM is an image fusion technique designed to enhance the spatial resolution of low-resolution multispectral images while preserving their original spectral characteristics [85,86]. SFIM has been successfully combined with the P + XS framework to improve the quality of fused imagery for land cover classification [87]. In this study, SFIM was used to integrate the lower-resolution bands of Sentinel-2 with the higher-resolution PlanetScope imagery in a band-wise manner. Specifically, all Sentinel-2 bands will be resampled to 4.77 m using cubic convolution and then fed into the following fusion formula together with the corresponding PlanetScope bands:
F U S i = X i × Y Y _
F U S i is the i band after fusion, X i is the i-th band of the resampled Sentinel-2 image, Y is the corresponding PlanetScope band, and Y _ is the band Y after low-pass filtering and averaging.
A 3 × 3 mean low-pass filter was applied to the Sentinel-2 bands during the SFIM process, using the default configuration in ArcGIS Pro. The remaining SWIR1 and SWIR2 bands in the Sentinel-2—those not corresponding to any PlanetScope bands—were resampled to a spatial resolution of 4.77 m using cubic convolution and then directly combined with the previously fused bands, which yielded the optical fusion dataset composed of ten bands.

3.4. Accuracy Assessment

To further evaluate the model’s performance with different data combinations as input, we calculated not only the overall accuracy but also the F1 scores for each vegetation class, as well as the weighted average F1 score to assess overall classification performance.
The F1 score, ranging from 0 to 1, is the harmonic mean of precision and recall, making it ideal for imbalanced datasets. It effectively balances high precision and low recall (or vice versa). Higher F1 scores indicate better classification performance. The formula is as follows:
P = T P T P + F P
R = T P T P + F N
F 1 s c o r e = 2 × P R P + R
P (precision) and R (recall) are calculated for each class by treating that class as the target class and all others as non-target. T P (true positives) refers to the number of instances correctly predicted as belonging to a given class. F P (false positives) refers to the number of instances incorrectly predicted as belonging to that class, and F N (false negatives) refers to the number of instances that actually belong to the class but were incorrectly predicted as another class.
The Weighted Average F1 score is a metric that accounts for class imbalance by assigning a weight to each class based on its support (i.e., the number of true instances of that class). In this study, where the number of samples per vegetation class is uneven, the Weighted Average F1 score provides a more realistic measure of the model’s overall classification performance [88]. A high Weighted Average F1 score indicates that the model performs well not only on rare classes but also consistently across dominant vegetation types. The formula for the Weighted Average F1 score is as follows:
W e i g h t e d F 1 s c o r e = i = 1 n N i N × F 1 i
n is the number of categories, N i is the number of samples in category i, N is the total number of samples, and F 1 i is the F 1 score of category i.
We generated a confusion matrix for the training results of each dataset, calculated the above indicators based on the confusion matrix, and evaluated the effectiveness of different data in classification tasks by comparing the differences in indicators.

4. Results

4.1. Identifying Which Sensor or Sensor Combination Results in the Highest Mapping Accuracies

Our results on the overall accuracy of the map showed that models combining optical and SAR data outperform those using single-sensor data (Table 5). The Optical Fusion + Sentinel-1 dataset achieved the highest classification accuracy (F1 = 0.85), whereas the combination of Sentinel-1 and Sentinel-2 performed slightly worse (F1 = 0.82), and the model using only the PlanetScope and Sentinel-1 combination showed poorer performance, only achieving an F1 accuracy of 0.75. Among the single optical data sources, PlanetScope data achieved the best classification performance (F1 = 0.8), which is not only better than Sentinel-2 data (F1 = 0.69) but also better than Optical Fusion data (F1 = 0.74), which integrates PlanetScope’s geometric information on Sentinel-2. In contrast, the model using only Sentinel-1 data yielded the lowest classification performance (F1 = 0.49).
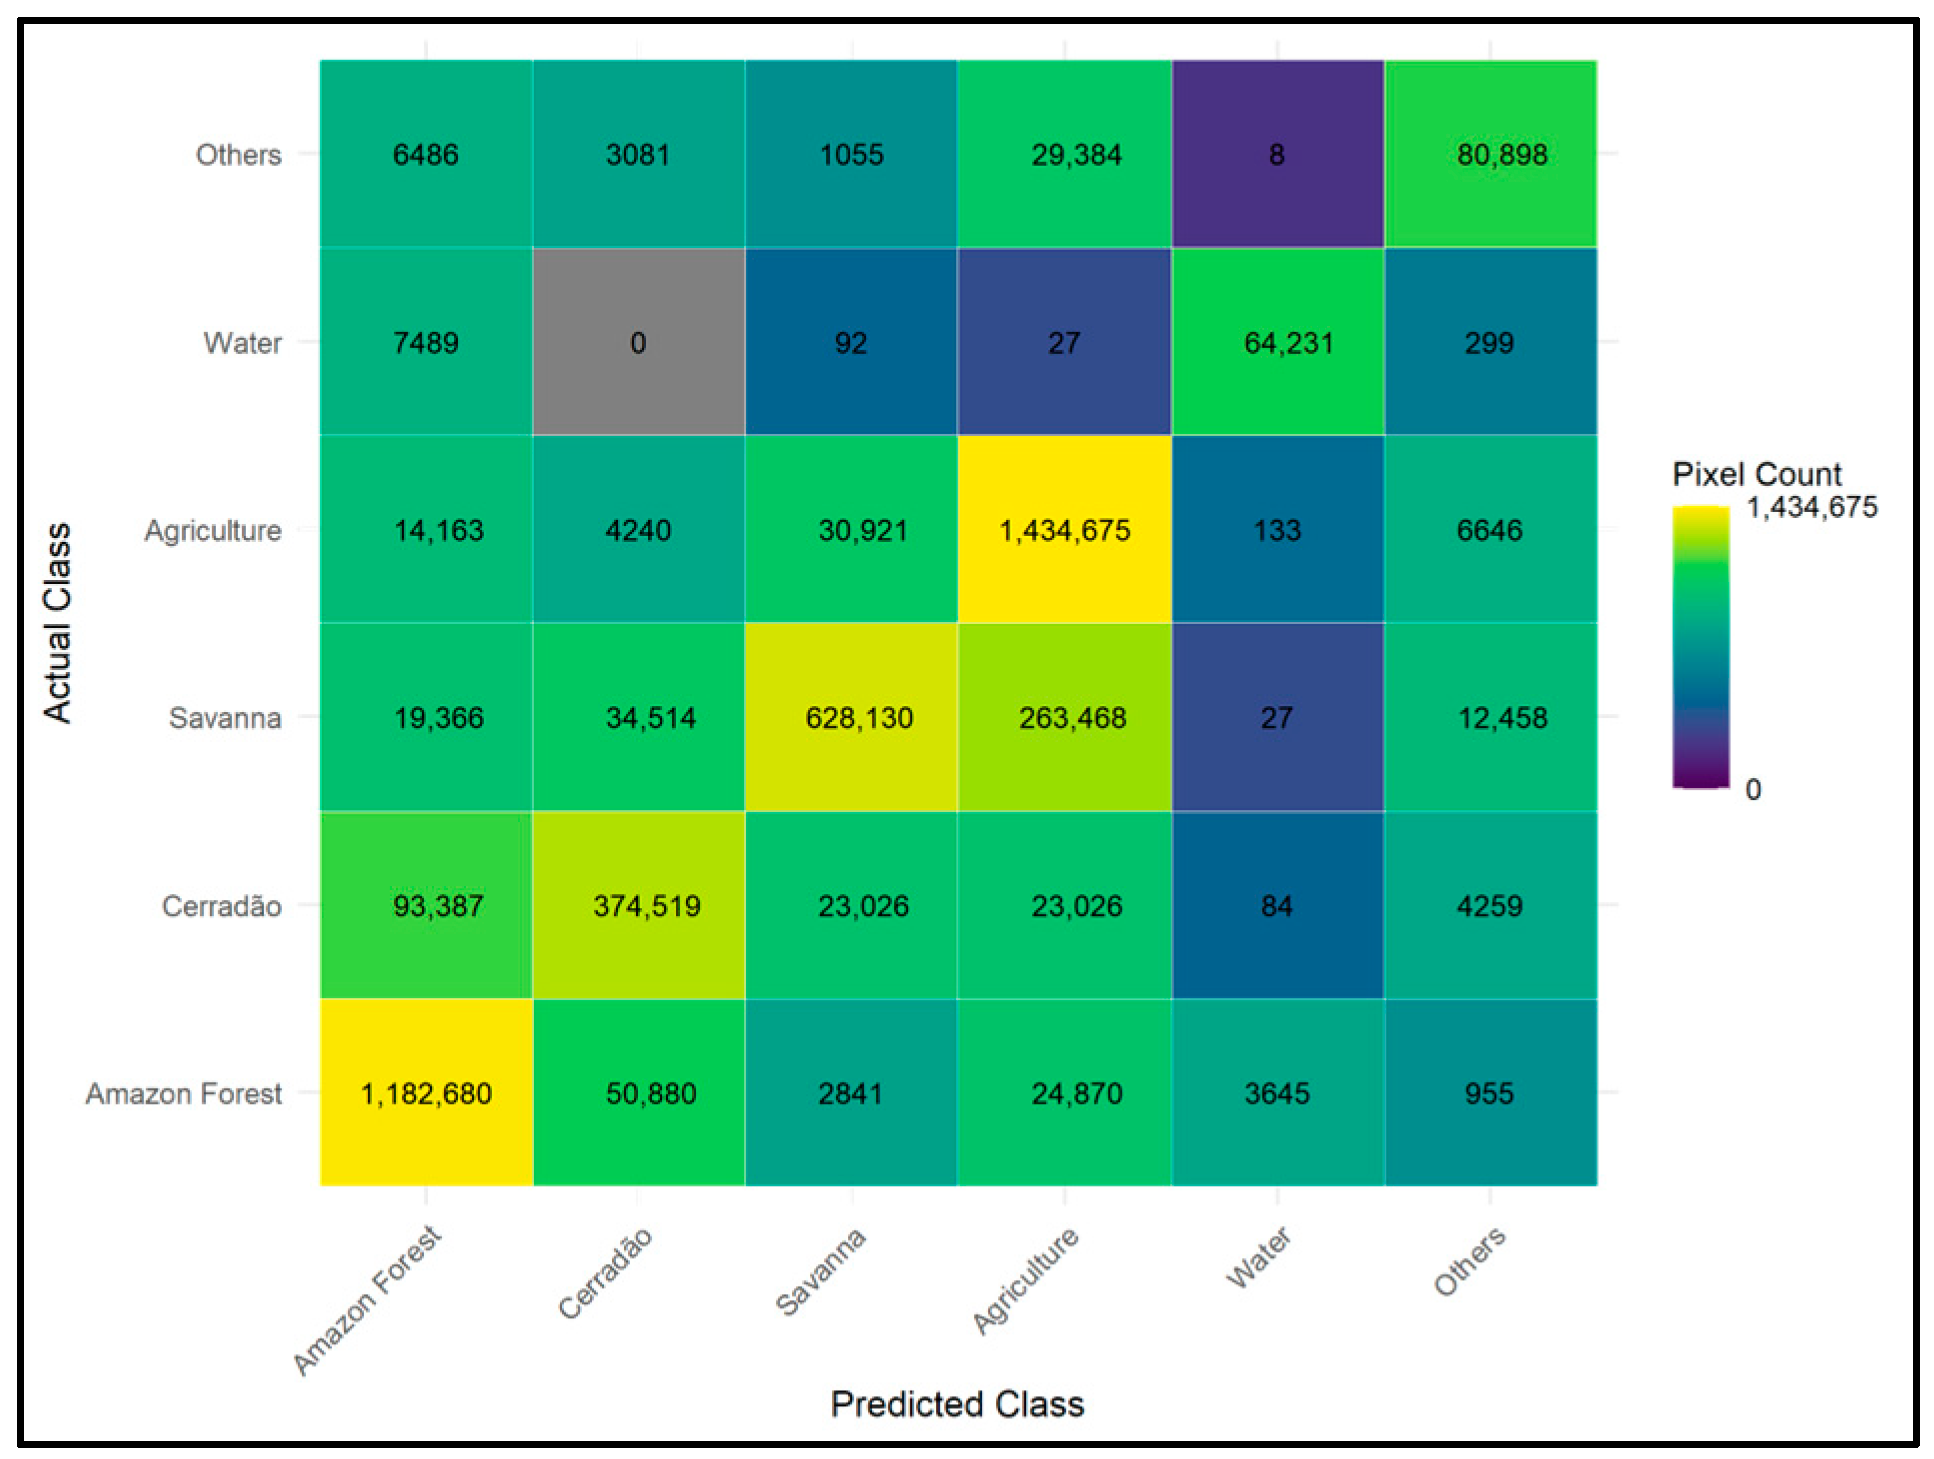
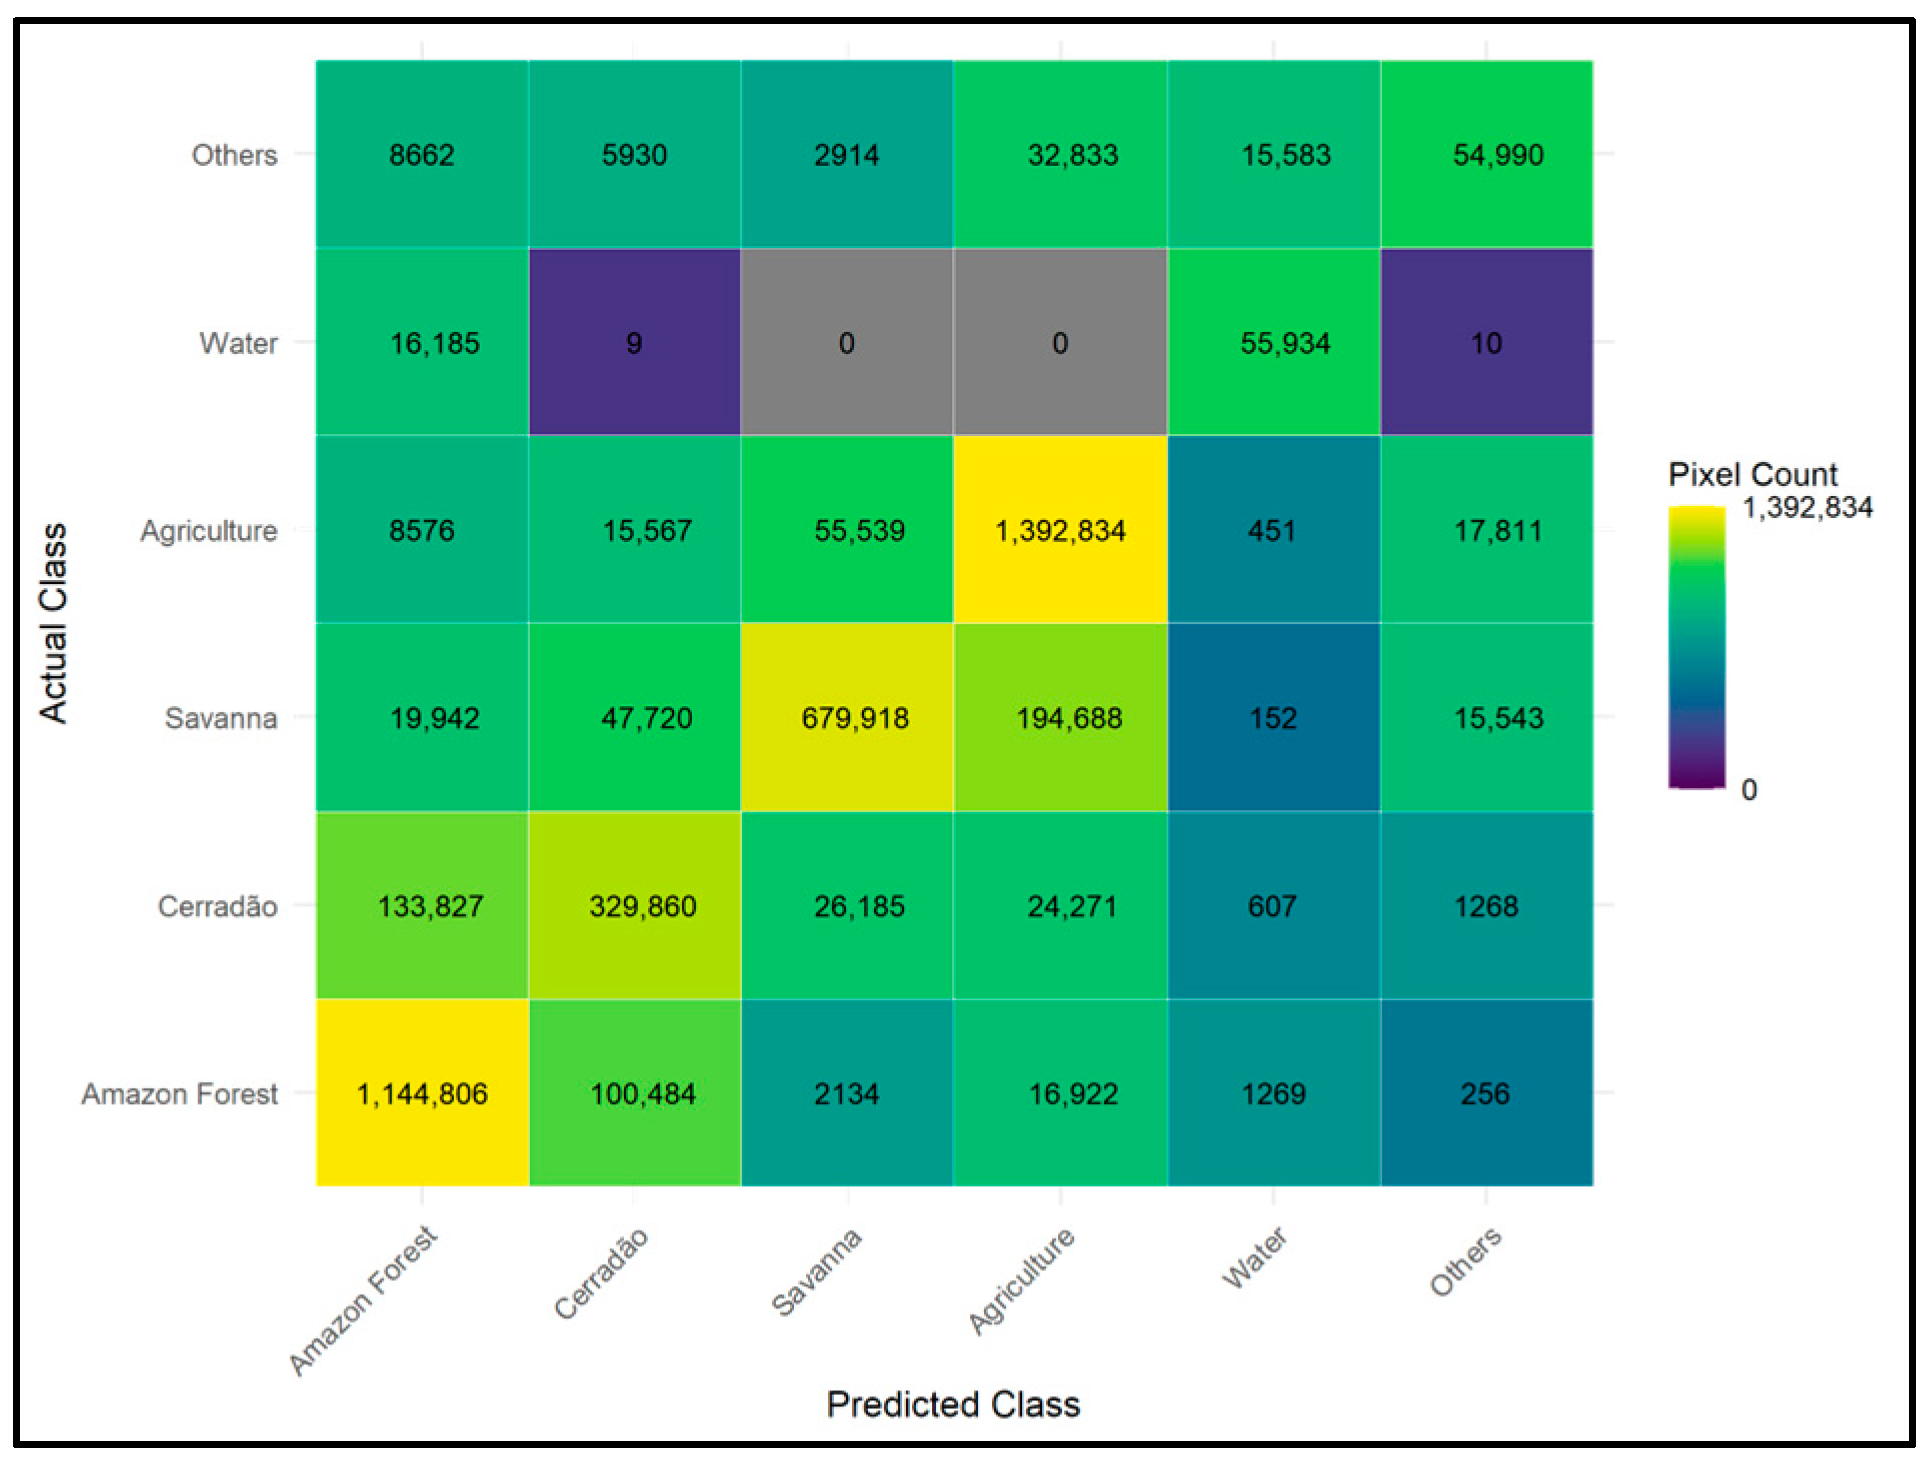
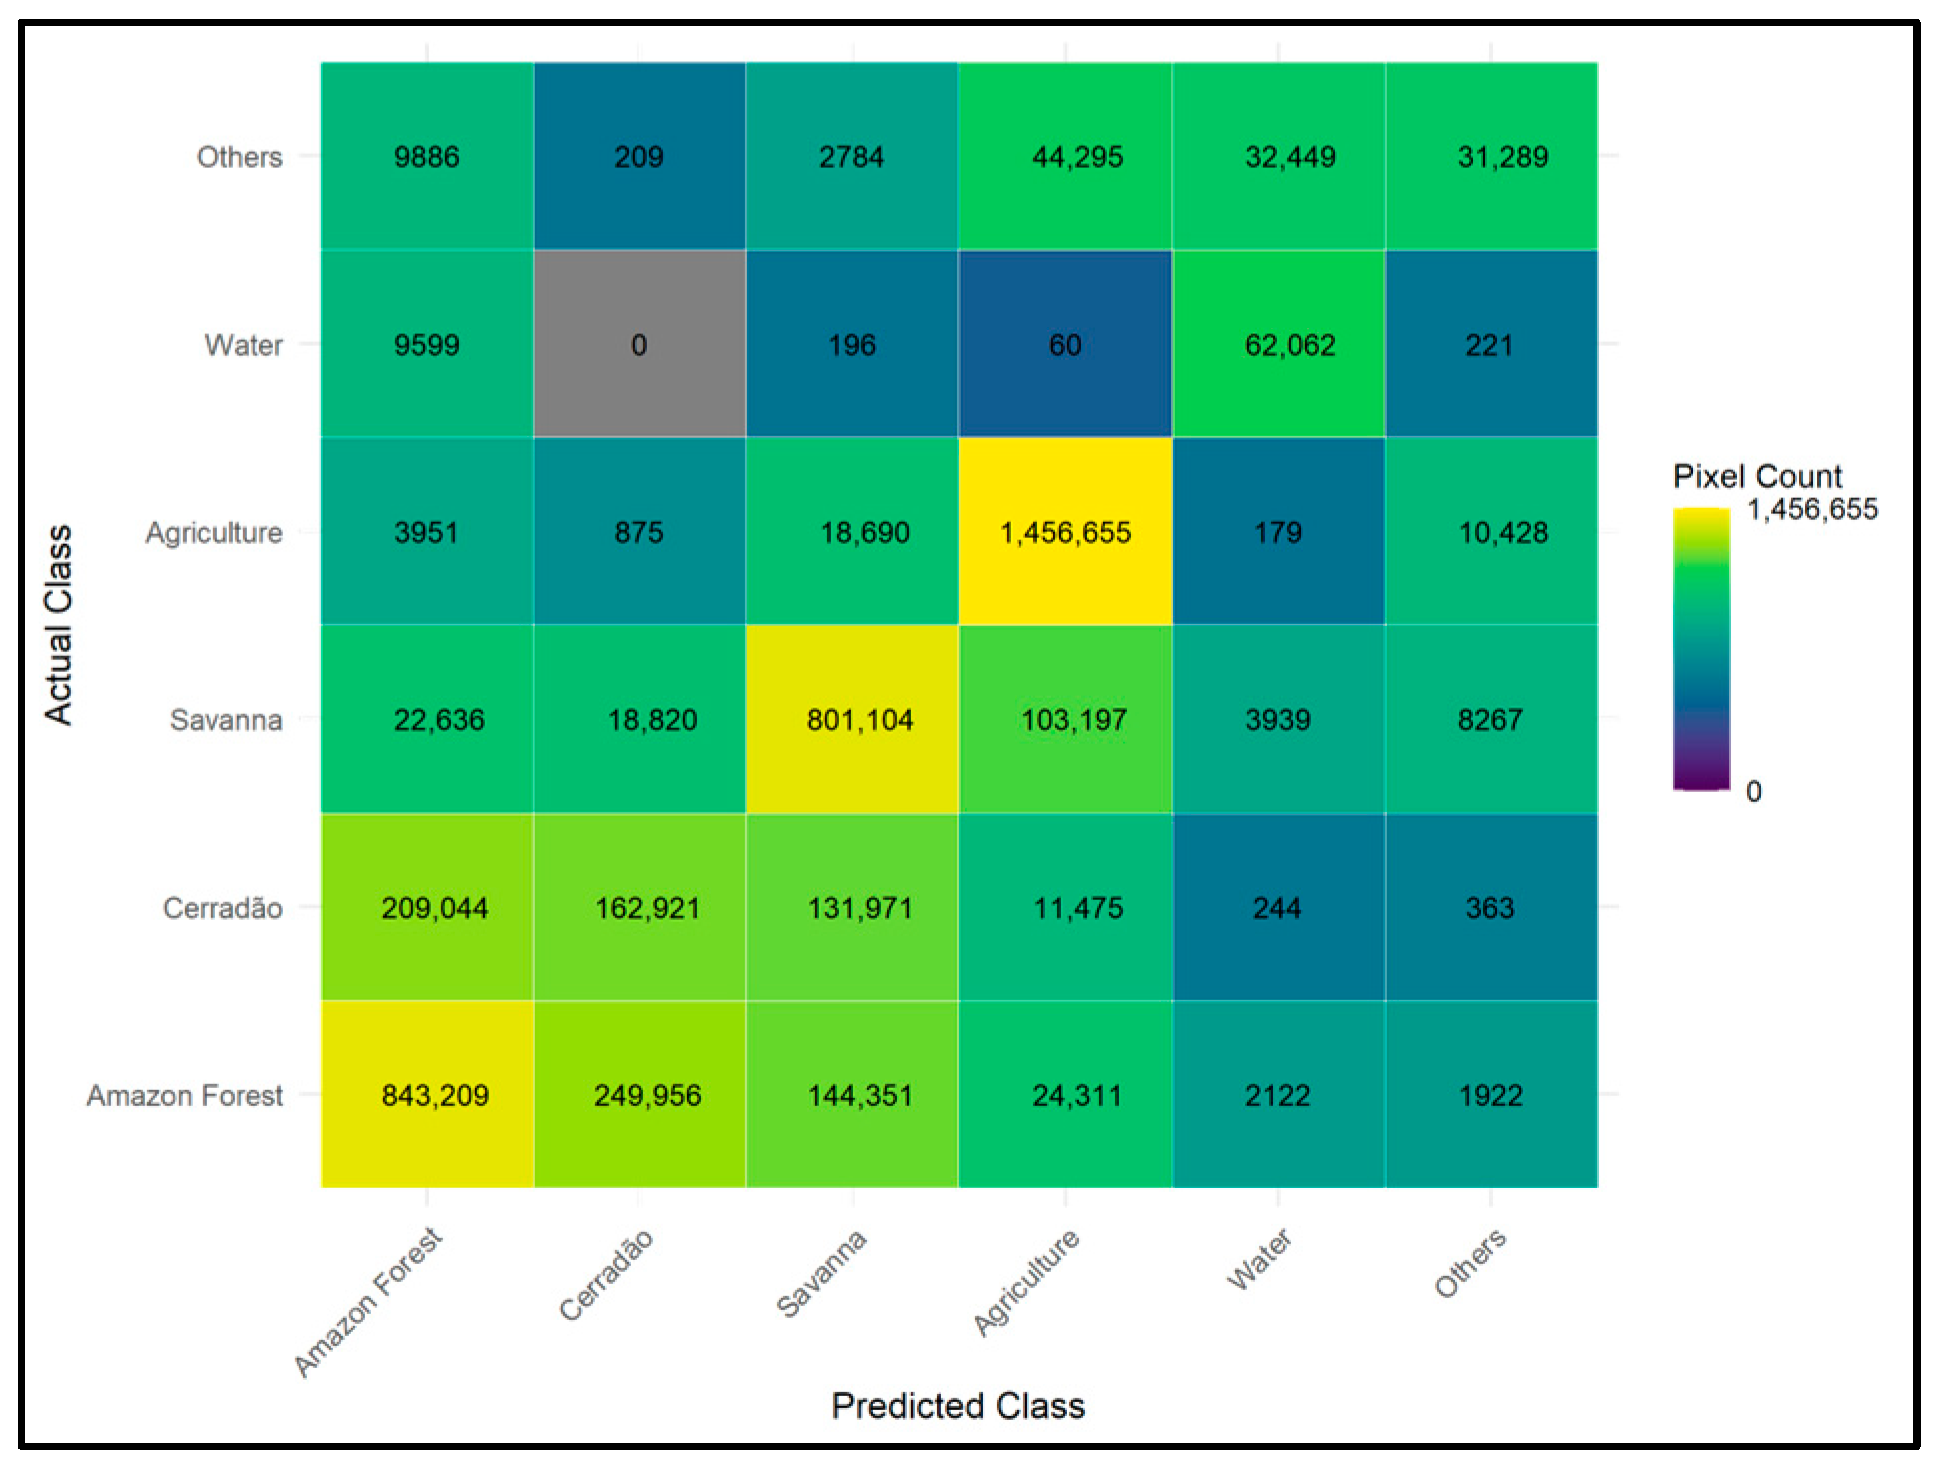
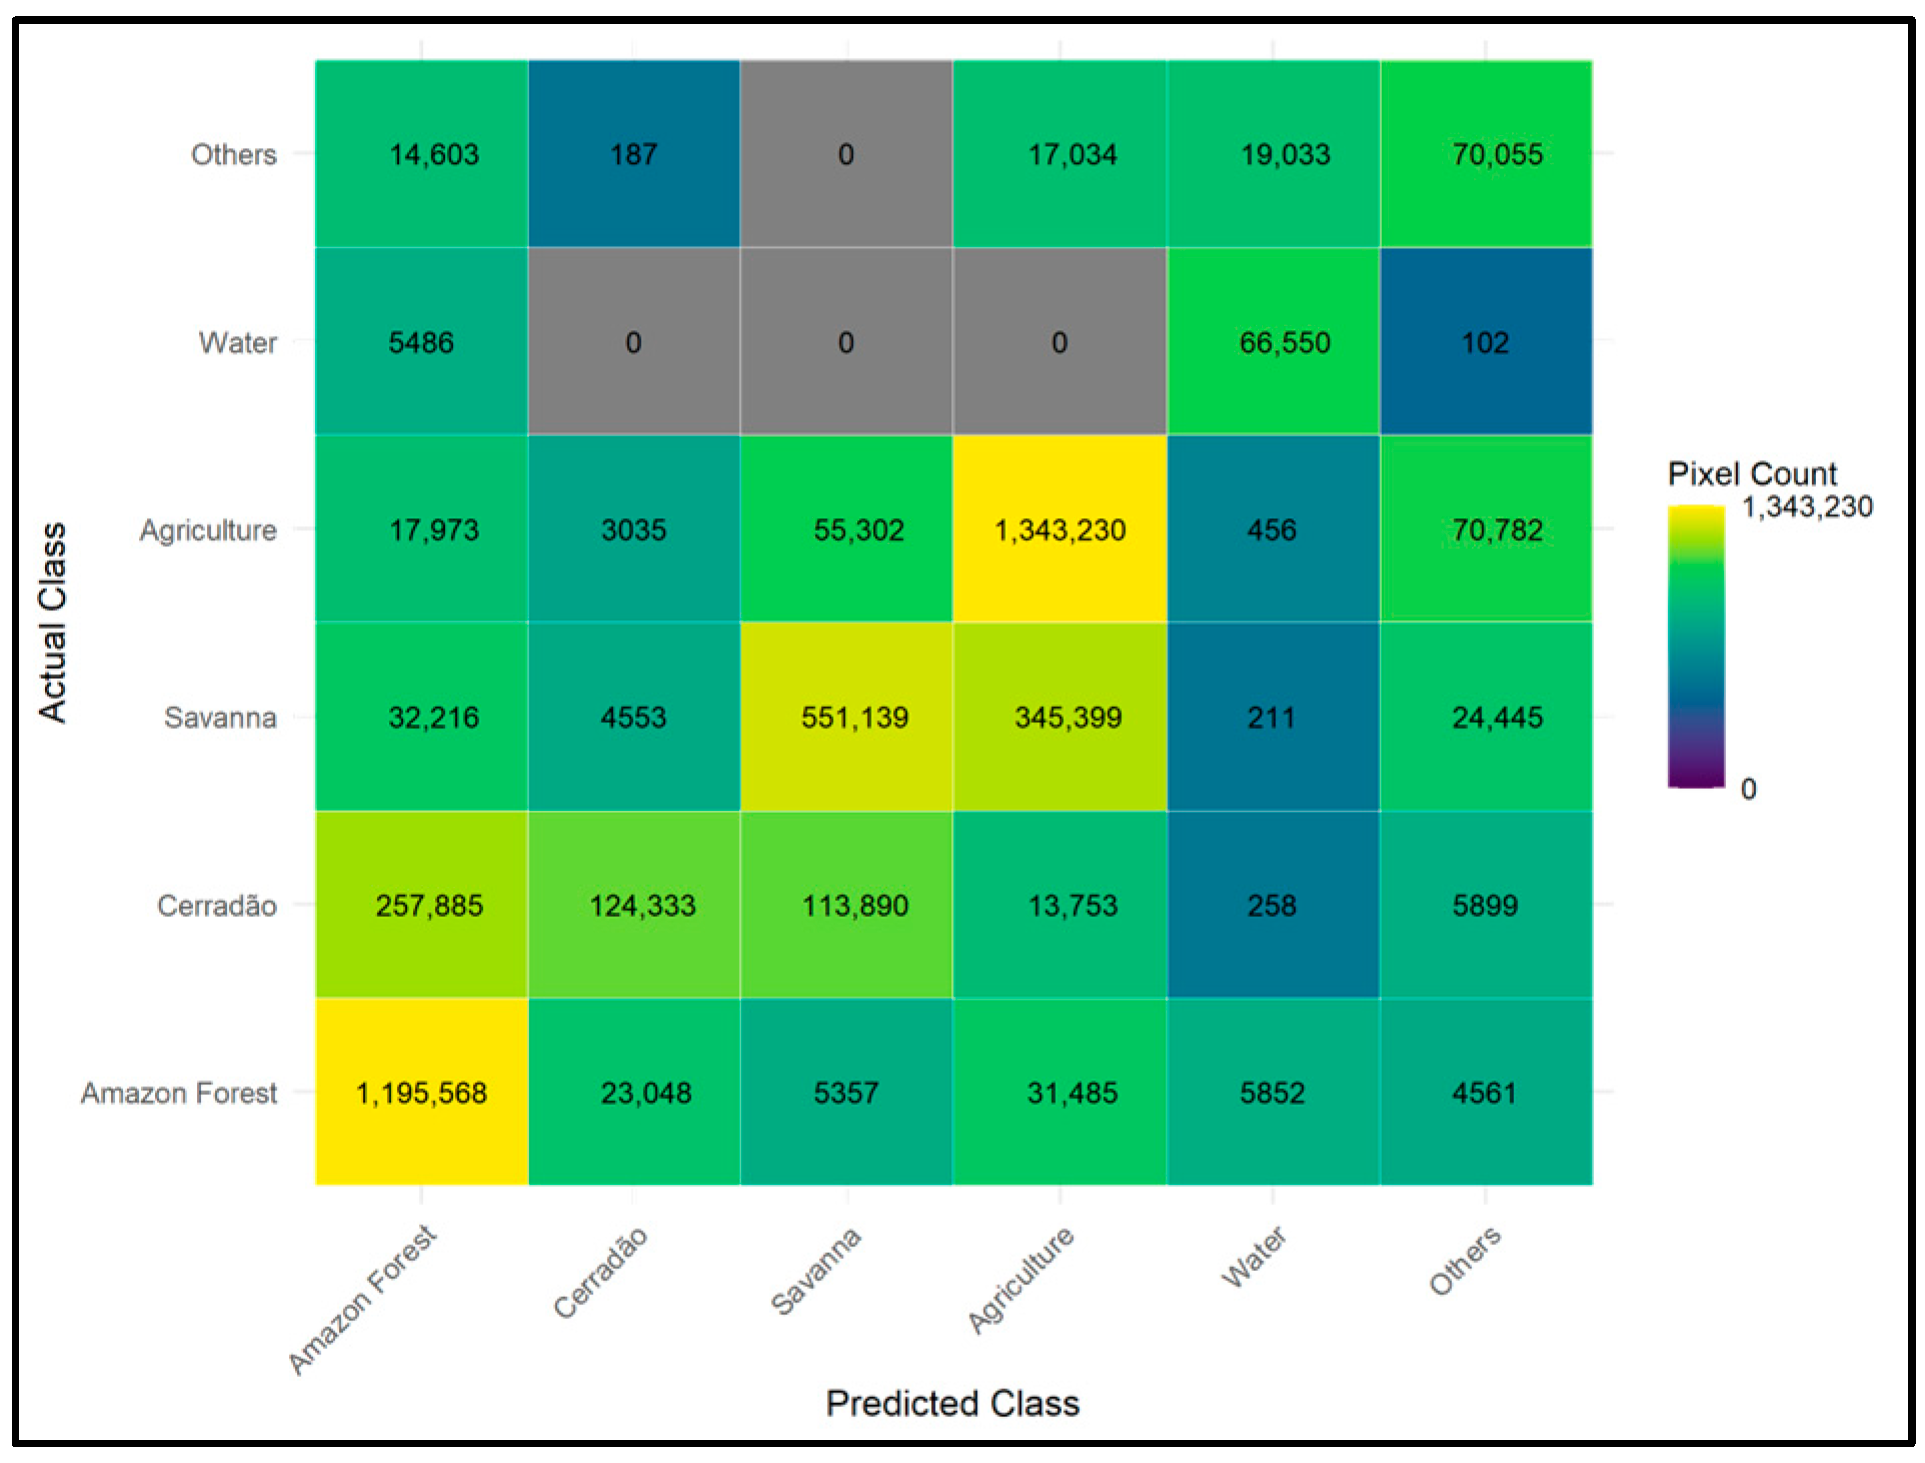
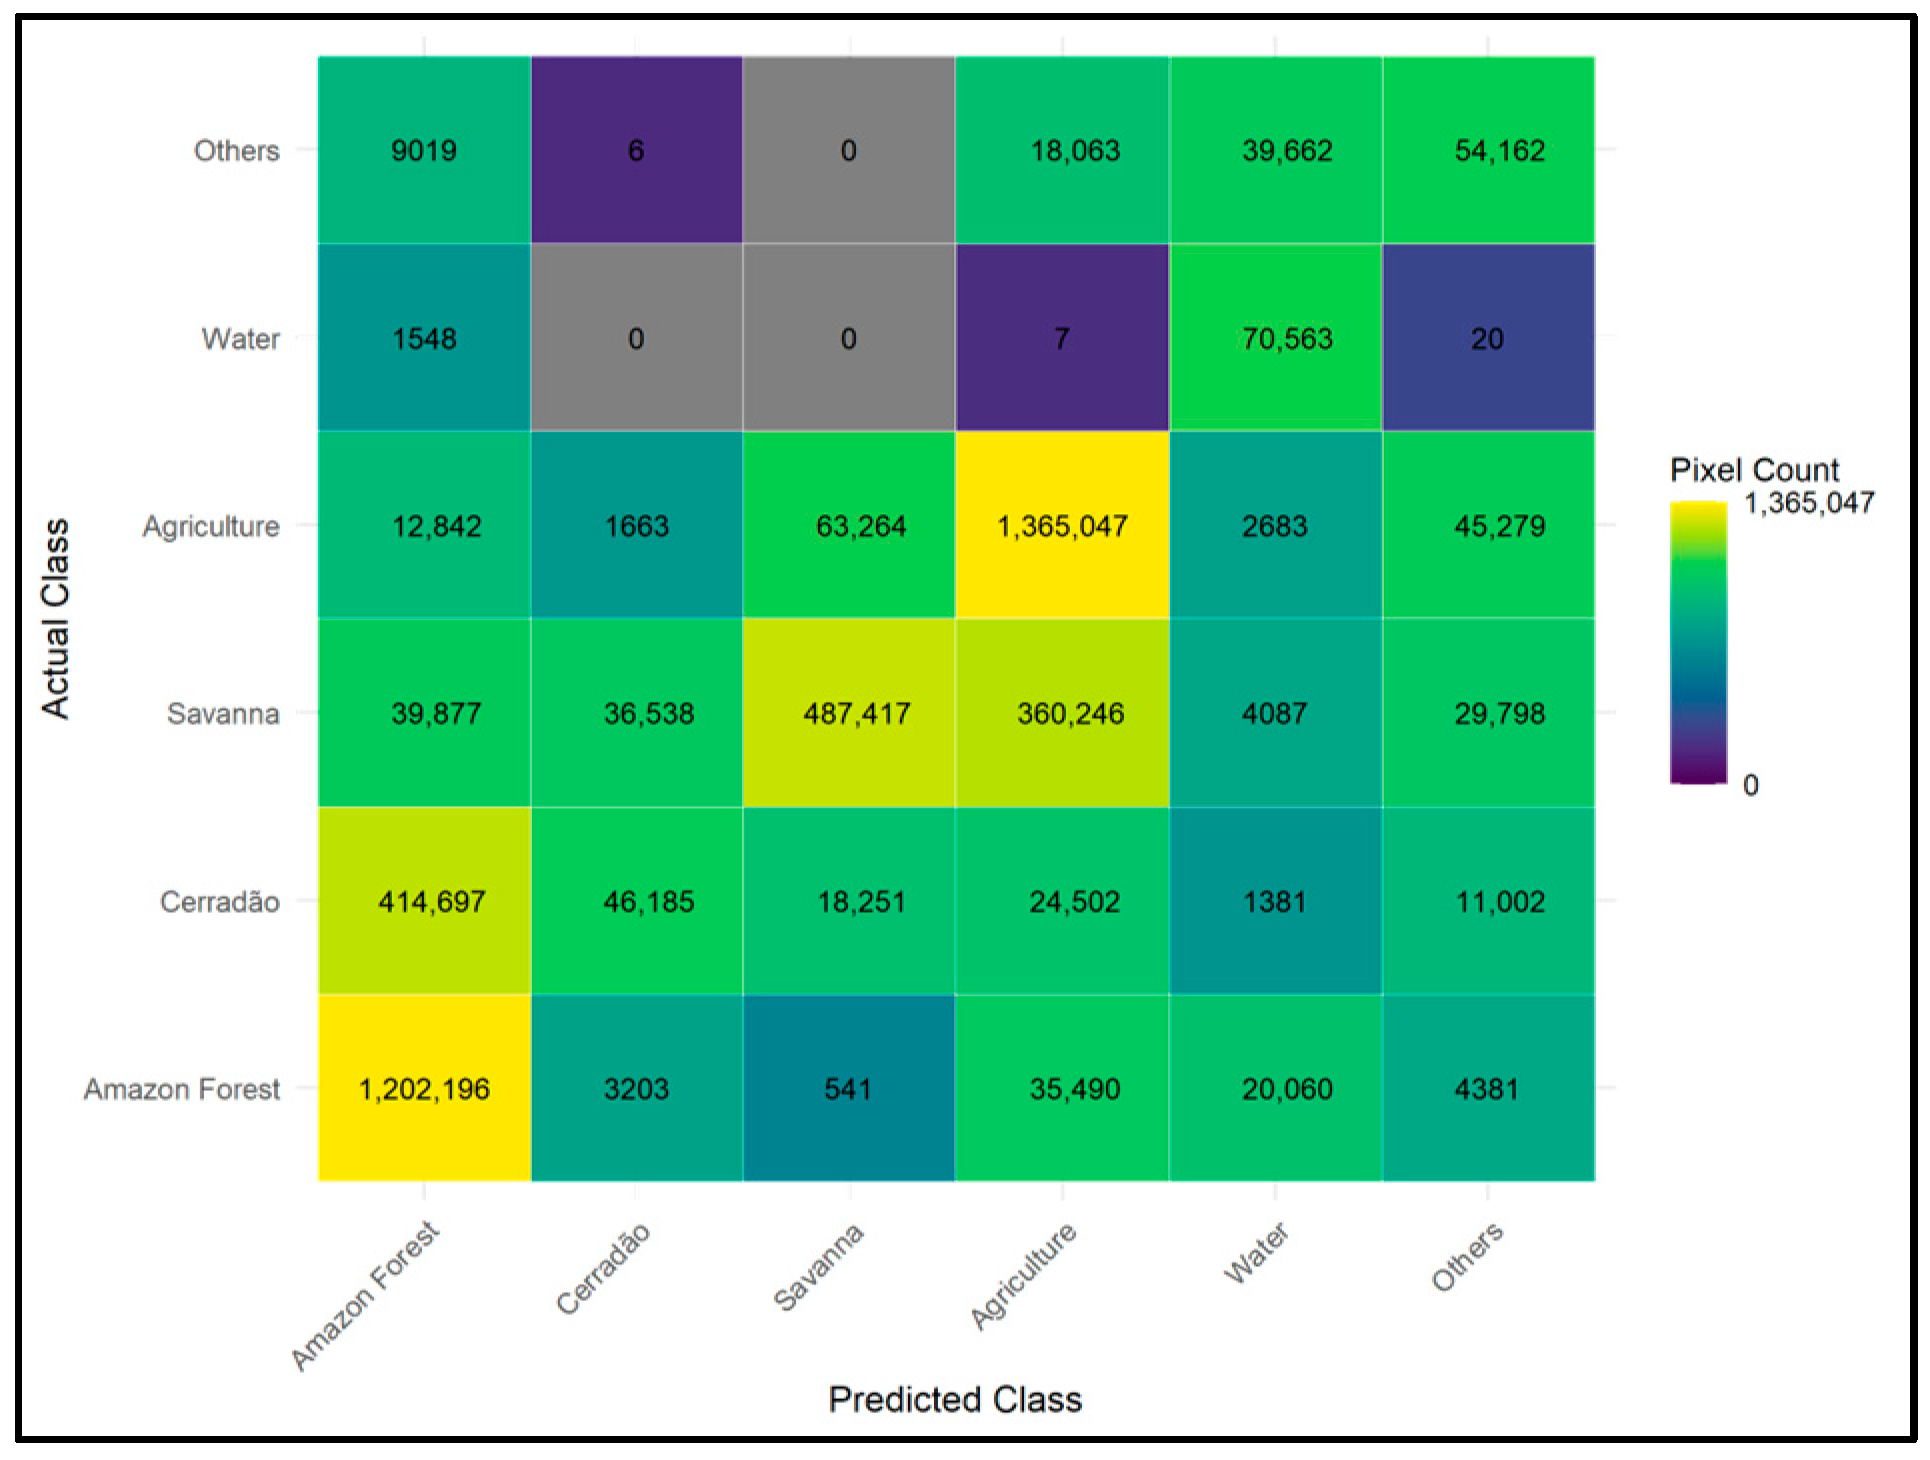
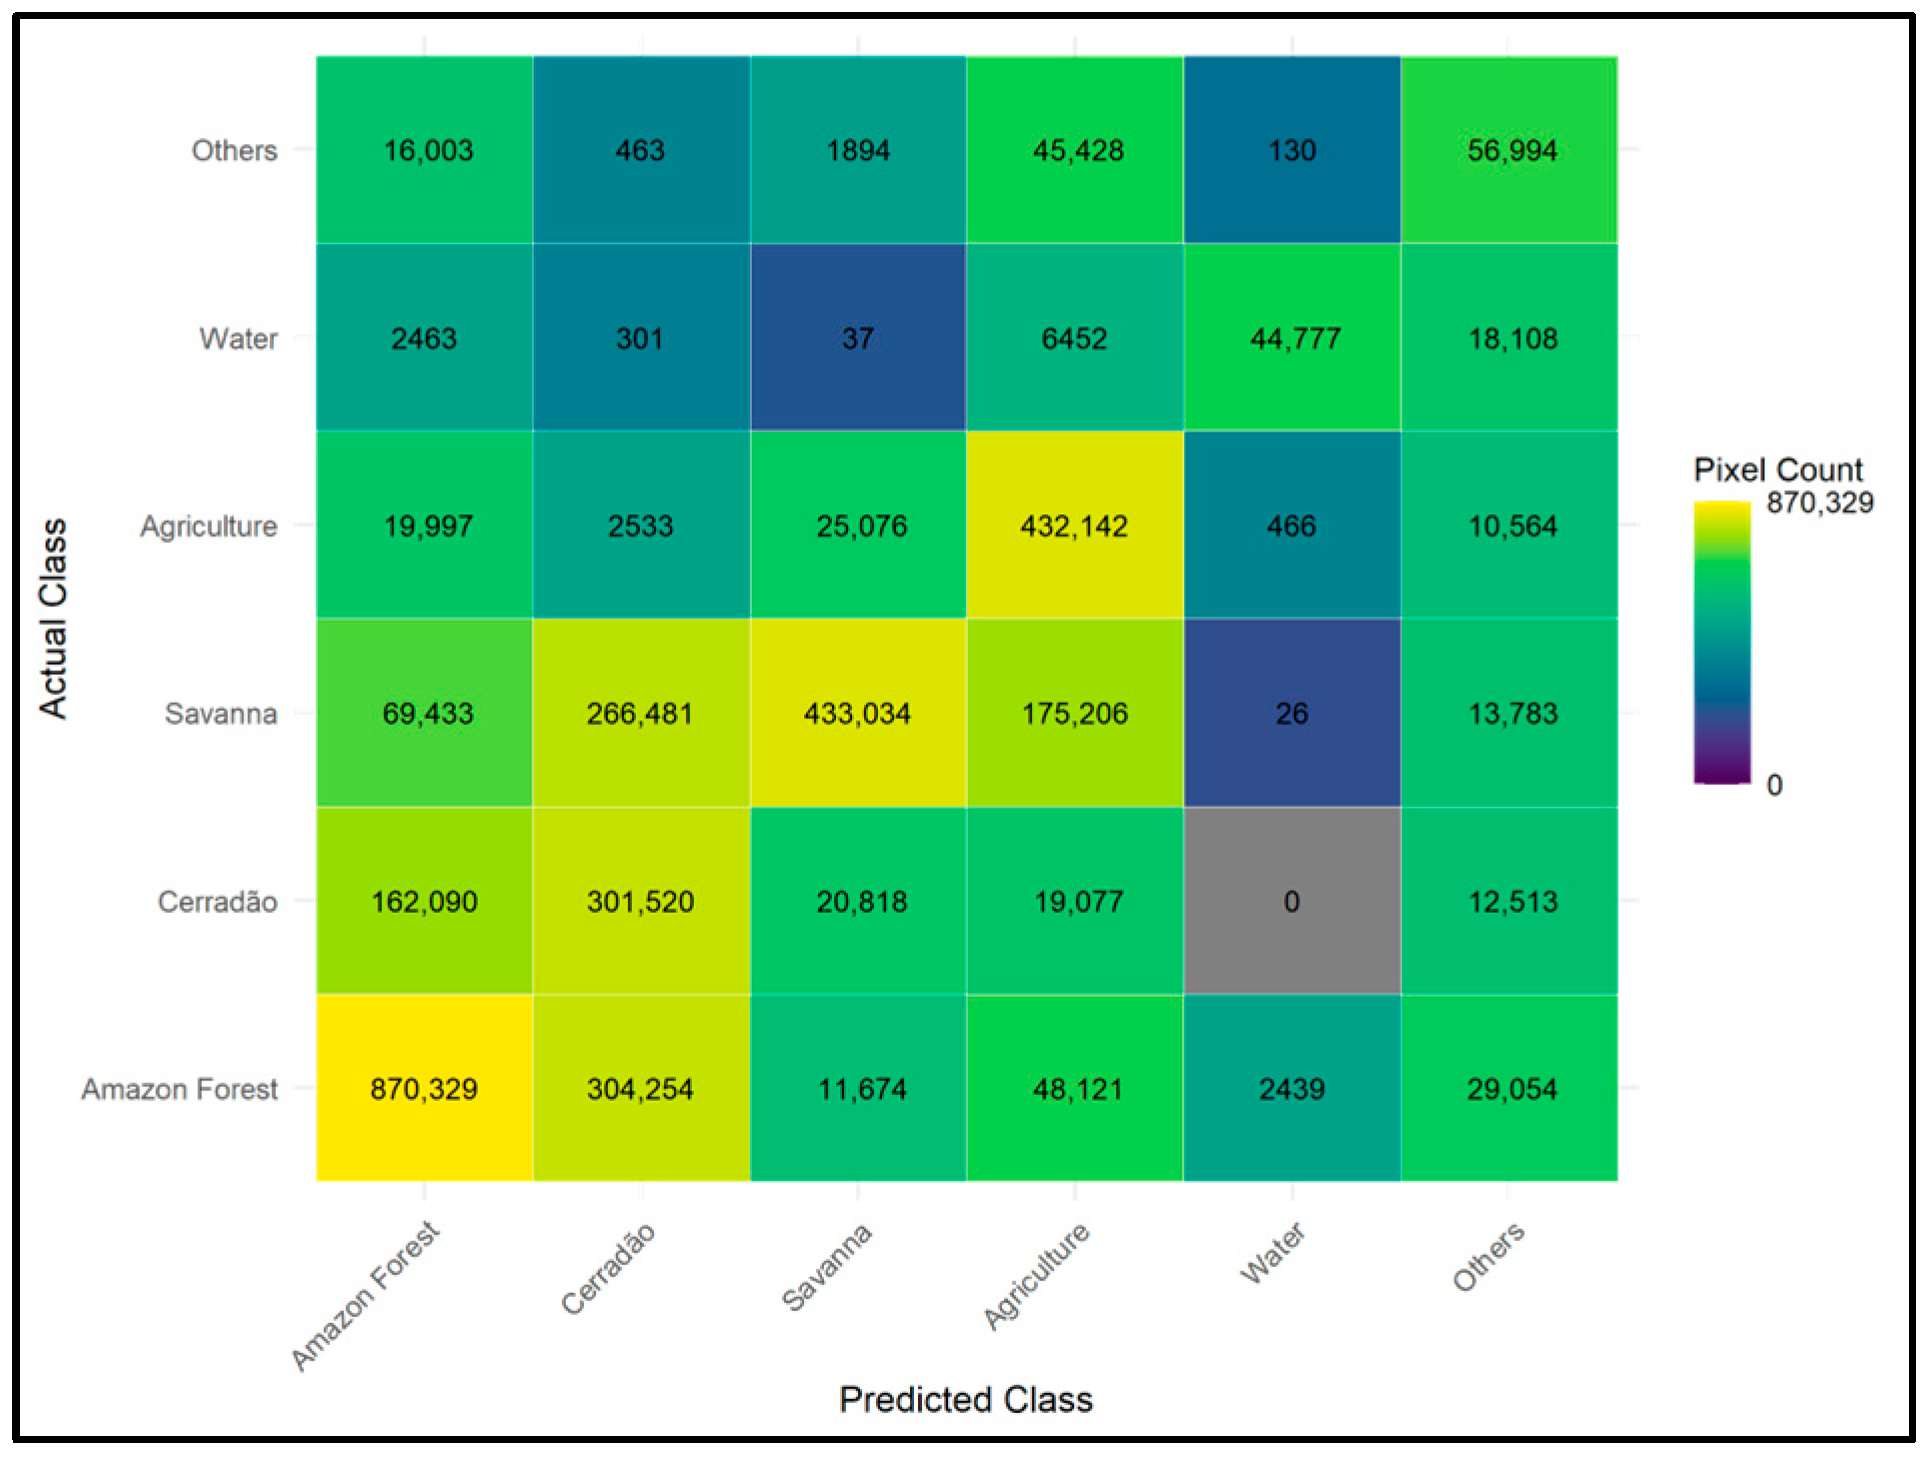
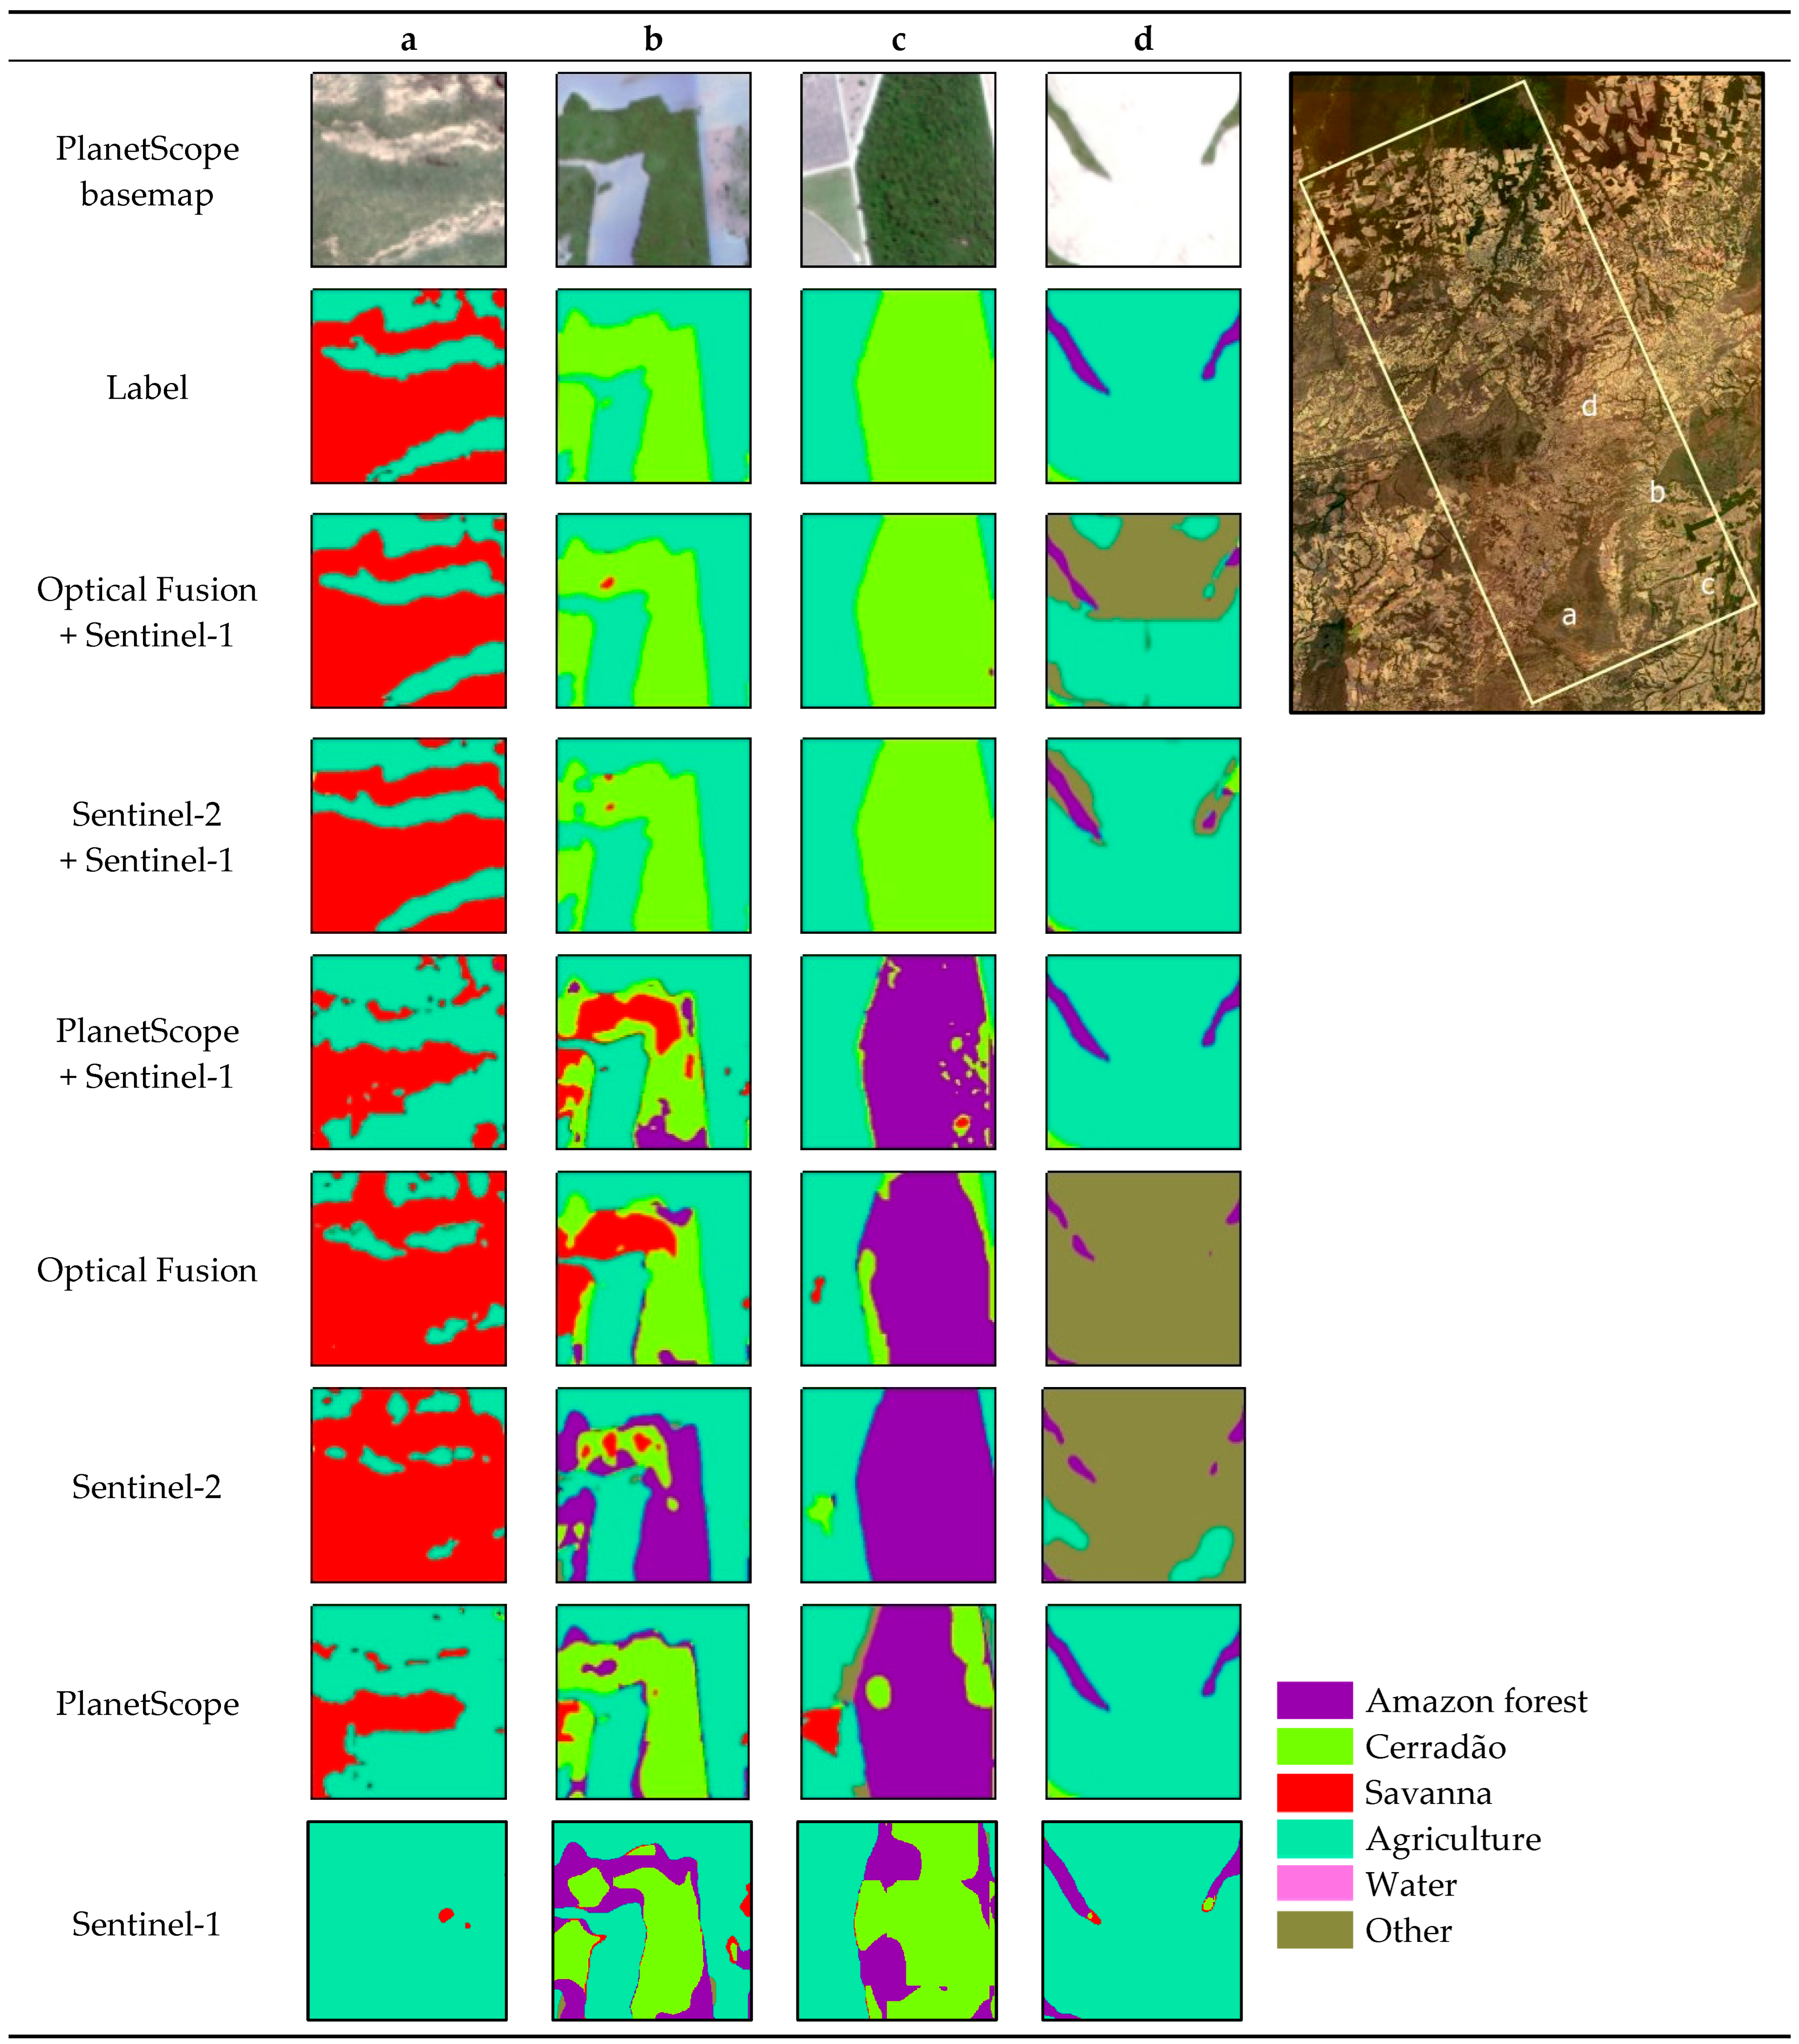
For mapping most land cover categories, models integrating optical and SAR data performed well, with the Optical Fusion + Sentinel-1 model in particular achieving the highest F1 scores for the Amazon forests, Cerradão, Water, and Other categories (Table 6). Forests were mapped with the highest level of accuracy, achieving F1 scores > 0.8 for all data combinations, except PlanetScope + Sentinel-1. However, Cerradão was often confused with the Amazon forest (Figure 6b,c), and only combinations that utilized SAR could accurately identify Cerradão (F1 ≥ 0.65; Table 6). Including SAR also yielded higher F1 scores for mapping Savanna (F1 ≥ 0.76; Table 6), as opposed to using optical data alone (F1 ≤ 0.74; Table 6), particularly where the boundaries between pastures and the Savanna were unclear (Figure 6a). When only optical imagery was used, high-resolution PlanetScope data proved best for distinguishing the Savanna (F1 > 0.7; Table 6; Figure 6a). PlanetScope imagery alone, or in combination with SAR, was also useful for mapping Agriculture class (F1 > 0.90; Table 6), possibly due to the high brightness of agriculture fields (Figure 6d). Confusion matrix heatmaps for all six models are provided in Appendix A (Figure A1, Figure A2, Figure A3, Figure A4, Figure A5, Figure A6 and Figure A7), offering a detailed overview of classification errors.

4.2. Spatial Patterns of Land Cover Within the CAT

We subsequently applied the best-performing classification model to the entire CAT region to produce a high spatial resolution (4.77 m) map of vegetation patterns within the CAT. The study area is predominantly covered by natural vegetation, encompassing 50.3% of the total area (Table 7). The Amazon rainforest and the Savanna occupy more than 20% of the total area, whereas the Cerradão accounts for just 8.4% of the total area (Table 7). Distinct differences exist in the distribution patterns of the vegetation types. Both the Amazon rainforest and the Savanna exhibit high-density regions, with the rainforest mainly concentrated north of the boundary and the Savanna primarily located to the south. The Amazon rainforest forms large, continuous, and interconnected areas, whereas the Savanna is distributed in multiple, discrete, and discontinuous patches. In contrast, the Cerradão is more scattered, with no clear spatial differences across the boundary (Figure 7). Aside from natural vegetation, the remaining area is largely occupied by Agriculture areas (farmland and pasture), collectively comprising 48.6% of the total area (Table 7). Farmland and pasture are widely distributed and fragment the natural vegetation—particularly the southern savanna—into small, scattered patches (Figure 7).

5. Discussion

The classification of land cover in the ecologically diverse CAT presents significant challenges due to the complex interplay of vegetation types, canopy structures, and anthropogenic disturbances. Traditional approaches based on single-source remote sensing data have proven inadequate in capturing the subtle biophysical variations and patchy distributions of land cover, especially in mixed forest–savanna mosaics. In this study, we address this limitation by producing the first high-resolution land cover map of the CAT using a deep learning framework that fuses PlanetScope optical imagery, Sentinel-2 multispectral data, and Sentinel-1 SAR data, which integrative approach offers an integrative solution for mapping transitional ecosystems.
Our results demonstrate that fused datasets significantly outperform single-source models, particularly in distinguishing complex and often-confused vegetation classes such as Amazon forest, Cerradão, and Savanna. Notably, the ability to spatially isolate Cerradão—an understudied and ecologically sensitive vegetation type—marks a key advancement over previous classification efforts. The resulting map not only achieves high accuracy (F1 = 0.85) but also reveals pronounced spatial heterogeneity and fragmentation patterns across the CAT. While the Amazon forest dominates the northern portion of the study area with large, contiguous patches, the Savanna and Cerradão formations appear more fragmented and spatially dispersed, with Cerradão accounting for only 8.4% of the total area. These landscape configurations reflect the long-term impacts of agricultural expansion, particularly in the Cerrado, where ecological connectivity is increasingly disrupted and regional carbon stocks are degraded [89,90,91].
We found significant differences in classification accuracy depending on the combinations of imagery used to map the CAT (Table 6). Whether from fused optical data, PlanetScope, or Sentinel-2, models that relied solely on optical imagery performed particularly poorly for distinguishing Cerradão (Figure 6b,c). Cerradão, as a transitional vegetation type, possesses characteristics of both forest and open savanna, and thus exhibits a complex structure whose spectral features closely resemble those of dense forest and partially open savanna [22]. Consequently, optical data alone may fail to capture these structural nuances. In addition, Cerradão often spans narrow transition zones between dry forest and Savanna, sometimes only a few kilometers wide [21,31]. Such a limited distribution often leads to Cerradão intermixing with forest and savanna, creating a highly patchy pattern that further complicates vegetation classification.
However, we observed that using both multispectral Sentinel-2 and Sentinel-1 SAR data improved classification accuracy (Table 6; Figure 6b,c). The integration of optical and SAR imagery offers a powerful and complementary approach for monitoring heterogeneous landscapes such as those found in the Brazilian Cerrado, located within the southern CAT. Optical sensors are highly sensitive to the biochemical and biophysical properties of vegetation, capturing information related to canopy greenness, pigment content, and phenological dynamics [92,93,94]. In contrast, Sentinel-1’s C-band SAR, with its sensitivity to surface geometry and vegetation structure (e.g., roughness, dielectric properties, and canopy architecture), provides valuable insights into vertical and structural changes that are often obscured by cloud cover [95,96]. This complementary nature is particularly advantageous in the Cerrado, a biome characterized by a complex mosaic of vegetation types and marked seasonality, where optical observations may be limited during the wet season due to persistent cloud cover. Multi-sensor fusion approaches have shown promise in improving land cover classification, detecting subtle vegetation changes, and enhancing the accuracy of degradation and vegetation loss monitoring [97,98,99]. Therefore, leveraging both spectral and structural information through the fusion of Sentinel-2, Planet, and Sentinel-1 data can significantly strengthen ecosystem monitoring and inform policy interventions in this increasingly threatened savanna biome.
Furthermore, our results indicate that models using PlanetScope data achieved better classification accuracy for mapping Savanna than other optical-only data models (Table 6). The CAT region contains expansive pastures that tend to regenerate when grazing ceases or when management intensity is reduced. These regenerating pastures often contain abundant herbaceous plants and shrubs, closely resembling open savanna formations [100]. Thus, in the model using only Sentinel-2, regenerating pastures are frequently confused with sparse Cerrado, leading to inaccuracies in identifying pasture boundaries (Figure 6a). By contrast, PlanetScope’s higher spatial resolution better captures the traces of human activities and management in agricultural areas [101], such as shrubs, herbaceous plants, bare soil, fences, or animal tracks. Moreover, while regenerating pastures and savannas exhibit similar spectral properties in optical data, their surface structure differs substantially. Pastures often feature more homogeneous vegetation composition, likely possessing less variable surface roughness than Savanna. In terms of surface moisture, pastures also tend to have lower evapotranspiration than the Savanna [102]. Hence, Sentinel-1 SAR data, which is sensitive to both structural and moisture characteristics, may compensate for the limitations of optical imagery, improving classification performance (Table 6).
With regard to agriculture classes, we detected several areas of extremely high reflectance in agricultural lands within the study area in both PlanetScope and Sentinel-2 images (Figure 6d), which may have arisen from exposed soil during cultivation, fallow periods, or from irrigation that increases reflectance in certain spectral bands [103,104,105]. High reflectance frequently leads to confusion between agricultural lands and built-up areas or roads [106], and PlanetScope’s high spatial resolution demonstrates a strong capacity for discriminating among these types (Figure 6d). This can also be attributed to PlanetScope’s ability to capture fine-scale agricultural surface features [44], including subtle internal field structures, crop planting patterns, and mixed patches of bare soil and vegetation. Furthermore, the Fusion + Sentinel-1 dataset performed well in the “other” category (Table 6), which encompasses isolated buildings, urban areas, and paved roads. Compared with natural vegetation, roads and buildings typically exhibit distinct color and textural characteristics [107]. Nonetheless, narrow roads, particularly those surrounded by vegetation, may be obscured by tree canopies and shadows, thereby influencing the physical attributes of vegetation [108]. The combination of high-resolution multispectral optical data with SAR fully harnesses the advantages of both. Optical data provides detailed spectral information, whereas SAR data captures morphological features. High-resolution optical data more effectively detects linear and continuous roads [109], while SAR data excels at identifying geometric properties such as flatness and width [110], thereby enhancing overall classification performance.
High-resolution fused remote sensing imagery demonstrates superior performance in complex tropical ecosystems, capturing fine-scale variations in canopy height and coverage more effectively [41,44,87]. Our study confirms this advantage within the CAT region. The classification accuracy of fused datasets not only outperforms single-source data overall (Table 5) but also excels in identifying specific vegetation types like Cerradão (Table 6). The results demonstrate that the combination of fused PlanetScope and Sentinel-2 optical imagery, together with SAR, significantly outperforms single-source models, particularly for identifying the Amazon forest and Cerradão, and concurs with several previous findings that also report improved classification outcomes using multi-source data fusion [52,111,112]. High-resolution imagery (e.g., PlanetScope) reveals finer surface details, allowing precise delineation of vegetation patches [113]. Although Sentinel-2 has lower spatial resolution than PlanetScope, it provides richer spectral information, capturing vegetation surface reflectance across different wavelengths [114,115]. SAR data offers structural information and surface roughness characteristics, aiding in distinguishing vegetation types and artificial structures [116,117]. In this study, data fusion effectively combines PlanetScope’s high spatial resolution with Sentinel-2’s spectral richness and Sentinel-1’s SAR data, enhancing vegetation classification in ecologically complex regions.
Agricultural expansion and increased human activities have significantly degraded vegetation in the CAT region [34]. Our results indicate that natural vegetation covers 50.3% of the region, with the Amazon forest and Savanna occupying similar areas, while Cerradão represents only 8.4%. Agricultural lands are widespread, particularly fragmenting the southern Cerrado into small patches (Figure 7). This landscape shift highlights the long-term impacts of intensive agriculture on regional ecological functions. These activities disrupt ecological balance by reducing soil organic matter and impairing soil respiration [118,119] while contributing to the erosion and spatial-temporal decline of plant species [16,17,65]. Unlike the Amazon, the Cerrado region lacks effective vegetation protection policies, exacerbating vegetation loss and fragmentation [120,121,122]. We also observed that the natural vegetation landscape in the CAT region exhibits pronounced spatial heterogeneity. The Amazon forest, concentrated in the north, features high connectivity and coverage, offering substantial carbon storage and biodiversity support. In contrast, the Savanna is primarily located in the south, forming isolated high-density regions with poor connectivity, while Cerradão, though scattered, is present throughout the region. These patterns reflect dynamic ecological processes and underscore the profound influence of human activities on natural landscapes [34,120]. As ecotone vegetation between tropical forests and savannas, Cerradão lacks sufficient protection policies [28,29], leading to higher deforestation rates compared to the Amazon [123,124]. This trend not only physically degrades vegetation but also reduces ecosystem services. The decline of Cerradão diminishes regional carbon storage, increasing greenhouse gas emissions and exacerbating climate change [65,125]. Given Cerradão’s prevalence in infertile soils [30,34], its loss further degrades soil structure and fertility, intensifying soil erosion.
A lack of comprehensive reference datasets has long posed a significant challenge for land cover classification studies in tropical regions [126,127]. The diversity of vegetation types, combined with complex spatial structures and distributions, complicates the acquisition of accurate ground truth data due to logistical challenges, high time requirements, and costs. Although traditional deep learning methods have been widely applied to land cover classification and shown to outperform conventional classifiers in distinguishing complex surface types [128,129,130], their accuracy typically depends on large training datasets, which presents additional challenges for land cover classification in the CAT region. In this study, the U-net model effectively handled multi-scale information, even with limited and imbalanced samples [62,131]. Despite the complex and dispersed distribution of vegetation types in the CAT region, the U-net model, enhanced by data augmentation techniques and hyperparameter optimization, achieved high classification accuracy, particularly for transitional vegetation types like Cerradão. This highlights the potential of deep learning in classifying tropical complex ecosystems [130,132,133,134,135,136]. The success of the U-net model can be attributed to its unique encoder–decoder structure, which preserves image details through skip connections while improving gradient propagation. This structure allows the U-net to excel in processing high-resolution remote sensing images by capturing spatial features at multiple scales. Furthermore, data augmentation techniques, such as image rotation, flipping, and cropping, significantly enhanced the diversity of the training samples, improving the model’s generalization ability. As a result, the U-net achieved high classification accuracy even with a limited training dataset.
Despite improving land cover classification accuracy in the CAT region through data fusion and deep learning techniques, several limitations remain. First, the limited availability of field-based vegetation survey data affects the diversity and representativeness of the training samples. Future studies should aim to increase the number of field samples, particularly detailed surveys of transitional vegetation types such as Cerradão, to further enhance the accuracy of classification models. Additionally, while this study focused on the fusion of optical and SAR data, future research could explore integrating other remote sensing data sources, such as spaceborne LiDAR and L-band SAR, to further improve classification performance and the discrimination of vegetation structures. Furthermore, although our current analysis focused on the year 2023, the proposed methodology shows promising potential for multi-year land cover monitoring and broader spatial applications. PlanetScope NICFI monthly mosaics provide regular high-resolution imagery that enables such temporal extension. However, we observed that in earlier years, image quality may be affected by cloud cover, shadows, and seasonal haze, which could impact classification performance. Future studies should consider these factors when applying the method across time and evaluate preprocessing strategies to improve temporal consistency.

6. Conclusions

This study demonstrates the effectiveness of integrating multi-source remote sensing data with deep learning techniques for high-precision land cover classification in the CAT region. By leveraging the complementary strengths of high-resolution optical imagery from PlanetScope, multispectral data from Sentinel-2, and SAR data from Sentinel-1, we achieved superior classification accuracy compared to models using single data sources. The Fusion + Sentinel-1 dataset emerged as the most effective, yielding the highest overall accuracy and F1 score. This confirms the hypothesis that data fusion can significantly enhance the classification performance by providing comprehensive spectral and structural information. The classification results revealed that 50.3% of the study area is covered by natural vegetation, with forests and savannas each occupying over 20%, while Cerradão covers only 8.4%. Cerradão, a forest-like vegetation type within the Cerrado biome, is notoriously difficult to distinguish from adjacent tropical forests using remote sensing due to its structural similarities. Despite its limited spatial extent, Cerradão plays a critical ecological role in the Amazon-Cerrado transition zone and is experiencing rapid loss. Preserving the Cerrado biome—particularly the Cerradão forest formation—is essential for biodiversity conservation, ecosystem resilience, and maintaining ecological connectivity in this transitional landscape. Our analysis revealed significant fragmentation of natural vegetation, primarily driven by extensive agricultural expansion in the southern regions. While forest areas exhibited high aggregation and connectivity, Cerradão was characterized by more dispersed and irregularly shaped patches. This study highlights the potential of data fusion and deep learning approaches to enhance land cover classification in ecotonal regions, providing valuable insights for biodiversity conservation and sustainable land-use planning in the CAT region.

Author Contributions

Conceptualization, C.L., A.H. and P.d.C.B.; methodology, C.L., A.H. and P.d.C.B.; software, C.L.; validation, C.L., B.S.M., B.H.M.J. and P.d.C.B.; formal analysis, C.L.; investigation, C.L.; resources, B.S.M., B.H.M.J. and P.d.C.B.; data curation, C.L.; writing—original draft preparation, C.L.; writing—review and editing, C.L., A.H., B.S.M., B.H.M.J., M.D. and P.d.C.B.; visualization, C.L.; supervision, A.H., M.D. and P.d.C.B. All authors have read and agreed to the published version of the manuscript.

Funding

This research received no external funding.

Data Availability Statement

The original contributions presented in the study are included in the article, further inquiries can be directed to the corresponding author.

Conflicts of Interest

The authors declare no conflicts of interest.

Appendix A

Figure A1. Confusion matrix heat-map for Optical Fusion + Sentinel-1 model.
Remotesensing 17 02138 g0a1
Figure A2. Confusion matrix heat-map for Sentinel-2 + Sentinel-1 model.
Remotesensing 17 02138 g0a2
Figure A3. Confusion matrix heat-map for PlanetScope + Sentinel-1 model.
Remotesensing 17 02138 g0a3
Figure A4. Confusion matrix heat-map for Optical Fusion model.
Remotesensing 17 02138 g0a4
Figure A5. Confusion matrix heat-map for Sentinel-2 model.
Remotesensing 17 02138 g0a5
Figure A6. Confusion matrix heat-map for PlanetScope model.
Remotesensing 17 02138 g0a6
Figure A7. Confusion matrix heat-map for Sentinel-1 model.
Remotesensing 17 02138 g0a7

References

  1. Peixoto, K.S.; Marimon-Junior, B.H.; Marimon, B.S.; Elias, F.; de Farias, J.; Freitag, R.; Mews, H.A.; das Neves, E.C.; Prestes, N.C.C.S.; Malhi, Y. Unravelling Ecosystem Functions at the Amazonia-Cerrado Transition: II. Carbon Stocks and CO2 Soil Efflux in Cerradão Forest Undergoing Ecological Succession. Acta Oecol. 2017, 82, 23–31. [Google Scholar] [CrossRef]
  2. Morandi, P.S.; Marimon, B.S.; Marimon-Junior, B.H.; Ratter, J.A.; Feldpausch, T.R.; Colli, G.R.; Munhoz, C.B.R.; da Silva Júnior, M.C.; de Souza Lima, E.; Haidar, R.F.; et al. Tree Diversity and Above-Ground Biomass in the South America Cerrado Biome and Their Conservation Implications. Biodivers. Conserv. 2020, 29, 1519–1536. [Google Scholar] [CrossRef]
  3. Marengo, J.A.; Jimenez, J.C.; Espinoza, J.-C.; Cunha, A.P.; Aragão, L.E.O. Increased Climate Pressure on the Agricultural Frontier in the Eastern Amazonia–Cerrado Transition Zone. Sci. Rep. 2022, 12, 457. [Google Scholar] [CrossRef] [PubMed]
  4. Zeferino, L.B.; Lustosa Filho, J.F.; dos Santos, A.C.; Cerri, C.E.P.; de Oliveira, T.S. Soil Carbon and Nitrogen Stocks Following Forest Conversion to Long-Term Pasture in Amazon Rainforest-Cerrado Transition Environment. CATENA 2023, 231, 107346. [Google Scholar] [CrossRef]
  5. Ribeiro, A.F.S.; Santos, L.; Randerson, J.T.; Uribe, M.R.; Alencar, A.A.C.; Macedo, M.N.; Morton, D.C.; Zscheischler, J.; Silvestrini, R.A.; Rattis, L.; et al. The Time since Land-Use Transition Drives Changes in Fire Activity in the Amazon-Cerrado Region. Commun. Earth Environ. 2024, 5, 96. [Google Scholar] [CrossRef]
  6. Reis, S.M.; de Oliveira, E.A.; Elias, F.; Gomes, L.; Morandi, P.S.; Marimon, B.S.; Marimon Junior, B.H.; das Neves, E.C.; de Oliveira, B.; Lenza, E. Resistance to Fire and the Resilience of the Woody Vegetation of the “Cerradão” in the “Cerrado”–Amazon Transition Zone. Braz. J. Bot. 2017, 40, 193–201. [Google Scholar] [CrossRef]
  7. Mataveli, G.; de Oliveira, G.; Silva-Junior, C.H.L.; Stark, S.C.; Carvalho, N.; Anderson, L.O.; Gatti, L.V.; Aragão, L.E.O.C. Record-Breaking Fires in the Brazilian Amazon Associated with Uncontrolled Deforestation. Nat. Ecol. Evol. 2022, 6, 1792–1793. [Google Scholar] [CrossRef]
  8. Malhi, Y.; Roberts, J.T.; Betts, R.A.; Killeen, T.J.; Li, W.; Nobre, C.A. Climate Change, Deforestation, and the Fate of the Amazon. Science 2008, 319, 169–172. [Google Scholar] [CrossRef]
  9. Matricardi, E.A.T.; Skole, D.L.; Pedlowski, M.A.; Chomentowski, W. Assessment of Forest Disturbances by Selective Logging and Forest Fires in the Brazilian Amazon Using Landsat Data. Int. J. Remote Sens. 2013, 34, 1057–1086. [Google Scholar] [CrossRef]
  10. Araújo, I.; Scalon, M.C.; Amorim, I.; Oliveras, I.; Cruz, W.J.A.; Reis, S.M.; Marimon, B.S. Contrasting Vegetation Gradient Effects Explain the Differences in Leaf Traits Among Woody Plant Communities in the Amazonia-Cerrado Transition. Res. Sq. 2021. [Google Scholar] [CrossRef]
  11. Alencar, A.; Nepstad, D.; McGrath, D.; Moutinho, P.; Pacheco, P.; Diaz, M.; Soares Filho, B. Desmatamento Na Amazônia: Indo Além Da ”Emergência Crônica”; IPAM: Belém, Brazil, 2004; Volume 90. [Google Scholar]
  12. Nogueira, D.S.; Marimon, B.S.; Marimon-Junior, B.H.; Oliveira, E.A.; Morandi, P.; Reis, S.M.; Elias, F.; Neves, E.C.; Feldpausch, T.R.; Lloyd, J.; et al. Impacts of Fire on Forest Biomass Dynamics at the Southern Amazon Edge. Environ. Conserv. 2019, 46, 285–292. [Google Scholar] [CrossRef]
  13. Beuchle, R.; Achard, F.; Bourgoin, C.; Vancutsem, C.; Eva, H.; Follador, M. Deforestation and Forest Degradation in the Amazon; European Union: Luxembourg, 2021. [Google Scholar] [CrossRef]
  14. Banerjee, O.; Cicowiez, M.; Macedo, M.N.; Malek, Ž.; Verburg, P.H.; Goodwin, S.; Vargas, R.; Rattis, L.; Bagstad, K.J.; Brando, P.M.; et al. Can We Avert an Amazon Tipping Point? The Economic and Environmental Costs. Environ. Res. Lett. 2022, 17, 125005. [Google Scholar] [CrossRef]
  15. Albert, J.S.; Carnaval, A.C.; Flantua, S.G.A.; Lohmann, L.G.; Ribas, C.C.; Riff, D.; Carrillo, J.D.; Fan, Y.; Figueiredo, J.J.P.; Guayasamin, J.M.; et al. Human Impacts Outpace Natural Processes in the Amazon. Science 2023, 379, eabo5003. [Google Scholar] [CrossRef] [PubMed]
  16. Gowda, J.H.; Kitzberger, T.; Premoli, A.C. Landscape Responses to a Century of Land Use along the Northern Patagonian Forest-Steppe Transition. Plant Ecol. 2012, 213, 259–272. [Google Scholar] [CrossRef]
  17. Joly, C.A.; Assis, M.A.; Bernacci, L.C.; Tamashiro, J.Y.; de Campos, M.C.R.; Comes, J.A.M.A.; Lacerda, M.S.; dos Santos, F.A.M.; Pedroni, F.; de Souza Pereira, L. Floristic and Phytosociology in Permanent Plots of the Atlantic Rainforest along an Altitudinal Gradient in Southeastern Brazil. Biota Neotrop. 2012, 12, 123–145. [Google Scholar]
  18. Pokorny, B.; Pacheco, P.; de Jong, W.; Entenmann, S.K. Forest Frontiers out of Control: The Long-Term Effects of Discourses, Policies, and Markets on Conservation and Development of the Brazilian Amazon. Ambio 2021, 50, 2199–2223. [Google Scholar] [CrossRef]
  19. Faria, D.; Morante-Filho, J.C.; Baumgarten, J.; Bovendorp, R.S.; Cazetta, E.; Gaiotto, F.A.; Mariano-Neto, E.; Mielke, M.S.; Pessoa, M.S.; Rocha-Santos, L.; et al. The Breakdown of Ecosystem Functionality Driven by Deforestation in a Global Biodiversity Hotspot. Biol. Conserv. 2023, 283, 110126. [Google Scholar] [CrossRef]
  20. Maurya, M.J.; Vivek, M. Deforestation: Causes, Consequences and Possible Solutions. Ldealistic J. Adv. Res. Progress. Spectr. IJARPS 2025, 4, 70–76. [Google Scholar]
  21. Ratter, J.A.; Richards, P.W.; Argent, G.; Gifford, D.R.; Clapham, A.R. Observations on the Vegetation of Northeastern Mato Grosso: I. The Woody Vegetation Types of the Xavantina-Cachimbo Expedition Area. Philos. Trans. R. Soc. Lond. B Biol. Sci. 1973, 266, 449–492. [Google Scholar] [CrossRef]
  22. Ribeiro, J.F.; Walter, B.M.T. As Principais Fitofissionomias do Bioma Cerrado. In Cerrado: Ecologia e Flora; Sano, S.M., Almeida, S.P., Ribeiro, J.P., Eds.; Embrapa: Brasilia, Brazil, 2008; pp. 153–212. [Google Scholar]
  23. Franczak, D.D.; Marimon, B.S.; Hur Marimon-Junior, B.; Mews, H.A.; Maracahipes, L.; Oliveira, E.A. de Changes in the Structure of a Savanna Forest over a Six-Year Period in the Amazon-Cerrado Transition, Mato Grosso State, Brazil. Rodriguésia 2011, 62, 425–436. [Google Scholar] [CrossRef]
  24. Marimon, B.S.; Marimon-Junior, B.H.; Feldpausch, T.R.; Oliveira-Santos, C.; Mews, H.A.; Lopez-Gonzalez, G.; Lloyd, J.; Franczak, D.D.; de Oliveira, E.A.; Maracahipes, L.; et al. Disequilibrium and Hyperdynamic Tree Turnover at the Forest–Cerrado Transition Zone in Southern Amazonia. Plant Ecol. Divers. 2014, 7, 281–292. [Google Scholar] [CrossRef]
  25. de Oliveira, S.N.; de Carvalho Júnior, O.A.; Gomes, R.A.T.; Guimarães, R.F.; McManus, C.M. Landscape-Fragmentation Change Due to Recent Agricultural Expansion in the Brazilian Savanna, Western Bahia, Brazil. Reg. Environ. Change 2017, 17, 411–423. [Google Scholar] [CrossRef]
  26. Morandi, P.S.; Marimon-Junior, B.H.; de Oliveira, E.A.; Reis, S.M.; Valadão, M.B.X.; Forsthofer, M.; Passos, F.B.; Marimon, B.S. Vegetation succession in the Cerrado/Amazonian forest transition zone of Mato Grosso state, Brazil. Edinb. J. Bot. 2016, 73, 83–93. [Google Scholar] [CrossRef]
  27. Reis, S.M.; Marimon, B.S.; Marimon Junior, B.H.; Morandi, P.S.; de Oliveira, E.A.; Elias, F.; das Neves, E.C.; de Oliveira, B.; Nogueira, D.d.S.; Umetsu, R.K.; et al. Climate and Fragmentation Affect Forest Structure at the Southern Border of Amazonia. Plant Ecol. Divers. 2018, 11, 13–25. [Google Scholar] [CrossRef]
  28. Soares-Filho, B.; Rajão, R.; Macedo, M.; Carneiro, A.; Costa, W.; Coe, M.; Rodrigues, H.; Alencar, A. Cracking Brazil’s Forest Code. Science 2014, 344, 363–364. [Google Scholar] [CrossRef]
  29. de Souza Mendes, F.; Baron, D.; Gerold, G.; Liesenberg, V.; Erasmi, S. Optical and SAR Remote Sensing Synergism for Mapping Vegetation Types in the Endangered Cerrado/Amazon Ecotone of Nova Mutum—Mato Grosso. Remote Sens. 2019, 11, 1161. [Google Scholar] [CrossRef]
  30. Marimon Junior, B.H.; Haridasan, M. Comparação da vegetação arbórea e características edáficas de um cerradão e um cerrado sensu stricto em áreas adjacentes sobre solo distrófico no leste de Mato Grosso, Brasil. Acta Bot. Bras. 2005, 19, 913–926. [Google Scholar] [CrossRef]
  31. Marimon, B.S.; Lima, E.D.S.; Duarte, T.G.; Chieregatto, L.C.; Ratter, J.A. Observations on the vegetation of northeastern Mato Grosso, Brazil. IV. An analysis of the Cerrado–Amazonian Forest ecotone. Edinb. J. Bot. 2006, 63, 323–341. [Google Scholar] [CrossRef]
  32. Torello-Raventos, M.; Feldpausch, T.R.; Veenendaal, E.; Schrodt, F.; Saiz, G.; Domingues, T.F.; Djagbletey, G.; Ford, A.; Kemp, J.; Marimon, B.S.; et al. On the Delineation of Tropical Vegetation Types with an Emphasis on Forest/Savanna Transitions. Plant Ecol. Divers. 2013, 6, 101–137. [Google Scholar] [CrossRef]
  33. Passos, F.B.; Marimon, B.S.; Phillips, O.L.; Morandi, P.S.; das Neves, E.C.; Elias, F.; Reis, S.M.; de Oliveira, B.; Feldpausch, T.R.; Marimon Júnior, B.H. Savanna Turning into Forest: Concerted Vegetation Change at the Ecotone between the Amazon and “Cerrado” Biomes. Braz. J. Bot. 2018, 41, 611–619. [Google Scholar] [CrossRef]
  34. Marques, E.Q.; Marimon-Junior, B.H.; Marimon, B.S.; Matricardi, E.A.T.; Mews, H.A.; Colli, G.R. Redefining the Cerrado–Amazonia Transition: Implications for Conservation. Biodivers. Conserv. 2020, 29, 1501–1517. [Google Scholar] [CrossRef]
  35. Bourscheit, A. Proposal to Remove Mato Grosso from the Legal Amazon Allows Deforestation of an Area the Size of Pernambuco. Available online: http://infoamazonia.org/en/2022/03/18/proposal-to-remove-mato-grosso-from-the-legal-amazon-allows-deforestation-of-an-area-the-size-of-pernambuco/ (accessed on 4 April 2025).
  36. Prizibisczki, C. MT Tenta Recategorizar Florestas no Estado para que Sejam Consideradas como Cerrado. Available online: https://oeco.org.br/noticias/mt-tenta-recategorizar-florestas-no-estado-para-que-sejam-consideradas-como-cerrado/ (accessed on 4 April 2025).
  37. Juarez, C. Bill No. 337/2022. 2022. Available online: https://www.camara.leg.br/proposicoesWeb/fichadetramitacao?idProposicao=2314952 (accessed on 4 April 2025).
  38. Comissão De Meio Ambiente, Recursos Hídricos E Recursos Minerais Supplementary Bill—Substitutivo Integral ao PLC No. 18/2024. 2024. Available online: https://oeco.org.br/wp-content/uploads/2024/10/PLC-18-Substitutivo-Integral-n.-3.pdf (accessed on 4 April 2025).
  39. Zaiatz, A.P.S.R.; Zolin, C.A.; Vendrusculo, L.G.; Lopes, T.R.; Paulino, J. Agricultural Land Use and Cover Change in the Cerrado/Amazon Ecotone: A Case Study of the Upper Teles Pires River Basin. Acta Amaz. 2018, 48, 168–177. [Google Scholar] [CrossRef]
  40. de Faria, L.D.; Matricardi, E.A.T.; Marimon, B.S.; Miguel, E.P.; Junior, B.H.M.; de Oliveira, E.A.; Prestes, N.C.C.d.S.; de Carvalho, O.L.F. Biomass Prediction Using Sentinel-2 Imagery and an Artificial Neural Network in the Amazon/Cerrado Transition Region. Forests 2024, 15, 1599. [Google Scholar] [CrossRef]
  41. Vizzari, M. PlanetScope, Sentinel-2, and Sentinel-1 Data Integration for Object-Based Land Cover Classification in Google Earth Engine. Remote Sens. 2022, 14, 2628. [Google Scholar] [CrossRef]
  42. Bueno, I.T.; Antunes, J.F.; Dos Reis, A.A.; Werner, J.P.; Toro, A.P.; Figueiredo, G.K.; Esquerdo, J.C.; Lamparelli, R.A.; Coutinho, A.C.; Magalhães, P.S. Mapping Integrated Crop-Livestock Systems in Brazil with Planetscope Time Series and Deep Learning. Remote Sens. Environ. 2023, 299, 113886. [Google Scholar] [CrossRef]
  43. Wagner, F.H.; Dalagnol, R.; Silva-Junior, C.H.L.; Carter, G.; Ritz, A.L.; Hirye, M.C.M.; Ometto, J.P.H.B.; Saatchi, S. Mapping Tropical Forest Cover and Deforestation with Planet NICFI Satellite Images and Deep Learning in Mato Grosso State (Brazil) from 2015 to 2021. Remote Sens. 2023, 15, 521. [Google Scholar] [CrossRef]
  44. Werner, J.P.; Belgiu, M.; Bueno, I.T.; Dos Reis, A.A.; Toro, A.P.; Antunes, J.F.; Stein, A.; Lamparelli, R.A.; Magalhães, P.S.; Coutinho, A.C. Mapping Integrated Crop–Livestock Systems Using Fused Sentinel-2 and PlanetScope Time Series and Deep Learning. Remote Sens. 2024, 16, 1421. [Google Scholar] [CrossRef]
  45. Matosak, B.M.; Fonseca, L.M.G.; Taquary, E.C.; Maretto, R.V.; Bendini, H.d.N.; Adami, M. Mapping Deforestation in Cerrado Based on Hybrid Deep Learning Architecture and Medium Spatial Resolution Satellite Time Series. Remote Sens. 2022, 14, 209. [Google Scholar] [CrossRef]
  46. Bolfe, É.L.; Parreiras, T.C.; da Silva, L.A.P.; Sano, E.E.; Bettiol, G.M.; Victoria, D.d.C.; Sanches, I.D.; Vicente, L.E. Mapping Agricultural Intensification in the Brazilian Savanna: A Machine Learning Approach Using Harmonized Data from Landsat Sentinel-2. ISPRS Int. J. Geo-Inf. 2023, 12, 263. [Google Scholar] [CrossRef]
  47. Maciel Junior, I.C.; Dallacort, R.; Boechat, C.L.; Teodoro, P.E.; Teodoro, L.P.R.; Rossi, F.S.; de Oliveira-Júnior, J.F.; Della-Silva, J.L.; Baio, F.H.R.; Lima, M.; et al. Maize Crop Detection through Geo-Object-Oriented Analysis Using Orbital Multi-Sensors on the Google Earth Engine Platform. AgriEngineering 2024, 6, 491–508. [Google Scholar] [CrossRef]
  48. Pham-Duc, B.; Nguyen, H.; Nguyen-Quoc, H. Unveiling the Research Landscape of Planetscope Data in Addressing Earth-Environmental Issues: A Bibliometric Analysis. Earth Sci. Inform. 2025, 18, 52. [Google Scholar] [CrossRef]
  49. Aguilera, M.A.Z. Classication Of Land-Cover Through Machine Learning Algorithms For Fusion Of Sentinel-2a And Planetscope Imagery. In Proceedings of the 2020 IEEE Latin American GRSS & ISPRS Remote Sensing Conference (LAGIRS), Santiago, Chile, 22–26 March 2020; pp. 246–253. [Google Scholar]
  50. Hoekman, D.; Kooij, B.; Quiñones, M.; Vellekoop, S.; Carolita, I.; Budhiman, S.; Arief, R.; Roswintiarti, O. Wide-Area Near-Real-Time Monitoring of Tropical Forest Degradation and Deforestation Using Sentinel-1. Remote Sens. 2020, 12, 3263. [Google Scholar] [CrossRef]
  51. Sarti, M.; Migliaccio, M.; Nunziata, F.; Mascolo, L.; Brugnoli, E. On the Sensitivity of Polarimetric SAR Measurements to Vegetation Cover: The Coiba National Park, Panama. Int. J. Remote Sens. 2017, 38, 6755–6768. [Google Scholar] [CrossRef]
  52. Bitencourt, M.D.; De Mesquita, H.N., Jr.; Kuntschik, G.; Da Rocha, H.R.; Furley, P.A. Cerrado Vegetation Study Using Optical and Radar Remote Sensing: Two Brazilian Case Studies. Can. J. Remote Sens. 2007, 33, 468–480. [Google Scholar] [CrossRef]
  53. de Carvalho, L.; Rahman, M.; Hay, G.; Yackel, J. Optical and SAR Imagery for Mapping Vegetation Gradients in Brazilian Savannas: Synergy between Pixel-Based and Object-Based Approaches. In Proceedings of the International Conference of Geographic Object-Based Image, Ghent, Belgium, 29 June–2 July 2010; Volume 38, pp. 1–7. [Google Scholar]
  54. Wagner, F.H.; Sanchez, A.; Tarabalka, Y.; Lotte, R.G.; Ferreira, M.P.; Aidar, M.P.M.; Gloor, E.; Phillips, O.L.; Aragão, L.E.O.C. Using the U-net Convolutional Network to Map Forest Types and Disturbance in the Atlantic Rainforest with Very High Resolution Images. Remote Sens. Ecol. Conserv. 2019, 5, 360–375. [Google Scholar] [CrossRef]
  55. Dang, K.B.; Nguyen, T.H.T.; Nguyen, H.D.; Truong, Q.H.; Vu, T.P.; Pham, H.N.; Duong, T.T.; Giang, V.T.; Nguyen, D.M.; Bui, T.H. U-Shaped Deep-Learning Models for Island Ecosystem Type Classification, a Case Study in Con Dao Island of Vietnam. One Ecosyst. 2022, 7, e79160. [Google Scholar] [CrossRef]
  56. Filatov, D.; Yar, G.N.A.H. Forest and Water Bodies Segmentation Through Satellite Images Using U-Net. arXiv 2022, arXiv:2207.11222. [Google Scholar]
  57. Zhao, G.; Zhang, Y.; Ge, M.; Yu, M. Bilateral U-Net Semantic Segmentation with Spatial Attention Mechanism. CAAI Trans. Intell. Technol. 2023, 8, 297–307. [Google Scholar] [CrossRef]
  58. Dimitrovski, I.; Spasev, V.; Loshkovska, S.; Kitanovski, I. U-Net Ensemble for Enhanced Semantic Segmentation in Remote Sensing Imagery. Remote Sens. 2024, 16, 2077. [Google Scholar] [CrossRef]
  59. de Bem, P.P.; de Carvalho Junior, O.A.; Fontes Guimarães, R.; Trancoso Gomes, R.A. Change Detection of Deforestation in the Brazilian Amazon Using Landsat Data and Convolutional Neural Networks. Remote Sens. 2020, 12, 901. [Google Scholar] [CrossRef]
  60. Mohla, S.; Mohla, S.; Guha, A.; Banerjee, B. Multimodal Noisy Segmentation Based Fragmented Burn Scars Identification in Amazon Rainforest. In Proceedings of the 2020 IEEE International Conference on Systems, Man, and Cybernetics (SMC), Toronto, ON, Canada, 11–14 October 2020; pp. 4122–4126. [Google Scholar]
  61. Neves, A.K.; Körting, T.S.; Fonseca, L.M.G.; Girolamo Neto, C.D.; Wittich, D.; Costa, G.; Heipke, C. Semantic Segmentation of Brazilian Savanna Vegetation Using High Spatial Resolution Satellite Data and U-Net. ISPRS Ann. Photogramm. Remote Sens. Spat. Inf. Sci. 2020, 5, 505–511. [Google Scholar] [CrossRef]
  62. Solórzano, J.V.; Mas, J.F.; Gao, Y.; Gallardo-Cruz, J.A. Land Use Land Cover Classification with U-Net: Advantages of Combining Sentinel-1 and Sentinel-2 Imagery. Remote Sens. 2021, 13, 3600. [Google Scholar] [CrossRef]
  63. Dalagnol, R.; Wagner, F.H.; Galvão, L.S.; Braga, D.; Osborn, F.; Sagang, L.B.; da Conceição Bispo, P.; Payne, M.; Junior, C.S.; Favrichon, S. Mapping Tropical Forest Degradation with Deep Learning and Planet NICFI Data. Remote Sens. Environ. 2023, 298, 113798. [Google Scholar] [CrossRef]
  64. Alvares, C.A.; Stape, J.L.; Sentelhas, P.C.; Gonçalves, J.d.M.; Sparovek, G. Köppen’s Climate Classification Map for Brazil. Meteorol. Z. 2013, 22, 711–728. [Google Scholar] [CrossRef] [PubMed]
  65. Prestes, N.C.C.S.; Marimon, B.S.; Morandi, P.S.; Reis, S.M.; Junior, B.H.M.; Cruz, W.J.A.; Oliveira, E.A.; Mariano, L.H.; Elias, F.; Santos, D.M.; et al. Impact of the Extreme 2015-16 El Niño Climate Event on Forest and Savanna Tree Species of the Amazonia-Cerrado Transition. Flora 2024, 319, 152597. [Google Scholar] [CrossRef]
  66. Biomas|IBGE. Available online: https://www.ibge.gov.br/geociencias/cartas-e-mapas/informacoes-ambientais/15842-biomas.html?=&t=downloads (accessed on 5 April 2025).
  67. Oliveira, K.N.; Miguel, E.P.; Martins, M.S.; Rezende, A.V.; Dos Santos, J.A.; Nappo, M.E.; Matricardi, E.A.T. Species Substitution and Changes in the Structure, Volume, and Biomass of Forest in a Savanna. Plants 2024, 13, 2826. [Google Scholar] [CrossRef] [PubMed]
  68. Ratter, J.A.; Askew, G.P.; Montgomery, R.F.; Gifford, D.R.; Ratter, J.A.; Askew, G.P.; Montgomery, R.F.; Gifford, D.R. Observations on Forests of Some Mesotrophic Soils in Central Brazil. Rev. Bras. Bot. 1978, 1, 47–58. [Google Scholar]
  69. Viani, R.A.; Rodrigues, R.R.; Dawson, T.E.; Lambers, H.; Oliveira, R.S. Soil pH Accounts for Differences in Species Distribution and Leaf Nutrient Concentrations of Brazilian Woodland Savannah and Seasonally Dry Forest Species. Perspect. Plant Ecol. Evol. Syst. 2014, 16, 64–74. [Google Scholar] [CrossRef]
  70. Gonçalves, R.V.S.; Cardoso, J.C.F.; Oliveira, P.E.; Oliveira, D.C. Changes in the Cerrado Vegetation Structure: Insights from More than Three Decades of Ecological Succession. Web Ecol. 2021, 21, 55–64. [Google Scholar] [CrossRef]
  71. Pereira, C.C.; Fernandes, G.W. Cerrado Rupestre Is Not Campo Rupestre: The Unknown and Threatened Savannah on Rocky Outcrops. Nat. Conserv. 2022, 49, 131–136. [Google Scholar] [CrossRef]
  72. Nogueira, E.M.; Nelson, B.W.; Fearnside, P.M.; França, M.B.; de Oliveira, Á.C.A. Tree Height in Brazil’s ‘Arc of Deforestation’: Shorter Trees in South and Southwest Amazonia Imply Lower Biomass. For. Ecol. Manag. 2008, 255, 2963–2972. [Google Scholar] [CrossRef]
  73. Torres, R.; Snoeij, P.; Geudtner, D.; Bibby, D.; Davidson, M.; Attema, E.; Potin, P.; Rommen, B.; Floury, N.; Brown, M.; et al. GMES Sentinel-1 Mission. Remote Sens. Environ. 2012, 120, 9–24. [Google Scholar] [CrossRef]
  74. Drusch, M.; Del Bello, U.; Carlier, S.; Colin, O.; Fernandez, V.; Gascon, F.; Hoersch, B.; Isola, C.; Laberinti, P.; Martimort, P.; et al. Sentinel-2: ESA’s Optical High-Resolution Mission for GMES Operational Services. Remote Sens. Environ. 2012, 120, 25–36. [Google Scholar] [CrossRef]
  75. Planet Satellite Imaging|Planet. Available online: https://www.planet.com/ (accessed on 5 April 2025).
  76. Grandini, M.; Bagli, E.; Visani, G. Metrics for Multi-Class Classification: An Overview. arXiv 2020, arXiv:2008.05756. [Google Scholar]
  77. Gorelick, N.; Hancher, M.; Dixon, M.; Ilyushchenko, S.; Thau, D.; Moore, R. Google Earth Engine: Planetary-Scale Geospatial Analysis for Everyone. Remote Sens. Environ. 2017, 202, 18–27. [Google Scholar] [CrossRef]
  78. Tropical Forest Observatory: High-Resolution Satellite Monitoring for Forests|Planet. Available online: https://www.planet.com/tropical-forest-observatory/ (accessed on 5 April 2025).
  79. Yin, F.; Lewis, P.E.; Gómez-Dans, J.L. Bayesian Atmospheric Correction over Land: Sentinel-2/MSI and Landsat 8/OLI. Geosci. Model Dev. 2022, 15, 7933–7976. [Google Scholar] [CrossRef]
  80. Lee, J.-S.; Grunes, M.R.; De Grandi, G. Polarimetric SAR Speckle Filtering and Its Implication for Classification. IEEE Trans. Geosci. Remote Sens. 1999, 37, 2363–2373. [Google Scholar]
  81. Solórzano, J.V.; Mas, J.F.; Gallardo-Cruz, J.A.; Gao, Y.; Fernández-Montes de Oca, A. Deforestation Detection Using a Spatio-Temporal Deep Learning Approach with Synthetic Aperture Radar and Multispectral Images. ISPRS J. Photogramm. Remote Sens. 2023, 199, 87–101. [Google Scholar] [CrossRef]
  82. Rasterio Package—Rasterio 1.5.0.Dev Documentation. Available online: https://rasterio.readthedocs.io/en/latest/api/rasterio.html (accessed on 5 April 2025).
  83. Minaee, S.; Boykov, Y.; Porikli, F.; Plaza, A.; Kehtarnavaz, N.; Terzopoulos, D. Image Segmentation Using Deep Learning: A Survey. IEEE Trans. Pattern Anal. Mach. Intell. 2022, 44, 3523–3542. [Google Scholar] [CrossRef]
  84. Gašparović, M.; Medak, D.; Pilaš, I.; Jurjević, L.; Balenović, I. Fusion of Sentinel-2 and PlanetScope Imagery for Vegetation Detection and Monitoring. Int. Arch. Photogramm. Remote Sens. Spat. Inf. Sci. 2018, XLII-1, 155–160. [Google Scholar] [CrossRef]
  85. Li, C.; Liu, L.; Wang, J.; Zhao, C.; Wang, R. Comparison of Two Methods of the Fusion of Remote Sensing Images with Fidelity of Spectral Information. In Proceedings of the IGARSS 2004—2004 IEEE International Geoscience and Remote Sensing Symposium, Anchorage, AK, USA, 20–24 September 2004; Volume 4, pp. 2561–2564. [Google Scholar]
  86. Ding, Y.; Wei, X.; Pang, H.; Zhang, J. Fusion of Object and Scene Based on IHS Transform and SFIM. In Proceedings of the 2011 IEEE Sixth International Conference on Image and Graphics, Hefei, China, 12–15 August 2011; pp. 702–706. [Google Scholar]
  87. Kpienbaareh, D.; Sun, X.; Wang, J.; Luginaah, I.; Bezner Kerr, R.; Lupafya, E.; Dakishoni, L. Crop Type and Land Cover Mapping in Northern Malawi Using the Integration of Sentinel-1, Sentinel-2, and PlanetScope Satellite Data. Remote Sens. 2021, 13, 700. [Google Scholar] [CrossRef]
  88. Farhadpour, S.; Warner, T.A.; Maxwell, A.E. Selecting and Interpreting Multiclass Loss and Accuracy Assessment Metrics for Classifications with Class Imbalance: Guidance and Best Practices. Remote Sens. 2024, 16, 533. [Google Scholar] [CrossRef]
  89. Grande, T.O. De Desmatamentos No Cerrado Na Última Década: Perda de Hábitat, de Conectividade e Estagnação Socioeconômica. Ph.D. Thesis, University of Brasilia, Brasilia, Brazil, 2019. [Google Scholar]
  90. Rekow, L. Socio-Ecological Implications of Soy in the Brazilian Cerrado. Chall. Sustain. 2019, 7, 7–29. [Google Scholar] [CrossRef]
  91. Sattolo, T.M.S. Soil Carbon and Nitrogen Dynamics as Affected by Crop Diversification and Nitrogen Fertilization Under Grain Production Systems in the Cerrado Region. Ph.D. Thesis, Universidade de São Paulo, São Paulo, Brazil, 2020. [Google Scholar]
  92. Gamon, J.A.; Field, C.B.; Goulden, M.L.; Griffin, K.L.; Hartley, A.E.; Joel, G.; Penuelas, J.; Valentini, R. Relationships Between NDVI, Canopy Structure, and Photosynthesis in Three Californian Vegetation Types. Ecol. Appl. 1995, 5, 28–41. [Google Scholar] [CrossRef]
  93. White, M.A.; De BEURS, K.M.; Didan, K.; Inouye, D.W.; Richardson, A.D.; Jensen, O.P.; O’keefe, J.; Zhang, G.; Nemani, R.R.; Van LEEUWEN, W.J.D.; et al. Intercomparison, Interpretation, and Assessment of Spring Phenology in North America Estimated from Remote Sensing for 1982–2006. Glob. Change Biol. 2009, 15, 2335–2359. [Google Scholar] [CrossRef]
  94. Sims, D.A.; Gamon, J.A. Relationships between Leaf Pigment Content and Spectral Reflectance across a Wide Range of Species, Leaf Structures and Developmental Stages. Remote Sens. Environ. 2002, 81, 337–354. [Google Scholar] [CrossRef]
  95. Nasirzadehdizaji, R.; Balik Sanli, F.; Abdikan, S.; Cakir, Z.; Sekertekin, A.; Ustuner, M. Sensitivity Analysis of Multi-Temporal Sentinel-1 SAR Parameters to Crop Height and Canopy Coverage. Appl. Sci. 2019, 9, 655. [Google Scholar] [CrossRef]
  96. Prakash, A.J.; Mudi, S.; Paramanik, S.; Behera, M.D.; Shekhar, S.; Sharma, N.; Parida, B.R. Dominant Expression of SAR Backscatter in Predicting Aboveground Biomass: Integrating Multi-Sensor Data and Machine Learning in Sikkim Himalaya. J. Indian Soc. Remote Sens. 2024, 52, 871–883. [Google Scholar] [CrossRef]
  97. Irfan, A.; Li, Y.; E, X.; Sun, G. Land Use and Land Cover Classification with Deep Learning-Based Fusion of SAR and Optical Data. Remote Sens. 2025, 17, 1298. [Google Scholar] [CrossRef]
  98. Sur, K.; Verma, V.K.; Panwar, P.; Shukla, G.; Chakravarty, S.; Nath, A.J. Monitoring Vegetation Degradation Using Remote Sensing and Machine Learning over India—A Multi-Sensor, Multi-Temporal and Multi-Scale Approach. Front. For. Glob. Change 2024, 7, 1382557. [Google Scholar] [CrossRef]
  99. Chi, Z.; Xu, K. Multi-Sensor Fusion and Machine Learning for Forest Age Mapping in Southeastern Tibet. Remote Sens. 2025, 17, 1926. [Google Scholar] [CrossRef]
  100. Sansevero, J.B.; Garbin, M.L.; Sánchez-Tapia, A.; Valladares, F.; Scarano, F.R. Fire Drives Abandoned Pastures to a Savanna-like State in the Brazilian Atlantic Forest. Perspect. Ecol. Conserv. 2020, 18, 31–36. [Google Scholar] [CrossRef]
  101. Silva, A.G.P.; Galvão, L.S.; Ferreira Júnior, L.G.; Teles, N.M.; Mesquita, V.V.; Haddad, I. Discrimination of Degraded Pastures in the Brazilian Cerrado Using the PlanetScope SuperDove Satellite Constellation. Remote Sens. 2024, 16, 2256. [Google Scholar] [CrossRef]
  102. Nóbrega, R.L.; Guzha, A.C.; Torres, G.N.; Kovacs, K.; Lamparter, G.; Amorim, R.S.; Couto, E.; Gerold, G. Effects of Conversion of Native Cerrado Vegetation to Pasture on Soil Hydro-Physical Properties, Evapotranspiration and Streamflow on the Amazonian Agricultural Frontier. PLoS ONE 2017, 12, e0179414. [Google Scholar] [CrossRef]
  103. van Leeuwen, W.J. Visible, near-IR, and Shortwave IR Spectral Characteristics of Terrestrial Surfaces. In The SAGE Handbook of Remote Sensing; Sage: Thousand Oaks, CA, USA, 2009; pp. 33–50. [Google Scholar]
  104. Feng, H.; Chen, C.; Dong, H.; Wang, J.; Meng, Q. Modified Shortwave Infrared Perpendicular Water Stress Index: A Farmland Water Stress Monitoring Method. J. Appl. Meteorol. Climatol. 2013, 52, 2024–2032. [Google Scholar] [CrossRef]
  105. Chen, S.; Zhao, K.; Jiang, T.; Li, X.; Zheng, X.; Wan, X.; Zhao, X. Predicting Surface Roughness and Moisture of Bare Soils Using Multiband Spectral Reflectance Under Field Conditions. Chin. Geogr. Sci. 2018, 28, 986–997. [Google Scholar] [CrossRef]
  106. Small, C. High Spatial Resolution Spectral Mixture Analysis of Urban Reflectance. Remote Sens. Environ. 2003, 88, 170–186. [Google Scholar] [CrossRef]
  107. Radhi, H.; Assem, E.; Sharples, S. On the Colours and Properties of Building Surface Materials to Mitigate Urban Heat Islands in Highly Productive Solar Regions. Build. Environ. 2014, 72, 162–172. [Google Scholar] [CrossRef]
  108. Alavipanah, S.K.; Karimi Firozjaei, M.; Sedighi, A.; Fathololoumi, S.; Zare Naghadehi, S.; Saleh, S.; Naghdizadegan, M.; Gomeh, Z.; Arsanjani, J.J.; Makki, M. The Shadow Effect on Surface Biophysical Variables Derived from Remote Sensing: A Review. Land 2022, 11, 2025. [Google Scholar] [CrossRef]
  109. Xu, Y.; Xie, Z.; Feng, Y.; Chen, Z. Road Extraction from High-Resolution Remote Sensing Imagery Using Deep Learning. Remote Sens. 2018, 10, 1461. [Google Scholar] [CrossRef]
  110. Shao, Z.; Fu, H.; Fu, P.; Yin, L. Mapping Urban Impervious Surface by Fusing Optical and SAR Data at the Decision Level. Remote Sens. 2016, 8, 945. [Google Scholar] [CrossRef]
  111. Chen, B.; Huang, B.; Xu, B. Multi-Source Remotely Sensed Data Fusion for Improving Land Cover Classification. ISPRS J. Photogramm. Remote Sens. 2017, 124, 27–39. [Google Scholar] [CrossRef]
  112. Mohammadpour, P.; Viegas, C. Applications of Multi-Source and Multi-Sensor Data Fusion of Remote Sensing for Forest Species Mapping. In Advances in Remote Sensing for Forest Monitoring; Pandey, P.C., Arellano, P., Eds.; Wiley: Hoboken, NJ, USA, 2022; pp. 255–287. ISBN 978-1-119-78812-6. [Google Scholar]
  113. Wang, J.; Yang, M.; Chen, Z.; Lu, J.; Zhang, L. An MLC and U-Net Integrated Method for Land Use/Land Cover Change Detection Based on Time Series NDVI-Composed Image from PlanetScope Satellite. Water 2022, 14, 3363. [Google Scholar] [CrossRef]
  114. Grabska, E.; Socha, J. Evaluating the Effect of Stand Properties and Site Conditions on the Forest Reflectance from Sentinel-2 Time Series. PLoS ONE 2021, 16, e0248459. [Google Scholar] [CrossRef] [PubMed]
  115. Gan, Y.; Wang, Q.; Song, G. Structural Complexity Significantly Impacts Canopy Reflectance Simulations as Revealed from Reconstructed and Sentinel-2-Monitored Scenes in a Temperate Deciduous Forest. Remote Sens. 2024, 16, 4296. [Google Scholar] [CrossRef]
  116. Imperatore, P.; Azar, R.; Calo, F.; Stroppiana, D.; Brivio, P.A.; Lanari, R.; Pepe, A. Effect of the Vegetation Fire on Backscattering: An Investigation Based on Sentinel-1 Observations. IEEE J. Sel. Top. Appl. Earth Obs. Remote Sens. 2017, 10, 4478–4492. [Google Scholar] [CrossRef]
  117. Tsokas, A.; Rysz, M.; Pardalos, P.M.; Dipple, K. SAR Data Applications in Earth Observation: An Overview. Expert Syst. Appl. 2022, 205, 117342. [Google Scholar] [CrossRef]
  118. Varella, R.F.; Bustamante, M.M.C.; Pinto, A.S.; Kisselle, K.W.; Santos, R.V.; Burke, R.A.; Zepp, R.G.; Viana, L.T. Soil fluxes of CO2, CO, NO, AND N2 O from an old pasture and from native savanna in Brazil. Ecol. Appl. 2004, 14, 221–231. [Google Scholar] [CrossRef]
  119. Atarashi-Andoh, M.; Koarashi, J.; Ishizuka, S.; Hirai, K. Seasonal Patterns and Control Factors of CO2 Effluxes from Surface Litter, Soil Organic Carbon, and Root-Derived Carbon Estimated Using Radiocarbon Signatures. Agric. For. Meteorol. 2012, 152, 149–158. [Google Scholar] [CrossRef]
  120. Ratter, J.A.; Ribeiro, J.F.; Bridgewater, S. The Brazilian Cerrado Vegetation and Threats to Its Biodiversity. Ann. Bot. 1997, 80, 223–230. [Google Scholar] [CrossRef]
  121. Carneiro, B.M.; de Carvalho Junior, O.A.; Guimarães, R.F.; Evangelista, B.A.; de Carvalho, O.L.F. Exploiting Legal Reserve Compensation as a Mechanism for Unlawful Deforestation in the Brazilian Cerrado Biome, 2012–2022. Sustainability 2024, 16, 9557. [Google Scholar] [CrossRef]
  122. Colman, C.B.; Guerra, A.; Almagro, A.; de Oliveira Roque, F.; Rosa, I.M.; Fernandes, G.W.; Oliveira, P.T.S. Modeling the Brazilian Cerrado Land Use Change Highlights the Need to Account for Private Property Sizes for Biodiversity Conservation. Sci. Rep. 2024, 14, 4559. [Google Scholar] [CrossRef] [PubMed]
  123. Overbeck, G.E.; Vélez-Martin, E.; Scarano, F.R.; Lewinsohn, T.M.; Fonseca, C.R.; Meyer, S.T.; Müller, S.C.; Ceotto, P.; Dadalt, L.; Durigan, G.; et al. Conservation in Brazil Needs to Include Non-forest Ecosystems. Divers. Distrib. 2015, 21, 1455–1460. [Google Scholar] [CrossRef]
  124. Colli, G.R.; Vieira, C.R.; Dianese, J.C. Biodiversity and Conservation of the Cerrado: Recent Advances and Old Challenges. Biodivers. Conserv. 2020, 29, 1465–1475. [Google Scholar] [CrossRef]
  125. Reis, S.M.; Marimon, B.S.; Esquivel-Muelbert, A.; Marimon, B.H., Jr.; Morandi, P.S.; Elias, F.; de Oliveira, E.A.; Galbraith, D.; Feldpausch, T.R.; Menor, I.O.; et al. Climate and Crown Damage Drive Tree Mortality in Southern Amazonian Edge Forests. J. Ecol. 2022, 110, 876–888. [Google Scholar] [CrossRef]
  126. Mitchard, E.T. The Tropical Forest Carbon Cycle and Climate Change. Nature 2018, 559, 527–534. [Google Scholar] [CrossRef]
  127. East, A.; Hansen, A.; Jantz, P.; Currey, B.; Roberts, D.W.; Armenteras, D. Validation and Error Minimization of Global Ecosystem Dynamics Investigation (GEDI) Relative Height Metrics in the Amazon. Remote Sens. 2024, 16, 3550. [Google Scholar] [CrossRef]
  128. Bragagnolo, L.; da Silva, R.V.; Grzybowski, J.M.V. Amazon Forest Cover Change Mapping Based on Semantic Segmentation by U-Nets. Ecol. Inform. 2021, 62, 101279. [Google Scholar] [CrossRef]
  129. Cherif, E.; Hell, M.; Brandmeier, M. DeepForest: Novel Deep Learning Models for Land Use and Land Cover Classification Using Multi-Temporal and-Modal Sentinel Data of the Amazon Basin. Remote Sens. 2022, 14, 5000. [Google Scholar] [CrossRef]
  130. Magalhães, I.A.L.; de Carvalho Júnior, O.A.; de Carvalho, O.L.F.; de Albuquerque, A.O.; Hermuche, P.M.; Merino, É.R.; Gomes, R.A.T.; Guimarães, R.F. Comparing Machine and Deep Learning Methods for the Phenology-Based Classification of Land Cover Types in the Amazon Biome Using Sentinel-1 Time Series. Remote Sens. 2022, 14, 4858. [Google Scholar] [CrossRef]
  131. Wei, S.; Zhang, H.; Wang, C.; Wang, Y.; Xu, L. Multi-Temporal SAR Data Large-Scale Crop Mapping Based on U-Net Model. Remote Sens. 2019, 11, 68. [Google Scholar] [CrossRef]
  132. Ronneberger, O.; Fischer, P.; Brox, T. U-Net: Convolutional Networks for Biomedical Image Segmentation. In Medical Image Computing and Computer-Assisted Intervention—MICCAI 2015; Navab, N., Hornegger, J., Wells, W.M., Frangi, A.F., Eds.; Lecture Notes in Computer Science; Springer International Publishing: Cham, Switzerland, 2015; Volume 9351, pp. 234–241. ISBN 978-3-319-24573-7. [Google Scholar]
  133. Yuan, Q.; Shen, H.; Li, T.; Li, Z.; Li, S.; Jiang, Y.; Xu, H.; Tan, W.; Yang, Q.; Wang, J. Deep Learning in Environmental Remote Sensing: Achievements and Challenges. Remote Sens. Environ. 2020, 241, 111716. [Google Scholar] [CrossRef]
  134. Masolele, R.N.; De Sy, V.; Herold, M.; Marcos, D.; Verbesselt, J.; Gieseke, F.; Mullissa, A.G.; Martius, C. Spatial and Temporal Deep Learning Methods for Deriving Land-Use Following Deforestation: A Pan-Tropical Case Study Using Landsat Time Series. Remote Sens. Environ. 2021, 264, 112600. [Google Scholar] [CrossRef]
  135. Rousset, G.; Despinoy, M.; Schindler, K.; Mangeas, M. Assessment of Deep Learning Techniques for Land Use Land Cover Classification in Southern New Caledonia. Remote Sens. 2021, 13, 2257. [Google Scholar] [CrossRef]
  136. Darbari, P.; Kumar, M.; Agarwal, A. SIT. Net: SAR Deforestation Classification of Amazon Forest for Land Use Land Cover Application. J. Comput. Commun. 2024, 12, 68–83. [Google Scholar] [CrossRef]
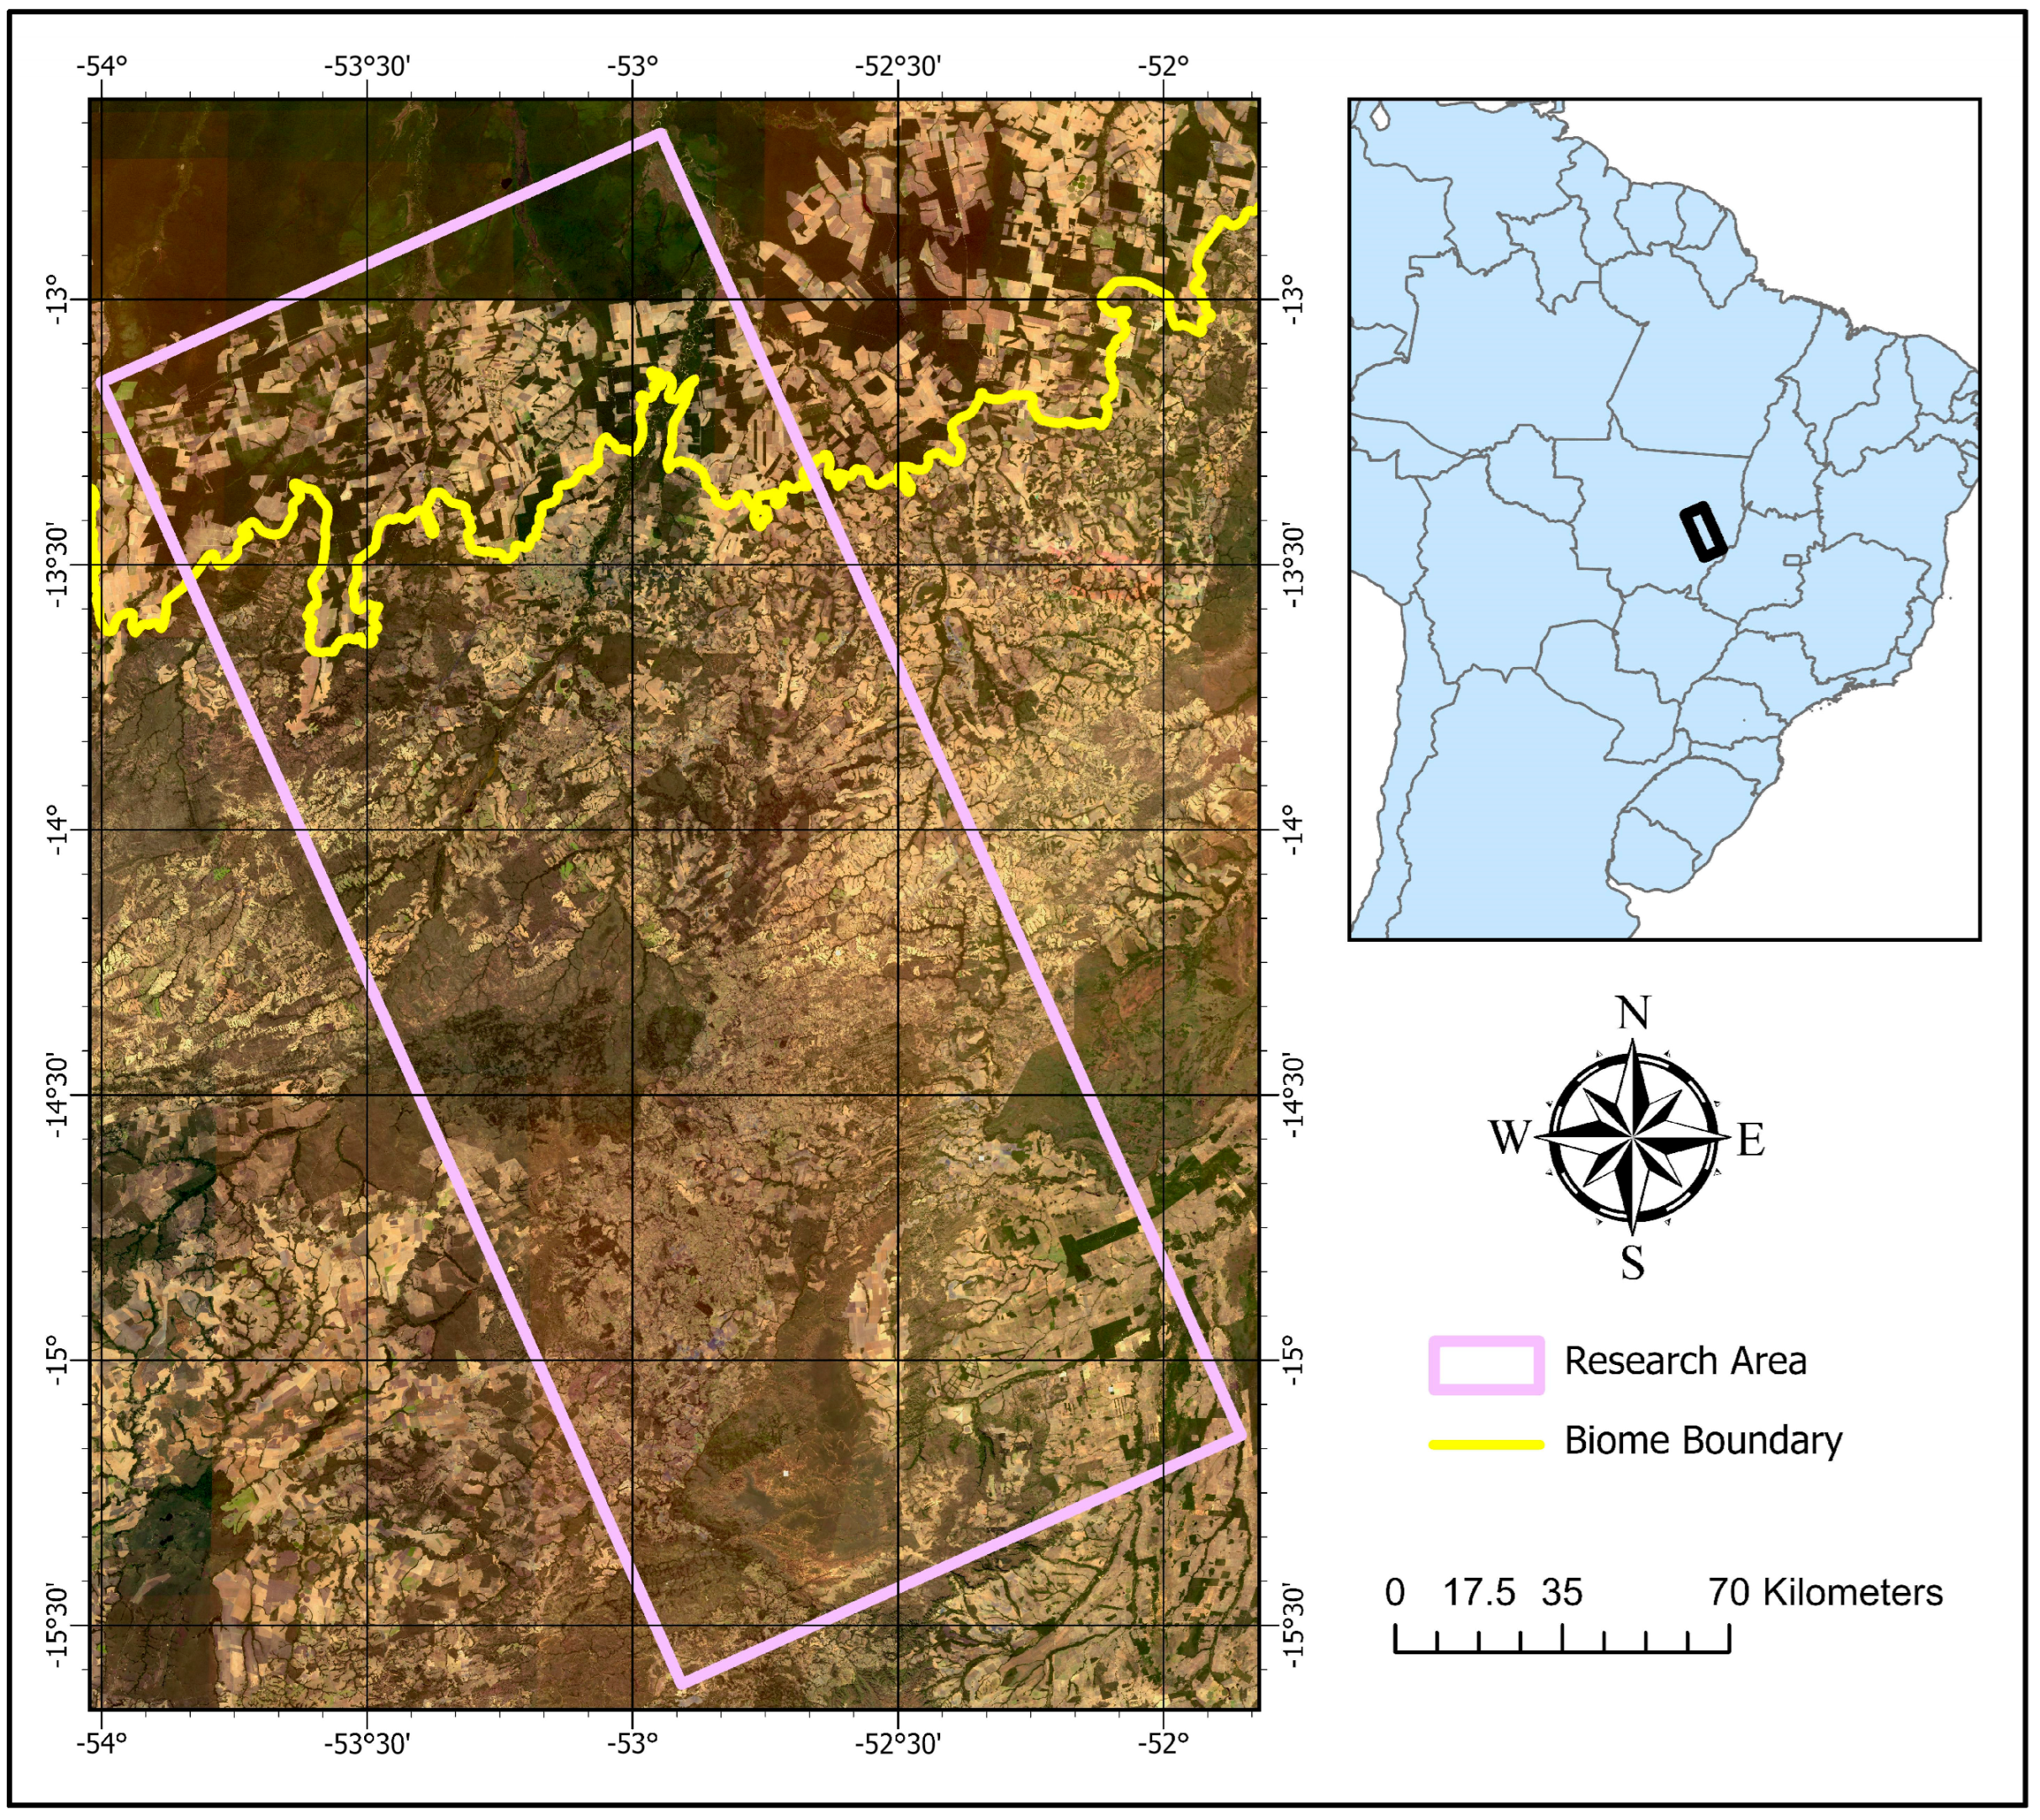
Figure 1. Location of the study area. The pink polygon shows the precise location of the research area selected for detailed analysis. The yellow line is the official and traditional [66] boundary between the Amazon and Cerrado biomes, with the Amazon to the north and the Cerrado to the south. The black frame in the inset map indicates the location of the study region within Brazil. The background image is a composite of PlanetScope NICFI basemap acquired between 1 June and 30 November 2023.
Remotesensing 17 02138 g001
Figure 2. Overview of vegetation types within the study area. Descriptive information adapted from [10,25,29,67,70,71,72].
Remotesensing 17 02138 g002
Figure 3. Flowchart of the research methodology.
Remotesensing 17 02138 g003
Figure 4. Location of vegetation survey plots and training and validation areas. (a) Location of vegetation survey plots; (b) Location of training and validation samples. The background imagery comes from the World Imagery of Esri ArcGIS Pro (v3.2.0) software. Source: Esri, DigitalGlobe, GeoEye, i-cubed, USDA FSA, USGS, AEX, Getmapping, Aerogrid, IGN, IGP, swisstopo, and the GIS User Community.
Remotesensing 17 02138 g004
Figure 5. U-Net encoder/decoder architecture diagram.
Remotesensing 17 02138 g005
Figure 6. Comparison of U-net prediction results for different data combinations. The size of each sample area is 1000 × 1000 m. The (ad) in the upper right corner of the image shows the location of the corresponding sample.
Remotesensing 17 02138 g006
Figure 7. The results of land cover classification of the CAT using Optical Fusion + Sentinel-1 dataset.
Remotesensing 17 02138 g007
Table 1. Total number of pixels per land cover class.
CategoryTraining DatasetValidation Dataset
Amazon forest3,735,6811,265,871
Cerradão3,418,998516,018
Savanna2,831,667957,963
Agriculture6,575,8801,490,778
Water274,89672,138
Other857,598120,912
Table 2. Name and description of land-use and cover classes.
Class NameDescription
Amazon ForestIncludes evergreen forests, semi-deciduous seasonal forests, gallery forests, and riparian forests.
CerradãoRepresents a transitional ecological woodland between the Amazon dry forest and the Brazilian savanna, characterized by dense vegetation.
SavannaEncompasses typical Cerrado, sparse Cerrado, and rocky Cerrado, with typical Cerrado being the predominant type in the study area.
AgricultureCovers all farmland and pastures.
WaterIncludes rivers, streams, and lakes.
OtherIncludes isolated buildings, urban areas, and other human-made surfaces such as paved roads.
Table 3. All datasets compared in the study.
Date TypeNumber of Bands
Optical Fusion + Sentinel-112
Optical + SARSentinel-2 + Sentinel-112
PlanetScope + Sentinel-16
OpticalOptical Fusion10
Sentinel-210
PlanetScope4
SARSentinel-12
Table 4. Spectral correspondence between Sentinel-2 and PlanetScope bands. S is the synthetic band used to match Sentinel-2 bands 5, 6, and 7.
Sentinel-2PlanetScope
NameDescriptionResolutionNameDescriptionResolution
Band 2Blue10 mBand 1Blue4.77 m
Band 3GreenBand 2Green
Band 4RedBand 3Red
Band 8NIRBand 4NIR
Band 8ARed Edge 420 mBand 4NIR
Band 5Red Edge 1 S = B 3 + B 4 2
Band 6Red Edge 2
Band 7Red Edge 3
Table 5. Overall accuracy results of land cover type classification for different datasets, including overall accuracy and Weighted Average F1 score.
Date TypeOverall AccuracyF1 Score
Optical and SAROptical Fusion + Sentinel-185%0.85
Sentinel-2 + Sentinel-183%0.82
PlanetScope + Sentinel-176%0.75
OpticalOptical Fusion76%0.74
Sentinel-273%0.69
PlanetScope80%0.80
SARSentinel-162%0.49
Table 6. Classification performance of different datasets in each land cover category, including precision (P), recall (R), and F1 score (F1).
Optical + SAROpticalSAR
Optical
Fusion
+ Sentinel-1
Sentinel-2
+ Sentinel-1
PlanetScope
+ Sentinel-1
Optical
Fusion
Sentinel-2PlanetScopeSentinel-1
PRF1 PRF1 PRF1 PRF1 PRF1 PRF1 PRF1
Amazon forest0.890.930.910.860.900.880.770.670.710.780.940.860.720.950.820.800.930.860.760.690.72
Cerradão0.800.720.760.660.640.650.380.320.340.800.240.370.530.090.150.600.460.520.340.580.43
Savanna0.920.660.760.890.710.790.730.840.780.760.580.650.860.510.640.930.620.740.880.450.60
Agriculture0.810.960.880.840.930.880.890.980.930.770.900.830.760.920.830.860.940.900.590.880.71
Water0.940.890.920.760.780.770.610.860.720.720.920.810.510.980.670.690.910.810.940.620.75
Other0.770.670.710.610.450.520.600.260.360.400.580.470.340.450.410.460.660.540.400.470.44
Table 7. Area and proportion of different land cover in the study area.
CategoryArea (km2)Proportion of Study Area (%)
Amazon forest7741.220.1
Cerradão3232.18.4
Savanna8317.321.6
Agriculture18,667.448.6
Water75.10.2
Other391.51.0
Disclaimer/Publisher’s Note: The statements, opinions and data contained in all publications are solely those of the individual author(s) and contributor(s) and not of MDPI and/or the editor(s). MDPI and/or the editor(s) disclaim responsibility for any injury to people or property resulting from any ideas, methods, instructions or products referred to in the content.