


Spatial Reconstruction and Economic Vitality Assessment of Historical Towns Using SDGSAT-1 Nighttime Light Imagery and Historical GIS: A Case Study of Suburban Shanghai

Abstract

1. Introduction
2. Study Area and Data
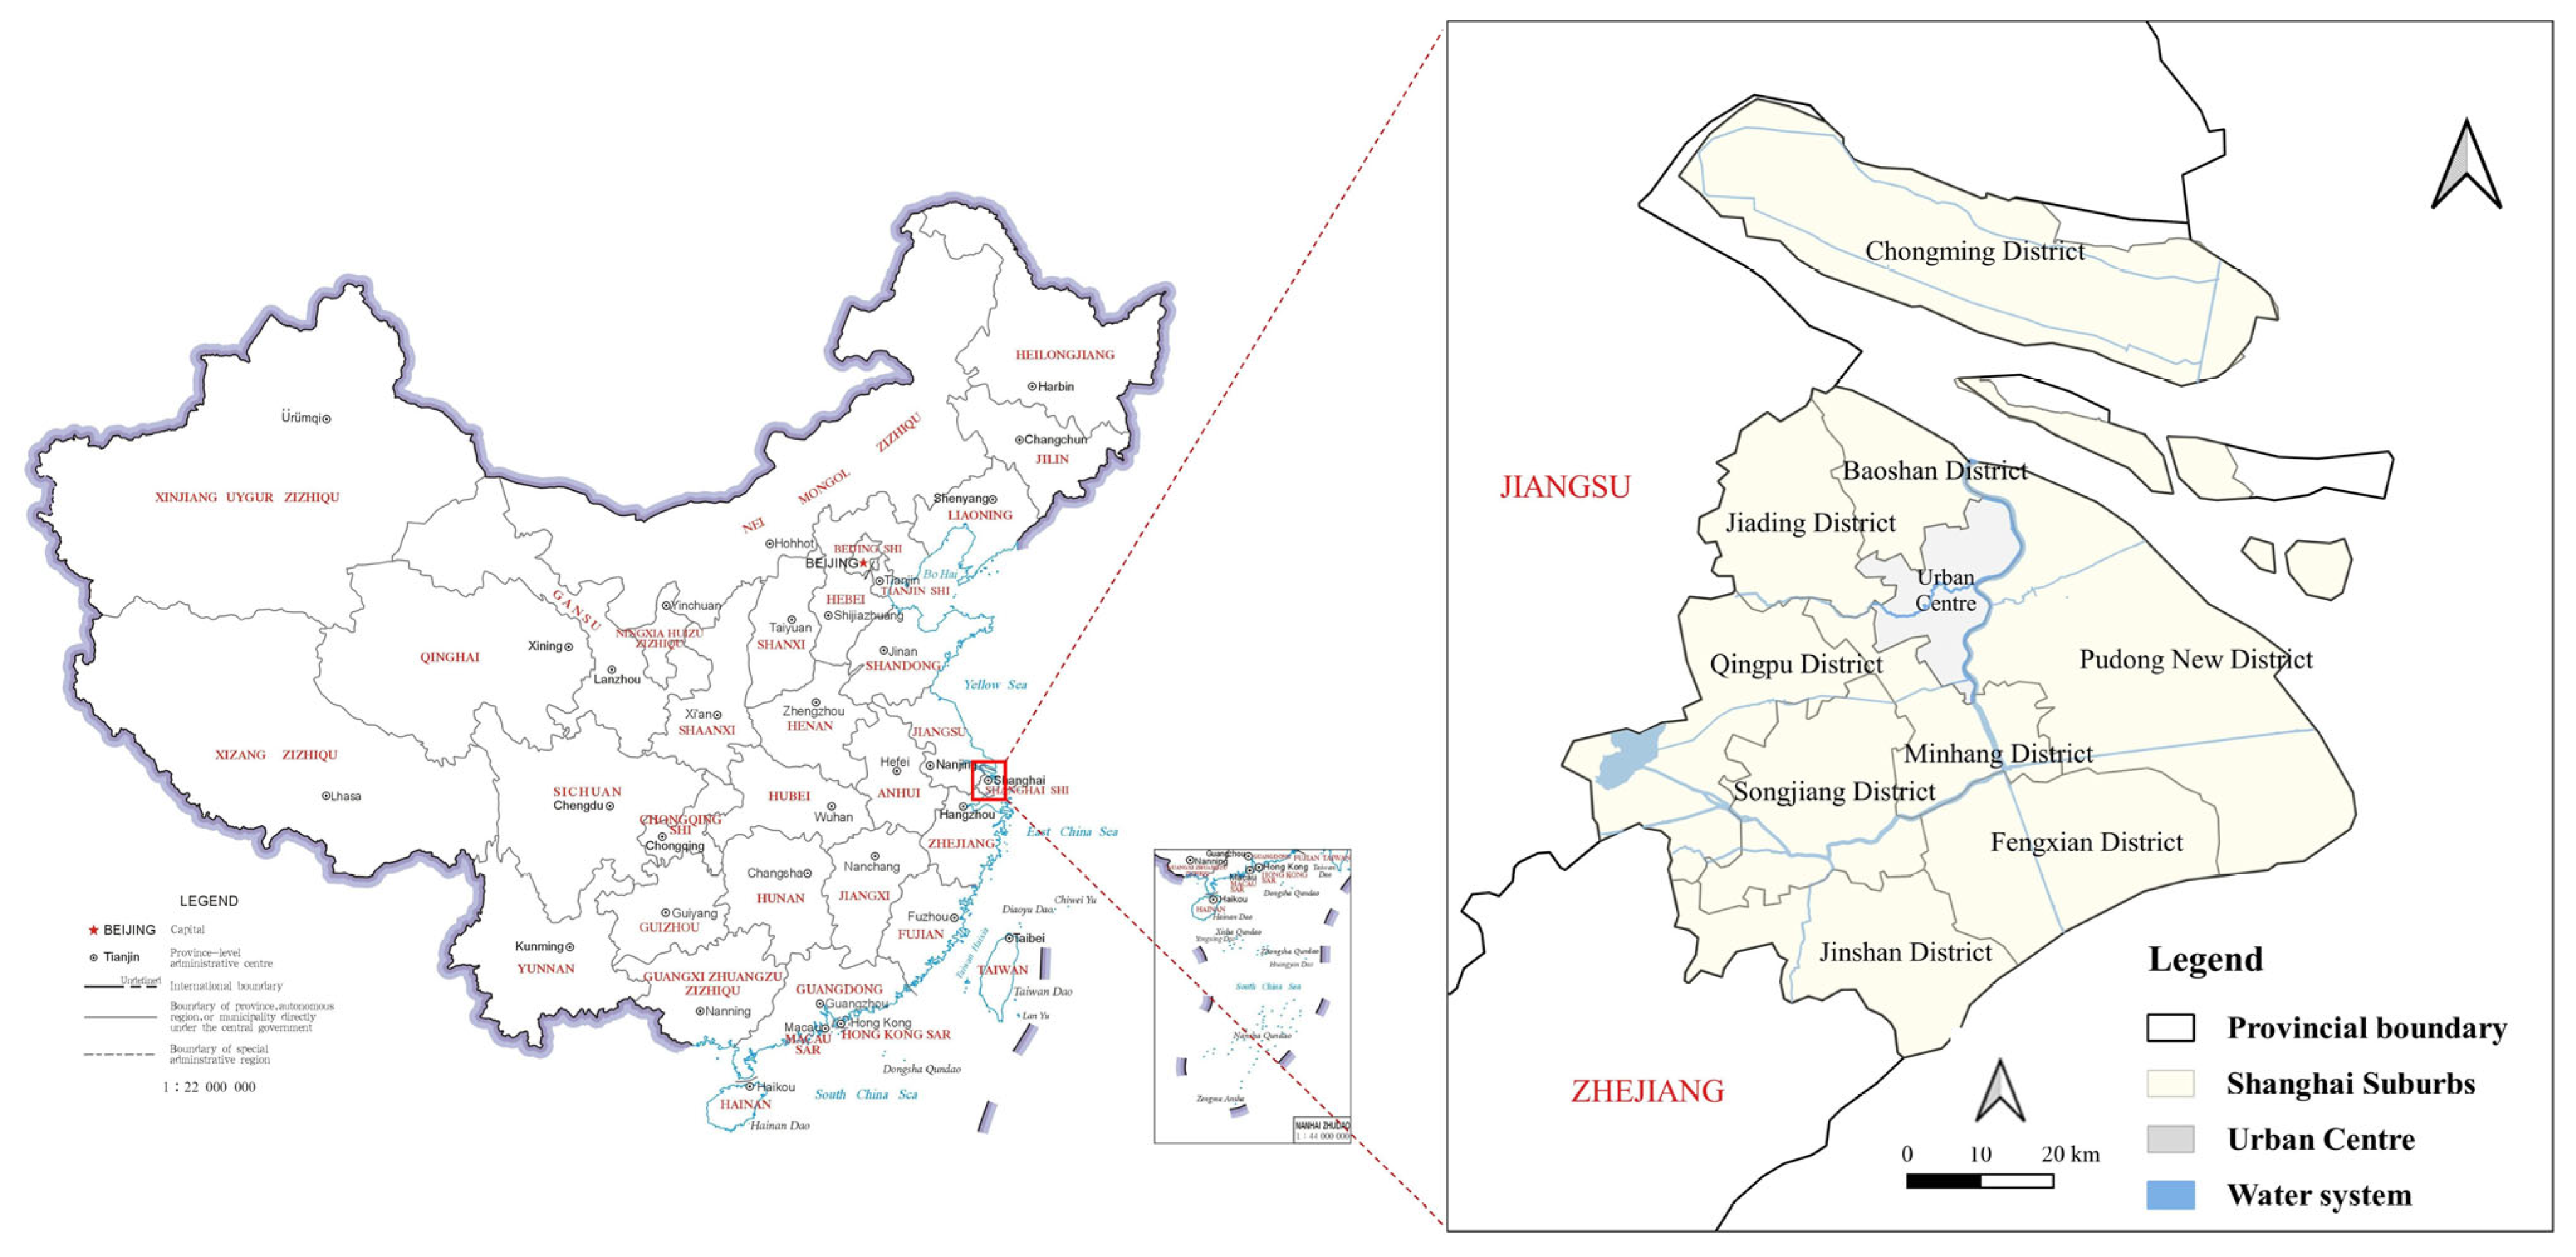
2.1. Study Area
2.2. Data
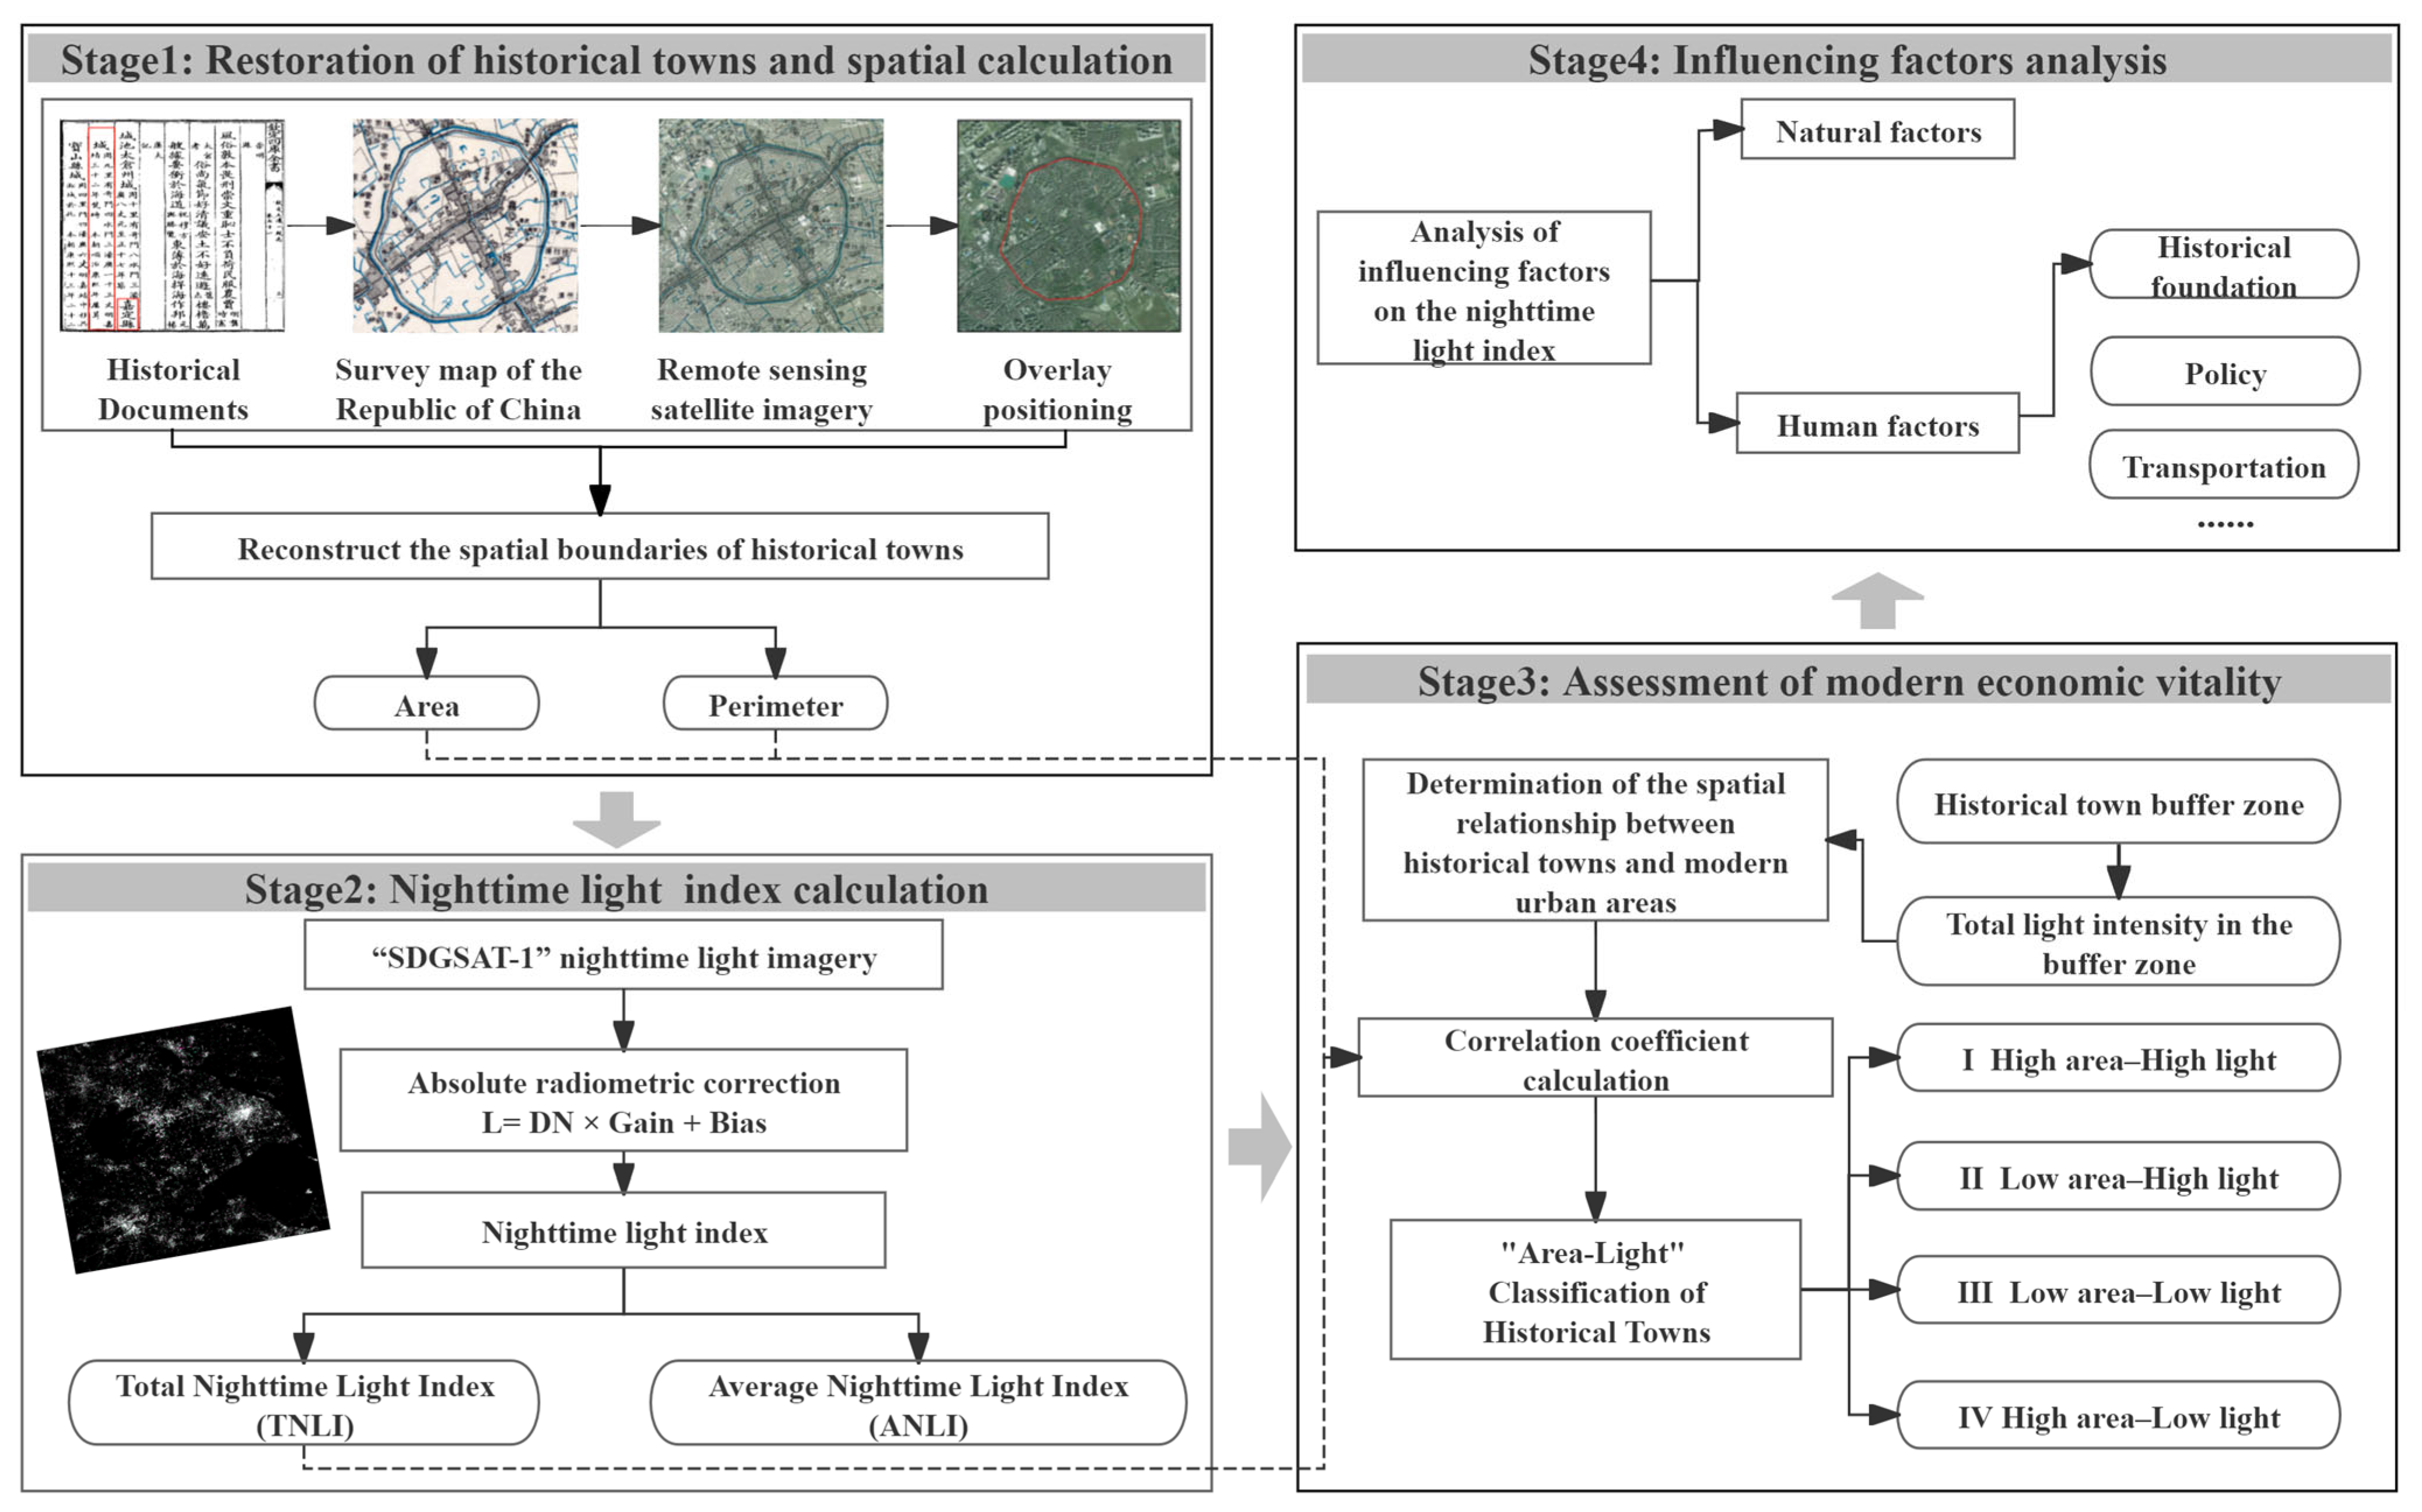
3. Methods
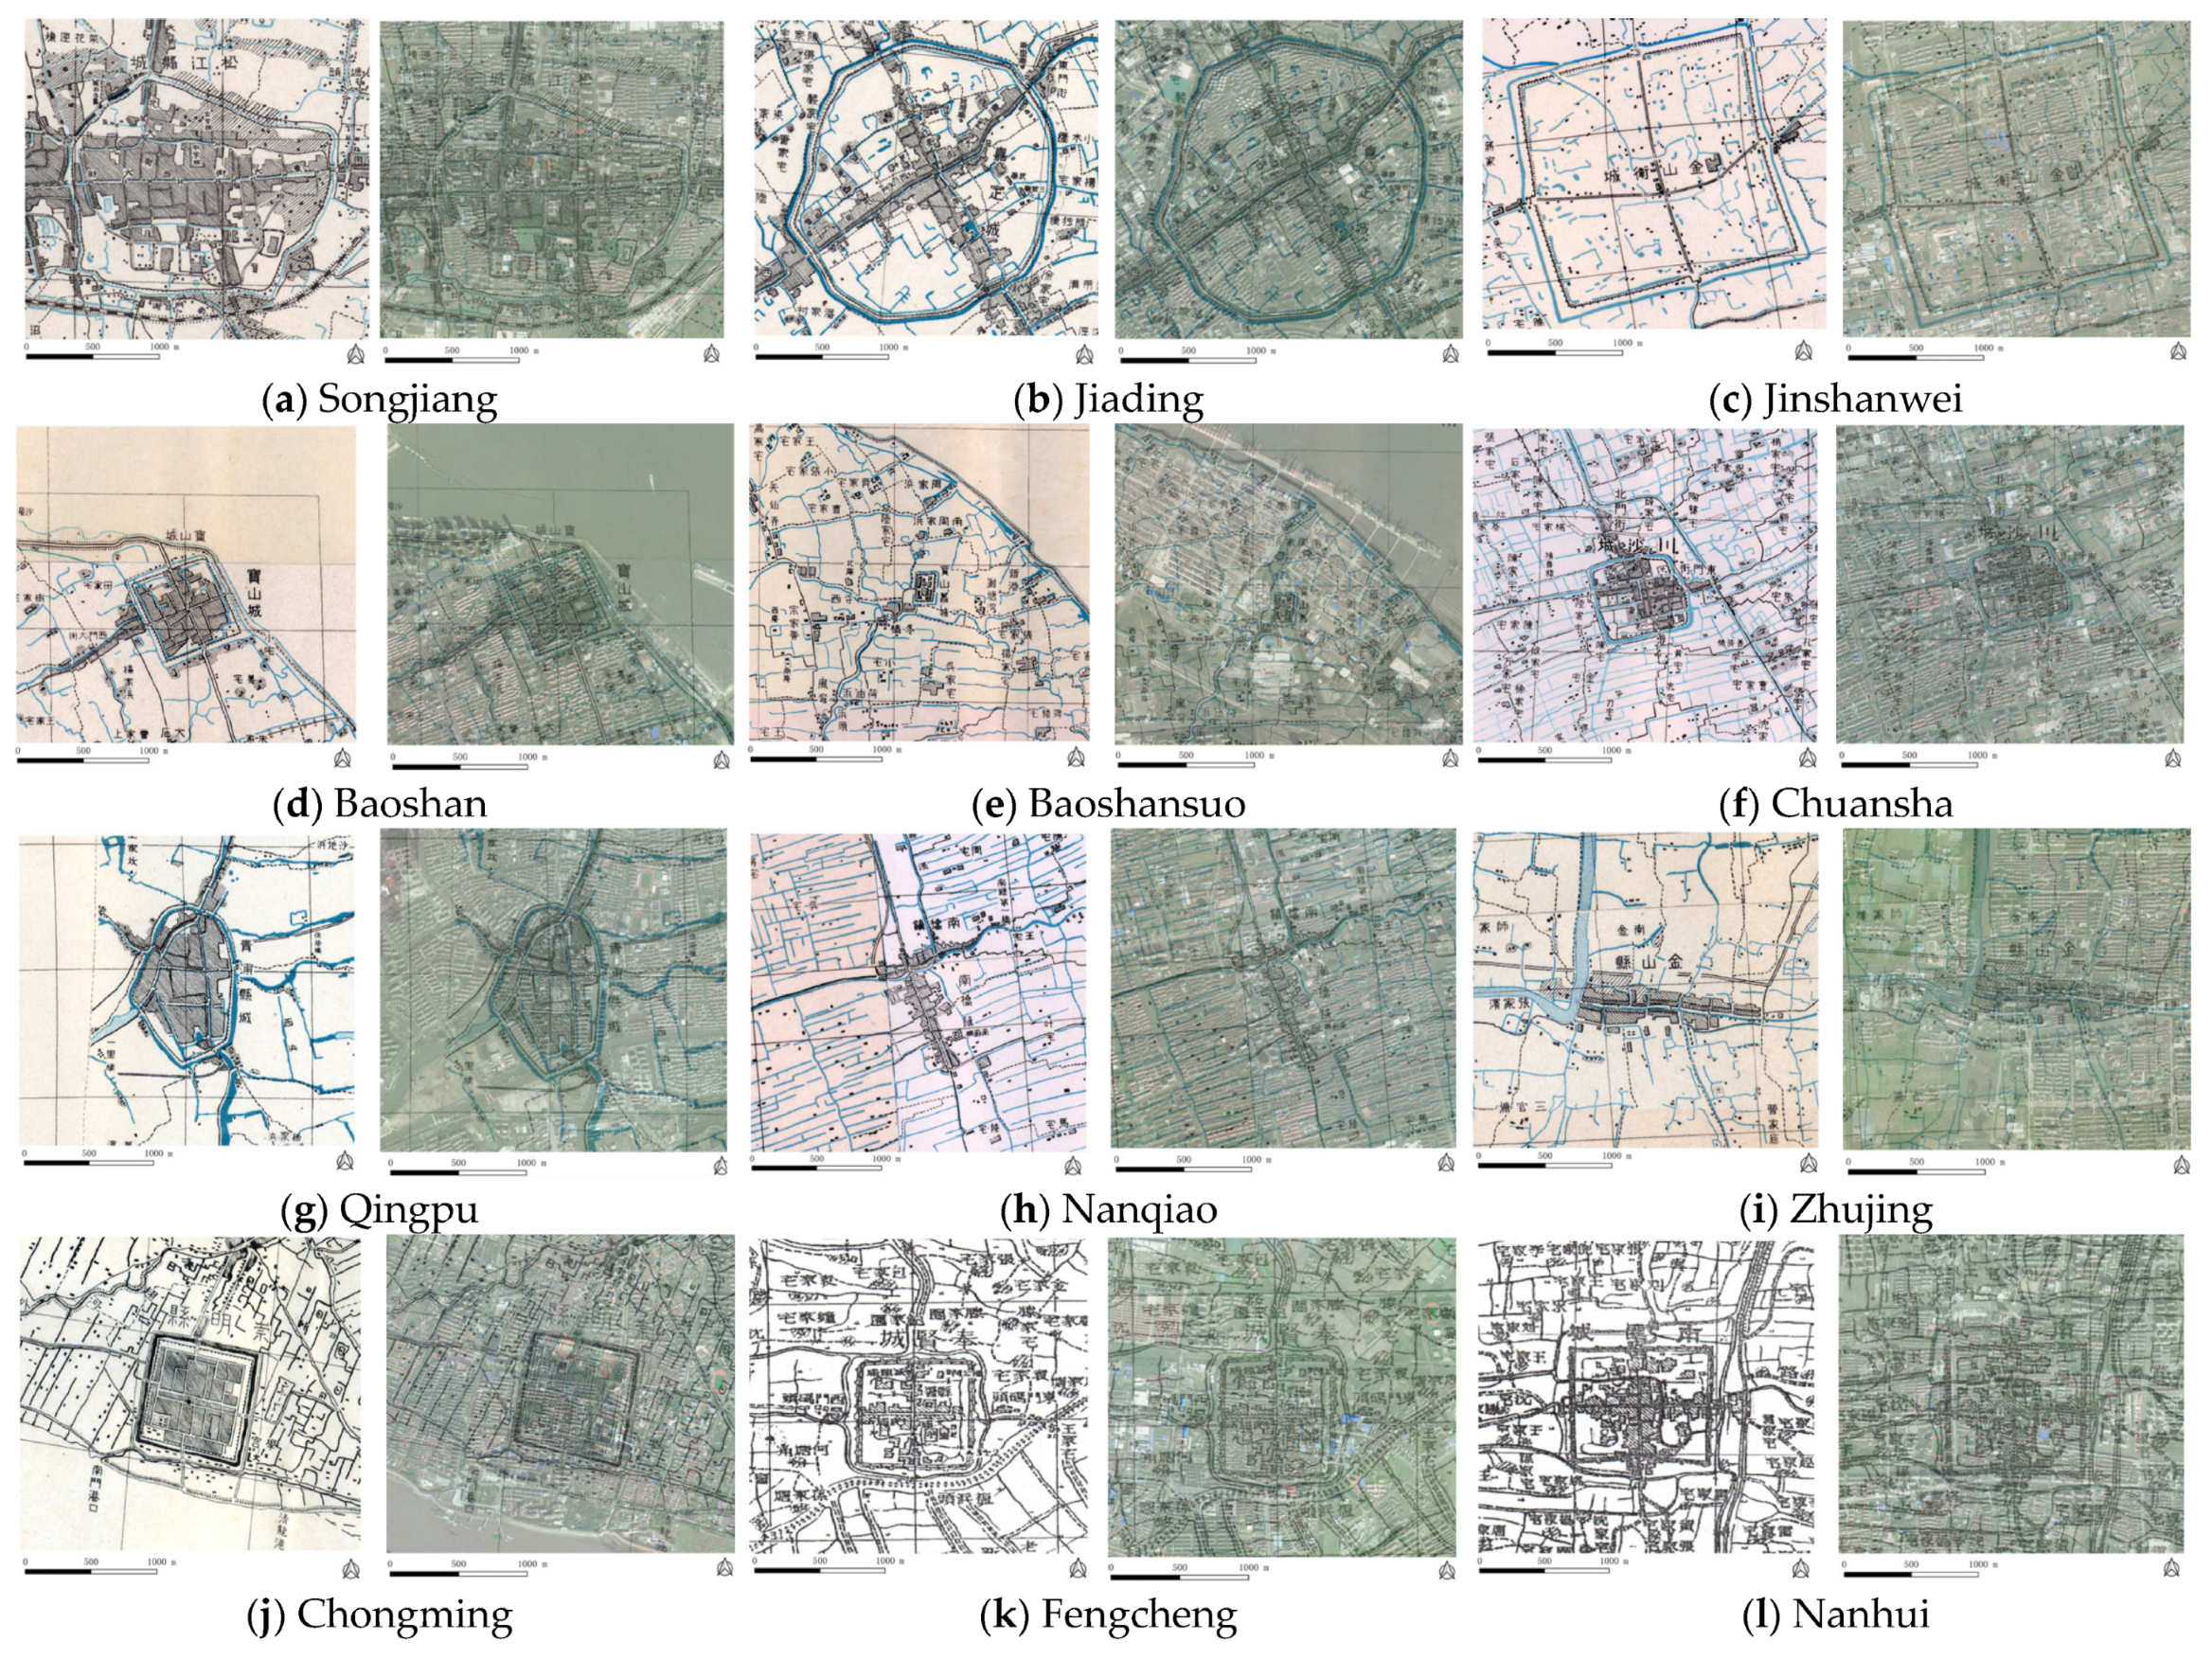
3.1. Restoration of Historical Towns and Spatial Calculation
3.2. Nighttime Light Index
3.3. Identification and Classification of Economic Vitality Based on Nighttime Light Index
4. Results and Analysis
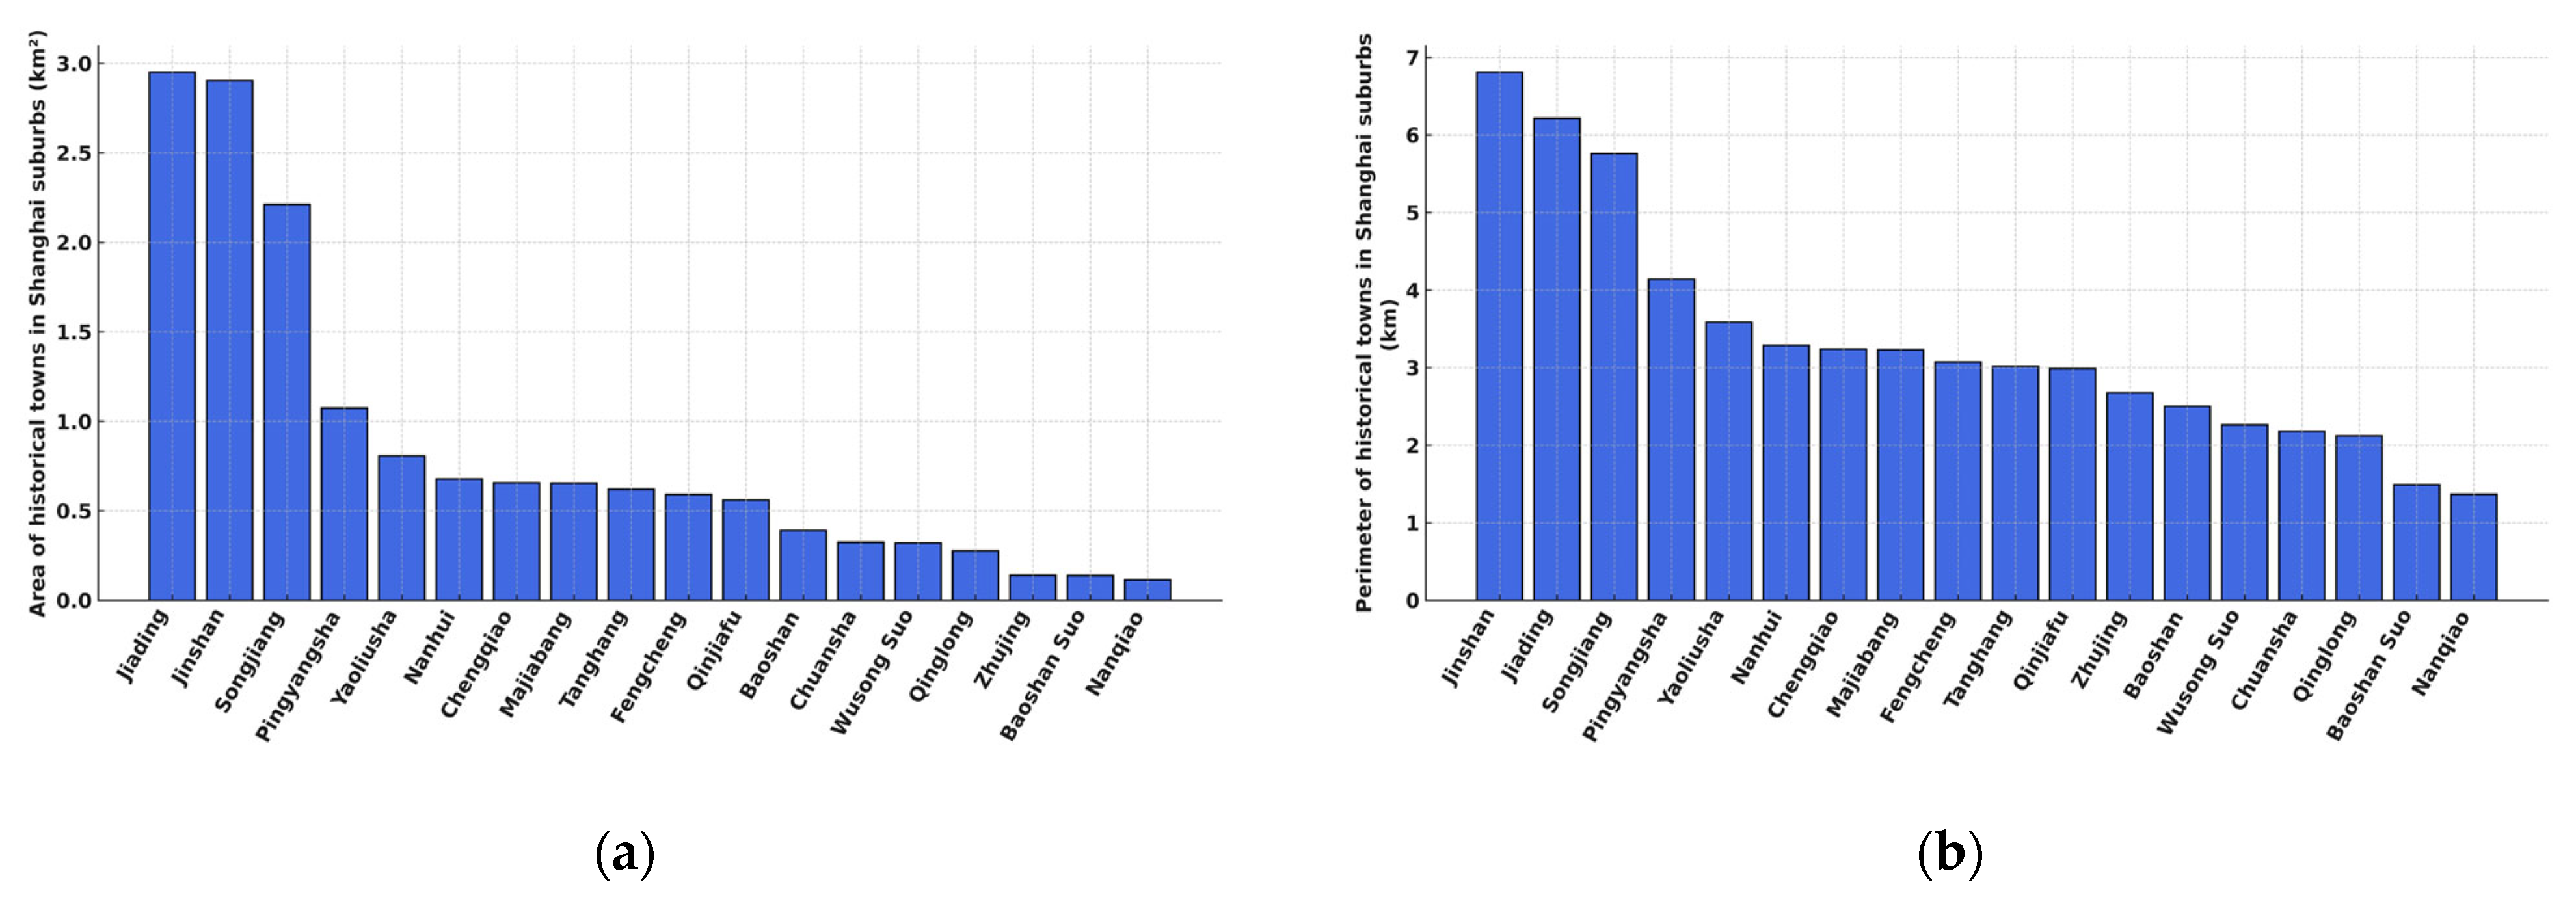
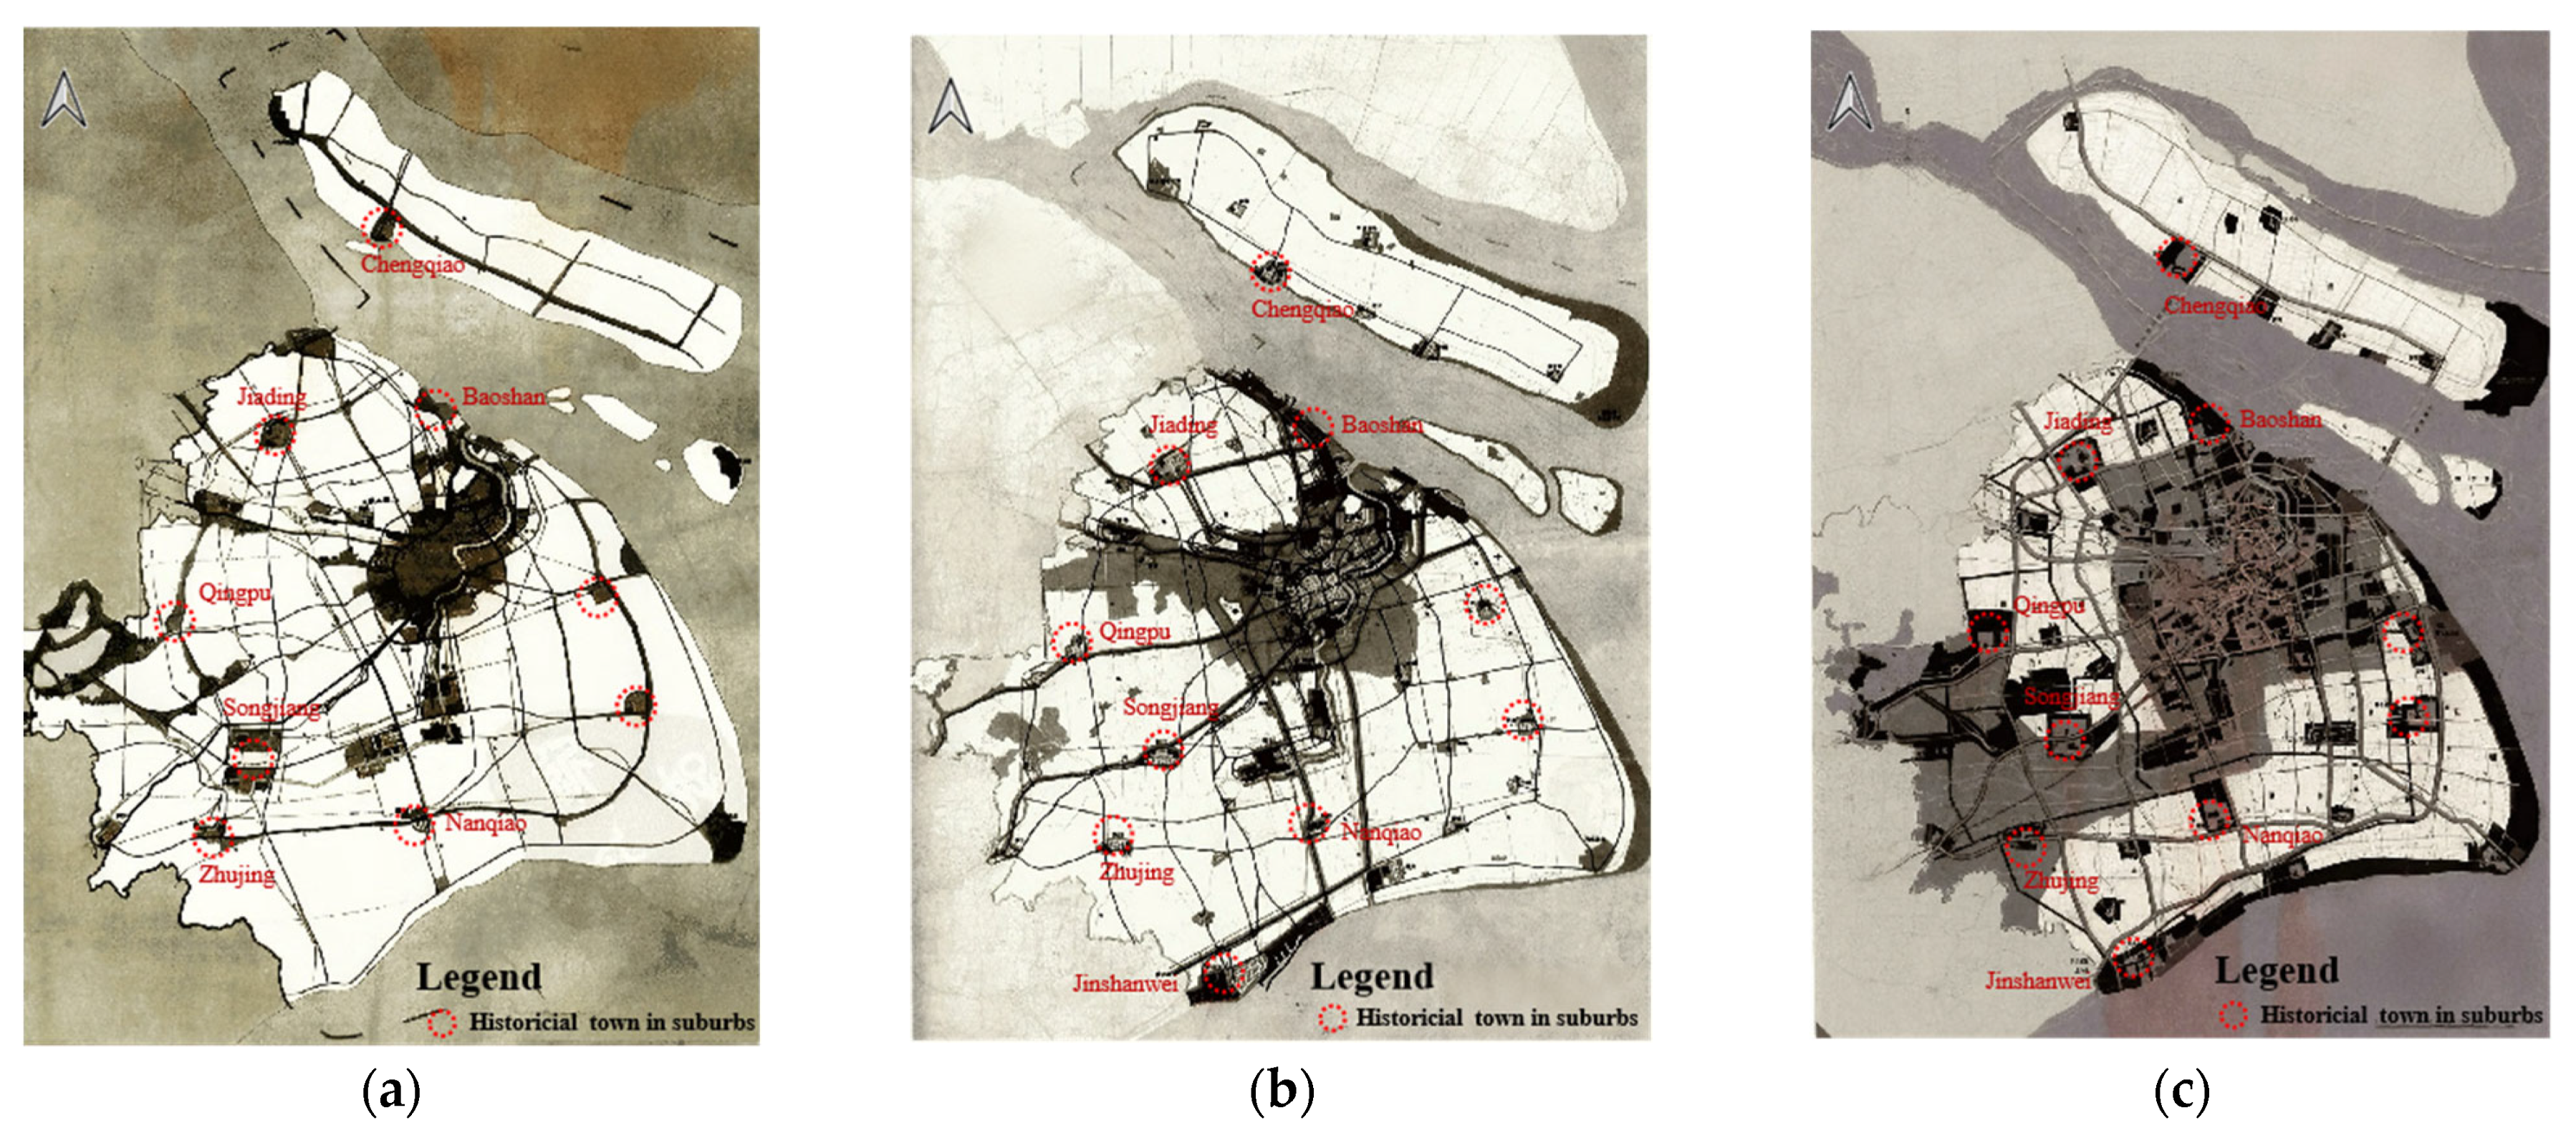
4.1. Analysis of Town Distribution and Scale in Historical Periods
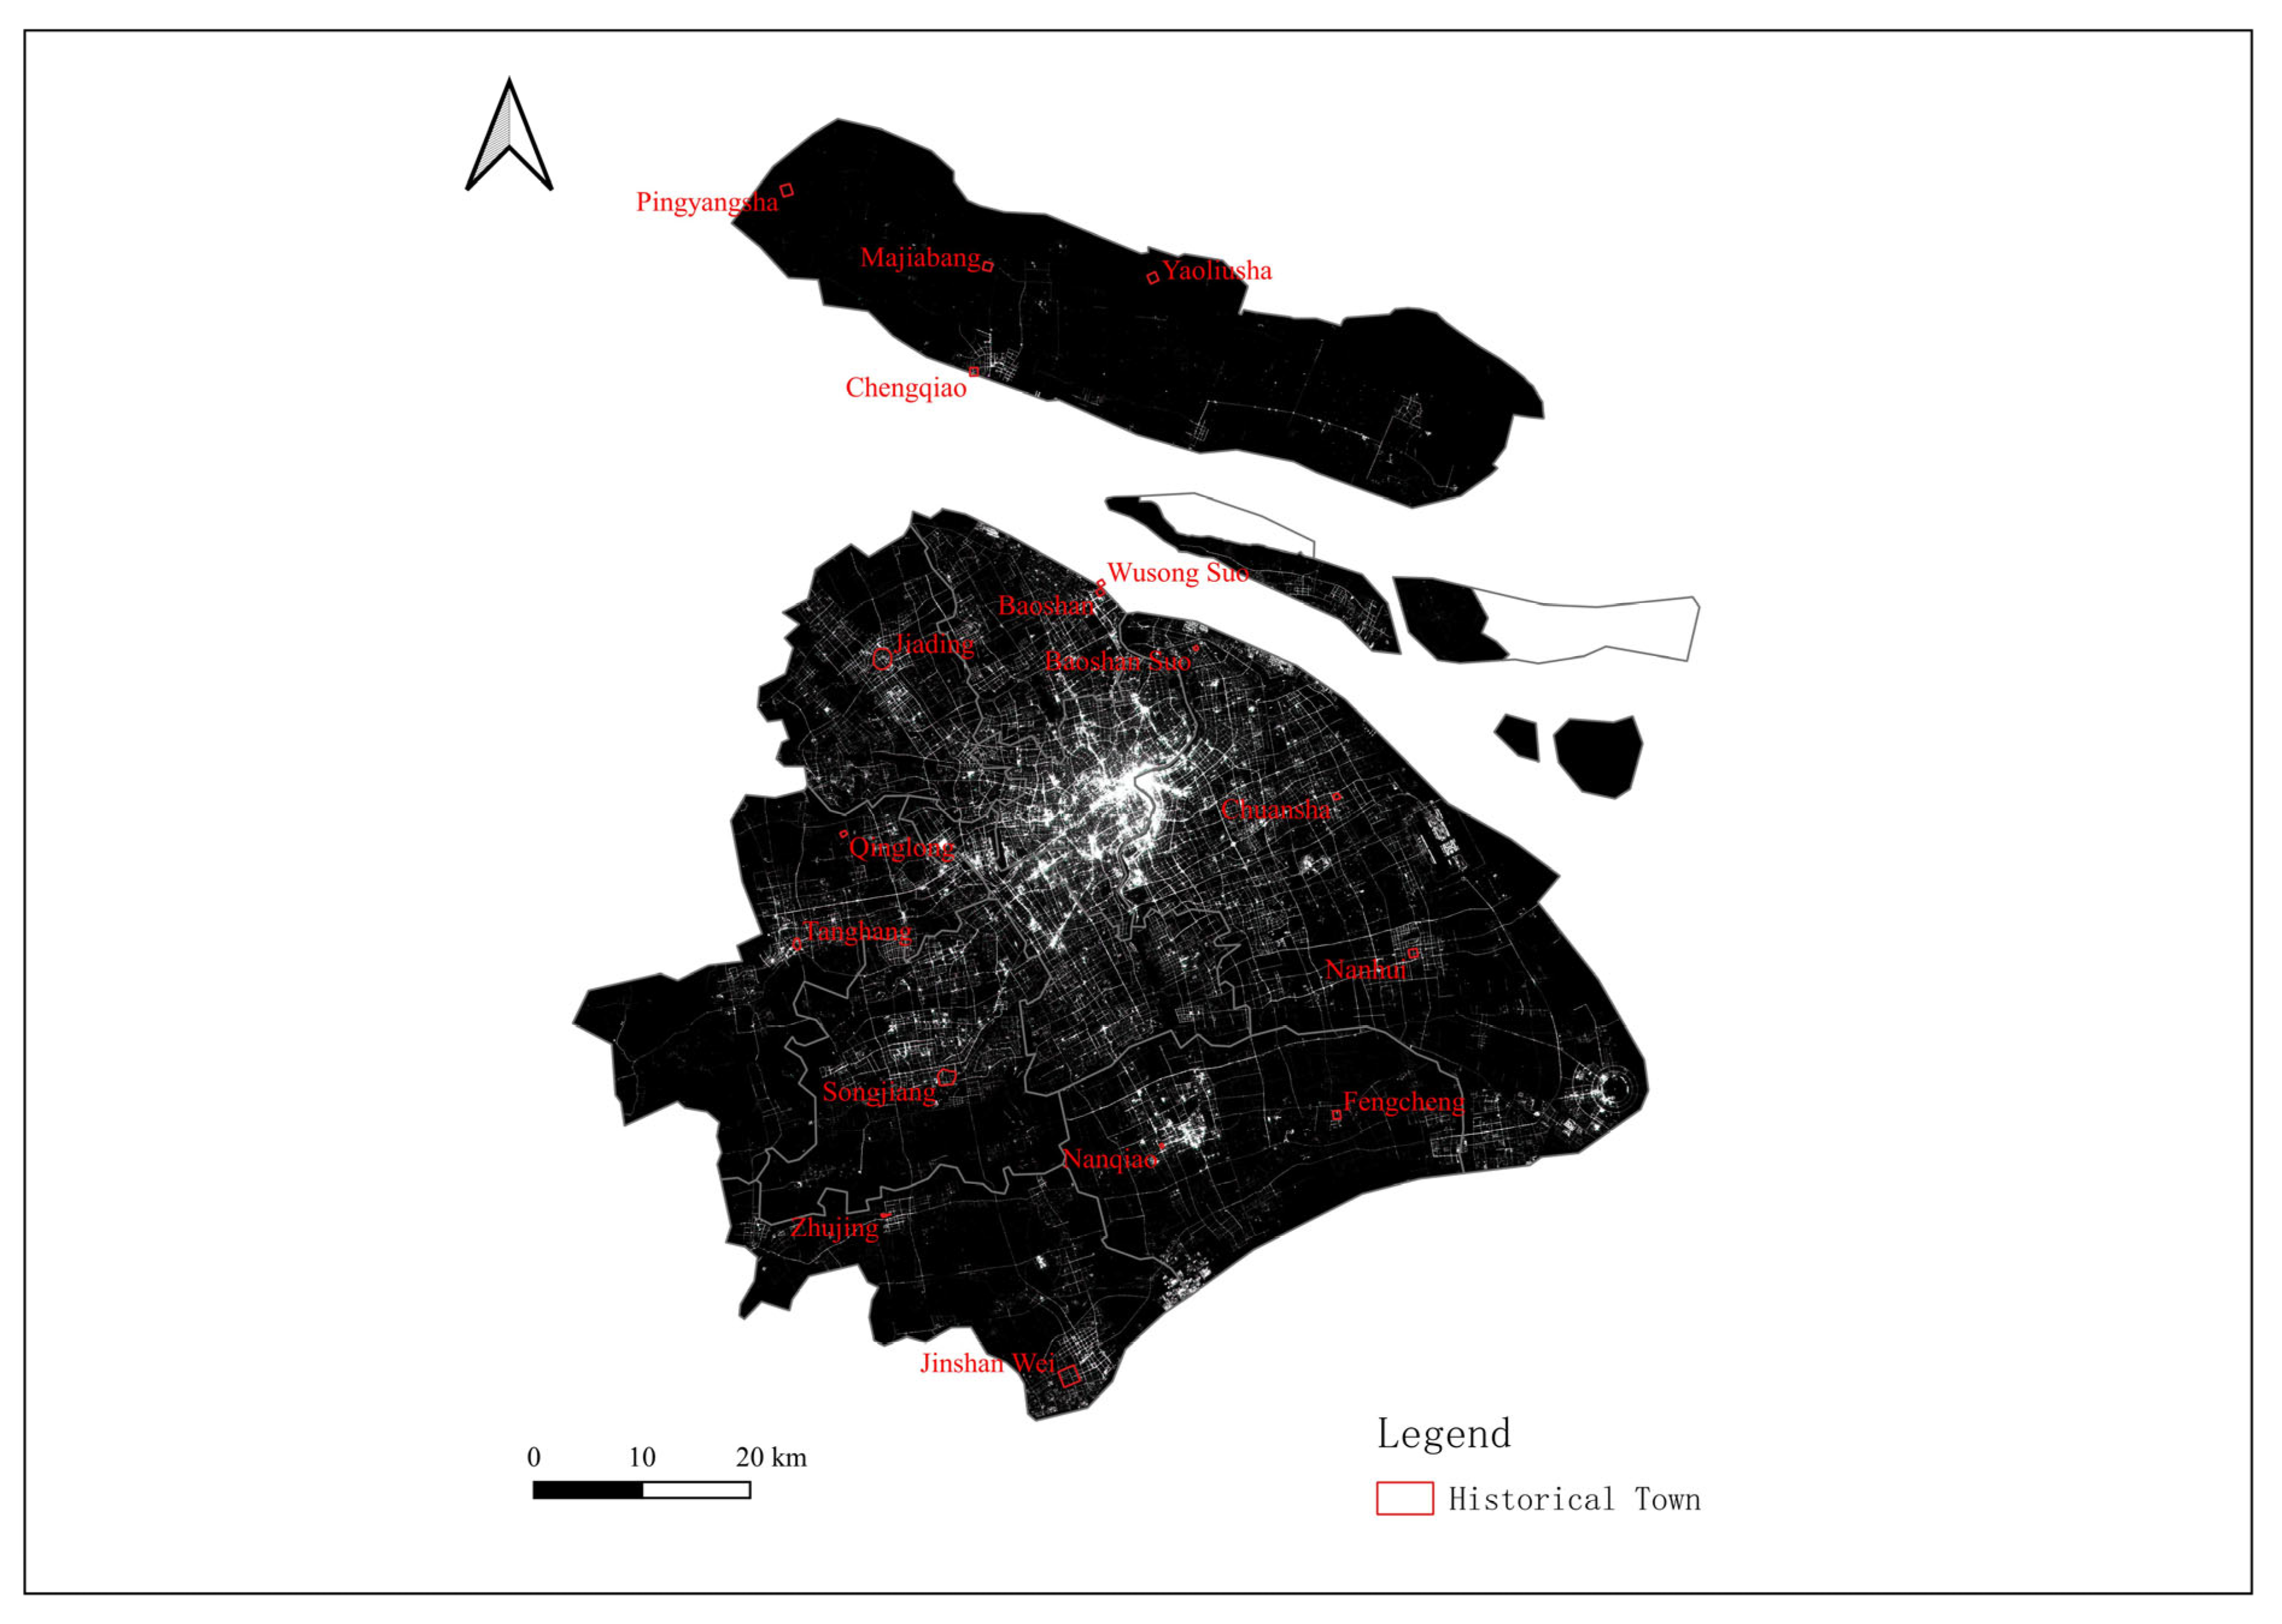
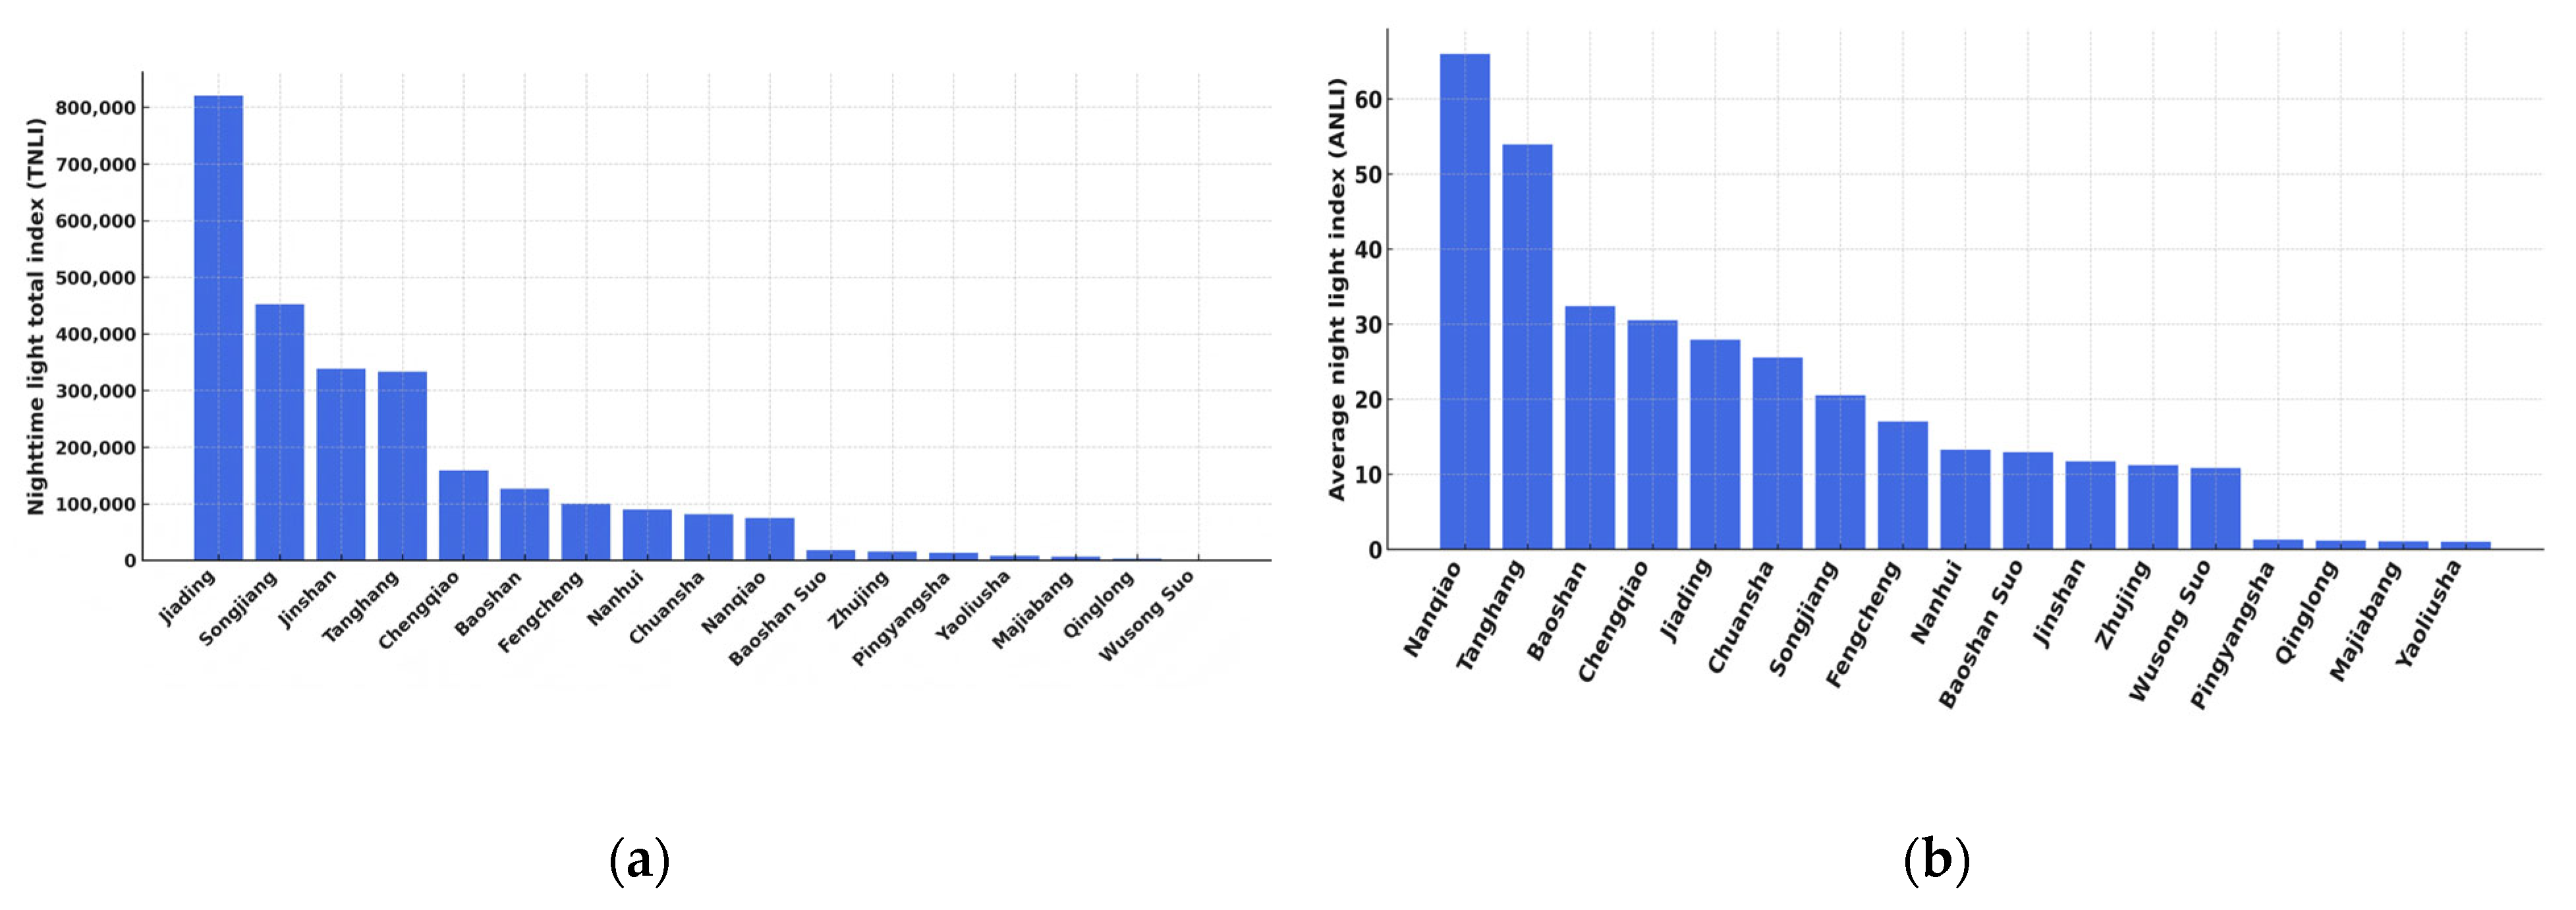
4.2. Analysis of NLT Distribution and Indices in Historical Towns
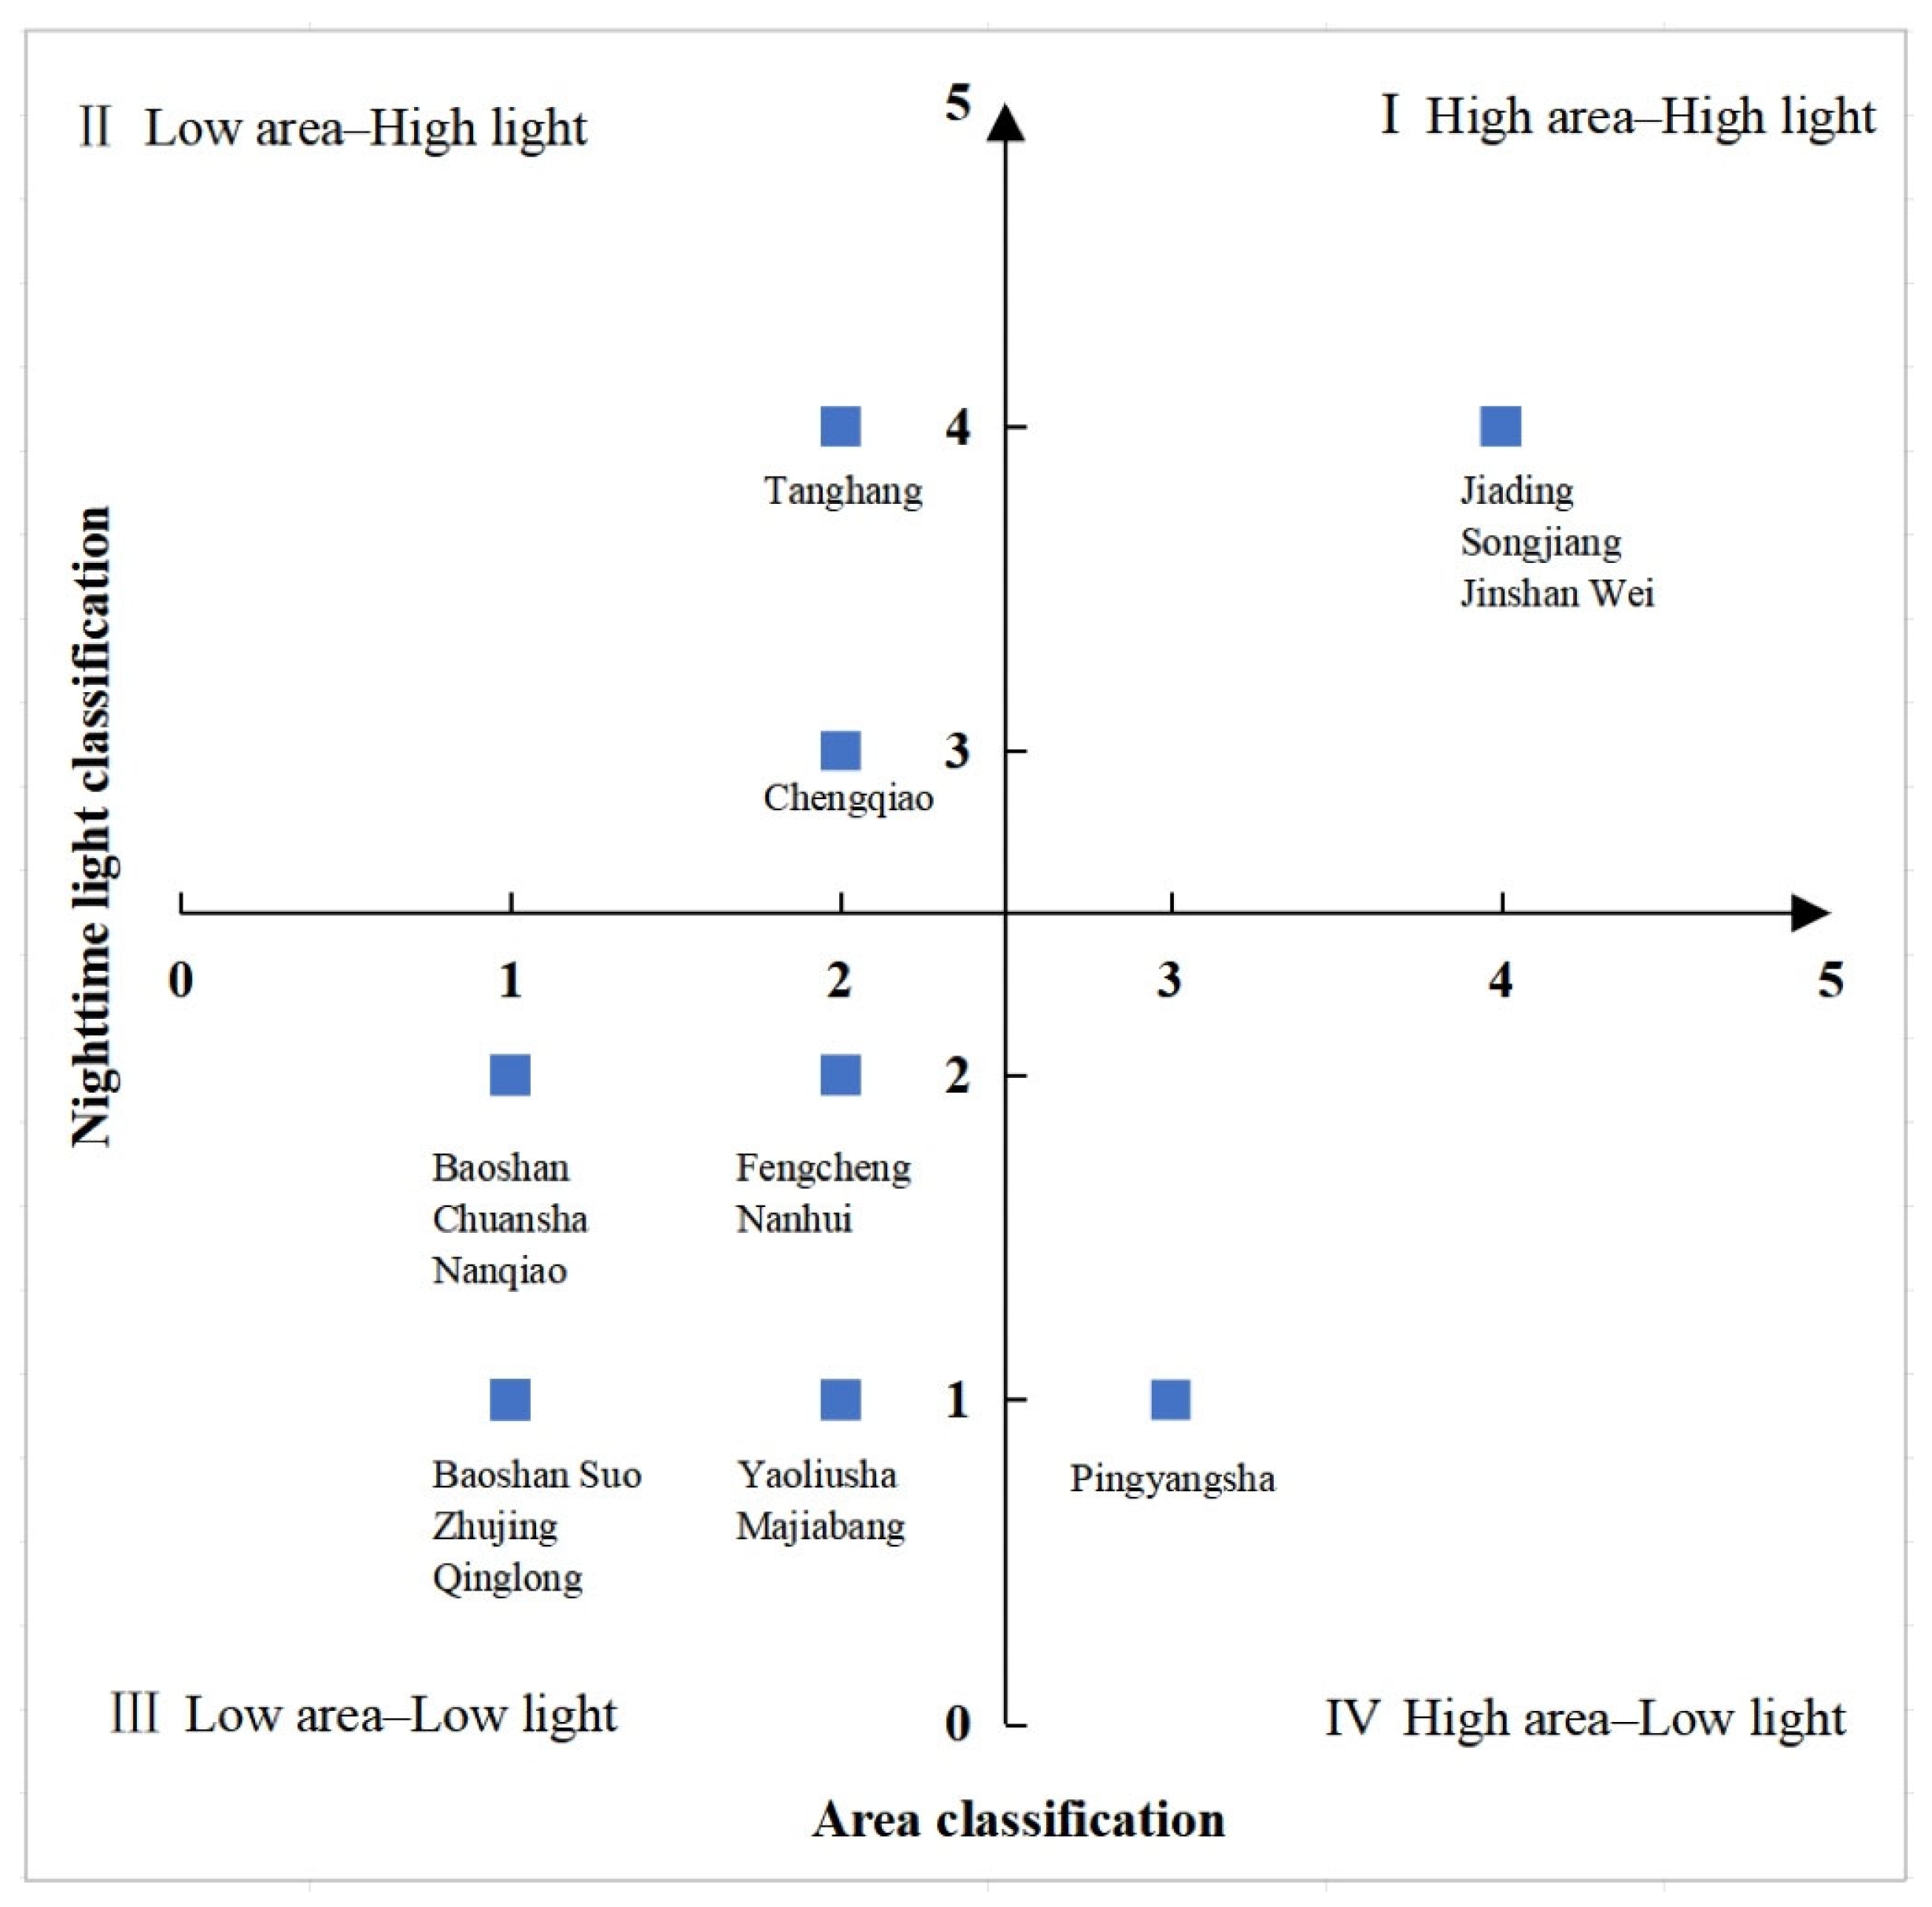
4.3. Grading Evaluation of Economic Vitality of Modern Historical Towns
4.4. Analysis of the Influence Mechanisms of Modern Economic Vitality in Historical Towns
4.4.1. Natural Geographical Conditions
4.4.2. Historical Foundations and Continuity
4.4.3. Policy Guidance
4.4.4. Transportation
5. Discussion
5.1. Integration of High-Resolution Nighttime Light Imagery and Historical Geographical Data
5.2. Value of Economic Vitality in Urban Cultural Heritage
6. Conclusions
Author Contributions
Funding
Data Availability Statement
Acknowledgments
Conflicts of Interest
References
- Tweed, C.; Sutherland, M. Built cultural heritage and sustainable urban development. Landsc. Urban Plan. 2007, 83, 62–69. [Google Scholar] [CrossRef]
- Ruan, Y.; Yuan, F. On historic towns conservation—Conservation and development of historic water towns south of the Yangtze River. Urban Plan. Forum 2011, 5, 95–101. [Google Scholar]
- Wang, X.; Xiao, L.; Liu, W. A study on the value cognition of historical towns from the perspective of historical geography: Taking the Beiwudu Town as an example. Urban Stud. 2019, 26, 28–32. [Google Scholar]
- Xia, J.; Kang, J.; Xu, X.L. Global research trends and future directions in urban historical heritage area conservation and development: A 25-year bibliometric analysis. Buildings 2024, 14, 3096. [Google Scholar] [CrossRef]
- Transforming Our World: The 2030 Agenda for Sustainable Development. Available online: https://www.un.org/ohrlls/sites/www.un.org.ohrlls/files/2030_agenda_for_sustainable_development_web.pdf (accessed on 16 June 2025).
- Policy Document for the Integration of a Sustainable Development Perspective into the Processes of the World Heritage Convention. Available online: https://whc.unesco.org/en/sustainabledevelopment/ (accessed on 27 April 2025).
- Tier Classification for Global SDG Indicators. Available online: https://unstats.un.org/sdgs/iaeg-sdgs/tier-classification/ (accessed on 27 April 2025).
- Larkham, P. The place of urban conservation in the UK reconstruction plans of 1942–1952. Plan. Perspect. 2003, 18, 295–324. [Google Scholar] [CrossRef]
- Kostof, S. The City Assembled: The Elements of Urban Form Through History; Thames and Hudson: London, UK, 1992. [Google Scholar]
- Li, X.F.; Xu, C.; Yang, C.; Yang, C.; Yang, H. Evolution of cultural landscape heritage layers and value assessment in urban countryside historic districts: The case of Jiufeng Sheshan, Shanghai, China. Npj Herit. Sci. 2024, 12, 96. [Google Scholar] [CrossRef]
- Shao, Y.; Hu, L.J.; Zhao, J.; Chhn, H. A research on the conservation plan of the human-habitat world heritage: Case study of Pingyao Ancient City. Urban Plan. Forum 2016, 5, 94–102. [Google Scholar]
- Wang, J. On professional problems of multi-scale protection of urban architectural heritage in China. City Plan. Rev. 2022, 46, 7–24. [Google Scholar]
- Steinberg, F. Conservation and rehabilitation of urban heritage in developing countries. Habitat Int. 1996, 20, 463–475. [Google Scholar] [CrossRef]
- Wang, M.; Zhang, W.W. Value system and attributes of town heritage based on the concept of sustainable development. China Cult. Herit. 2024, 3, 119–126. [Google Scholar]
- Zhong, C. Exploring the proto-landscape and architectural layering of the old town of Shanghai from the perspectives of time and space. Shanghai Chron. 2024, 3, 55–64. [Google Scholar]
- Liu, Y. Anchoring and Stratification of Urban Historical Landscapes: Understanding and Protecting Historical Cities; Science Press: Beijing, China, 2017; p. 97. [Google Scholar]
- Liu, P. The theory and practice exploration of “remembering nostalgia” in the construction of new urbanization. Geogr. Res. 2015, 34, 1205–1212. [Google Scholar]
- Wang, J.Y.; Zakaria, S.A. Morphological characteristics and sustainable adaptive reuse strategies of regional cultural architecture: A case study of Fenghuang Ancient Town, Xiangxi, China. Buildings 2025, 15, 119. [Google Scholar] [CrossRef]
- Zheng, L.D. On the protection and utilization of the famous historic and cultural cities, towns, and villages in the Central Plain Economic Region. Appl. Mech. Mater. 2014, 507, 595–598. [Google Scholar]
- Zhao, Y.X.; Xiang, H.W.; Huang, Z.S. Architectural spatial distribution and network connectivity characteristics of ancient military towns in Southwest China: A case study of Qingyan Ancient Town in Guiyang. Npj Herit. Sci. 2024, 12, 403. [Google Scholar] [CrossRef]
- Yang, X.; Shen, J. Integrating historic landscape characterization for historic district assessment through multi-source data: A case study from Hangzhou, China. Npj Herit. Sci. 2025, 13, 33. [Google Scholar] [CrossRef]
- Mehanna, W.A. Urban renewal for traditional commercial streets at the historical centers of cities. Alex. Eng. J. 2019, 58, 1127–1143. [Google Scholar] [CrossRef]
- Wang, X.; Aoki, N. Paradox between neoliberal urban redevelopment, heritage conservation, and community needs: Case study of a historic neighborhood in Tianjin, China. Cities 2019, 85, 156–169. [Google Scholar] [CrossRef]
- Chen, Z.J.; Zhang, C.Z.; Qiu, S.X.; Lin, J.Y. GDP estimation by integrating Qimingxing-1 nighttime light, street-view imagery, and points of interest: An empirical study in Dongguan City. Remote Sens. 2025, 17, 1127. [Google Scholar] [CrossRef]
- Elvidge, C.D.; Baugh, K.E.; Kihn, E.A.; Kroehl, H.W.; Davis, E.R. Mapping city lights with nighttime data from the DMSP Operational Linescan System. Photogramm. Eng. Remote Sens. 1997, 63, 727–734. [Google Scholar]
- Sutton, P.; Roberts, D.; Elvidge, C.; Melj, H. A comparison of nighttime satellite imagery and population density for the continental United States. Photogramm. Eng. Remote Sens. 1997, 63, 1303–1313. [Google Scholar]
- Tripathy, B.R.; Tiwari, V.; Pandey, V.; Elvidge, C.D.; Rawat, J.S.; Sharma, M.P.; Prawasi, R.; Kumar, P. Estimation of urban population dynamics using DMSP-OLS night-time lights time series sensors data. IEEE Sens. J. 2017, 17, 1013–1020. [Google Scholar] [CrossRef]
- Wang, L.Y.; Fan, H.; Wang, Y.K. Improving population mapping using Luojia 1-01 nighttime light image and location-based social media data. Sci. Total Environ. 2020, 730, 139148. [Google Scholar] [CrossRef] [PubMed]
- Keola, S.; Andersson, M.; Hall, O. Monitoring economic development from space: Using nighttime light and land cover data to measure economic growth. World Dev. 2015, 66, 322–334. [Google Scholar] [CrossRef]
- Chen, X.; Nordhaus, W.D. Using luminosity data as a proxy for economic statistics. Proc. Natl. Acad. Sci. USA 2011, 108, 8589–8594. [Google Scholar] [CrossRef]
- Li, Q.X.; Zheng, H.; Zhang, G.; Guo, X.Y.; Liu, W.L. Analysis of Luojia1-01 index based on nighttime light imagery. J. Geomat. 2020, 45, 8–15. [Google Scholar]
- Letu, H.; Hara, M.; Yagi, H.; Naoki, K.; Tana, G.; Nishio, F.; Shuhei, O. Estimating energy consumption from night-time DMSP/OLS imagery after correcting for saturation effects. Int. J. Remote Sens. 2010, 31, 4443–4458. [Google Scholar] [CrossRef]
- Chen, Z.J.; Liu, Y.M.; Liu, X.; Kong, F.B. Research on carbon emission peak in Yangtze River economic zone with steady economic growth: Based on data of global night-time light. J. Nat. Resour. 2018, 33, 2213–2222. [Google Scholar]
- Doll, C.N.H.; Muller, J.P.; Elvidge, C.D. Night-time imagery as a tool for global mapping of socioeconomic parameters and greenhouse gas emissions. AMBIO 2000, 29, 157–162. [Google Scholar] [CrossRef]
- Hsu, F.C.; Elvidge, C.D.; Matsuno, Y. Exploring and estimating in-use steel stocks in civil engineering and buildings from nighttime lights. Int. J. Remote Sens. 2013, 34, 490–504. [Google Scholar] [CrossRef]
- Tan, Z.R.; Wei, D.L.; Yin, Z.X. Housing vacancy rate in major cities in China: Perspectives from nighttime light data. Complexity 2020, 2020, 5104578. [Google Scholar] [CrossRef]
- Yu, B.L.; Wang, C.X.; Gong, W.K.; Chen, Z.T. Nighttime light remote sensing and urban studies: Data, methods, applications, and prospects. Natl. Remote Sens. Bull. 2021, 25, 342–364. [Google Scholar] [CrossRef]
- Chen, Y. Geographically heterogeneous spatial inequality in China: A luminosity-based analysis of prefectural cities and counties. Asian Dev. Rev. 2025; 42, in press. [Google Scholar] [CrossRef]
- Zhang, X.; Gibson, J. Using multi-source nighttime lights data to proxy for county-level economic activity in China from 2012 to 2019. Remote Sens. 2022, 14, 1282. [Google Scholar] [CrossRef]
- Li, D.R.; Li, X. Applications of night-time light remote sensing in evaluating socioeconomic development. J. Macro-Qual. Res. 2015, 3, 1–8. [Google Scholar]
- User Guide of SDGSAT-1 (Released on July 2022). Available online: http://124.16.184.48:6008/downresouce (accessed on 27 April 2025).
- Li, S.; Sun, T. Spatial distribution of cities and towns in the late Qing Dynasty and early Republic of China and evaluation of modern economic vitality based on multi-source data: Taking the Yellow River Basin as an example. Digit. Humanit. Res. 2022, 2, 39–51. [Google Scholar]
- Li, H.; Jing, L.H.; Dou, C.Y.; Ding, H.F. A comprehensive assessment of the pansharpening of the nighttime light imagery of the Glimmer Imager of the Sustainable Development Science Satellite 1. Remote Sens. 2024, 16, 245. [Google Scholar] [CrossRef]
- Chang, H.; Wang, X.; Zhang, J.; Li, Y. Fishing vessel identification by low-light images of SDGSAT-1 satellites. Radio Eng. 2023, 53, 2691–2698. [Google Scholar]
- Zhao, Y.L.; Chao, Z.H. A review of historical GIS and its trend. J. Geo-Inf. Sci. 2020, 22, 929–944. [Google Scholar]
- Pan, W.; Liu, Y.; Zhang, Q. On the informationization of antique maps in historical geography. Lib. Forum 2021, 41, 79–89. [Google Scholar]
- Gu, H.H.; Sun, B.D. The urban spatial change hypothesis revisited: A case study of Shanghai. Cities 2025, 158, 105694. [Google Scholar] [CrossRef]
- Wang, J.; Jia, L.Y. Administrative region adjustment between ten counties from Jiangsu province and Shanghai municipality in 1958. Hist. Rev. 2019, 1, 170–182, 221. [Google Scholar]
- Shanghai Urban Planning and Design Research Institute. Tracing and Innovating: The Evolution of Shanghai Urban Planning; Tongji University Press: Shanghai, China, 2007. [Google Scholar]
- Guo, L. Research on the development of new towns in Shanghai suburb. Shanghai Econ. 2016, 1, 72–85. [Google Scholar]
- Zhou, Z.H. Historical Atlas of Shanghai; Shanghai People’s Publishing House: Shanghai, China, 1999. [Google Scholar]
- Sun, X.; Zhong, C. (Eds.) Compilation of Shanghai Urban Maps; Shanghai Calligraphy and Painting Publishing House: Shanghai, China, 2017. [Google Scholar]
- Xue, Q.; Jin, X.; Cheng, Y.; Yang, X.; Zhou, Y. The dataset of walled cities and urban extent in late imperial China in the 15th–19th centuries. Earth Syst. Sci. Data 2021, 13, 5071–5085. [Google Scholar] [CrossRef]
- Skinner, G.W. The City in Late Imperial China; Stanford University Press: Stanford, CA, USA, 1977. [Google Scholar]
- He, F.N.; Ge, Q.S.; Zheng, J.Y. Reckoning the area of urban land use and their comparison in the Qing Dynasty in China. Acta Geogr. Sin. 2002, 6, 709–716. [Google Scholar]
- Liu, Y.Y. Modern Transformation of Traditional Urban Space: A Case Study of Shanghai Chinese Territory (1905–1914). J. Hist. Geogr. China 2020, 1, 92–102. [Google Scholar]
- Chen, L.; Zhao, L.; Xiao, Y.; Lu, Y. Investigating the spatiotemporal pattern between the built environment and urban vibrancy using big data in Shenzhen, China. Comput. Environ. Urban Syst. 2022, 95, 101827. [Google Scholar] [CrossRef]
- Li, Q.; Cui, C.; Liu, F.; Wu, Q.; Run, Y.; Han, Z. Multidimensional urban vitality on streets: Spatial patterns and influence factor identification using multisource urban data. ISPRS Int. J. Geo-Inf. 2021, 11, 2. [Google Scholar] [CrossRef]
- Xie, Q.; Cai, C.; Jiang, Y.; Zhang, H.; Wu, Z.; Xu, J. Investigating the performance of SDGSAT-1/GIU and NPP/VIIRS nighttime light data in representing nighttime vitality and its relationship with the built environment: A comparative study in Shanghai, China. Ecol. Indic. 2024, 160, 111945. [Google Scholar] [CrossRef]
- Pu, Y.X.; Liu, J.Y.; He, Y.M.; Xiang, B. Spatio-temporal dynamics of city-size distribution in Yangtze River Delta. Geogr. Res. 2009, 28, 161–172. [Google Scholar]
- Sun, C.Q. Exploring Jiangnan Cities: A Study of the Historical Urban Form of Shanghai Garrison Towns; Shanghai Bookstore: Shanghai, China, 2022. [Google Scholar]
- Han, J.; Xu, X.; Zhang, C. (Eds.) Jiading County Gazetteer of Jiangsu Province; Chengwen Publishing House: Beijing, China, 1983. [Google Scholar]
- Zhang, Z.M. Growth, distribution, and characteristics of towns in the Shanghai area during the Ming Dynasty. Hist. Rev. 1990, 1, 19–24. [Google Scholar]
- Chu, S.T. Historical Geography of Shanghai; East China Normal University Press: Shanghai, China, 1999. [Google Scholar]
- An, T. Center and Periphery: Research on the Economic and Social Transformation of Jiangnan Towns since the Ming and Qing Dynasties; Shanghai People’s Publishing House: Shanghai, China, 2010. [Google Scholar]
- Sun, P. Shanghai Urban Planning Gazetteer; Shanghai Academy of Social Sciences Press: Shanghai, China, 1999. [Google Scholar]
- Lan, W.J.; Hu, M.; Zhao, Z.C. Review, feature analysis, and prospect of the historic city conservation system. Urban Plan. Forum 2019, 2, 30–35. [Google Scholar]
- Li, S.; Zhang, X.H. Spatio-temporal process and mechanism analysis of Shanghai’s urban expansion in 1843–2020. Acta Geogr. Sin. 2024, 79, 1286–1302. [Google Scholar]
- Zhang, X.D. Rise and fall of Qinglongzhen Port in Tang and Song: A study from the perspective of maritime porcelain road. Hist. Rev. 2022, 3, 35–45+219. [Google Scholar]


| Type | Data | Time |
|---|---|---|
| Historical documents | Official history, geography, local chronicles, etc. | Ming and Qing Dynasties |
| Old maps | Large-scale 1:25,000 map of Shanghai | 1932 |
| Shanghai historical atlas | 1999 | |
| Complete atlas of Shanghai antiquated maps | 2018 | |
| Remote sensing imagery | SDGSAT-1 Nighttime Light Data | 2025 |
| Base map satellite imagery from Tianditu | 2025 |
| Band | Gain | Bias |
|---|---|---|
| PL | 0.00008832 | 0.0000167808 |
| PH | 0.00008757 | 0.0000183897 |
| R | 0.00001354 | 0.0000136754 |
| G | 0.00000507 | 0.000006084 |
| B | 0.0000099253 | 0.0000099253 |
| Historical Town | Reconstructed Area (km2) | Reconstructed Perimeter (km) |
|---|---|---|
| Jiading County | 2.95 | 6.21 |
| Songjiang Prefecture | 2.21 | 5.76 |
| Jinshan Wei | 2.90 | 6.81 |
| Nanhui County | 0.68 | 3.29 |
| Zhujing Town | 0.14 | 2.67 |
| Fengcheng Town | 0.59 | 3.07 |
| Nanqiao Town | 0.11 | 1.36 |
| Baoshan County | 0.39 | 2.50 |
| Wusongsuo Town | 0.32 | 2.26 |
| Baoshan Suo | 0.14 | 1.49 |
| Chuansha Ting | 0.32 | 2.18 |
| Tanghang Town | 0.62 | 3.02 |
| Qinglong Town | 0.28 | 2.12 |
| Chengqiao Town | 0.66 | 3.24 |
| Pingyangsha | 1.07 | 4.14 |
| Yaoliusha | 0.81 | 3.59 |
| Majiabang | 0.65 | 3.23 |
| Qinjiafu | 0.56 | 2.99 |
Disclaimer/Publisher’s Note: The statements, opinions and data contained in all publications are solely those of the individual author(s) and contributor(s) and not of MDPI and/or the editor(s). MDPI and/or the editor(s) disclaim responsibility for any injury to people or property resulting from any ideas, methods, instructions or products referred to in the content. |
© 2025 by the authors. Licensee MDPI, Basel, Switzerland. This article is an open access article distributed under the terms and conditions of the Creative Commons Attribution (CC BY) license (https://creativecommons.org/licenses/by/4.0/).
Share and Cite
Hu, Q.; Li, S. Spatial Reconstruction and Economic Vitality Assessment of Historical Towns Using SDGSAT-1 Nighttime Light Imagery and Historical GIS: A Case Study of Suburban Shanghai. Remote Sens. 2025, 17, 2123. https://doi.org/10.3390/rs17132123
Hu Q, Li S. Spatial Reconstruction and Economic Vitality Assessment of Historical Towns Using SDGSAT-1 Nighttime Light Imagery and Historical GIS: A Case Study of Suburban Shanghai. Remote Sensing. 2025; 17(13):2123. https://doi.org/10.3390/rs17132123
Chicago/Turabian StyleHu, Qi, and Shuang Li. 2025. "Spatial Reconstruction and Economic Vitality Assessment of Historical Towns Using SDGSAT-1 Nighttime Light Imagery and Historical GIS: A Case Study of Suburban Shanghai" Remote Sensing 17, no. 13: 2123. https://doi.org/10.3390/rs17132123
APA StyleHu, Q., & Li, S. (2025). Spatial Reconstruction and Economic Vitality Assessment of Historical Towns Using SDGSAT-1 Nighttime Light Imagery and Historical GIS: A Case Study of Suburban Shanghai. Remote Sensing, 17(13), 2123. https://doi.org/10.3390/rs17132123