Article

Landslide Risk Assessment as a Reference for Disaster Prevention and Mitigation: A Case Study of the Renhe District, Panzhihua City, China

1
State Key Laboratory of Lithospheric and Environmental Coevolution, Institute of Geology and Geophysics, Chinese Academy of Sciences, Beijing 100029, China
2
College of Earth and Planetary Sciences, University of Chinese Academy of Sciences, Beijing 100049, China
3
School of Engineering and Technology, China University of Geosciences (Beijing), Beijing 100083, China
4
State Key Laboratory of Continental Dynamics, Department of Geology, Northwest University, Xi’an 710069, China
5
College of Geosciences and Engineering, North China University of Water Resources and Electric Power, Zhengzhou 450046, China
*
Author to whom correspondence should be addressed.
Remote Sens. 2025, 17(13), 2120; https://doi.org/10.3390/rs17132120
Submission received: 1 April 2025 / Revised: 1 June 2025 / Accepted: 18 June 2025 / Published: 20 June 2025
(This article belongs to the Section Earth Observation for Emergency Management)

Abstract

:
In this study, landslide risk assessment was conducted in the Renhe District, Panzhihua City, China. Firstly, based on 190 landslide points and 10 influencing factors, the landslide hazard was assessed using three models: random forest (RF), eXtreme Gradient Boosting (XGBoost), and Tabular Prior-data Fitted Network (TabPFN). The results indicate that the RF and XGBoost models exhibit comparable performance, both demonstrating strong generalization and accuracy, with the RF model achieving superior generalization, as evidenced by an area-under-the-curve (AUC) value of 0.9471. While the AUC value of TabPFN is 0.9243, indicating higher accuracy, it also poses a risk of overfitting and is therefore more suitable for applications involving small sample sizes and the need for rapid responses. The vulnerability assessment utilized the Analytic Hierarchy Process (AHP) to determine the weights of four disaster-bearing bodies, with sensitivity analysis revealing that road type was the most sensitive vulnerability factor. Finally, the landslide risk-assessment map of the Renhe District was produced by integrating the landslide hazard assessment map with the vulnerability assessment map. The findings indicate that the high-risk zones comprised 2.08% of the research region, which includes three principal train stations and necessitates enhanced protective measures. The medium-risk zones comprise 34.23% of the total area and are scattered throughout the region. It is important to enhance local capabilities for landslide monitoring and early warning systems. Relevant conclusions can provide a significant reference for landslide disaster prevention and mitigation work in the Renhe District and help ensure the safe operation of public transport infrastructure, such as railway stations and airports in the district.

1. Introduction

Landslide refers to the geological phenomenon in which rock and soil mass slide down as a whole or in part along a certain weak surface or weak zone under the action of gravity or other disturbances [1]. China is one of the countries most severely affected by landslide disasters worldwide [2]. Due to complex geological conditions and diverse topography, landslide geological disasters occur frequently in China. With the acceleration of urbanization in China, human activities are gradually extending into unstable mountainous areas [3], disrupting the stability of already fragile slope systems and significantly increasing the risk of landslides. Landslides in the southwestern region were particularly severe [2,4,5]. The “First National Comprehensive Risk Census of Natural Disasters,” released by the State Council of China, indicates that by the end of December 2023, there were 132,000 landslide hazard sites in China, representing 53.4% of all geological disaster hazard sites. Additionally, landslides pose significant hazards, and from 2010 to 2022, such events in China caused 5158 fatalities. Located on the edge of the Hengduan Mountains in Southwest China, Panzhihua City is a significant industrial hub in China, boasting rich mineral resources, including vanadium and titanium, as well as a well-developed industrial infrastructure. It is also a key transport hub in the Sichuan–Yunnan region of China, connecting several important cities and regions in Southwest China [2,6]. However, owing to the significant terrain fluctuations and complex geological structure, landslide geological disasters occur frequently in this area, which seriously impedes local economic development. Therefore, a systematic analysis of the distribution pattern of landslide geohazard risk in Panzhihua City is urgently needed and holds great research significance.
Notably, the Renhe District is a significant economic pillar and transport hub of Panzhihua City. It brings together important public infrastructure, such as railway stations, airports, and Vanadium Titanium New City. Nonetheless, the district exhibits typical traits of recurrent landslides, significantly hindering local economic development. According to the Geological Hazard Risk Survey and Assessment Report (1:50,000) for the Renhe District, Sichuan Province (2021), there are currently 84 geological hazard points in the Renhe District, of which 71 are landslides, accounting for 84.5% of the total geological hazard points, far exceeding those of collapses (8), debris flows (3), and ground subsidence (2). Landslides constitute the predominant geological hazards in the Renhe District. A thorough risk assessment of landslides is crucial for enhancing the safety of transportation hubs, such as rail stations and airports, while also providing a scientific foundation for regional disaster prevention and mitigation strategies. However, there is currently a lack of relevant disaster assessment research in the Renhe District. Therefore, this paper focuses on assessing the landslide disaster risk in the Renhe District.
In recent years, scholars have conducted numerous in-depth studies on the risk-assessment methods for geological disasters and have applied them to a wide range of cases. For example, Peng et al. [7] combined a geographic information system (GIS) with machine learning and selected rough set theory and support vector machine models to conduct a quantitative risk analysis of landslides in the Three Gorges region of China. Wang et al. [8] constructed a new index system that considers the influencing factors of railway construction and used the matter–element extended model (MEEM), grey correlation model (GCM), and support vector machine (SVM) to comprehensively assess the geological disaster risks along the Sichuan–Tibet Railway in China. The results of this study indicate that railway construction has a significant impact on the outcomes of geological hazard assessment, and the relevant research methods offer new insights for railway geological hazard assessment. Lin et al. [9] selected eight evaluation indicators, including elevation, slope, normalized difference vegetation index (NDVI), lithology, land-use type, annual average precipitation, distance to river system, and distance to fault. Based on the information value (IV) model and GeoDetector, eight evaluation indicators were selected to reveal the spatial pattern of geological hazard risk and its influencing factors in Fujian Province, China. Liu et al. [10] used a random forest (RF) combined with InSAR technology to assess the risk of landslides in the urban areas of Yan’an City. Zhang et al. [11] introduced a prototype-guided domain-aware progressive representation learning (PG-DPRL) methodology designed to address the challenges of label scarcity and model generalization in extensive cross-domain landslide mapping. The findings indicate that the proposed method achieves elevated accuracy, robustness, and significantly enhanced multi-domain adaptation performance, surpassing current methods (CCA, TriADA, GOAL, and MTCL) in transfer learning mapping. Dai et al. [12] addressed the overfitting challenges encountered by eXtreme Gradient Boosting (XGBoost) in high-dimensional feature contexts by simulating the rime frost formation process, subsequently introducing the RIME-XGBoost model for landslide risk assessment, which attained an area-under-the-curve (AUC) score of 0.947, surpassing the standalone XGBoost model’s AUC value by 0.064.
The development of geological disaster risk-assessment systems has been significantly facilitated by extensive research conducted by previous generations. In general, current geohazard risk-assessment methods mainly include statistical models (e.g., IV [13,14,15], logistic regression [16,17,18,19], discriminant analysis [20,21]), physical models (e.g., numerical simulation [22,23]), and machine-learning models (e.g., SVM [24,25,26], and RF [27,28,29,30,31], deep learning [32,33,34], and transfer learning [35,36]). In numerous instances, the complexity of generating landslide inventories renders the acquisition of extensive landslide data tough. The lack of data constrains the ability to develop resilient models with extensive generalization potential [37]. Consequently, in scenarios of constrained sample size, conventional machine-learning models retain considerable research value and practical applicability [38].
In traditional machine-learning models, the RF algorithm has consistently demonstrated outstanding performance in landslide risk prediction, particularly under the influence of multiple factors. This model can randomly select feature subsets and samples, construct multiple uncorrelated decision trees, and automatically identify key factors using Gini impurity or information gain criteria to effectively mitigate the influence of redundant variables, thereby significantly enhancing the model’s accuracy and robustness [39,40,41]. The XGBoost is a prominent ensemble learning technique utilized in landslide assessment, exhibiting robust predictive accuracy and the ability to identify variable sensitivity [42,43,44,45]. While models like RF and XGBoost exhibit exceptional performance in landslide assessment, characterized by significant robustness and accuracy, they necessitate intricate hyperparameter tuning during the modeling phase and entail comparatively prolonged computation times. In 2023, Hollmann et al. [46] introduced a table-based model named Tabular Prior-data Fitted Network (TabPFN) for small-scale classification tasks. This model utilizes a generative transformer architecture, providing rapid and precise predictions within seconds, eliminating the necessity for parameter adjustment. In 2025, Hollmann et al. [47] introduced an upgraded version of the model, which significantly improved prediction performance while maintaining computational efficiency and achieving superior generalization. The model substantially surpassed all prior techniques on datasets containing up to 10,000 samples and 500 features. TabPFN has significant advantages in small-sample modeling, multivariate adaptability, and no-parameter tuning, and is expected to become a viable new method for landslide assessment.
Furthermore, selecting negative samples is essential for machine-learning models. Research indicates that employing statistical models to identify non-landslide points can markedly enhance model efficacy. Among these methods, the information value (IV) method is widely used in landslide assessment due to its simplicity and clear physical meaning. Therefore, this study proposes to use the IV method to identify non-landslide points and compare the performance of three models—random forest, XGBoost, and TabPFN—to systematically assess the landslide hazard risk in the Renhe District, Panzhihua City.
The main contributions of this paper are as follows:
(1)
This study methodically contrasts the TabPFN model with two conventional reinforcement learning models: random forest (RF) and eXtreme Gradient Boosting tree (XGBoost). We assess the predictive performance, generalization capability, and adaptability of the TabPFN model under limited sample conditions by training and testing on the same dataset, while also investigating its feasibility and potential applications as a rapid and lightweight alternative in geological disaster modelling.
(2)
A multi-factor landslide risk-assessment system is developed to furnish data support and a decision-making foundation for local government agencies in disaster prevention and mitigation, thereby enhancing local landslide management.

2. Materials and Methods
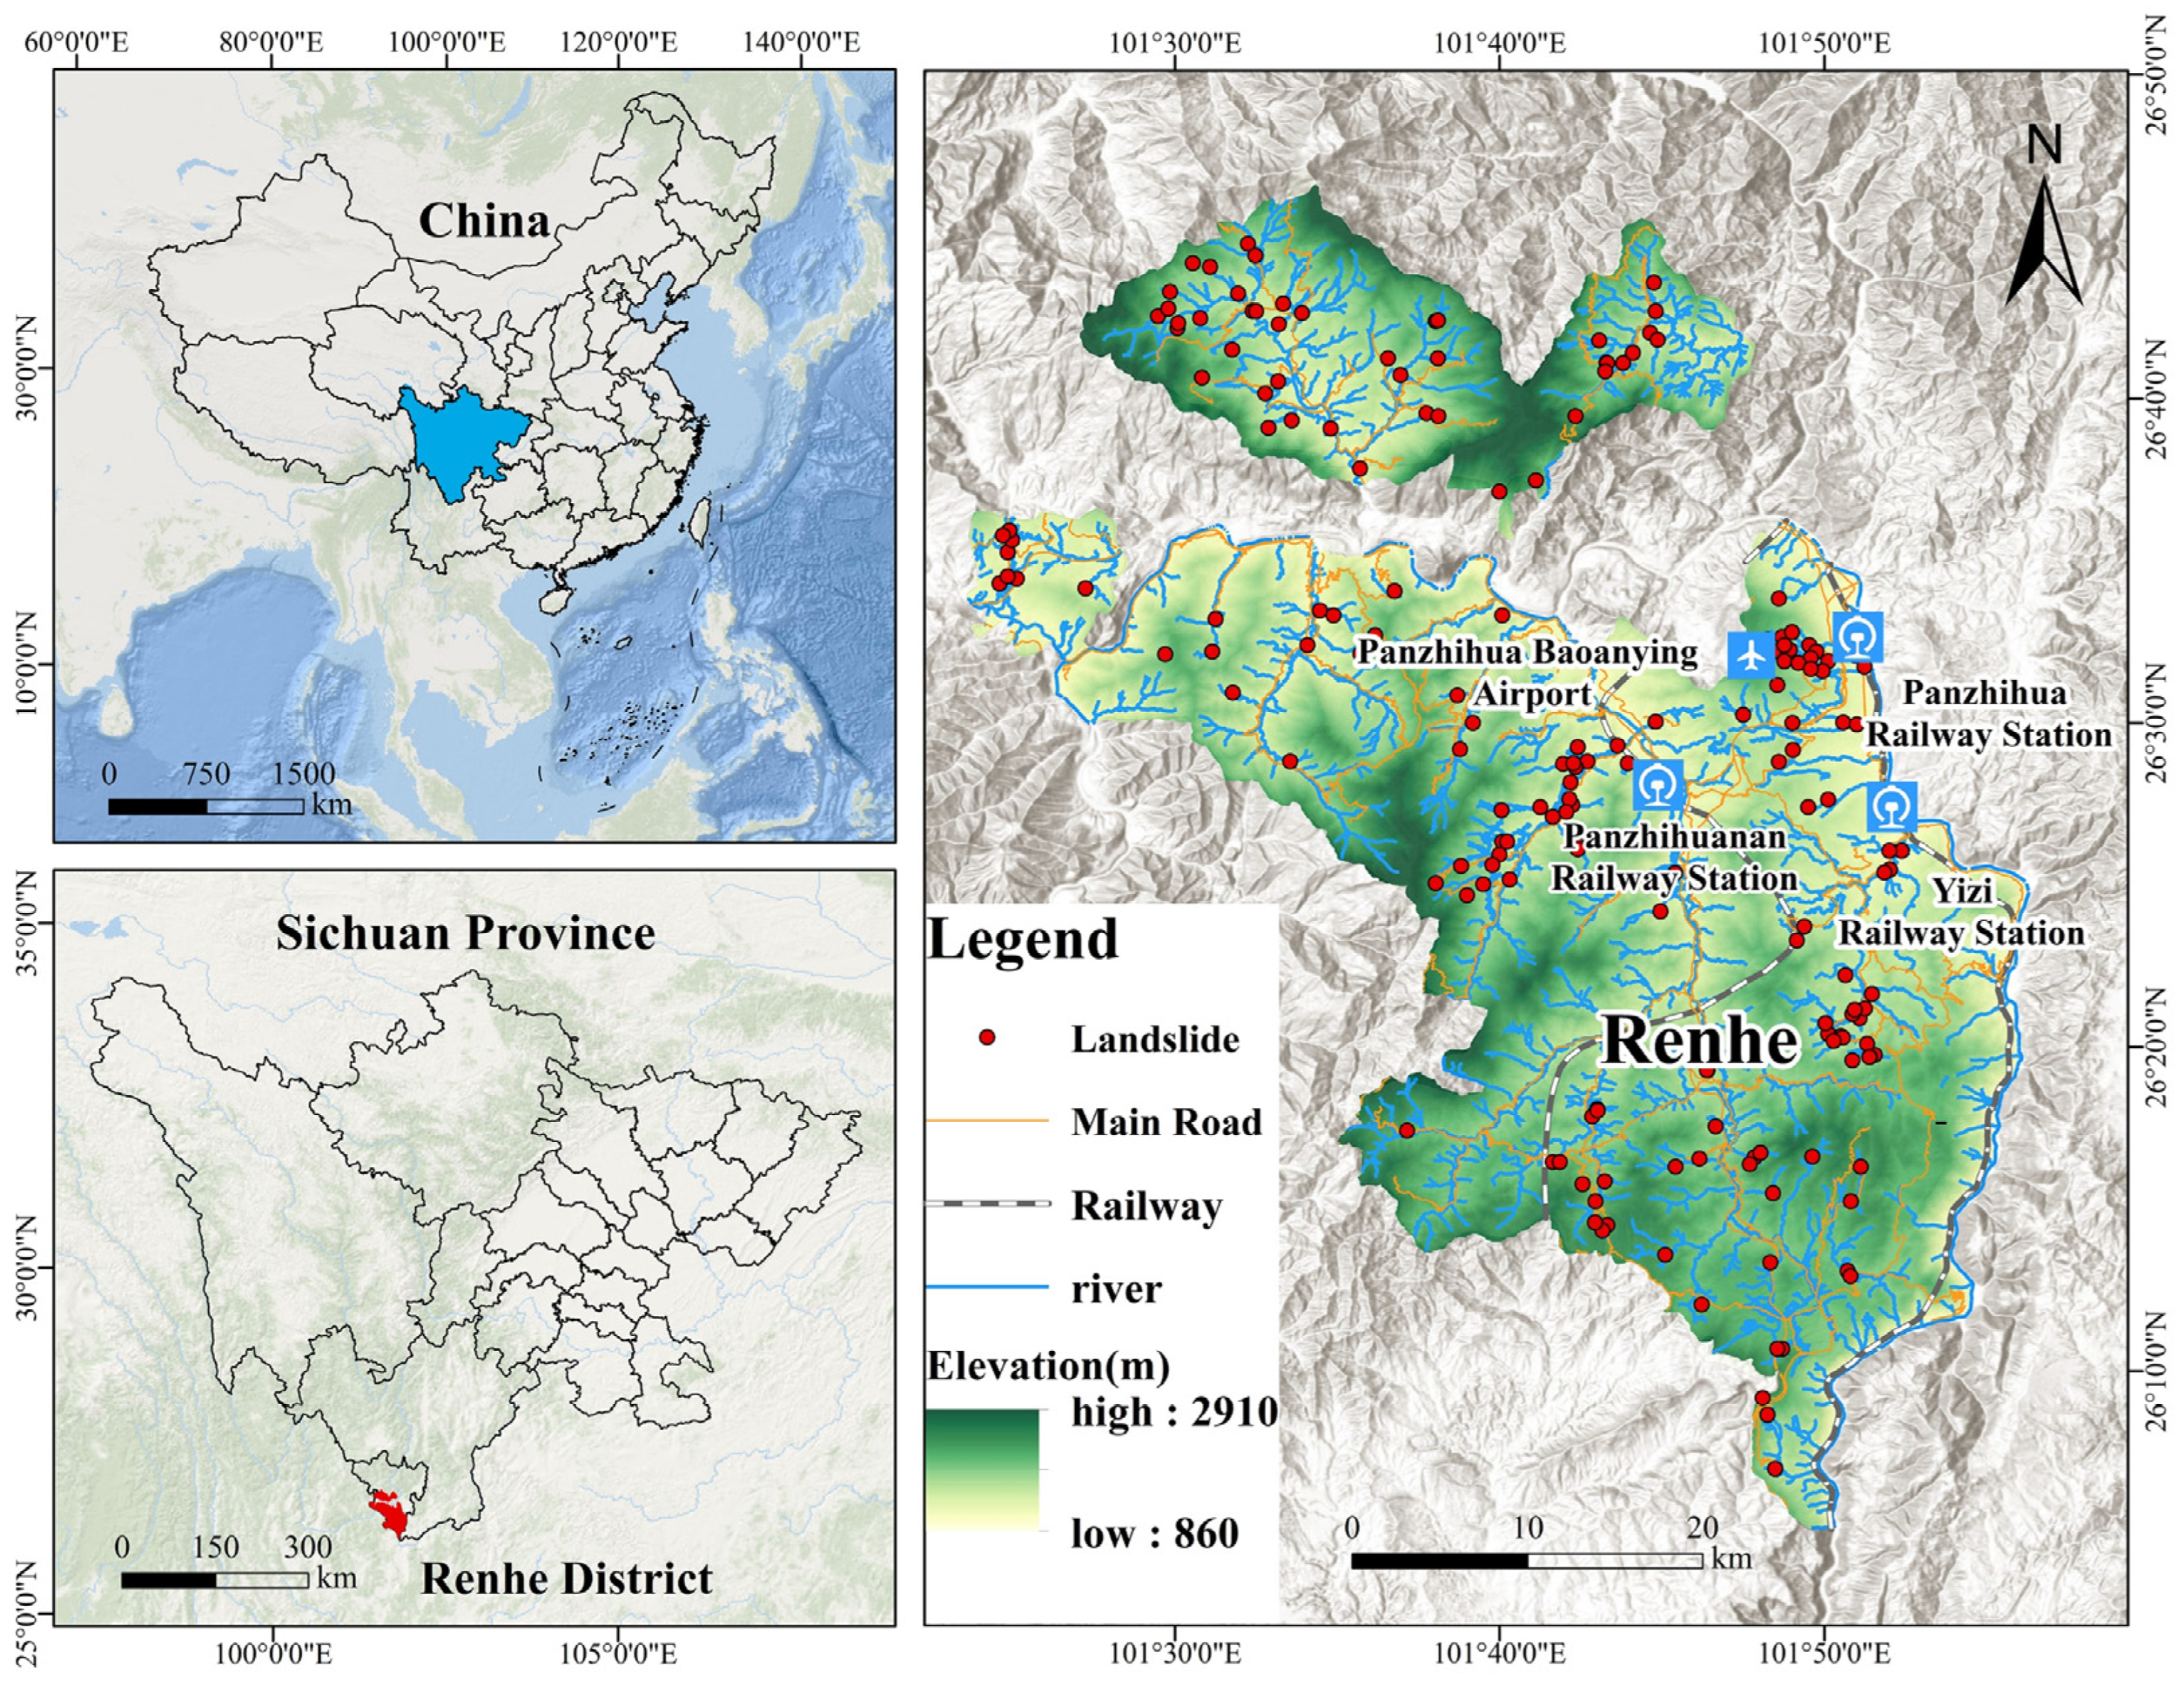
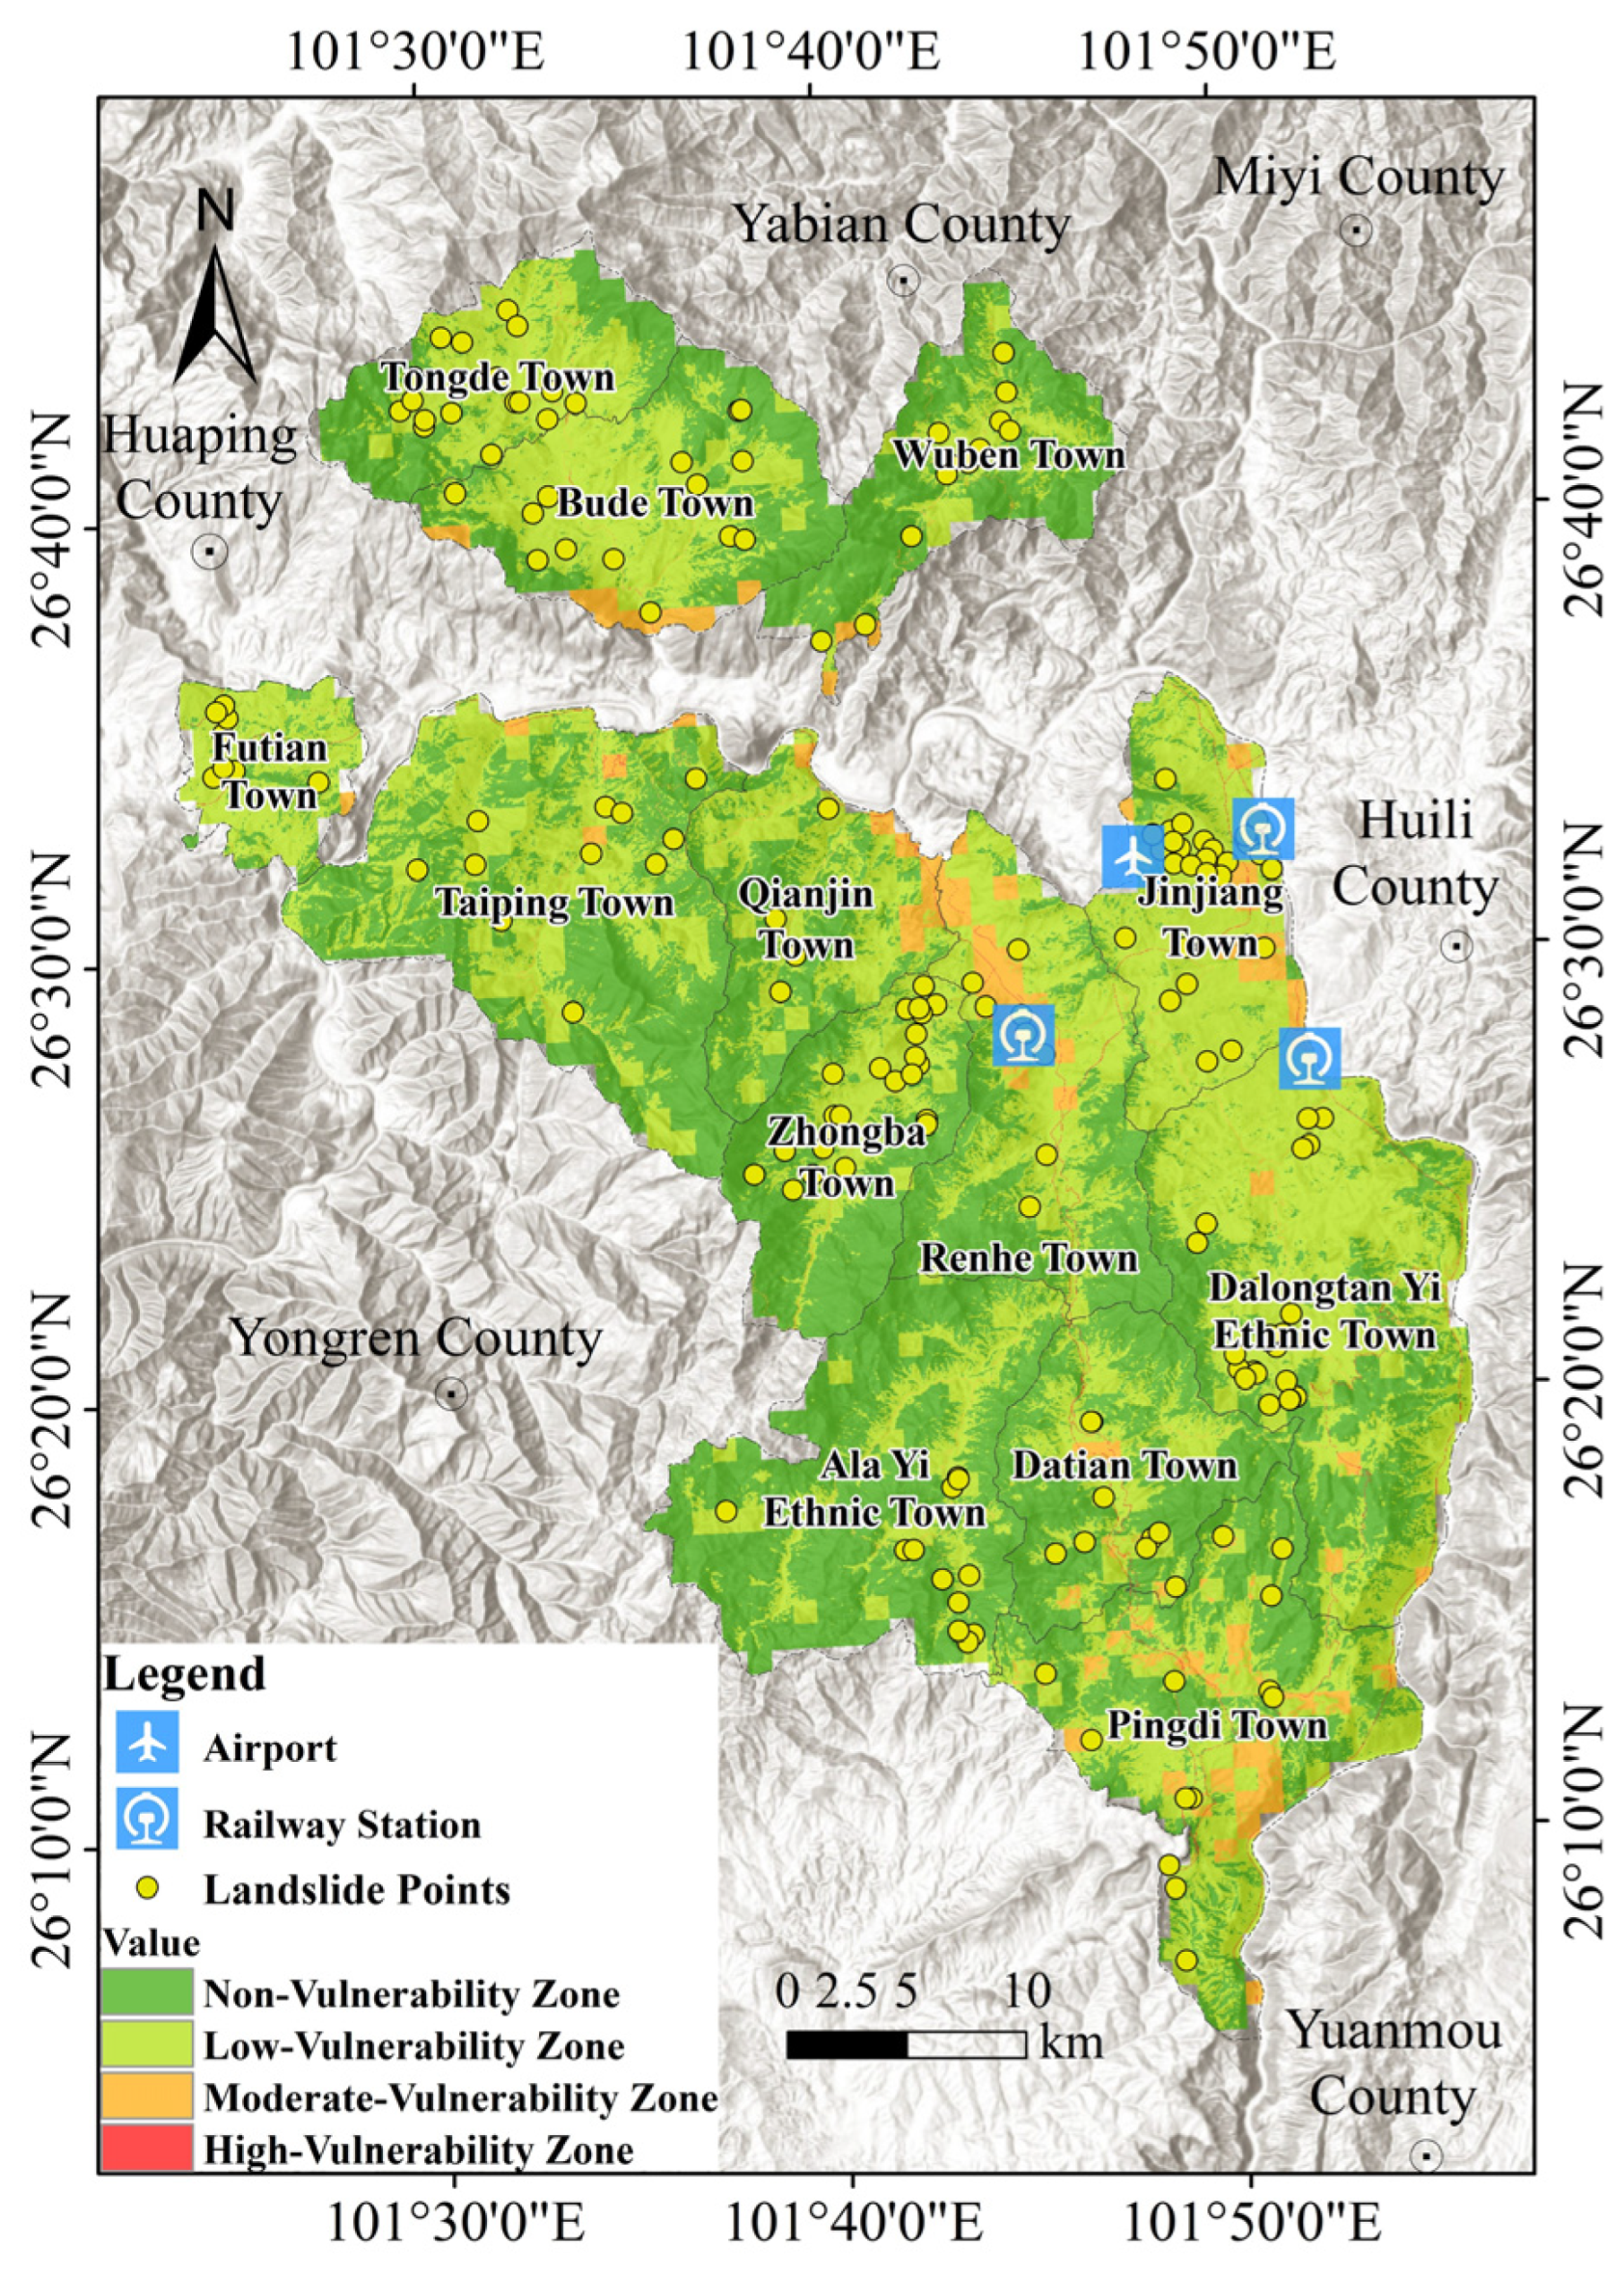
2.1. Study Area

The Renhe District, situated at the intersection of Sichuan and Yunnan provinces, is administered by Panzhihua City in Sichuan Province (Figure 1). The geographical coordinates are 26°06′N to 26°47′N and 101°24′E to 101°56′E, encompassing a total area of 1728.39 km2. It governs one subdistrict, eight towns, and five townships. The district’s geography consists mainly of medium-sized hills and hilly valleys formed by erosion and denudation. The mean altitude is approximately 1500 m, with a maximum relative elevation of 1939 m, showcasing a terrain of elevated mountains and profound valleys interspersed with basins. The overall terrain slopes from northwest to southeast and gradually becomes gentler, with a fragmented topography. The mountains extend approximately in a north–south orientation, with their axis aligned mainly with the tributaries of the Jinsha River. It is situated in the central-southern portion of the Panxi Graben, where the topography is significantly shaped by the Hengduan Mountain Range fault zone, resulting in a complex geological framework. The district is marked by well-developed faults, predominantly small-scale secondary faults. The district reveals a comprehensive array of strata types [48], extending from the Precambrian to the Cenozoic eras. The primary strata include Precambrian and Cambrian metamorphic rocks, Paleozoic sandstone and limestone, Mesozoic conglomerate, mudstone interspersed with coal layers, Cenozoic Xigeda Formation siltstone and mudstone, and Quaternary river deposits. The region is predominantly defined by the upper sections of the Jinsha River and the Wula River, a tributary of the Yalong River, along with several minor rivers and streams dispersed throughout. The climate is categorized as temperate continental [49]. The Renhe District Meteorological Bureau reports that the annual average temperature in the district is roughly 20.3 °C, with a minimum of 14.3 °C and a maximum of 29.7 °C. The long-term average annual precipitation is 752 mm, varying between 468.5 mm and 1217.2 mm. Precipitation is markedly irregularly distributed across the year, with the majority totaling 668.3 mm, occurring between May and September, or 83.6% of the annual total.

2.2. Data Sources

The 190 landslide disaster sites in this study were derived from geological disaster investigation data in the Renhe District. The digital elevation model (DEM) was derived from 30 m resolution DEM data provided by the geospatial data cloud platform GDEMV3, and data such as slope, aspect, and topographic relief were obtained based on this data. Lithology and faults were derived from 1:200,000 regional geological map data. NDVI data were calculated from surface reflectance product processing of the Landsat 8 Operational Land Imager (OLI) at a spatial resolution of 30 m on the U.S. Geological Survey (USGS) Earth Explorer platform (USGS, 2020). The maximum rainfall data for 24 h in 2020 is sourced from the Renhe District Meteorological Bureau. Seismic peak ground acceleration (PGA) data were derived from the “Seismic ground motion parameter zonation map of China” (GB18306-2015) [50]. Land-use type and road data were derived from the Singtu Cloud Open Platform (https://open.geovisearth.com). The Chinese population spatial distribution km-grid dataset [51] and the Chinese Gross Domestic Product (GDP) spatial distribution km-grid dataset [52] were sourced from the Resource and Environmental Science Data registration and publication system.

3. Methodology

The research framework of this paper is illustrated in Figure 2, and the specific research procedure may be categorized into five primary steps:
(1)
Systematically gather multi-source data, including topography, geology, meteorological, and remote sensing, for evaluation factor selection. Select suitable assessment criteria based on study goals and the attributes of each data type, categorizing them into groups such as geographical and environmental elements to create a cohesive geographic information database.
(2)
Utilize the information content model (IV) to identify non-landslide units within the study area and randomly select a quantity of non-landslide points equivalent to the number of landslide points inside these units. Integrate the landslide points with the non-landslide points to provide the training sample set necessary for the model.
(3)
Conduct a hazard assessment by partitioning the sample set into a training set and a test set in a 7:3 ratio. Employ the RF, XGBoost, and TabPFN algorithms to model the training set, evaluate the fitting capability and predictive accuracy of the three models, and identify the optimal model to compute the landslide occurrence probability for each grid cell within the study area. Utilize this probability as the landslide hazard index to finalize the hazard assessment.
(4)
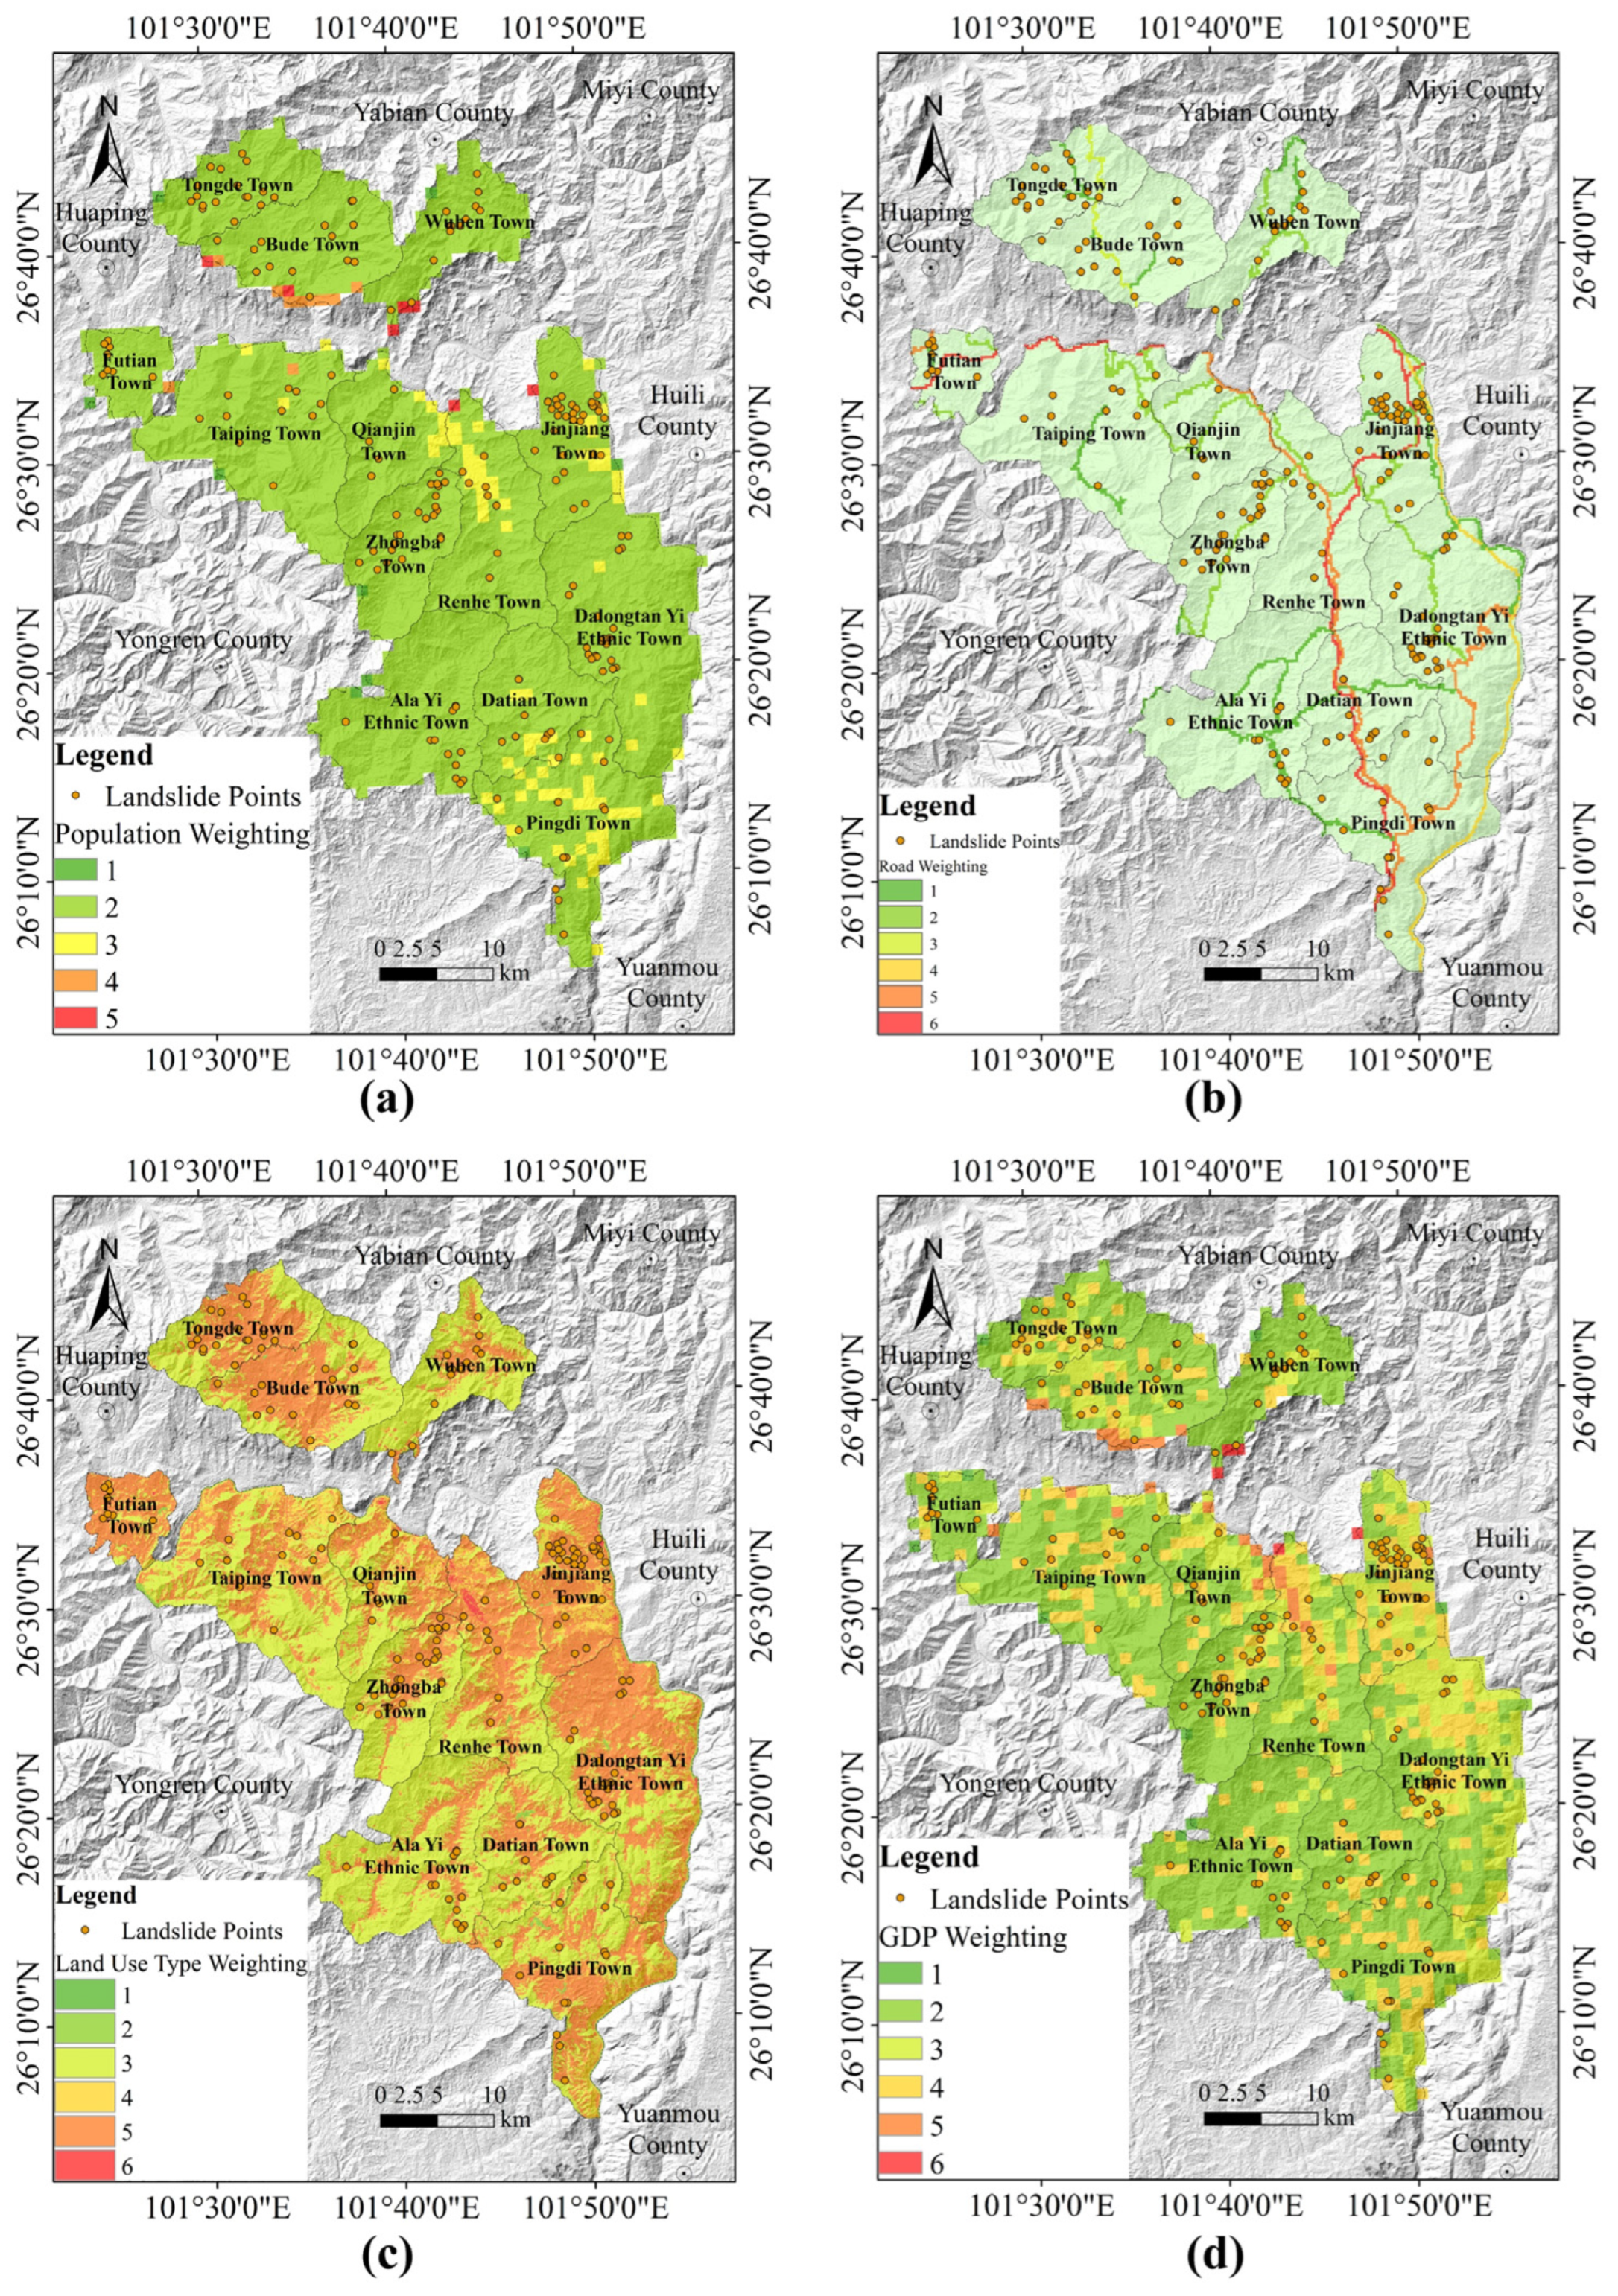
Select representative disaster-prone carriers based on population density, GDP, road type, and land-use type, and develop a vulnerability assessment indicator system. Calculate the weights of each disaster-bearing body utilizing the Analytic Hierarchy Process (AHP) and do a sensitivity analysis. Amend the judgment matrix in accordance with the analysis results. Compute the vulnerability index utilizing the adjusted weights and derive the spatial grading outcomes of vulnerability.
(5)
Combine the landslide hazard index with the vulnerability grade outcomes to produce a landslide hazard risk zoning map, thereby finalizing the regional landslide risk assessment.

3.1. Landslide Hazard Assessment Method

Landslide hazard assessment aims to ascertain the spatial and temporal likelihood of landslides within a designated area, as well as to elucidate their probable propagation processes, magnitude, and impact severity [53]. Varnes [54] characterized landslide hazard as the likelihood of a landslide of a particular magnitude transpiring. According to the Internationally Agreed Glossary of Basic Terms Related to Disaster Management, published by the United Nations, hazard can be interpreted as an analysis of the intensity and probability of landslip hazards occurring in a specific area over a designated timeframe [55].
This study implemented the following stages to perform the hazard assessment:
(1)
Data processing of pertinent evaluation criteria was conducted utilizing QGIS 3.34. Non-landslide units were delineated utilizing the information volume model (IV), and non-landslide points were collected from these units as negative samples. The negative samples were combined with landslide unit samples to create a sample set for the model data.
(2)
Three models were trained based on Python 3.11.11. Both RF and XGBoost employed the grid_search function to explore various hyperparameter combinations in order to identify the ideal parameters and then trained the sample set to derive the final model.
(3)
The data from the research region was input into the optimal model developed to forecast landslide hazard probability, and the outcomes were assessed by generating ROC curves and learning curves.

3.1.1. Information Value (IV) Model

IV is a statistical method, derived from information theory, that quantifies the predictive capacity of environmental factors and has been widely used by many scholars for landslide hazard assessment [13,56,57]. By comparing the spatial distribution of various environmental factors in the identified landslide and non-landslide areas, the model quantifies the predictive ability of each environmental factor. The central idea is to utilize the distribution of past landslides and selected evaluation factors to convert the evaluation factor data in the study area into quantifiable information values, thereby measuring the degree of landslide hazard. A number above 0 signifies that the geological factor facilitates landslides, whereas a value below 0 denotes a restraining influence. The calculation is expressed as follows:
I = i = 1 n I i j = i = 1 n l n N i j / N S i j / S
where I i j is the information value of the j -th level of the i -th evaluation factor, N i j is the number of landslides that occurred at the j -th level of the i -th evaluation factor, N is the total number of landslides in the study area, S i j is the number of grids where landslides occurred at the j -th level of the i -th evaluation factor, and S is the total number of evaluation unit grids in the study area.

3.1.2. Random Forest (RF) Model

RF is a classification and regression algorithm based on ensemble learning [58], which was proposed by Breiman [59]. This is an extension and improvement of the decision-tree model. Traditional decision trees are prone to overfitting. To overcome this problem, RF introduces two key strategies: bagging (bootstrap aggregating) and random feature selection. Bagging creates several training subsets by sampling with replacement, ensuring that each decision tree is trained on distinct data. Random feature selection identifies the ideal split point from m randomly chosen features (m < M, where M is the total number of features in the subset) during node splitting, thereby significantly diminishing model variation through dual randomness [60].
The specific workflow of RF is as follows: First, a random sample of N samples is selected from the training set D using the bootstrap resampling algorithm (bootstrap) as a subset. Second, a decision tree is trained on each subset to obtain K decision trees ( T 1 ( x ) , T 2 x , , T k ( x ) ), during which m features ( m < M , where M is the number of features in the subset) are randomly selected when the node is split, and the feature that maximizes the split is selected. Finally, the RF integrates the prediction results of all decision trees by voting and outputs the classification label to obtain the prediction result, that is,
f x = majority   vote T i x
where m a j o r i t y v o t e is the voting result.
As the number of decision trees escalates, the generalization error of random forests invariably approaches a stable threshold, with the error limit dictated by the classification efficacy of individual trees and the inter-tree connection. Breiman has demonstrated via mathematical derivation that the top limit of a model’s generalization error is positively connected with the correlation among base learners and inversely proportionate to the square of the base learners’ predictive strength [59]. Consequently, random feature selection enhances the classification efficacy of individual trees while reducing the correlation among them, which is crucial for improving accuracy. This process allows the model to sustain high robustness, even in noisy conditions [30].
In comparison to other machine-learning techniques, random forests possess intrinsic anti-overfitting properties and advantages in parallel processing, all while ensuring good predictive accuracy [27,30]. These attributes render them an optimal selection for managing intricate geological situations.

3.1.3. The eXtreme Gradient Boosting (XGBoost) Model

XGBoost is an optimized machine-learning technique founded on gradient-boosted decision trees. XGBoost is very adept at managing extensive, high-dimensional datasets and can markedly enhance training speed using parallel and distributed computing [61]. It exhibits robust predictive skills in classification and regression tasks [62]. XGBoost is widely used in machine-learning contests due to its efficiency and high accuracy, making it the model of choice for numerous problems [63].
The fundamental premise of XGBoost is to build an ensemble of decision trees by incrementally enhancing the errors of preceding tree models. In the boosting process, each subsequent tree rectifies the residuals of its predecessor, and the ultimate prediction of the model is the weighted aggregate of all tree predictions. During training, XGBoost optimizes the objective function, comprising the loss function and regularization terms (L1/L2), to regulate model complexity. It utilizes a greedy technique to determine the ideal tree splitting points, facilitating incremental model optimization [61].
It is worth noting that XGBoost is highly reliant on hyperparameters, and the model’s performance is substantially contingent upon the optimization of these parameters. In many application contexts, significant hyperparameter adjustments are frequently required to achieve optimal model performance [64]. Moreover, being an ensemble learning model, XGBoost inherently has limited interpretability [43].

3.1.4. The Tabular Prior-Data Fitted Network (TabPFN) Model

Tabular data problems represent the predominant category of tasks in machine-learning (ML) applications. TabPFN is specifically designed for classification and regression tasks using small- to medium-sized tabular data, demonstrating remarkable efficacy in certain applications [46]. The model integrates causal reasoning and in-context learning (ICL) to analyze tabular data with exceptional speed and precision. The fundamental concept is to employ the Prior-data Fitted Networks (PFN) framework, producing numerous synthetic datasets and conducting pre-training on these datasets, akin to meta-learning, so as to equip the model with the capability to address diverse tabular data tasks. TabPFN utilizes a transformer model for data encoding and incorporates causal models and Bayesian neural networks (BNNs) as priors to produce synthetic data. Fifty percent of the dataset originates from causal structure data produced by structural causal models (SCMs). At the same time, the other 50% is sourced from functional connection data generated by Bayesian neural networks (BNNs), thus emulating diverse prediction tasks [47]. This process does not rely on traditional hyperparameter tuning and model selection, but instead uses transformers to characterize the dataset and can be learned in a single forward pass through the network without backpropagation [46].
TabPFN overcomes the limitations of conventional table data processing, delivering high-accuracy classification and regression predictions rapidly and without the need for hyperparameter tuning. Its efficiency and minimal tuning requirements provide extensive applicability across several domains, particularly in scenarios involving limited data and intricate features [47].

3.1.5. Evaluation of Model

The true positive rate (TPR) and false positive rate (FPR) of the model can be calculated using a confusion matrix. The ROC curve can then be plotted with the FPR as the abscissa and TPR as the ordinate so that the classification ability and accuracy of the prediction model can be evaluated [65]. Specifically, the ROC curve can visually reflect the accuracy of the RF in identifying high-risk zones (positive class) and low-risk zones (negative class). It can quantify the overall prediction performance of the model by calculating the AUC. The AUC value can be calculated using the following:
A U C = 1 2 i = 1 n F i + 1 F i T i + 1 + T i
where F i is FPR and T i is TPR.

3.2. Landslide Vulnerability Assessment Method

In the context of natural science, vulnerability denotes the extent of loss experienced by disaster-prone entities in a hazard-affected region when confronted with a specific disaster [53]. Disaster-bearing bodies usually refers to the elements directly or indirectly affected by landslides. According to the actual situation in the study area, this paper selected four disaster-bearing bodies: land-use type, GDP, road type, and population density. These elements were assigned hierarchical values.

3.2.1. The Analytic Hierarchy Process (AHP)

The relative importance (i.e., weight values) of the disaster-bearing bodies was calculated using the AHP, which systematizes, models, and quantifies the cognitive decision-making processes of decision-makers in complex systems. It adheres to a logical progression from simplicity to complexity by decomposing a complex system layer-by-layer into manageable components for analysis. This involves the application of a 1–9 scalar method for various programs, utilizing pairwise comparative scoring to establish a judgment matrix and calculating the weight values of different programs, ultimately providing a foundation for final decision-making choices. The consistency of the judgment matrix can be assessed using the following formula:
C I = ( λ max n ) / ( n 1 )
C R = C I / R I
where C I is the consistency index, RI is the random consistency index, and C R is the consistency ratio. When C R < 0.10, it is considered that the inconsistency of the judgment matrix is within an acceptable range, and there is satisfactory consistency. Otherwise, the judgment matrix should be reconstructed, and appropriate corrections should be made.
The vulnerability index is obtained by weighting and superposition of the assigned values and weights of the disaster-bearing bodies; the specific formula is as follows:
V = i = 1 n N i · W i
where V is the vulnerability index, N i is the assigned value of the disaster-bearing body grading, and W i is the weight value of the disaster-bearing body.

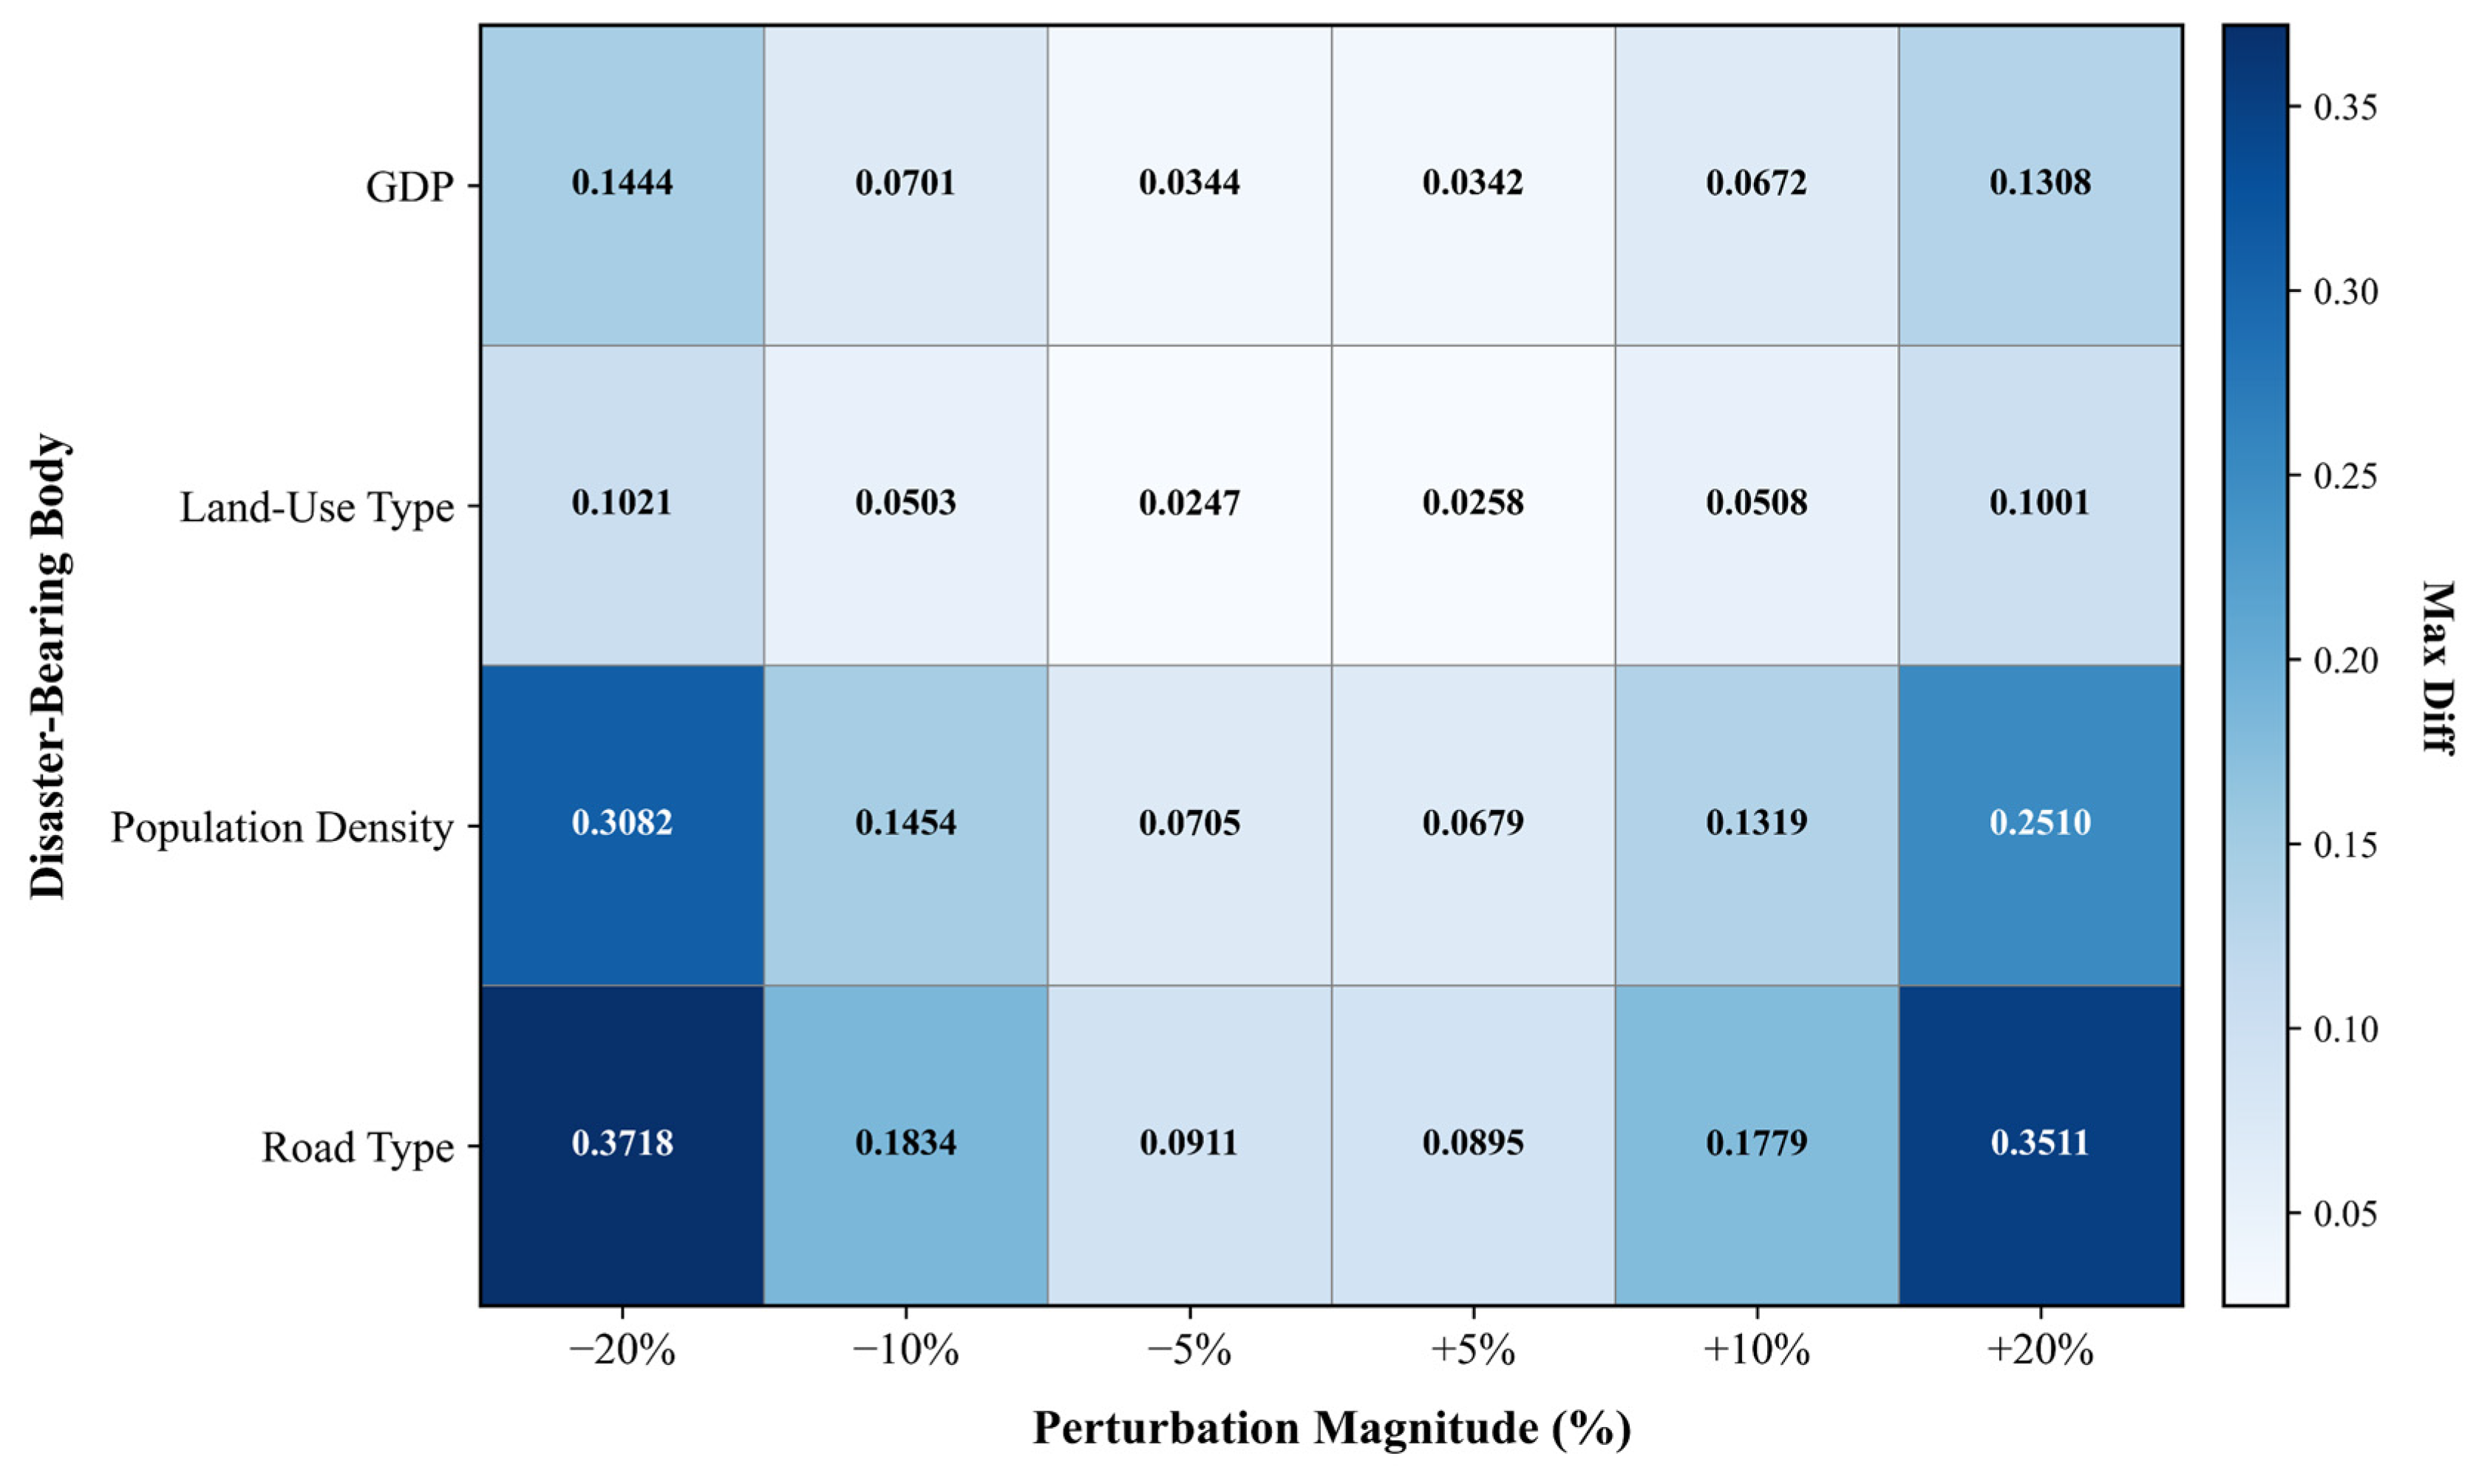
3.2.2. Sensitivity Analysis (SA)

A primary shortcoming of AHP is its pronounced subjectivity. Experts’ assessments may exhibit bias, resulting in inconsistent weight distribution and final outcomes. SA can be utilized to evaluate the influence of variability in expert assessments on the final conclusions, hence improving the reliability of evaluation outcomes [66]. This study utilizes the univariate method to conduct a sensitivity analysis of the computational outcomes of AHP.
The univariate method, also known as the one-at-a-time (OAT) method, involves altering the parameters of a single variable sequentially to assess the model’s stability [67]. This method can ascertain the direct influence of each variable on the vulnerability index. In this study, the weight of a single element is modified sequentially. Minor perturbations (±5%, ±10%, and ±20%) are introduced to the weights of each factor, and the vulnerability index V is computed subsequent to the perturbation. The perturbation values are subsequently compared to the original V baseline values to determine the difference, thus assessing the sensitivity of each factor.

3.3. Landslide Risk-Assessment Method

According to the United Nations definition of geological disaster risk [54], landslide risk can be understood as the possibility of a landslide geological disaster causing losses to human life and property, economic activities, etc., within a certain regional and temporal limit. It involves assessing the probability of a landslide occurring and the damage it may cause to the area.
This study employed the risk grading matrix outlined in the recent national industry standard “ Specification of geological hazard risk survey and assessment (1:50,000)” (DZ/T 0438-2023) [68], promulgated by the Ministry of Natural Resources of China and effective from 1 August 2023, to ensure that landslide risk-assessment results are scientifically robust and standardized, thereby providing a reliable reference for local governments’ landslide prevention and control initiatives (Table 1). Employing this matrix analysis technique, the landslide hazard zoning map and vulnerability zoning map were superimposed and amalgamated, leading to a systematic evaluation of landslide hazards in the research region based on risk classification standards.

4. Results

4.1. Results of Landslide Hazard Assessment

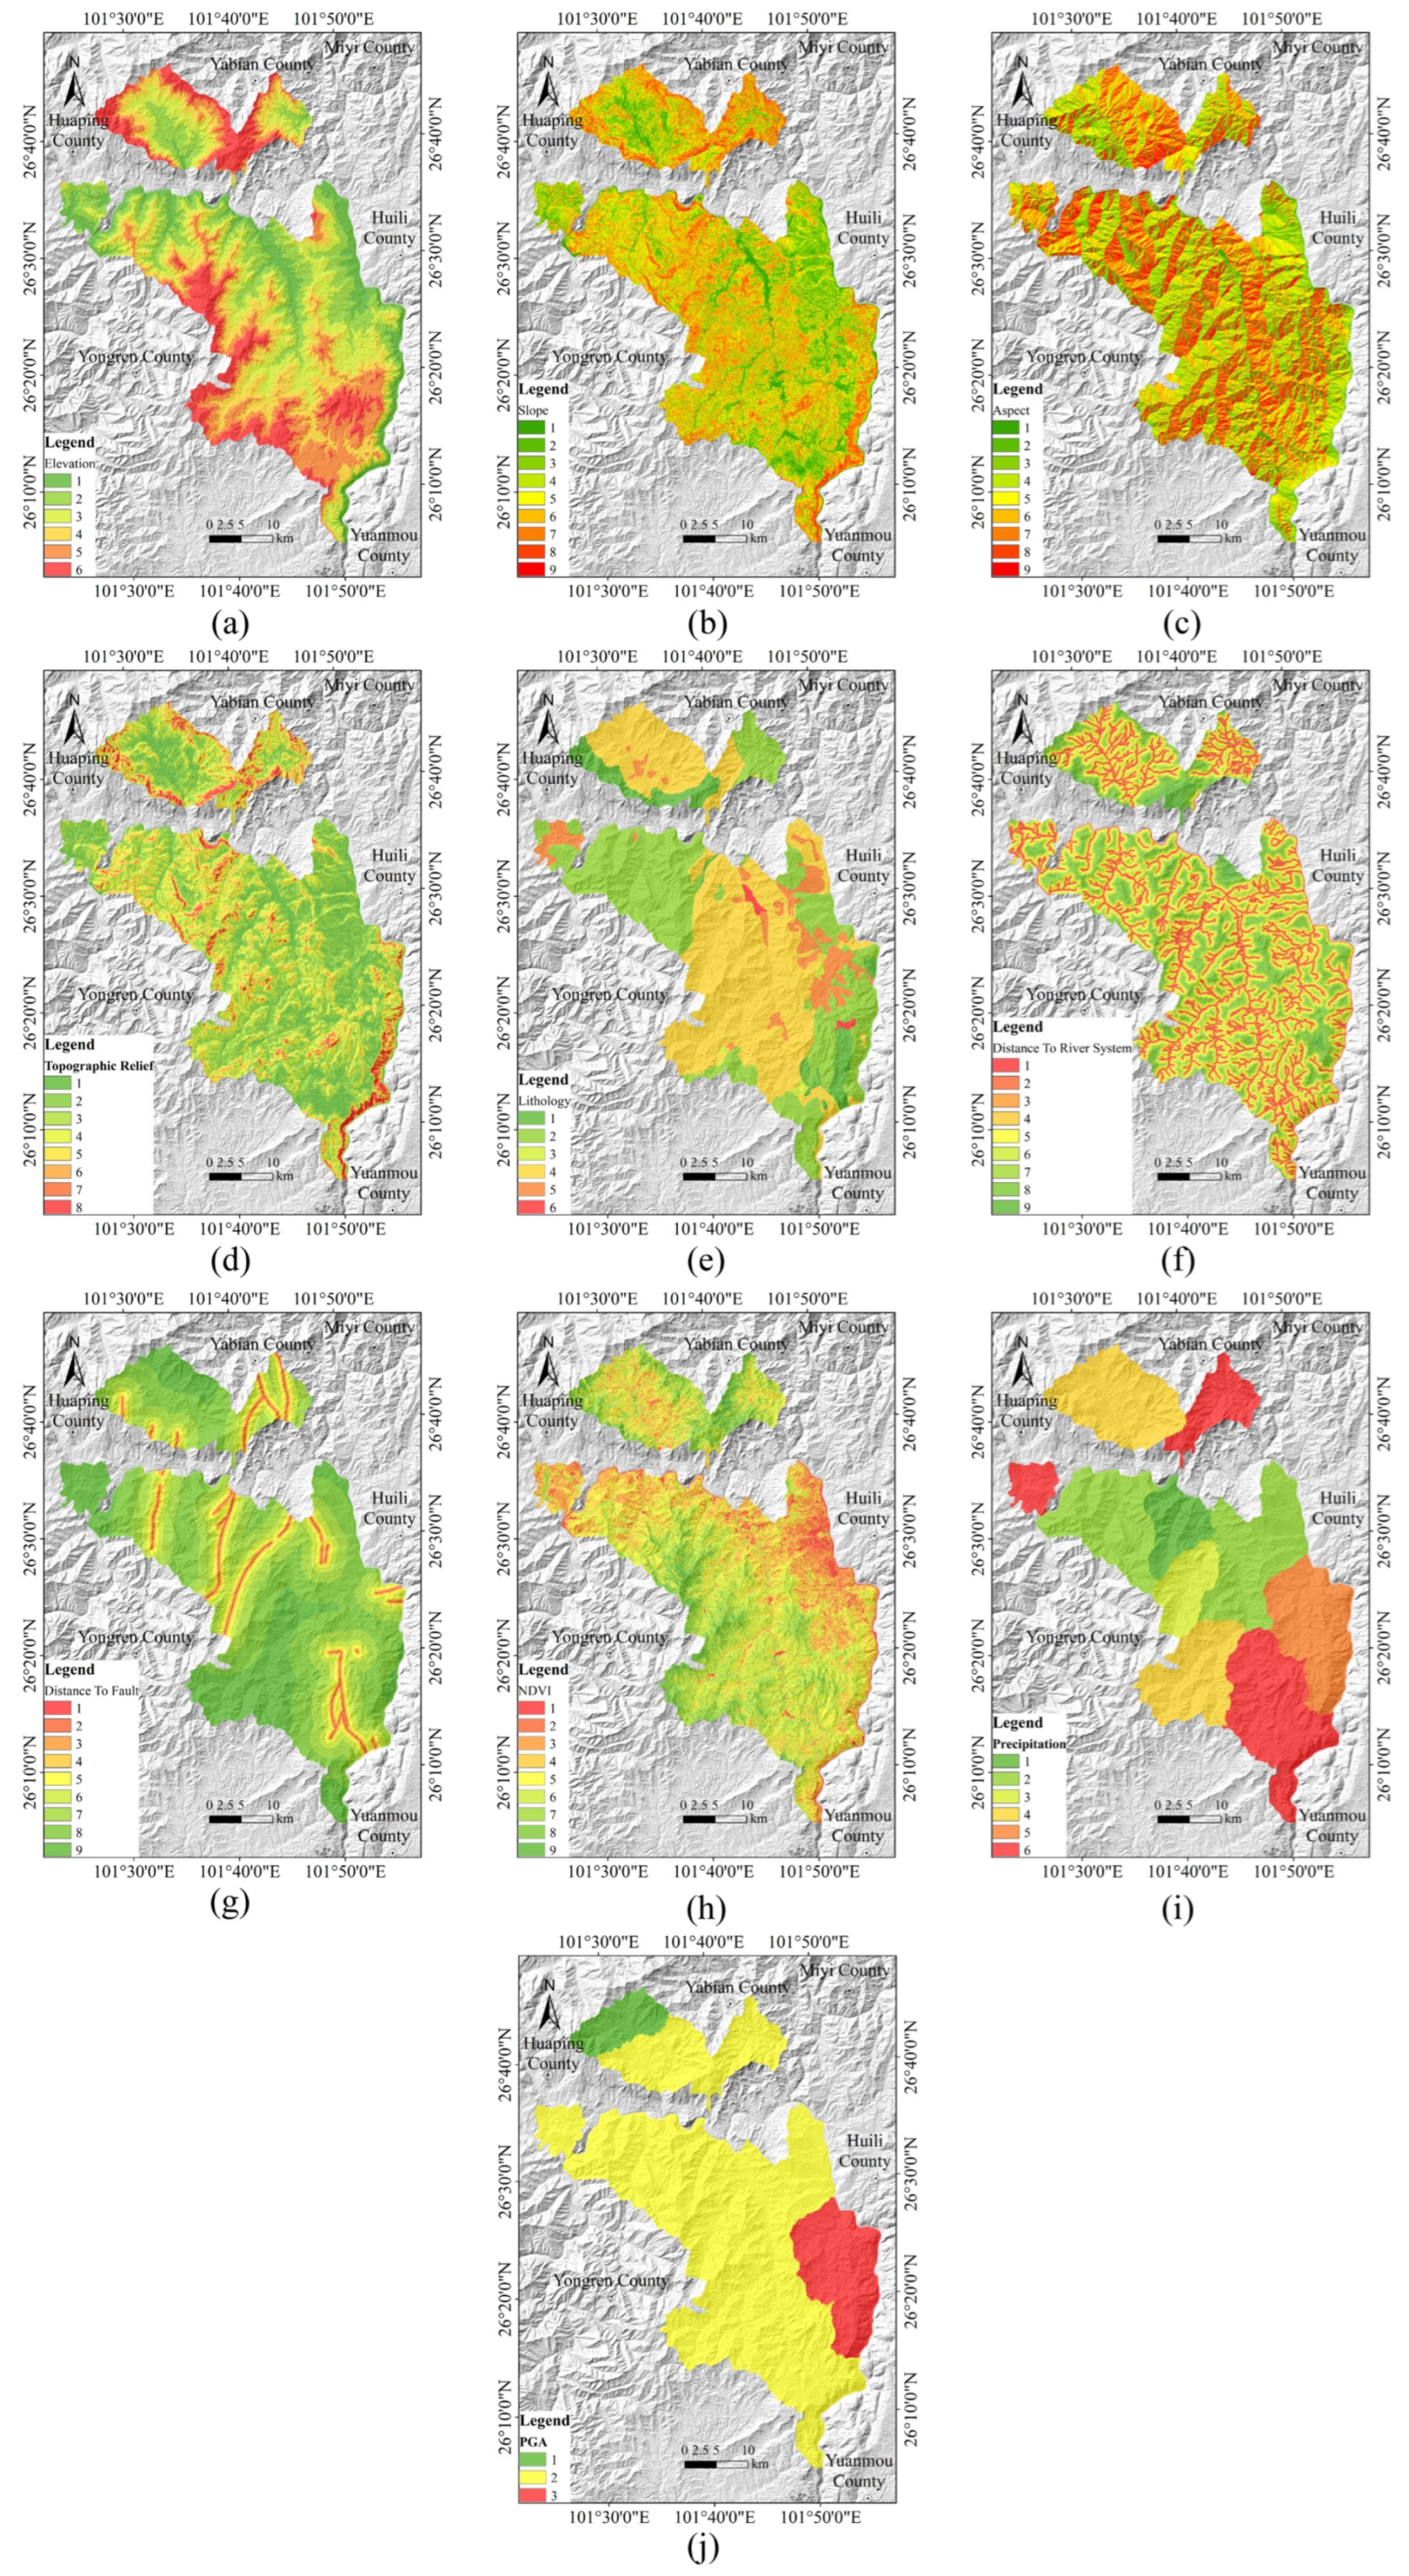
4.1.1. Selection and Grading of Evaluation Factors

Landslide disasters typically result from the combined influence of conditioning and triggering factors [69,70,71]. The role of each factor varies and is complex in different regional geological settings. A precise selection of appropriate evaluation factors can enhance both the efficiency of the assessment process and the accuracy of the final results [72].
Based on the data obtained from the geological disaster investigation in the Renhe District, this study comprehensively analyzed the regional geological environment conditions and geological disaster-pregnant factors. Drawing upon existing data and relevant previous research [15,73,74], ten evaluation factors were selected to establish the landslide hazard assessment indicator system: elevation, slope, aspect, topographic relief, lithology, distance to river system, distance to fault, NDVI, 24 h maximum precipitation, and PGA.
Alongside the fundamental, persistently stable geological conditions, both the NDVI and the 24 h maximum precipitation data are sourced from 2020. The 24 h maximum precipitation was chosen as the rainfall factor due to its efficacy in demonstrating the influence of rainfall on geological disasters. We gathered three categories of precipitation data from 2013 to 2020: annual precipitation, monthly average precipitation, and 24 h maximum precipitation. Statistical investigation indicated that annual precipitation exhibits a negligible link with the likelihood of geological disasters, and variations in monthly average precipitation do not correspondingly affect the distribution of geological disaster locations. The 24 h maximum precipitation has a robust linear positive association with the incidence of geological disasters. This suggests that intense rainfall over a 24 h duration more accurately represents the immediate influence of precipitation on the incidence of geological disasters.
Combining the actual development of the landslide disaster in the study area, all factors were assigned a graded value to facilitate data processing. The results of the evaluation factor grading and information value characteristic curve are shown in Figure 3 and Figure 4.

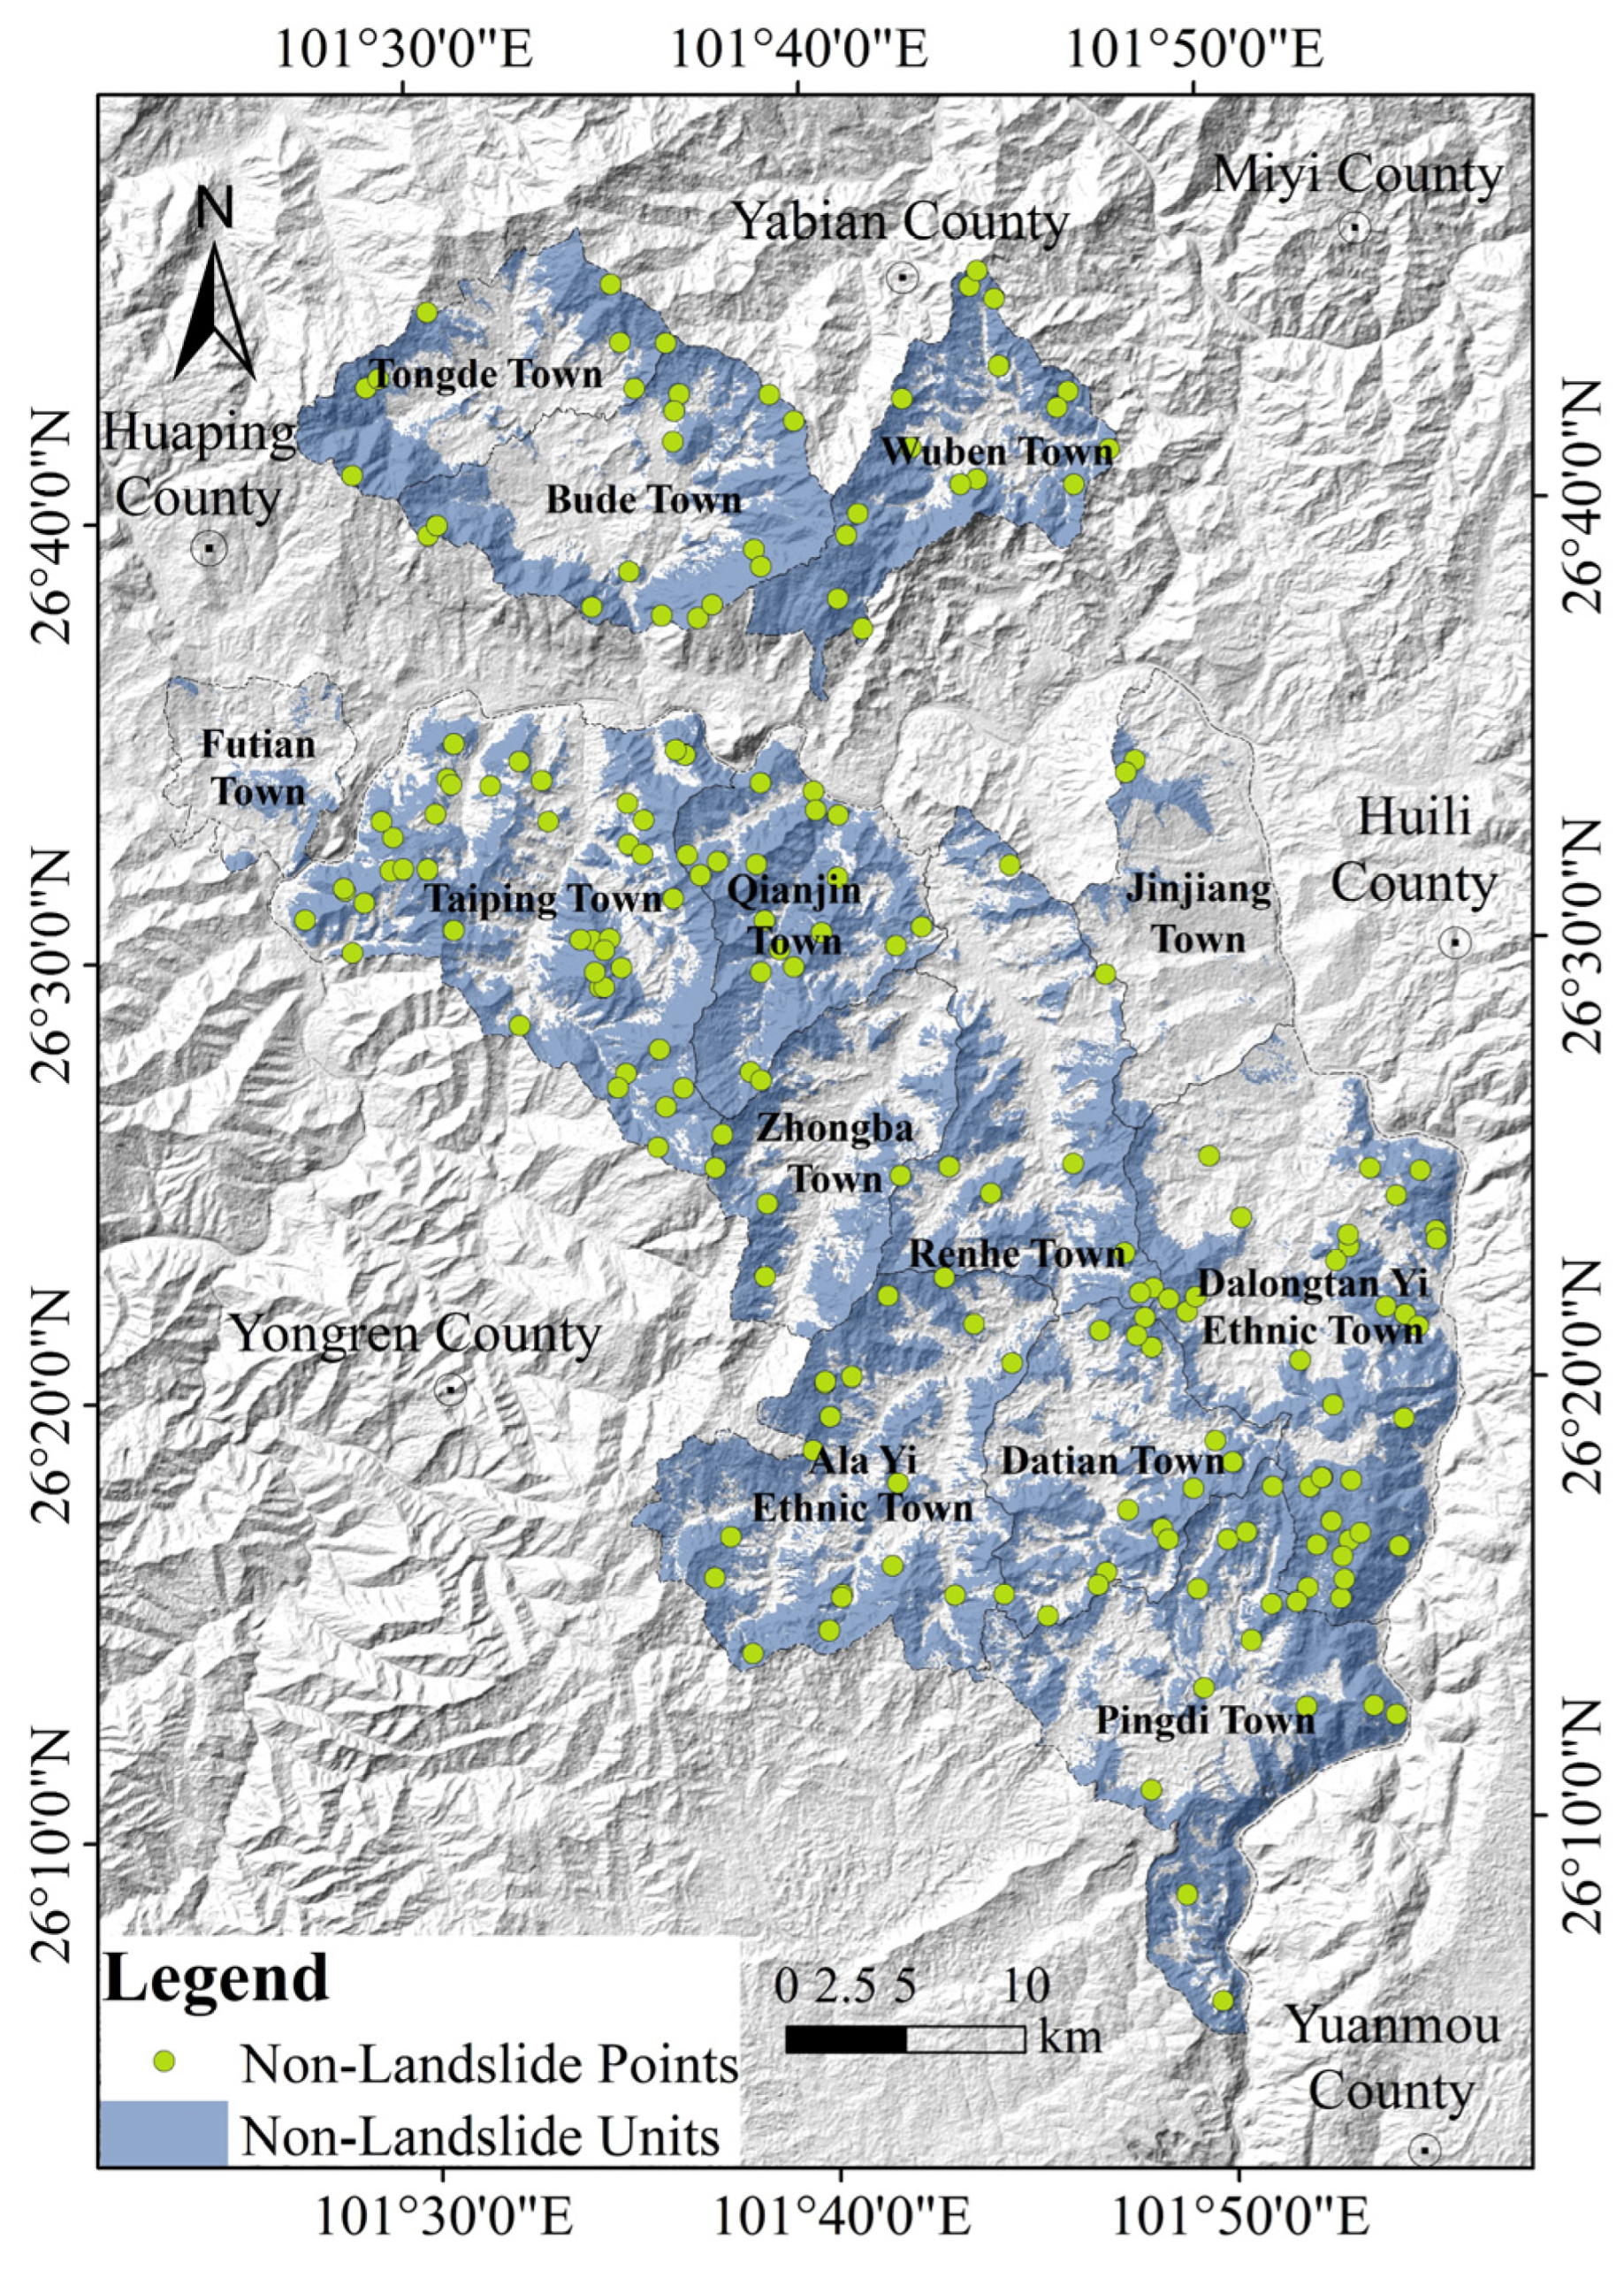
4.1.2. Determination of Non-Landslide Units

The choice of training samples has a significant impact on the accuracy of the trained model in machine learning [75]. The training samples for landslide geological disaster hazard assessment are derived from a combination of positive and negative samples. Currently, the primary methods for selecting non-landslide units are random sampling [76], buffer sampling [29], and coupled quantitative models [77,78]. Among these, the coupled quantitative model method, which enhances the accuracy of the model, utilizes quantitative mathematical and statistical models to calculate landslide-prone areas and randomly selects non-landslide units within the low-prone areas.
This paper comprehensively studies the scale and distribution of landslide disasters in the study area. The IV model was used to obtain the non-landslide units in the study area. The specific plan is to calculate the information values for different grading intervals of the evaluation factors in the Renhe District using the IV model (Table 2) and evaluate the landslide susceptibility of the study area.
According to pertinent studies [79], the information content was classified into four categories: low, medium, high, and extremely high, using the natural breakpoint method. Areas with low and medium information values were considered non-landslide units, generating 190 non-landslide sample points equal to the number of landslide points (Figure 5).

4.1.3. Model Training

This work develops a landslide hazard prediction model by integrating non-landslide and landslide point samples collected by the previously outlined approaches to create a comprehensive point dataset. Utilizing QGIS 3.34, we extracted the classification grade data for all assessment parameters and incorporated this information into the aggregated point dataset as input for model training. In Python 3.11.11, we accessed the integrated point file, examined the properties of each feature, retrieved the data, and placed it in a Pandas DataFrame for subsequent processing. We established the random seed at random_state = 100 and thereafter partitioned the sample set into training and testing sets in a 7:3 ratio.
Grid search with 10-fold cross-validation was employed to optimize the parameters of the RF and XGBoost models, identifying the ideal hyperparameters to enhance each model’s generalization capacity (Table 3 and Table 4). The model was retrained with the optimal parameter combination, and predictions were generated on the test set, producing anticipated category probabilities. The TabPFN model utilizes a TabPFNClassifier constructed on PyTorch (version 2.5.1, CPU build). This model is pre-trained with existing knowledge. Hence, no parameter tuning is necessary during application.

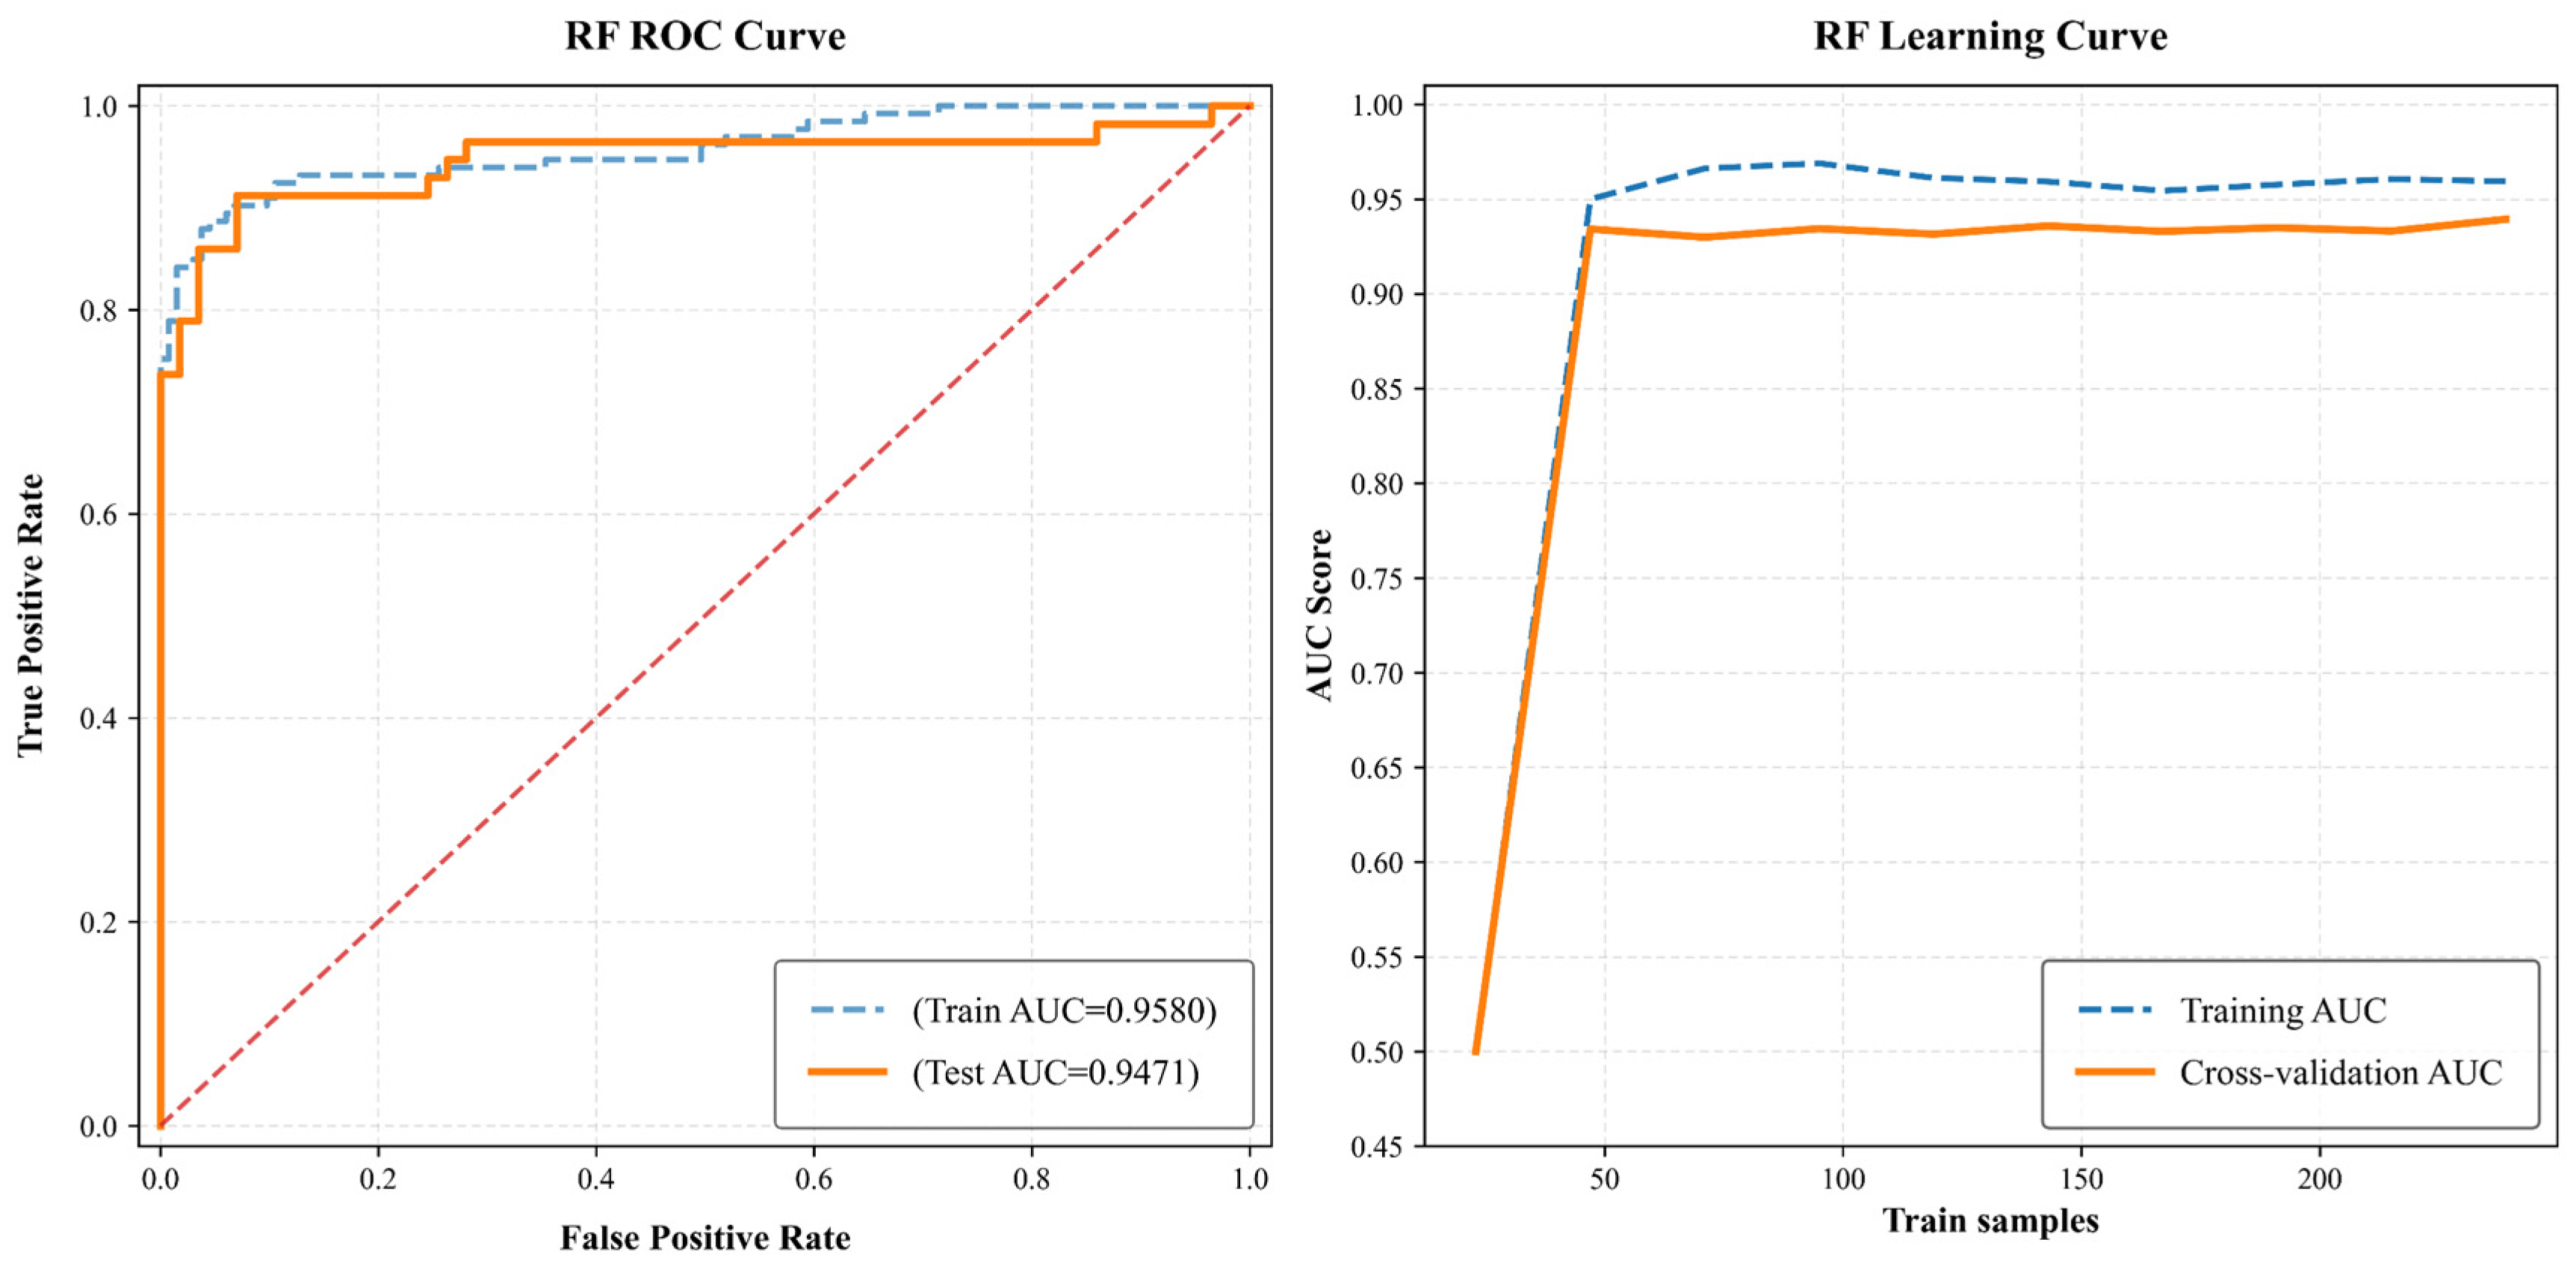
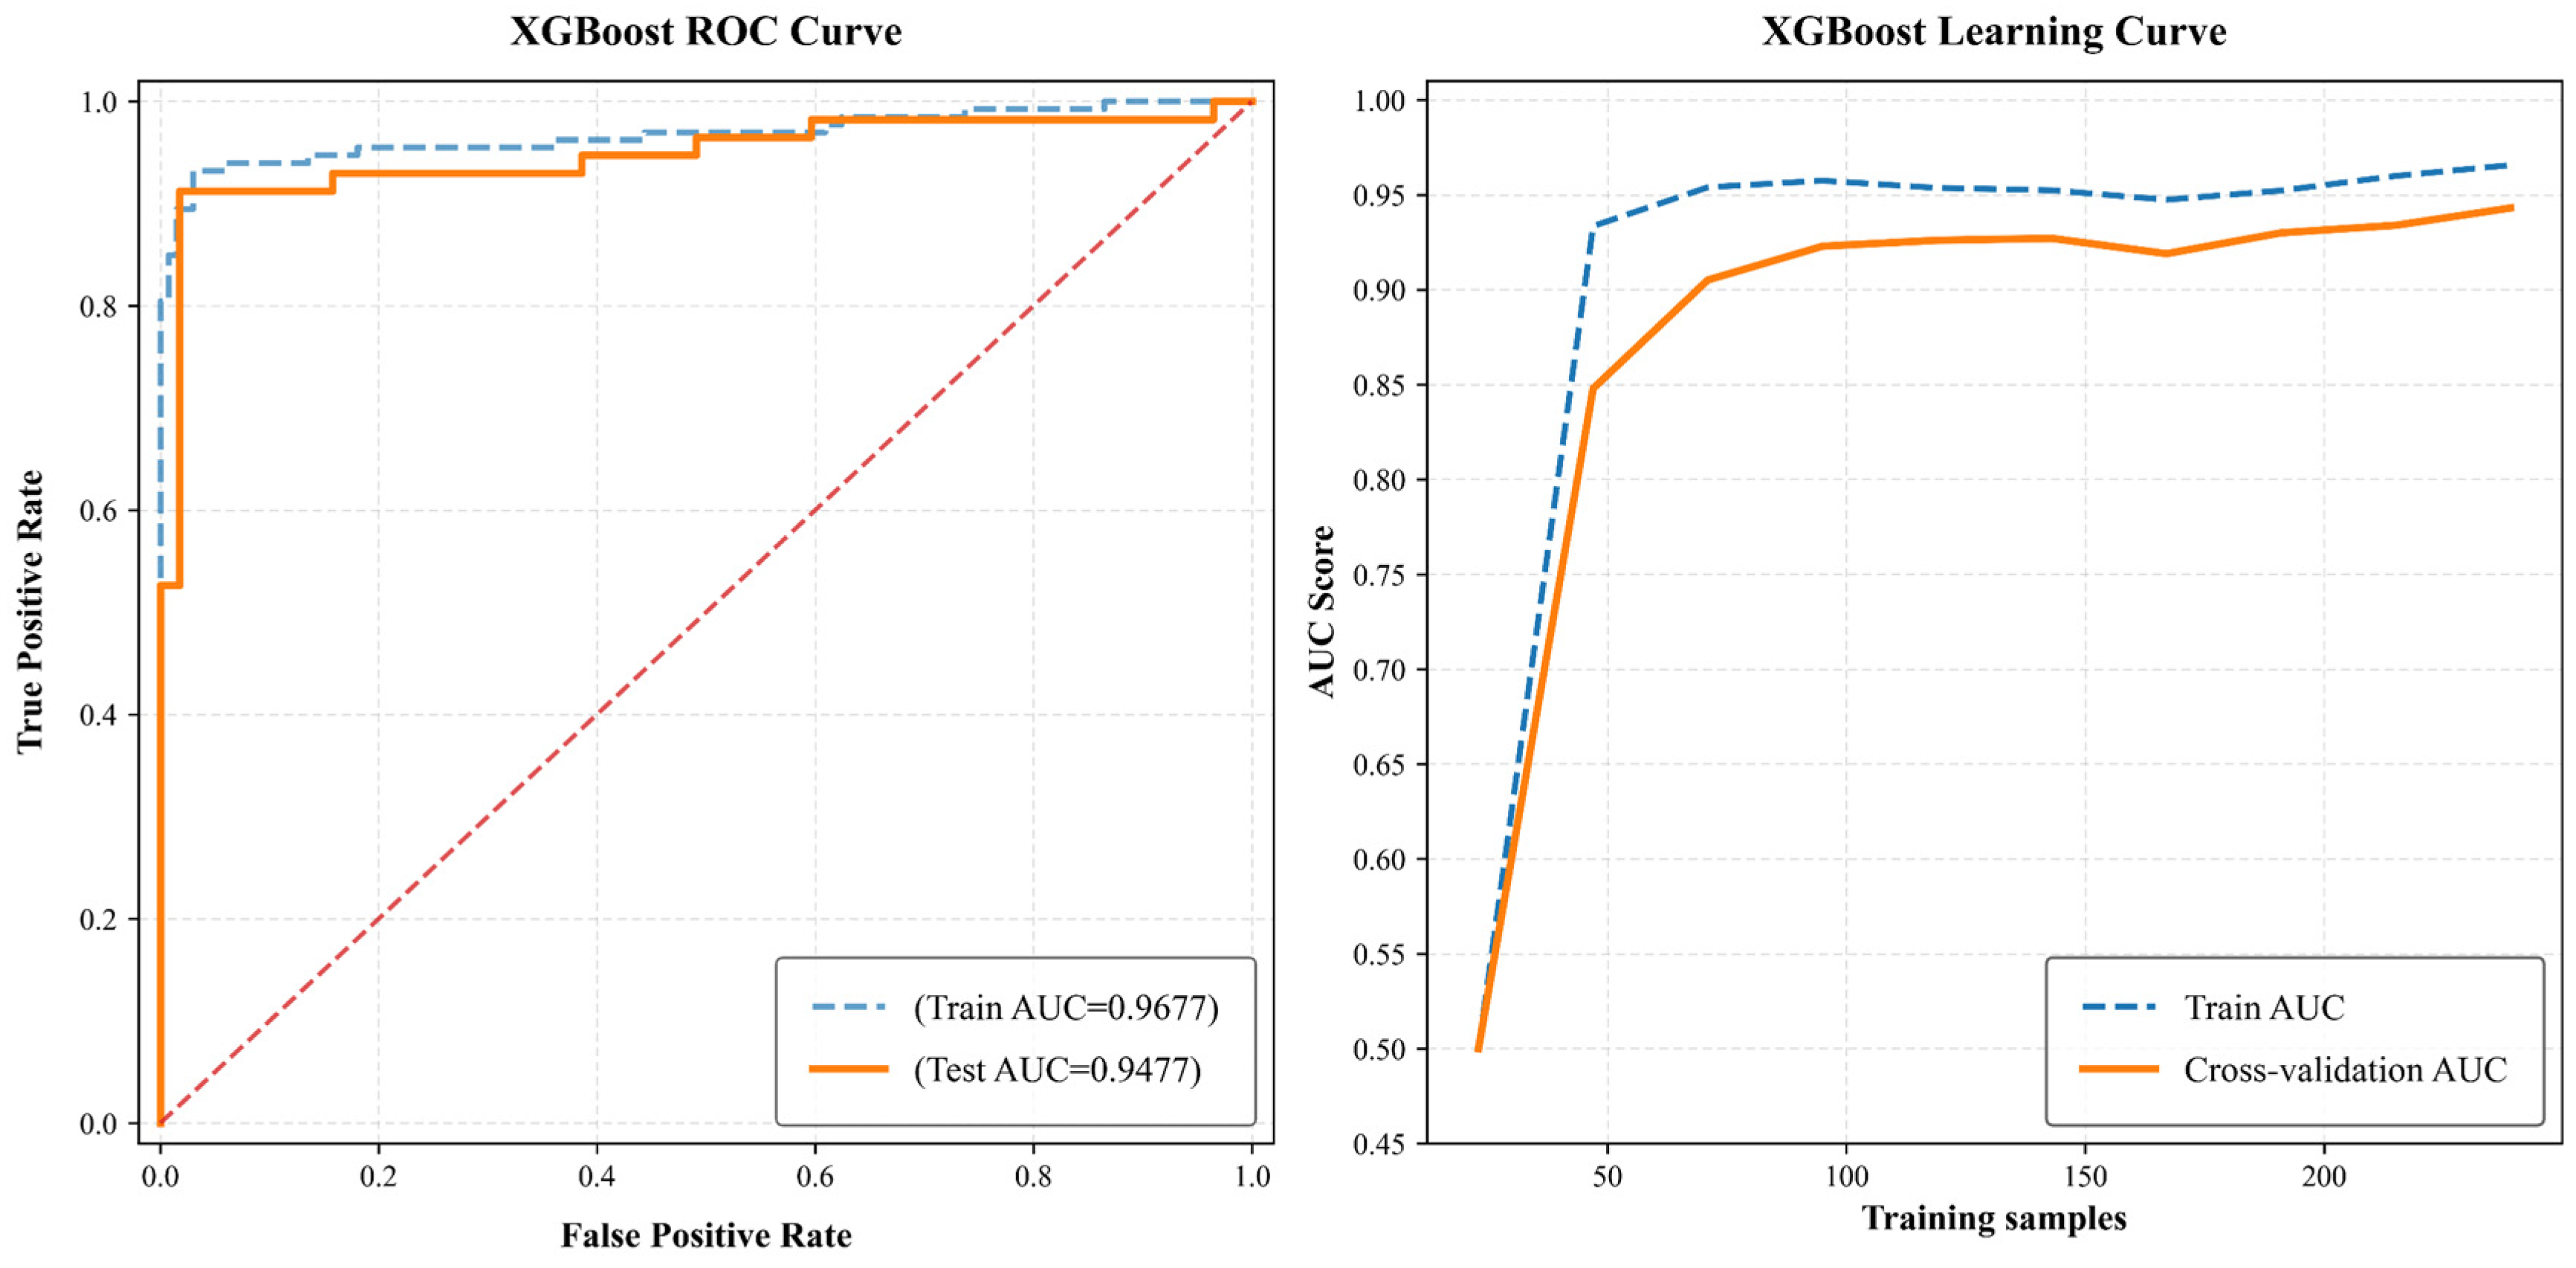
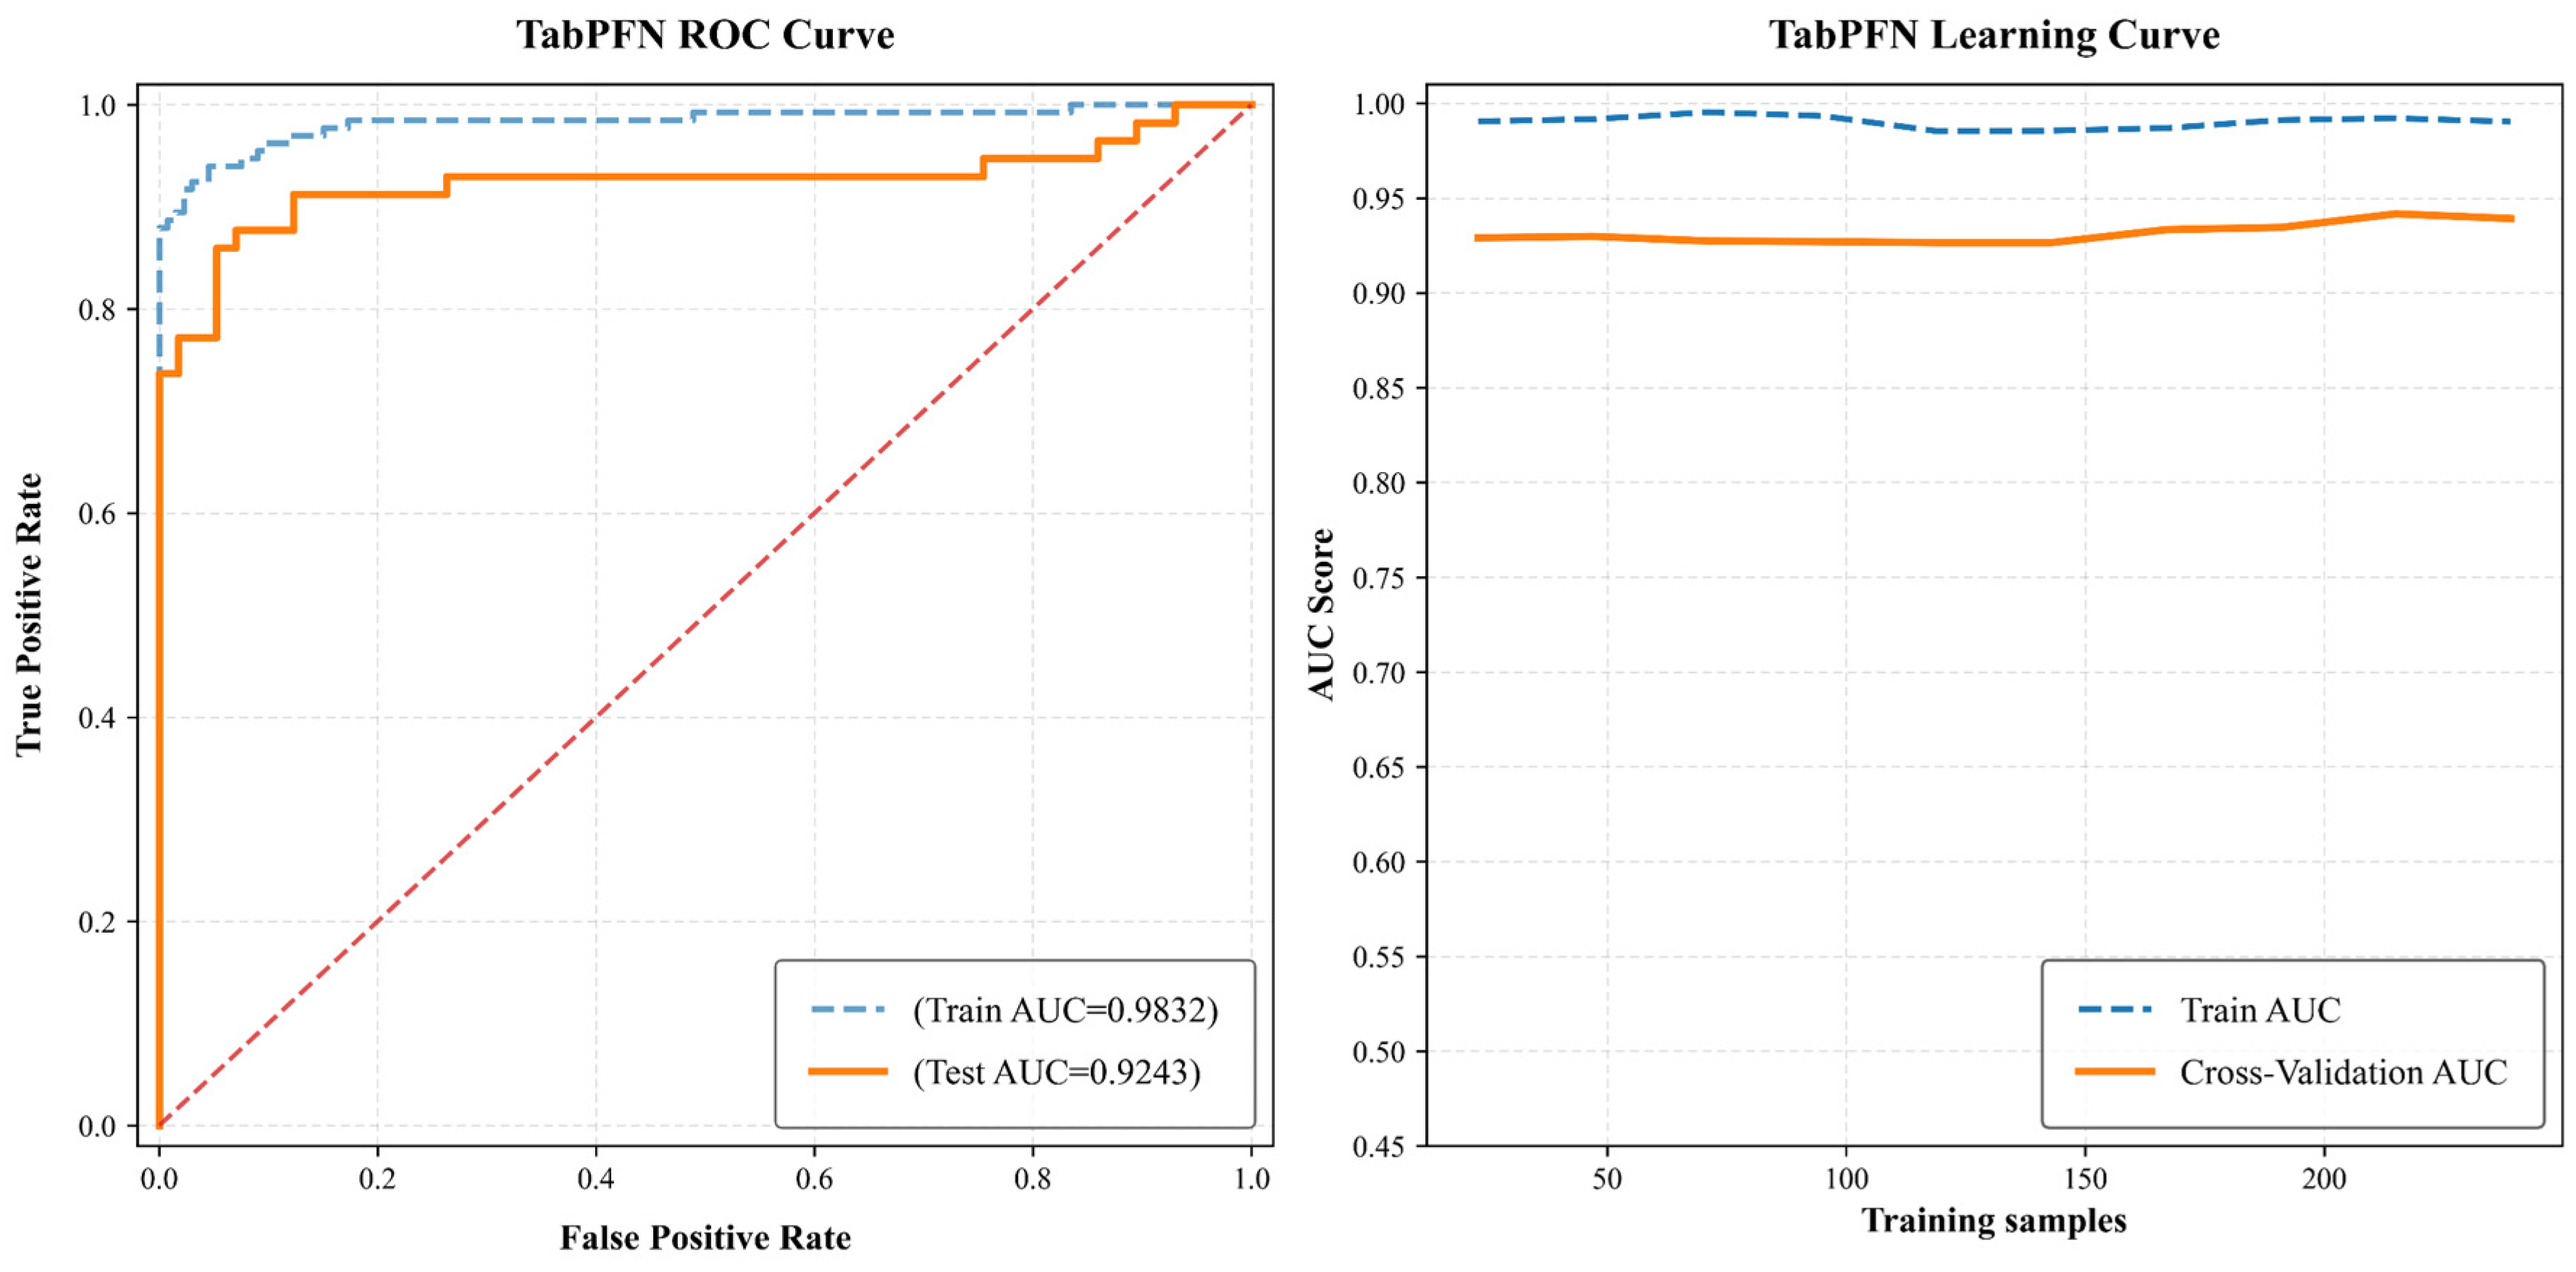
4.1.4. Evaluation of the Accuracy and Analysis of the Results

The predictive performance of the coupled model was analyzed using ROC analysis, with the ROC curve generated in Python. The AUC value ranged from 0.5 to 1. It is generally considered that when the AUC value is greater than 0.9, the model has extremely high predictive accuracy [53].
To assess the comprehensive performance of a model, it is essential to examine the AUC value alongside an analysis of potential overfitting. Overfitting occurs when a model captures not only the relevant information in the data but also the noise, resulting in suboptimal performance on new data and complicating the interpretation of the relationships acquired by the model [80]. Overfitting usually occurs when a model excels on training data but performs markedly poorly on unseen data (test data) [81]. Techniques for assessing overfitting involve analyzing the AUC disparity between the training and test sets, as well as graphing a learning curve to evaluate the model’s performance on both the training and cross-validation sets [80,81]. If the model exhibits a markedly superior performance on the training set compared to the cross-validation set, and this disparity is considerable, then an AUC difference of more than 0.05 often suggests potential overfitting of the model.
Figure 6, Figure 7 and Figure 8 illustrate the ROC curves and learning curves of the three models, where the red diagonal line indicates the baseline performance of a random classifier (AUC = 0.5). The AUC values for RF on the training and test sets are 0.9580 and 0.9471, respectively, with a difference of 0.0109, suggesting that the training and test data exhibit relative balance and no overfitting has transpired. The learning curves indicate that as the quantity of training samples rises, the AUC values for both the training set and cross-validation set remain consistent, signifying robust generalization capability. The disparity between the two AUC values remains under 0.05 as the quantity of training data grows, signifying the absence of overfitting. XGBoost has AUC values of 0.9677 for the training set and 0.9477 for the test set. The disparity between the AUC values is 0.0200, marginally exceeding that of RF, while the overall performance remains balanced, exhibiting no overfitting. The learning curve reveals that as the quantity of training samples rises, both the training and test AUC progressively enhance while the disparity remains consistent, signifying the absence of overfitting and robust generalization capabilities. TabPFN attains an AUC of 0.9832 on the training set and 0.9243 on the test set, with a difference of 0.0589, surpassing the 0.05 threshold for overfitting, indicating substantial overfitting. Despite the ongoing enhancement of the training AUC, the test set AUC exhibits minimal progress, signifying inadequate adaptability to novel data. This may pertain to the attributes of TabPFN as a pre-trained model.
Overall, both XGBoost and RF demonstrated strong generalization capabilities. While XGBoost’s AUC value was only 0.0006 higher than RF’s, RF exhibited better overfitting control. Therefore, we conclude that RF offers the best overall performance. In contrast, TabPFN exhibits significant overfitting issues and may face significant performance challenges in practical applications. Therefore, RF was selected as the optimal model for drawing landslide hazard zoning maps.
Subsequent to the successful training of the model, we produced a 30 m × 30 m fishnet grid encompassing the whole study region. For each grid point, the classification levels of the assessment factors presented in Table 1 were retrieved and assembled into a CSV dataset. The dataset was subsequently entered into the trained random forest model to compute the probability of landslide occurrence for each grid cell. The output likelihood was utilized as the landslide danger index, which was then employed to create the hazard zoning map depicted in Figure 9.
The hazard index calculated for each grid cell by the random forest model was imported into the corresponding grid, categorizing the hazard into four intervals: non-hazard, low-hazard, medium-hazard, and high-hazard zones, using the natural breakpoint method. The final result was a landslide hazard zoning map of the Renhe District (Figure 9). It can be seen that the high-hazard zones are more obviously affected by the mainstream of the Jinsha River, and are mainly distributed in a strip-like pattern near the airport in Jingang Town, the banks of the river, and Pingdi Town; the distribution of the medium-hazard zones is almost the same as that of the high-hazard zones, but it is slightly further away from the river and residential areas; the low-hazard zones are mainly distributed in Taiping Town, Qianjin Town, and Pingdi Town; the non-hazard zones are mainly distributed in Qianjin Town, Wuben Town, Taiping Town, Dalongtan Yi Ethnic Town, and Ala Yi Ethnic Town, which are farther away from the river.

4.2. Results of Landslide Vulnerability Assessment

The vulnerability classification maps (Figure 10) for the four disaster-bearing bodies—land-use types, GDP, route types, and population density—were created by assigning graded values, as per Table 5. A judgment matrix for each body was constructed using the AHP to ascertain the relative significance of the disaster-bearing bodies (Table 5). The eigenvector λ and the maximum eigenvalue λ m a x = 4.0104 were calculated using the eigenvalue method. The derived eigenvectors were then standardized and normalized to produce the weight vector W for each disaster-bearing body (Table 6). Given that the judgment matrix is of order n = 4 , the random consistency index ( R I = 0.89 ) was selected from standard reference tables. According to Equations (4) and (5), C I = 0.0035 and C R = 0.0038 were calculated, indicating that the judgment matrix has good consistency ( C R < 0.1 ), allowing for further calculations and confirming its suitability for subsequent analyses and decision-making processes.
After calculating the weights of the disaster-bearing bodies, sensitivity analysis was conducted using the univariate method to assess the impact and uncertainty of changes in the weights of disaster-prone entities on the vulnerability index. By varying the initial weights derived from the AHP by ±5%, ±10%, and ±20%, the resultant alterations in the vulnerability index V were computed using Equation (6). The differences attributable to changes in each element were evaluated by comparing these alterations with the baseline vulnerability index. This assesses the responsiveness of each element to the vulnerability index. The extent of the alterations is quantified by the maximum difference (max diff) and illustrated using a heat map (Figure 11). The figure illustrates that road type has the greatest sensitivity to fluctuations in the vulnerability index, evidenced by the highest maximum difference of 0.3718 under a ±20% perturbation. This signifies that route type substantially influences the vulnerability index. Subsequently, population density demonstrates substantial fluctuations, especially in the negative realm (−20%), with the maximum difference reaching 0.3082, signifying considerable alterations in the vulnerability index. The alterations in GDP and land-use type are rather minor, exerting no impact on the vulnerability score and demonstrating no substantial sensitivity.
The findings derived from the univariate method markedly diverge from the starting weights established by AHP. The judgment matrices were modified according to the influence of each component on alterations in vulnerability (max diff). Factors with greater max diff values were assigned more relative significance within the matrix. Table 7 displays the modified judgment matrix and corresponding weight values. The consistency ratio (CR) of the updated matrix is 0.013, which is less than 0.1, signifying that the consistency test has been successfully passed.
To obtain the vulnerability index for the study area, the graded values assigned to each factor in Table 3 for vulnerability assessment can be weighted and superimposed according to Equation (6), using the weight values of each factor in Table 5. On this basis, the vulnerability index can be further divided into four intervals: non-, low-, medium-, and high-vulnerability zones using the natural break method.
In summary, this study ultimately produced a vulnerability assessment zoning map of the Renhe District (Figure 12). It can be seen that non-vulnerability zones are predominantly distributed in the remote and scattered Yi households and vast non-populated areas of the Renhe District; low-vulnerability zones are primarily found in the populated areas of various towns and rural towns; medium-vulnerability zones are mainly located in areas characterized by intensive human engineering activities, such as railway stations, airports, and certain tourist attractions, necessitating attention and enhanced preventive measures; and high-vulnerability zones are primarily aligned along both sides of roads, indicating the disruptive influence of human engineering on the original geological conditions, thereby necessitating enhanced priority protection actions.

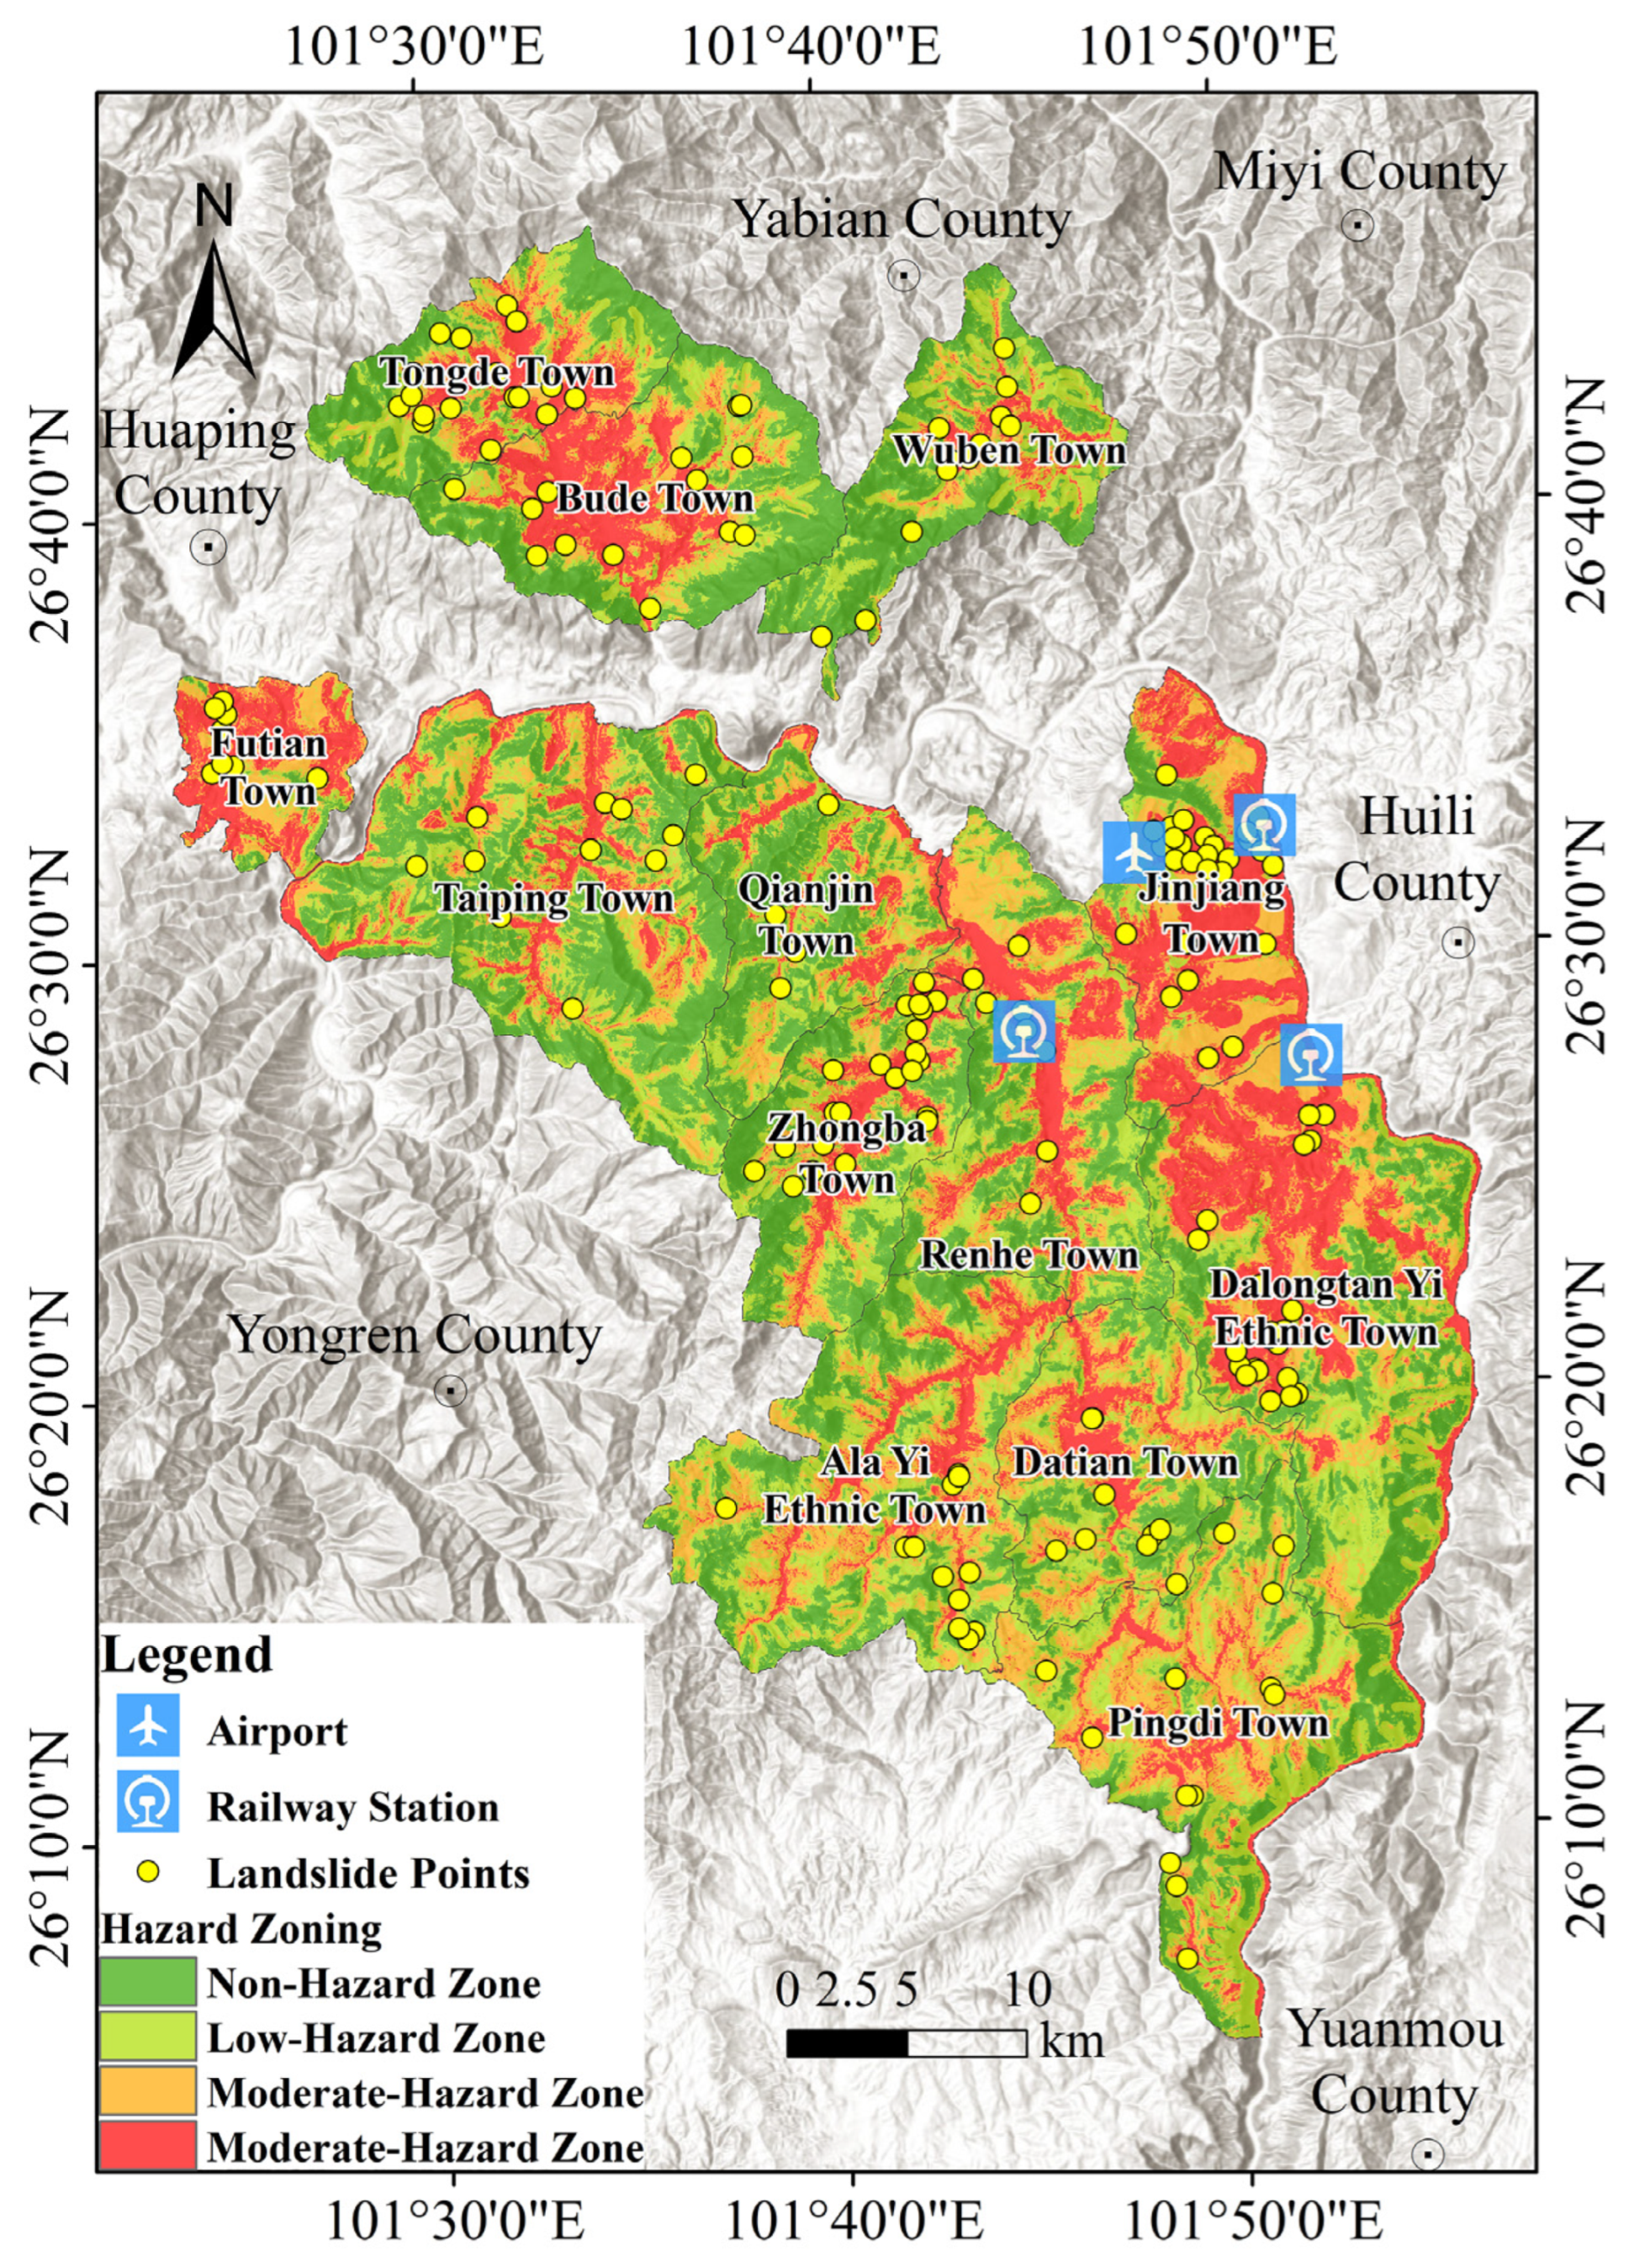
4.3. Results of Landslide Risk Assessment

The landslide hazard zoning map shown in Figure 9 and the vulnerability assessment zoning map shown in Figure 12 were overlaid and fused according to the risk-level division matrix shown in Table 1 and reclassified into four categories: non-, low-, medium-, and high-risk zones. Finally, the landslide disaster risk zoning map of the Renhe District was obtained (Figure 13).
The zoning results were analyzed and statistically compiled, with the area of each risk zone presented in Table 8. It can be seen from the risk zoning map that the high-risk zones include 2.08% of the research area, predominantly located in Renhe Town, Jinjiang Town, Pingdi Town, and surrounding regions. These regions encompass numerous critical infrastructure facilities, including three railway stations, and require prioritized attention to enhance security measures. The medium-risk zone encompasses 34.23% of the entire land, predominantly located in Jinjiang Town, Dalongtan Yi Autonomous Town, Renhe Town, Tongde Town, Pingdi Town, and Budu Town. Low- and non-risk zones are mainly distributed in areas with high mountains and steep slopes, low mountains and flat dams, and alluvial valleys with low human activity, such as Taiping Town and Ala Yi Ethnic Town.

5. Discussion

5.1. Model Selection

In the research conducted by Hollmann et al. [47], TabPFN demonstrated superior classification prediction ability compared to tree-based models, including XGBoost and RF. However, when comparing the performance of RF, XGBoost, and TabPFN in evaluating landslide hazards, RF and XGBoost demonstrated superior results. This may be attributed to the fact that TabPFN uses synthetic data for pre-training, making it a model that leverages prior knowledge, enabling it to quickly compute the posterior probability distribution for specific tasks during deployment. This process’s advantage lies in its rapid adaptability to various tasks; yet its dependence on synthetic data may compromise its efficacy in particular domains. This is particularly applicable in geological landslide assessment, where there may be an insufficiency of domain-specific data. The intricate and specialized nature of data pertaining to geological disasters may hinder comprehensive representation through synthetic data derived from prior pre-training, thereby constraining the generalization capacity of the data produced by TabPFN in accurately depicting the actual geological environment, ultimately resulting in overfitting.
Nonetheless, the AUC value of TabPFN attained 0.9243 in this study. In situations where acquiring extensive labeled data is expensive and swift responses are essential, such as in real-time decision support systems, TabPFN, with its rapid and efficient predictive capabilities, can deliver precise predictions promptly to facilitate decision-making. This is essential for devising rescue strategies and mitigating damages. In the future, incorporating more geologically relevant data during the pre-training process could enhance TabPFN’s adaptability and prediction accuracy, enabling it to perform even more effectively in geological disaster prediction tasks.

5.2. Vulnerability Assessment Methods

Vulnerability assessment is an important component of risk assessment [82]. Numerous studies merely employed a simple linear aggregation of various vulnerability factors, neglecting the nonlinear correlations and disparities in relative significance among indicators [10,12,31]. This simplified approach often results in deviations between analytical outcomes and real-world conditions. This work presents the AHP and integrates expert experience to enhance the assessment of the relative significance of disaster-prone entities, addressing the issue of arbitrary indicator weighting and so facilitating a more precise calculation of the vulnerability index. Nevertheless, given that the formulation of the judgment matrix is predominantly dependent on expert expertise, it is vulnerable to cognitive bias, necessitating a sensitivity analysis of the results.
Table 9 presents a comparison of expert weight rankings and sensitivity rankings, along with a list of causes for the discrepancy observed. Discrepancies were identified in the other three disaster-bearing bodies, except for land-use types, where the weight assessments aligned with the sensitivity analysis.

5.3. Contributions and Shortcomings

The findings of this study reveal that high-risk zones are 2.08% of the total area of the Renhe District, predominantly located in Renhe Town, Jinjiang Town, Pingdi Town, and additional regions. These areas exhibit elevated urbanization and notable geological disruptions, suggesting that anthropogenic activities are a primary contributor to landslides, aligning with the findings of most existing studies [83,84,85]. In addition, medium-risk areas are mainly caused by complex regional hydrogeological networks, developed faults, sparse vegetation, and the combined effects of human and natural factors. The low- and non-risk zones are primarily situated on steep sides of high mountains, flat dams in low mountains, and alluvial-pluvial valley areas where human activities are infrequent. The elucidation of the spatial distribution pattern of risk can assist pertinent personnel in intuitively identifying areas requiring enhanced landslip management and control, while the derived conclusions may offer viable references for disaster prevention and mitigation in the Renhe District, a strategically significant region. The identification of high-risk zones in critical infrastructure, such as railway stations and airports, enables local governments to restrict high-density growth in these vulnerable regions and prioritize resource allocation for disaster preparedness.
It should be acknowledged that this article has some research limitations, as follows: (1) The research framework utilizes a singular model method that, owing to its intrinsic constraints, poses challenges adapting to the geological circumstances of the studied area. In complex geological contexts, the integration of models helps to enhance forecast accuracy and spatial adaptability, particularly under the influence of several causes [86]. Future research may mitigate the risk of overfitting by merging various models to use their complementary capabilities, hence enhancing the model’s smoothness and predictive accuracy. (2) The construction of the evaluation index system did not employ methods such as the correlation coefficient method or geodetector to conduct a correlation analysis of the evaluation factors. Potential collinearity between factors may lead to interactions during weight allocation, reducing the accuracy of the assessment. (3) The study is constrained by inadequate data, resulting in the exclusion of dynamic aspects such as surface deformation and climatic change, remaining at a static risk prediction level. Future research could aim to incorporate pertinent data for a dynamic assessment of landslides.

6. Conclusions

This paper systematically evaluated the hazard, vulnerability, and risk assessments of landslides in the Renhe District, Panzhihua City, Sichuan Province, China. The following conclusions are drawn.
(1)
This research analyzes 190 landslide locations, selecting 10 factors such as elevation, slope gradient, and aspect. Three models—random forest (RF), eXtreme Gradient Boosting Tree (XGBoost), and Tabular Prior-data Fitted Network (TabPFN)—are utilized to assess landslide hazard. Random forest and XGBoost exhibited exceptional generalization and precision. RF attained an area-under-the-curve (AUC) value of 0.9471, demonstrating superior generalization performance, and was recognized as the ideal model for hazard mapping. TabPFN attained an AUC value of 0.9243, indicating substantial accuracy, although it also presented a potential risk of overfitting. As a pre-trained model designed for rapid responses, it demonstrates potential for small-scale datasets and situations necessitating prompt decision-making.
(2)
The Analytic Hierarchy Process (AHP) was employed to ascertain the weights of the four disaster-bearing bodies: land-use type, Gross Domestic Product (GDP), road type, and population density. The expert scoring technique was found to be highly subjective through sensitivity analysis. The lagging nature of economic indicators was not completely considered, and the initial weights calculated using AHP underestimated the impact of engineering and overestimated the contribution of population indicators. The most sensitive vulnerability factor was determined to be road type, followed by population density. GDP and land-use type were relatively less sensitive.
(3)
The vulnerability assessment map and the landslide hazard assessment map were combined to produce the landslide hazard assessment map of the Renhe District. The findings suggest that the high-risk area comprises 2.08% of the studied area, with all three railway stations situated within this zone. Consequently, it is necessary to implement more stringent protective measures. These consist of the optimization of drainage systems, the enhancement of geological disaster monitoring systems, and reinforcement engineering. A relatively large area, 34.23%, is covered by the medium-risk zone, which is widely distributed throughout the district, particularly in the vicinity of main transportation routes, residential areas, and significant economic zones. The establishment of a comprehensive landslide early warning system and the enhancement of landslide early warning measures are necessary in this region. The regular installation of real-time monitoring apparatus and the improvement of public emergency response capabilities are examples of specific measures. The aforementioned conclusions offer significant support for the safe operation of public transportation infrastructure, including train stations and airports, and provide a scientific foundation for landslide prevention in the Renhe District, Panzhihua City.

Author Contributions

Y.Z.: Investigation, Data curation, Writing—original draft preparation. L.X.: Conceptualization, Writing—review and editing, Formal analysis and investigation, Funding acquisition. H.D.: Formal analysis and investigation, Data curation, Validation. H.W.: Investigation, Data curation, Validation. K.H.: Investigation, Data curation, Validation. L.L.: Formal analysis, Data curation, Validation. Z.L.: Formal analysis, Data curation, Validation. All authors have read and agreed to the published version of the manuscript.

Funding

This work was financially supported by the National Key R&D Program of China (Grant numbers 2024YFF1307801; 2024YFF1307800) and the National Natural Science Foundation of China (Grant number 42090052).

Data Availability Statement

The data are not publicly available due to privacy restrictions.

Conflicts of Interest

The authors declare that they have no known competing financial interests or personal relationships that could have appeared to influence the work reported in this paper.

References

  1. Varnes, D.J. Slope Movement Types and Processes, Special Report 176. In Landslides: Analysis and Control; Schuster, R., Krizek, R., Eds.; Transportation Research Board, National Research Council: Washington, DC, USA, 1978; pp. 11–33. [Google Scholar]
  2. Wang, D.; Hao, M.; Chen, S.; Meng, Z.; Jiang, D.; Ding, F. Assessment of Landslide Susceptibility and Risk Factors in China. Nat. Hazard. 2021, 108, 3045–3059. [Google Scholar] [CrossRef]
  3. Dai, F.C.; Lee, C.F.; Ngai, Y.Y. Landslide Risk Assessment and Management: An Overview. Eng. Geol. 2002, 64, 65–87. [Google Scholar] [CrossRef]
  4. Huang, R. Some Catastrophic Landslides since the Twentieth Century in the Southwest of China. Landslides 2009, 6, 69–81. [Google Scholar] [CrossRef]
  5. Xu, Q. Remote Sensing for Landslide Investigations: A Progress Report from China. Eng. Geol. 2023, 321, 107156. [Google Scholar] [CrossRef]
  6. Dai, X.; Gao, Y.; He, X.; Liu, T.; Jiang, B.; Shao, H.; Yao, Y. Spatial-Temporal Pattern Evolution and Driving Force Analysis of Ecological Environment Vulnerability in Panzhihua City. Environ. Sci. Pollut. Res. 2021, 28, 7151–7166. [Google Scholar] [CrossRef]
  7. Peng, L.; Xu, S.; Hou, J.; Peng, J. Quantitative Risk Analysis for Landslides: The Case of the Three Gorges Area, China. Landslides 2015, 12, 943–960. [Google Scholar] [CrossRef]
  8. Wang, W.-D.; Li, J.; Han, Z. Comprehensive Assessment of Geological Hazard Safety along Railway Engineering Using a Novel Method: A Case Study of the Sichuan-Tibet Railway, China. Geomat. Nat. Hazards Risk 2020, 11, 1–21. [Google Scholar] [CrossRef]
  9. Lin, J.; Chen, W.; Qi, X.; Hou, H. Risk Assessment and Its Influencing Factors Analysis of Geological Hazards in Typical Mountain Environment. J. Clean. Prod. 2021, 309, 127077. [Google Scholar] [CrossRef]
  10. Liu, W.; Zhang, Y.; Liang, Y.; Sun, P.; Li, Y.; Su, X.; Wang, A.; Meng, X. Landslide Risk Assessment Using a Combined Approach Based on InSAR and Random Forest. Remote Sens. 2022, 14, 2131. [Google Scholar] [CrossRef]
  11. Zhang, X.; Yu, W.; Pun, M.-O.; Shi, W. Cross-Domain Landslide Mapping from Large-Scale Remote Sensing Images Using Prototype-Guided Domain-Aware Progressive Representation Learning. ISPRS J. Photogramm. Remote Sens. 2023, 197, 1–17. [Google Scholar] [CrossRef]
  12. Dai, X.; Chen, J.; Zhang, T.; Xue, C. Integrated Landslide Risk Assessment via a Landslide Susceptibility Model Based on Intelligent Optimization Algorithms. Remote Sens. 2025, 17, 545. [Google Scholar] [CrossRef]
  13. Yang, Y.; Zhang, R.; Wang, T.; Liu, A.; He, Y.; Lv, J.; He, X.; Mao, W.; Xiang, W.; Zhang, B. An Information Quantity and Machine Learning Integrated Model for Landslide Susceptibility Mapping in Jiuzhaigou, China. Nat. Hazard. 2024, 120, 10185–10217. [Google Scholar] [CrossRef]
  14. Li, R.; Tan, S.; Zhang, M.; Zhang, S.; Wang, H.; Zhu, L. Geological Disaster Susceptibility Evaluation Using a Random Forest Empowerment Information Quantity Model. Sustainability 2024, 16, 765. [Google Scholar] [CrossRef]
  15. He, W.; Chen, G.; Zhao, J.; Lin, Y.; Qin, B.; Yao, W.; Cao, Q. Landslide Susceptibility Evaluation of Machine Learning Based on Information Volume and Frequency Ratio: A Case Study of Weixin County, China. Sensors 2023, 23, 2549. [Google Scholar] [CrossRef]
  16. Ohlmacher, G.C.; Davis, J.C. Using Multiple Logistic Regression and GIS Technology to Predict Landslide Hazard in Northeast Kansas, USA. Eng. Geol. 2003, 69, 331–343. [Google Scholar] [CrossRef]
  17. Lee, S.; Pradhan, B. Landslide Hazard Mapping at Selangor, Malaysia Using Frequency Ratio and Logistic Regression Models. Landslides 2007, 4, 33–41. [Google Scholar] [CrossRef]
  18. Dong, J.-J.; Tung, Y.-H.; Chen, C.-C.; Liao, J.-J.; Pan, Y.-W. Logistic Regression Model for Predicting the Failure Probability of a Landslide Dam. Eng. Geol. 2011, 117, 52–61. [Google Scholar] [CrossRef]
  19. Budimir, M.E.A.; Atkinson, P.M.; Lewis, H.G. A Systematic Review of Landslide Probability Mapping Using Logistic Regression. Landslides 2015, 12, 419–436. [Google Scholar] [CrossRef]
  20. Carrara, A.; Cardinali, M.; Detti, R.; Guzzetti, F.; Pasqui, V.; Reichenbach, P. GIS Techniques and Statistical Models in Evaluating Landslide Hazard. Earth Surf. Process. Landf. 1991, 16, 427–445. [Google Scholar] [CrossRef]
  21. Wang, G.; Chen, X.; Chen, W. Spatial Prediction of Landslide Susceptibility Based on GIS and Discriminant Functions. ISPRS Int. J. Geo-Inf. 2020, 9, 144. [Google Scholar] [CrossRef]
  22. Lo, C.-M.; Feng, Z.-Y.; Chang, K.-T. Landslide Hazard Zoning Based on Numerical Simulation and Hazard Assessment. Geomat. Nat. Hazards Risk 2018, 9, 368–388. [Google Scholar] [CrossRef]
  23. Jia, L.; Wang, J.; Gao, S.; Fang, L.; Wang, D. Landslide Risk Evaluation Method of Open-Pit Mine Based on Numerical Simulation of Large Deformation of Landslide. Sci. Rep. 2023, 13, 15410. [Google Scholar] [CrossRef] [PubMed]
  24. Xu, C.; Dai, F.; Xu, X.; Lee, Y.H. GIS-Based Support Vector Machine Modeling of Earthquake-Triggered Landslide Susceptibility in the Jianjiang River Watershed, China. Geomorphology 2012, 145–146, 70–80. [Google Scholar] [CrossRef]
  25. Dou, J.; Yunus, A.P.; Bui, D.T.; Merghadi, A.; Sahana, M.; Zhu, Z.; Chen, C.-W.; Han, Z.; Pham, B.T. Improved Landslide Assessment Using Support Vector Machine with Bagging, Boosting, and Stacking Ensemble Machine Learning Framework in a Mountainous Watershed, Japan. Landslides 2020, 17, 641–658. [Google Scholar] [CrossRef]
  26. Hong, H.; Pradhan, B.; Xu, C.; Tien Bui, D. Spatial Prediction of Landslide Hazard at the Yihuang Area (China) Using Two-Class Kernel Logistic Regression, Alternating Decision Tree and Support Vector Machines. Catena 2015, 133, 266–281. [Google Scholar] [CrossRef]
  27. Krkač, M.; Špoljarić, D.; Bernat, S.; Arbanas, S.M. Method for Prediction of Landslide Movements Based on Random Forests. Landslides 2017, 14, 947–960. [Google Scholar] [CrossRef]
  28. Zhao, L.; Wu, X.; Niu, R.; Wang, Y.; Zhang, K. Using the Rotation and Random Forest Models of Ensemble Learning to Predict Landslide Susceptibility. Geomatics Nat. Hazards Risk 2020, 11, 1542–1564. [Google Scholar] [CrossRef]
  29. Liu, Y.; Zhang, W.; Zhang, Z.; Xu, Q.; Li, W. Risk Factor Detection and Landslide Susceptibility Mapping Using Geo-Detector and Random Forest Models: The 2018 Hokkaido Eastern Iburi Earthquake. Remote Sens. 2021, 13, 1157. [Google Scholar] [CrossRef]
  30. Tanyu, B.F.; Abbaspour, A.; Alimohammadlou, Y.; Tecuci, G. Landslide Susceptibility Analyses Using Random Forest, C4.5, and C5.0 with Balanced and Unbalanced Datasets. Catena 2021, 203, 105355. [Google Scholar] [CrossRef]
  31. Wang, Y.; Wen, H.; Sun, D.; Li, Y. Quantitative Assessment of Landslide Risk Based on Susceptibility Mapping Using Random Forest and GeoDetector. Remote Sens. 2021, 13, 2625. [Google Scholar] [CrossRef]
  32. Guo, W.; Ye, J.; Liu, C.; Lv, Y.; Zeng, Q.; Huang, X. An Approach for Predicting Landslide Susceptibility and Evaluating Predisposing Factors. Int. J. Appl. Earth Obs. Geoinf. 2024, 135, 104217. [Google Scholar] [CrossRef]
  33. Wang, L.; Yang, K.; Wu, C.; Zhou, Y.; Liu, J.; Hu, H. Novel Approach to Quantitative Risk Assessment of Reservoir Landslides Using a Hybrid CNN-LSTM Model. Landslides 2024, 22, 943–956. [Google Scholar] [CrossRef]
  34. Wang, Y.; Zhou, C.; Cao, Y.; Meena, S.R.; Feng, Y.; Wang, Y. Utilizing Deep Learning Approach to Develop Landslide Susceptibility Mapping Considering Landslide Types. Bull. Eng. Geol. Environ. 2024, 83, 430. [Google Scholar] [CrossRef]
  35. Wang, H.; Wang, L.; Zhang, L. Transfer Learning Improves Landslide Susceptibility Assessment. Gondwana Res. 2023, 123, 238–254. [Google Scholar] [CrossRef]
  36. Wang, Z.; Brenning, A. Unsupervised Active–Transfer Learning for Automated Landslide Mapping. Comput. Geosci. 2023, 181, 105457. [Google Scholar] [CrossRef]
  37. Huang, F.; Mao, D.; Jiang, S.-H.; Zhou, C.; Fan, X.; Zeng, Z.; Catani, F.; Yu, C.; Chang, Z.; Huang, J.; et al. Uncertainties in Landslide Susceptibility Prediction Modeling: A Review on the Incompleteness of Landslide Inventory and Its Influence Rules. Geosci. Front. 2024, 15, 101886. [Google Scholar] [CrossRef]
  38. Liu, S.; Wang, L.; Zhang, W.; He, Y.; Pijush, S. A Comprehensive Review of Machine Learning-based Methods in Landslide Susceptibility Mapping. Geol. J. 2023, 58, 2283–2301. [Google Scholar] [CrossRef]
  39. Song, J.; Wang, Y.; Fang, Z.; Peng, L.; Hong, H. Potential of Ensemble Learning to Improve Tree-Based Classifiers for Landslide Susceptibility Mapping. IEEE J. Sel. Top. Appl. Earth Obs. Remote Sens. 2020, 13, 4642–4662. [Google Scholar] [CrossRef]
  40. Kumar, C.; Walton, G.; Santi, P.; Luza, C. An Ensemble Approach of Feature Selection and Machine Learning Models for Regional Landslide Susceptibility Mapping in the Arid Mountainous Terrain of Southern Peru. Remote Sens. 2023, 15, 1376. [Google Scholar] [CrossRef]
  41. Liu, B.; Guo, H.; Li, J.; Ke, X.; He, X. Application and Interpretability of Ensemble Learning for Landslide Susceptibility Mapping along the Three Gorges Reservoir Area, China. Nat. Hazard. 2024, 120, 4601–4632. [Google Scholar] [CrossRef]
  42. Sahin, E.K. Implementation of Free and Open-Source Semi-Automatic Feature Engineering Tool in Landslide Susceptibility Mapping Using the Machine-Learning Algorithms RF, SVM, and XGBoost. Stoch. Environ. Res. Risk Assess. 2022, 37, 1067–1092. [Google Scholar] [CrossRef]
  43. Lv, J.; Zhang, R.; Shama, A.; Hong, R.; He, X.; Wu, R.; Bao, X.; Liu, G. Exploring the Spatial Patterns of Landslide Susceptibility Assessment Using Interpretable Shapley Method: Mechanisms of Landslide Formation in the Sichuan-Tibet Region. J. Environ. Manag. 2024, 366, 121921. [Google Scholar] [CrossRef] [PubMed]
  44. Lv, L.; Chen, T.; Liu, G.; Dou, J.; Plaza, A. A Comparative Study of Model Interpretability Considering the Decision Differentiation of Landslide Susceptibility Models. IEEE Trans. Geosci. Remote Sens. 2025, 63, 1–18. [Google Scholar] [CrossRef]
  45. Das, R.; Chattoraj, S.L.; Singh, M.; Bisht, A. Synergetic Use of Geospatial and Machine Learning Techniques in Modelling Landslide Susceptibility in Parts of Shimla to Kinnaur National Highway, Himachal Pradesh. Model. Earth Syst. Environ. 2024, 10, 4163–4183. [Google Scholar] [CrossRef]
  46. Hollmann, N.; Müller, S.; Eggensperger, K.; Hutter, F. Tabpfn: A Transformer That Solves Small Tabular Classification Problems in a Second. arXiv 2023, arXiv:2207.01848. [Google Scholar]
  47. Hollmann, N.; Müller, S.; Purucker, L.; Krishnakumar, A.; Körfer, M.; Hoo, S.B.; Schirrmeister, R.T.; Hutter, F. Accurate Predictions on Small Data with a Tabular Foundation Model. Nature 2025, 637, 319–326. [Google Scholar] [CrossRef]
  48. Zhao, X.; Li, Y.; Tan, S. Evaluation of Mine Geological Hazard Susceptibility of Coupling CF with Information Model Based on GIS in Panzhihua City. J. Yunnan Univ. Nat. Sci. Ed. 2022, 44, 754–764. [Google Scholar]
  49. Dai, X.; Li, W.; Liu, Z.; Tong, C.; Li, C.; Zeng, J.; Ye, Y.; Li, W.; Shan, Y.; Zhou, J.; et al. Effects of Mining on Urban Environmental Change: A Case Study of Panzhihua. Remote Sens. 2022, 14, 6004. [Google Scholar] [CrossRef]
  50. GB 18306-2015; Seismic Ground Motion Parameter Zonation Map of China. Standards Press of China: Beijing, China, 2015.
  51. Xu, X. China Population Spatial Distribution Kilometer Grid Dataset. Resource and Environmental Science Data Center 2017. Available online: https://www.resdc.cn/DOI/doi.aspx?DOIid=32 (accessed on 24 July 2024). [CrossRef]
  52. Xu, X. China GDP Spatial Distribution Kilometer Grid Dataset. Resource and Environmental Science Data Center 2017. Available online: https://www.resdc.cn/DOI/doi.aspx?DOIid=33 (accessed on 24 July 2024). [CrossRef]
  53. Corominas, J.; Van Westen, C.; Frattini, P.; Cascini, L.; Malet, J.-P.; Fotopoulou, S.; Catani, F.; Van Den Eeckhaut, M.; Mavrouli, O.; Agliardi, F.; et al. Recommendations for the Quantitative Analysis of Landslide Risk. Bull. Eng. Geol. Environ. 2013, 73, 209–263. [Google Scholar] [CrossRef]
  54. Varnes, D. Landslide Hazard Zonation: A Review of Principles and Practice; United Nations: Paris, France, 1984. [Google Scholar]
  55. United Nations Department of Humanitarian Affairs. International Decade for Disaster Reduction. Internationally Agreed Glossary of Basic Terms Related to Disaster Management; United Nations Department of Humanitarian Affairs (DHA): Geneva, Switzerland, 1992; Volume 81. [Google Scholar]
  56. Sharma, L.P.; Patel, N.; Ghose, M.K.; Debnath, P. Development and Application of Shannon’s Entropy Integrated Information Value Model for Landslide Susceptibility Assessment and Zonation in Sikkim Himalayas in India. Nat. Hazard. 2015, 75, 1555–1576. [Google Scholar] [CrossRef]
  57. Tsangaratos, P.; Ilia, I.; Hong, H.; Chen, W.; Xu, C. Applying Information Theory and GIS-Based Quantitative Methods to Produce Landslide Susceptibility Maps in Nancheng County, China. Landslides 2017, 14, 1091–1111. [Google Scholar] [CrossRef]
  58. Karir, D.; Ray, A.; Kumar Bharati, A.; Chaturvedi, U.; Rai, R.; Khandelwal, M. Stability Prediction of a Natural and Man-Made Slope Using Various Machine Learning Algorithms. Transp. Geotech. 2022, 34, 100745. [Google Scholar] [CrossRef]
  59. Breiman, L. Random Forests. Mach. Learn. 2001, 45, 5–32. [Google Scholar] [CrossRef]
  60. El Gana, E.M.; Ouallali, A.; Taleb, A. Scour Depth Prediction around Bridge Piers of Various Geometries Using Advanced Machine Learning and Data Augmentation Techniques. Transp. Geotech. 2025, 51, 101537. [Google Scholar] [CrossRef]
  61. Chen, T.; Guestrin, C. XGBoost: A Scalable Tree Boosting System. In Proceedings of the 22nd ACM SIGKDD International Conference on Knowledge Discovery and Data Mining, San Francisco, CA, USA, 13–17 August 2016; ACM: New York, NY, USA, 2016; pp. 785–794. [Google Scholar]
  62. Zeng, T.; Wu, L.; Peduto, D.; Glade, T.; Hayakawa, Y.S.; Yin, K. Ensemble Learning Framework for Landslide Susceptibility Mapping: Different Basic Classifier and Ensemble Strategy. Geosci. Front. 2023, 14, 101645. [Google Scholar] [CrossRef]
  63. Zhang, W.; Li, H.; Han, L.; Chen, L.; Wang, L. Slope Stability Prediction Using Ensemble Learning Techniques: A Case Study in Yunyang County, Chongqing, China. J. Rock Mech. Geotech. Eng. 2022, 14, 1089–1099. [Google Scholar] [CrossRef]
  64. Kavzoglu, T.; Teke, A. Advanced Hyperparameter Optimization for Improved Spatial Prediction of Shallow Landslides Using Extreme Gradient Boosting (XGBoost). Bull. Eng. Geol. Environ. 2022, 81, 201. [Google Scholar] [CrossRef]
  65. Carter, J.V.; Pan, J.; Rai, S.N.; Galandiuk, S. ROC-Ing along: Evaluation and Interpretation of Receiver Operating Characteristic Curves. Surgery 2016, 159, 1638–1645. [Google Scholar] [CrossRef]
  66. Thammaboribal, P.; Triapthti, N.K.; Lipiloet, S. Using of Analytical Hierarchy Process (AHP) in Disaster Management: A Review of Flooding and Landslide Susceptibility Mapping. Int. J. Geoinformatics 2025, 21, 177–196. [Google Scholar] [CrossRef]
  67. Ilia, I.; Tsangaratos, P. Applying Weight of Evidence Method and Sensitivity Analysis to Produce a Landslide Susceptibility Map. Landslides 2016, 13, 379–397. [Google Scholar] [CrossRef]
  68. DZ/T 0438-2023; Specification of Geological Hazard Risk Survey and Assessment (1:50000). Ministry of Natural Resources: Beijing, China, 2023.
  69. Samia, J.; Temme, A.; Bregt, A.; Wallinga, J.; Guzzetti, F.; Ardizzone, F.; Rossi, M. Do Landslides Follow Landslides? Insights in Path Dependency from a Multi-Temporal Landslide Inventory. Landslides 2017, 14, 547–558. [Google Scholar] [CrossRef]
  70. Silalahi, F.E.S.; Pamela; Arifianti, Y.; Hidayat, F. Landslide Susceptibility Assessment Using Frequency Ratio Model in Bogor, West Java, Indonesia. Geosci. Lett. 2019, 6, 10. [Google Scholar] [CrossRef]
  71. Li, B.; Liu, K.; Wang, M.; He, Q.; Jiang, Z.; Zhu, W.; Qiao, N. Global Dynamic Rainfall-Induced Landslide Susceptibility Mapping Using Machine Learning. Remote Sens. 2022, 14, 5795. [Google Scholar] [CrossRef]
  72. Dou, J.; Tien Bui, D.; Yunus, A.P.; Jia, K.; Song, X.; Revhaug, I.; Xia, H.; Zhu, Z. Optimization of Causative Factors for Landslide Susceptibility Evaluation Using Remote Sensing and GIS Data in Parts of Niigata, Japan. PLoS ONE 2015, 10, e0133262. [Google Scholar] [CrossRef]
  73. Chen, W.; Xie, X.; Peng, J.; Wang, J.; Duan, Z.; Hong, H. GIS-Based Landslide Susceptibility Modelling: A Comparative Assessment of Kernel Logistic Regression, Naïve-Bayes Tree, and Alternating Decision Tree Models. Geomat. Nat. Hazards Risk 2017, 8, 950–973. [Google Scholar] [CrossRef]
  74. Kalantar, B.; Ueda, N.; Saeidi, V.; Ahmadi, K.; Halin, A.A.; Shabani, F. Landslide Susceptibility Mapping: Machine and Ensemble Learning Based on Remote Sensing Big Data. Remote Sens. 2020, 12, 1737. [Google Scholar] [CrossRef]
  75. Dou, J.; Yunus, A.P.; Merghadi, A.; Shirzadi, A.; Nguyen, H.; Hussain, Y.; Avtar, R.; Chen, Y.; Pham, B.T.; Yamagishi, H. Different Sampling Strategies for Predicting Landslide Susceptibilities Are Deemed Less Consequential with Deep Learning. Sci. Total Environ. 2020, 720, 137320. [Google Scholar] [CrossRef]
  76. Kornejady, A.; Ownegh, M.; Bahremand, A. Landslide Susceptibility Assessment Using Maximum Entropy Model with Two Different Data Sampling Methods. Catena 2017, 152, 144–162. [Google Scholar] [CrossRef]
  77. Liu, Y.; Meng, Z.; Zhu, L.; Hu, D.; He, H. Optimizing the Sample Selection of Machine Learning Models for Landslide Susceptibility Prediction Using Information Value Models in the Dabie Mountain Area of Anhui, China. Sustainability 2023, 15, 1971. [Google Scholar] [CrossRef]
  78. Qin, Z.; Zhou, X.; Li, M.; Tong, Y.; Luo, H. Landslide Susceptibility Mapping Based on Resampling Method and FR-CNN: A Case Study of Changdu. Land 2023, 12, 1213. [Google Scholar] [CrossRef]
  79. Zhao, P.; Wang, Y.; Xie, Y.; Uddin, M.G.; Xu, Z.; Chang, X.; Zhang, Y. Landslide Susceptibility Assessment Using Information Quantity and Machine Learning Integrated Models: A Case Study of Sichuan Province, Southwestern China. Earth Sci. Inform. 2025, 18, 190. [Google Scholar] [CrossRef]
  80. Ramampiandra, E.C.; Scheidegger, A.; Wydler, J.; Schuwirth, N. A Comparison of Machine Learning and Statistical Species Distribution Models: Quantifying Overfitting Supports Model Interpretation. Ecol. Modell. 2023, 481, 110353. [Google Scholar] [CrossRef]
  81. Montesinos López, O.A.; Montesinos López, A.; Crossa, J. Overfitting, Model Tuning, and Evaluation of Prediction Performance. In Multivariate Statistical Machine Learning Methods for Genomic Prediction; Springer International Publishing: Cham, Switzerland, 2022; pp. 109–139. ISBN 978-3-030-89009-4. [Google Scholar]
  82. Frédéric, L.; Asté, J.; Leroi, E. Vulnerability Assessment of Elements Exposed to Mass-Movement: Working toward a Better Risk Perception. Landslides 1996, 1, 263–269. [Google Scholar]
  83. Froude, M.J.; Petley, D.N. Global Fatal Landslide Occurrence from 2004 to 2016. Nat. Hazards Earth Syst. Sci. 2018, 18, 2161–2181. [Google Scholar] [CrossRef]
  84. Zeng, T.; Guo, Z.; Wang, L.; Jin, B.; Wu, F.; Guo, R. Tempo-Spatial Landslide Susceptibility Assessment from the Perspective of Human Engineering Activity. Remote Sens. 2023, 15, 4111. [Google Scholar] [CrossRef]
  85. Zhao, G.; Lan, H.; Yin, H.; Li, L.; Strom, A.; Sun, W.; Tian, C. Deformation, Structure and Potential Hazard of a Landslide Based on InSAR in Banbar County, Xizang (Tibet). China Geol. 2024, 7, 203–221. [Google Scholar] [CrossRef]
  86. Reichenbach, P.; Rossi, M.; Malamud, B.D.; Mihir, M.; Guzzetti, F. A Review of Statistically-Based Landslide Susceptibility Models. Earth Sci. Rev. 2018, 180, 60–91. [Google Scholar] [CrossRef]
Figure 1. Location of the study area.
Remotesensing 17 02120 g001
Figure 2. Methodological framework for landslide risk assessment.
Remotesensing 17 02120 g002
Figure 3. Classification map of evaluation factors: (a) elevation, (b) slope, (c) aspect, (d) topographic relief, (e) lithology, (f) distance to river system, (g) distance to fault, (h) NDVI, (i) 24 h maximum precipitation, and (j) PGA. Note: The classifications in the figure correspond to those in Table 2 (classification). For specific classification criteria and standards, please refer to Table 2.
Remotesensing 17 02120 g003
Figure 4. Characteristic curve of evaluation factor information value: (a) elevation, (b) slope, (c) aspect, (d) topographic relief, (e) lithology, (f) distance to river system, (g) distance to fault, (h) NDVI, (i) 24 h maximum precipitation, and (j) PGA. Note: The classifications in the figure correspond to those in Table 2 (classification). For specific classification criteria and standards, please refer to Table 2.
Remotesensing 17 02120 g004
Figure 5. Non-landslide points map of the study area.
Remotesensing 17 02120 g005
Figure 6. RF evaluation results chart.
Remotesensing 17 02120 g006
Figure 7. XGBoost evaluation results chart.
Remotesensing 17 02120 g007
Figure 8. TabPFN evaluation results chart.
Remotesensing 17 02120 g008
Figure 9. Landslide hazard zoning map of the study area.
Remotesensing 17 02120 g009
Figure 10. Vulnerability assessment grading result for disaster-bearing body: (a) population density, (b) road type, (c) land-use type, and (d) GDP.
Remotesensing 17 02120 g010
Figure 11. Sensitivity analysis of vulnerability factors to parameter perturbations.
Remotesensing 17 02120 g011
Figure 12. Landslide vulnerability zoning map of the study area.
Remotesensing 17 02120 g012
Figure 13. Landslide risk zoning map of the study area.
Remotesensing 17 02120 g013
Table 1. The matrix of landslide risk mapping integrating landslide hazard (H1–4) and landslide vulnerability (V1–4).
H4H3H2H1
V4HRHRMRLR
V3HRMRLRLR
V2MRMRLRNR
V1MRLRNRNR
HR: High risk (red); MR: moderate risk (orange); LR: low risk (light green); NR: non risk (dark green).
Table 2. Information value of evaluation factors.
Evaluation FactorsClassificationGradingNij/CountNij/N/%Sij/CountSij/S/%Information Values
Elevation (m)1<12003216.84%196,69310.25%0.4966
21200–14003719.47%350,27518.25%0.0649
31400–16005629.47%398,58920.77%0.3500
41600–18003417.89%366,14219.08%−0.0641
51800–20002513.16%323,51716.86%−0.2479
6>200063.16%160,3018.35%−0.9724
Slope (°)1<52312.11%228,88511.95%0.0129
25–102714.21%125,3196.54%0.7760
310–154624.21%198,75610.38%0.8469
415–203417.89%273,37814.28%0.2256
520–252613.68%333,73717.43%−0.2420
625–30178.95%310,35916.21%−0.5943
730–40157.89%347,61918.15%−0.8325
840–5021.05%85,0894.44%−1.4394
9>5000.00%11,7940.62%
Aspect (°)1Plane00.00%24,7601.30%
20–453317.37%246,92912.95%0.2936
345–902111.05%270,87914.20%−0.2506
490–1354121.58%292,26815.33%0.3419
5135–1802412.63%239,79312.57%0.0049
6180–225115.79%196,31510.29%−0.5751
7225–270115.79%217,18410.23%−0.5693
8270–3152312.11%217,18411.39%0.0609
9315–3602613.68%223,76511.73%0.1541
Lithology1Hard Limestone–Dolomite21.05%122,3776.38%−1.8019
2Igneous Rock9248.42%919,30547.91%0.0106
3Weak Interlayer Gneiss21.05%11,7550.61%0.5456
4Sandy Shale5528.95%697,80036.36%−0.2280
5Interbedded Shale and Siltstone3618.95%157,5928.21%0.8363
6Loose Sand, Gravel, and Cobbles31.58%10,1040.53%1.0916
Distance To Fault (m)1<5042.11%16,0620.84%0.9230
250–10042.11%16,4270.86%0.9006
3100–20042.11%32,6211.70%0.2145
4200–400115.79%65,2023.40%0.5336
5400–800136.84%126,7146.60%0.0362
6800–16003216.84%239,63912.48%0.2998
71600–32004021.05%416,42421.69%−0.0296
83200–64005126.84%605,79731.55%−0.1615
9>640003116.32%401,37920.90%−0.2477
Distance to River System (m)1<502814.74%182,3709.50%0.4394
250–1003618.95%167,5648.73%0.7753
3100–1503015.79%153,9528.02%0.6778
4150–2002010.53%142,1827.40%0.3518
5200–4004724.74%464,56324.19%0.0222
6400–600189.47%322,26416.78%−0.5718
7600–80052.63%207,66910.81%−1.4133
8800–160052.63%241,56412.58%−1.5645
9>160010.53%38,1371.99%−1.3280
NDVI1<0.142.11%46,0112.40%−0.1302
20.1–0.15136.84%84,9344.43%0.4355
30.15–0.23015.79%184,4609.61%0.4962
40.2–0.254423.16%300,10915.64%0.3925
50.25–0.33417.89%387,68520.20%−0.1214
60.3–0.352312.11%406,86221.20%−0.5606
70.35–0.42211.58%277,01614.44%−0.2206
80.4–0.45157.89%150,1397.82%0.0089
9>0.4552.63%81,5444.25%−0.4793
Topographic Relief (m)1<604925.79%240,49712.53%0.7216
260–1007338.42%501,63826.14%0.3851
3100–1304523.68%398,97720.79%0.1303
4130–160136.84%346,35718.05%−0.9700
5160–19063.16%211,07211.00%−1.2479
6190–22021.05%113,0335.89%−1.7220
7220–26010.53%67,9413.54%−1.9061
8>26010.53%31,7271.65%−1.1447
24 h Maximum Precipitation (mm)1<4042.11%111,0605.78%−1.0100
240–605327.89%519,64027.06%0.0304
360–802312.11%111,5515.81%0.7341
480–1004523.68%450,22223.45%0.0099
5100–1202211.58%249,08012.97%−0.1135
6>1204322.63%47871224.93%−0.0967
PGA10.1178.95%102,2005.32%0.5199
20.1515179.47%1,568,98581.71%−0.0278
30.22211.58%249,08012.97%−0.1135
Table 3. RF model best parameters.
ParameterSetting
n_estimators300
max_depth8
max_features0.25
max_samples0.7
min_samples_split10
min_samples_leaf8
ccp_alpha0.005
Table 4. XGBoosdt model best parameters.
ParameterSetting
n_estimators500
max_depth2
colsample_bytree0.6
learning_rate0.05
min_child_weight5
reg_alpha0.1
reg_lambda5
subsample0.8
Table 5. Grading standards of vulnerability assessment factors in the study area.
Disaster-Bearing BodyGrading Value
123456
Population Density/persons·km−2<100100~200200~500500~1000>1000——
GDP/10,000 yuan·km−2<50005000~10,00010,000~15,00015,000~20,00020,000~250,000>25,000
Road TypeCountry RoadCounty RoadProvincial RoadRailwayNational RoadExpressway
Land-Use TypeCroplandForestGrasslandWaterBarrenConstruction Land
Table 6. Weight judgment matrix of vulnerability evaluation factors.
Disaster-Bearing Body Population DensityGDPRoad TypeLand-Use TypeWeight
Population Density12460.5195
GDP1/21230.2598
Road Type1/41/2120.1400
Land-Use Type1/61/31/210.0808
Table 7. Revised weight judgment matrix of vulnerability evaluation factors.
Disaster-Bearing Body Population DensityGDPRoad TypeLand-Use TypeWeight
Population Density142/350.3518
GDP1/411/520.1042
Road Type3/25160.4777
Land-Use Type1/51/21/610.0665
Table 8. Statistical results of risk zoning of the study area.
Risk ZoningArea (km)Percentage (%)
High-Risk Zone35.12972.08%
Medium-Risk Zone577.131334.23%
Low-Risk Zone358.974921.29%
Non-Risk Zone714.844842.40%
Table 9. Analysis of the causes of deviations between expert weight ranking and sensitivity ranking.
Disaster-Bearing BodiesExpert Weight RankingSensitivity RankingReason for Deviation
Road Types31Underestimating the impact of human engineering
Population Density12Overestimating the contribution of the indicator
GDP23Ignoring the lag effect of economic indicators
Land-Use Types44--
Disclaimer/Publisher’s Note: The statements, opinions and data contained in all publications are solely those of the individual author(s) and contributor(s) and not of MDPI and/or the editor(s). MDPI and/or the editor(s) disclaim responsibility for any injury to people or property resulting from any ideas, methods, instructions or products referred to in the content.

