Abstract
Panoramic 3D object detection is a challenging task due to image distortion, sensor heterogeneity, and the difficulty of combining information from multiple modalities over a wide field-of-view (FoV). To address these issues, we propose SMM-POD, a novel framework that introduces a spherical multi-stage fusion strategy for panoramic 3D detection. Our approach creates a five-channel spherical image aligned with LiDAR data and uses a quasi-uniform Voronoi sphere (UVS) model to reduce projection distortion. A cross-attention-based feature extraction module and a transformer encoder–decoder with spherical positional encoding enable the accurate and efficient fusion of image and point cloud features. For precise 3D localization, we adopt a Frustum PointNet module. Experiments on the DAIR-V2X-I benchmark and our self-collected SHU-3DPOD dataset show that SMM-POD achieves a state-of-the-art performance across all object categories. It significantly improves the detection of small objects like cyclists and pedestrians and maintains stable results under various environmental conditions. These results demonstrate the effectiveness of SMM-POD in panoramic multi-modal 3D perception and establish it as a strong baseline for wide FoV object detection.
1. Introduction
Panoramic object detection has emerged as a vital component in applications such as autonomous driving [1] and vehicle-road cooperative systems [2], particularly in large-scale scenarios like traffic networks and parking surveillance. These environments benefit from wide field-of-view (FoV) sensors such as panoramic cameras and wide-angle LiDARs, which provide broader spatial coverage and reduce blind spots. However, most existing 3D object localization models are designed for narrow-FoV inputs—e.g., KITTI [3] or nuScenes [4] datasets—leaving a significant research gap in developing perception systems for wide-FoV settings.
Utilizing panoramic imagery for perception presents unique challenges, particularly in achieving continuous and geometrically consistent feature extraction across the full spherical FOV. Due to the intrinsic characteristics of panoramic imaging, significant geometric distortions frequently arise, especially near image boundaries, adversely impacting the performance of conventional planar-projection-based image methods. Among existing projection techniques, equirectangular projection (ERP) is the most commonly used [5]. However, it introduces substantial distortions near the polar regions and suffers from highly non-uniform spatial resolution. Moreover, the transformation from the original panoramic image to ERP inevitably causes data discontinuities, particularly at the image edges, which undermines object detection accuracy by disrupting spatial consistency and impairing feature alignment [6]. These limitations reveal that single-modality panoramic approaches for 3D object localization remain fundamentally constrained. More importantly, there is still a lack of effective solutions for panoramic multi-sensor fusion frameworks capable of robust object recognition and localization under wide-FoV conditions.
In parallel, multi-modal fusion techniques have gained increasing attention for their ability to enhance detection performance by leveraging the complementary strengths of RGB images and LiDAR point clouds. Despite their successes, the applicability of these methods in wide FoV contexts remains limited. Most existing approaches employ modality-specific backbones that operate independently and perform fusion only at context encoder stages, such as during projection or within the encoder [7,8,9,10]. TransFusion [11] and BEVFusion [12], adopt encoder-level fusion strategies that restrict cross-modal interactions to encoder stages of processing. This design introduces two primary limitations. First, the isolation of modality-specific backbones prevents joint feature learning and hinders the ability to exploit complementary signals during early feature extraction. Second, confining fusion to the encoder stage limits the network’s capacity to leverage low- and mid-level feature interactions, which are particularly important for fine-grained alignment. Few methods, such as EPNet++ [13], mitigate these issues by incorporating cross-modal interactions directly within the backbone network. However, these methods are primarily validated on narrow-FoV datasets and are not readily adaptable to wide-FoV or panoramic applications.
To address these challenges, we propose a unified spherical convolutional neural network (SCNN) fusion framework tailored for wide-FoV multi-modal 3D object localization. Our approach employs a spherical representation to address projection distortions and seamlessly fuses panoramic image features with LiDAR data using attention-based mechanisms. To the best of our knowledge, this work is among the first to propose a dedicated fusion framework for 3D object localization in panoramic scenarios. The main contributions of this work are summarized as follows:
- Spherical panoramic multi-modal framework: We present a spherical convolutional framework designed for panoramic image and point cloud fusion. This framework reduces geometric distortion and improves the alignment of features across different sensor types. To our knowledge, this is the first method that combines spherical CNNs and spherical positional encoding within a transformer-based detection pipeline. This design enables position-aware attention on quasi-uniform Voronoi sphere (UVS) structures, which are essential for accurate panoramic perception.
- Attention-driven multi-stage fusion: We propose a new multi-stage fusion approach that enhances cross-modal interaction at both the feature extraction and context-encoding stages. Specifically, we use a cross-channel attention module to strengthen local feature alignment and a joint multi-head attention mechanism with a feature enhancement unit to improve the global context understanding. This structure improves the model’s ability to represent complex scenes and increases its generalization across object types.
- Extensive validation on panoramic-FoV datasets: We conducted comprehensive experiments on the DAIR-V2X-I dataset (a vehicle-infrastructure cooperative perception benchmark from the RODE dataset) and our panoramic multi-modal dataset SHU-3DPOD. The comparison results of the proposed method with the most advanced single-modal and multi-modal fusion methods show that the proposed method achieves the best success rate in the DAIR-V2X-I dataset, especially for small objects such as pedestrians and cyclists. Additionally, our method maintains consistent detection performance across all object categories. Under the panoramic multi-modal dataset SHU-3DPOD, our method substantially improves the detection accuracy and effectively eliminates the localization drift induced by image distortion.
The remainder of this paper is structured as follows. Section 2 reviews systematic and previous related works. Section 3 describes the overall architecture and innovation of the proposed method in detail. Section 4 provides implementation details and comparative analyses, including the open source and self-collected panoramic dataset, training parameters, and comparison experiments. Section 5 discusses the efficiency of the method and the relevant parts of the ablation studies.
2. Literature Review
2.1. Vision-Based 3D Object Detection
Vision-based 3D object detection methods primarily rely on 2D image information, which often lacks direct depth cues. To compensate for this limitation, many approaches incorporate geometric priors or auxiliary constraints to infer height and spatial depth—particularly in roadside perception scenarios. Most of these methods are built upon convolutional neural networks (CNNs) to extract and process image features. Zhang et al. [14] proposed a ray-aware convolution method to replace the depth-aware convolution for the vehicle monitor. Yang et al. [15] used a background suppression module, which mitigates background overfitting by attenuating background features for 3D object detection. Li et al. [16] proposed a geometrically aligned multi-scale training strategy to unravel the camera parameters and ensure the geometrically consistent monocular detection of the domain. Li et al. [17] proposed the prediction of nine perspective key points of a 3D bounding box in image space and then utilized the geometric relationship between 3D and 2D perspectives to recover the dimensions, positions, and orientations to achieve the 3D detection of objects. Ye et al. [18] proposed the YOLOv7-3D algorithm, designed for single-camera 3D object detection from the roadside viewpoint. MonoGAE [19] employs a supervised training paradigm with ground planes to predict high-dimensional ground-aware embeddings, followed by a new framework for monocular 3D object detection via a cross-attention mechanism integrated with image features. In the BEV field, BEVDepth [20] leverages explicit depth supervision and a camera-awareness depth estimation module to facilitate depth-predicting capability, and BEVHeight [21] designs a regression ground height network for 3D BEV detection. CoBEV [22] integrates a BEV end-to-end framework capable of estimating the depth and height of each pixel and fusing 3D camera features using a two-stage complementary feature selection module.
While these methods show promising performance in terms of accuracy and efficiency, they generally depend on precise camera calibration. This requirement poses a challenge for real-world deployment, especially in vehicle-road cooperative systems, where camera positions can be affected by road vibrations, environmental changes, or natural disturbances. Consequently, the robustness and practicality of monocular vision-based methods remain limited in dynamic and large-scale roadside scenarios.
2.2. LiDAR-Based 3D Object Detection
LiDAR sensors offer accurate 3D structural information and panoramic coverage, making them a key technology for 3D object detection. With decreasing costs and improvements in point cloud resolution, LiDAR-based detection methods have seen steady development in recent years. In autonomous driving applications, laser-based detection solutions, such as [23,24,25,26,27], primarily utilize voxel-based convolutional methods. Although these methods demonstrate significant advantages in detection speed, their accuracy remains limited, particularly in detecting small objects at long distances. CluB [28] focused on cluster-based detectors for LiDAR-based 3D object detection, utilizing a voting mechanism to aggregate foreground points into object-centric clusters. Additionally, PLA-LiDAR [29] highlighted physical laser attacks against LiDAR-based 3D object detection systems, emphasizing the importance of correct detection in autonomous vehicles and robots. Wu et al. [30] discussed the optimization of LiDAR-based detectors for different domains to improve scalability in real-world applications. Finally, RangeDet [31] defended using range view for LiDAR-based 3D semantic segmentation and object detection tasks.
While LiDAR provides strong spatial precision, its effectiveness heavily depends on the quality and density of the point cloud. In practice, sparse or incomplete point clouds—especially those collected from long distances—can significantly reduce the detection performance. Since LiDAR primarily provides geometric coordinates and intensity information, relying on it alone often leads to incomplete perception in challenging or complex scenes.
2.3. Multi-Modal Fusion Object Detection
Combining LiDAR point clouds with camera images enables access to complementary environmental information, significantly improving both the accuracy and robustness of 3D object detection tasks [8,12,32]. LiDAR provides a precise geometric structure, while images contribute rich texture and color details. However, effective fusion remains challenging due to inherent differences between the two modalities. For instance, wide-angle cameras often introduce notable distortion, and LiDAR data tends to be sparse at long ranges. These discrepancies complicate feature alignment and cross-modal information integration. Multi-modal object detection typically employs parallel backbone networks for independent feature extraction, followed by encoding stages, and different fusion strategies usually significantly affect the efficiency and performance, including point-wise, feature, and decision levels. Among them, the point level usually occurs in the original information stage for fusion, as [33]. Feature-level fusion frequently adopts transformer-based architectures such as DETR. Chen et al. [34] proposed a dual-feature interaction module based on a soft-fusion strategy at the feature level. Xu et al. developed FusionRCNN [9] for LiDAR camera fusion, the sparse geometric information of LiDAR, and the dense texture information of the camera are adaptively integrated through a unified attention mechanism. Bai et al. proposed TransFusion [11], a LiDAR camera fusion solution with a soft correlation mechanism to handle poor image conditions, which consists of a backbone network and a detection head based on the transformer decoder. EPNet [35] proposed a multi-modal fusion object algorithm that uses image semantics information to compensate point clouds in the feature extraction stage, while EPNet++ [13] implemented an interactive fusion strategy of two modalities in the feature extraction stage and achieved SOTA performance in 3D object detection. However, these works are all based on the narrow FoV environment. Pang et al. [36] proposed a decision layer to fuse the object detection results of individual sensors through geometric structure and semantic consistency.
Despite progress, most existing methods are developed and validated under narrow FoV conditions. This limits their applicability to real-world settings that require panoramic perception, such as roadside monitoring or urban traffic scenes. Furthermore, many current frameworks only perform coarse fusion at the encoder stage, missing opportunities for deeper cross-modal interaction during early feature extraction. Few studies explore fine-grained, interactive fusion mechanisms at lower layers, which are essential for accurate detection—especially for small or occluded objects.
3. Materials and Methods
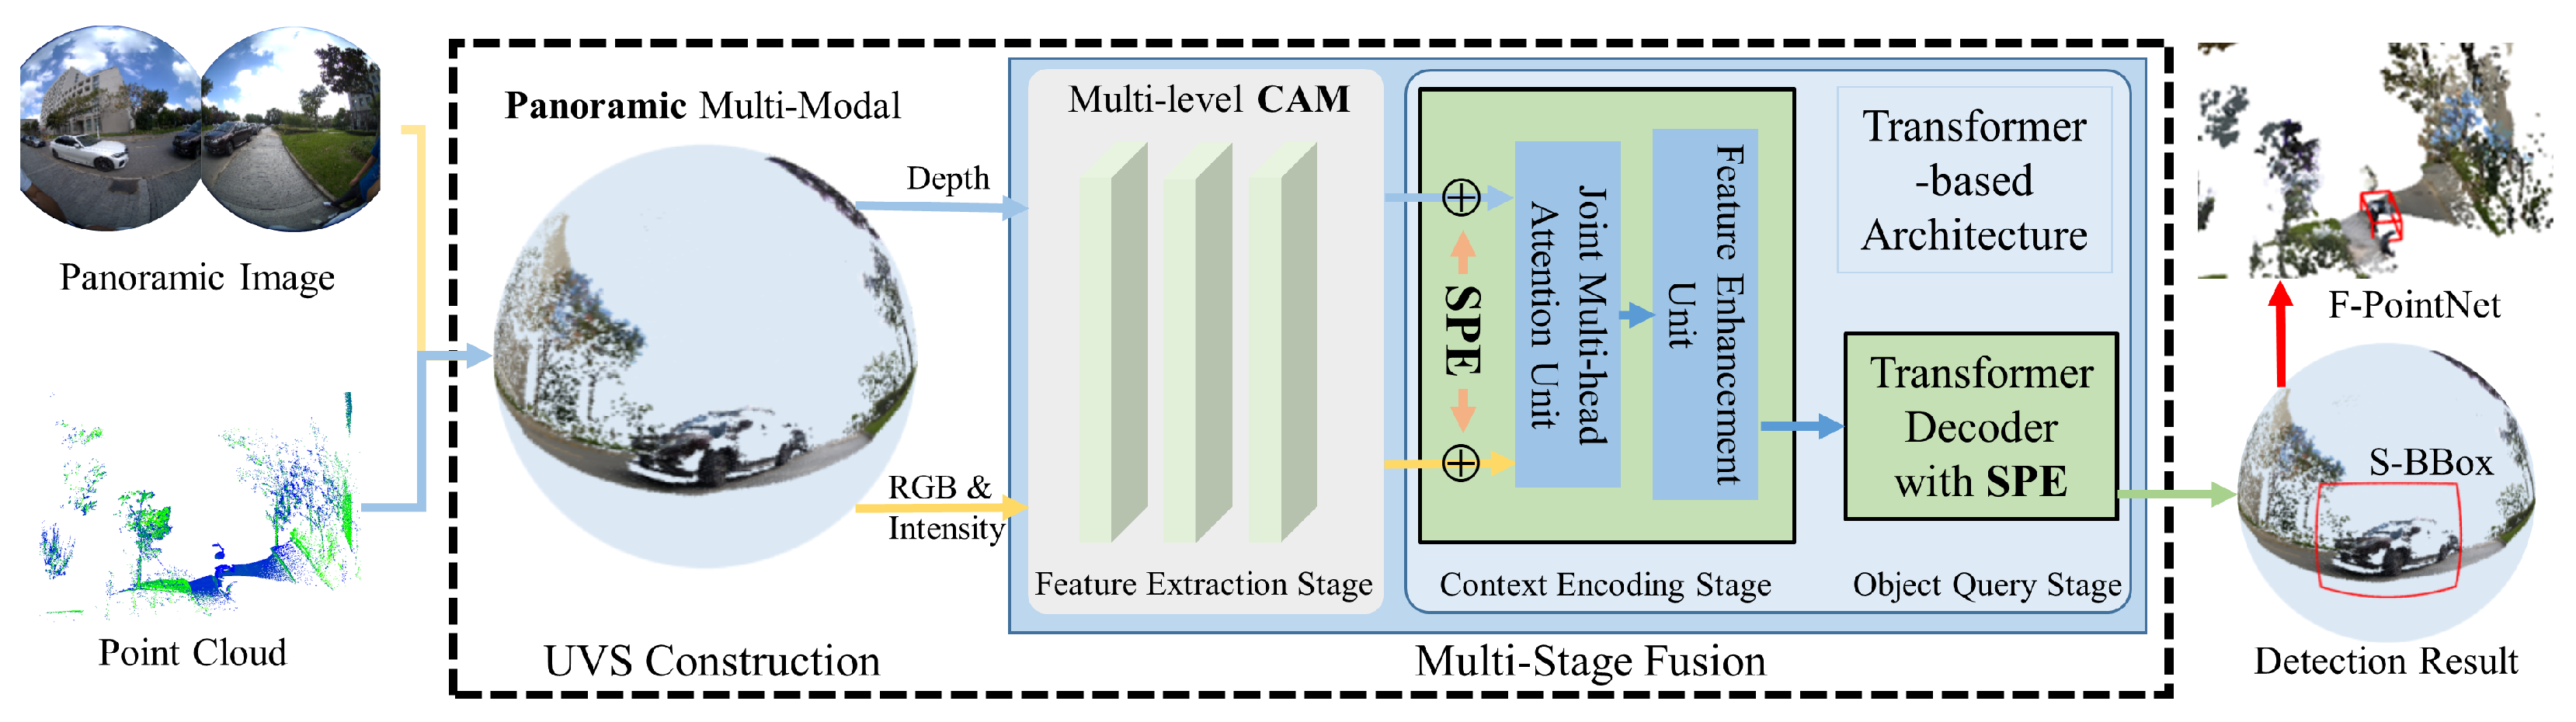
Figure 1 illustrates the proposed multi-modal fusion framework for 3D object detection, which contains two core modules: Panoramic multi-modal image construction and Attention-driven multi-stage fusion framework. In the multi-modal image construction module, each pixel within the sphere-structured panoramic image is aligned with its corresponding depth value captured by the LiDAR, along with the associated intensity information. Subsequently, we proposed a multi-stage cross-attention fusion mechanism to enhance the feature extraction, including the feature extraction stage, the context encoding stage, and the object query stage. Finally, 3D object detection is performed using Frustum PointNet [37], based on the detection results obtained from the spherical image.
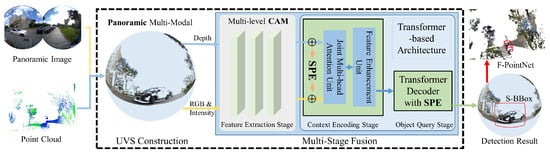
Figure 1.
Overview of the proposed SMM-POD pipeline.
3.1. Spherical Panoramic Multi-Modal Image Construction
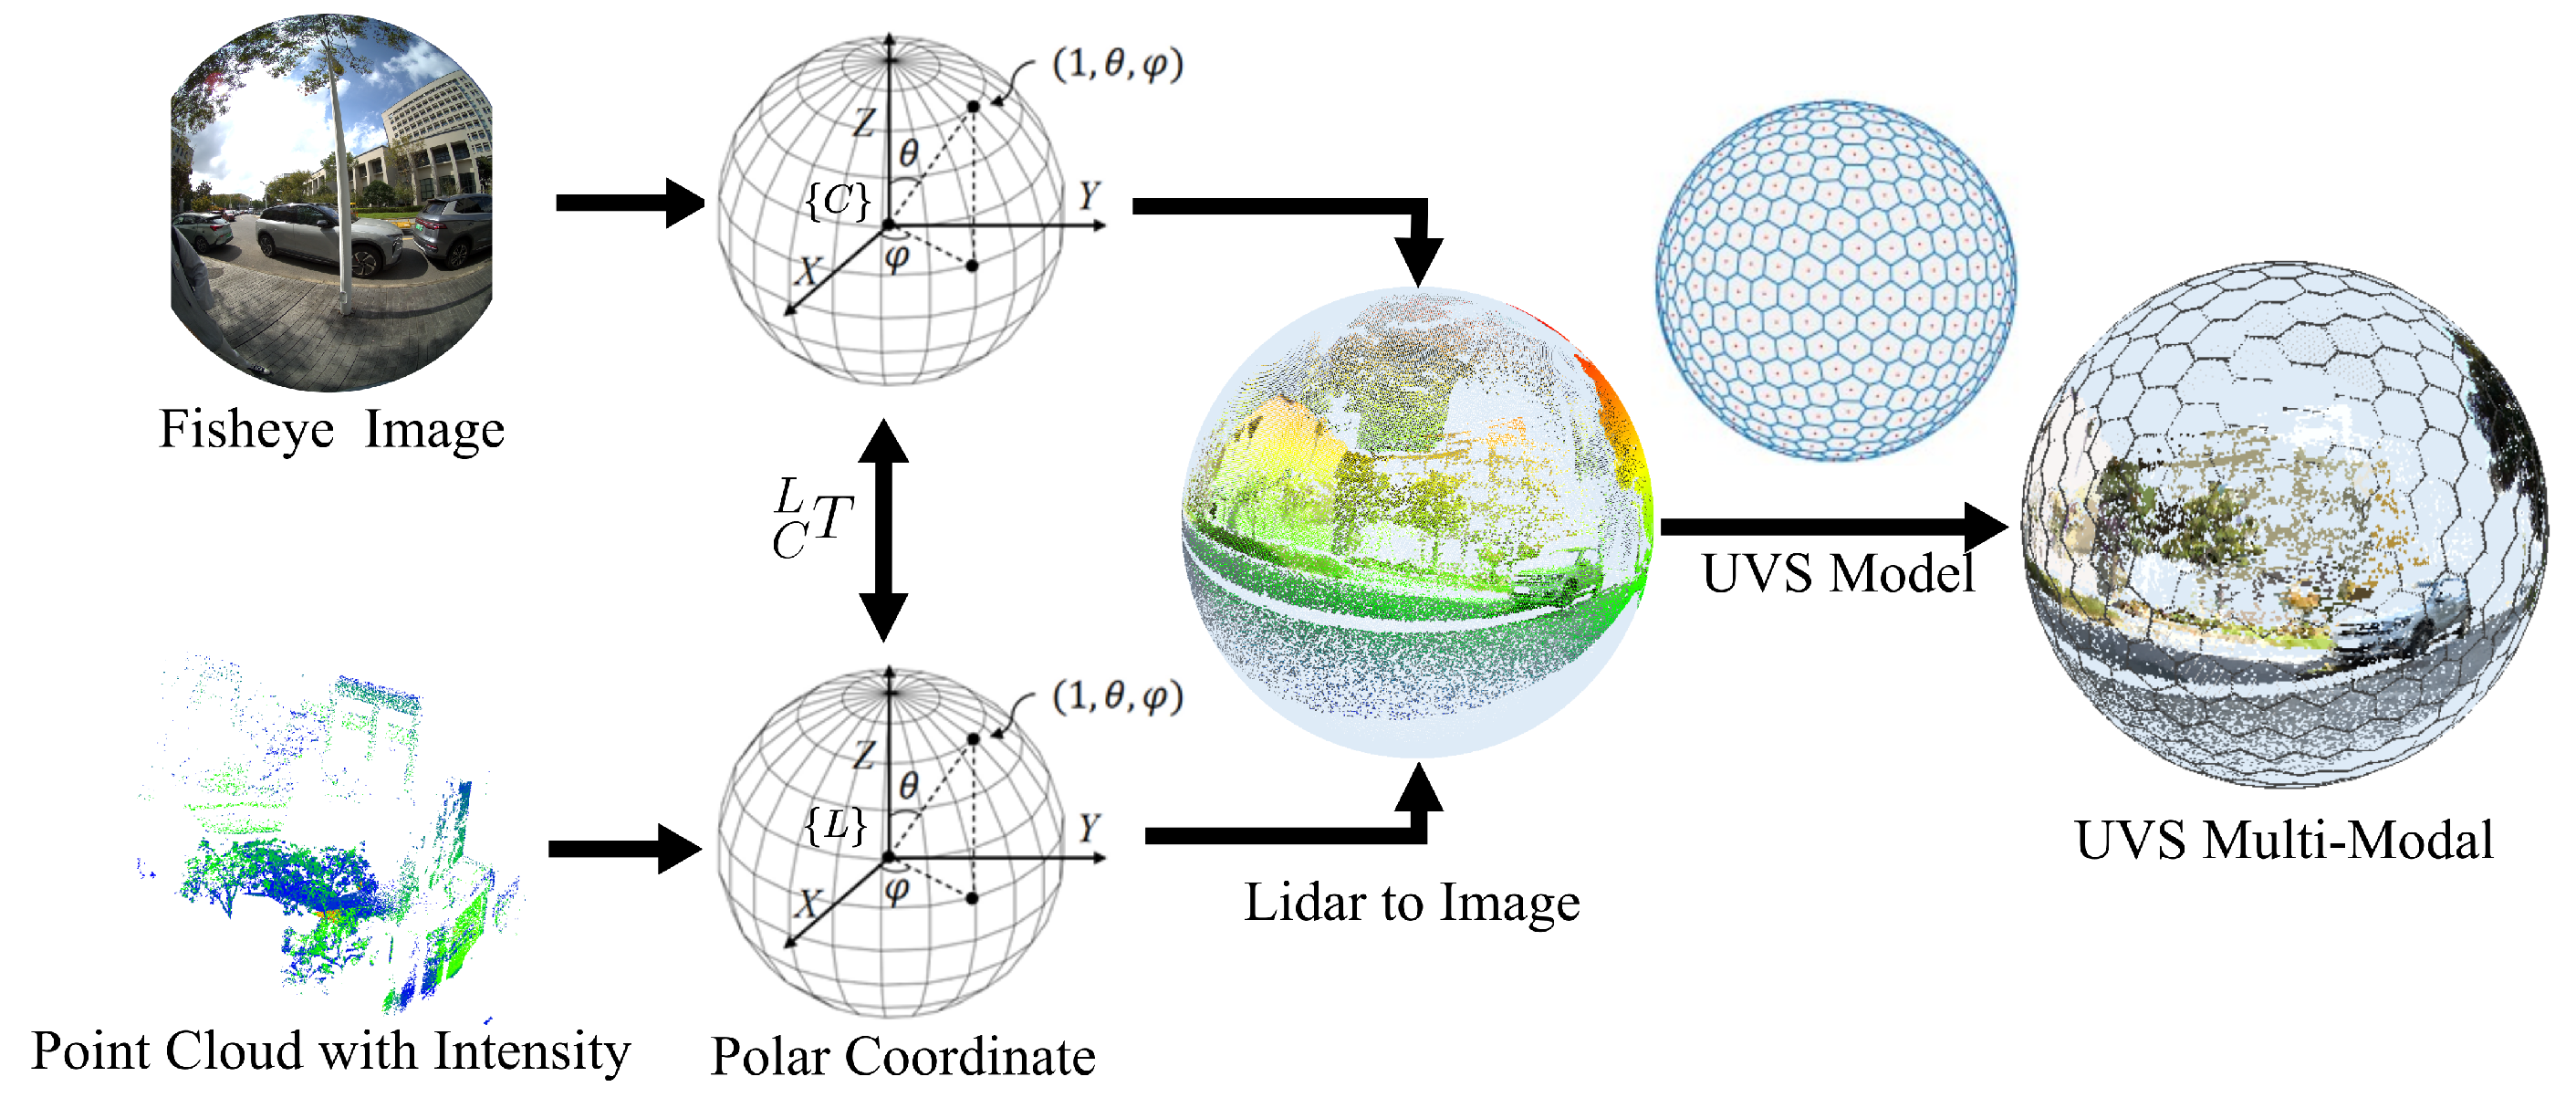
Spherical images are multi-modal data structures that fuse panoramic images and point clouds. Since panoramic images with planar structures, such as equirectangular projection (ERP) structures or fisheye images, will have obvious distortion, especially at the poles or edges, spherical representation is used to depict panoramic images and point cloud information directly. Therefore, the spherical image and spherical point cloud are aligned at the pixel level and uniformly segmented to meet subsequent computational requirements.
For the panoramic image in the spherical structure, regarded as the spherical color image, each pixel is denoted as , where are the coordinates in the spherical polar coordinate system. indicates the color channels for red, green, and blue. To construct the spherical LiDAR image, point cloud data are normalized according to their depths, and the corresponding pixel is represented in the polar coordinate system as well, . are the coordinates of the cloud point in the LiDAR polar coordinate. The depth of the LiDAR pixel is represented as d, and the associated intensity value is expressed as i. The transformation matrix between the camera and the LiDAR coordinate needs to be calibrated before alignment, and the calibration method proposed in [38] is adopted in this paper due to its accuracy and efficiency.
To align the vertices from the spherical color image and spherical LiDAR image, the vertices in the LiDAR coordinate are transformed into the camera polar coordinate by the following equation:
where means the position of the LiDAR vertex on the camera polar coordinate. For each vertex of the spherical color image, the K-nearest neighbor (KNN) algorithm is employed to identify associated LiDAR vertices, and the corresponding depth and intensity information for the color vertex is calculated as the mean values of the neighboring LiDAR vertices.
Eventually, a multi-modal spherical image is generated with each pixel having five channel features , incl. three color channels, one depth channel, and one intensity channel.
Specifically, the UVS model assumes that the vertices distributed on the spherical surface can be treated as particles that interact with each other. Driven by electrostatic forces, particles would converge to a stable state by orchestrating electrostatic repulsion balance. Leveraging the optimized uniformly distributed vertices as the foundation, pixel segmentation is executed utilizing the Voronoi algorithm, as depicted in Figure 2. Since most pixels of the UVS image are hexagonal, area-based sampling is further used for the multi-modal spherical image to decide feature values for the corresponding UVS pixel blocks. The feature value for the UVS pixel block is the mean of all spherical multi-modal spherical pixels inside this block. In this paper, a 7-level subdivision UVS image is built for the multi-modal spherical image, and 163,842 pixels are generated. These pixels are stored in the form of an adjacency list and would be treated for further network operations. UVS images can effectively reduce the distortion of panoramic cameras and can align multi-modal data at the pixel-wise level to reduce the noise impact caused by sensor calibration.

Figure 2.
Generation of quasi-uniform Voronoi sphere (UVS) multi-modal images.
3.2. Multi-Stage Fusion Framework
A multi-stage feature learning and fusion framework is proposed to achieve sufficient feature interaction. Specifically, the backbone network of the multi-modal interactive fusion mechanism is implemented in the feature extraction stage, the transformer-based encoder architecture integrating spherical position coding and joint multi-head attention unit is designed in the context encoding stage, and the decoder incorporating the novel spherical position coding is achieved in the object query stage.
3.2.1. Interactive Feature Extraction with Cross-Attention Modules
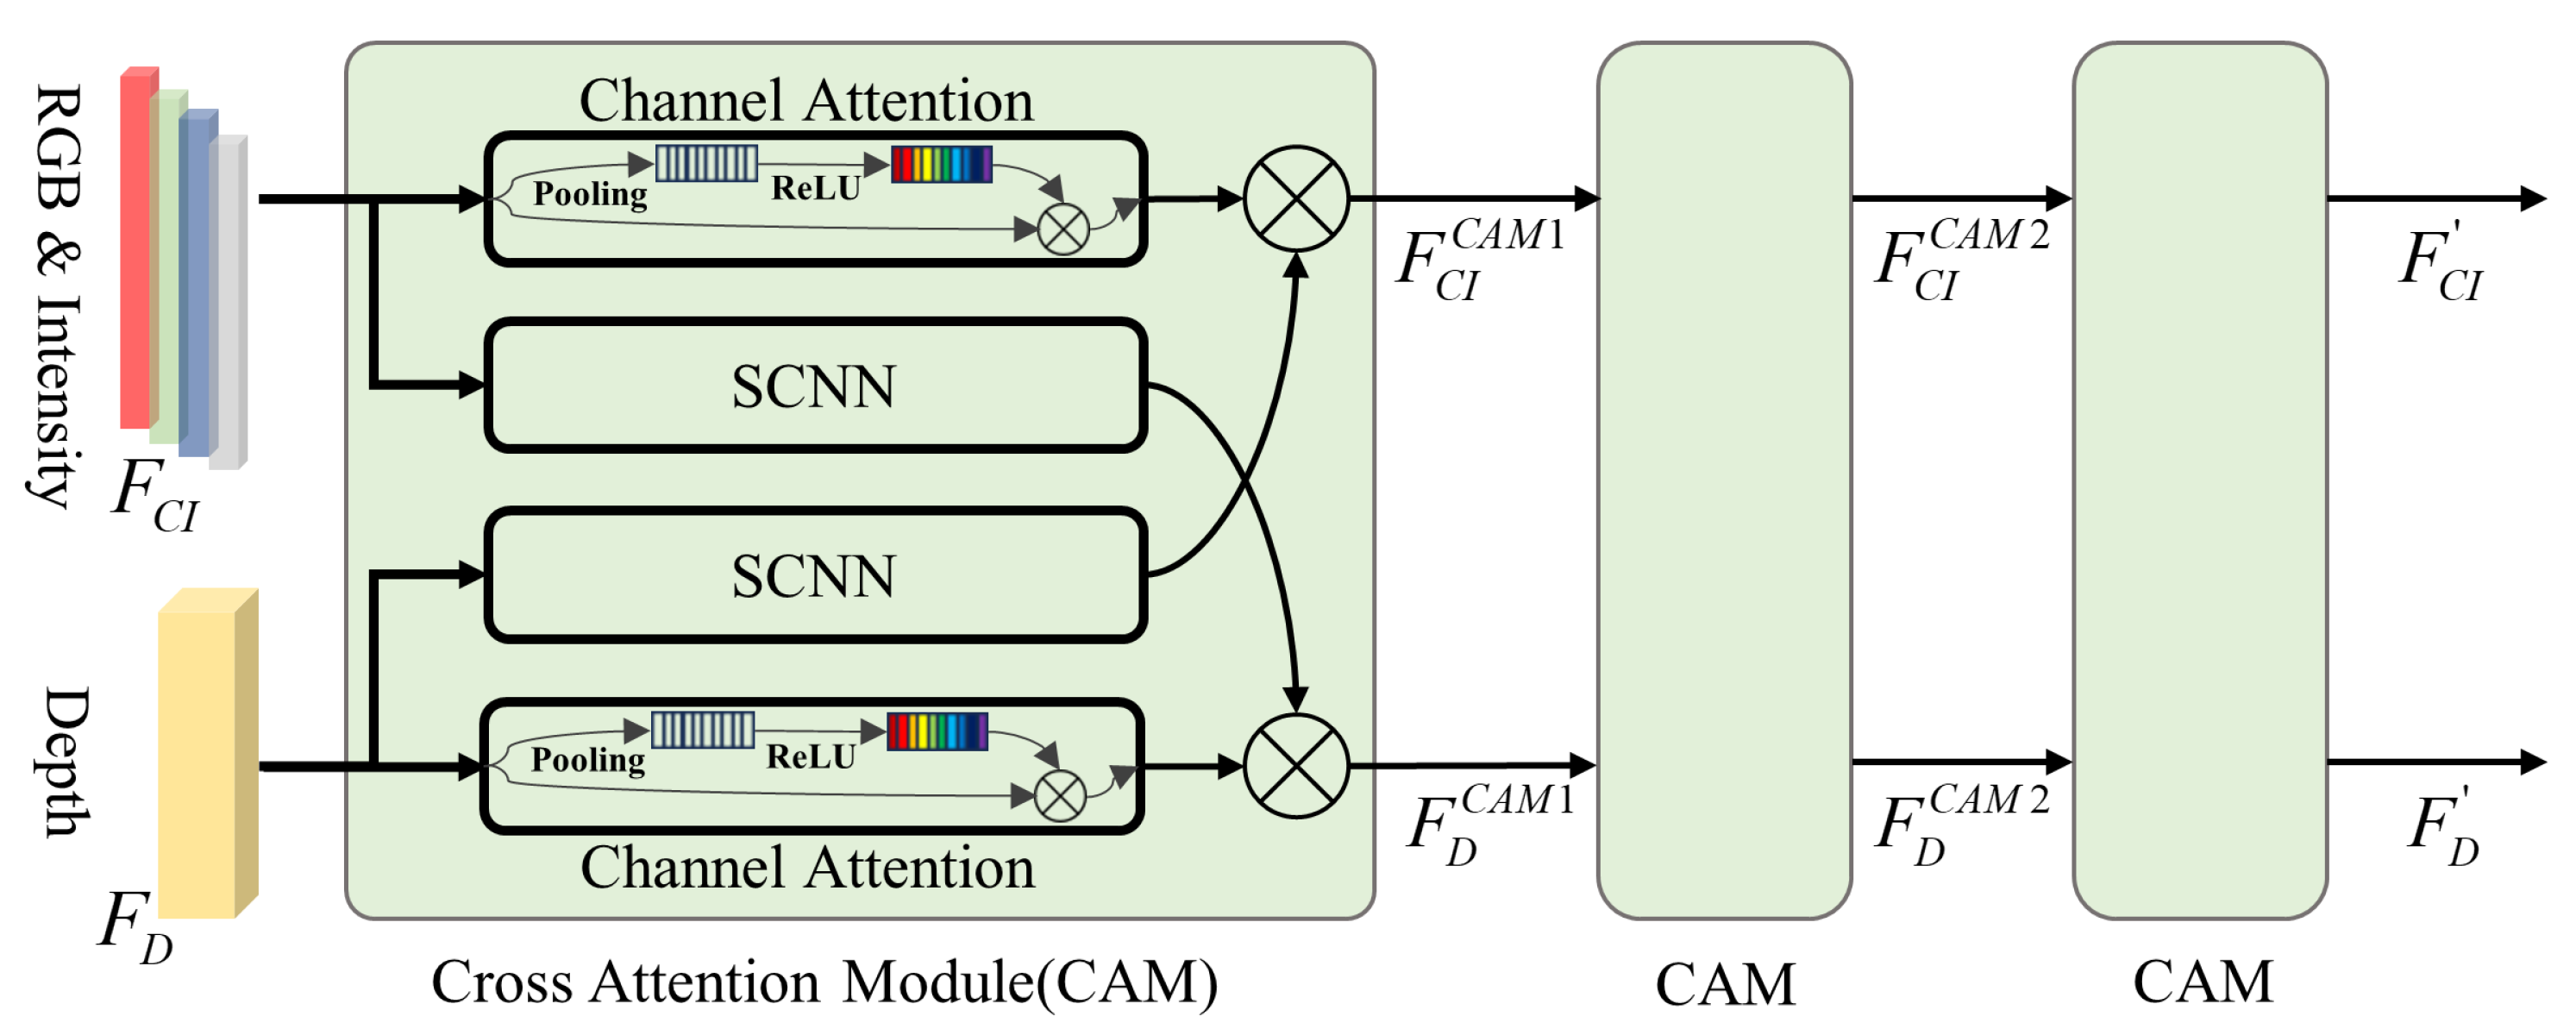
In the feature extraction stage, the feature channels are separated into two branches, one feature branch contains three channels for color and one channel for intensity, since they all represent the texture properties, another feature branch , which means the spatial geometric information of the object. Considering the potential connection between and , cross-attention modules (CAMs) are adopted to facilitate feature extraction, as indicated in Figure 3. For each level of CAM, and are processed in two flows. In the processing flow , a channel attention network is adopted to extract internal significance in object detection among different texture features. A convolution network obtains structure and spatial context information from to facilitate texture recognition. A symmetrical operation is applied for processing . Additionally, two flow features are fused in each flow with an operator ⊗, which means the element-wise multiplication of two sets of vectors. The CAM is cascaded three times to fully interact with the features and obtain enhanced and . The above process is formulated as
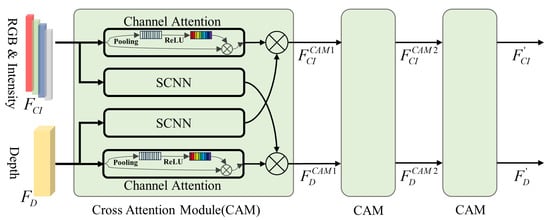
Figure 3.
Multi-level cross-attention module in the feature extraction stage.
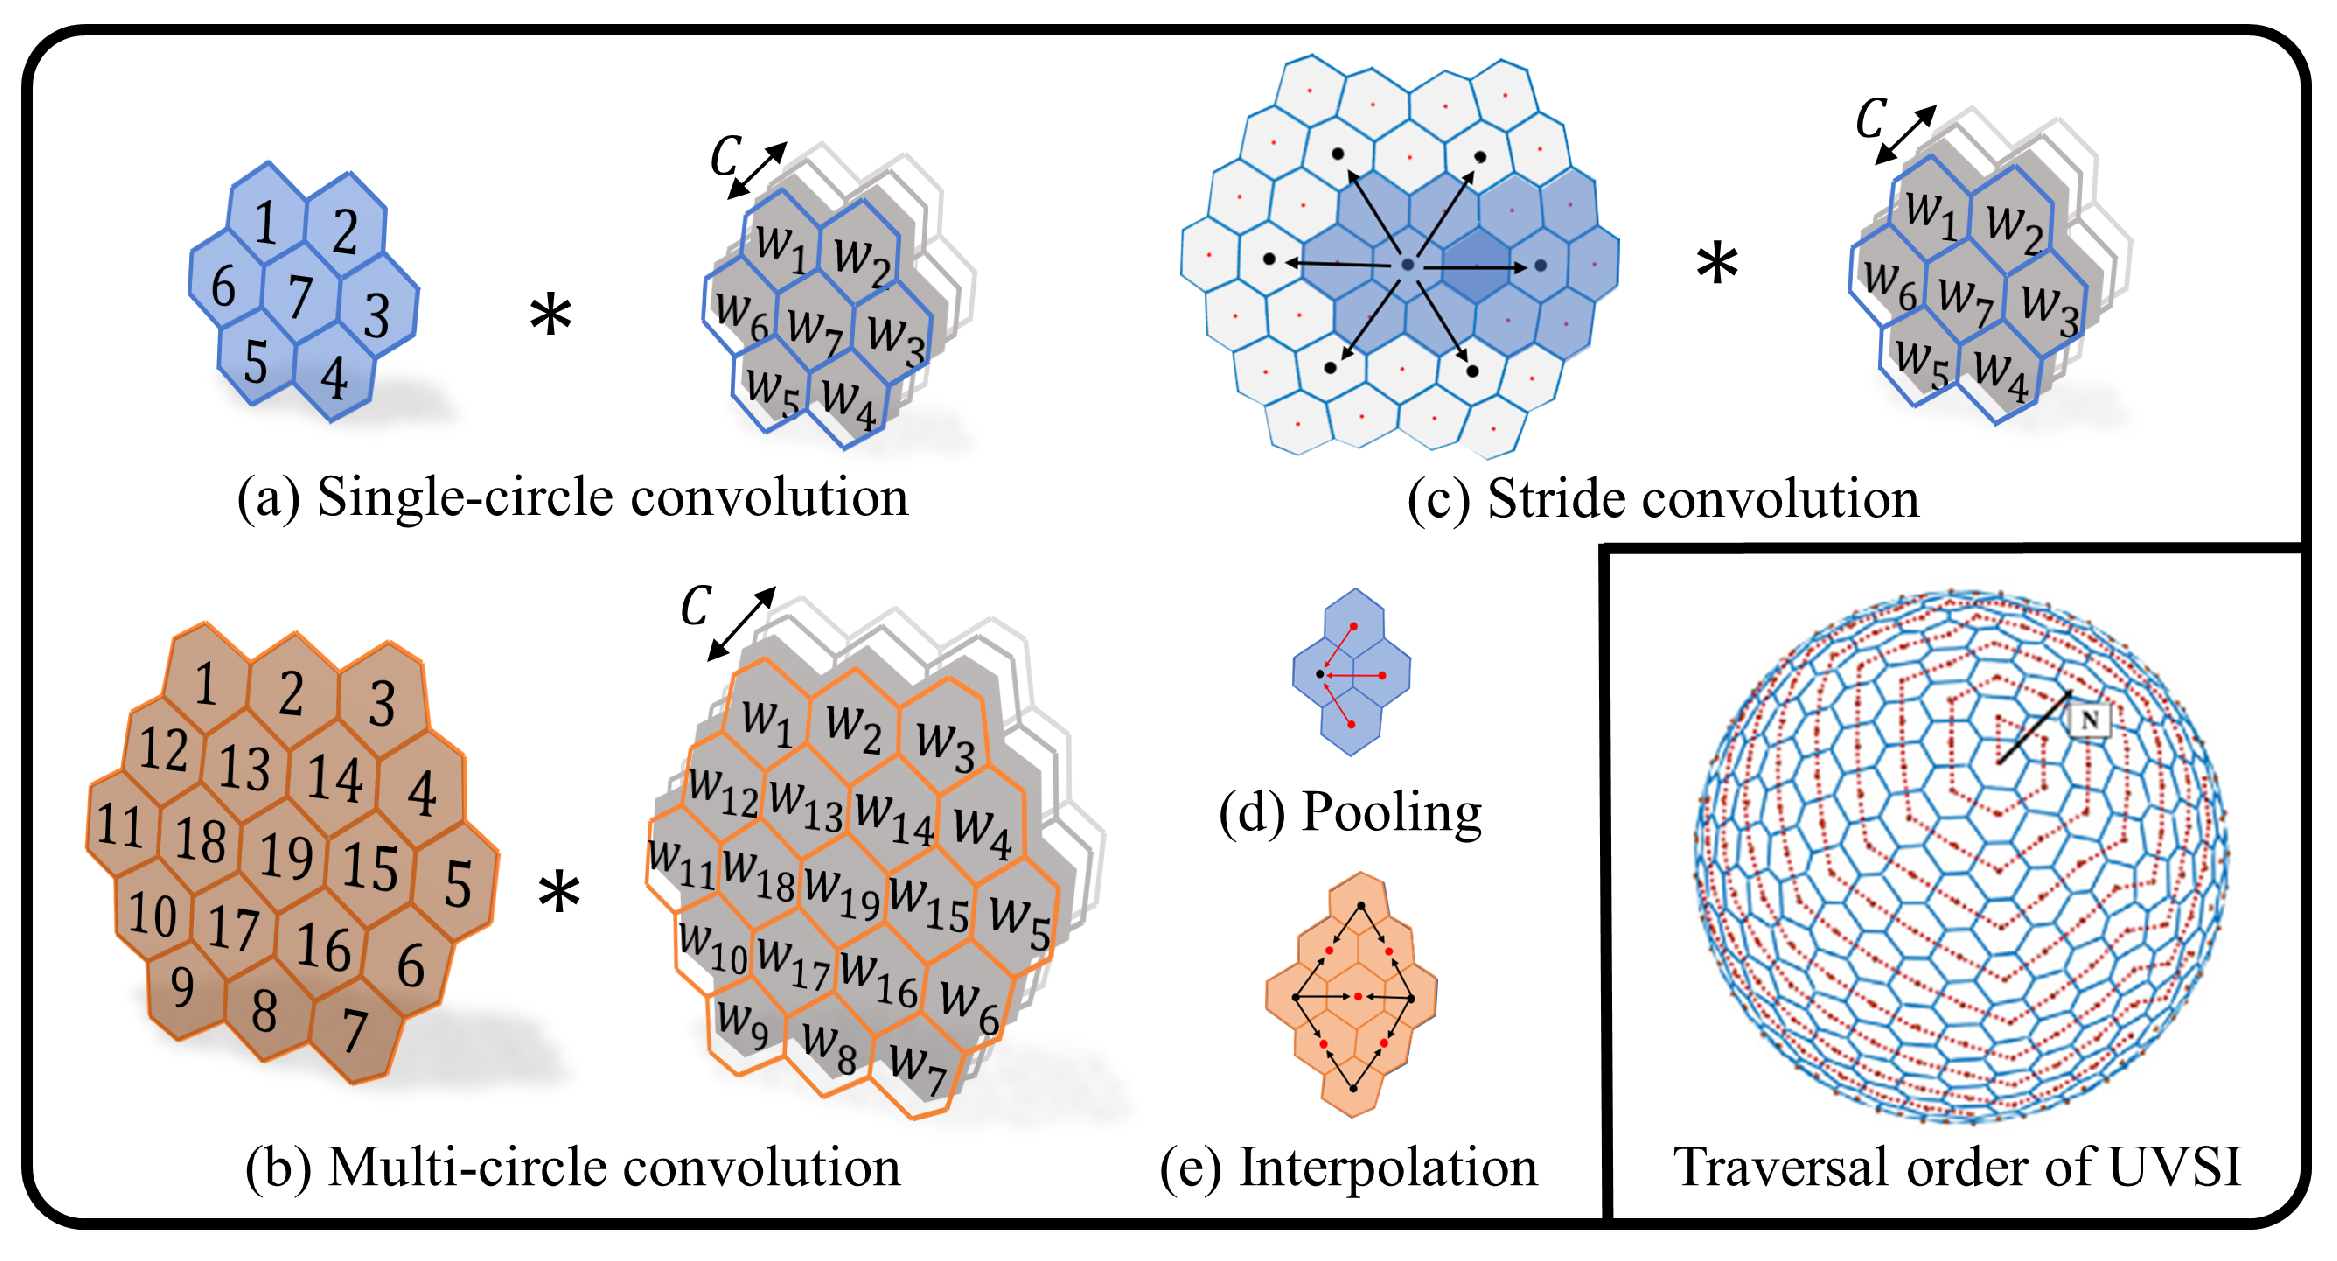
In this paper, the SCNN is designed for the UVS image, where the calculation details are indicated in Figure 4. For more theoretical details, refer to the previous work on UVS-CNNs [39]. UVS-CNNs are a multi-level uniform pixel segmentation method on the spherical model, which encompasses a set of convolution operations designed for the UVS image, including stride convolution, single-circle convolution, multi-circle convolution, pooling, and interpolation, etc. To ensure its extraction effectiveness, this paper selected ResNet-50 [40] as the backbone network architecture, which is a deep residual structure and an excellent feature extractor widely validated.

Figure 4.
The SCNN operations involved in the feature extraction stage and the traversal sequence of the UVS multi-modal image, are primarily adapted from Reference [39]. The symbol ∗ denotes the convolution operation.
3.2.2. Fusion Strategy with SPE in the Transformer Encoder and Decoder
In the context-encoding stage, a transformer-based fusion structure is created, which takes and as inputs, as shown in Figure 5. The encoder mainly contains two units, the joint multi-head attention unit and the feature enhancement unit. The joint multi-head attention unit consists of two multi-head self-attention modules and two multi-head cross-attention modules. The query (Q), key (K), and value (V) matrices for the multi-head self-attention module regarded the values integrating SPE as the inputs. However, the query matrix for the multi-head cross-attention module from the other feature flow integrates SPE as the input. The motivation of this operation is to establish a connection between the spatial geometric features and the texture features.
The extracted feature vectors would be concatenated as and regarded as the input for the feature enhancement unit. After the processing in the feature enhancement unit, an layer is conducted for the output of the feature enhancement unit and the original flow input , and the same procedure is processed for the flow. The above procedure was cascaded six times, defined as N. It is worth mentioning that there is no layer in the final layer, and the result of the Feature Enhancement Unit is transformed into the decoder.
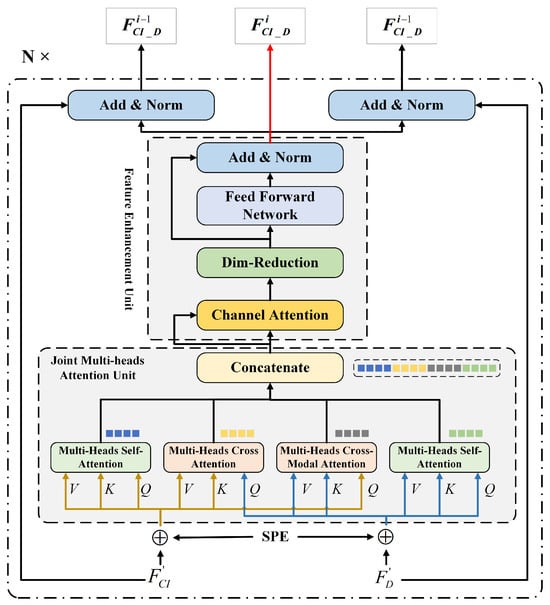
Figure 5.
Fusion framework of encoding networks (multi-modal data features).
Figure 5.
Fusion framework of encoding networks (multi-modal data features).

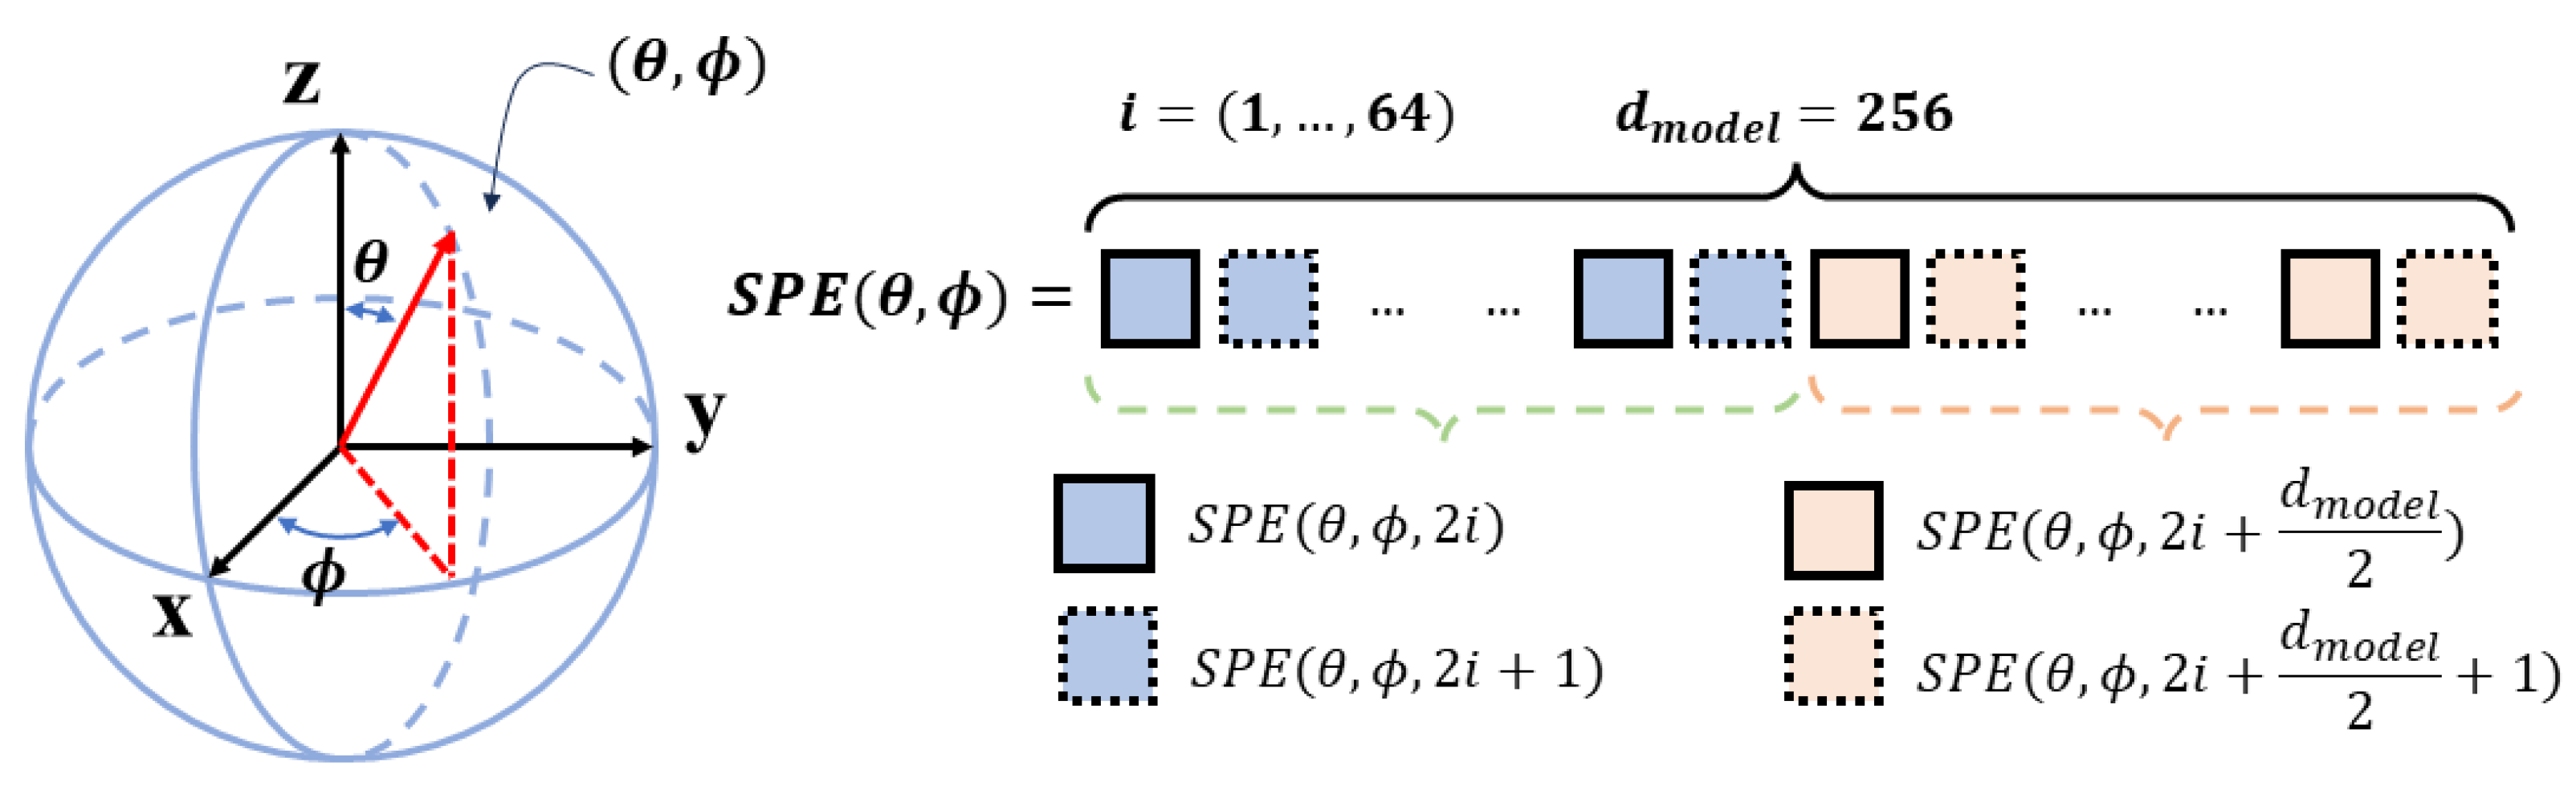
In contrast to the regular distribution of pixels in the planar image, the uniformly distributed pixels in the UVS image do not distribute regularly since the UVS image combines pentagonal and hexagonal pixels simultaneously. Therefore, a novel spherical position encoding (SPE) approach for the UVS image is proposed to be integrated into the transformer-based encoding architecture. As illustrated in Figure 6, the spherical coordinates of the UVS pixel are adopted to encode its positional information. The presented spherical positional encoding V is a 256-dimensional vector whose first 128 dimensions encode the position, and the remaining 128 dimensions encode the positions, whilst the sine and cosine functions are used for different frequencies.
where represents the spherical positional encoding, means the encoding dimension, which is 256 in this paper. The index i ranges from 0 to 63, which takes a quarter of . The positional encodings have the same dimension as the inputs of and .
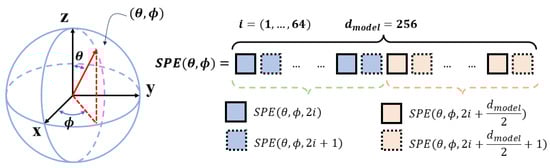
Figure 6.
The detail of spherical positional encoding (SPE).
Regarding the decoder, we utilize the structure presented in [41], enhanced with our novel SPE. The decoder comprises multiple multi-head self-attention modules, and two parallel FFNs are embedded with the decoder output, which predicts the 2D bounding boxes of the object and the corresponding class label using N queries in the format of the one-hot class vector at the object query stage.
3.3. Loss Function Definition
To reduce the number of network parameters and enhance the efficiency of network training, the transformer-based spherical prediction and Frustum-PointNet-based 3D regression networks are trained separately. This independent training approach will optimize computational resources and allow the models to adapt to distinct application scenarios effectively. For instance, the results of 2D spherical regression can be directly applied to tasks such as traffic monitoring, thereby improving the domain adaptation capabilities of the proposed network. The loss function of the transformer-based spherical detection network, the core part of this work, is defined as Equation (11).
where represents the predictive anchor boxes that are best matched to the actual anchor boxes by the Hungarian algorithm, N is the count of ground truths, are the regression results of spherical bounding box (S-BBox), denotes the loss weights for border regression, denotes the loss weight for classification, c denotes object types, denotes weight of the bounding boxes’ GIoU loss, referring to the GIoU definition in [42].
With the help of the method proposed in this paper, the two-dimensional region coordinates suitable for the spherical coordinate system can be obtained on the spherical multi-modal image. Figure 7 shows the process of modal fusion and its corresponding detection results in steps. This scene contains three categories of detection objects, which can fully demonstrate the advantages and effects of panoramic FoV detection.
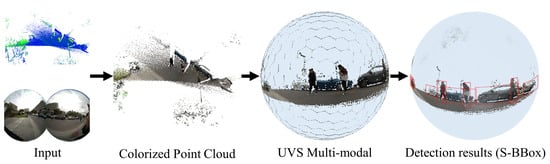
Figure 7.
Visualization of detection results S-BBox of spherical images.
Finally, this work uses Frustum PointNet [37] to project each 2D detection box into a 3D frustum, cut out the corresponding points in the point cloud, and send these points to the PointNet network to regress the 3D bounding box position and size.
4. Results
4.1. Dataset Introduction
Due to the absence of standardized panoramic multi-modal datasets for 3D object detection, this paper adopts the widely used DAIR-V2X-I dataset [43] for evaluation. As a benchmark dataset in this field, DAIR-V2X-I provides comprehensive panoramic perception capabilities by offering both wide FoV LiDAR and visual data. In addition, it supports long-range sensing up to 300 m, which is essential for accurate 3D object detection at a distance. The dataset covers diverse and complex traffic scenarios and includes high-quality joint annotations in both 2D and 3D. Following common practice in related work, we utilize multi-modal data within the range of 0, taking into account the limited density of LiDAR points, the reduced accuracy of spherical images, and the scarcity of annotations beyond this range.
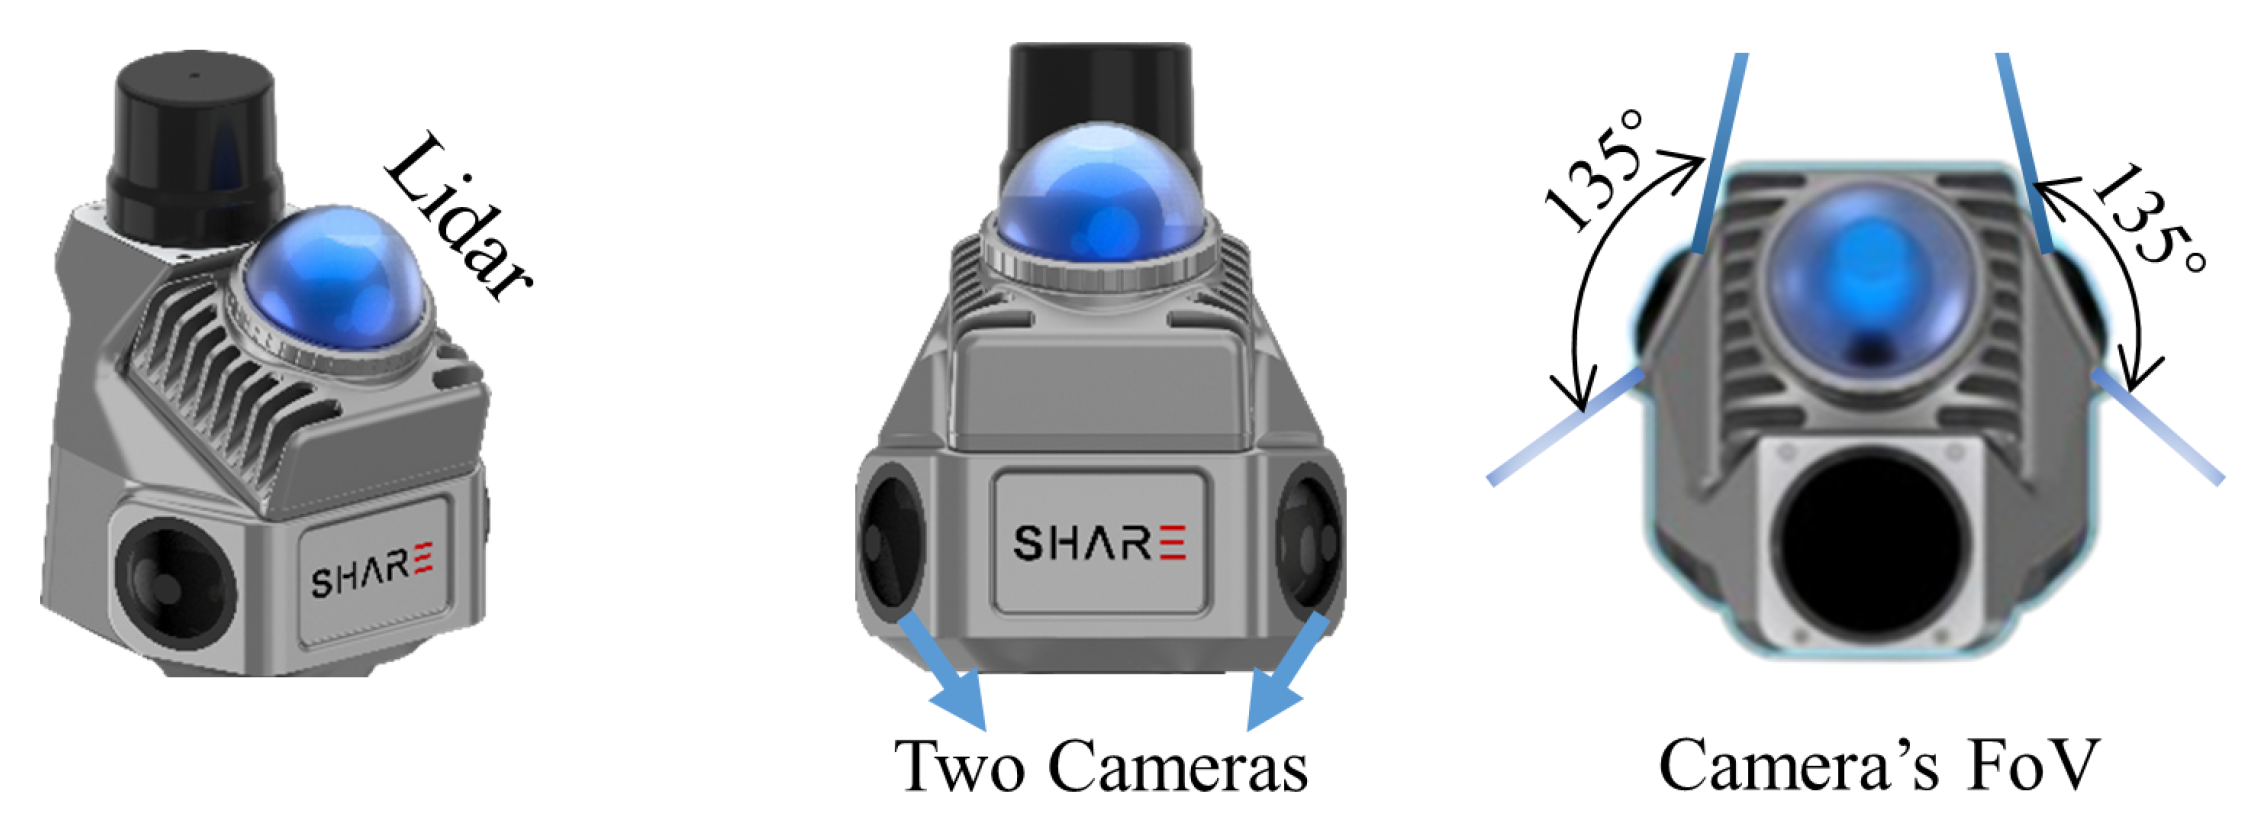
To further validate the effectiveness of our method in panoramic surveillance scenarios, we collected a comprehensive multi-modal dataset (SHU-3DPOD) using the SHARE S10 platform, which integrates a 360° mid-range LiDAR and two wide-angle fisheye cameras mounted at a 135° angle (Figure 8). The LiDAR provides a horizontal FoV of 360° and a vertical range from −7° to 52°, while the combined camera system achieves a panoramic FoV of up to 360° × 270°. The LiDAR’s scanning region defines the effective multi-modal perception coverage. Using this setup, we simulated diverse sensor poses and viewing angles representative of real-world surveillance deployments, and collected data across various scenes on the Shanghai University campus. The resulting SHU-3DPOD dataset contains 520 frames with high-quality 3D annotations, including 1408 cars, 288 pedestrians, and 233 cyclists. Challenging conditions such as wide FoV distortion, frequent occlusion, varying lighting, and extended perception ranges are prominently featured—characteristics aligned with the operational assumptions of our spherical detection framework. To ensure data reliability, all sensors were rigorously calibrated, and annotations were manually verified by a professional team. Compared to the public DAIR-V2X-I dataset, SHU-3DPOD benefits from higher-resolution sensors and denser LiDAR, which enhance detection performance, especially for small and occluded targets.

Figure 8.
Panoramic data collection equipment (dual wide-angle cameras + 360° LiDAR).
4.2. Experimental Parameters Setting
All verification experiments in this study were conducted on a workstation equipped with an Intel i7-14700K CPU (Intel, Santa Clara, CA, USA), an NVIDIA RTX 4090 GPU (NVIDIA, Santa Clara, CA, USA), and 128 GB of RAM. The UVS image construction utilizes the KNN algorithm with a neighborhood size of . During the training phase, all models adopt consistent core hyperparameters: the total number of training epochs is 500, and the initial learning rate for the Transformer-based architecture is . A learning rate decay strategy is applied via the mechanism, reducing the learning rate every 200 epochs to facilitate convergence. For the Frustum PointNet module, a fixed learning rate of is used to maintain the training stability. The detailed training parameters, summarized in Table 1, are carefully tuned for the two datasets with differing characteristics to ensure optimal performance.

Table 1.
Training parameters setting of two test datasets.
4.3. Comparison on DAIR-V2X-I Dataset
We conduct a comprehensive comparison with previous 3D object detection methods on the DAIR-V2X-I dataset, covering LiDAR-only, image-only, and LiDAR-image fusion paradigms. We allocate 20% of the sequences as the test set, while the remaining data is used for training and validation.
As summarized in Table 2, the evaluated methods include LiDAR-based approaches [23,24,26,27], image-based approaches [20,21,22,44,45], and multi-modal fusion methods [7,10,46], all tested on the original DAIR-V2X-I validation set. Experimental results demonstrate that the SMM-POD consistently outperforms all baselines across almost all object categories, achieving significant improvements in 3D detection accuracy. The only exception appears in the easy subset of the vehicle category, where our method slightly underperforms the best-performing image-based approach, BEVHeight, by a margin of only 0.52% in AP. In all other cases, SMM-POD achieves superior results. Specifically, in the remaining subsets of the vehicle category, SMM-POD outperforms BEVHeight by 11.45% on the moderate level and by 9.39% on the hard level. For the pedestrian category, our method achieves improvements over the best multi-modal method LoGoNet by 5.18%, 6.57%, and 3.54% in the easy, moderate, and hard levels, respectively. For the cyclist category, SMM-POD also shows significant gains over BEVHeight, with improvements of 9.38%, 9.53%, and 9.12% across the easy, moderate, and hard levels, respectively.
Table 2.
Comparative performance evaluation on the DAIR-V2X-I dataset using the mean average precision (mAP) metric. Objects are classified into three difficulty levels (easy, mod., hard) based on occlusion and truncation severity. The table presents overall mAP averaged across all difficulty levels, and individual performance ranges for each difficulty category. The best performances are highlighted in bold.
Another notable advantage of our proposed method lies in its unprecedented consistency across object categories and difficulty levels in 3D detection and localization. As illustrated in Table 2, SMM-POD achieves a highly uniform performance across all evaluated classes, demonstrating strong generalization and balanced recognition capability. Specifically, in the vehicle category, the performance variation between difficulty levels is only 2.02%. For the pedestrian category, the variation is slightly larger at 3.12%, yet still highly stable compared to the prior works. Remarkably, in the cyclist category, the AP scores across easy, moderate, and hard settings are almost identical, with a variation of merely 0.05%. This level of consistency indicates that the model is capable of robustly detecting both large and small, simple and complex objects under varying levels of difficulty. Moreover, the overall mAP scores across the three classes are comparably high: 76.57% for vehicles, 71.07% for pedestrians, and 69.63% for cyclists. This balanced performance underscores that our comprehensive fusion contributes not only to high accuracy but also to cross-category robustness, addressing one of the key limitations observed in both unimodal and prior fusion-based approaches.
Point cloud-based 3D object detection methods face inherent limitations, particularly in complex roadside scenes. Techniques such as PointPillars and PV-RCNN suffer from spatial detail loss due to 2D projection or fixed voxel partitioning, while increasing distance leads to point cloud sparsity and incomplete object representation. Although methods like SECOND achieve competitive vehicle detection (71.47%), their performance on small or visually complex objects drops significantly. For example, PointPillars yields only 37.67% mAP for pedestrians and 27.85% for cyclists. These results highlight the challenges of relying solely on LiDAR, which lacks semantic richness and struggles with fine-grained or distant target recognition.
Camera-only 3D detection methods typically infer spatial geometry using estimated depth, height priors, or attention mechanisms, but the absence of direct 3D measurements introduces uncertainty in BEV representations. This limitation is pronounced in roadside scenarios, where small objects like pedestrians lack clear geometric cues. BEVDepth and BEVFormer achieve strong vehicle detection (64.34% and 53.84% mAP), but perform poorly on pedestrians (39.06% and 16.22%). Even improved methods like BEVHeight and CoBEV still underperform on pedestrian detection compared to cyclists. Moreover, camera-only models rely on LiDAR-supervised depth learning, making them sensitive to domain shifts such as viewpoint or lighting changes, which limits their robustness in varied deployment conditions.
While multi-modal approaches () theoretically offer richer spatial and semantic information, existing fusion methods often fail to fully exploit the complementarity between LiDAR and camera inputs during feature extraction. Several prior fusion-based methods such as MVXNet and LoGoNet achieve relatively high performance on vehicle detection, yet their results on the cyclist category (mAP of 30.05% and 36.59%, respectively) fall behind even strong camera-only methods such as BEVHeight (mAP of 55.34%) and CoBEV (mAP of 53.72%). These results indicate that the context-encoding stage or shallow fusion fails to capture fine-grained details in visually complex objects like cyclists. In contrast, our multi-stage fusion strategy progressively integrates LiDAR geometry and image semantics, enabling more effective modality interaction and improved detection accuracy.
Overall, the experimental results confirm that the early and continuous fusion of LiDAR and image features is essential to maximize the strengths of both sensors. In particular, vision contributes substantially to the detection of visually rich and structurally detailed objects like cyclists, and our framework successfully captures this synergy. This highlights the core advantage of our method over previous fusion-based approaches.
4.4. Comparison on Panoramic SHU-3DPOD Dataset
The SHU-3DPOD dataset was collected in a campus environment and is specifically designed to evaluate the robustness of 3D object detection algorithms. To this end, the dataset includes diverse scenarios with variations in lighting conditions, scene coverage, and object distribution. Following standard practice, 80% of the data is used for training and the remaining 20% is reserved for testing. In addition to the commonly used , we adopt two complementary evaluation metrics for 3D object detection: the mean center error () and the mean angle error (), which provide a more fine-grained assessment of localization accuracy. These metrics are formally defined in Equations (12) and (13).
where and represent the predicted outcome and the ground truth, respectively, D and are the center coordinate and rotation angle of the 3D box.
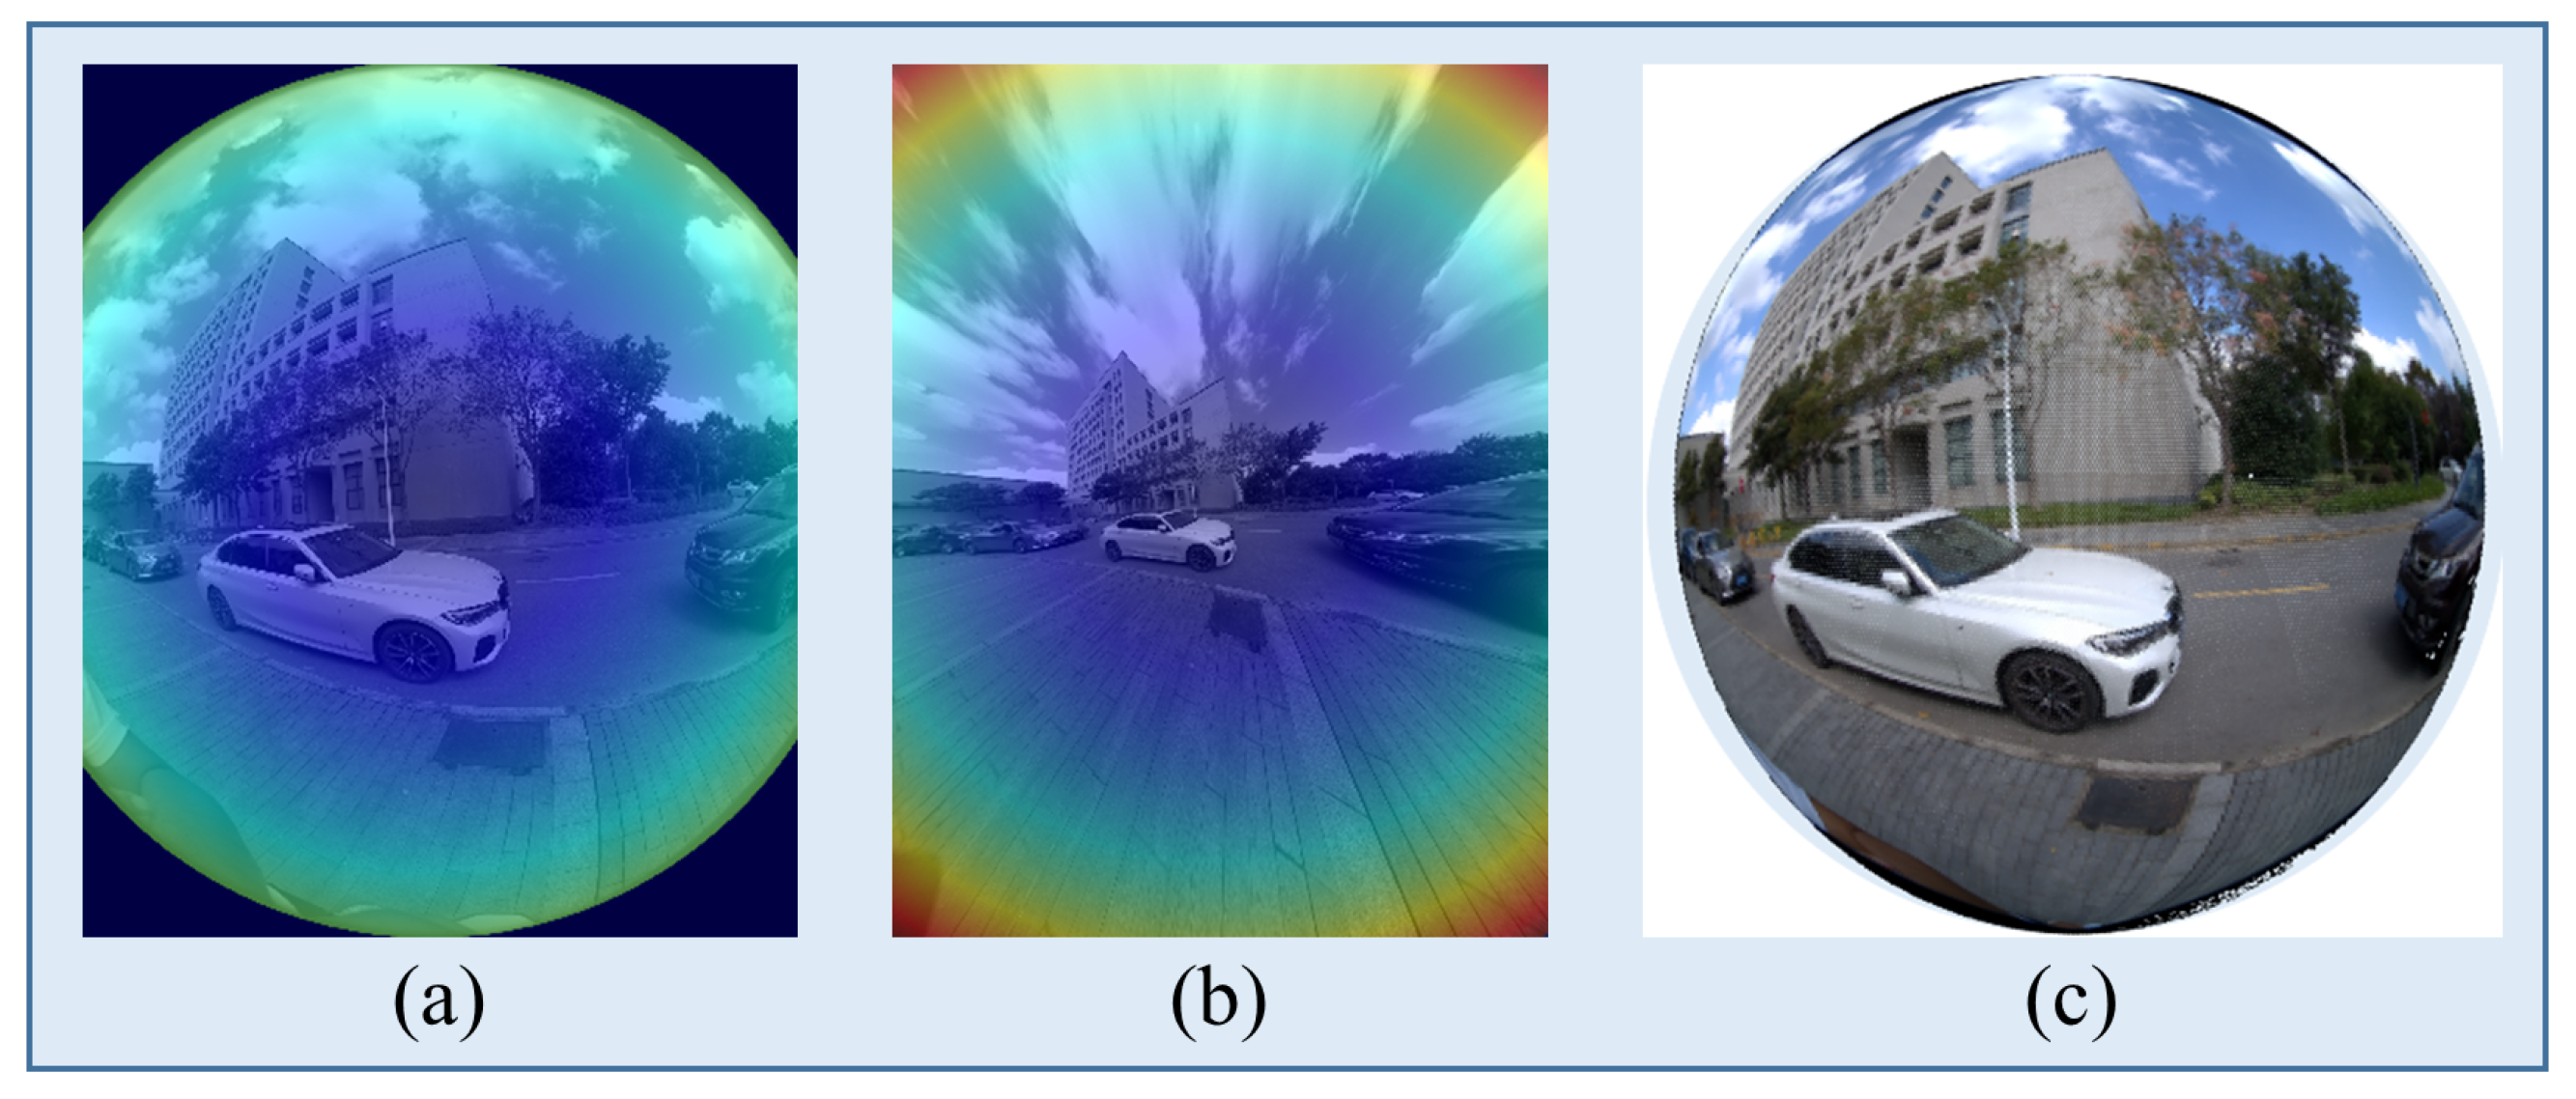
To evaluate the robustness and generalizability of our approach, we compare SMM-POD with two representative multi-modal fusion baselines, FocalsConv [47] and LoGoNet [7], on the SHU-3DPOD dataset. Since both baselines were originally designed for planar imagery, we adapt them to the panoramic setting using three image modalities derived from the same raw fisheye input: (i) the original fisheye images, (ii) ERP images, and (iii) undistorted images. ERP images are generated via OpenCV-based reprojection using calibrated intrinsics and distortion parameters, while the undistorted images are produced by radial distortion correction followed by central cropping. Figure 9 utilizes a heat-map effect to show the distortion of images with different wide FoV.

Figure 9.
Visualization of edge distortion correction across different panoramic representations. (a) Fisheye image exhibiting significant edge distortion. (b) ERP image after applying distortion parameter correction, showing the partial alleviation of edge stretching. (c) The final result of the UVS model correction is using spherical projection, where peripheral distortions are effectively mitigated and visual consistency is improved.
To ensure a fair comparison, all methods are evaluated using the same synchronized LiDAR and fisheye inputs, with unified extrinsic calibration applied across sensors. The input FoV is kept consistent across all settings. Furthermore, we do not apply additional data augmentation or heuristic tuning, and all baseline models are retrained using their default optimal hyperparameters under our dataset. Each image format introduces distinct geometric distortions. Fisheye images preserve a wide FoV but suffer from radial compression near the periphery, affecting geometric fidelity. ERP images offer a normalized layout but introduce polar stretching and seam discontinuities, undermining global consistency. Undistorted images reduce local distortion but truncate peripheral information, narrowing the effective FoV. These issues impair pixel-level alignment across modalities and degrade the performance of baseline models reliant on precise correspondence. In contrast, our method performs fusion directly on a unified spherical representation via quasi-uniform Voronoi sampling, preserving angular geometry and enabling accurate cross-modal alignment. This design leads to superior geometric consistency and fusion robustness in panoramic scenarios.
The comparison results are presented in Table 3. It can be observed that fisheye images suffer from strong radial distortion, limiting the usable field of view and increasing angular errors (e.g., FocalsConv reports 11.53° mAE and 55.98% mAP for cars). ERP projections introduce texture artifacts due to remapping, degrading feature quality. While distortion removal improves local geometric accuracy, it narrows the field of view and causes missing semantic context, leading to performance drops on peripheral objects (e.g., LoGoNet drops to 30.41% cyclist mAP). In contrast, our SMM-POD leverages dense geometric cues from LiDAR and rich semantic features from images in a tightly coupled fusion framework. It consistently outperforms all baselines across all object categories and accuracy metrics. For example, on car detection, it achieves the lowest center and angle errors (0.24 m and 0.45°) and the highest mAP of 81.27%. For pedestrian and cyclist detection, it also delivers a superior performance (94.95% and 85.66% mAP, respectively).
Table 3.
Comparison tests with the SHU-3DPOD dataset.
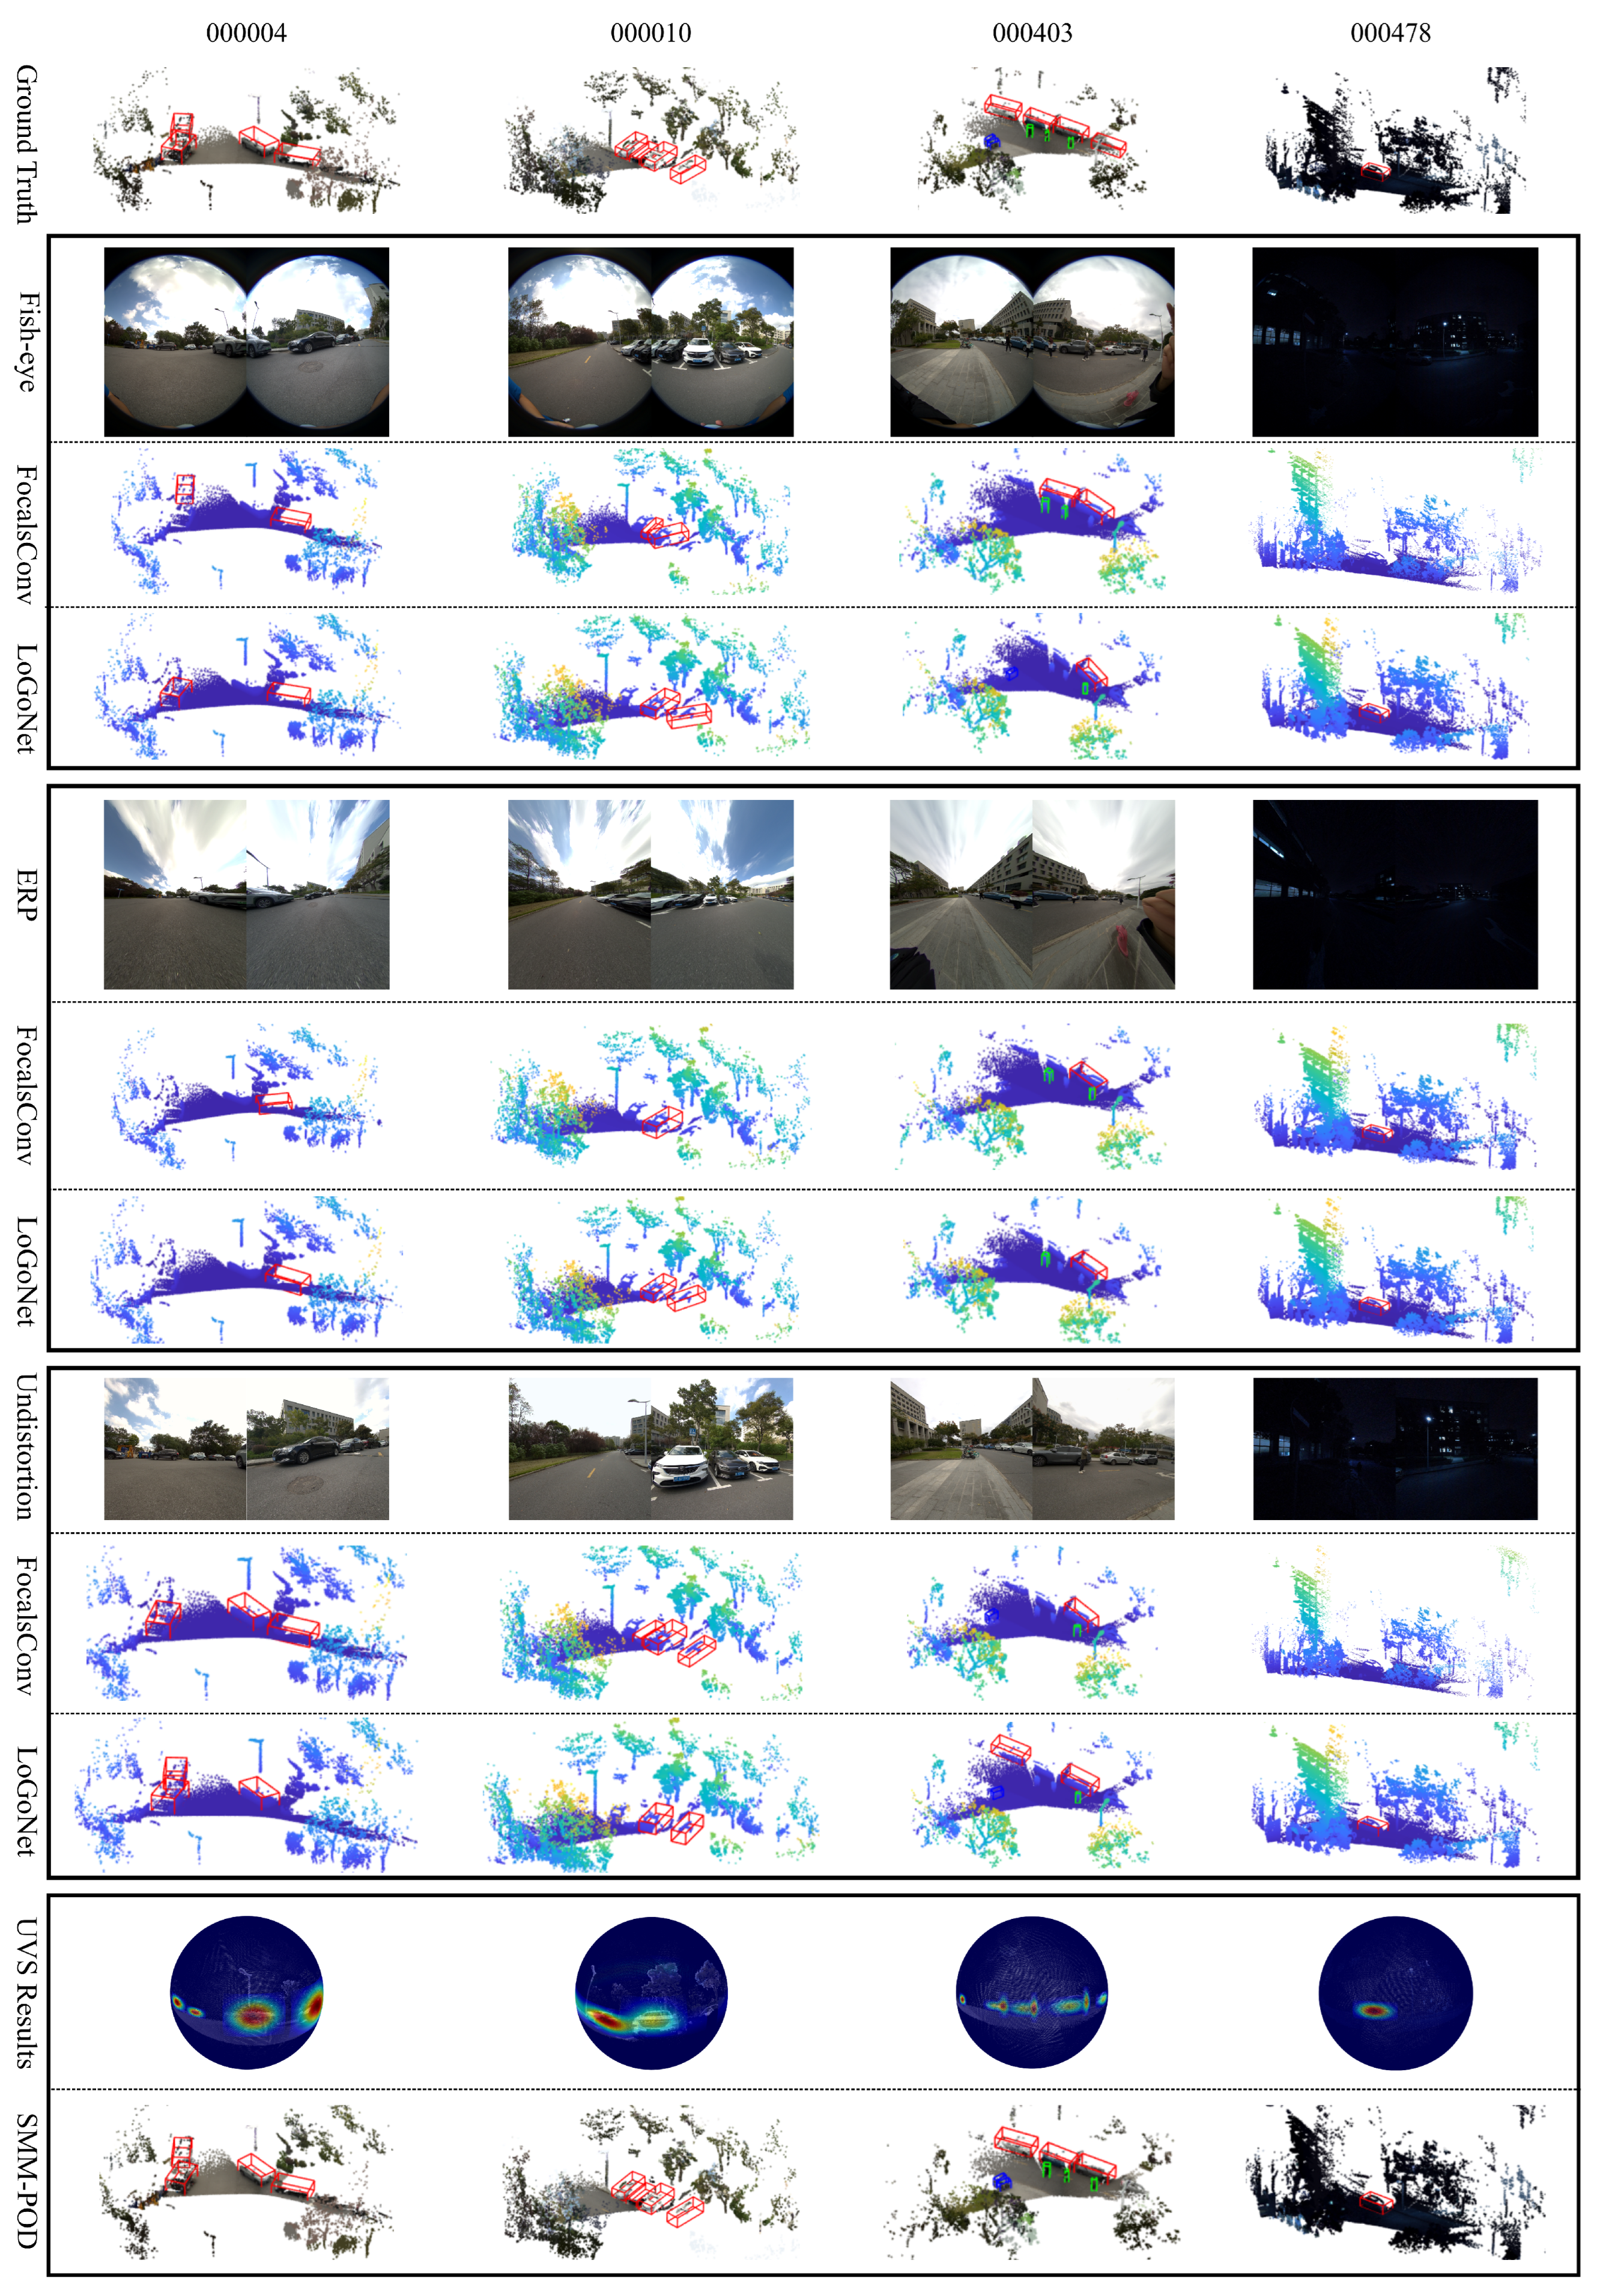
The conclusion is especially evident in the visual results shown in Figure 10. To thoroughly assess robustness, the SHU-3DPOD dataset was constructed with intentionally challenging scenarios, including large FoV edge objects, diverse object depth distributions, various occlusion patterns, and low-light nighttime scenes with minimal illumination. Subjective visual analysis further validates the advantages of our method in panoramic FoV multi-modal object detection. For instance, in sequence 000004, the scene includes a distant vehicle captured by the left camera and a nearby one on the right. Competing methods such as FocalsConv [47] and LoGoNet [7] exhibit detection failures in the left camera’s view, while our distortion-aware approach achieves significantly improved localization. In sequence 000010, strong fisheye distortion near the image periphery leads to angular estimation errors for side-by-side parked vehicles. Our method effectively mitigates this effect via spherical distortion modeling. In the more complex 000403 sequence, where bicycles, pedestrians, and cars co-exist across a wide and heavily distorted FoV, baseline methods suffer from missed detections and inaccurate bounding boxes. In contrast, our model, leveraging a uniform spherical projection, consistently delivers accurate results across all object types and locations. Finally, sequence 000478 presents a low-light scenario designed to evaluate feature extraction under illumination scarcity. These examples collectively highlight our approach’s robustness, generalization, and adaptability in challenging panoramic multi-modal environments.

Figure 10.
Comparative detection results on the SHU-3DPOD dataset. Detection bounding boxes are color-coded, red for cars, green for pedestrians, and blue for cyclists.
5. Discussion
5.1. Parameter Count and Efficiency Discussion
To comprehensively assess the inference efficiency of the proposed SMM-POD framework, we conducted a detailed analysis of model complexity and identified the main computational bottlenecks. The DETR-based spherical detection module contains approximately 145.01 million trainable parameters, primarily attributed to the ResNet-101 backbone and the global attention-based Transformer decoder. In contrast, representative baseline models such as LoGoNet (43.46M), MVX-Net (33.87M), and FocalConv (8.08M) have significantly fewer parameters, which partially explains their superior runtime performance. Specific parameter counts and corresponding inference speeds are summarized in Table 2.
Despite the relatively large model size, our optimized implementation achieves a competitive inference speed of approximately 12 FPS for the 2D spherical detection stage. Detailed runtime profiling reveals that the ResNet-101 backbone accounts for roughly 36.4 ms per frame, while the Transformer decoder contributes about 18.9 ms. Although the overall efficiency of SMM-POD is comparable to other state-of-the-art multi-modal detection methods, we acknowledge that further improvements are possible. In particular, the parallelization of the spherical traversal process and architectural refinements to the encoder–decoder structure of the Transformer module remain promising directions for optimization.
5.2. Ablation Experiments and Discussion
The ablation experiment in this paper mainly considers the input modality and the variants of the fusion architecture.
5.2.1. Ablation Study on Input Channels
To evaluate the contribution of each input modality to overall detection performance, we conduct an ablation study on input channels, as shown in Table 4. Our method adopts a five-channel panoramic image representation, including RGB, intensity, and depth. In this experiment, we compare two input configurations: RGB+Depth versus Depth-only, to examine the role of semantic and geometric information in 3D object detection.
Table 4.
Ablation of input channels. The best performances are highlighted in bold.
Results indicate that removing the RGB channels substantially drops the detection performance across all categories and difficulty levels. For example, in the vehicle category, the mAP drops from 74.08% to 37.91% under the easy setting, and similar declines are observed for pedestrians (64.42% to 26.69%) and cyclists (58.83% to 21.21%). This confirms that depth alone cannot provide reliable localization and classification cues, especially in complex outdoor scenes. The rich texture and semantic information in the RGB modality play a critical role in accurate object detection, particularly given that the DAIR-V2X-I dataset primarily consists of daytime scenes with sufficient lighting for capturing high-quality visual features.
5.2.2. Ablation Study on Network Architecture
We conduct a series of ablation experiments to evaluate the impact of key components in the proposed network architecture by systematically modifying specific modules. These experiments aim to highlight the effectiveness of our architectural design. We adopt a progressive ablation design that isolates the individual contribution of each proposed module. This approach enhances clarity and interpretability in identifying the critical components of the architecture. The results, as shown in Table 5, are obtained on the DAIR-V2X-I dataset. The tested configurations reflect different levels of structural degradation from the full model:
Table 5.
Ablation of different network architecture proposed methods. The best performances are highlighted in bold.
- (1)
- Feature extraction fusion removed: All feature interactions in the feature extraction stage are removed. The two modality branches operate independently with no fusion until the encoding network, where late fusion is applied.
- (2)
- Partial feature extraction fusion removed: The multi-level cross-attention mechanism in the feature extraction stage is removed. Instead, features from both modalities are directly concatenated and passed to the next layer.
- (3)
- Cross-attention in the context encoder removed: Only multi-head self-attention modules are retained in the context encoder stage, discarding cross-modal attention.
- (4)
- Self-attention in the context encoder removed: Only cross-attention modules are used in the context encoder, omitting modality-specific self-attention branches.
- (5)
- SPE (spherical positional encoding) removed: The proposed spherical position encoding is replaced by the standard learnable positional encoding used in conventional transformer architectures.
We further evaluate the effectiveness of each architectural component through ablation experiments on the DAIR-V2X-I dataset, as shown in Table 5. The results demonstrate that all components positively contribute to the final performance, with varying degrees of impact across object categories and difficulty levels. Removing feature extraction stage feature fusion (Configuration 1) results in the most significant performance drop across all categories, especially under hard conditions (e.g., vehicle mAP drops from 75.24% to 58.01%, and pedestrian mAP from 69.02% to 49.07%), indicating the importance of early multi-modal interaction. Configuration 3, which removes cross-attention in the context stage, also causes large degradation, particularly in cyclist detection (e.g., hard mAP decreases from 69.66% to 42.44%), highlighting the necessity of inter-modal alignment at the semantic level. Configuration 2 and Configuration 4 show moderate declines, suggesting that hierarchical feature fusion and modality-specific attention mechanisms benefit robust detection. Finally, Configuration 5, which replaces our spherical positional encoding (SPE) with standard Transformer encoding, leads to a consistent drop across all metrics, demonstrating the effectiveness of SPE in modeling panoramic spatial layouts.
Overall, the full architecture outperforms all ablated variants by a significant margin, confirming the importance of the carefully designed multi-stage fusion strategy, including feature extraction fusion, contextual attention, and spherical positional encoding.
5.3. Limitations
Although the proposed spherical detection framework successfully addresses key challenges in panoramic object detection, there remain two main limitations in its current implementation. First, the 3D reconstruction stage, based on Frustum PointNet, is not explicitly optimized for complex occlusion scenarios involving multiple objects within a single frustum. This may lead to reduced accuracy in tightly clustered environments. Second, the SCNN module suffers from limited computational efficiency due to the adjacency-driven feature aggregation over the UVS representation, which restricts parallelism on standard GPU architectures. These constraints indicate promising directions for future work, including lightweight spherical convolution designs and occlusion-aware 3D refinement strategies to enhance both performance and real-time applicability.
6. Conclusions
This paper introduces SMM-POD, a panoramic 3D object detection framework that integrates spherical image modeling, multi-stage attention fusion, and 3D reconstruction into a unified architecture. The model aligns multi-modal sensor data and suppresses geometric distortion by leveraging a UVS representation. The proposed multi-stage fusion pipeline—featuring early-stage cross-attention, transformer-based context encoding, and spherical positional encoding—enables effective interaction between RGB, depth, and intensity information. Our method demonstrates consistent performance advantages over existing LiDAR-based, vision-based, and fusion-based detectors on both DAIR-V2X-I and the SHU-3DPOD datasets. Notably, it achieves balanced performance across object categories and difficulty levels, while also maintaining robustness in complex or low-light environments. Future work will explore optimizing the computational efficiency of the SCNN module and enhancing the occlusion handling in 3D reconstruction, to further promote real-time panoramic perception in intelligent transportation and surveillance systems.
Author Contributions
Conceptualization, Y.X. and J.Z.; methodology, Z.G. and J.Z.; software, Z.G. and J.Z.; validation, J.Z.; formal analysis, J.Z.; investigation, Z.G. and J.Z.; data curation, J.Z.; writing—original draft preparation, J.Z.; writing—review and editing, J.Z., Y.Y., and H.S.; visualization, J.Z.; funding acquisition, Y.X. All authors have read and agreed to the published version of the manuscript.
Funding
This research was funded by the National Natural Science Foundation of China, grant number 62173220 and 62303294.
Data Availability Statement
The core implementation code and dataset are available on https://github.com/RSAMRG-SHU/SMM-POD.git, accessed on 7 April 2025.
Acknowledgments
The authors of this paper thank Ruqi Li and Pengfei Sun from Shanghai University for assisting with the data collection, cleaning, and annotation for SHU-3DPOD.
Conflicts of Interest
The authors declare no conflicts of interest.
Abbreviations
The following abbreviations are used in this manuscript:
| FOV | Field of View |
| ERP | Equirectangular Projection |
| UVS | Quasi-Uniform Voronoi Spherical |
| SCNN | Spherical Convolution Neural Network |
| KNN | K-Nearest Neighbor |
| CAM | Cross-Attention Module |
| FPS | Frames per Second |
| SPE | Spherical Positional Encoding |
References
- Tang, Y.; He, H.; Wang, Y.; Mao, Z.; Wang, H. Multi-modality 3D object detection in autonomous driving: A review. Neurocomputing 2023, 553, 126587. [Google Scholar] [CrossRef]
- Chu, H.; Liu, H.; Zhuo, J.; Chen, J.; Ma, H. Occlusion-guided multi-modal fusion for vehicle-infrastructure cooperative 3D object detection. Pattern Recognit. 2025, 157, 110939. [Google Scholar] [CrossRef]
- Geiger, A.; Lenz, P.; Stiller, C.; Urtasun, R. Vision meets robotics: The kitti dataset. Int. J. Robot. Res. 2013, 32, 1231–1237. [Google Scholar] [CrossRef]
- Caesar, H.; Bankiti, V.; Lang, A.H.; Vora, S.; Liong, V.E.; Xu, Q.; Krishnan, A.; Pan, Y.; Baldan, G.; Beijbom, O. nuscenes: A multimodal dataset for autonomous driving. In Proceedings of the IEEE/CVF Conference on Computer Vision and Pattern Recognition, Seattle, WA, USA, 13–19 June 2020; pp. 11621–11631. [Google Scholar]
- Zhang, M.; Li, H.; Li, Q.; Zheng, M.; Dvinianina, I. POD-YOLO: YOLOX-Based Object Detection Model for Panoramic Image. In Proceedings of the Image Processing, Electronics and Computers, Dalian, China, 12–14 April 2024; pp. 236–250. [Google Scholar]
- de La Garanderie, G.P.; Abarghouei, A.A.; Breckon, T.P. Eliminating the blind spot: Adapting 3d object detection and monocular depth estimation to 360 panoramic imagery. In Proceedings of the European Conference on Computer Vision (ECCV), Munich, Germany, 8–14 September 2018; pp. 789–807. [Google Scholar]
- Li, X.; Ma, T.; Hou, Y.; Shi, B.; Yang, Y.; Liu, Y.; Wu, X.; Chen, Q.; Li, Y.; Qiao, Y.; et al. LoGoNet: Towards Accurate 3D Object Detection with Local-to-Global Cross-Modal Fusion. In Proceedings of the IEEE Conference on Computer Vision and Pattern Recognition (CVPR), Vancouver, BC, Canada, 17–24 June 2023. [Google Scholar]
- Zhang, J.; Xu, D.; Li, Y.; Zhao, L.; Su, R. FusionPillars: A 3D object detection network with cross-fusion and self-fusion. Remote Sens. 2023, 15, 2692. [Google Scholar] [CrossRef]
- Xu, X.; Dong, S.; Xu, T.; Ding, L.; Wang, J.; Jiang, P.; Song, L.; Li, J. Fusionrcnn: Lidar-camera fusion for two-stage 3d object detection. Remote Sens. 2023, 15, 1839. [Google Scholar] [CrossRef]
- Sindagi, V.A.; Zhou, Y.; Tuzel, O. Mvx-net: Multimodal voxelnet for 3d object detection. In Proceedings of the 2019 International Conference on Robotics and Automation (ICRA), Montreal, QC, Canada, 20–24 May 2019; pp. 7276–7282. [Google Scholar]
- Bai, X.; Hu, Z.; Zhu, X.; Huang, Q.; Chen, Y.; Fu, H.; Tai, C.L. Transfusion: Robust lidar-camera fusion for 3d object detection with transformers. In Proceedings of the IEEE/CVF Conference on Computer Vision and Pattern Recognition, New Orleans, LA, USA, 18–24 June 2022; pp. 1090–1099. [Google Scholar]
- Liu, Z.; Tang, H.; Amini, A.; Yang, X.; Mao, H.; Rus, D.; Han, S. BEVFusion: Multi-Task Multi-Sensor Fusion with Unified Bird’s-Eye View Representation. In Proceedings of the IEEE International Conference on Robotics and Automation (ICRA), London, UK, 29 May–2 June 2023. [Google Scholar]
- Liu, Z.; Huang, T.; Li, B.; Chen, X.; Wang, X.; Bai, X. EPNet++: Cascade bi-directional fusion for multi-modal 3D object detection. IEEE Trans. Pattern Anal. Mach. Intell. 2022, 45, 8324–8341. [Google Scholar] [CrossRef] [PubMed]
- Zhang, C.; Tian, B.; Sun, Y.; Zhang, R. Monocular 3D Ray-Aware RPN For Roadside View Object Detection. In Proceedings of the 2023 International Annual Conference on Complex Systems and Intelligent Science (CSIS-IAC), Shenzhen, China, 20–22 October 2023; pp. 841–846. [Google Scholar]
- Yang, L.; Zhang, X.; Li, J.; Wang, L.; Zhang, C.; Ju, L.; Li, Z.; Shen, Y. Towards Scenario Generalization for Vision-based Roadside 3D Object Detection. arXiv 2024, arXiv:2401.16110. [Google Scholar] [CrossRef]
- Li, Z.; Chen, Z.; Li, A.; Fang, L.; Jiang, Q.; Liu, X.; Jiang, J. Unsupervised domain adaptation for monocular 3d object detection via self-training. In Proceedings of the European Conference on Computer Vision, Tel Aviv, Israel, 23–27 October 2022; Springer: Berlin/Heidelberg, Germany, 2022; pp. 245–262. [Google Scholar]
- Li, P.; Zhao, H.; Liu, P.; Cao, F. Rtm3d: Real-time monocular 3d detection from object keypoints for autonomous driving. In Proceedings of the European Conference on Computer Vision, Glasgow, UK, 23–28 August 2020; Springer: Berlin/Heidelberg, Germany, 2020; pp. 644–660. [Google Scholar]
- Ye, Z.; Zhang, H.; Gu, J.; Li, X. YOLOv7-3D: A Monocular 3D Traffic Object Detection Method from a Roadside Perspective. Appl. Sci. 2023, 13, 11402. [Google Scholar] [CrossRef]
- Yang, L.; Yu, J.; Zhang, X.; Li, J.; Wang, L.; Huang, Y.; Zhang, C.; Wang, H.; Li, Y. MonoGAE: Roadside monocular 3D object detection with ground-aware embeddings. arXiv 2023, arXiv:2310.00400. [Google Scholar] [CrossRef]
- Li, Y.; Ge, Z.; Yu, G.; Yang, J.; Wang, Z.; Shi, Y.; Sun, J.; Li, Z. Bevdepth: Acquisition of reliable depth for multi-view 3d object detection. In Proceedings of the AAAI Conference on Artificial Intelligence, Washington, DC, USA, 7–14 February 2023; Volume 37, pp. 1477–1485. [Google Scholar]
- Yang, L.; Yu, K.; Tang, T.; Li, J.; Yuan, K.; Wang, L.; Zhang, X.; Chen, P. Bevheight: A robust framework for vision-based roadside 3d object detection. In Proceedings of the IEEE/CVF Conference on Computer Vision and Pattern Recognition, Vancouver, BC, Canada, 17–24 June 2023; pp. 21611–21620. [Google Scholar]
- Shi, H.; Pang, C.; Zhang, J.; Yang, K.; Wu, Y.; Ni, H.; Lin, Y.; Stiefelhagen, R.; Wang, K. Cobev: Elevating roadside 3d object detection with depth and height complementarity. arXiv 2023, arXiv:2310.02815. [Google Scholar] [CrossRef] [PubMed]
- Lang, A.H.; Vora, S.; Caesar, H.; Zhou, L.; Yang, J.; Beijbom, O. Pointpillars: Fast encoders for object detection from point clouds. In Proceedings of the IEEE/CVF Conference on Computer Vision and Pattern Recognition, Long Beach, CA, USA, 15–20 June 2019; pp. 12697–12705. [Google Scholar]
- Yan, Y.; Mao, Y.; Li, B. Second: Sparsely embedded convolutional detection. Sensors 2018, 18, 3337. [Google Scholar] [CrossRef] [PubMed]
- Ye, M.; Xu, S.; Cao, T. Hvnet: Hybrid voxel network for lidar based 3d object detection. In Proceedings of the IEEE/CVF Conference on Computer Vision and Pattern Recognition, Seattle, WA, USA, 13–19 June 2020; pp. 1631–1640. [Google Scholar]
- Shi, S.; Guo, C.; Jiang, L.; Wang, Z.; Shi, J.; Wang, X.; Li, H. PV-RCNN: Point-Voxel Feature Set Abstraction for 3D Object Detection. In Proceedings of the IEEE Conference on Computer Vision and Pattern Recognition, Seattle, WA, USA, 13–19 June 2020. [Google Scholar]
- Shi, S.; Jiang, L.; Deng, J.; Wang, Z.; Guo, C.; Shi, J.; Wang, X.; Li, H. PV-RCNN++: Point-voxel feature set abstraction with local vector representation for 3D object detection. Int. J. Comput. Vis. 2023, 131, 531–551. [Google Scholar] [CrossRef]
- Wang, Y.; Deng, J.; Hou, Y.; Li, Y.; Zhang, Y.; Ji, J.; Ouyang, W.; Zhang, Y. CluB: Cluster meets BEV for LiDAR-based 3D object detection. Adv. Neural Inf. Process. Syst. 2024, 36, 40438–40449. [Google Scholar]
- Jin, Z.; Ji, X.; Cheng, Y.; Yang, B.; Yan, C.; Xu, W. Pla-lidar: Physical laser attacks against lidar-based 3d object detection in autonomous vehicle. In Proceedings of the 2023 IEEE Symposium on Security and Privacy (SP), San Francisco, CA, USA, 22–24 May 2023; pp. 1822–1839. [Google Scholar]
- Wu, G.; Cao, T.; Liu, B.; Chen, X.; Ren, Y. Towards universal LiDAR-based 3D object detection by multi-domain knowledge transfer. In Proceedings of the IEEE/CVF International Conference on Computer Vision, Paris, France, 2–3 October 2023; pp. 8669–8678. [Google Scholar]
- Fan, L.; Xiong, X.; Wang, F.; Wang, N.; Zhang, Z. Rangedet: In defense of range view for lidar-based 3d object detection. In Proceedings of the IEEE/CVF International Conference on Computer Vision, Montreal, BC, Canada, 11–17 October 2021; pp. 2918–2927. [Google Scholar]
- Wang, K.; Zhou, T.; Zhang, Z.; Chen, T.; Chen, J. PVF-DectNet: Multi-modal 3D detection network based on Perspective-Voxel fusion. Eng. Appl. Artif. Intell. 2023, 120, 105951. [Google Scholar] [CrossRef]
- Xie, L.; Xiang, C.; Yu, Z.; Xu, G.; Yang, Z.; Cai, D.; He, X. PI-RCNN: An efficient multi-sensor 3D object detector with point-based attentive cont-conv fusion module. In Proceedings of the AAAI Conference on Artificial Intelligence, New York, NY, USA, 7–12 February 2020; Volume 34, pp. 12460–12467. [Google Scholar]
- Chen, M.; Liu, P.; Zhao, H. LiDAR-camera fusion: Dual transformer enhancement for 3D object detection. Eng. Appl. Artif. Intell. 2023, 120, 105815. [Google Scholar] [CrossRef]
- Huang, T.; Liu, Z.; Chen, X.; Bai, X. Epnet: Enhancing point features with image semantics for 3d object detection. In Proceedings of the Computer Vision–ECCV 2020: 16th European Conference, Glasgow, UK, 23–28 August 2020; Proceedings, Part XV 16. Springer: Berlin/Heidelberg, Germany, 2020; pp. 35–52. [Google Scholar]
- Pang, S.; Morris, D.; Radha, H. CLOCs: Camera-LiDAR object candidates fusion for 3D object detection. In Proceedings of the 2020 IEEE/RSJ International Conference on Intelligent Robots and Systems (IROS), Las Vegas, NV, USA, 24 October 2020; pp. 10386–10393. [Google Scholar]
- Qi, C.R.; Liu, W.; Wu, C.; Su, H.; Guibas, L.J. Frustum pointnets for 3d object detection from rgb-d data. In Proceedings of the IEEE Conference on Computer Vision and Pattern Recognition, Salt Lake City, UT, USA, 18–23 June 2018; pp. 918–927. [Google Scholar]
- Lin, Y.; Fei, Y.; Gao, Y.; Shi, H.; Xie, Y. A LiDAR-Camera Calibration and Sensor Fusion Method with Edge Effect Elimination. In Proceedings of the 2022 17th International Conference on Control, Automation, Robotics and Vision (ICARCV), Singapore, 11–13 December 2022; pp. 28–34. [Google Scholar]
- Yang, Y.; Gao, Z.; Zhang, J.; Hui, W.; Shi, H.; Xie, Y. UVS-CNNs: Constructing general convolutional neural networks on quasi-uniform spherical images. Comput. Graph. 2024, 122, 103973. [Google Scholar] [CrossRef]
- He, K.; Zhang, X.; Ren, S.; Sun, J. Deep residual learning for image recognition. In Proceedings of the IEEE Conference on Computer Vision and Pattern Recognition, Las Vegas, NV, USA, 27–30 June 2016; pp. 770–778. [Google Scholar]
- Carion, N.; Massa, F.; Synnaeve, G.; Usunier, N.; Kirillov, A.; Zagoruyko, S. End-to-end object detection with transformers. In Proceedings of the European Conference on Computer Vision, Glasgow, UK, 23–28 August 2020; Springer: Berlin/Heidelberg, Germany, 2020; pp. 213–229. [Google Scholar]
- Rezatofighi, H.; Tsoi, N.; Gwak, J.; Sadeghian, A.; Reid, I.; Savarese, S. Generalized intersection over union: A metric and a loss for bounding box regression. In Proceedings of the IEEE/CVF Conference on Computer Vision and Pattern Recognition, Long Beach, CA, USA, 15–20 June 2019; pp. 658–666. [Google Scholar]
- Yu, H.; Luo, Y.; Shu, M.; Huo, Y.; Yang, Z.; Shi, Y.; Guo, Z.; Li, H.; Hu, X.; Yuan, J.; et al. Dair-v2x: A large-scale dataset for vehicle-infrastructure cooperative 3d object detection. In Proceedings of the IEEE/CVF Conference on Computer Vision and Pattern Recognition, New Orleans, LA, USA, 18–24 June 2022; pp. 21361–21370. [Google Scholar]
- Rukhovich, D.; Vorontsova, A.; Konushin, A. Imvoxelnet: Image to voxels projection for monocular and multi-view general-purpose 3d object detection. In Proceedings of the IEEE/CVF Winter Conference on Applications of Computer Vision, Waikoloa, HI, USA, 3–8 January 2022; pp. 2397–2406. [Google Scholar]
- Li, Z.; Wang, W.; Li, H.; Xie, E.; Sima, C.; Lu, T.; Qiao, Y.; Dai, J. Bevformer: Learning bird’s-eye-view representation from multi-camera images via spatiotemporal transformers. In Proceedings of the European Conference on Computer Vision, Tel Aviv, Israel, 23–27 October 2022; Springer: Berlin/Heidelberg, Germany, 2022; pp. 1–18. [Google Scholar]
- Deng, J.; Shi, S.; Li, P.; Zhou, W.; Zhang, Y.; Li, H. Voxel r-cnn: Towards high performance voxel-based 3d object detection. In Proceedings of the AAAI Conference on Artificial Intelligence, Online, 2–9 February 2021; Volume 35, pp. 1201–1209. [Google Scholar]
- Chen, Y.; Li, Y.; Zhang, X.; Sun, J.; Jia, J. Focal Sparse Convolutional Networks for 3D Object Detection. In Proceedings of the IEEE Conference on Computer Vision and Pattern Recognition, New Orleans, LA, USA, 18–24 June 2022. [Google Scholar]

Disclaimer/Publisher’s Note: The statements, opinions and data contained in all publications are solely those of the individual author(s) and contributor(s) and not of MDPI and/or the editor(s). MDPI and/or the editor(s) disclaim responsibility for any injury to people or property resulting from any ideas, methods, instructions or products referred to in the content. |
© 2025 by the authors. Licensee MDPI, Basel, Switzerland. This article is an open access article distributed under the terms and conditions of the Creative Commons Attribution (CC BY) license (https://creativecommons.org/licenses/by/4.0/).