Article

Mapping the Mineralogical Footprints of Petroleum Microseepage Systems in Redbeds of the Qom Region (Iran) Using EnMAP Hyperspectral Data

1
Department of Remote Sensing and GIS, Shahid Chamran University of Ahvaz, Ahvaz 6135783151, Iran
2
GFZ Helmholtz Centre for Geosciences, Telegrafenberg, 14473 Potsdam, Germany
*
Author to whom correspondence should be addressed.
Remote Sens. 2025, 17(12), 2088; https://doi.org/10.3390/rs17122088
Submission received: 22 March 2025 / Revised: 11 June 2025 / Accepted: 12 June 2025 / Published: 18 June 2025

Abstract

:
This study utilizes EnMAP hyperspectral satellite data to map the mineralogical footprints of hydrocarbon microseepage systems induced in the Upper-Red Formation (URF), a clastic Upper Miocene sedimentary sequence in the Qom region (Iran) affected by petroleum leakage from the underlying Alborz reservoir. The Level 2A surface reflectance product of EnMAP was processed using spectral matching and polynomial fitting techniques to characterize diagnostic absorption features associated with microseepage-induced alteration minerals. The identified mineralogical changes include partial to complete bleaching of hematite from redbeds, the formation of secondary goethite, and the development of montmorillonite, calcite, and Fe2+-bearing chlorite across the affected zones. Compared to previous studies conducted using ASTER and Sentinel-2 multispectral data, EnMAP demonstrated superior performance in identifying mineralogy and delineating petroleum-affected zones, with results aligning closely with field observations and laboratory spectroscopy. This study highlights the advantages of EnMAP hyperspectral data for mapping diagenetic mineralogical alterations induced in sedimentary strata, facilitating remote sensing-based detection of microseepage, and advancing petroleum exploration in exposed terrains.

1. Introduction

According to the microseepage theory, the incomplete caprocks sealing hydrocarbon accumulations allow a gradual but steady leakage of light gaseous hydrocarbons to the surface. The long-term bacterial activities thriving on the leaking hydrocarbons can induce physicochemical and mineralogical changes in the stratigraphic column overlying hydrocarbon accumulations [1,2,3]. The mineralogical changes associated with the microseepage phenomenon typically comprise iron oxide bleaching, clay alteration/formation, and excessive carbonates and sulfides precipitations [1,2,4,5,6,7]. Redbed bleaching results from the chemical removal of ferric iron oxides, primarily hematite, and is influenced by the host rock’s fabric and porosity. This process leads to significant color changes above the potential petroleum accumulations [2,5]. The bleached ferric iron can manifest itself in three forms: (i) reduction to ferrous iron and precipitation as new minerals; (ii) partial or complete removal from the system by groundwater; and (iii) re-precipitation as patchy iron oxide concretions [8]. The formation and transformation of clays are mainly associated with slightly acidic conditions within the chimney column. Kaolinite, the predominant clay mineral in microseepage-induced environments, commonly forms through the alteration of feldspars or the conversion of illitic/smectitic clays [9]. Other clay minerals commonly found in these diagenetic environments include smectites like montmorillonite and nontronite [10]. Pyrite (FeS2) is the primary sulfide mineral in the reduced zones, although other iron-bearing minerals such as Fe-carbonates and chlorite are also likely to present [6,11].
Given that a large proportion of these diagenetic minerals are spectrally active in the visible-near infrared (VNIR) and shortwave infrared (SWIR) wavelengths [11], it is feasible to map the mineralogical footprints of microseepage systems using spectral remote sensing methodologies [12,13]. Over the years, multispectral remote sensing datasets, such as different generations of Landsat instruments, ASTER, and Sentinel-2, have been successfully used to detect the mineralogical footprints of microseepage systems by identifying bleaching and mapping the occurrences of clays and carbonate minerals [12,14,15,16,17,18,19,20,21,22,23,24]. Remote sensing detection and mapping, however, has traditionally been limited to identifying broad mineral groups, with less success in distinguishing specific mineralogical species formed in the microseepage-affected zones. In contrast, hyperspectral remote sensing data, with hundreds of contiguous spectral bands across the VNIR-SWIR ranges, offer a more detailed characterization of the mineralogical variations induced by microseepage systems. This approach significantly enhances the remote sensing mapping capabilities by enabling the identification of specific clay species, as well as the mineralogy of iron oxides and carbonates at the Earth’s surface [15,25,26,27]. In subsurface studies, hyperspectral imaging provides continuous mineralogical data along boreholes, offering valuable insights into geological composition at depth [28].
The advent of high-quality spaceborne hyperspectral data, including from the EnMAP satellite system, has opened up new opportunities for geological studies [29]. In the petroleum industry, this technology has primarily been used for environmental monitoring by enabling the detection of methane (CH4) plumes from the production and transportation infrastructure [8], aiming to mitigate point-source emissions contributing to global warming [30]. The spectral resolution of the EnMAP allows the generation of anomaly maps that highlight methane concentration relative to background levels across an entire scene [31,32]. Although it has not yet been demonstrated, this technology holds significant potential for detecting hydrocarbon pollution in the environment [33].
Despite the global availability of spaceborne hyperspectral data at medium spatial resolution and at no cost, this technology has yet to be widely adopted by the petroleum industry for mapping and monitoring purposes. In particular, no studies have yet demonstrated its effectiveness in detecting the mineralogical footprints of microseepage systems in sedimentary basins. By identifying the surface expressions of microseeps, imaging spectroscopy could significantly enhance exploration efforts, particularly for natural gas reserves. As a lower-carbon alternative to other fossil fuels, natural gas can play a vital role in the transition to cleaner energy, especially in petroleum-rich countries such as Iran, which holds the world’s second-largest natural gas resources, much of which remains unexplored.
This study aims to evaluate the potential of EnMAP hyperspectral data for detecting alteration minerals associated with hydrocarbon microseepage from the Alborz petroleum reservoir in the Qom region, Iran. This area has been the focus of extensive geological, geochemical, and remote sensing studies in the past. This includes systematic sampling along profiles crossing the reservoir, detailed spectroscopic analysis of the samples in the laboratory, bulk-rock geochemical analysis, optical microscopy, and multispectral remote sensing analysis using ASTER and Sentinel-2 datasets [10,17]. This provides a solid foundation for hyperspectral remote sensing studies, enabling the validation of the results and comparisons with previous findings, and highlighting the advantages of hyperspectral data for microseepage detection.

2. Materials and Methods

2.1. Geologic Background

The study area is a subset of a larger region covered by [10,17]. It is located north of Qom City and forms part of the central basin of the Iranian plateau, known as the Saveh-Qom Basin. The area includes the Alborz oil field, hosted in an anticlinal structural trap. The reservoir is composed of limestones from the Qom Formation, sealed by a thick evaporitic unit and overlain by Oligocene sediments of the Upper-Red Formation (URF). The overlying URF consists of sandstones, siltstones, conglomerates, and glass rock, locally intersected with marl, shale, and gypsum sediments. The dominant unit in this formation is characterized by arenite sandstones sandstones (Figure 1). he URF sediments have been affected by active microseepage systems, causing the initially dark red facies to change to white tones over the oil-bearing zones. A more detailed description of the region’s geology, the induced changes at the outcrop scale, and the petroleum system is provided in [1].

2.2. EnMAP Hyperspectral Data

The study area was covered by a single EnMAP scene acquired on 26 August 2023, upon our request. We used the Level 2A orthorectified surface reflectance product, which comprises 224 consecutive spectral bands in the VNIR and SWIR ranges. The data was ordered/processed with the following configuration: reflectance data corrected for ozone and haze, with no terrain correction, and spectral interpolation resampled using the nearest neighbor method.
EnMAP is a German satellite launched into orbit on 1 April 2022, and has been in the operational phase since November 2022, collecting data from the Earth’s surface upon user demand. EnMAP records VNIR (420–1000 nm) and SWIR (900–2450 nm) wavelengths in 224 spectral channels, with sampling intervals of ~6.5 nm and ~10 nm, respectively, and a signal-to-noise ratio of better than 400:1 and 170:1. The data is collected at a spatial resolution of 30 m with a swath width of 30 km [31,34]. The main specifications of EnMAP data are summarized in Table 1.

2.3. Spectral Processing

We applied spectral feature matching and polynomial fitting techniques to detect and map the target minerals based on their diagnostic absorption features. Both techniques require local continuum removal over a user-defined range [35]. In the spectral feature matching technique, the continuum-removed pixel spectra are matched against the spectra of known minerals or a synthetic spectral mixture between pairs of minerals using the correlation coefficient (R2) similarity metric [36]. The spectra with the highest matching score are used to identify the mineralogy of a pixel and determine the relative abundances of the minerals for the simulated linear mixtures metric [37]. For instance, to map hematite and goethite, a synthetic linear mixture is constructed between the pair using reference spectra of the minerals from the USGS spectral library, mixed at 10% increments. The continuum is then removed from the simulated mixtures within the 418–750 nm range (Figure 2). The continuum-removed image data in the same spectral range is then compared, pixel-by-pixel, to the simulated mixtures using the R2 metric. If the similarity score exceeds a user-defined threshold (e.g., 0.9 ≤ t < 1), the pixel is considered a match. The spectrum with the highest matching score (from a set of 11 simulated mixtures) is considered the answer, and its corresponding proportions (e.g., 0.4 goethite and 0.6 hematite) are used to estimate the relative abundances of iron oxides in that pixel. By repeating this process for the entire image, scene-wide mineral maps are generated for hematite and goethite.
In contrast, the polynomial fitting technique does not depend on matching against an independent spectral library. Instead, it extracts the spectral parameters directly by fitting a polynomial (i.e., 4th order) to a continuum-removed absorption feature [38]. By using the coefficients of the fitted polynomial, the minimum wavelength, relative depth, width, area, and asymmetry of the absorption feature are retrieved and used to characterize the mineralogy of the corresponding pixel. The minimum wavelength is identified by finding the real roots of the first derivative of the fitted polynomial function, calculated using the Lagrange method. The depth of the absorption feature is then derived by substituting the retrieved minimum wavelength into the polynomial function and subtracting it from the continuum hull (=1) [39,40].
Based on the alteration mineralogy identified through spectroscopic studies of the hand samples (see below), we considered the following minerals for remote sensing mapping using EnMAP data: hematite, goethite, calcite, montmorillonite, and chlorite. Nontronite was excluded from the mapping due to its very low proportion in the strata.
In the first step, the local continuum of the spectra was removed within user-specified ranges across the VNIR and SWIR. To map hematite-goethite and any variations in their proportions, a linear mixture of the mineral spectra was matched against the corresponding continuum-removed pixel spectra, as explained above. This approach enabled mapping both the mineralogy and relative abundance of hematite and goethite across the area. The occurrences of ferrous iron minerals, mostly represented by Fe2+ in chlorite, were mapped using the ratio (R920 + R1650)/(R1030 + R1230), where Rλ represents the reflectance (R) at wavelength λ.
The relative proportions of montmorillonite and calcite were determined by fitting a 4th-order polynomial to the spectral ranges between 2120–2250 nm and 2265–2375 nm, retrieving the spectral parameters relevant to the Al–OH and carbonate absorption features at 2200 nm and 2340 nm, respectively. The plot of minimum wavelength versus depth/area was used interactively to identify/map montmorillonite- and calcite-rich pixels within the EnMAP scene [40]. A more detailed explanation of this technique is provided in [29].

2.4. Field Observations and Laboratory Spectroscopy

The study area has been extensively investigated through field observations, systematic sampling along profiles crossing the strata, and detailed spectroscopic analyses of the collected samples in the laboratory using an ASD FieldSpec 4 Hi-Res NG Spectroradiometer, as detailed in [10,17]. The accumulated dataset was used to validate the mapping products derived from EnMAP data, including comparisons between laboratory-measured spectra and EnMAP-derived pixel spectra. Spectral measurements of the samples were conducted between 350 to 2500 nm wavelengths using a contact probe under artificial illumination at the University of Campinas. The details of the measurements are available in [10,17].

3. Results

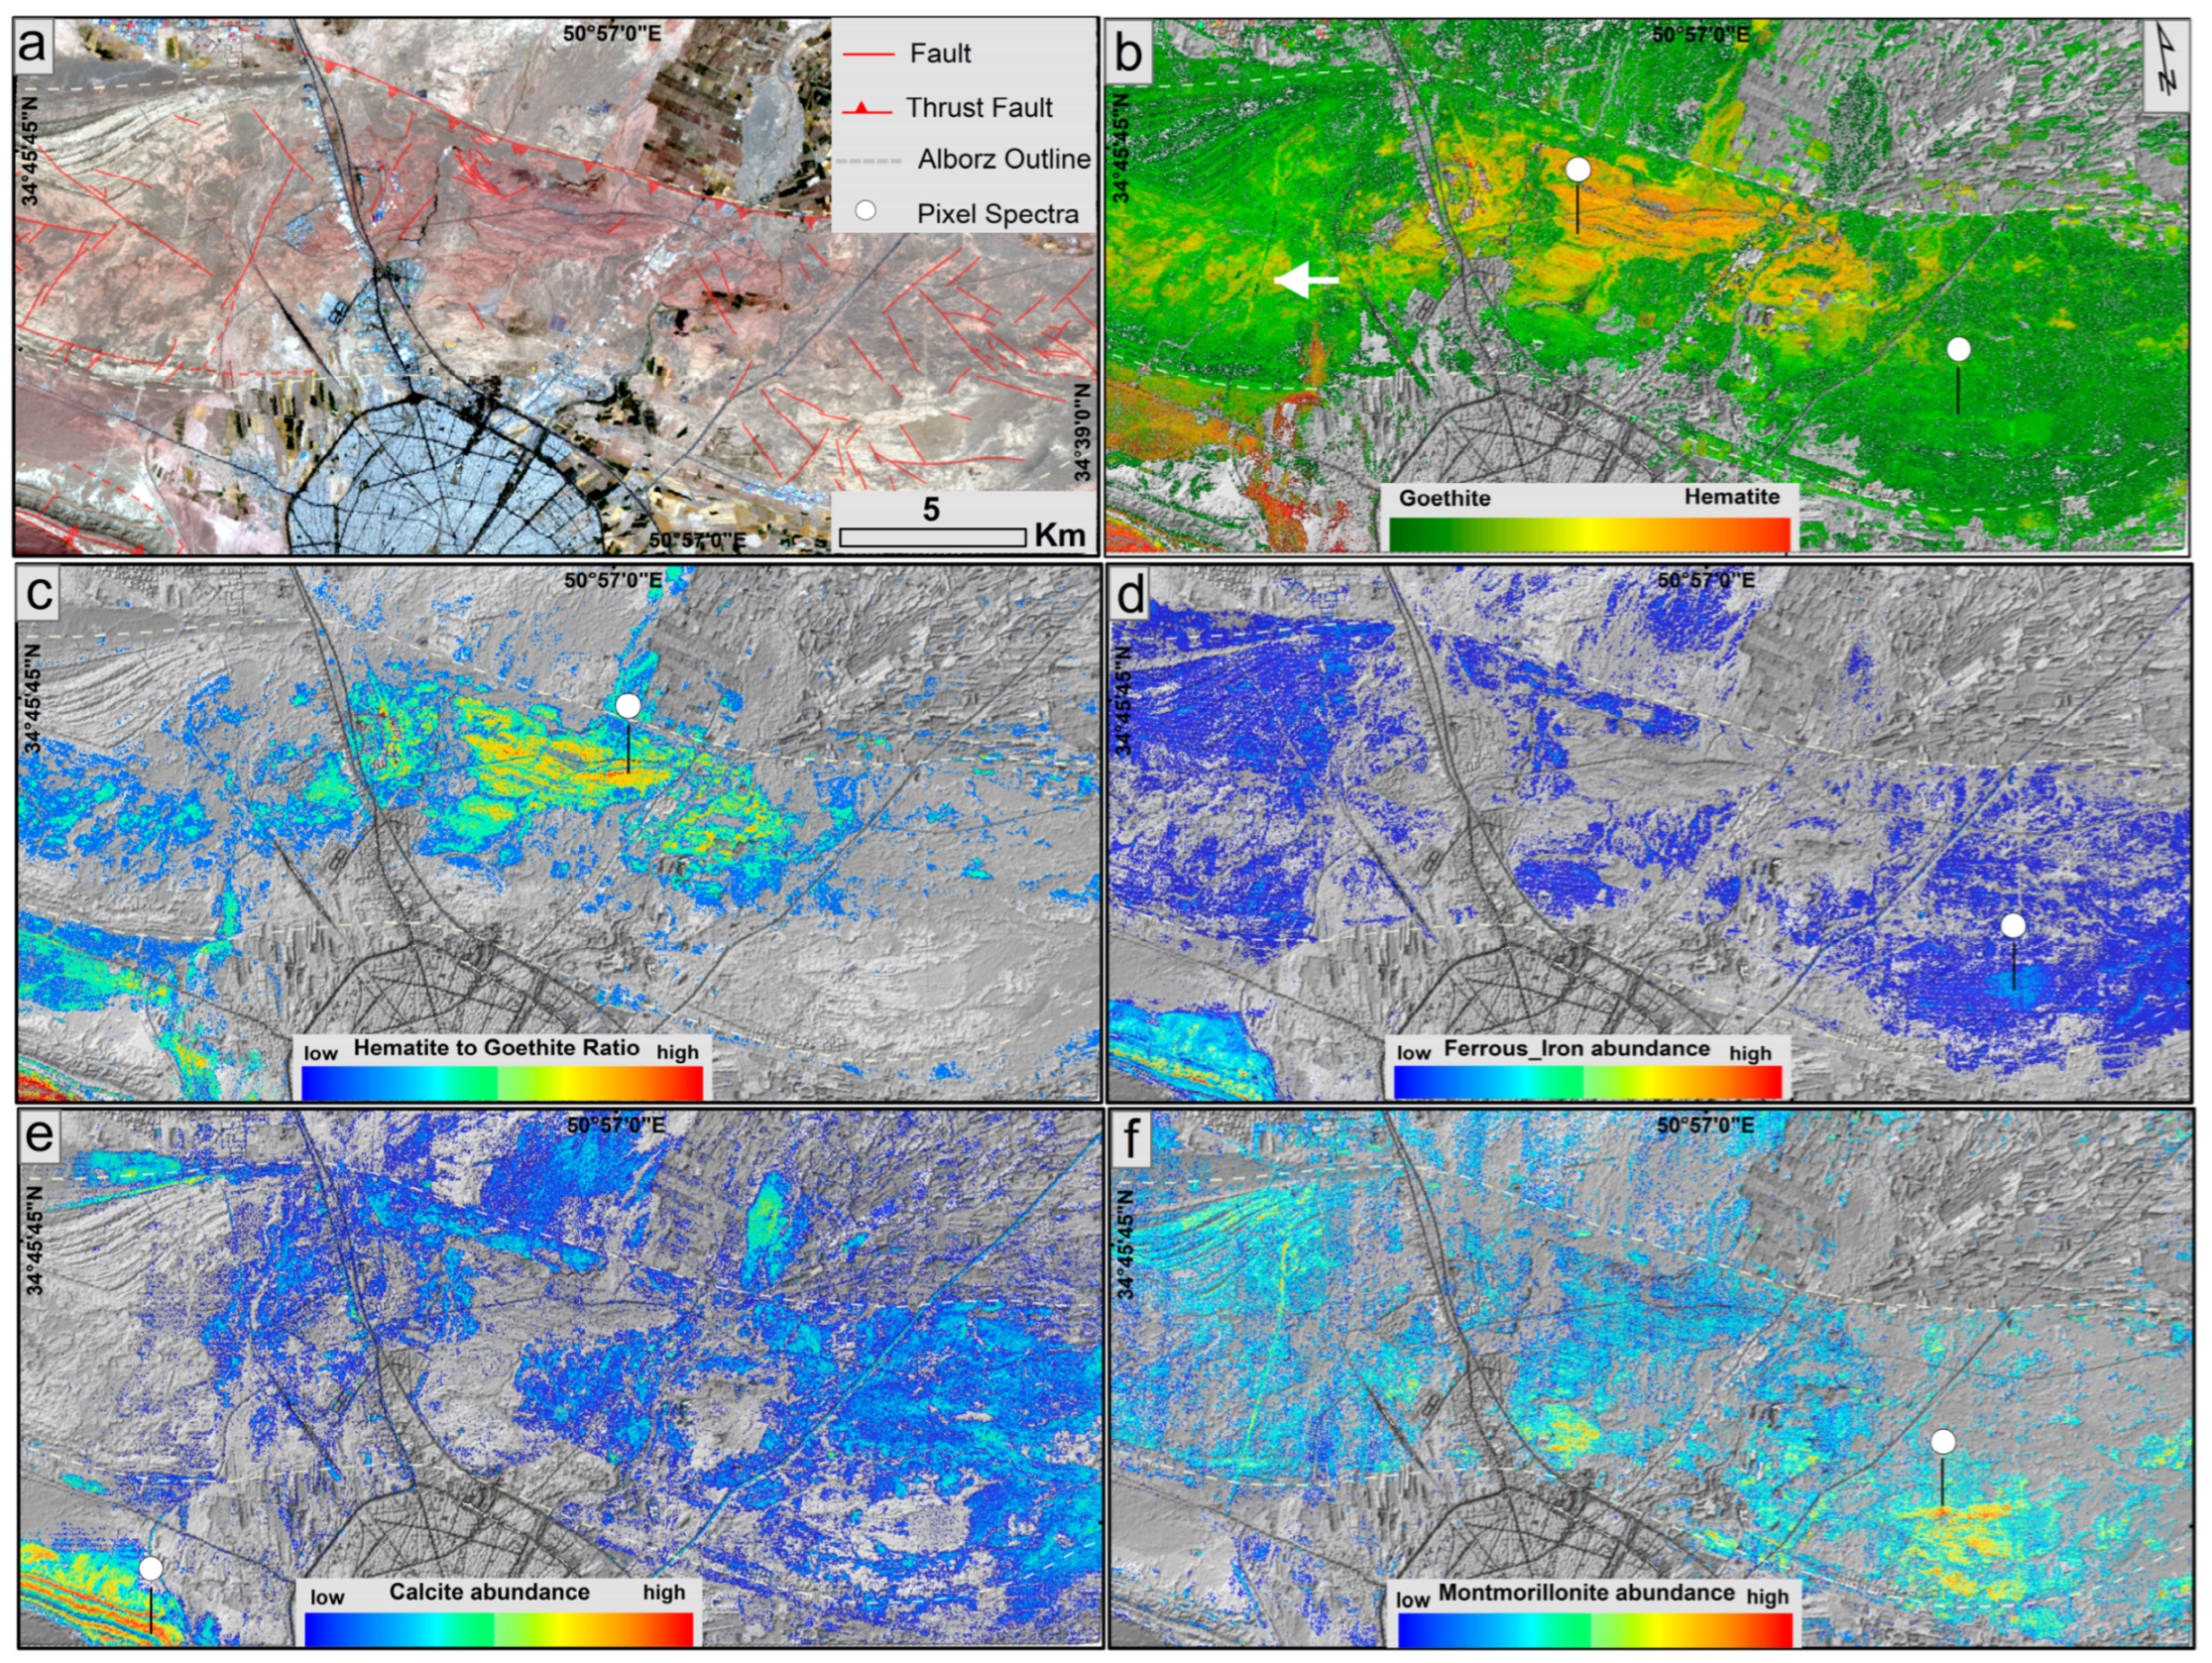
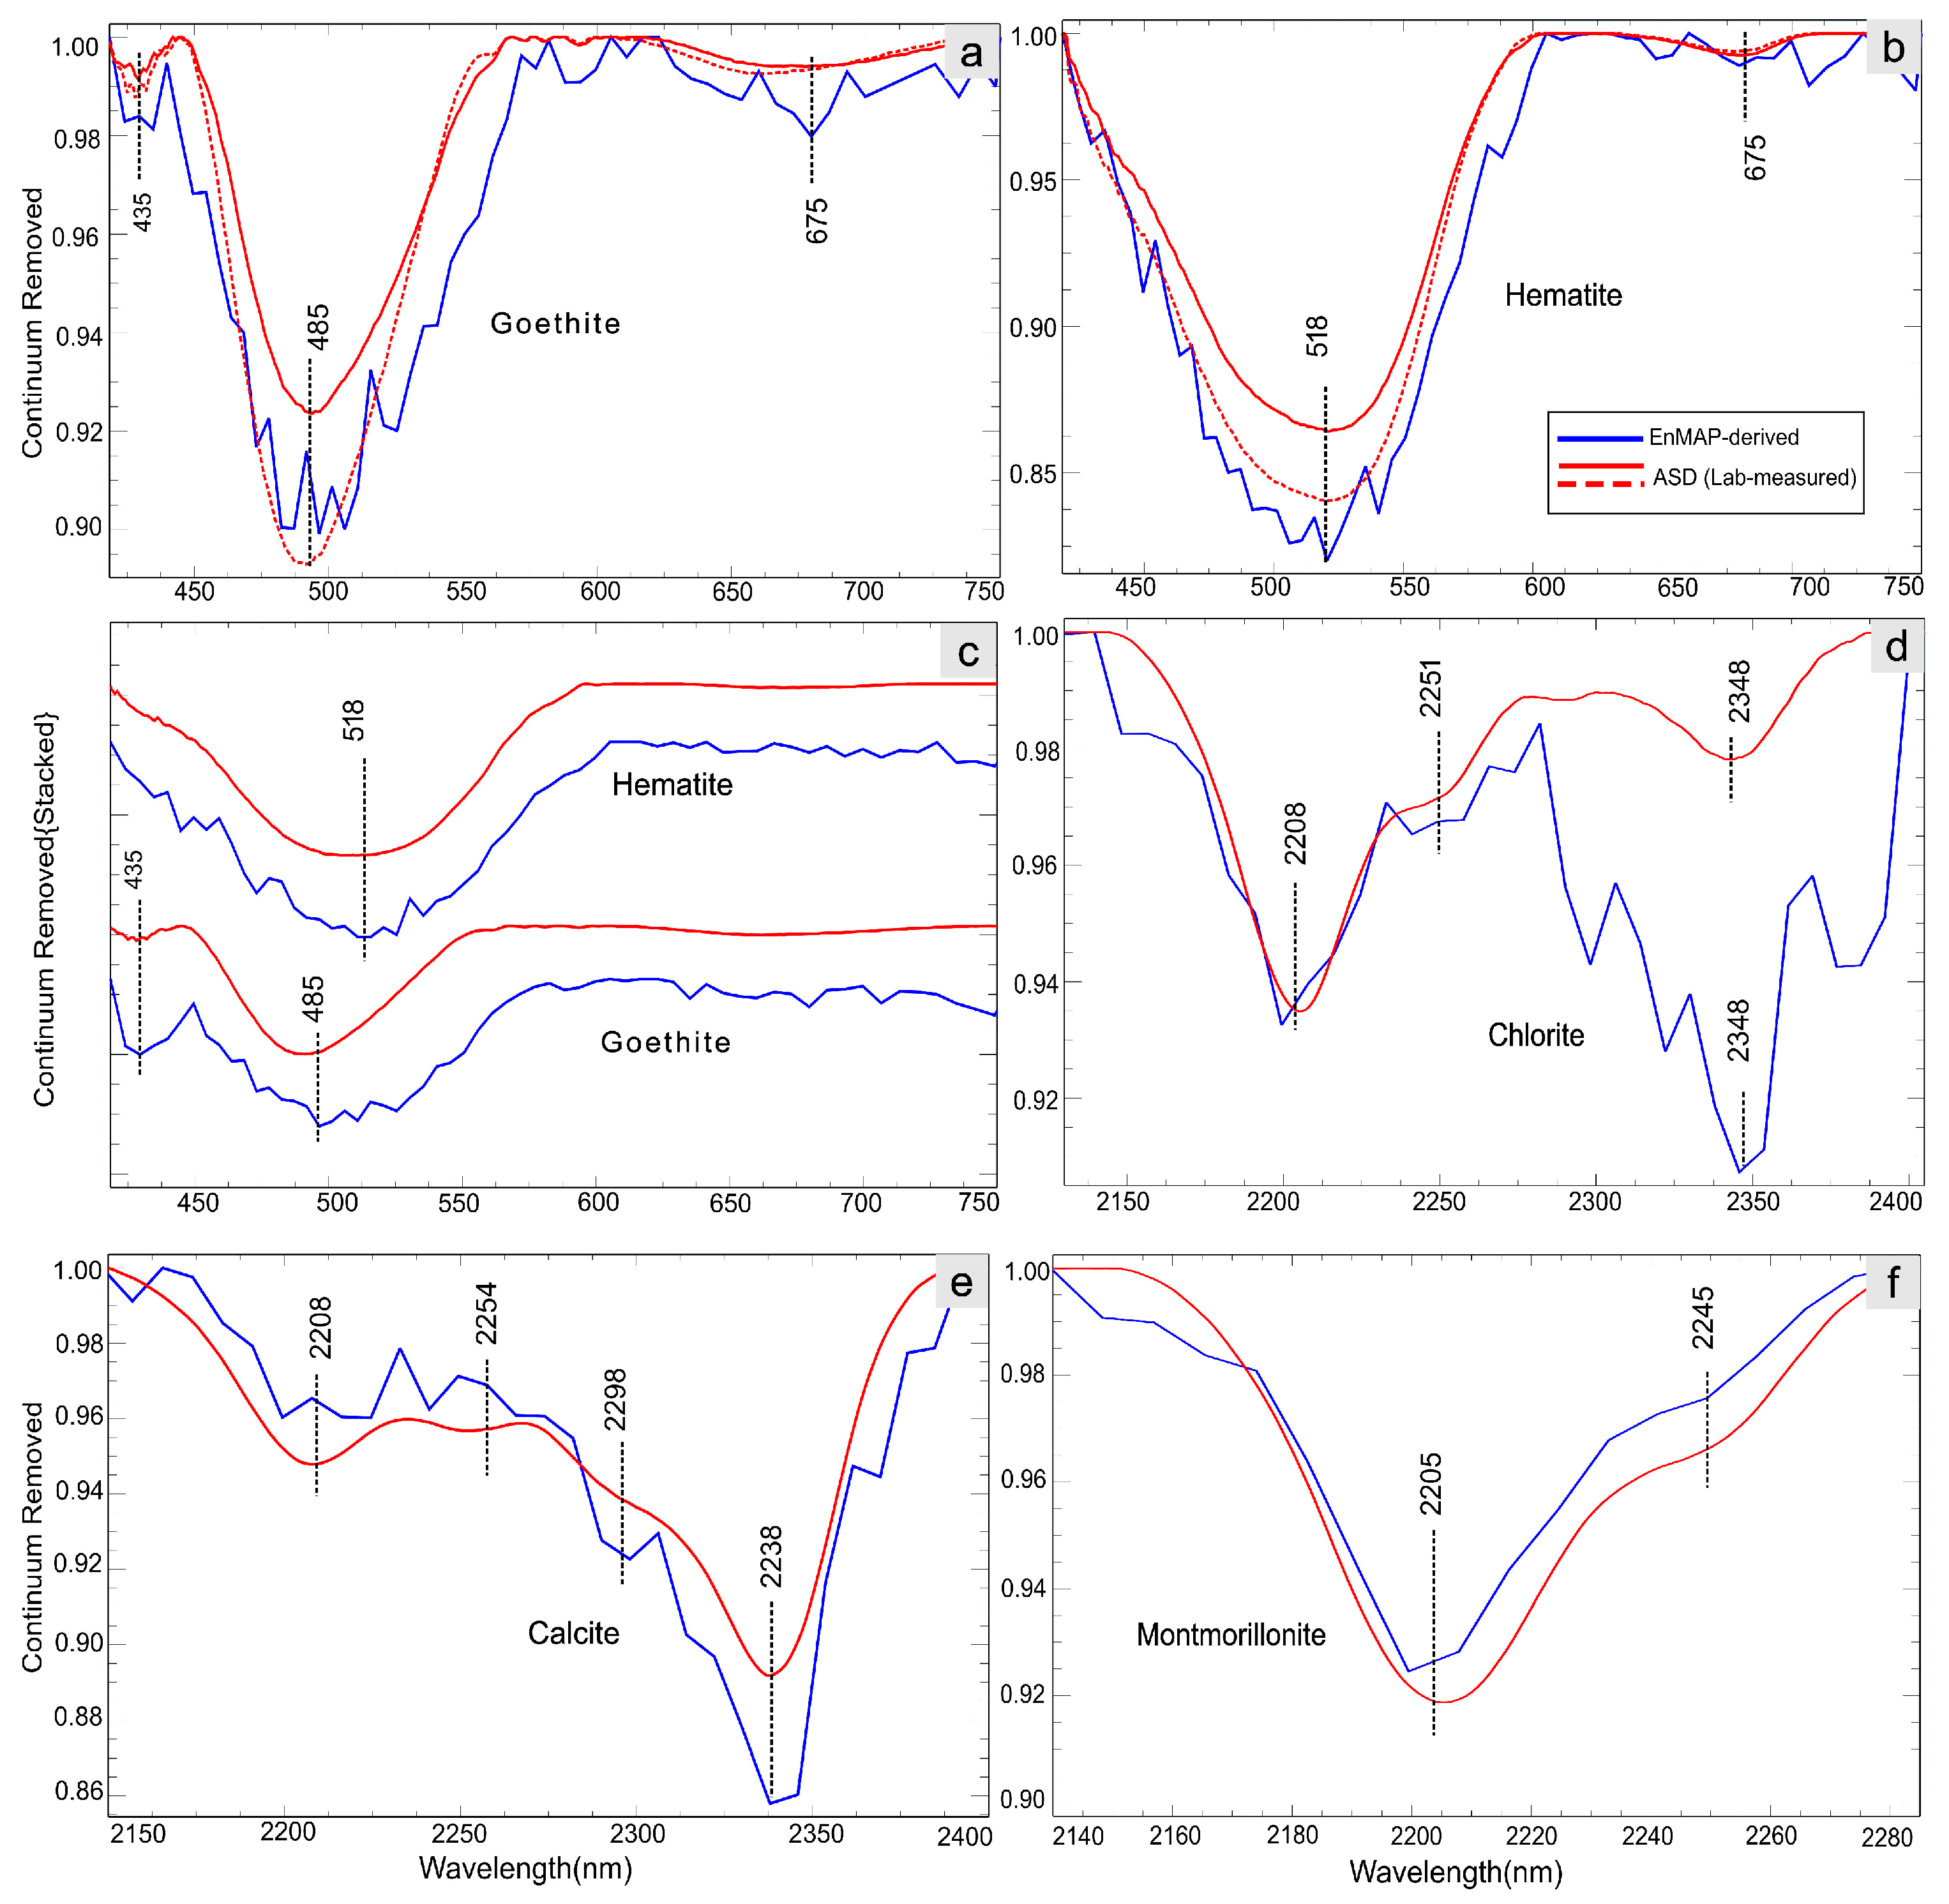
Figure 3 shows the mineral mapping results derived from EnMAP data, while Figure 4 compares selected EnMAP pixel spectra with laboratory-measured spectra of samples from the corresponding locations. As illustrated in the natural color composite image in Figure 3a and the map in Figure 3b, the bedrocks over the anticline exhibit intense color variability, due to the partial/complete removal of hematite coatings and the development of secondary goethite in place. The variations observed in the hue of the sediments in Figure 3a correspond to changes in their iron oxide contents and compositions as well as the crystal size and isomorphic substitution [41], with goethite-rich areas corresponding to partially bleached facies.
The hematite-dominated outcrops (white arrow in Figure 3b) are largely mapped at the center of the anticline, where field observations have recorded unaltered rocks with no evidence of fluid flow or diagenetic alteration linked to microseepage systems. This zone (along with another intact outcrop to the south of the area outside the extent of the oil field, indicated by the white arrow in Figure 3b) represents the original red coloration of the redbeds of the URF, attributed to hematite cements in the strata.
Moving laterally towards the edges of the anticline, both along the axis and southward perpendicular to it, the proportion of hematite and the overall ferric-iron minerals decreases (Figure 3c). In contrast, goethite becomes the dominant mineral.
Although previous spectroscopic studies identified chlorite as the primary ferrous iron mineral in the area [17], mapping its occurrences using EnMAP’s SWIR bands proved challenging. While chlorite’s absorption features were evident in many EnMAP pixels (e.g., Figure 4d) at 2253 nm [10], scene-wide mapping using the SWIR bands was less successful. This was primarily due to the mineral’s weak absorption features at the 2250 nm region, which resulted from its low concentration in the strata. Instead, chlorite-bearing zones were effectively mapped using the ferrous iron index by incorporating bands in the VNIR range (Figure 3d).
The intensely bleached, goethite-rich facies at the southern edge of the anticline are also associated with excess amounts of clays and carbonates (Figure 3e,f), which collectively represent the alteration minerals induced by microseepage systems. The clays mapped in Figure 4f include montmorillonite, identified by its diagnostic Al-OH feature at 2205 nm. It is most abundant at the altered/bleached parts of the URF towards the edges of the anticline, coinciding with intense bleaching [22]. Carbonate occurrences, with calcite as the dominant mineral, are shown in Figure 3e. The mineral shows a diagnostic absorption feature at 2340 nm in both the EnMAP-derived and laboratory spectra, as is exhibited in Figure 4e. The spectrum was extracted from the southwest limestone beds of the Qom Formation [10,17].
The intense calcite anomaly in the southwest of the area corresponds to the limestone beds of the Qom Formation. Over the reservoir, however, calcite appears in quite low proportions yet is widely distributed, coinciding with goethite-dominated pixels. The dominance of calcitic carbonate was confirmed by a diagnostic absorption feature at ~2340 nm in both EnMAP and spectroscopic data. A comparison between laboratory and EnMAP spectra is shown in Figure 4e. Based on petrographic studies, calcite (together with silica, which is not visible in the VNIR-SWIR range) constitutes the dominant secondary cements of the strata [10,17].
Conversely, montmorillonite, as the dominant secondary clay mineral in this area, shows a different distribution pattern compared to calcite, being dominantly mapped over chlorite and goethite-rich zones towards the edges of the anticline. While it partly coincides with shaly interlayer and alluvial fans, in most parts of the area, it is highly consistent with the altered/bleached part of the URF (Figure 3f) [17]. A comparison between EnMAP-derived spectra and lab-based measurements is shown in Figure 4f, highlighting the Al-OH feature at 2205 nm, diagnostic of this mineral [17]

4. Discussion

The mineral mapping results derived from EnMAP data reveal significant spatial variations in the distribution of ferric iron minerals across the anticline, providing insights into the diagenetic processes affecting the strata of URF. The dominance of hematite at the center of the anticline (Figure 3b) and its gradual replacement by goethite towards the edges of the anticline (Figure 3c) highlights the anatomy of microseepage over the reservoir. As noted by [12], such transitions are indicative of microseepage-induced alteration, where reducing fluids associated with hydrocarbon leakage cause the reduction of hematite to ferrous iron, followed by partial transformation and then re-oxidation to goethite under oxidizing conditions of the vadose zone [10]. This is supported by the spectroscopy of hand samples and recognition of hematite and goethite in them, with distinct absorption features both in the visible part (between 420 to 750 nm) and in the near-infrared at 880 nm for hematite and at 925 nm for goethite, as shown in Figure 4a and Figure 4b, respectively [10,41]. Hematite (Fe2O3) is kinetically stable and does not convert directly into goethite [42]. For transformation to occur, hematite must first be reduced to ferrous iron (Fe2+) and then re-oxidized to ferric iron (Fe3+), including goethite (FeOOH) by the following reaction (Equation (1)), facilitated by the exposure to oxidizing meteoric water in the vadose zone [10,41]:
4 F e 2 + + O 2 + 6 H 2 O 4 F e O O H + 8 H +
So, on one hand, the reduction of iron contributes to the development of bleached facies in the URF strata, when ferrous iron is flushed away from the system, and on the other hand, it leads to widespread goethite formation within the strata, due to prevailing oxidation by the meteoric water. This mineralogical transformation manifests itself in the EnMAP data (e.g., Figure 4a,b), highlighting the utility of imaging spectroscopy to map oxidation-reduction zones associated with microseepage systems.
The hematite-rich strata along the axis of the anticline represent a zone unaffected (or least affected) by microseeps. As interpreted by [10,17], this anomaly is attributed to a reservoir-penetrating thrust fault that channels microseepage fluids along the fault line directly to the surface, thereby preventing the near-surface strata from being affected by the underlying microseepage system.
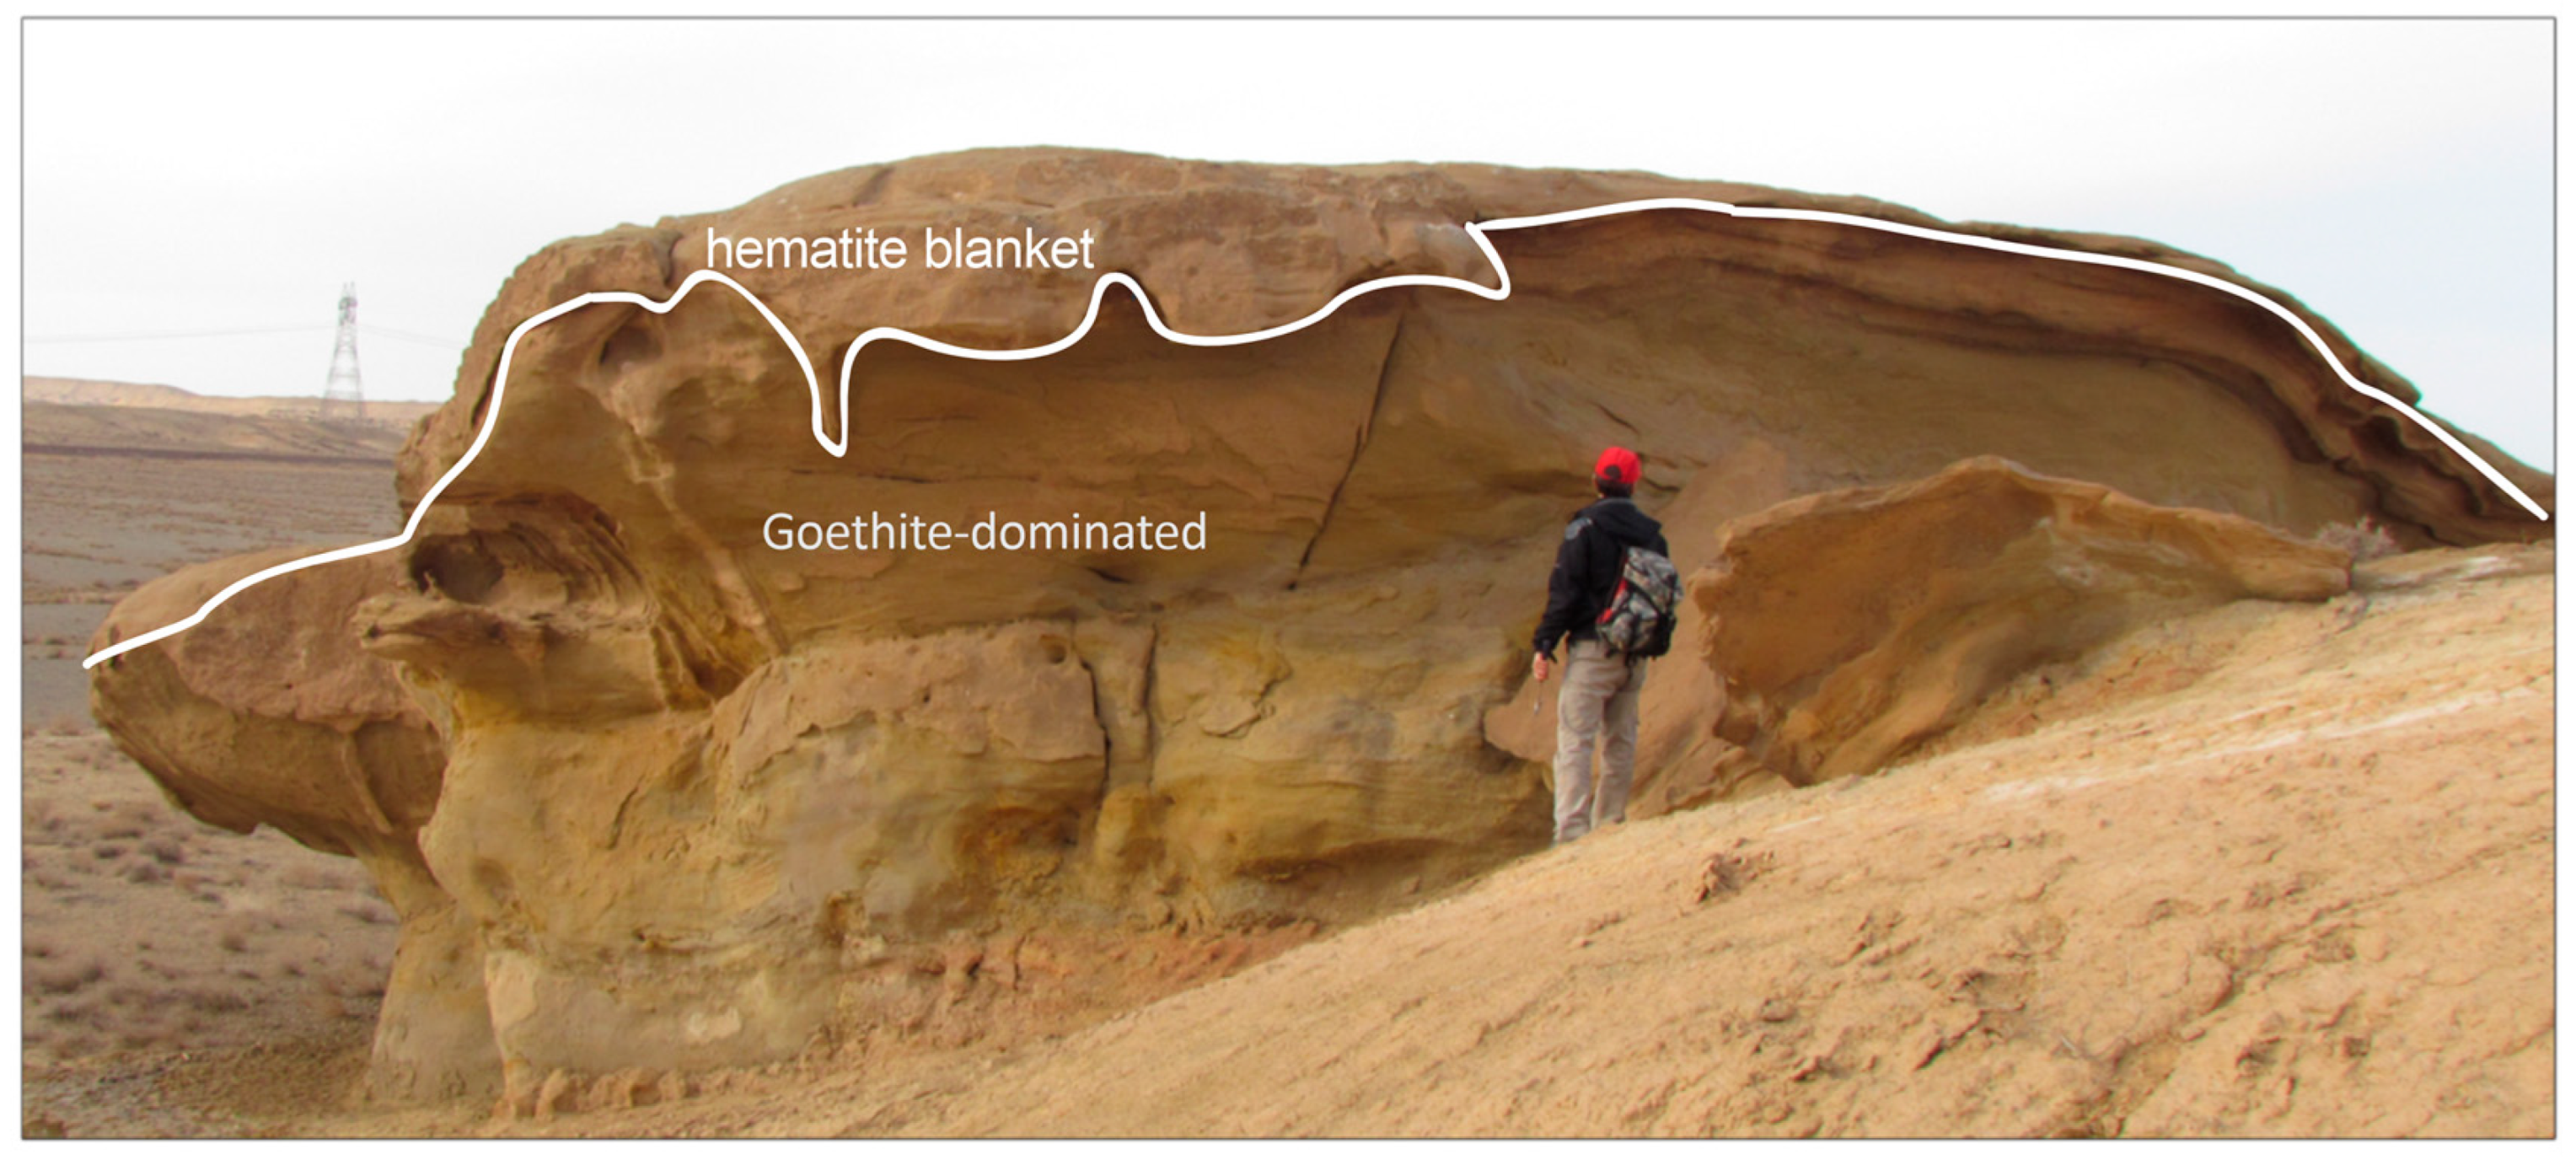
It is worth noting that many of the hematite-bearing zones over the anticline are shown to be hematite-rich only at the uppermost parts, where a thin hematite-rich layer blankets the partially bleached goethite-dominated facies. This phenomenon is clearly illustrated in Figure 5, where the goethite-dominated strata of the URF are overlain by a thin hematite-rich weathering crust. This crust, which is likely formed by surface oxidation and dehydration of goethite to hematite under dry conditions, causes satellite imagery to overestimate the occurrences of hematite compared to ground observations or reflectance spectroscopic measurements in the lab, a finding consistent with [12], who noted similar discrepancies in hyperspectral mapping of iron oxides due to surficial weathering effects [10]. Overall, the maps in Figure 3b,c indicate that the URF strata are not equally affected by diagenetic processes, which is likely due to heterogeneity in the structural architecture of the basin controlled by the thrust faulting in the area.
Overall, goethite is the dominant ferric iron mineral in the microseepage-affected zones, with hematite predominantly manifesting as a thin layer blanketing the goethite-rich strata. This indicates that iron has been moderately mobilized and transported only locally for short distances before being re-deposited as oxides/oxyhydroxides, likely due to the scarcity of precipitation in this dry area and the deep vadose zones above the groundwater level [10,17].
Spectral analysis of carbonates and clays further supports the identified patterns from iron oxide mineralogy. The increased abundance of montmorillonite in the altered/bleached parts of the URF (Figure 3f) and the localized distribution of calcite (Figure 3e) indicate zones of fluid-induced alteration, where hydrocarbon microseepage has contributed to the formation of secondary clays and carbonates [10].
During both the spectral analysis of hand samples and the processing of EnMAP imagery, we specifically looked for any traces of kaolinite within the strata in samples/pixels, as it has previously been identified as a common clay mineral in microseepage-affected zones. However, no evidence of kaolinite was detected. Instead, montmorillonite emerged as the dominant clay mineral (Figure 3f). This is likely attributed to the influence of the mafic composition of the host rock, limited alteration of the strata, and near-neutral pH conditions, all of which inhibit the formation of kaolinite and favor smectite formation [10]. This aligns with previous findings by the authors of [12].
Compared to the mapping results obtained from Sentinel-2 and ASTER multispectral datasets described in [17], EnMAP provides a more accurate delineation of ferric iron minerals. Furthermore, it enables mapping the transitions from hematite to goethite—something not achievable with multispectral data (See Supplementary Figure S1a,b). In addition to the iron mineralogy, EnMAP significantly improves the identification of clay and carbonate minerals, offering greater accuracy and detail (Figure S1c–f). For example, the clay distribution map from EnMAP is extensive and covers large areas, whereas ASTER data highlight only clay-dominated zones, with a more limited spatial extent (Figure S1c,d). A similar pattern is evident in the distribution of carbonates (Figure S1e,f). The results from EnMAP also show a closer alignment with field observations and the spectroscopic analyses presented in [10,17]. Importantly, when relying solely on ASTER data, without reflectance spectroscopic measurements, it was not possible to determine the specific types of clays or carbonates present. This limitation underscores the enhanced mineral discrimination capabilities of hyperspectral sensors like EnMAP. Overall, the findings of this study emphasize the superiority of hyperspectral data over multispectral data for detailed mineral identification and underscore its potential for mapping diagenetic mineralogy in sedimentary environments.
The use of remote sensing for detecting petroleum microseepage systems presents several practical limitations. One of the primary challenges is vegetation cover; in heavily vegetated regions, remote sensing techniques are often ineffective due to interference with surface geology (However, the stress induced in vegetation could instead be the subject of a remote sensing study). Even in exposed terrains where mineral mapping is viable, the detected mineral assemblages must be interpreted within the framework of microseepage models and surface and subsurface geology to yield meaningful insights for petroleum exploration.
Alteration minerals associated with the microseepage phenomenon are quite common in sedimentary environments; thus, the comparison should be relative to a control area over which the effects of background lithology are accounted for. Although features such as large-scale iron oxide bleaching and the development of secondary goethite coatings can indicate the presence of reducing fluids from underlying petroleum reservoirs, these indicators are most diagnostic in redbeds or formations with sufficient permeability to allow fluid circulation.
Subsurface structural architecture also plays a critical role in controlling fluid pathways. As highlighted by [17], structural features such as thrust faults may influence seepage patterns. As a result of the underlying structure, certain areas, such as the one at the crest of the anticline, remain unaffected despite being directly above the reservoir.
Another significant limitation of this method is its inability to distinguish between currently active (charged) and depleted petroleum reservoirs, with inactive microseepage systems. The mineralogical alterations induced by hydrocarbon seepage are irreversible; thus, even after a reservoir has been depleted, the overlying altered strata may continue to exhibit the same mineralogical signatures. Consequently, remote sensing mapping alone cannot differentiate between historical and ongoing hydrocarbon microseeps, demanding other supplementary datasets.
To enhance the reliability of this method, it is essential to analyze alteration minerals collectively and integrate their results with other surface exploration techniques, such as soil geochemistry and soil-gas surveys. Despite inherent limitations, remote sensing remains a valuable tool for reducing the risk of dry holes, given that more than 80% of hydrocarbon reservoirs are associated with microseepage manifestation of one kind or another [12].

5. Conclusions

A distinctive set of mineralogical indicators associated with petroleum microseepage systems in the strata of the URF was mapped using EnMAP hyperspectral data. These include partial bleaching of redbeds, widespread formation of secondary goethite coatings along the anticline axis, development of ferrous iron minerals indicative of secondary Fe-chlorite, and extensive occurrences of calcite and montmorillonite over the reservoir. The mapping results were validated against laboratory-based reflectance spectroscopic data and outcrop-scale field observations. Compared to multispectral remote sensing data from the ASTER and Sentinel-2 instruments, EnMAP demonstrated superior capability in delineating the boundaries of affected zones and in effectively identifying and characterizing individual minerals, thereby more accurately complementing field observations and laboratory spectroscopy. This study demonstrates the potential of spaceborne imaging spectroscopy for tracking diagenetic changes in sedimentary environments, facilitating remote sensing-based microseepage detection in arid to semi-arid regions. This capability, coupled with free accessibility, can improve the efficiency of petroleum exploration and development programs.

Supplementary Materials

The following supporting information can be downloaded at: https://www.mdpi.com/article/10.3390/rs17122088/s1, Figure S1. Comparison of EnMAP-derived mineral maps with corresponding products from Sen-tinel-2 and ASTER multispectral data over the Qom region, Iran.

Author Contributions

Conceptualization, S.A. and Y.E.; methodology, S.A.; software, S.A.; validation, S.A. and Y.E.; formal analysis, Y.E. and S.A.; investigation, S.A.; resources, S.A.; data curation, S.A.; writing—original draft, Y.E.; writing—review and editing, S.A.; visualization, Y.E. and S.A.; supervision, S.A.; project administration, S.A. All authors have read and agreed to the published version of the manuscript.

Funding

This research was supported by the DLR Space Agency, EnMAP science program, grant number 50EE2401. Y.E.’s internship at GFZ was funded by the Iranian Student Affairs Organization at the Ministry of Science, Research and Technology (MSRT).

Data Availability Statement

The data presented in this study are freely available at the EnMAP portal of the DLR Space Agency at https://www.enmap.org/data_access (accessed on 26 August 2023).

Acknowledgments

We express our gratitude to Carlos Roberto de Souza Filho for his generous support during the spectral measurements of the samples at the University of Campinas, Brazil.

Conflicts of Interest

The authors declare no conflicts of interest. The funders (DLR Space Agency and the Iranian Student Affairs Organization at MSRT) had no role in the design of the study; in the collection, analyses, or interpretation of data; in the writing of the manuscript; or in the decision to publish the results.

References

  1. Saunders, D.F.; Burson, K.R.; Thompson, C.K. Model for hydrocarbon microseepage and related near-surface alterations. AAPG Bull. 1999, 83, 170–185. [Google Scholar] [CrossRef]
  2. Schumacher, D. Hydrocarbon-induced alteration of soils and sediments. AAPG Mem. 1996, 66, 71–89. [Google Scholar]
  3. Thompson, C.; Saunders, D.; Burson, K. Model advanced for hydrocarbon microseepage, related alterations. Oil Gas J. 1994, 92, 45–50. [Google Scholar]
  4. Al-Shaieb, Z.; Cairns, J.; Puckette, J. Hydrocarbon-induced diagenetic aureoles (HIDA): Indicators of deeper leaky reservoirs. AAPG Bull. 1995, 79, 141–142. [Google Scholar]
  5. Donovan, T.J. Petroleum microseepage at Cement, Oklahoma: Evidence and mechanism. AAPG Bull. 1974, 58, 429–446. [Google Scholar] [CrossRef]
  6. Al-Shaieb, Z.; Cairns, J.; Puckette, J. Hydrocarbon-induced diagenetic aureoles: Indicators of deeper, leaky reservoirs. Assoc. Pet. Geochem. Explor. Bull. 1994, 10, 23–34. [Google Scholar]
  7. Douglas, W.K.; Rodger, E.D.; Melodye, A.R. Diagenetic alteration of Permian strata at oil fields of south central Oklahoma, USA. Mar. Pet. Geol. 1995, 12, 629–644. [Google Scholar] [CrossRef]
  8. Parry, W.T.; Chan, M.A.; Nash, B.P. Diagenetic characteristics of the Jurassic Navajo Sandstone in the Covenant oil field, central Utah thrust belt. AAPG Bull. 2009, 93, 1039–1061. [Google Scholar] [CrossRef]
  9. Schumacher, D. Surface geochemical exploration for petroleum. In Exploring for Oil and Gas Traps; Beaumont, E.A., Foster, N.H., Eds.; AAPG: Tulsa, OK, USA, 1999; pp. 18–27. [Google Scholar]
  10. Asadzadeh, S.; de Souza Filho, C.R. Characterization of microseepage-induced diagenetic changes in the Upper Red Formation, Qom region, Iran. Part II: A new insight using reflectance spectroscopic analysis. Mar. Pet. Geol. 2020, 117, 104387. [Google Scholar] [CrossRef]
  11. Hunt, G.R. Spectral signatures of particulate minerals in the visible and near infrared. Geophysics 1977, 42, 501–513. [Google Scholar] [CrossRef]
  12. Asadzadeh, S.; de Souza Filho, C.R. Spectral remote sensing for onshore seepage characterization: A critical overview. Earth-Sci. Rev. 2017, 168, 48–72. [Google Scholar] [CrossRef]
  13. Segal, D.B.; Ruth, M.D.; Merin, I.S. Remote detection of anomalous mineralogy associated with hydrocarbon production, Lisbon Valley, Utah. Mt. Geol. 1986, 23, 45–52. [Google Scholar] [CrossRef]
  14. Perry, S.L.; Kruse, F.A.; Carlston, C. Evidence of hydrocarbon seepage using multispectral satellite imagery, Kurdistan, Iraq. In Proceedings of the 73rd EAGE Conference and Exhibition-Workshops 2011, Vienna, Austria, 23–27 May 2011; EAGE: Houten, The Netherlands, 2011. Abstract Number cp-239-00069. [Google Scholar]
  15. Bowen, B.B.; Martini, B.A.; Chan, M.A.; Parry, W.T. Reflectance spectroscopic mapping of diagenetic heterogeneities and fluid-flow pathways in the Jurassic Navajo Sandstone. AAPG Bull. 2007, 91, 173–190. [Google Scholar] [CrossRef]
  16. Lammoglia, T.; de Souza Filho, C.R. Unraveling hydrocarbon microseepages in onshore basins using spectral–spatial processing of ASTER data. Surv. Geophys. 2013, 34, 349–373. [Google Scholar] [CrossRef]
  17. Asadzadeh, S.; de Souza Filho, C.R. Characterization of microseepage-induced diagenetic changes in the Upper Red Formation, Qom region, Iran. Part I: Outcrop, geochemical, and remote sensing studies. Mar. Pet. Geol. 2020, 117, 104149. [Google Scholar] [CrossRef]
  18. Rainoldi, A.L.; Franchini, M.; Beaufort, D.; Patrier, P.; Giusiano, A.; Impiccini, A.; Pons, J. Large-scale bleaching of red beds related to upward migration of hydrocarbons: Los Chihuidos High, Neuquen Basin, Argentina. J. Sediment. Res. 2014, 84, 373–393. [Google Scholar] [CrossRef]
  19. Rangzan, K.; Kabolizade, M.; Elhaei, Y.; Taghizadeh, A. Reflectance spectroscopy and ASTER imagery applied to unravel mineral assemblage as surface indicators of hydrocarbon micro-seepage in the region of Khuzestan oilfields, Iran. Egypt. J. Remote Sens. Space Sci. 2021, 24, 361–372. [Google Scholar] [CrossRef]
  20. Beitler, B.; Chan, M.A.; Parry, W.T. Bleaching of Jurassic Navajo Sandstone on Colorado Plateau Laramide highs: Evidence of exhumed hydrocarbon supergiants? Geology 2003, 31, 1041–1044. [Google Scholar] [CrossRef]
  21. Bishop, J.L.; Lane, M.D.; Dyar, M.D.; King, S.J.; Brown, A.J.; Swayze, G.A. Spectral properties of Ca-sulfates: Gypsum, bassanite, and anhydrite. Am. Mineral. 2014, 99, 2105–2115. [Google Scholar] [CrossRef]
  22. Shi, P.; Fu, B.; Ninomiya, Y.; Sun, J.; Li, Y. Multispectral remote sensing mapping for hydrocarbon seepage-induced lithologic anomalies in the Kuqa foreland basin, south Tian Shan. J. Asian Earth Sci. 2012, 46, 70–77. [Google Scholar] [CrossRef]
  23. Garain, S.; Mitra, D.; Das, P. Mapping hydrocarbon microseepage prospect areas by integrated studies of ASTER processing, geochemistry and geophysical surveys in Assam-Arakan Fold Belt, NE India. Int. J. Appl. Earth Obs. Geoinf. 2021, 102, 102432. [Google Scholar] [CrossRef]
  24. Guo, J.; Fan, H.; Wang, X.; Zhang, L.; Ren, L.; He, Y.; Ma, F.; Meng, W.; Bai, X.; Yin, J. Integrating geochemical anomaly and remote sensing methods to predict oil- and gas-bearing areas in the Yanchang Oil Field, Ordos Basin, China. Earth Sci. Res. J. 2019, 23, 79–86. [Google Scholar] [CrossRef]
  25. Chen, S.; Zhao, Y.; Zhao, L.; Liu, Y.; Zhou, C. Hydrocarbon micro-seepage detection by airborne hyperspectral data in Xifeng Oilfield, China. J. Earth Sci. 2017, 28, 656–665. [Google Scholar] [CrossRef]
  26. Everett, J.R.; Jengo, C.; Staskowski, R. Remote sensing and GIS enable future exploration success. World Oil 2002, 223, 59–65. [Google Scholar]
  27. Petrovic, A.; Khan, S.D.; Thurmond, A.K. Integrated hyperspectral remote sensing, geochemical and isotopic studies for understanding hydrocarbon-induced rock alterations. Mar. Pet. Geol. 2012, 35, 292–308. [Google Scholar] [CrossRef]
  28. Alnahwi, A.; Kosanke, T.; Loucks, R.G.; Greene, J.; Liu, X.; Linton, P. High-resolution hyperspectral-based continuous mineralogical and total organic carbon analysis of the Eagle Ford Group and associated formations in south Texas. AAPG Bull. 2020, 104, 1439–1462. [Google Scholar] [CrossRef]
  29. Asadzadeh, S.; Zhou, X.; Chabrillat, S. Assessment of the spaceborne EnMAP hyperspectral data for alteration mineral mapping: A case study of the Reko Diq porphyry CuAu deposit, Pakistan. Remote Sens. Environ. 2024, 314, 114389. [Google Scholar] [CrossRef]
  30. Guanter, L.; Irakulis-Loitxate, I.; Gorroño, J.; Sánchez-García, E.; Cusworth, D.H.; Varon, D.J.; Cogliati, S.; Colombo, R. Mapping methane point emissions with the PRISMA spaceborne imaging spectrometer. Remote Sens. Environ. 2021, 265, 112671. [Google Scholar] [CrossRef]
  31. Chabrillat, S.; Foerster, S.; Segl, K.; Beamish, A.; Brell, M.; Asadzadeh, S.; Milewski, R.; Ward, K.; Brosinsky, A.; Koch, K.; et al. The EnMAP spaceborne imaging spectroscopy mission: Initial scientific results two years after launch. Remote Sens. Environ. 2024, 315, 114379. [Google Scholar] [CrossRef]
  32. Roger, J.; Irakulis-Loitxate, I.; Valverde, A.; Gorroño, J.; Chabrillat, S.; Brell, M.; Guanter, L. High-resolution methane mapping with the EnMAP satellite imaging spectroscopy mission. IEEE Trans. Geosci. Remote Sens. 2024, 62, 1–12. [Google Scholar] [CrossRef]
  33. Correa Pabón, R.E.; de Souza Filho, C.R.; de Oliveira, W.J. Reflectance and imaging spectroscopy applied to detection of petroleum hydrocarbon pollution in bare soils. Sci. Total Environ. 2019, 649, 1224–1236. [Google Scholar] [CrossRef] [PubMed]
  34. Storch, T.; Honold, H.P.; Chabrillat, S.; Habermeyer, M.; Tucker, P.; Brell, M.; Ohndorf, A.; Wirth, K.; Betz, M.; Kuchler, M.; et al. The EnMAP imaging spectroscopy mission towards operations. Remote Sens. Environ. 2023, 294, 113632. [Google Scholar] [CrossRef]
  35. Clark, R.N.; Roush, T.L. Reflectance spectroscopy: Quantitative analysis techniques for remote sensing applications. J. Geophys. Res. Solid Earth 1984, 89, 6329–6340. [Google Scholar] [CrossRef]
  36. van der Meer, F.D. The effectiveness of spectral similarity measures for the analysis of hyperspectral imagery. Int. J. Appl. Earth Obs. Geoinf. 2006, 8, 3–17. [Google Scholar] [CrossRef]
  37. Boardman, J.W.; Kruse, F.A.; Green, R.O. Spectral image processing system (SIPS) for geologic mapping with imaging spectrometers. In Proceedings of the 9th Thematic Conference on Geologic Remote Sensing, Pasadena, CA, USA, 8–11 February 1993; ERIM: Ann Arbor, MI, USA; pp. 465–477. [Google Scholar]
  38. Li, Q.; Zhang, B.; Guo, H. Polynomial fitting for preprocessing hyperspectral data in mineral exploration. J. Remote Sens. 2005, 9, 432–439. [Google Scholar]
  39. Asadzadeh, S.; de Souza Filho, C.R. Iterative curve fitting for enhancing hyperspectral data analysis in mineral exploration. IEEE Trans. Geosci. Remote Sens. 2016, 54, 4056–4068. [Google Scholar]
  40. Asadzadeh, S.; de Souza Filho, C.R. Iterative curve fitting: A robust technique to estimate the wavelength position and depth of absorption features from spectral data. IEEE Trans. Geosci. Remote Sens. 2016, 54, 5964–5974. [Google Scholar] [CrossRef]
  41. Nielson, G.; Chan, M.A.; Bowen, B. Iron-rich horizons in the Jurassic Navajo Sandstone, southwestern Utah: Progressive cementation and permeability inversion. In Geology of Utah’s Far South; MacLean, J.S., Biek, R.F., Huntoon, J.E., Eds.; Utah Geological Association: Salt Lake City, UT, USA, 2014; Volume 43, pp. 215–236. [Google Scholar]
  42. Schwertmann, U. Transformation of hematite to goethite in soils. Nature 1971, 232, 624–625. [Google Scholar] [CrossRef]
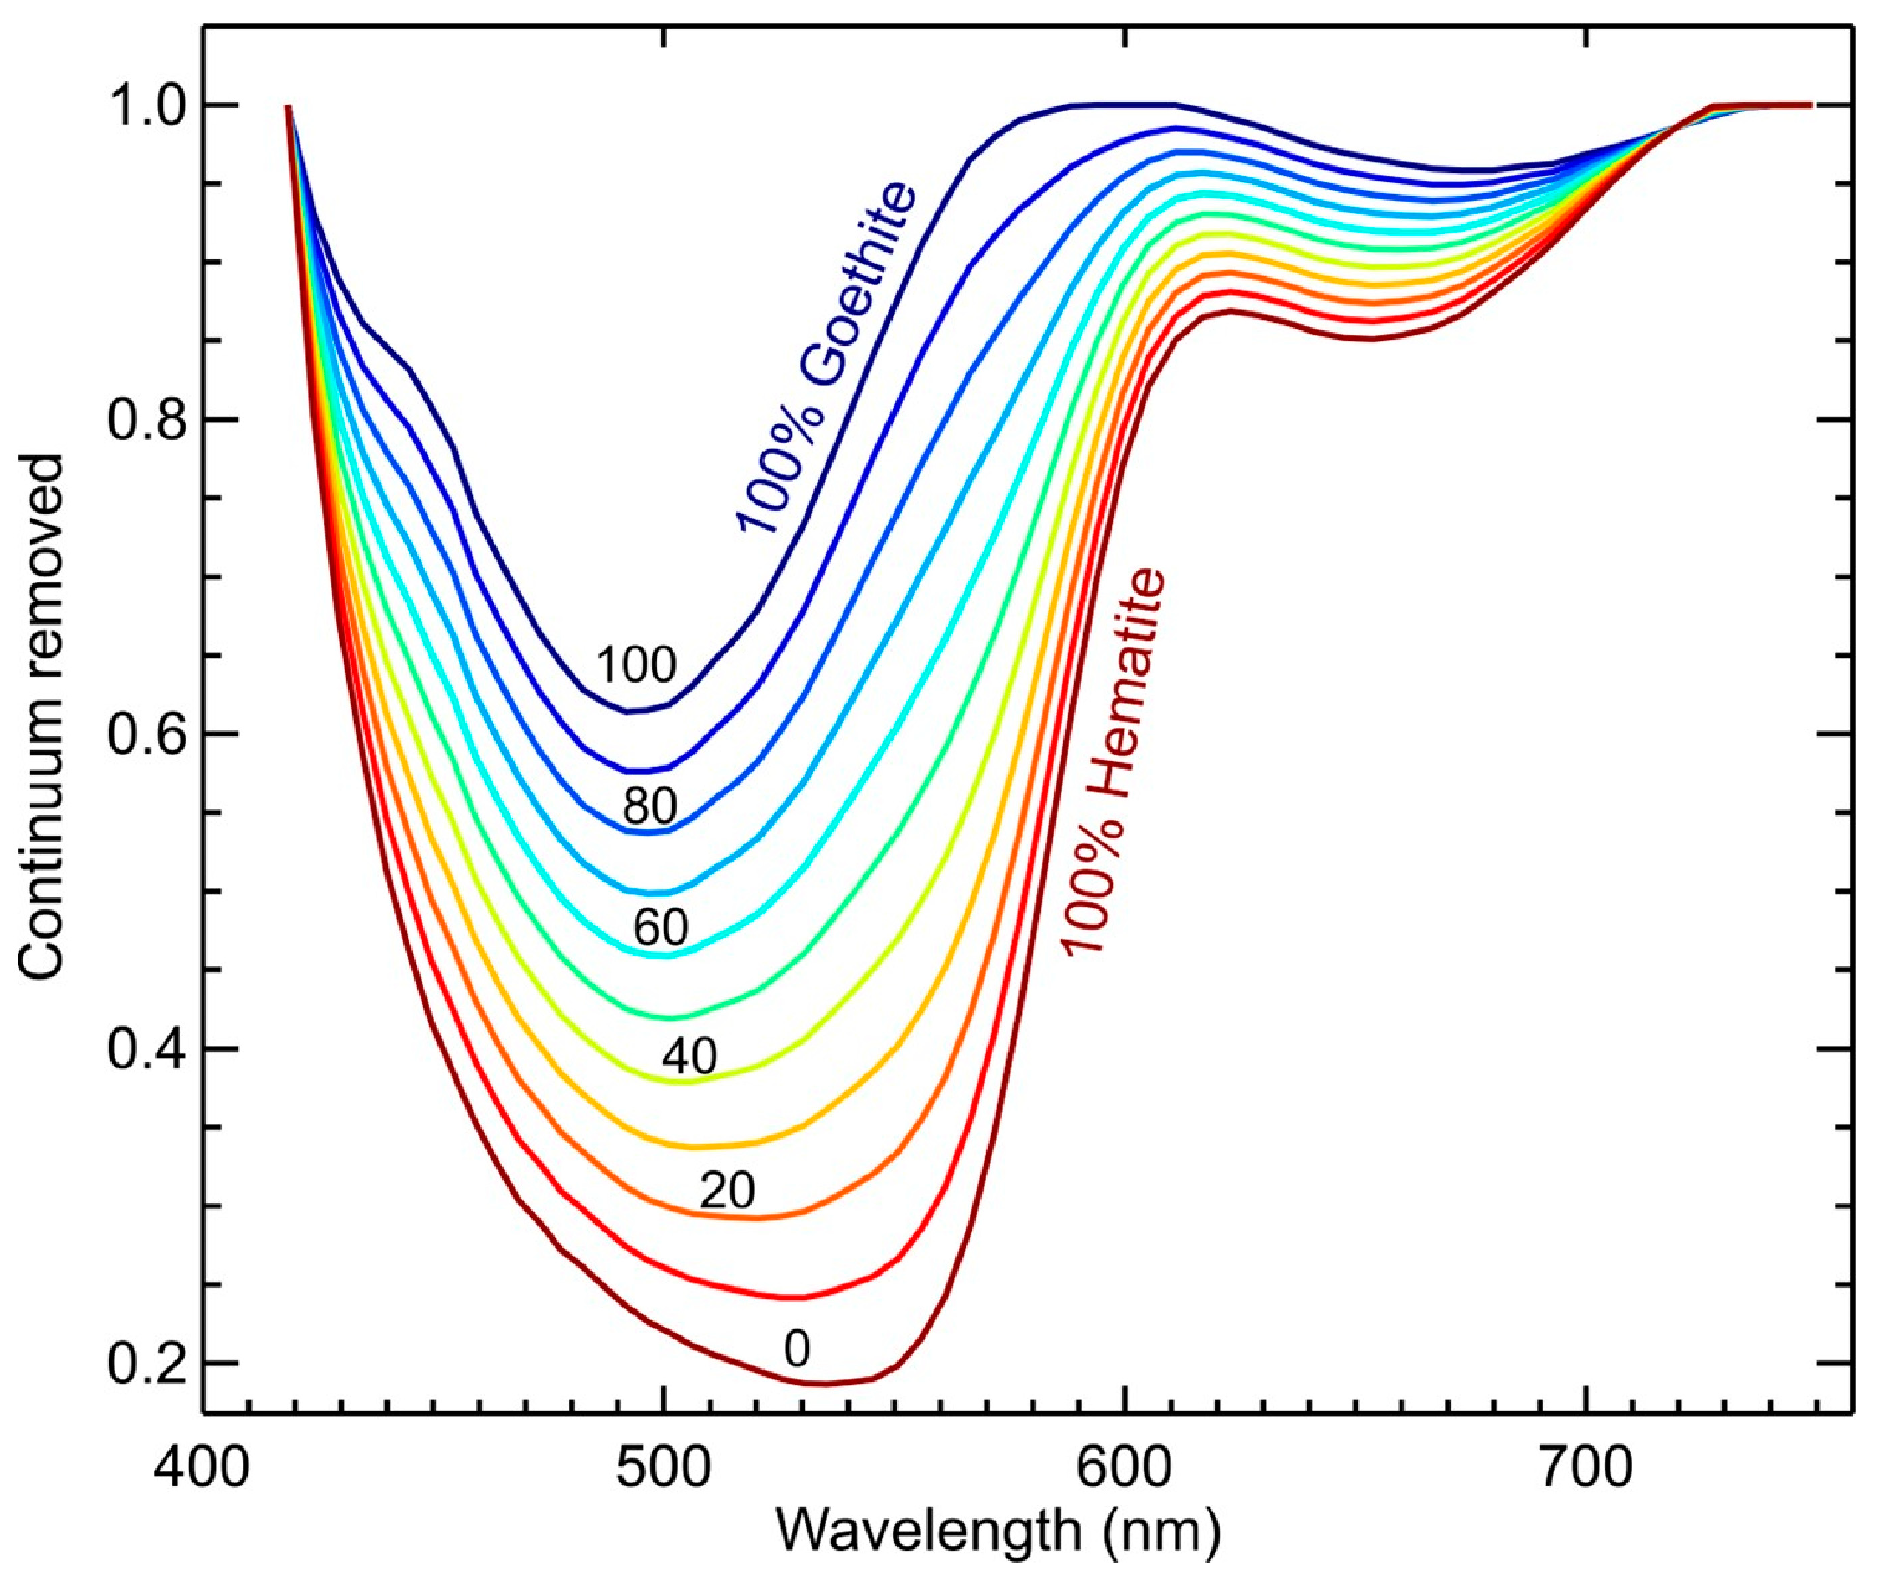
Figure 1. Generalized geologic map of the Qom study area, adopted from [10,17].
Remotesensing 17 02088 g001
Figure 2. A synthetic linear mixture between hematite and goethite spectra generated in the 420–750 nm range at 10% increments. By matching image pixels against this continuum-removed simulated mixture, the relative proportion of hematite and goethite were mapped using the spectral feature matching method.
Remotesensing 17 02088 g002
Figure 3. Microseepage alteration maps derived from EnMAP satellite data over the Qom region: (a) natural color composite imagery; (b) relative distribution of hematite and goethite; (c) hematite-to-goethite ratio map, highlighting hematite-rich areas; (d) distribution and relative abundance of ferrous-iron minerals, representing Fe-chlorite occurrences in the area; (e) relative abundance and distribution of calcite; and (f) relative abundance and distribution of montmorillonite. The white circles in panels (bf) mark the location of the pixels for which the spectra are shown in Figure 3. The white arrow indicates the location of the photograph in Figure 4. This figure includes modified EnMAP data ©DLR [2023], all rights reserved.
Remotesensing 17 02088 g003
Figure 4. Continuum-removed reflectance spectra derived from EnMAP pixels (blue) compared to laboratory-measured spectra of samples collected from the corresponding locations in the field (red): (a) Goethite; (b) Hematite; (c) hematite and goethite shown together; (d) chlorite; (e) calcite; and (f) montmorillonite. The locations of the corresponding pixels/samples are shown in Figure 2. The EnMAP spectra are presented in their native resolution with no spectral smoothing. This figure includes modified EnMAP data ©DLR [2023], all rights reserved.
Remotesensing 17 02088 g004
Figure 5. The hematite-rich weathering crust formed at the top of the goethite-dominated sandstone beds of the URF in the Qom region. The photo location corresponds to the arrow shown in Figure 3b.
Remotesensing 17 02088 g005
Table 1. The main specifications of EnMAP data.
SensorSpectral RangeNo. of BandsFWHMSpatial Res.SNR
EnMAPVNIR: 420–975 nm91~6.5 nm30 m>400 @ 495 nm
SWIR: 975–2450 nm133~10 nm>170 @ 2200 nm
Disclaimer/Publisher’s Note: The statements, opinions and data contained in all publications are solely those of the individual author(s) and contributor(s) and not of MDPI and/or the editor(s). MDPI and/or the editor(s) disclaim responsibility for any injury to people or property resulting from any ideas, methods, instructions or products referred to in the content.