
Effects of Precipitation and Fire on Land Surface Phenology in the Brazilian Savannas (Cerrado)

 , ,
, , 
Abstract

1. Introduction
2. Methodology
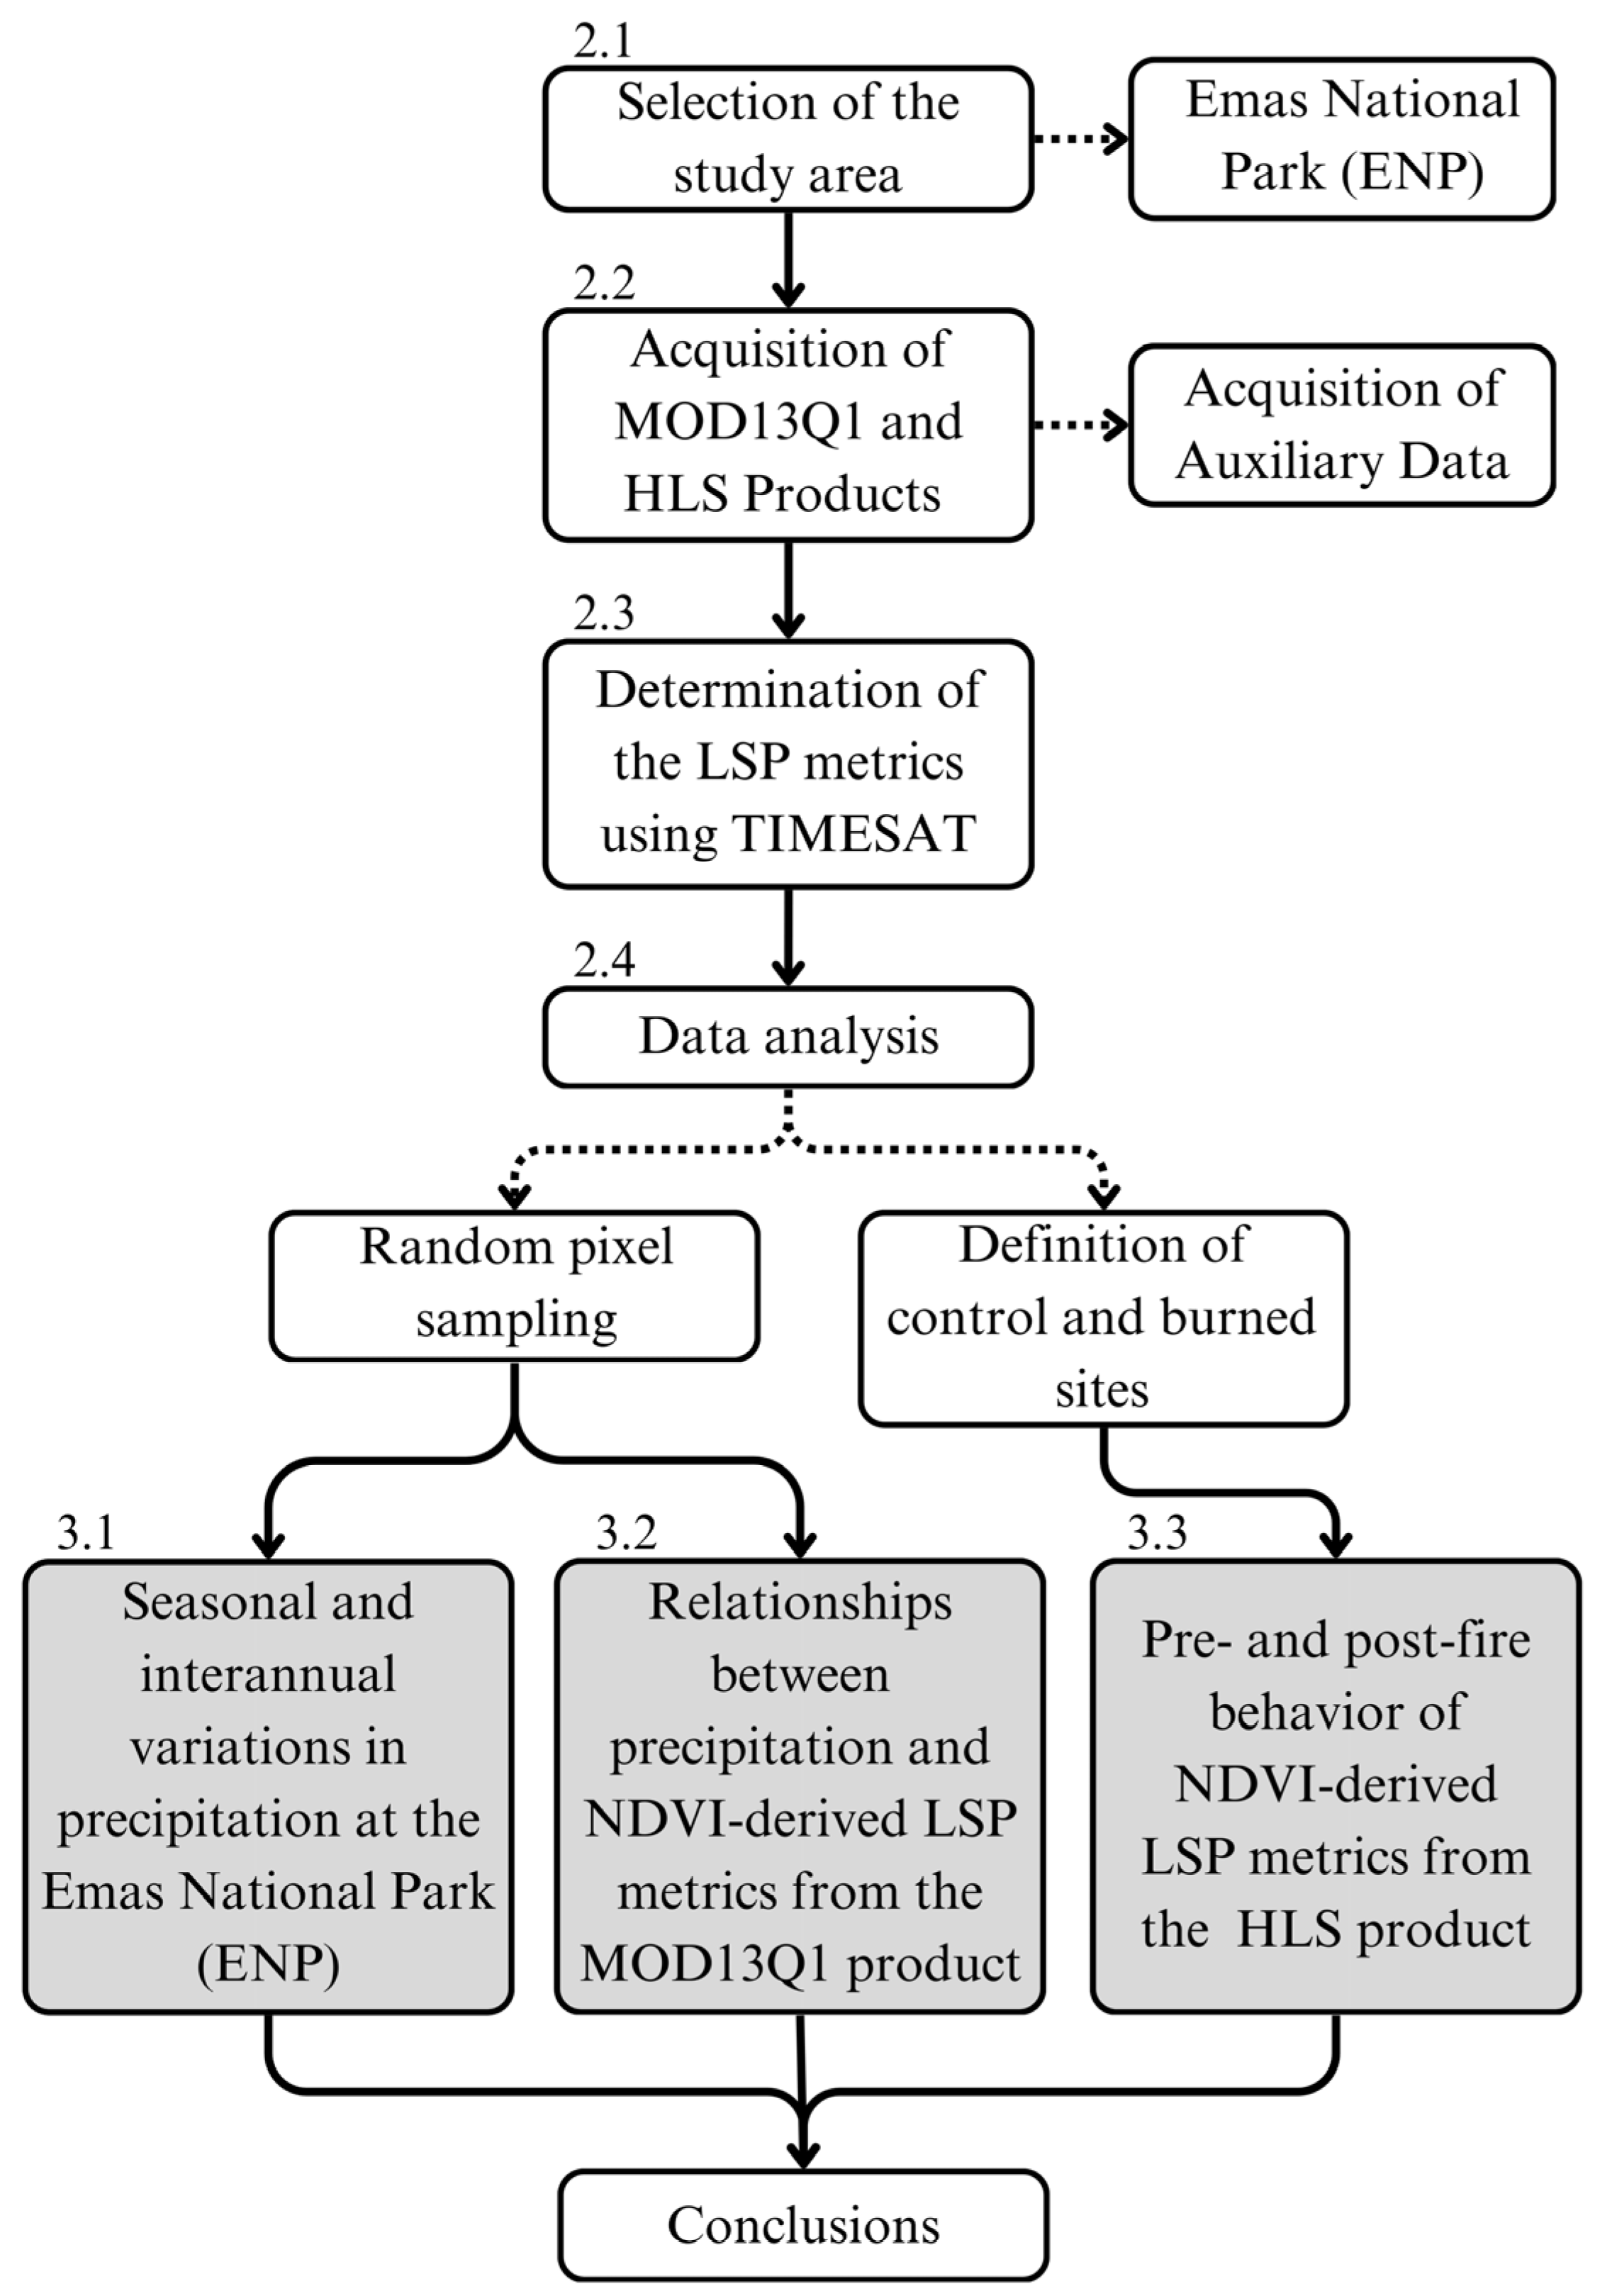
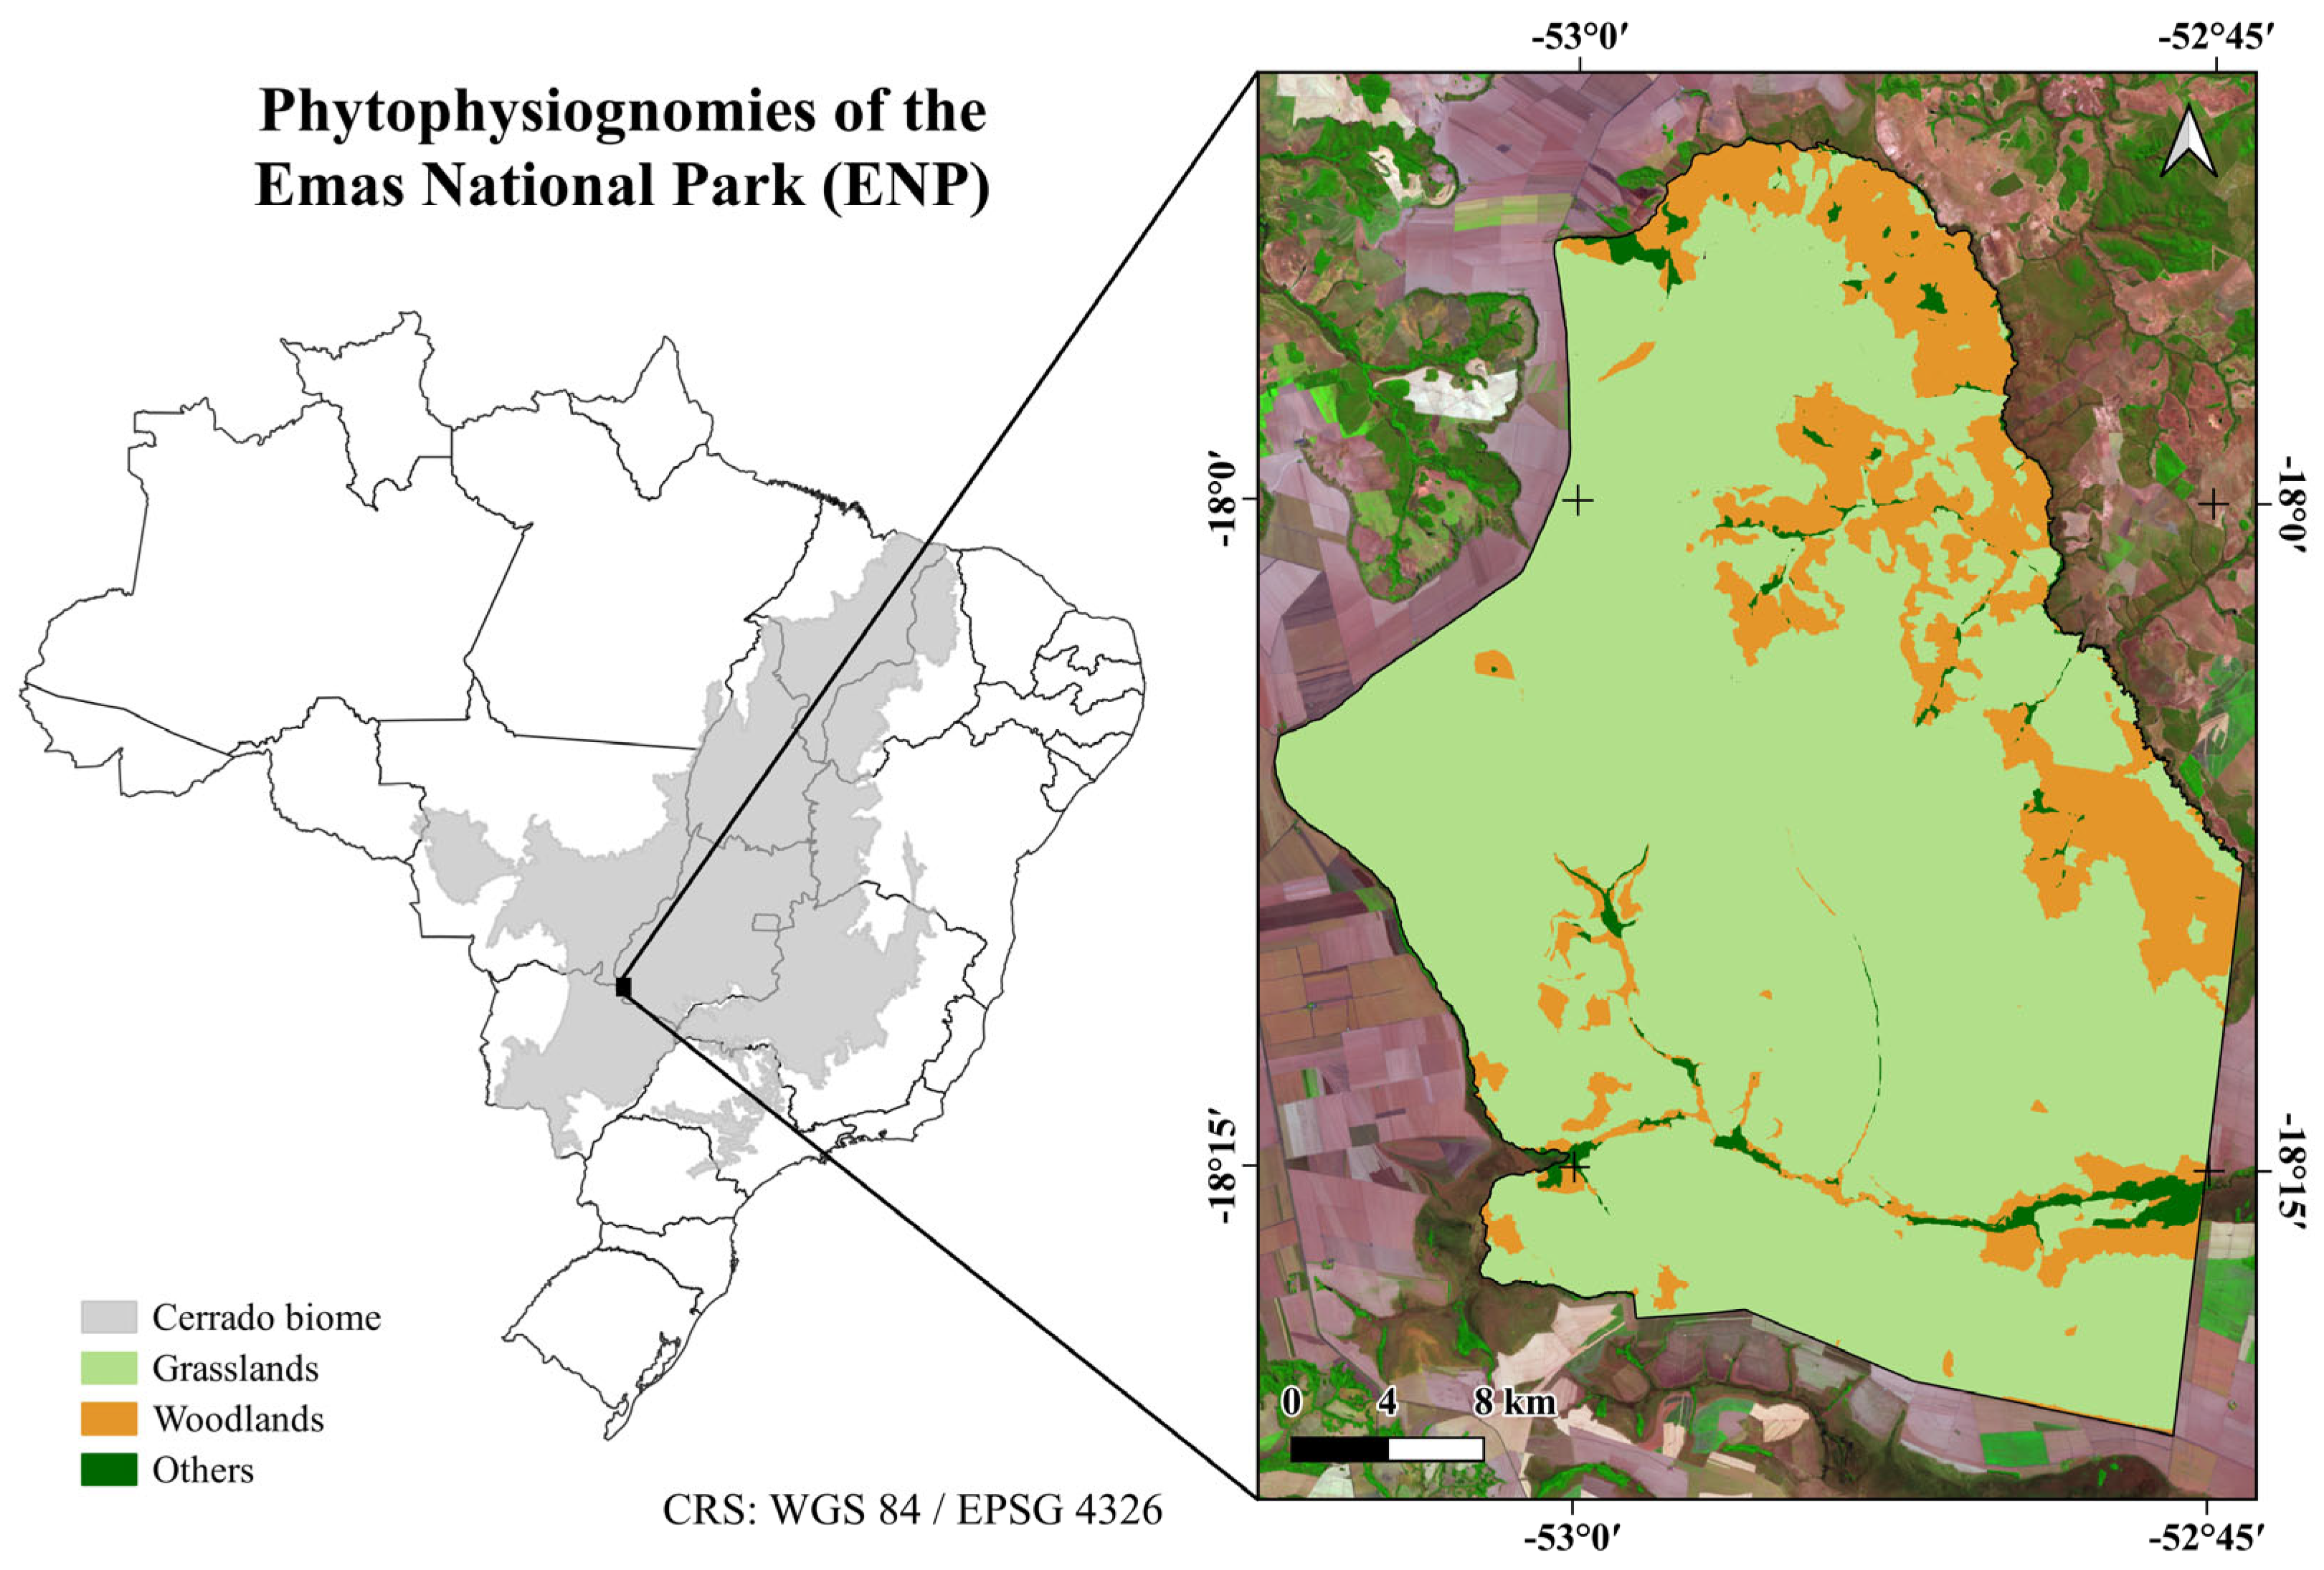
2.1. Selection of the Study Area
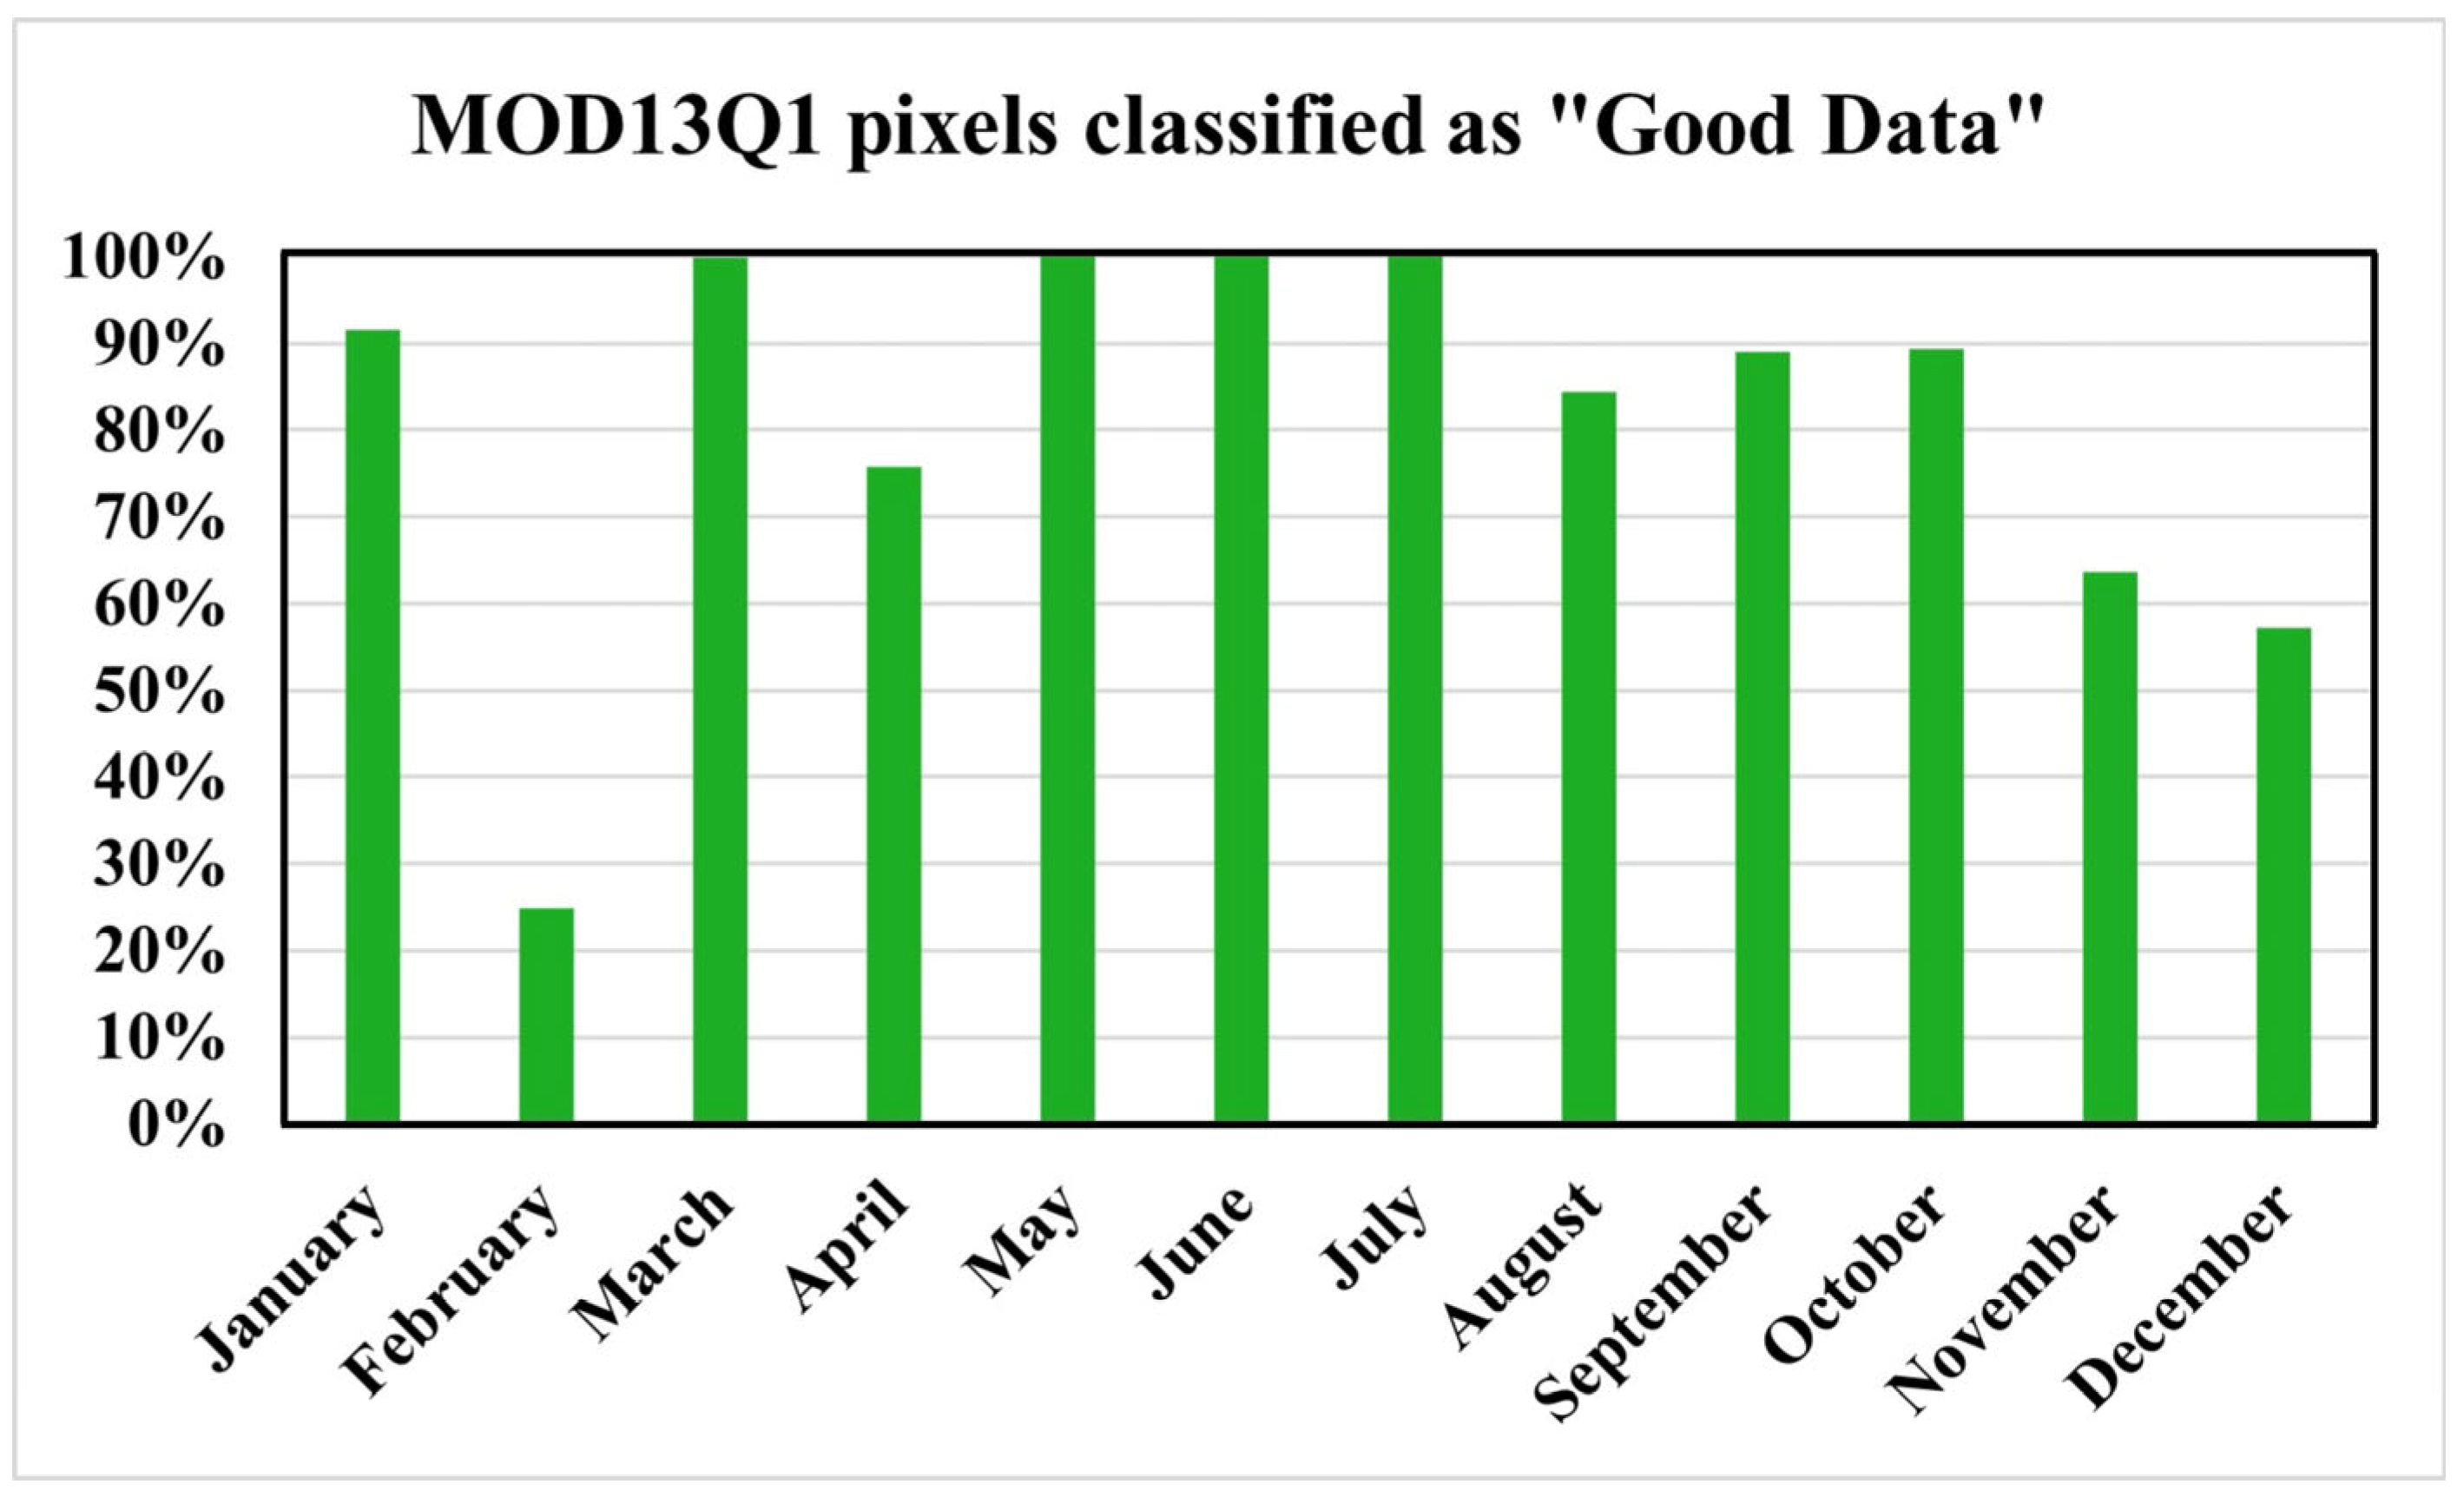
2.2. Acquisition of MOD13Q1 and HLS Products and Auxiliary Data
2.3. Determination of the LSP Metrics Using TIMESAT
2.4. Data Analysis
3. Results
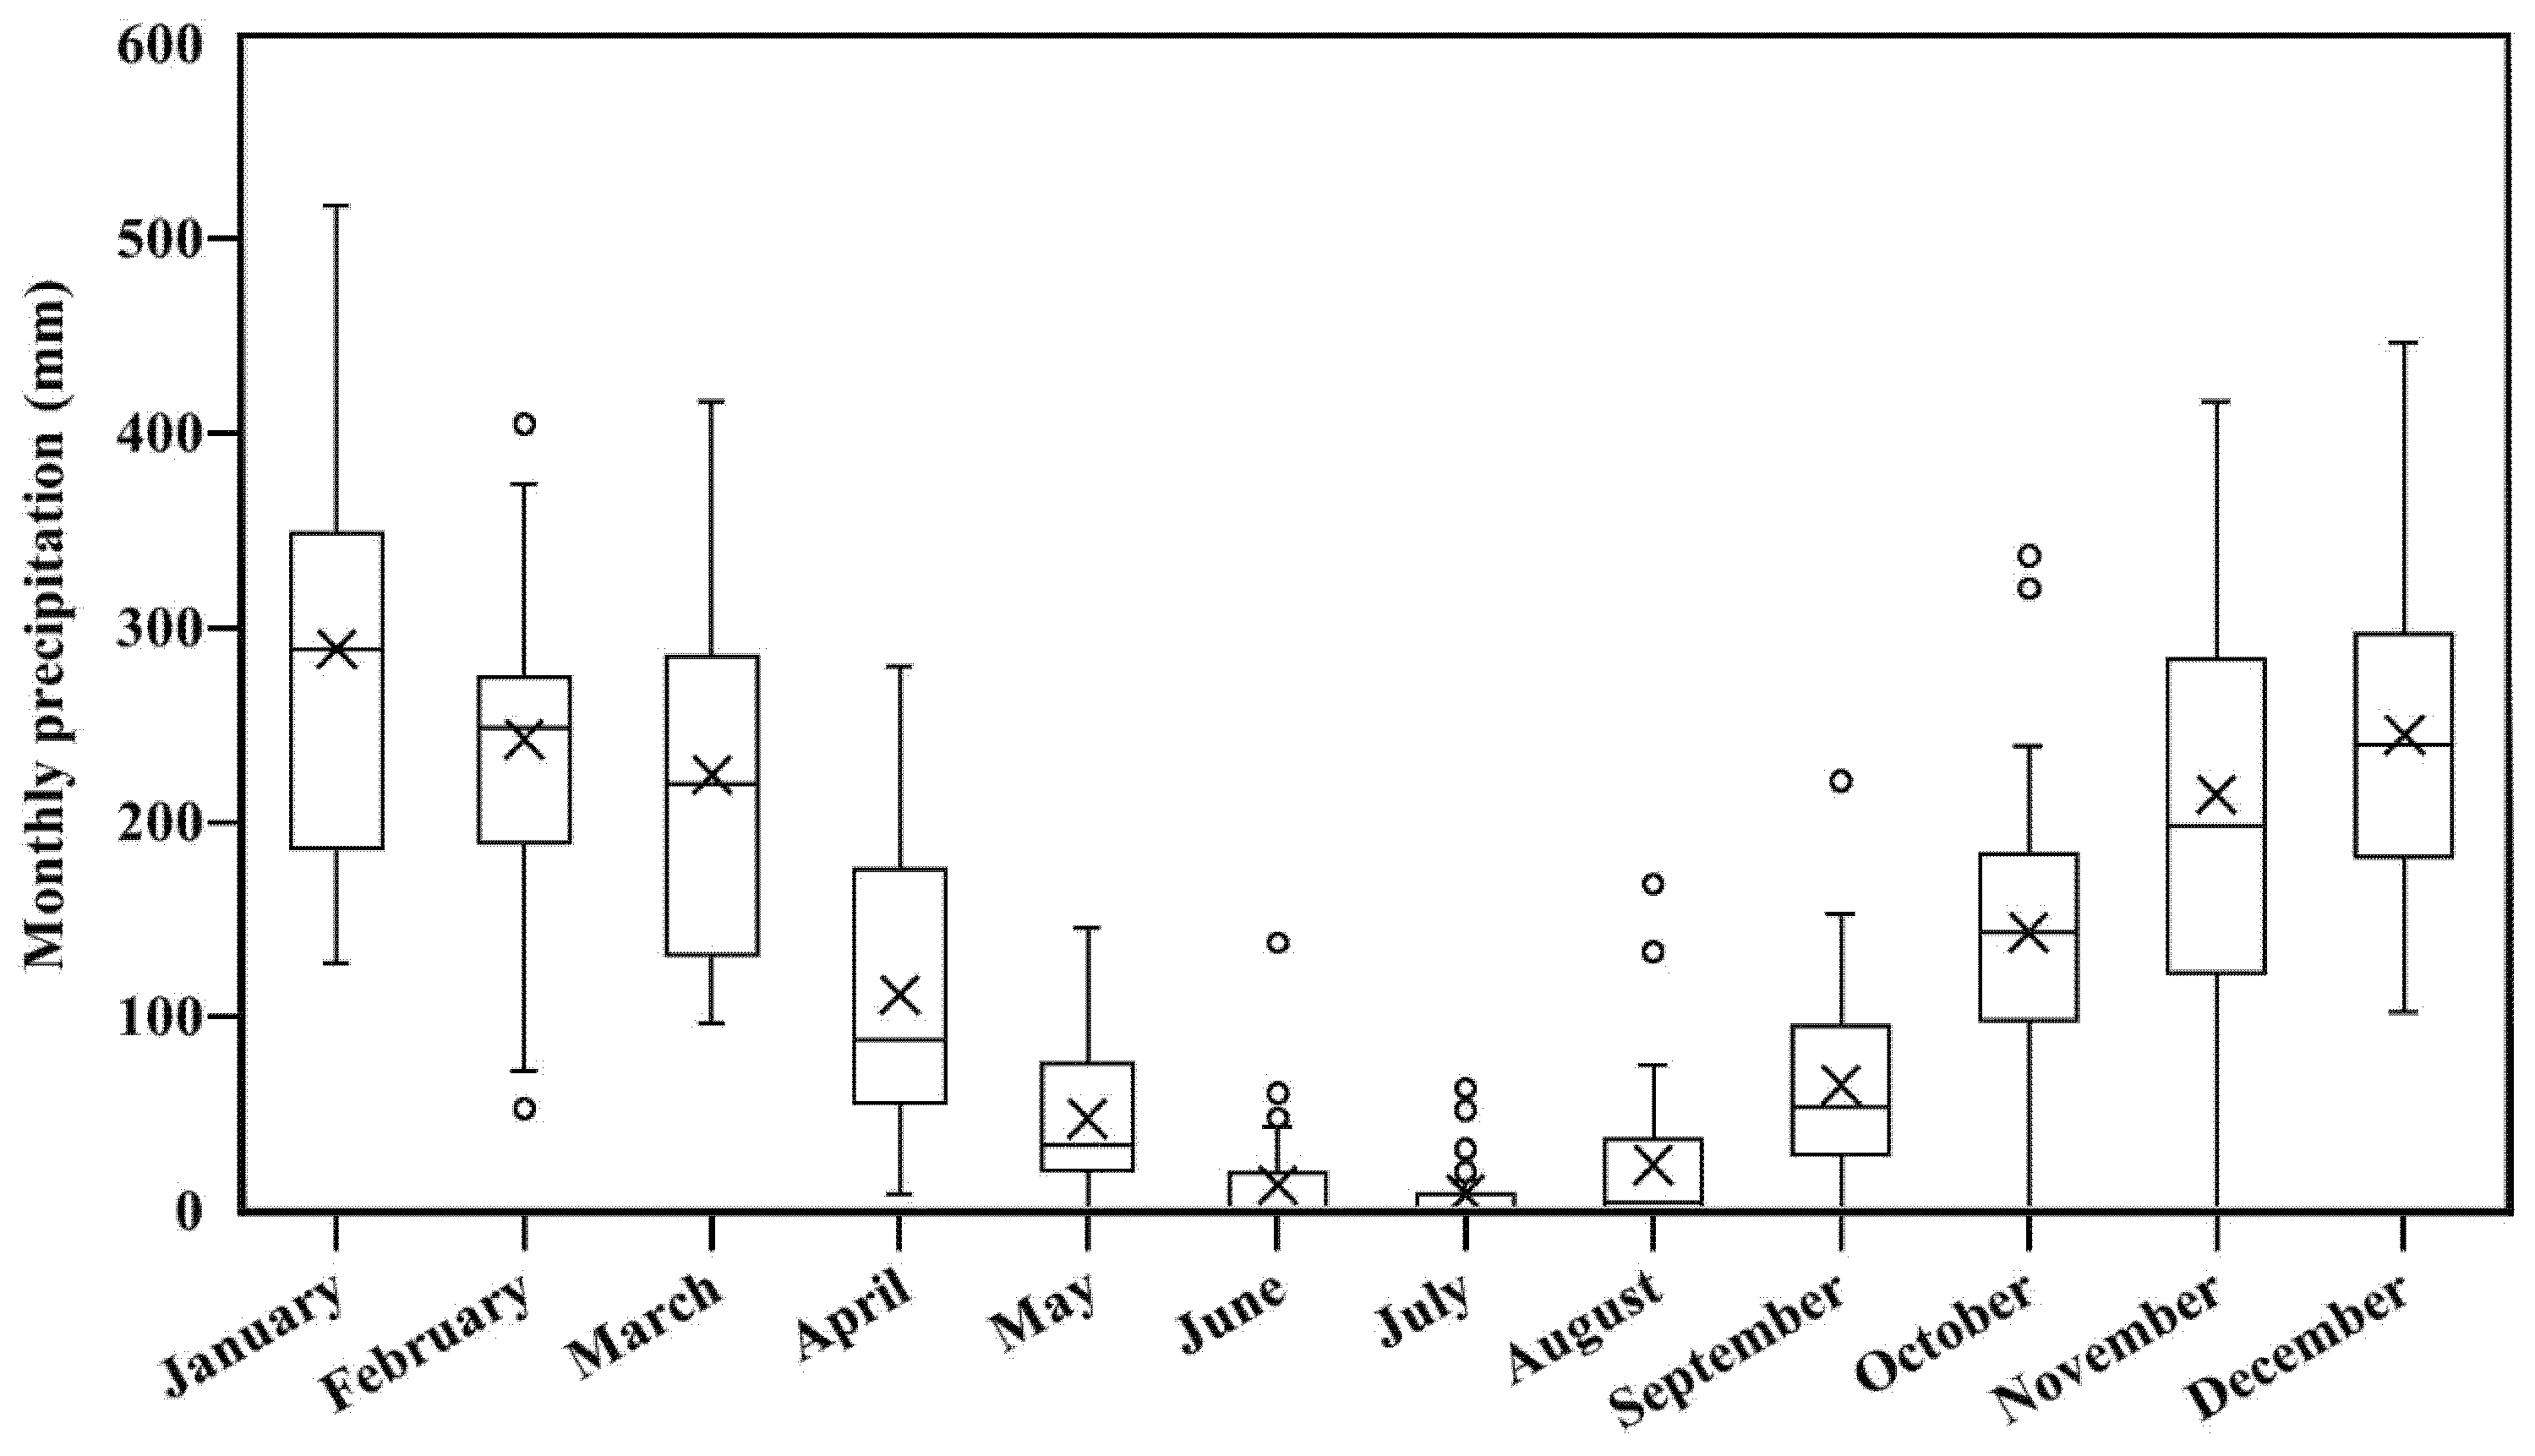
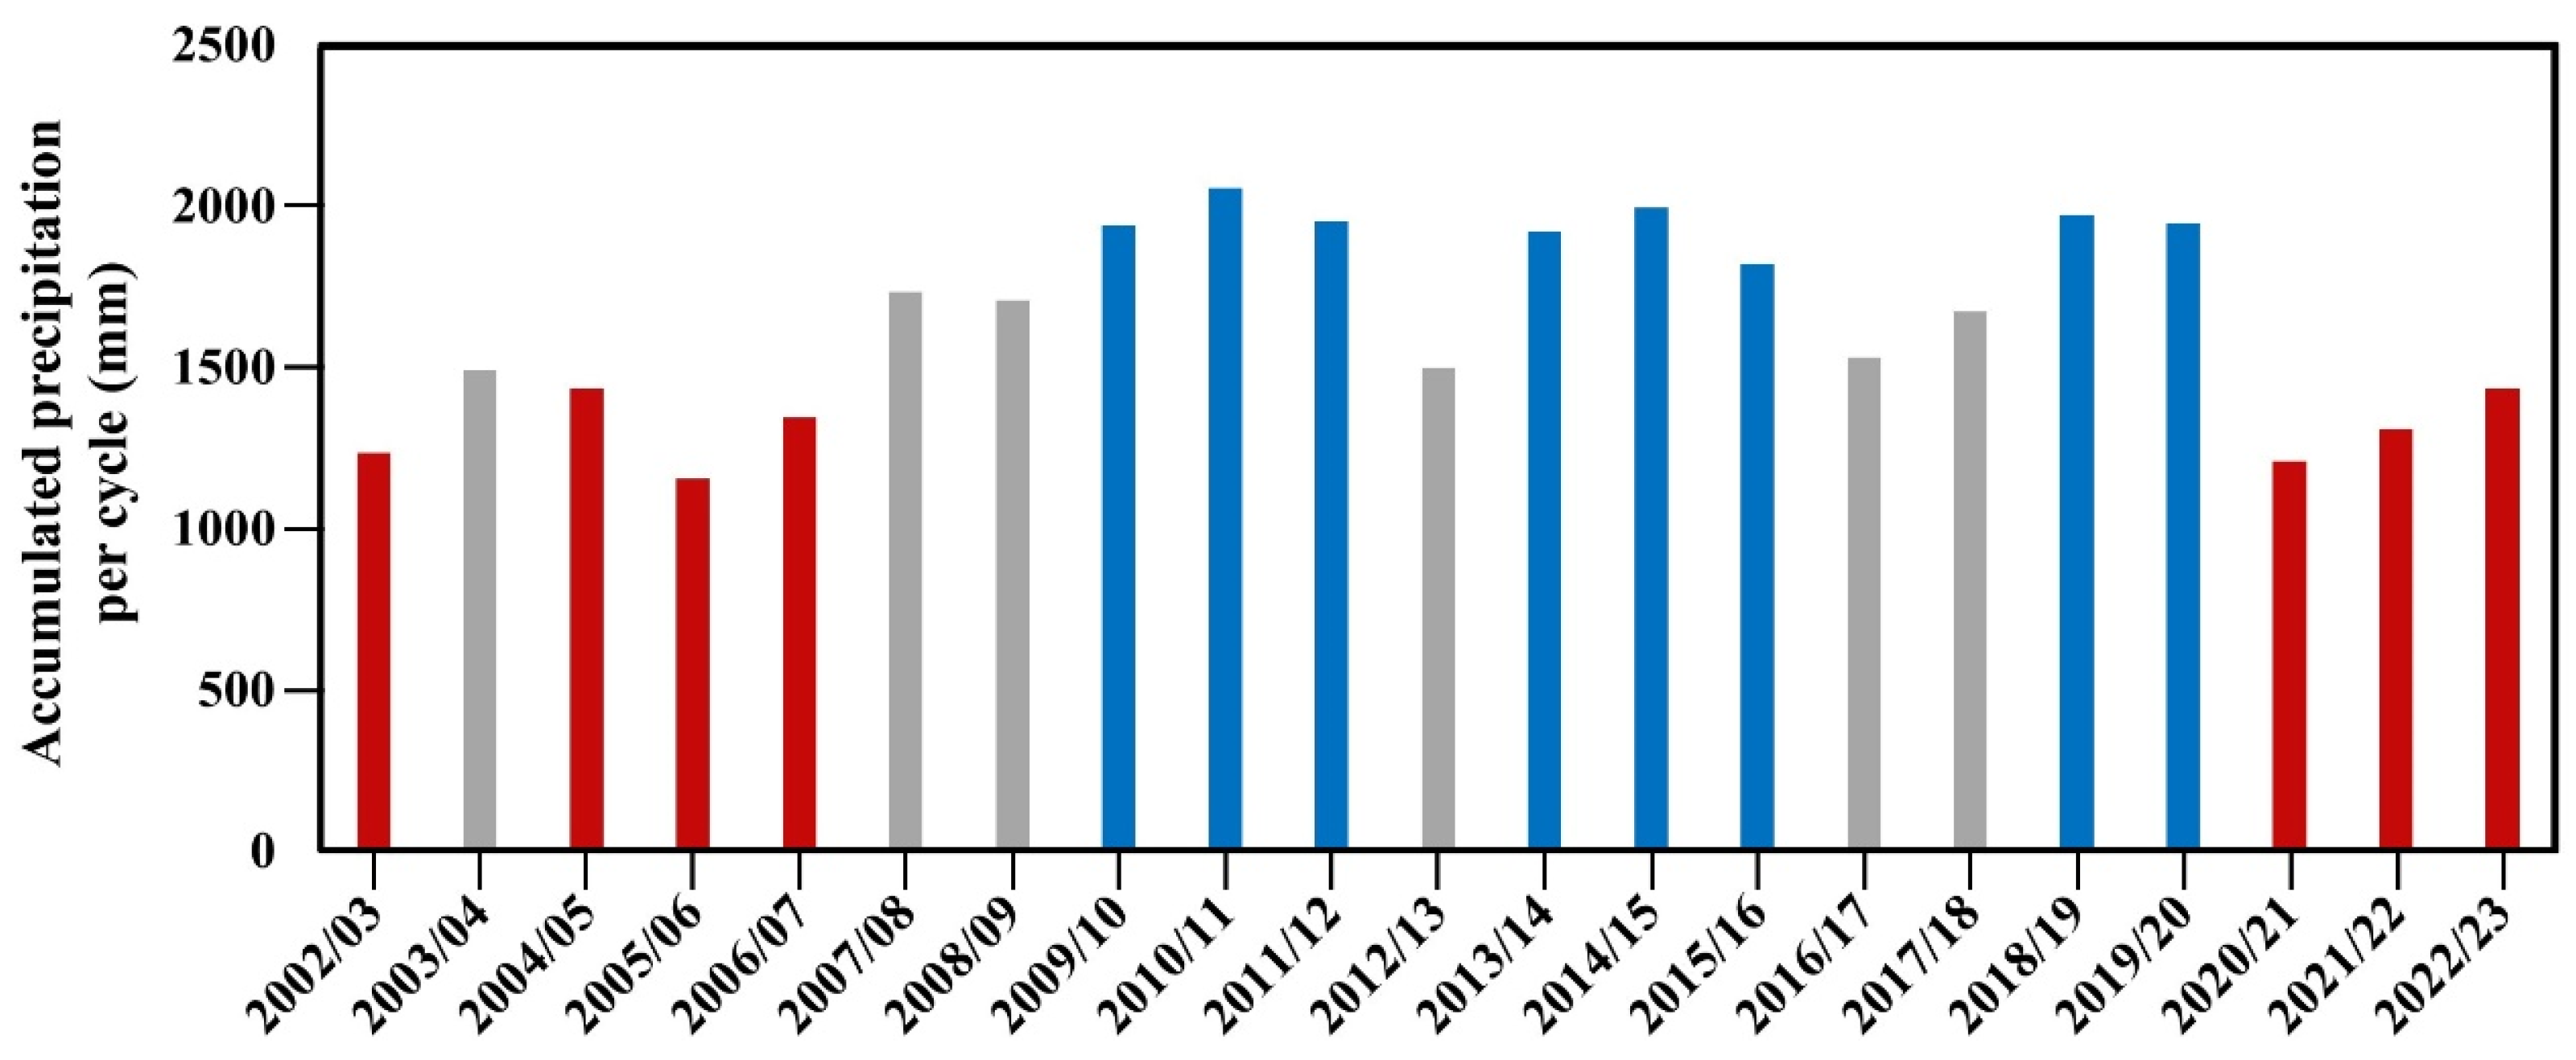
3.1. Identification of the Driest and Wettest Seasonal Cycles at the Park
3.2. Relationships Between Precipitation and NDVI-Derived LSP Metrics from the MOD13Q1 Product
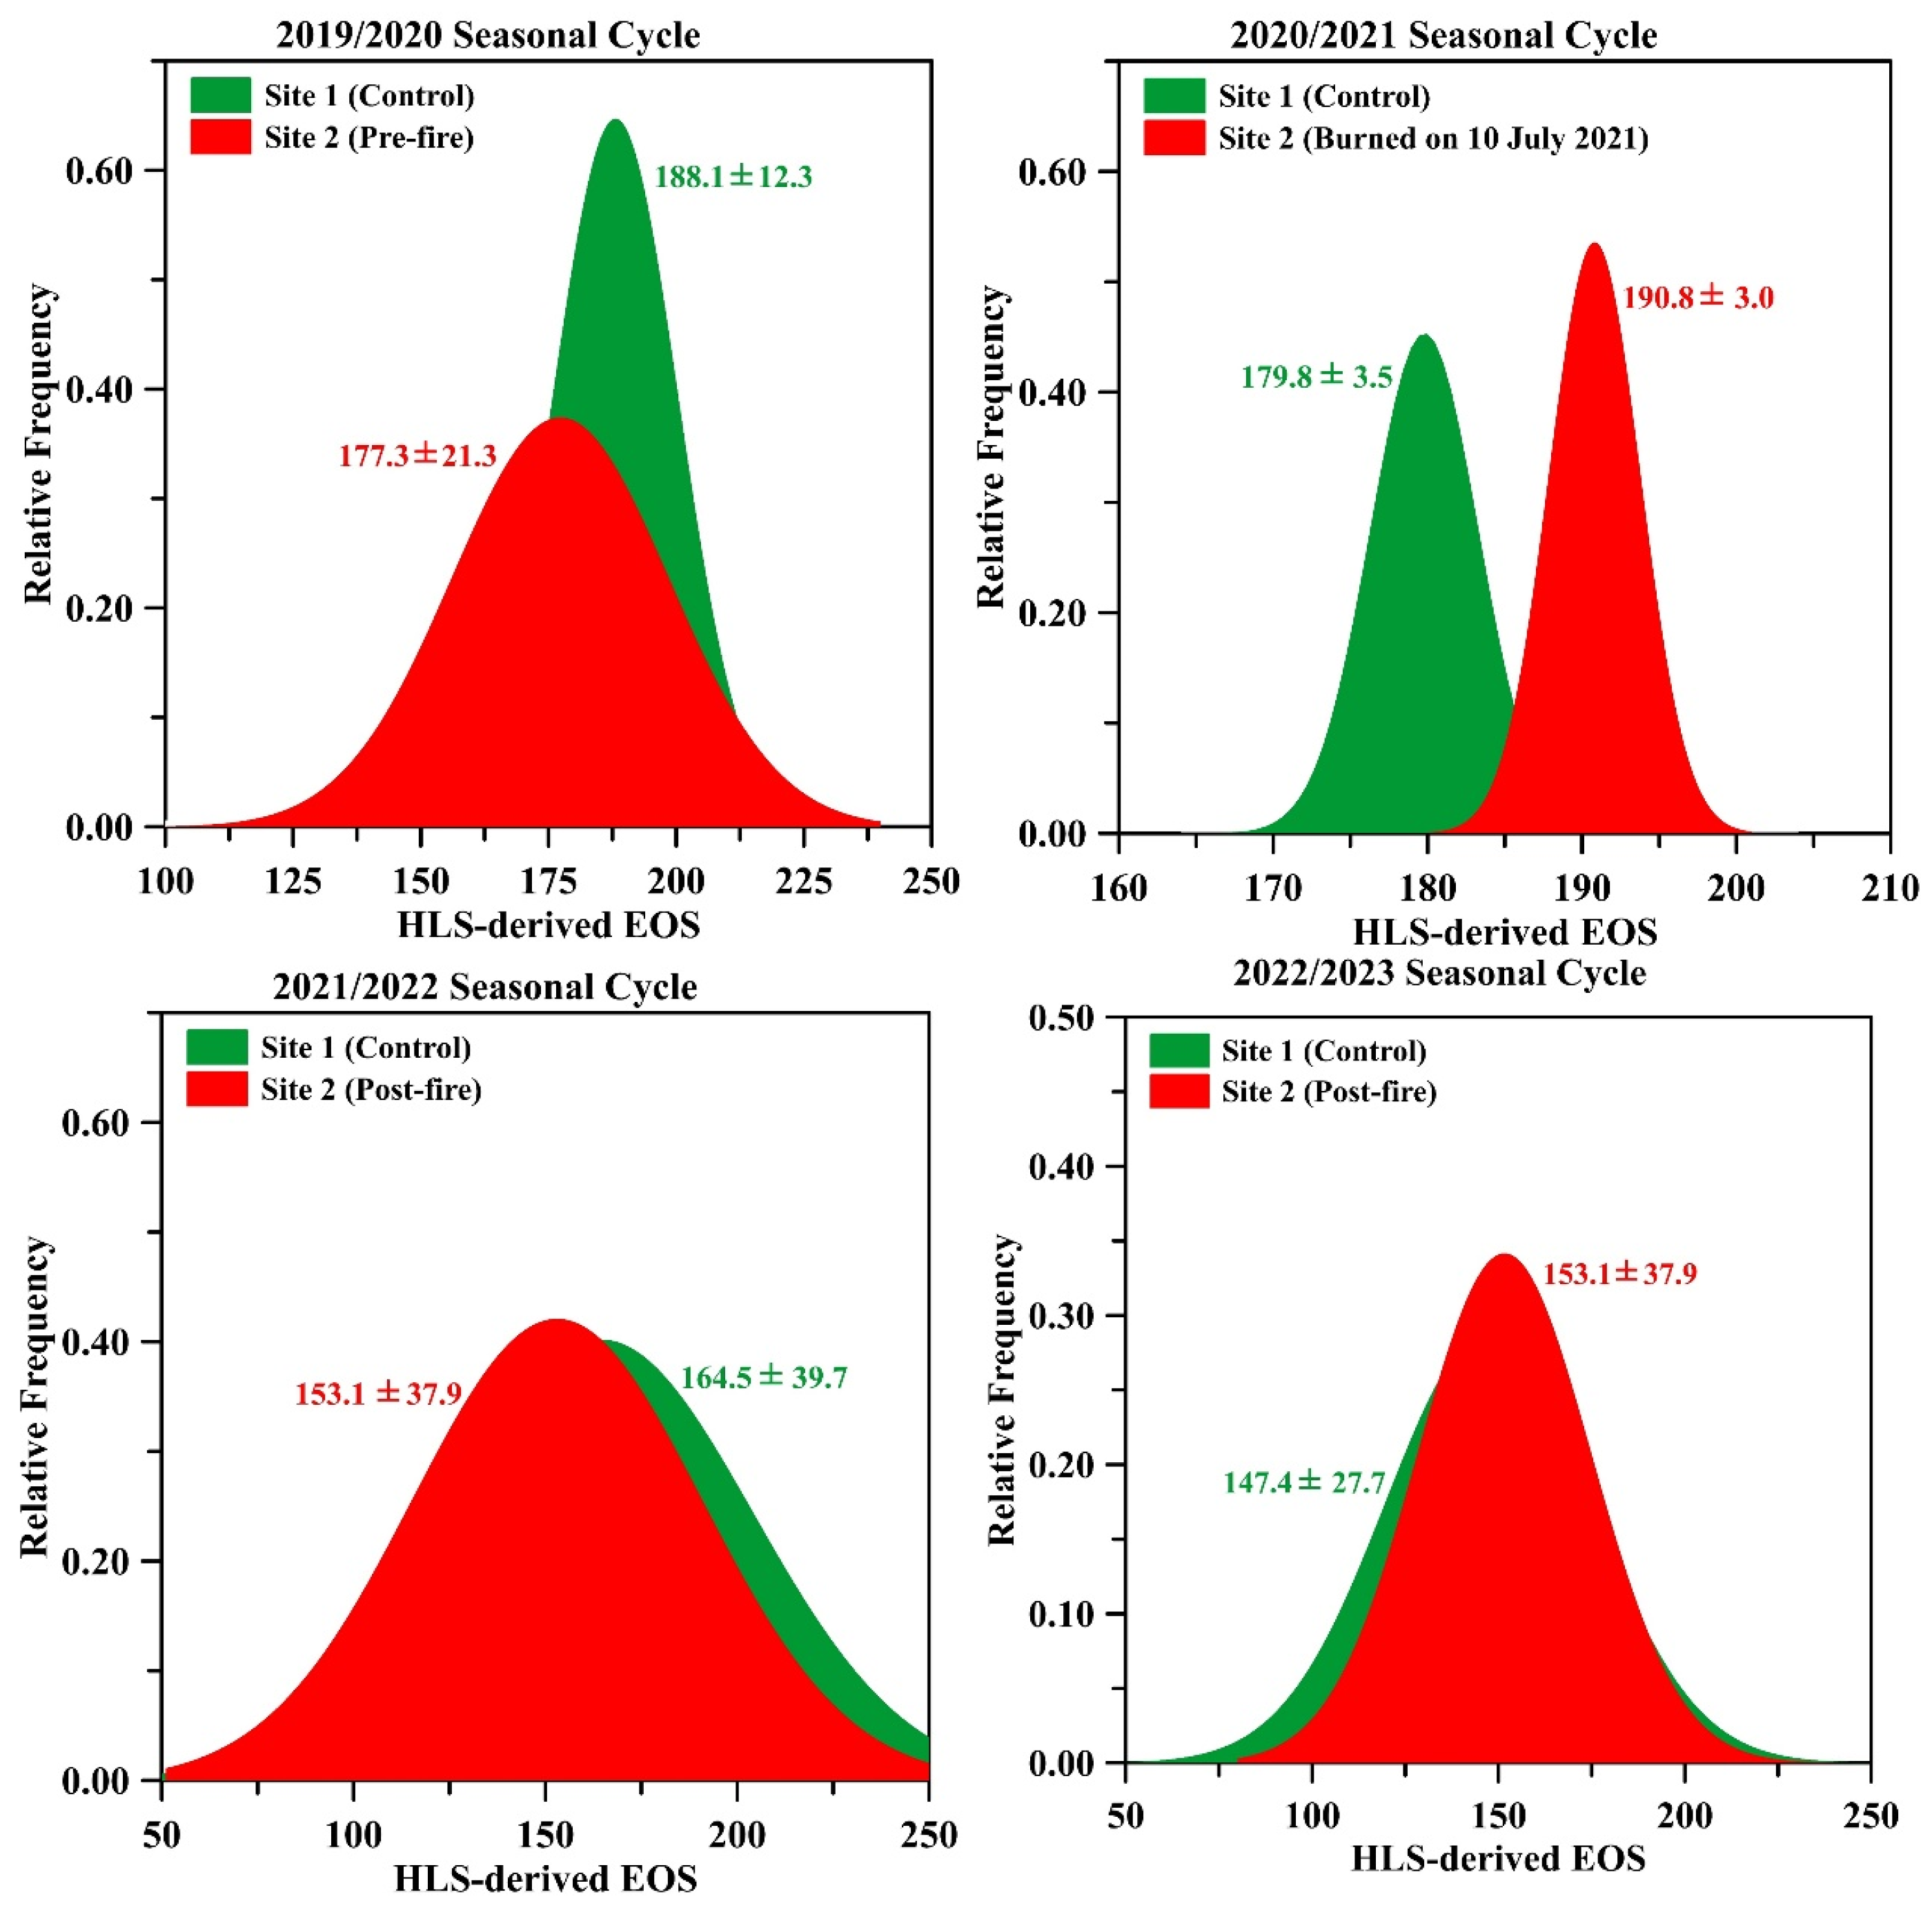
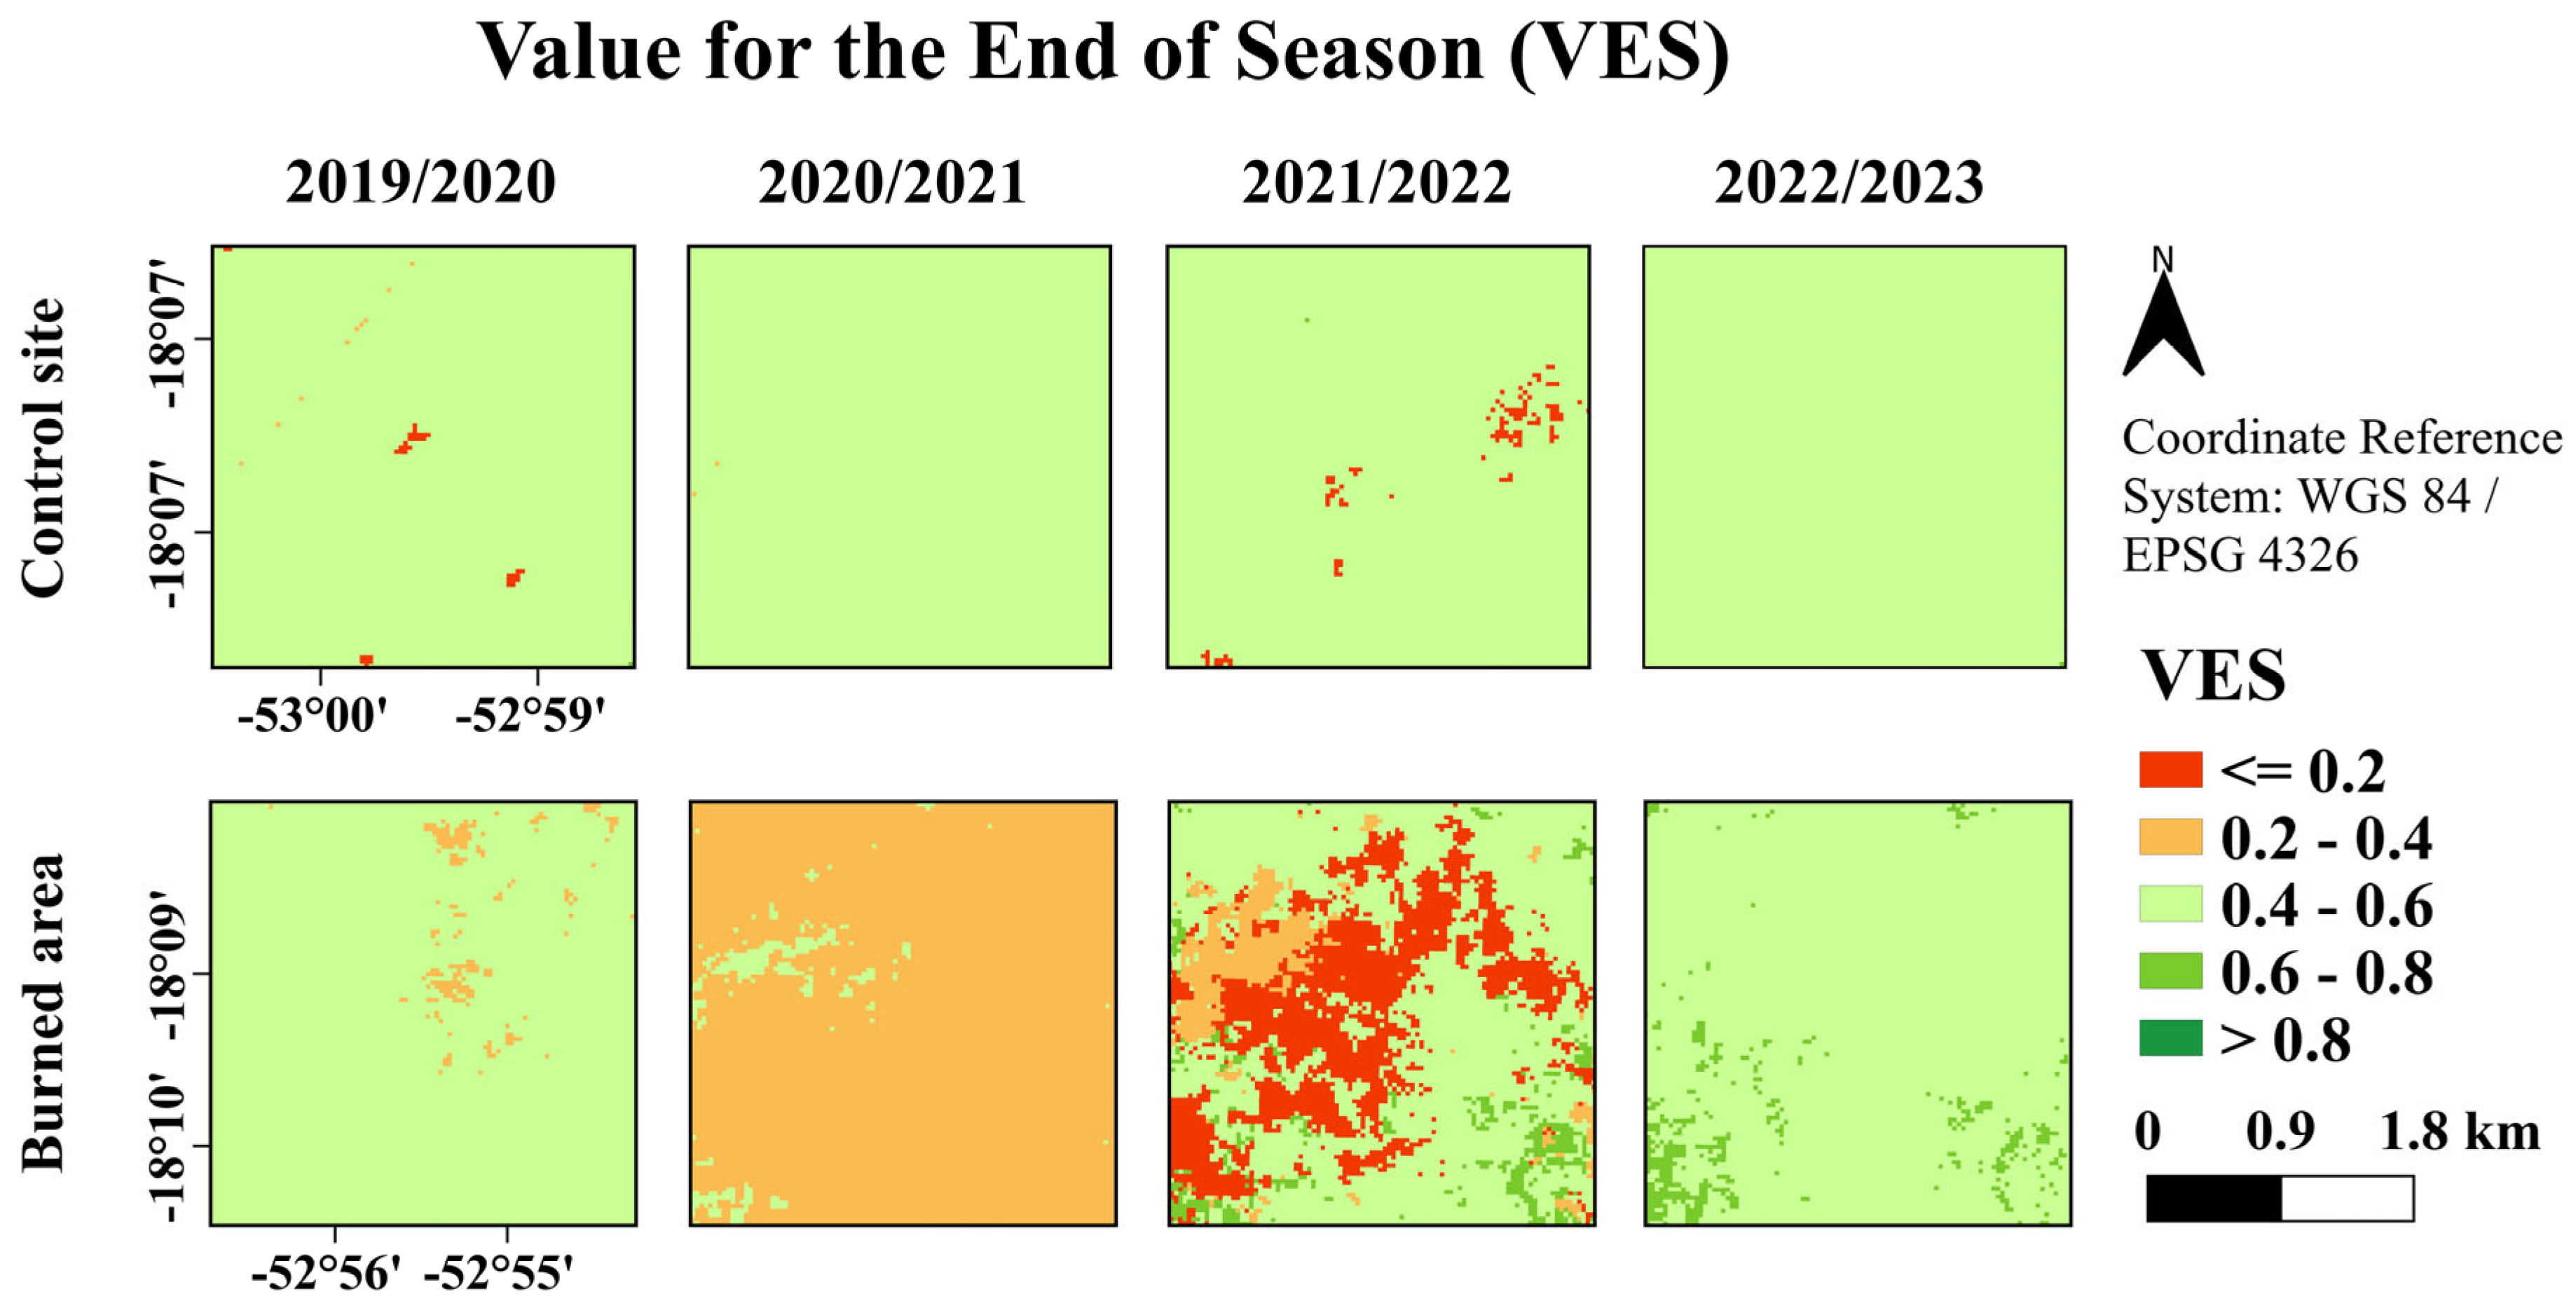
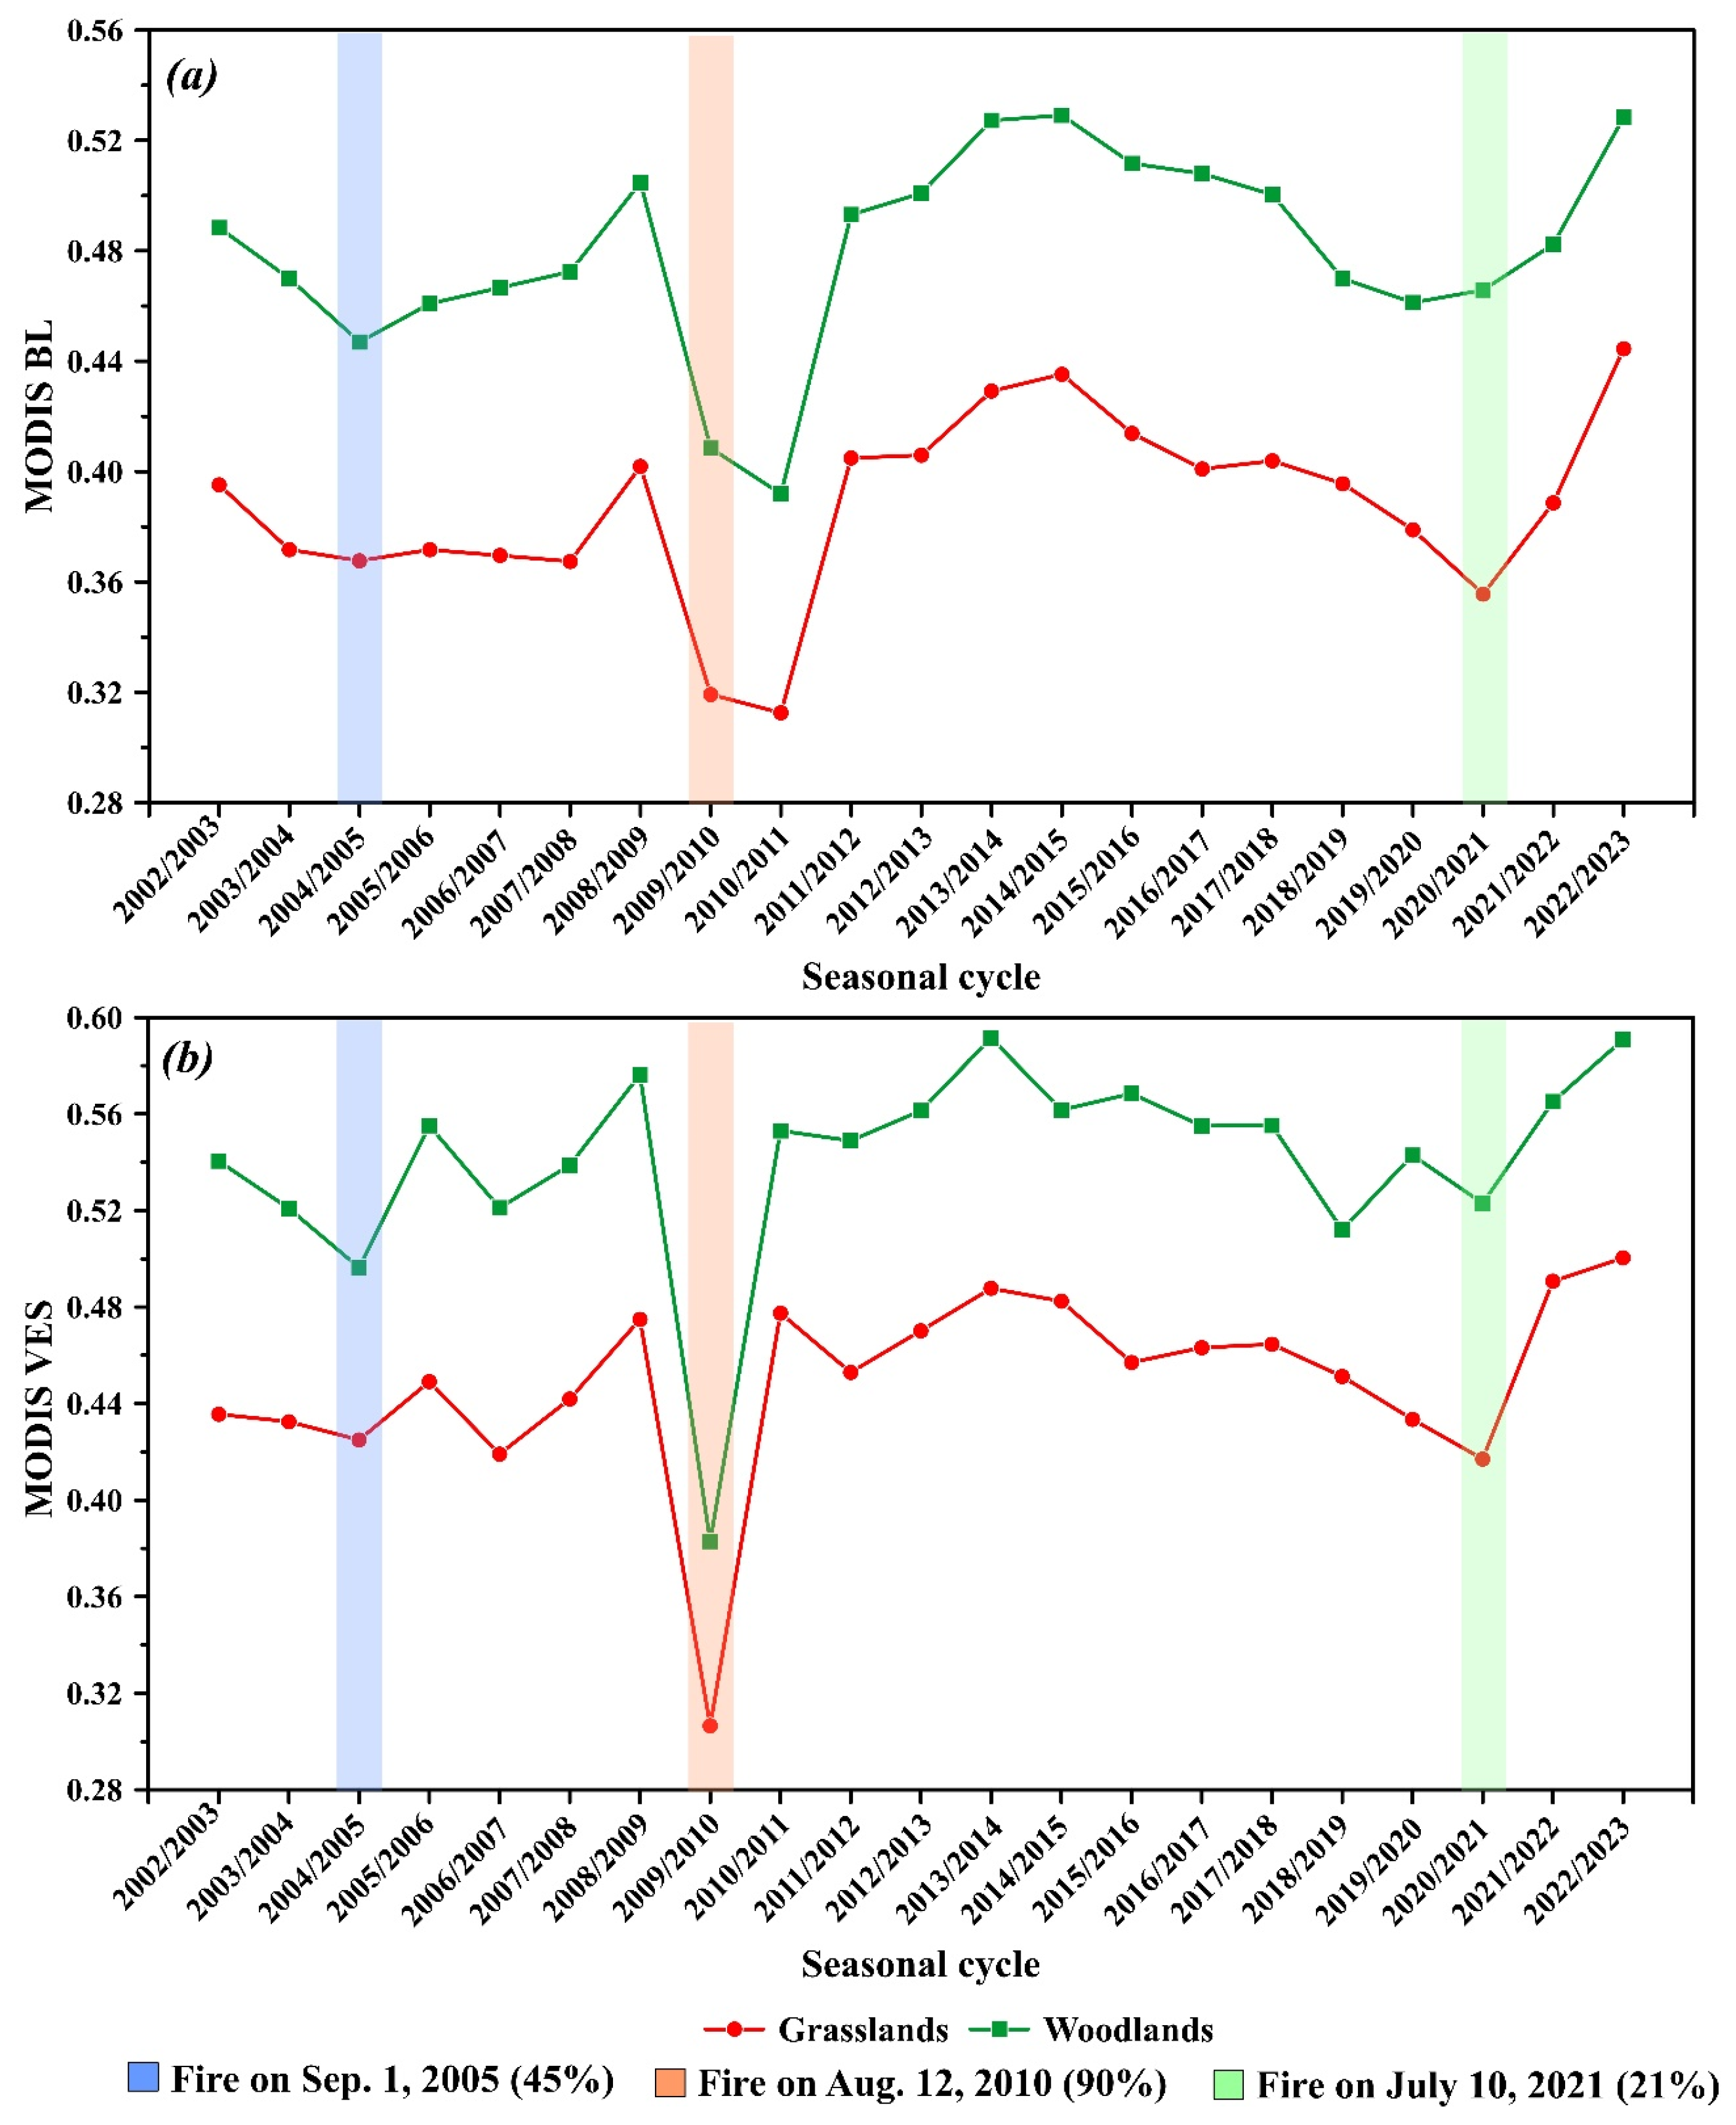
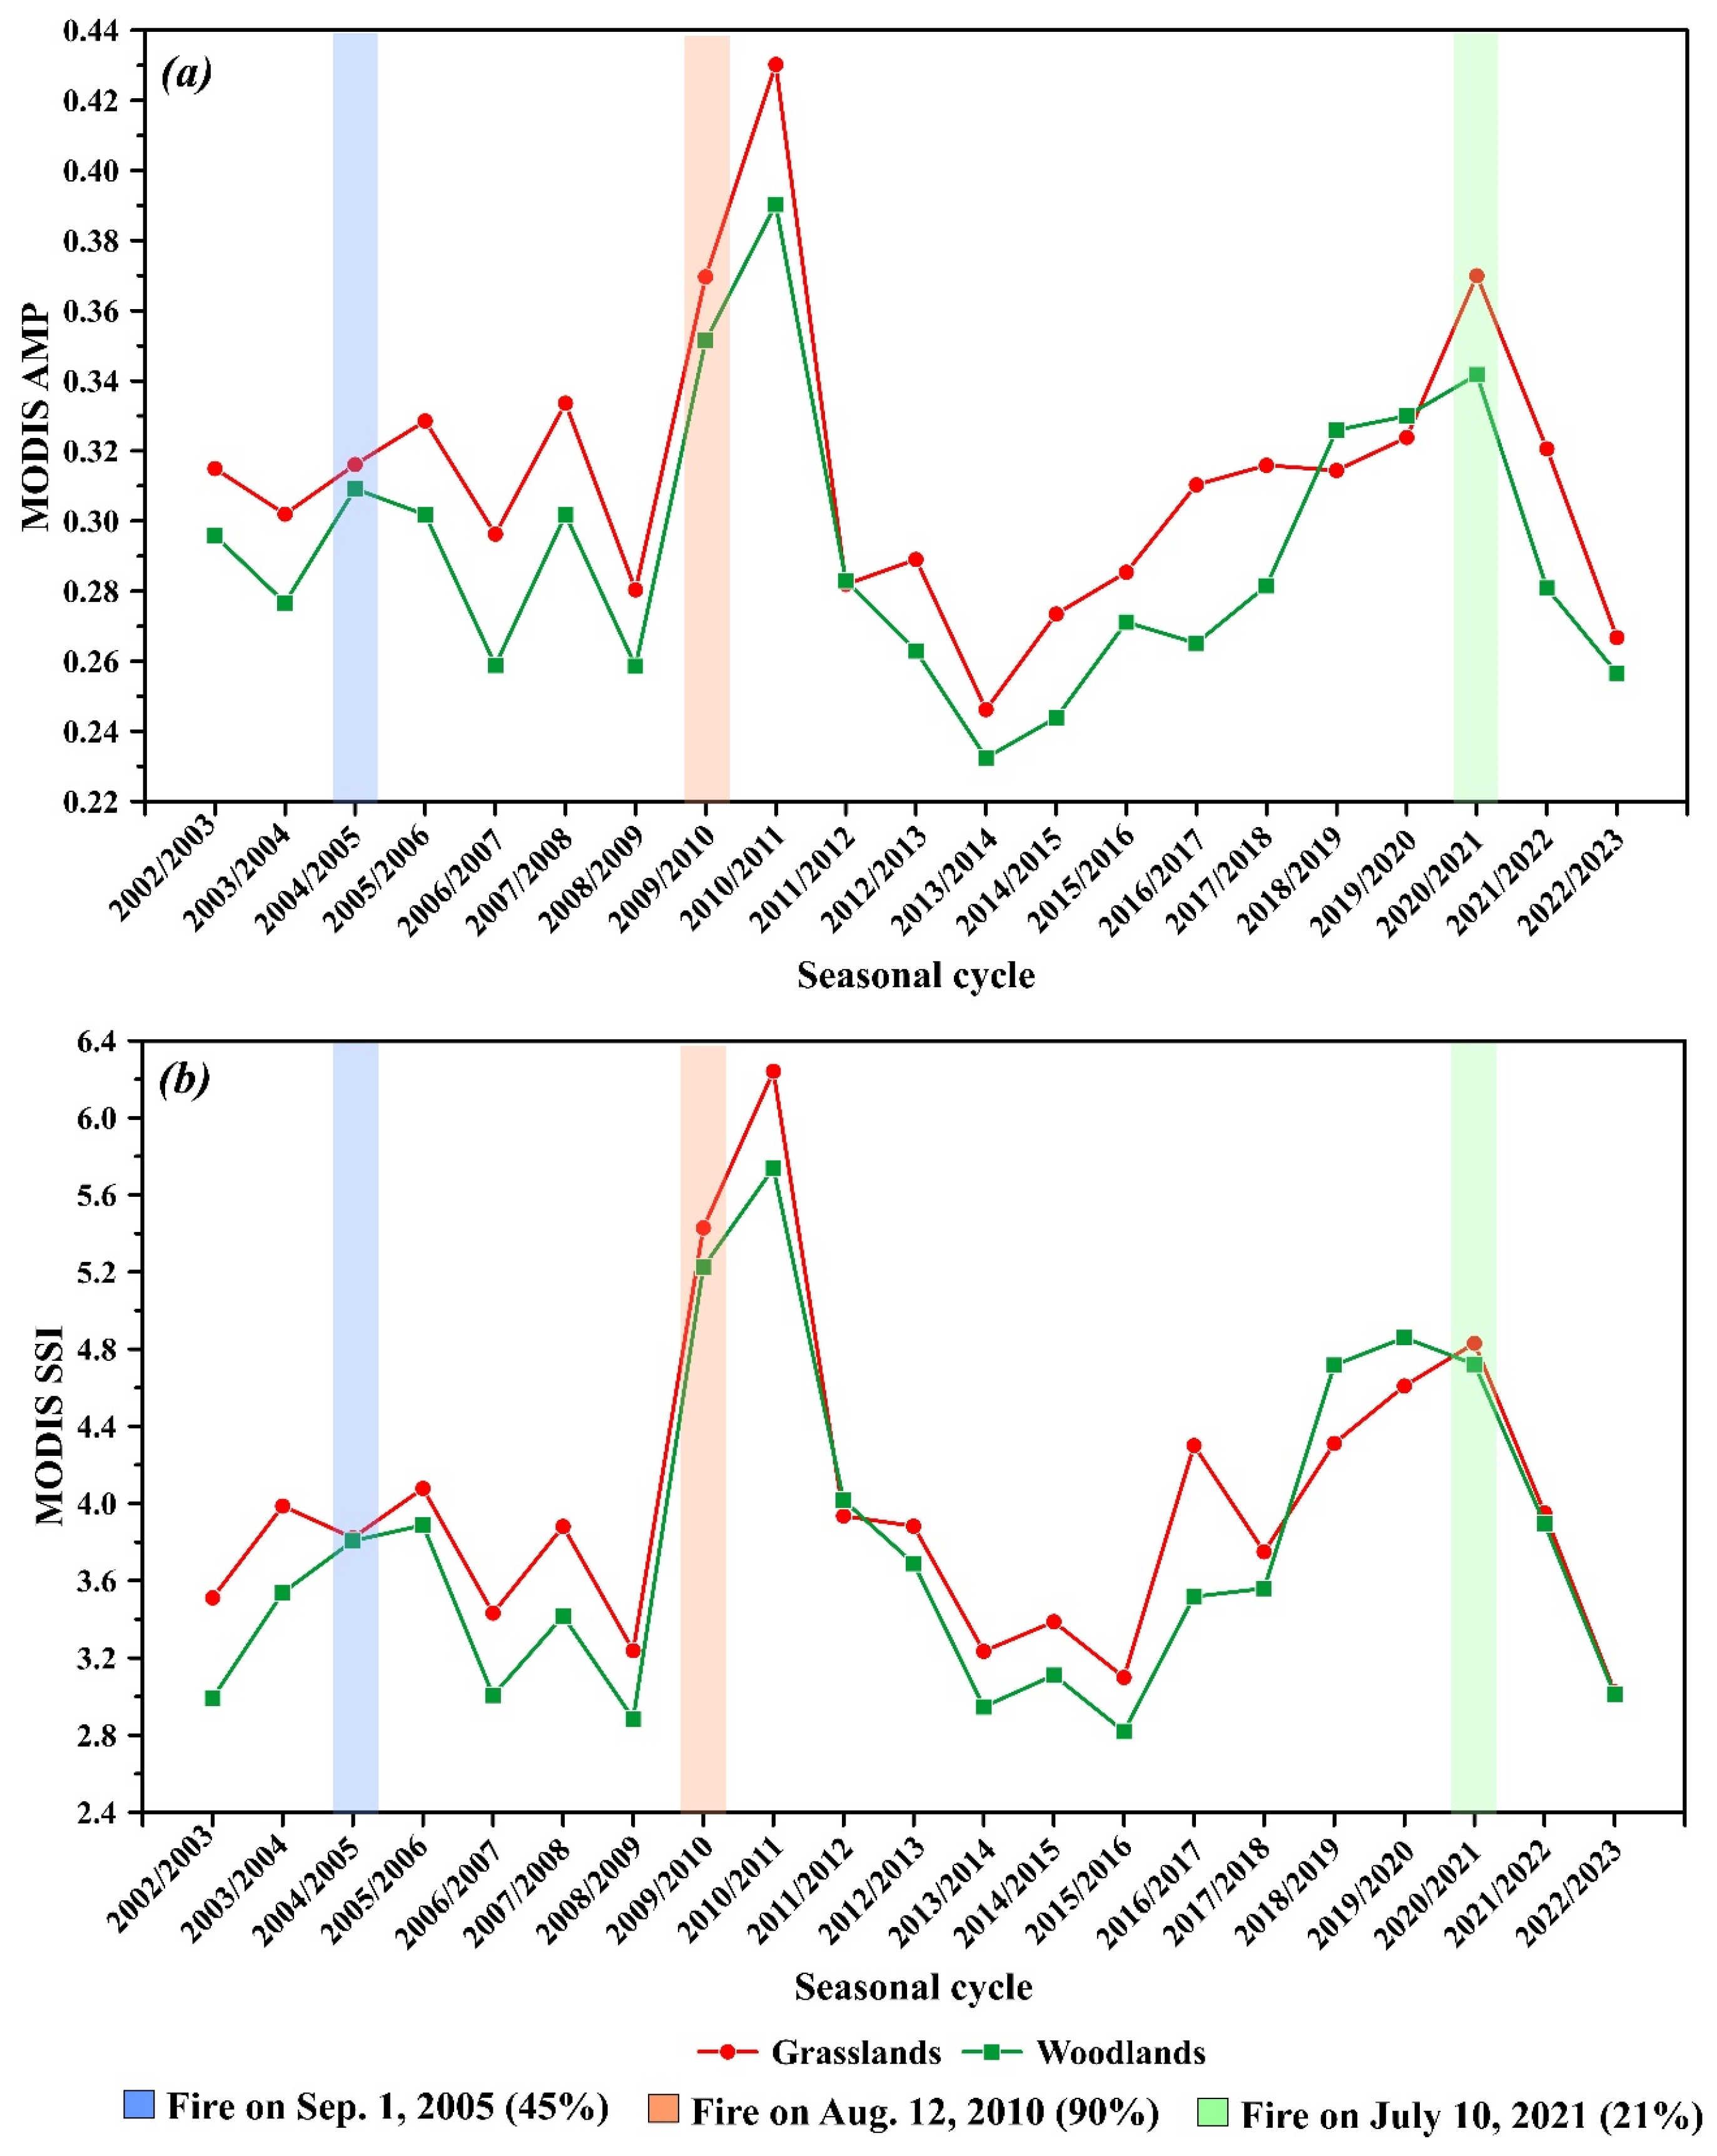
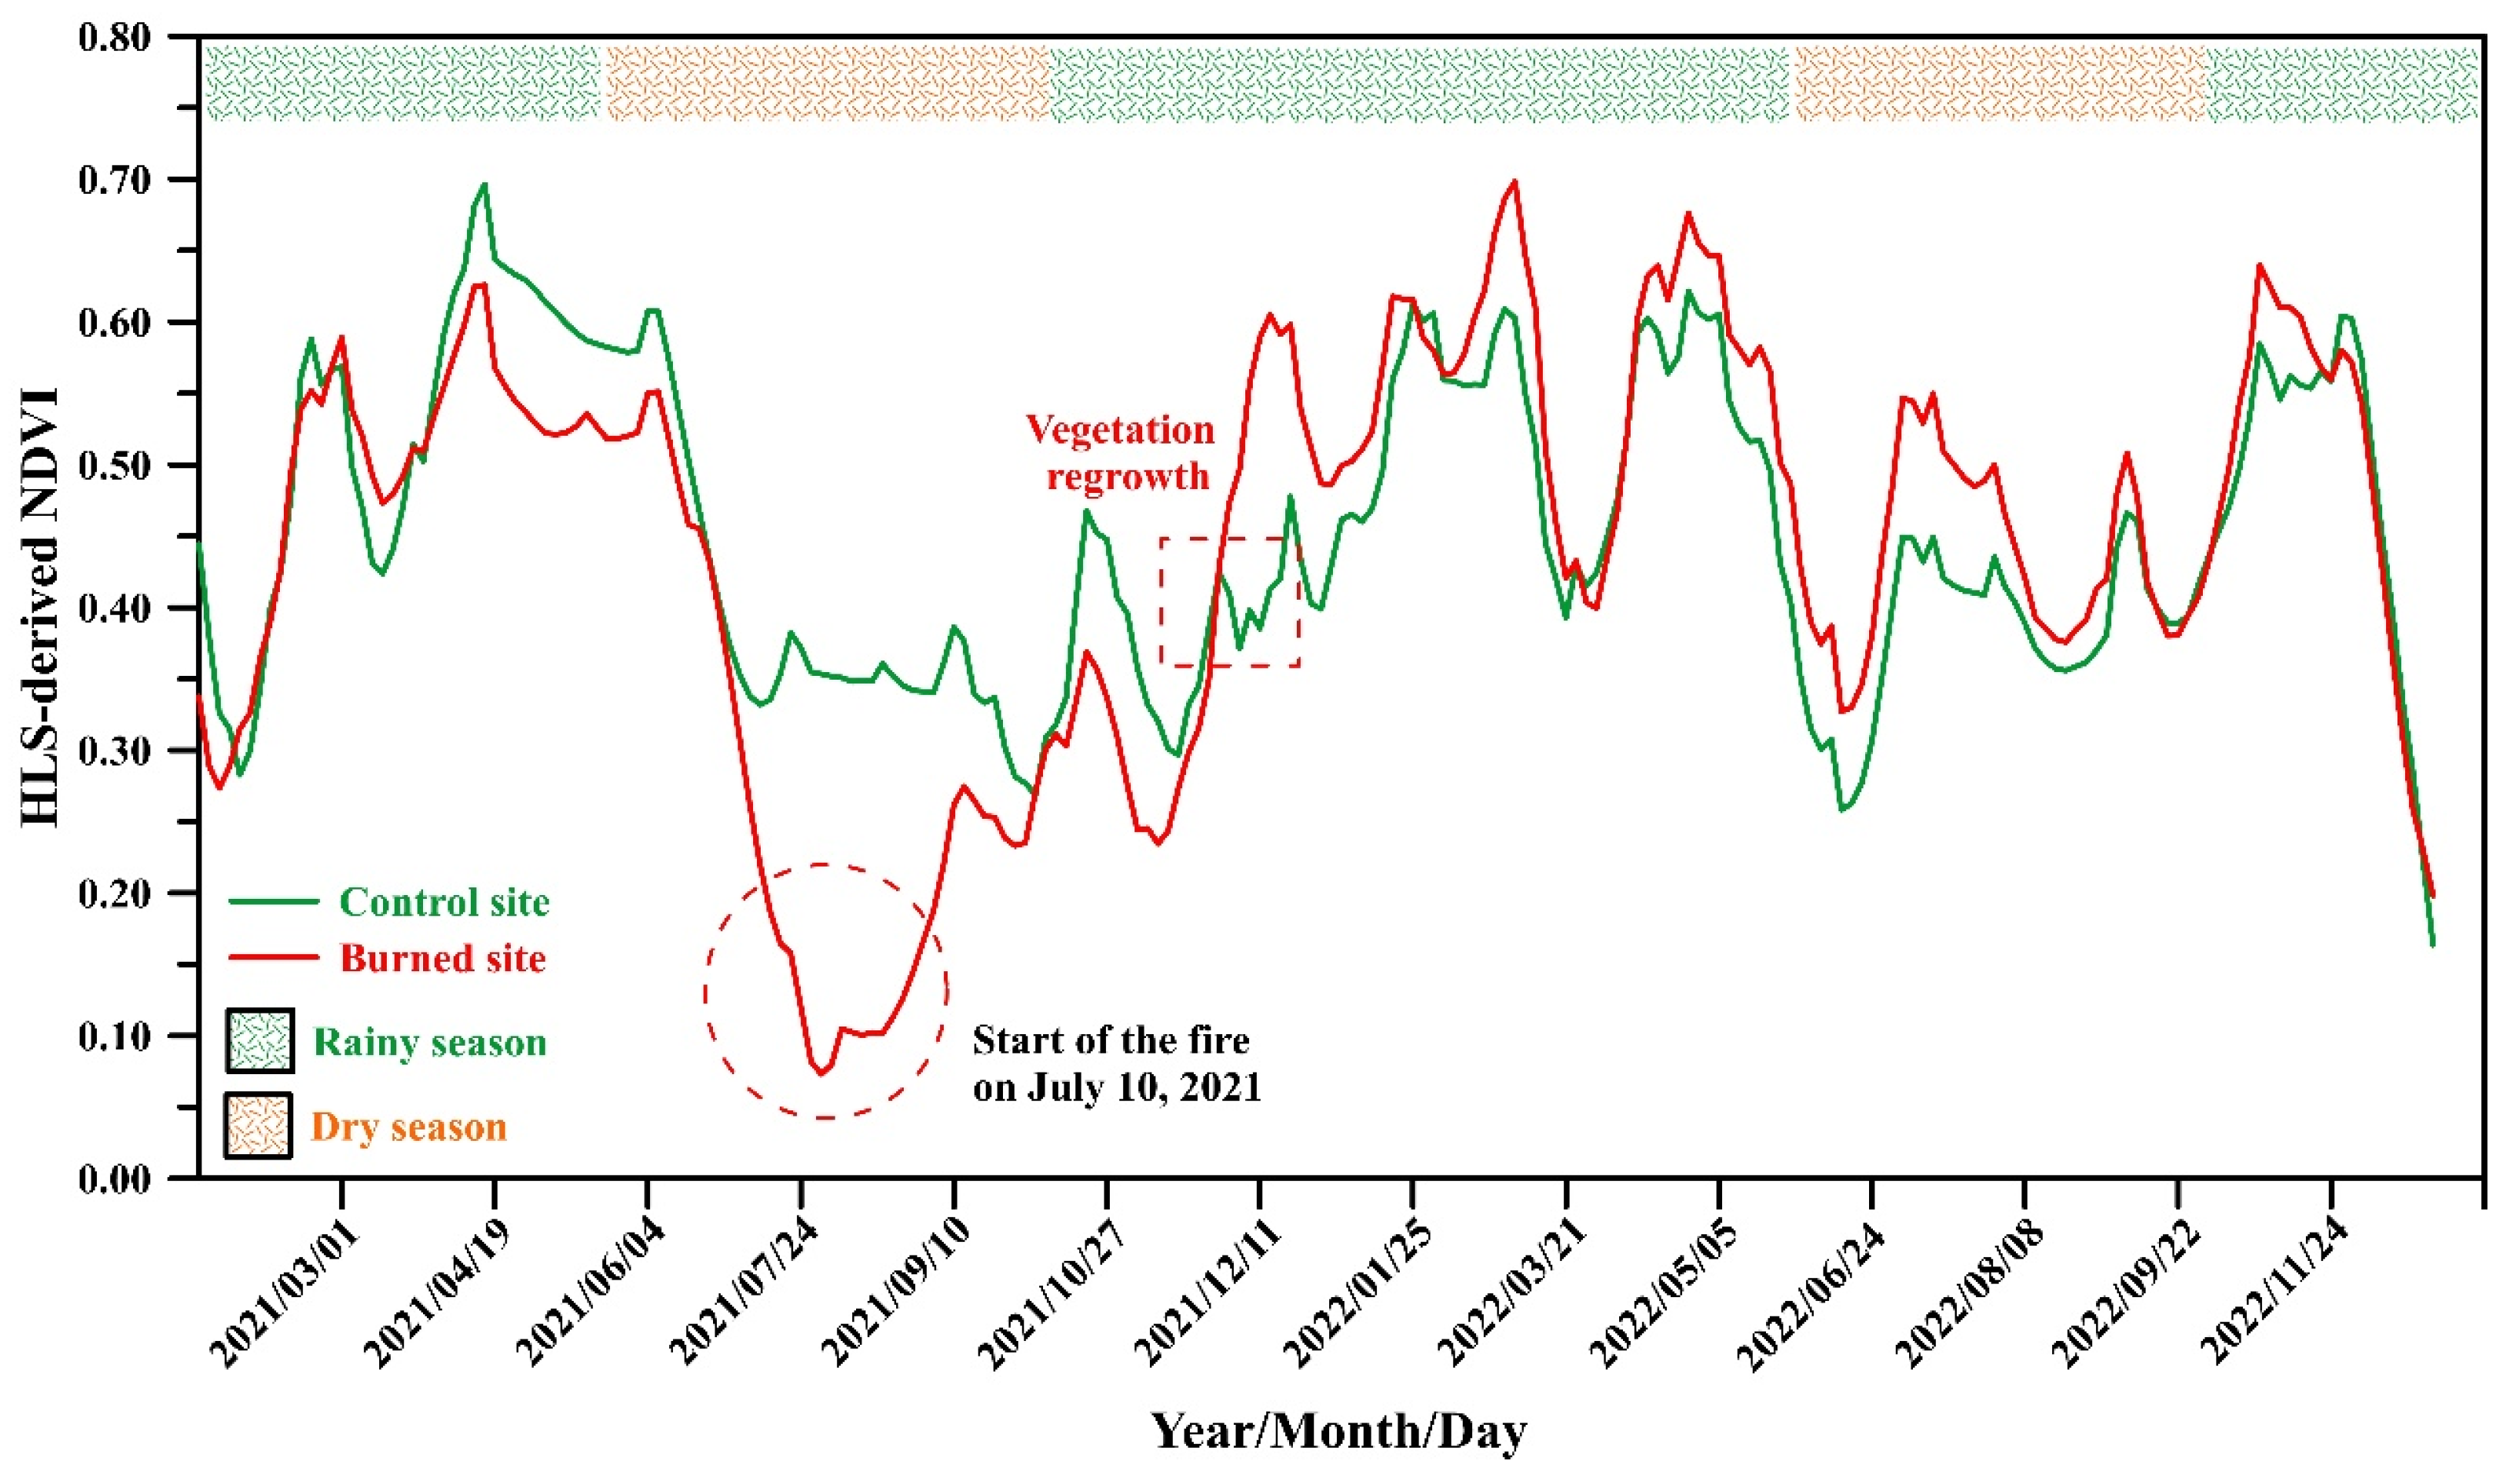
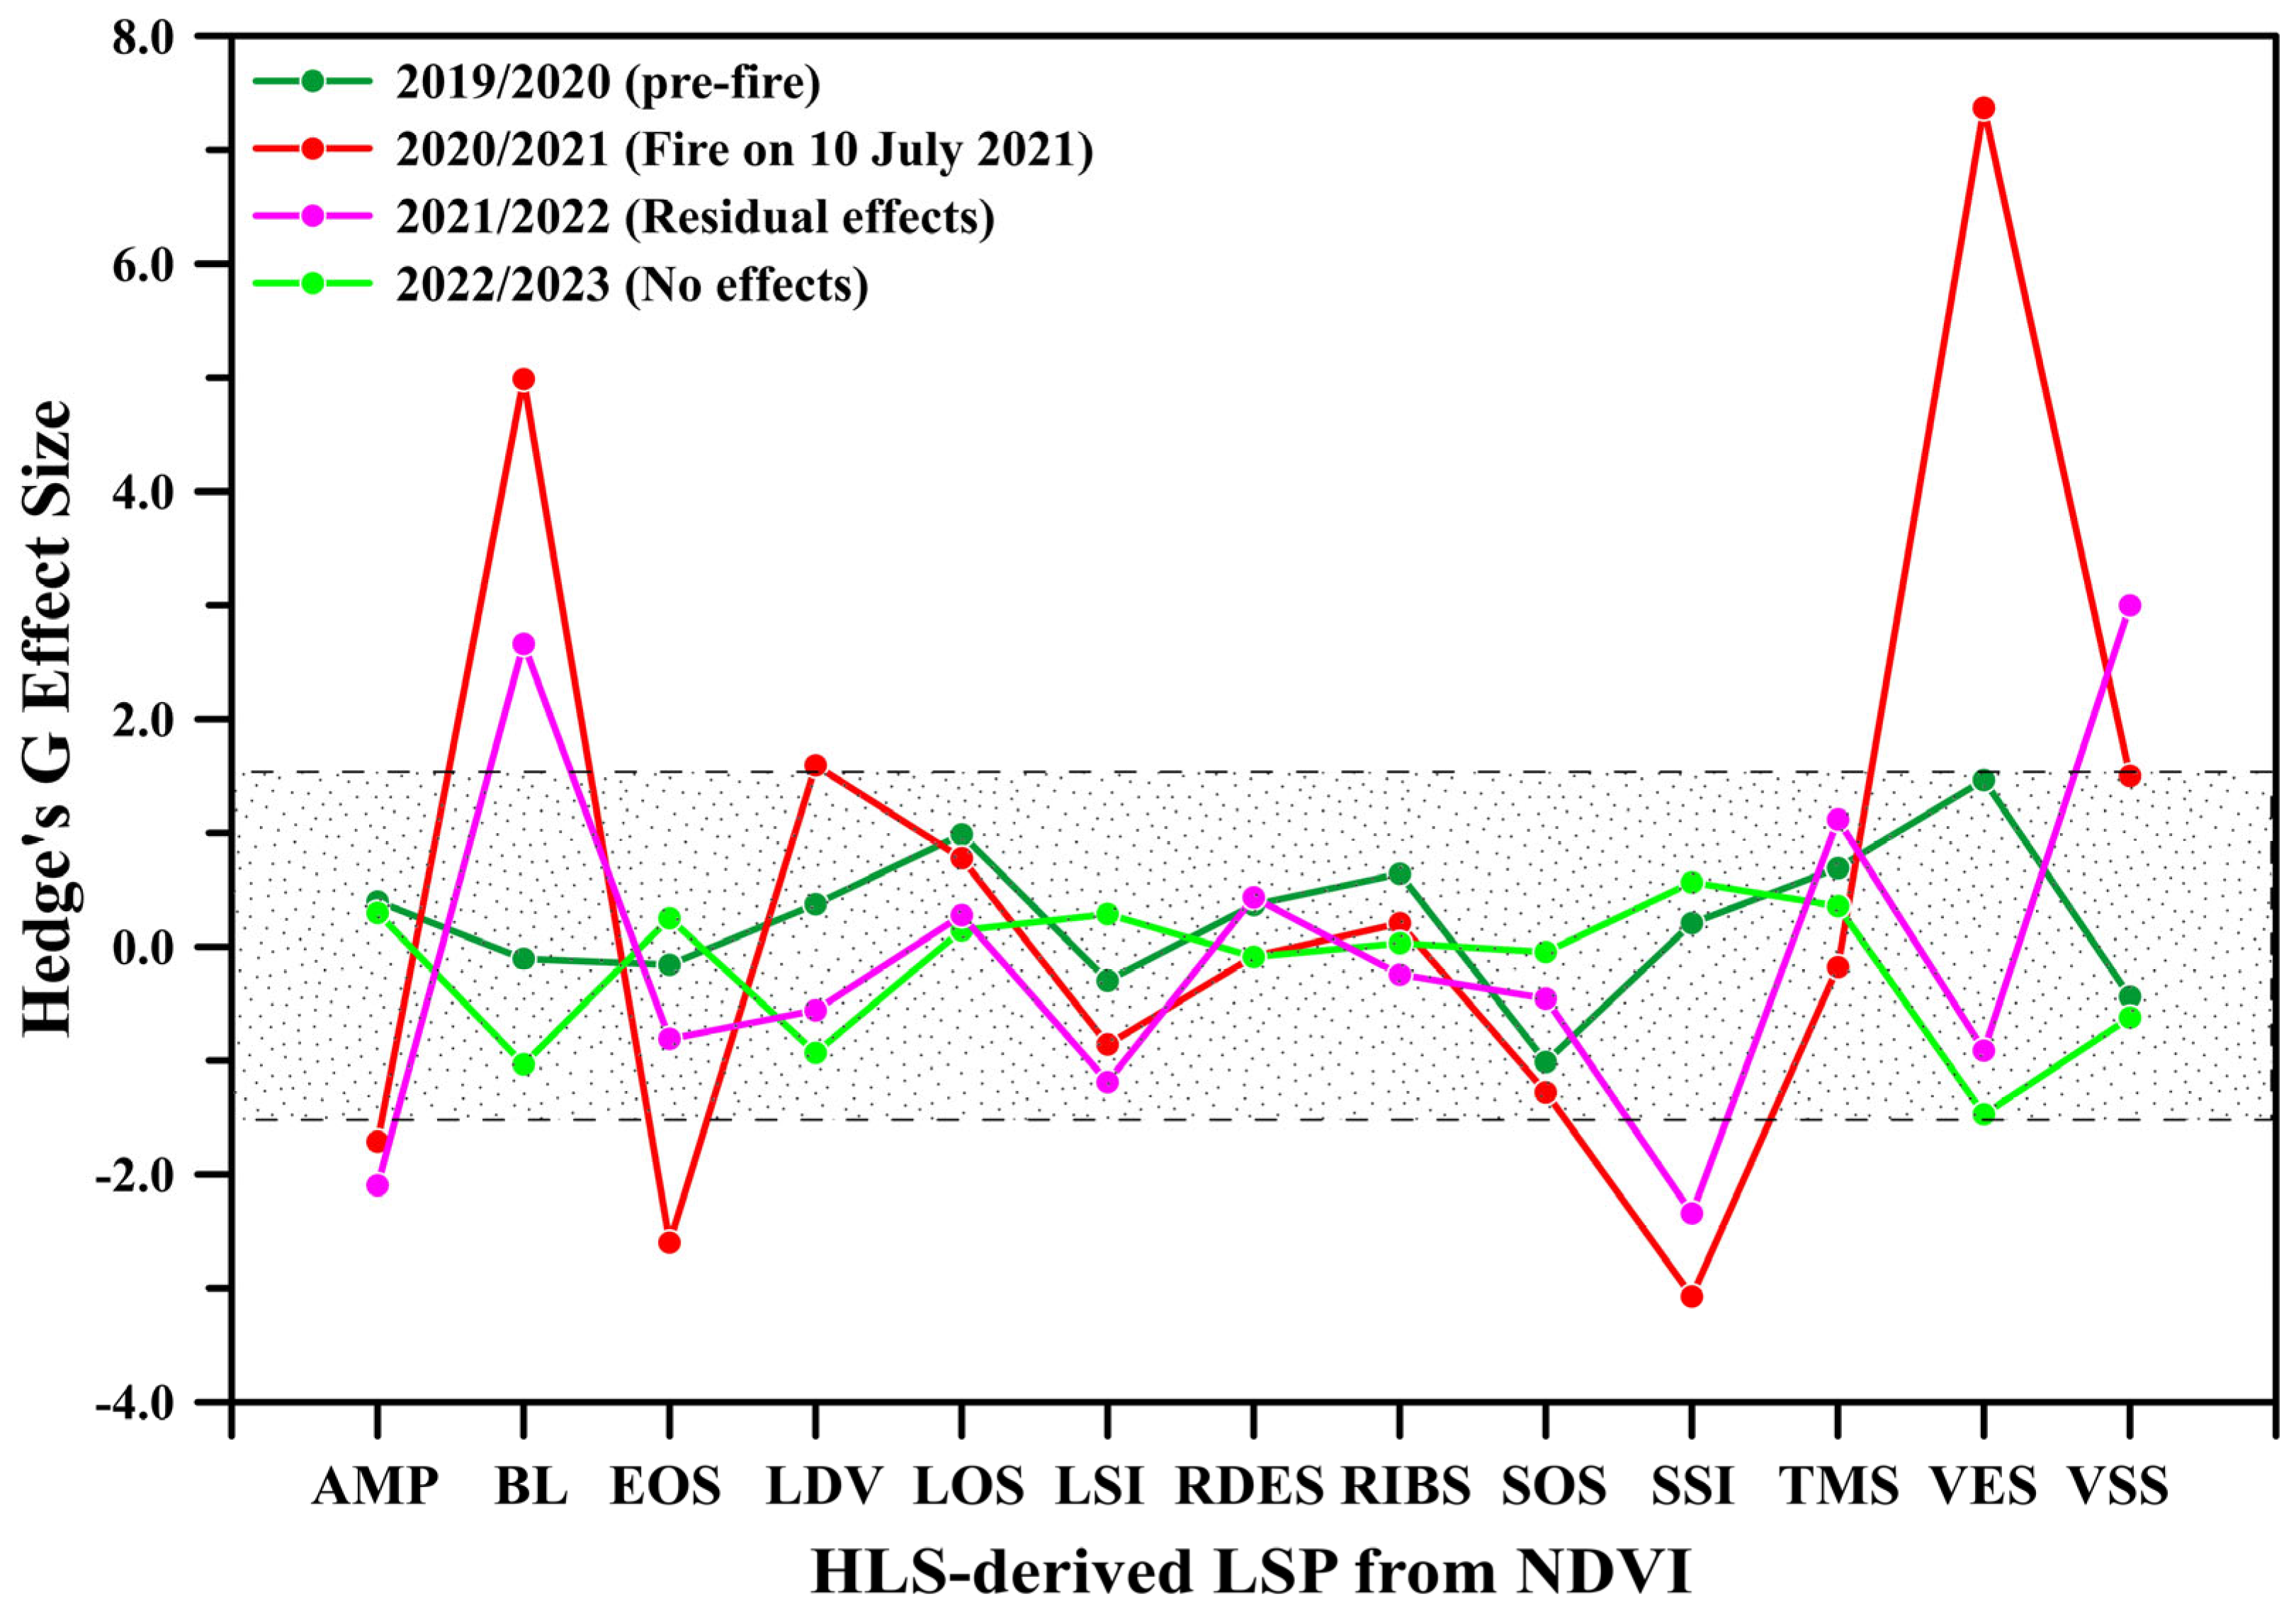
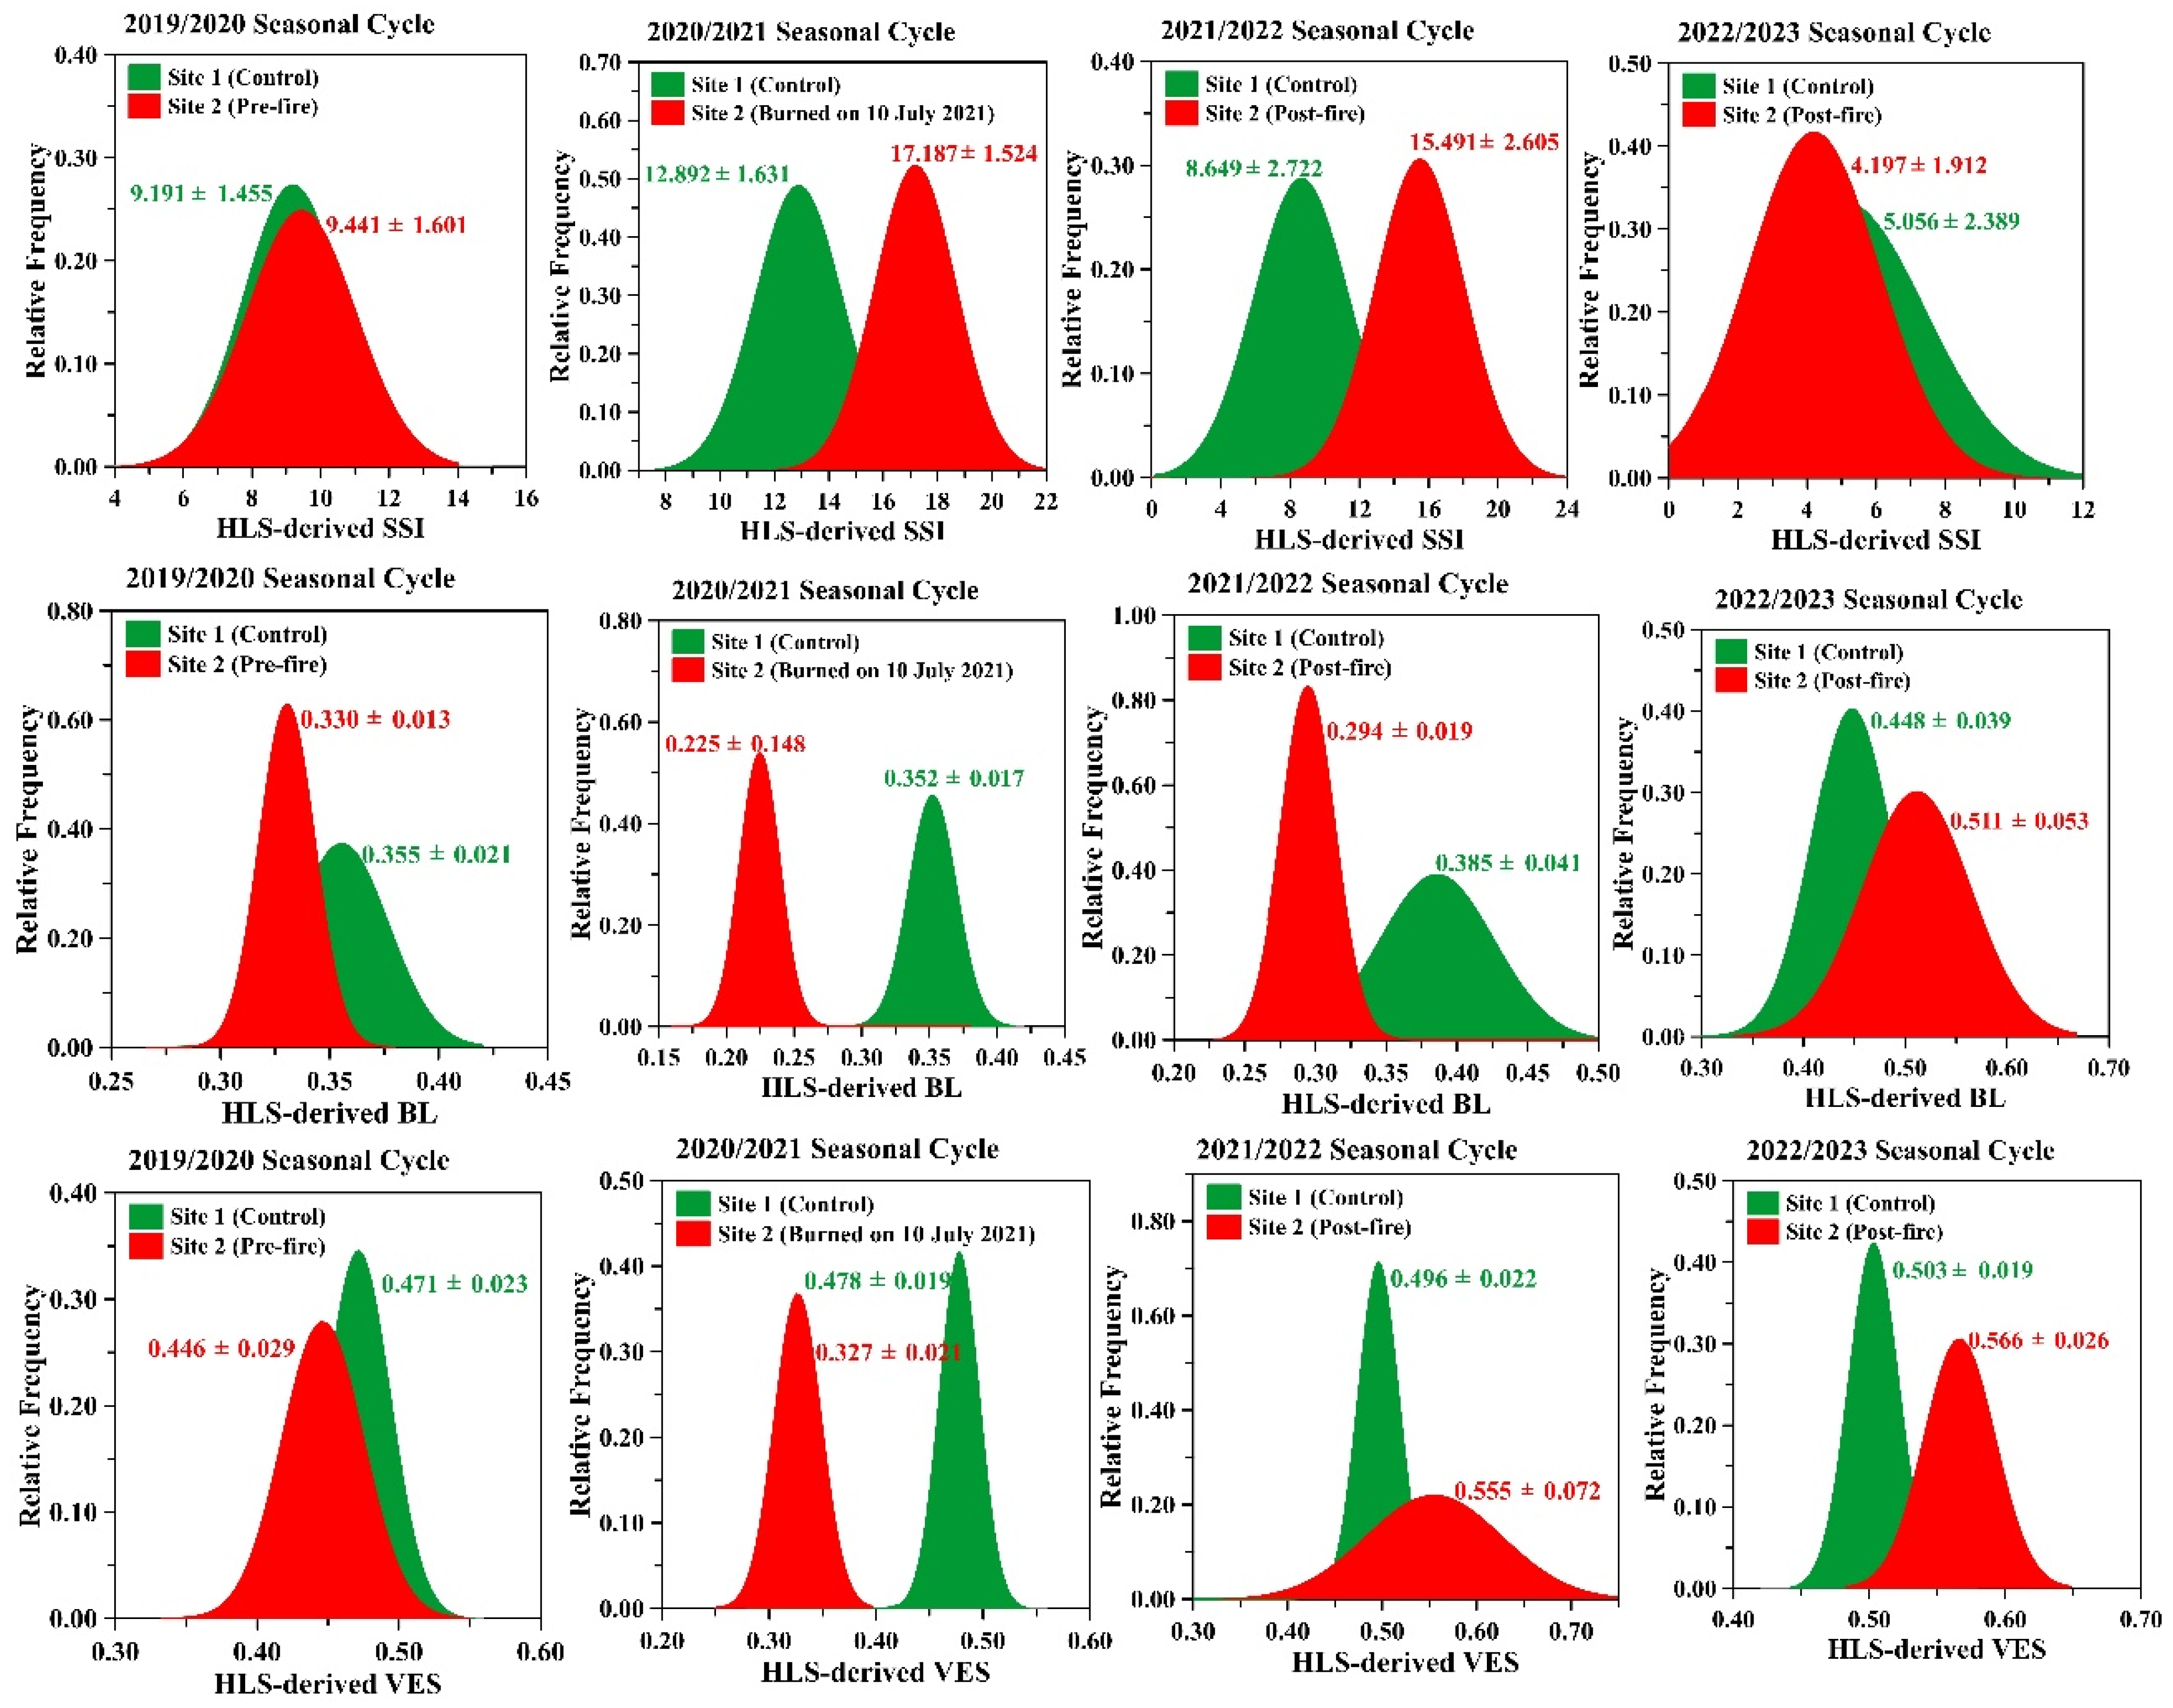
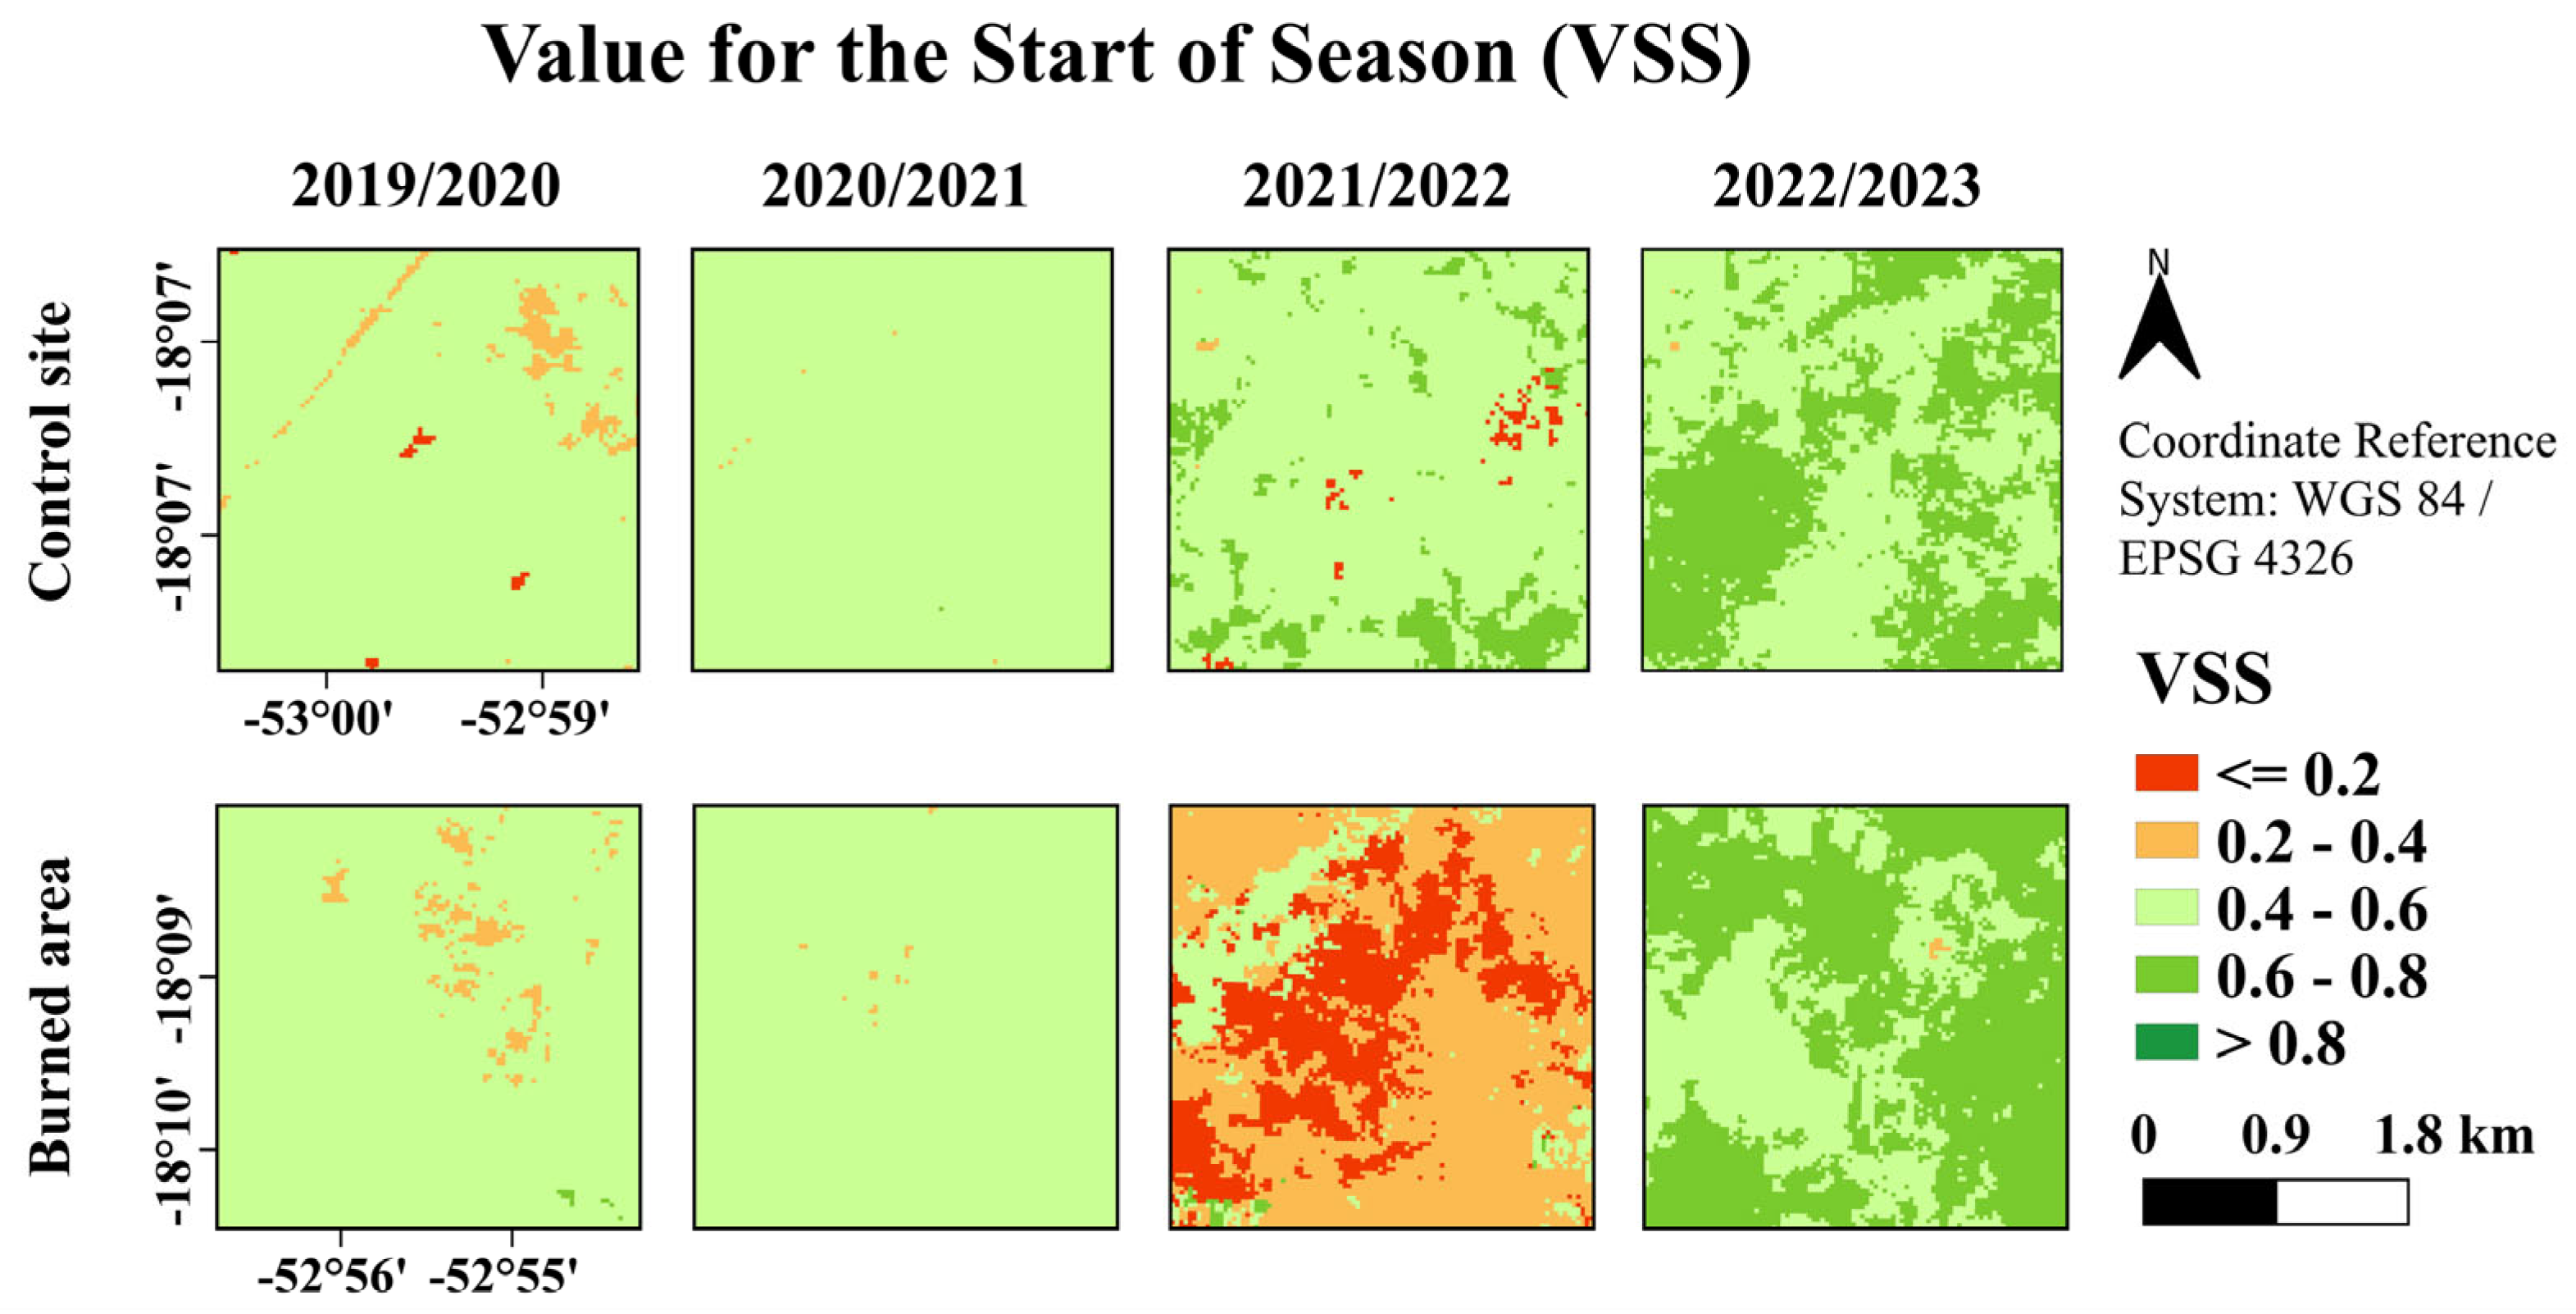
3.3. Pre- and Post-Fire Behavior of NDVI-Derived LSP Metrics from the MOD13Q1 and HLS Products
4. Discussion
5. Conclusions
Author Contributions
Funding
Data Availability Statement
Acknowledgments
Conflicts of Interest
Appendix A


| Vegetation Phenological Metric | Precipitation (Dry Versus Wet Cycle) MOD13Q1 Product | Fire (Burned Versus Non-Burned) HLS Product |
|---|---|---|
| AMP | −0.402 | −2.096 |
| EOS | −0.037 | −2.599 |
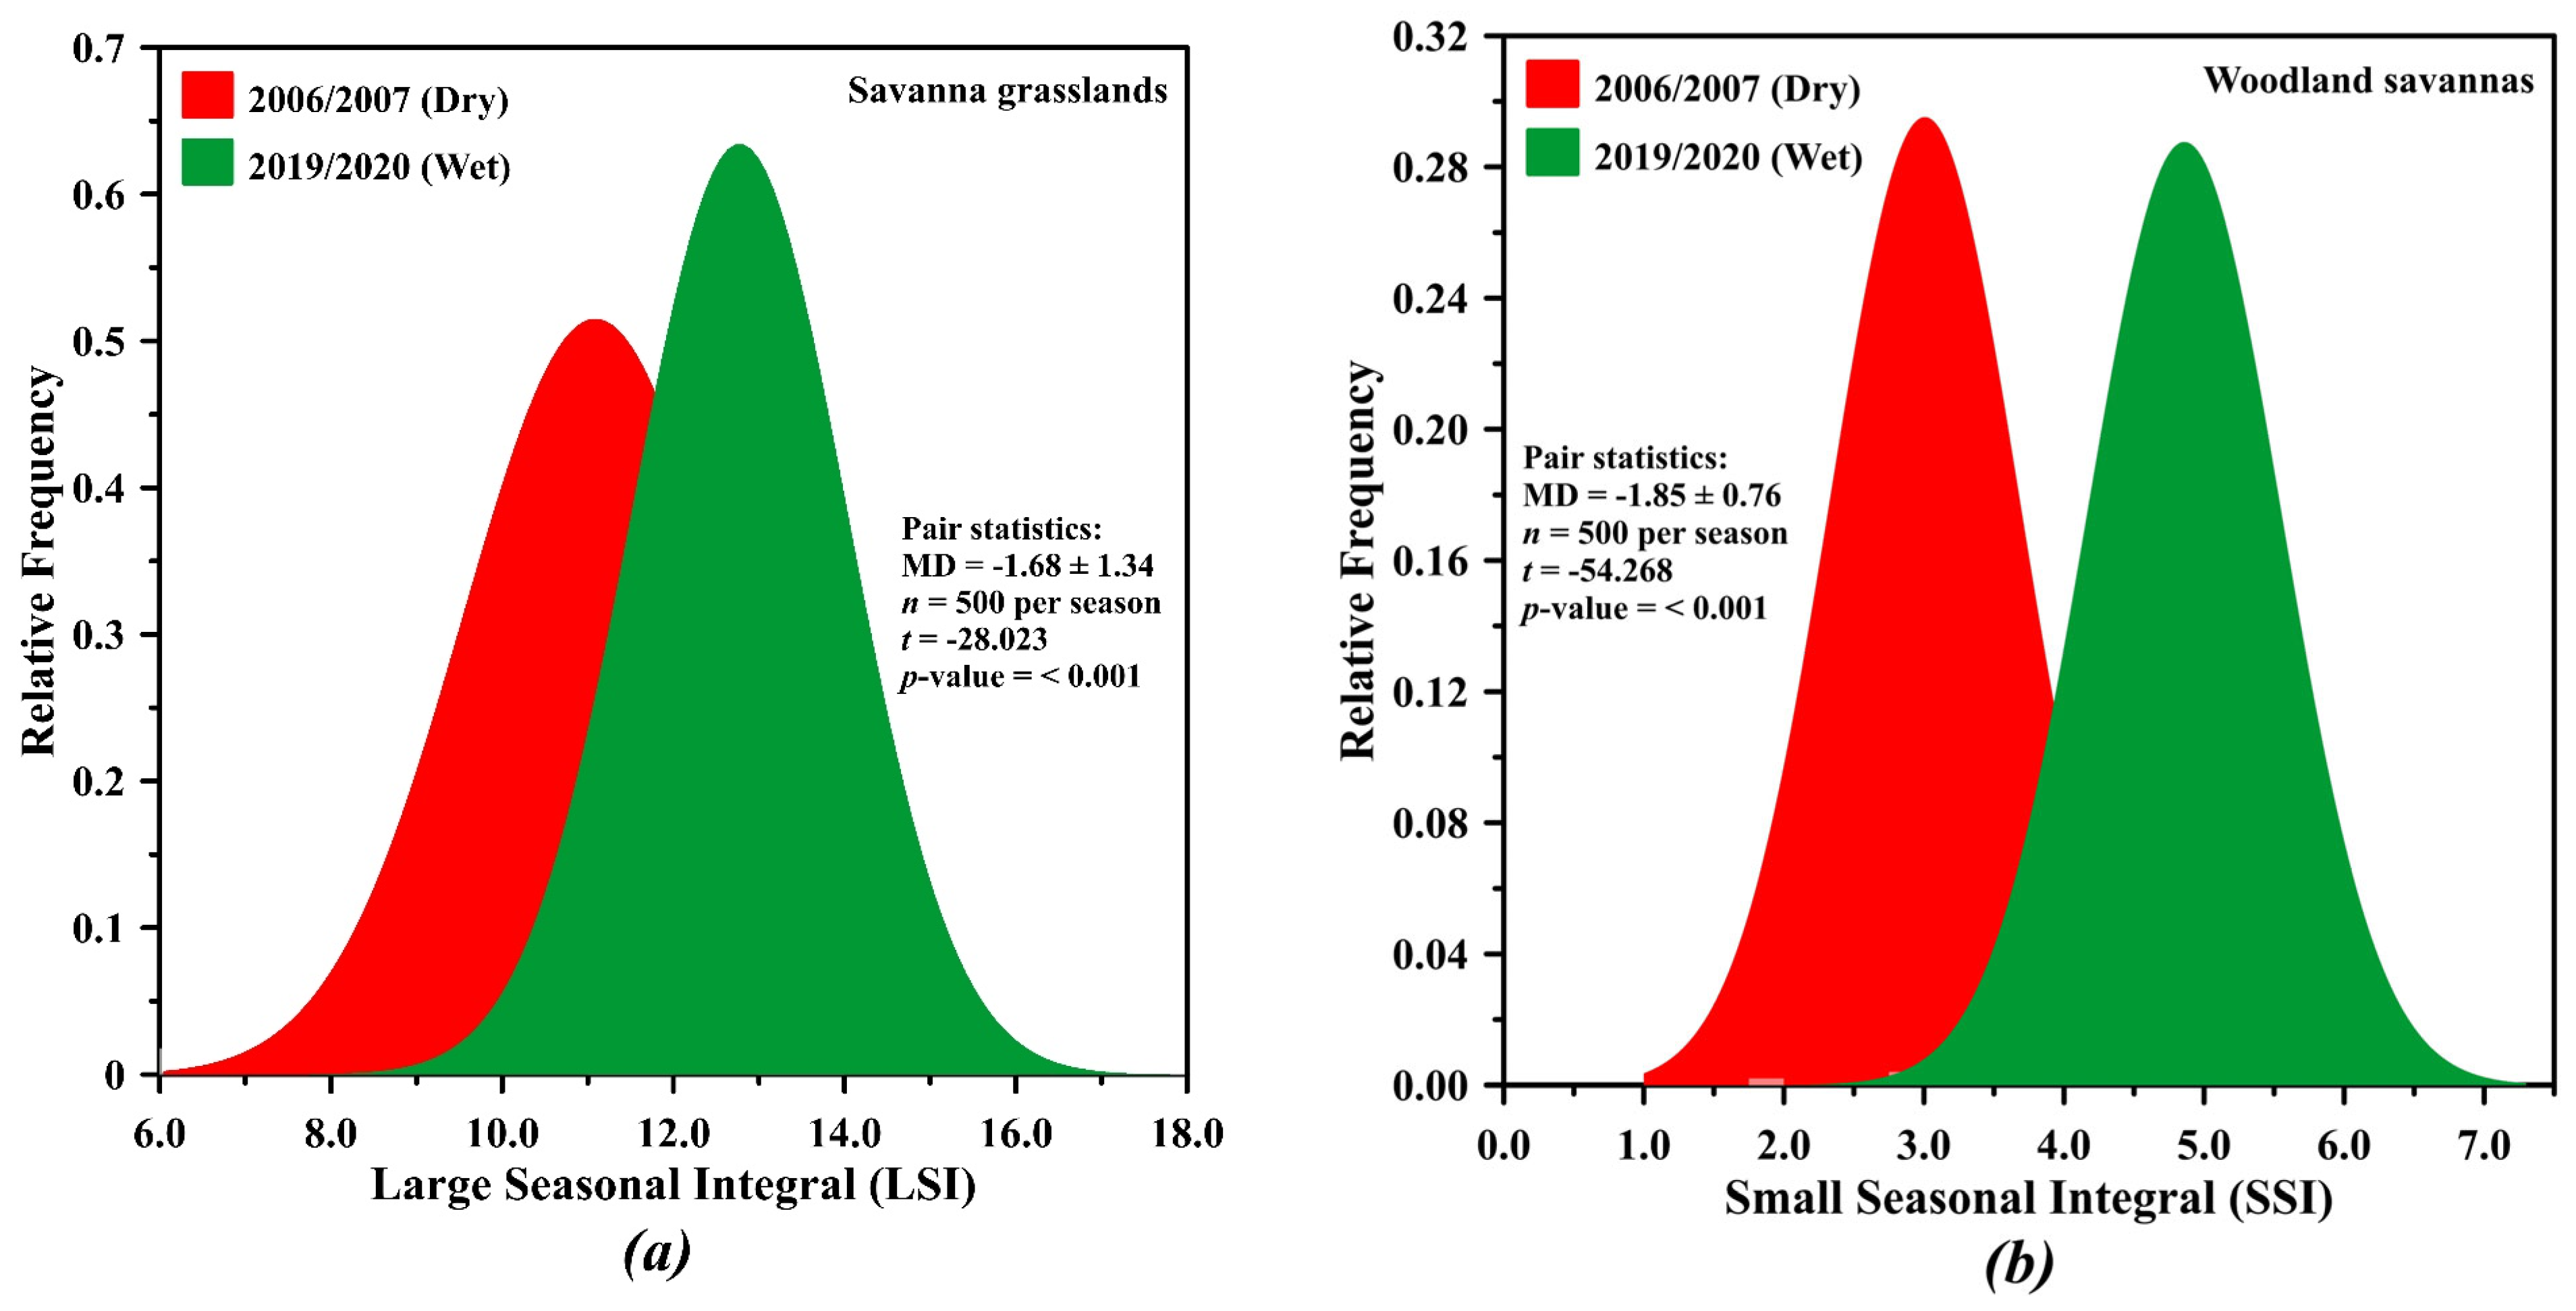
| SSI | −1.330 | −3.072 |
References
- Ferreira, L.G.; Asner, G.P.; Kanapp, D.E.; Coe, M.; Bustamante, M.M.C.; Oliveira, E.L. Equivalent water thickness in savanna ecosystems: MODIS estimates based on ground and EO-1 Hyperion data. Int. J. Remote Sens. 2011, 32, 7423–7440. [Google Scholar] [CrossRef]
- Sano, E.E.; Rosa, R.; Scaramuzza, C.A.M.; Adami, M.; Bolfe, E.L.; Coutinho, A.C.; Esquerdo, J.C.D.M.; Maurano, L.E.P.; Narvaes, I.d.S.; Filho, F.J.B.d.O.; et al. Land use dynamics in the Brazilian Cerrado in the period from 2002 to 2013. Pesqui. Agropecuária Bras. 2019, 54, e00138. [Google Scholar] [CrossRef]
- Jacon, A.D.; Galvão, L.S.; Santos, J.R.; Sano, E.E. Seasonal characterization and discrimination of savannah physiognomies in Brazil using hyperspectral metrics from Hyperion/EO-1. Int. J. Remote Sens. 2017, 38, 4494–4516. [Google Scholar] [CrossRef]
- Ribeiro, J.F.; Walter, B.M.T. Fitofisionomias do bioma Cerrado. In Cerrado: Ambiente e flora; Sano, S.M., Almeida, S.P., Eds.; Embrapa-CPAC: Brasília, Brazil, 1998; 556p. [Google Scholar]
- Oliveira-Filho, A.T.; Ratter, J.A. Vegetation physiognomies and woody flora of the Cerrado biome. In The Cerrados of Brazil; Oliveira, P.S., Marquis, R.J., Eds.; Columbia University Press: New York, NY, USA, 2002; pp. 91–120. [Google Scholar] [CrossRef]
- Araújo, J.A.; Galvão, L.S.; Dalagnol, R. Sensitivity of hyperspectral vegetation indices to rainfall seasonality in the Brazilian savannahs: An analysis using PRISMA data. Remote Sens. Lett. 2023, 14, 277–287. [Google Scholar] [CrossRef]
- Kraaij, T.; Cowling, R.M.; van Wilgen, B.W.; Rikhotso, D.R.; Difford, M. Vegetation responses to season of fire in a seasonal, fire-prone fynbos shrubland. PeerJ 2017, 5, e3591. [Google Scholar] [CrossRef]
- Currier, C.M.; Sala, O.E. Precipitation versus Temperature as Phenology Controls in Drylands. Ecology 2022, 103, e3793. [Google Scholar] [CrossRef] [PubMed]
- Lu, C.; Zhang, J.; Min, X.; Chen, J.; Huang, Y.; Zhao, H.; Yan, T.; Liu, X.; Wang, H.; Liu, H. Contrasting responses of early- and late-season plant phenophases to altered precipitation. Oikos 2023, 5, e09829. [Google Scholar] [CrossRef]
- Bond, W.J.; Woodward, F.I.; Midgley, G.F. The global distribution of ecosystems in a world without fire. New Phytol. 2005, 165, 525–538. [Google Scholar] [CrossRef] [PubMed]
- Alvarado, S.T.; Fornazari, T.; Cóstola, A.; Morellato, L.P.C.; Silva, T.S.F. Drivers of fire occurrence in a mountainous Brazilian cerrado savanna: Tracking long-term fire regimes using remote sensing. Ecol. Indic. 2017, 78, 270–281. [Google Scholar] [CrossRef]
- Silva, L.S.; Costa, T.R.; Salomão, N.V.; Otoni, T.J.O.; Machado, E.L.M. After-fire Variations in Floristic Composition at the Cerrado (Brazilian Savannah) Phytophysiognomies in Curvelo, Minas Gerais, Brazil. Floresta E Ambiente 2020, 27, e20180188. [Google Scholar] [CrossRef]
- Karimi, S.; Heydari, M.; Mirzael, J.; Karami, O.; Heung, B.; Mosavi, A. Assessment of Post-Fire Phenological Changes Using MODIS-Derived Vegetative Indices in the Semiarid Oak Forests. Forests 2023, 14, 590. [Google Scholar] [CrossRef]
- Enright, N.J.; Fontaine, J.B.; Bowman, D.M.J.S.; Bradstock, R.A.; Williams, R.J. Interval squeeze: Altered fire regimes and demographic responses interact to threaten woody species persistence as climate changes. Front. Ecol. Environ. 2015, 13, 265–272. [Google Scholar] [CrossRef]
- Gomes, L.; Miranda, H.S.; Soares-Filho, B.; Rodrigues, L.; Oliveira, U.; Bustamante, M.M.C. Responses of Plant Biomass in the Brazilian Savanna to Frequent Fires. Front. For. Glob. Chang 2020, 3, 507710. [Google Scholar] [CrossRef]
- Silvério, D.V.; Pereira, O.R.; Mews, H.A.; Maracahipes-Santos, L.; dos Santos, J.O.; Lenza, E. Surface fire drives short-term changes in the vegetative phenology of woody species in a Brazilian savanna. Biota Neotrop. 2015, 15, e20140077. [Google Scholar] [CrossRef]
- Geng, L.; Che, T.; Wang, X.; Wang, H. Detecting Spatiotemporal Changes in Vegetation with the BFAST Model in the Qilian Mountain Region during 2000–2017. Remote Sens. 2019, 11, 103. [Google Scholar] [CrossRef]
- Ibrahim, S.; Kaduk, J.; Tansey, K.; Balzter, H.; Lawal, U.M. Detecting phenological changes in plant functional types over West African savannah dominated landscape. Int. J. Remote Sens. 2021, 42, 567–594. [Google Scholar] [CrossRef]
- Borges, E.F.; Sano, E.E. Temporal series of EVI from MODIS sensor for land use and land cover mapping of western Bahia. Bol. De Ciências Geodésicas 2014, 20, 526–547. [Google Scholar] [CrossRef]
- Saad, S.I.; Rocha, H.R.; Dias, M.A.F.S.; Rosolem, R. Can the deforestation breeze change the rainfall in Amazonia? A case study for the BR-163 highway region. Earth Interact. 2010, 14, 1–25. [Google Scholar] [CrossRef]
- Chai, Y.; Martins, G.; Nobre, C.; von Randow, C.; Chen, T.; Dolman, H. Constraining Amazonian land surface temperature sensitivity to precipitation and the probability of forest dieback. Clim. Atmos. Sci. 2021, 4, 6. [Google Scholar] [CrossRef]
- Pennington, R.T.; Lehmann, C.E.R.; Rowland, L.M. Tropical savannas and dry forests. Curr. Biol. 2018, 28, 527–548. [Google Scholar] [CrossRef]
- Ma, X.; Jin, J.; Zhu, X.; Zhou, Y.; Xie, Q. Remote Sensing of Land Surface Phenology: Editorial. Remote Sens. 2022, 14, 4310. [Google Scholar] [CrossRef]
- Gao, X.; McGregor, I.R.; Gray, J.M.; Friedl, M.A.; Moon, M. Observations of satellite land surface phenology indicate that maximum leaf greenness is more associated with global vegetation productivity than growing season length. Glob. Biogeochem. Cycles 2023, 37, e2022GB007462. [Google Scholar] [CrossRef]
- Li, Z.; Shi, H.; Vogelmann, J.E.; Hawbaker, T.J.; Peterson, B. Assessment of Fire Fuel Load Dynamics in Shrubland Ecosystems in the Western United States Using MODIS Products. Remote Sens. 2020, 12, 1911. [Google Scholar] [CrossRef]
- Didan, K.; Munhoz, A.B. MODIS Vegetation Index User’s Guide (MOD13 Series) Version 3.10, 2019 (Collection 6.1). The University of Arizona. Available online: https://vip.arizona.edu (accessed on 13 April 2025).
- Eklundh, L.; Jonsson, P. TIMESAT 3.3 Software Manual; Lund and Malmö University: Scandinavia, Sweden, 2017. [Google Scholar]
- Dronova, I.; Taddeo, S. Remote sensing of phenology: Towards the comprehensive indicators of plant community dynamics from species to regional scales. J. Ecol. 2022, 110, 1460–1484. [Google Scholar] [CrossRef]
- Rodigheri, G.; Sanches, I.D.; Richetti, J.; Tsukahara, R.Y.; Lawes, R.; Bendini, H.N.; Adami, M. Estimating Crop Sowing and Harvesting Dates Using Satellite Vegetation Index: A Comparative Analysis. Remote Sens. 2023, 15, 5366. [Google Scholar] [CrossRef]
- Schwieder, M.; Leitão, P.J.; Bustamante, M.M.C.; Ferreira, L.G.; Rabe, A.; Hostert, P. Mapping Brazilian savanna vegetation gradients with Landsat time series. Int. J. Appl. Earth Obs. Geoinf. 2016, 52, 361–370. [Google Scholar] [CrossRef]
- Haddad, I.; Galvão, L.S.; Breunig, F.M.; Dalagnol, R.; Bourscheidt, V.; Jacon, A.D. On the combined use of phenological metrics derived from different Planetscope vegetation indices for classifying savannas in Brazil. Remote Sens. Appl. Soc. Environ. 2022, 26, 100764. [Google Scholar] [CrossRef]
- Araújo, J.A.; Galvão, L.S.; Dalagnol, R. Evaluating changes with vegetation cover in PRISMA’s spectral, spatial, and temporal attributes and their performance for classifying savannahs in Brazil. Remote Sens. Appl. Soc. Environ. 2023, 32, 101074. [Google Scholar] [CrossRef]
- Masek, J.; Ju, J.; Roger, J.; Skakun, S.; Vermote, E.; Claverie, M.; Dungan, J.; Yin, Z.; Freitag, B.; Justice, C. HLS Sentinel-2 MSI Surface Reflectance Daily Global 30 m V1.5. NASA EOSDIS Land Processes Distributed Active Archive Center 2020. Available online: https://lpdaac.usgs.gov/products/hlss30v015/ (accessed on 14 April 2025).
- Ju, J.; Neigh, C.; Claverie, M.; Skakun, S.; Roger, J.C.; Vermote, E.; Dungan, J. Harmonized Landsat Sentinel-2 (HLS). In Product User Guide: Product Version 2.0; National Aeronautics and Space Administration (NASA): Washington, DC, USA, 2023; 23p. [Google Scholar]
- França, H.; Ramos Neto, M.B.; Setzer, A. O fogo no Parque Nacional das Emas (Série Biodiversidade); Ministério do Meio Ambiente: Brasília, Brazil, 2007; Volume 27, 140p.
- Batista, F.R.Q. Manejo e Monitoramento de Impactos Sobre o Ecossistema em Áreas Protegidas de Cerrado: Estrutura da Vegetação, Gramíneas Exóticas e Incêndios. Ph.D. Thesis, Universidade Federal de Goiás, Goiânia, Brazil, 2019; 165p. [Google Scholar]
- Ramos-Neto, M.B. O Parque Nacional das Emas (GO) e o fogo: Implicações para a conservação biológica. Ph.D. Thesis, Instituto de Biociências, Universidade de São Paulo, São Paulo, Brazil, 2000; 159p. [Google Scholar]
- Rouse, J.W.; Haas, R.H.; Schell, J.A.; Deering, D.W. Monitoring Vegetation Systems in the Great Plains with ERTS. In Proceedings of the Third ERTS-1 Symposium, Washington, DC, USA, 10–14 December 1973; NASA SP-351. Volume 1, pp. 309–317. [Google Scholar]
- Matsushita, B.; Yang, W.; Chen, J.; Onda, Y.; Qiu, G. Sensitivity of the Enhanced Vegetation Index (EVI) and Normalized Difference Vegetation Index (NDVI) to Topographic Effects: A Case Study in High-Density Cypress Forest. Sensors 2007, 7, 2636–2651. [Google Scholar] [CrossRef]
- Oliveira, L.M.; Galvão, L.S.; Ponzoni, F.J. Topographic Effects on the Determination of Hyperspectral Vegetation Indices: A Case Study in Southeastern Brazil. Geocarto Int. 2021, 36, 2186–2203. [Google Scholar] [CrossRef]
- Galvão, L.S.; Arlanche Petri, C.; Dalagnol, R. Coupled effects of solar illumination and phenology on vegetation index determination: An analysis over the Amazonian forests using the SuperDove satellite constellation. GIScience Remote Sens. 2024, 61, 2290354. [Google Scholar] [CrossRef]
- Jonsson, P.; Eklundh, L. TIMESAT—A program for analysing time-series of satellite sensor data. Comput. Geosci. 2004, 8, 833–845. [Google Scholar] [CrossRef]
- Lara, B.; Gandini, M. Assessing the performance of smoothing functions to estimate land surface phenology on temperate grassland. Int. J. Remote Sens. 2016, 37, 1801–1813. [Google Scholar] [CrossRef]
- Zheng, W.; Liu, Y.; Yang, X.; Fand, W. Spatiotemporal Variations of Forest Vegetation Phenology, and Its Response to Climate Change in Northeast China. Remote Sens. 2022, 14, 2909. [Google Scholar] [CrossRef]
- Alemayehu, B.; Suarez-Minguez, J.; Rosette, J.; Khan, S.A. Vegetation Trend Detection Using Time Series Satellite Data as Ecosystem Condition Indicators for Analysis in the Northwestern Highlands of Ethiopia. Remote Sens. 2023, 15, 5032. [Google Scholar] [CrossRef]
- Bendini, H.N.; Fonseca, L.M.G.; Schwieder, M.; Korting, T.S.; Ruffin, P.; Sanches, I.D. Comparing Phenometrics Extracted from Dense Landsat-Like Image Time Series for Crop Classification. In Proceedings of the IEEE International Geoscience and Remote Sensing Symposium, Yokohama, Japan, 28 July–2 August 2019. [Google Scholar] [CrossRef]
- Caparros-Santiago, J.A.; Rodriguez-Galiano, V.; Dash, J. Land surface phenology as indicator of global terrestrial ecosystem dynamics: A systematic review. ISPRS J. Photogramm. Remote Sens. 2021, 171, 330–347. [Google Scholar] [CrossRef]
- Galvani, E.; Luchiari, A. Critérios para classificação de anos com regime pluviométrico normal, seco e úmido. In Proceedings of the Anais do X Encontro de Geógrafos da América Latina, São Paulo, SP, Brazil, 20–26 March 2005; pp. 5701–5710. [Google Scholar]
- Lakens, D. Calculating and reporting effect sizes to facilitate cumulative science: A practical primer for t-tests and ANOVAs. Front. Psychol. 2013, 4, 863. [Google Scholar] [CrossRef] [PubMed]
- Ma, X.; Huete, A.; Yu, Q.; Coupe, N.R.; Davies, K.; Broich, M.; Ratana, P.; Beringer, J.; Hutley, L.B.; Cleverly, J.; et al. Spatial patterns and temporal dynamics in savanna vegetation phenology across the North Australian Tropical Transect. Remote Sens. Environ. 2013, 139, 97–115. [Google Scholar] [CrossRef]
- Lehmann, C.E.R.; Anderson, T.M.; Sankaran, M.; Higgins, S.I.; Archibald, S.; Hoffmann, W.A.; Hanan, N.P.; Williams, R.J.; Fensham, R.J.; Felfili, J.; et al. Savanna vegetation-fire-climate relationships differ among continents. Science 2014, 343, 548–552. [Google Scholar] [CrossRef]
- Krawchuk, M.A.; Moritz, M.A. Constraints on global fire activity vary across a resource gradient. Ecology 2011, 92, 121–132. [Google Scholar] [CrossRef]
- Ge, C.; Sun, S.; Yao, R.; Sun, P.; Li, M.; Bian, Y. Long-term vegetation phenology changes and response to multi-scale meteorological drought on the Loess Plateau, China. J. Hydrol. 2022, 614, 128605. [Google Scholar] [CrossRef]
- Medeiros, R.; Andrade, J.; Ramos, D.; Moura, M.; Pérez-Marin, A.M.; dos Santos, C.A.C.; da Silva, B.B.; Cunha, J. Remote Sensing Phenology of the Brazilian Caatinga and Its Environmental Drivers. Remote Sens. 2022, 14, 2637. [Google Scholar] [CrossRef]
- Singh, R.; Patel, N.R.; Danodia, A. Deriving Phenological Metrics from Landsat-OLI for Sugarcane Crop Type Mapping: A Case Study in North India. J. Indian Soc. Remote Sens. 2022, 50, 1021–1030. [Google Scholar] [CrossRef]
- Machida, W.S.; Gomes, L.; Moser, P.; Castro, I.B.; Miranda, S.C.; Silva-Júnior, M.C.; Bustamante, M.M.C. Long term post-fire recovery of woody plants in savannas of central Brazil. For. Ecol. Manag. 2021, 493, 119255. [Google Scholar] [CrossRef]
- Carvalho, I.S.; Barros, K.A.L.; Alves, D.B.; Ferraz, T.M.; Alvarado, S.T. Relações entre Incidência de Queimadas e a Dinâmica da Vegetação no Parque Nacional da Chapada das Mesas, Maranhão, Brasil: Uma Abordagem a partir de Métricas Fenológicas derivadas de Sensoriamento Remoto. Rev. Geográfica Acadêmica 2024, 18, 19–41. Available online: https://revista.ufrr.br/rga/article/view/8276 (accessed on 23 March 2025).
- Cui, T.; Martz, L.; Zhao, L.; Guo, X. Investigating the impact of the temporal resolution of MODIS data on measured phenology in the prairie grasslands. GIScience Remote Sens. 2020, 57, 395–410. [Google Scholar] [CrossRef]
- Bueno, L.M.; Dexter, K.G.; Pennington, R.T.; Pontara, V.; Neves, D.M.; Ratter, J.A.; de Oliveira-Filho, A.T. The Environmental Triangle of the Cerrado Domain: Ecological Factors Driving Shifts in Tree Species Composition between Forests and Savannas. J. Ecol. 2018, 106, 2109–2120. [Google Scholar] [CrossRef]
- Silva, Y.B.A.; Galvão, L.S.; Sanches, I.D.; Oliveira, L.B. On the occurrence and causes of long-term declines in MODIS NDVI within the savanna environment of central Brazil. Remote Sens. Appl. Soc. Environ. 2025, 38, 101558. [Google Scholar] [CrossRef]
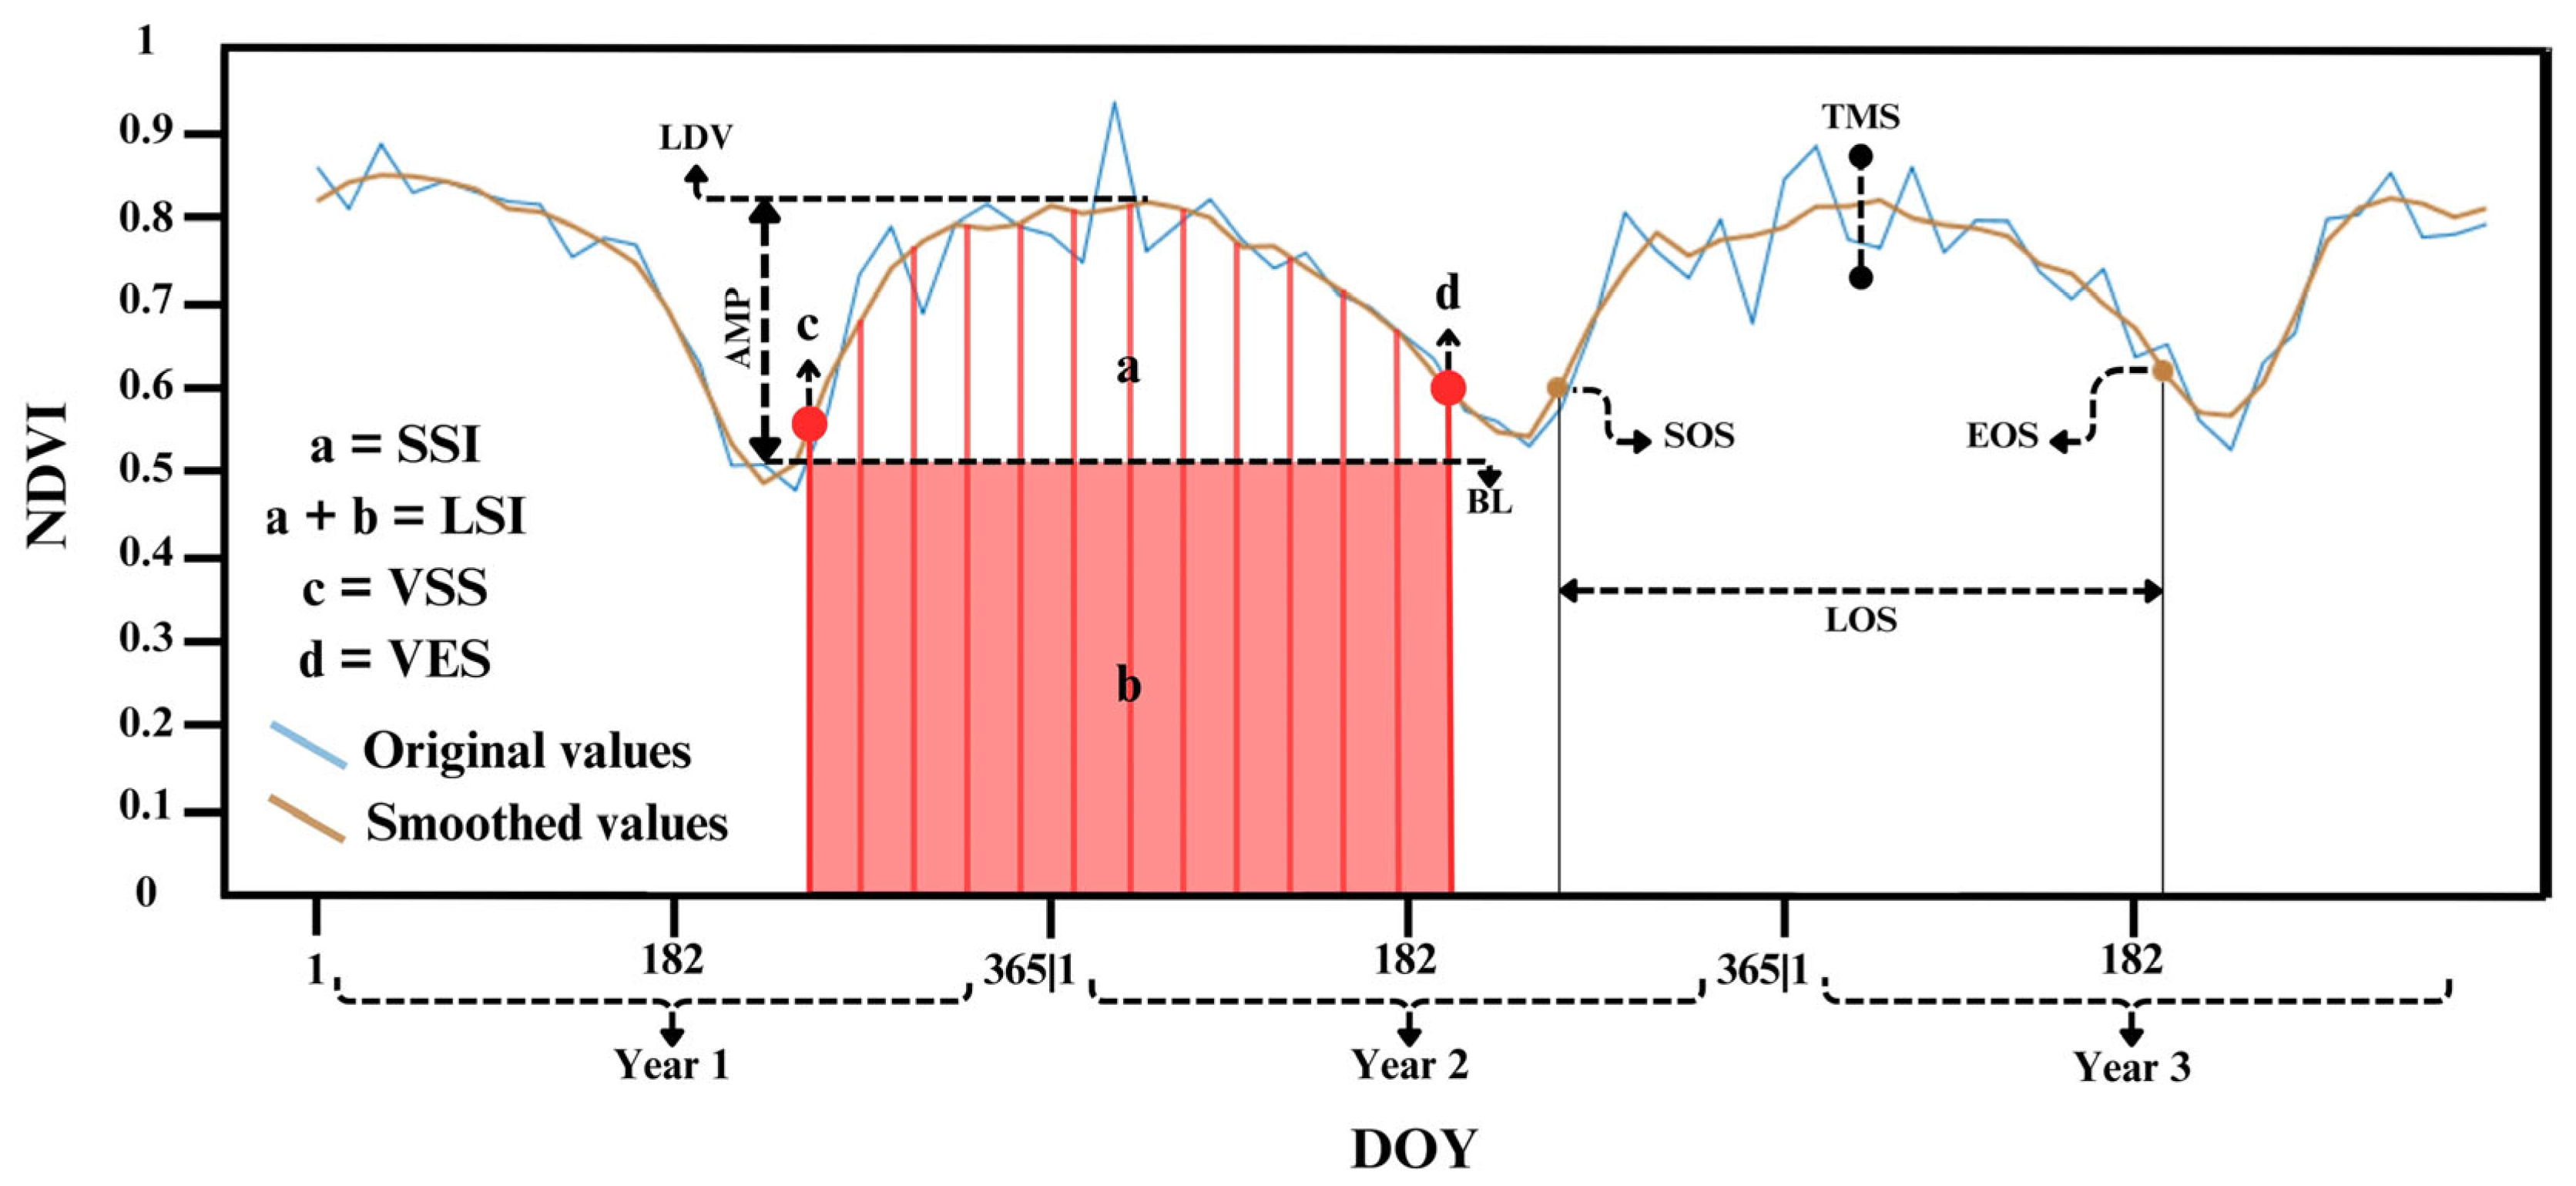

| LSP Metric | Abb. | Description | Unit |
|---|---|---|---|
| Start of Season | SOS | Start time of growing season | DOY |
| End of season | EOS | End time of growing season | DOY |
| Length of the Season | LOS | Duration of the season | Days |
| Time for the Mid of the Season | TMS | Mean value of the times for which, respectively, the left edge has increased to the 80% level and the right edge has decreased to the 80% level | DOY |
| Largest Data Value | LDV | Largest NDVI in the season | - |
| Base Level | BL | Average of the left and right minimum NDVI values | - |
| Amplitude | AMP | Difference between LDV and BL | - |
| Value for the Start of the Season | VSS | NDVI value of the function at the time of SOS | - |
| Value for the End of the Season | VES | NDVI value of the function at the time of EOS | - |
| Rate of Increase at the Beginning of the Season | RIBS | Ratio of the difference between the left 20% and 80% levels and the corresponding time difference | NDVI/DOY |
| Rate of Decrease at the End of the Season | RDES | Ratio of the difference between the right 20% and 80% levels and the corresponding time difference | NDVI/DOY |
| Large Seasonal Integral | LSI | Integral of the function describing the season from the SOS to the EOS | NDVIxDOY |
| Small Seasonal Integral | SSI | Integral of the difference between the function describing the season and the BL | NDVIxDOY |
| LSP Metric | Grasslands | Woodlands |
|---|---|---|
| AMP | 0.311 ± 0.061 | 0.290 ± 0.054 |
| BL | 0.388 ± 0.054 | 0.480 ± 0.057 |
| EOS (DOY) | 199.732 ± 22.937 | 206.030 ± 20.739 |
| LDV | 0.698 ± 0.051 | 0.772 ± 0.047 |
| LOS (DOY) | 300.038 ± 47.277 | 309.097 ± 45.753 |
| LSI | 11.838 ± 1.313 | 13.767 ± 1.366 |
| RDES | 0.036 ± 0.017 | 0.035 ± 0.013 |
| RIBS | 0.059 ± 0.029 | 0.057 ± 0.028 |
| SOS (DOY) | 264.693 ± 37.770 | 261.932 ± 38.435 |
| SSI | 3.959 ± 0.849 | 3.756 ± 0.759 |
| TMS (DOY) | 55.766 ± 59.080 | 58.971 ± 57.284 |
| VES | 0.450 ± 0.061 | 0.541 ± 0.056 |
| VSS | 0.446 ± 0.058 | 0.538 ± 0.055 |
Disclaimer/Publisher’s Note: The statements, opinions and data contained in all publications are solely those of the individual author(s) and contributor(s) and not of MDPI and/or the editor(s). MDPI and/or the editor(s) disclaim responsibility for any injury to people or property resulting from any ideas, methods, instructions or products referred to in the content. |
© 2025 by the authors. Licensee MDPI, Basel, Switzerland. This article is an open access article distributed under the terms and conditions of the Creative Commons Attribution (CC BY) license (https://creativecommons.org/licenses/by/4.0/).
Share and Cite
Santos, M.C.d.R.; Galvão, L.S.; Korting, T.S.; Rodigheri, G. Effects of Precipitation and Fire on Land Surface Phenology in the Brazilian Savannas (Cerrado). Remote Sens. 2025, 17, 2077. https://doi.org/10.3390/rs17122077
Santos MCdR, Galvão LS, Korting TS, Rodigheri G. Effects of Precipitation and Fire on Land Surface Phenology in the Brazilian Savannas (Cerrado). Remote Sensing. 2025; 17(12):2077. https://doi.org/10.3390/rs17122077
Chicago/Turabian StyleSantos, Monique Calderaro da Rocha, Lênio Soares Galvão, Thales Sehn Korting, and Grazieli Rodigheri. 2025. "Effects of Precipitation and Fire on Land Surface Phenology in the Brazilian Savannas (Cerrado)" Remote Sensing 17, no. 12: 2077. https://doi.org/10.3390/rs17122077
APA StyleSantos, M. C. d. R., Galvão, L. S., Korting, T. S., & Rodigheri, G. (2025). Effects of Precipitation and Fire on Land Surface Phenology in the Brazilian Savannas (Cerrado). Remote Sensing, 17(12), 2077. https://doi.org/10.3390/rs17122077