Article

Perceiving Fifth Facade Colors in China’s Coastal Cities from a Remote Sensing Perspective: A New Understanding of Urban Image

by
Yue Liu
1,
Richen Ye
2,
Wenlong Jing
1,3,
Xiaoling Yin
1,3,
Jia Sun
3,
Qiquan Yang
4,
Zhiwei Hou
3,
Hongda Hu
1,3,
Sijing Shu
1 and
Ji Yang
1,3,*
1
Guangzhou Institute of Geography, Guangdong Academy of Sciences, Guangzhou 510070, China
2
Guangzhou Urban Planning & Design Survey Research Institute Co., Ltd., Guangzhou 510060, China
3
Southern Marine Science and Engineering Guangdong Laboratory (Guangzhou), Guangzhou 511485, China
4
College of Surveying & Geo-Informatics, Tongji University, Shanghai 200092, China
*
Author to whom correspondence should be addressed.
Remote Sens. 2025, 17(12), 2075; https://doi.org/10.3390/rs17122075
Submission received: 25 March 2025 / Revised: 28 May 2025 / Accepted: 4 June 2025 / Published: 17 June 2025
(This article belongs to the Section Environmental Remote Sensing)

Abstract

Urban color represents the visual skin of a city, embodying regional culture, historical memory, and the contemporary spirit. However, while the existing studies focus on pedestrian-level facade colors, the “fifth facade” from a bird’s-eye view has been largely overlooked. Moreover, color distortions in traditional remote sensing imagery hinder precise analysis. This study targeted 56 Chinese coastal cities, decoding the spatiotemporal patterns of their fifth facade color (FFC). Through developing an innovative natural color optimization algorithm, the oversaturation and color bias of Sentinel-2 imageries were addressed. Several color indicators, including dominant colors, hue–saturation–value, color richness, and color harmony, were developed to analyze the spatial variations of FFC. Results revealed that FFC in Chinese coastal cities is dominated by gray, black, and brown, reflecting the commonality of cement jungles. Among them, northern warm grays exude solidity, as in Weifang, while southern cool grays convey modern elegance, as in Shenzhen. Blue PVC rooftops (e.g., Tianjin) and red-brick villages (e.g., Quanzhou) serve as symbols of industrial function and cultural heritage. Economically advanced cities (e.g., Shanghai) lead in color richness, linking vitality to visual diversity, while high-harmony cities (e.g., Lianyungang) foster livability through coordinated colors. The study also warns of color pollution risks. Cities like Qingdao exposed planning imbalances through color clashes. This research pioneers a systematic and large-scale decoding of urban fifth facade color from a remote sensing perspective, quantitatively revealing the dilemma of “identical cities” in modernization development. The findings inject color rationality into urban planning and create readable and warm city images.

Graphical Abstract

1. Introduction

“Urban color” broadly refers to the collective surface colors of all physical landscapes within a city, including artificial structures such as roads, buildings, and billboards, as well as natural landscapes like rivers, mountains, and vegetation [1]. Urban color is shaped by a combination of cultural, geographical, historical, and contemporary factors, making it a direct reflection of urban character and spirit. In return, it influences the livability and attractiveness of a city. For instance, the red bricks and green tiles of Beijing symbolize the solemnity of ancient imperial power, while the beige and gray tones of Paris reflect the elegance of a fashion capital, and the blue-and-white palette of Greek towns mirrors the locals’ relaxed lifestyle. Rich and harmonious urban colors also positively impact residents’ mental and physical health and promote social equality [2]. However, with China’s rapid urbanization in recent decades, urban colors have become increasingly homogenized [3]. Quantitative research on urban color is a critical approach to perceiving and calculating the “urban image” [4,5], offering new insights into urbanization and providing diverse data support for urban renewal projects.
Traditional urban color research primarily focuses on the colors of urban facades from a pedestrian perspective [6,7,8]. These studies often concentrate on micro-scale urban spaces, employing methods such as field photography and surveys. With advancements in computer vision (CV) technology, some researchers have begun extracting urban facade colors from street-view images. For example, Zhong et al. [9] used the Baidu Street View platform to create a comprehensive facade color map of Shenzhen, providing valuable data for urban color planning. However, few studies have explored the macro-scale investigation of urban “fifth facade” colors (i.e., the colors of urban surfaces from a bird’s-eye view) [10]. Although the fifth facade is not entirely visible to pedestrians, it plays a crucial role in shaping the city’s aerial visual image, contributing to architectural integrity, ecological functions, and aesthetic appeal [11,12,13]. Particularly, since 2024, the Chinese government has vigorously promoted the development of low-altitude economy. Drone-dominated low-altitude aircraft are expected to fundamentally transform photography and recreational activities, with increasing public attention to and utilization of urban fifth facades. While existing studies have conducted preliminary discussions on practical applications of fifth facades across ecological, energy, social, policy, and design domains [14], research focusing on the fifth facade colors (FFCs) remains scarce. Driven by both policy and practical needs, FFC demonstrates significant implications for sustainable urban development. Understanding and quantifying FFC characteristics has emerged as an urgent research priority in urban studies.
Remote sensing technology holds clear advantages in acquiring FFC data, offering continuous spatiotemporal archives and capturing more authentic urban colors through its rich spectral bands compared to conventional cameras [15]. In previous studies, Gao et al. [16] were the first to employ remote sensing and landscape analysis to extract the dominant architectural colors of Northwestern University’s fifth facade in China, providing quantitative data for campus color planning. Similarly, Rizzo et al. [17] combined satellite imagery from 1985 to 2020 with field soil spectral measurements to create a global topsoil color map at 30 m resolution, enriching the color database for soil landscapes within fifth facades. For vegetation landscapes, studies such as Ju and Masek [18] and Zhong and Li [19] utilized long-term satellite data to detect vegetation canopy greenness and its trends in global urban areas. However, systematic and innovative research on the comprehensive FFC of urban landscapes remains lacking, with persistent gaps in both methodological frameworks and applied analytical perspectives.
Theoretically, urban FFC distribution maps can be created using true-color composite remote sensing products. Unlike raw imagery, these products map the reflectance of red, green, and blue bands directly to RGB channels, aligning more closely with human color perception [20]. Thus, they are widely used to present satellite observations to non-specialist audiences. However, recent studies have noted that direct combinations of these bands can lead to oversaturated colors (e.g., green vegetation) or unrealistic hues (e.g., deserts), which can significantly reduce the accuracy of fine-grained urban color research [21]. To address this, this study draws on previous work that corrected ocean color tones using the CIE color model, an internationally standardized system for color quantification based on human visual perception, to correct chromatic distortion [22]. The satellite spectral band values were first transformed into XYZ color coordinates in the CIE space, and then applied to linear and nonlinear adjustments to create natural-looking remote sensing composite imagery (referred to as “natural-color products”), supporting high-precision color analysis and scientific decision-making.
Based on the above research background, this study aims to (1) develop a remote sensing image color optimization algorithm and generate natural-color products for China’s coastal urban built-up areas using 2020 Sentinel-2 satellite imagery; (2) construct six representative color indices (dominant colors, hue–saturation–value, richness, and harmony) to analyze FFC characteristics and spatial variations across coastal cities; and (3) interpret the urban image of contemporary coastal cities from an FFC perspective. By leveraging remote sensing technology, this study seeks to explore the formation patterns of urban colors from a macro-geographical perspective, enabling urban design to better integrate humanistic and ecological goals.

2. Materials and Methods
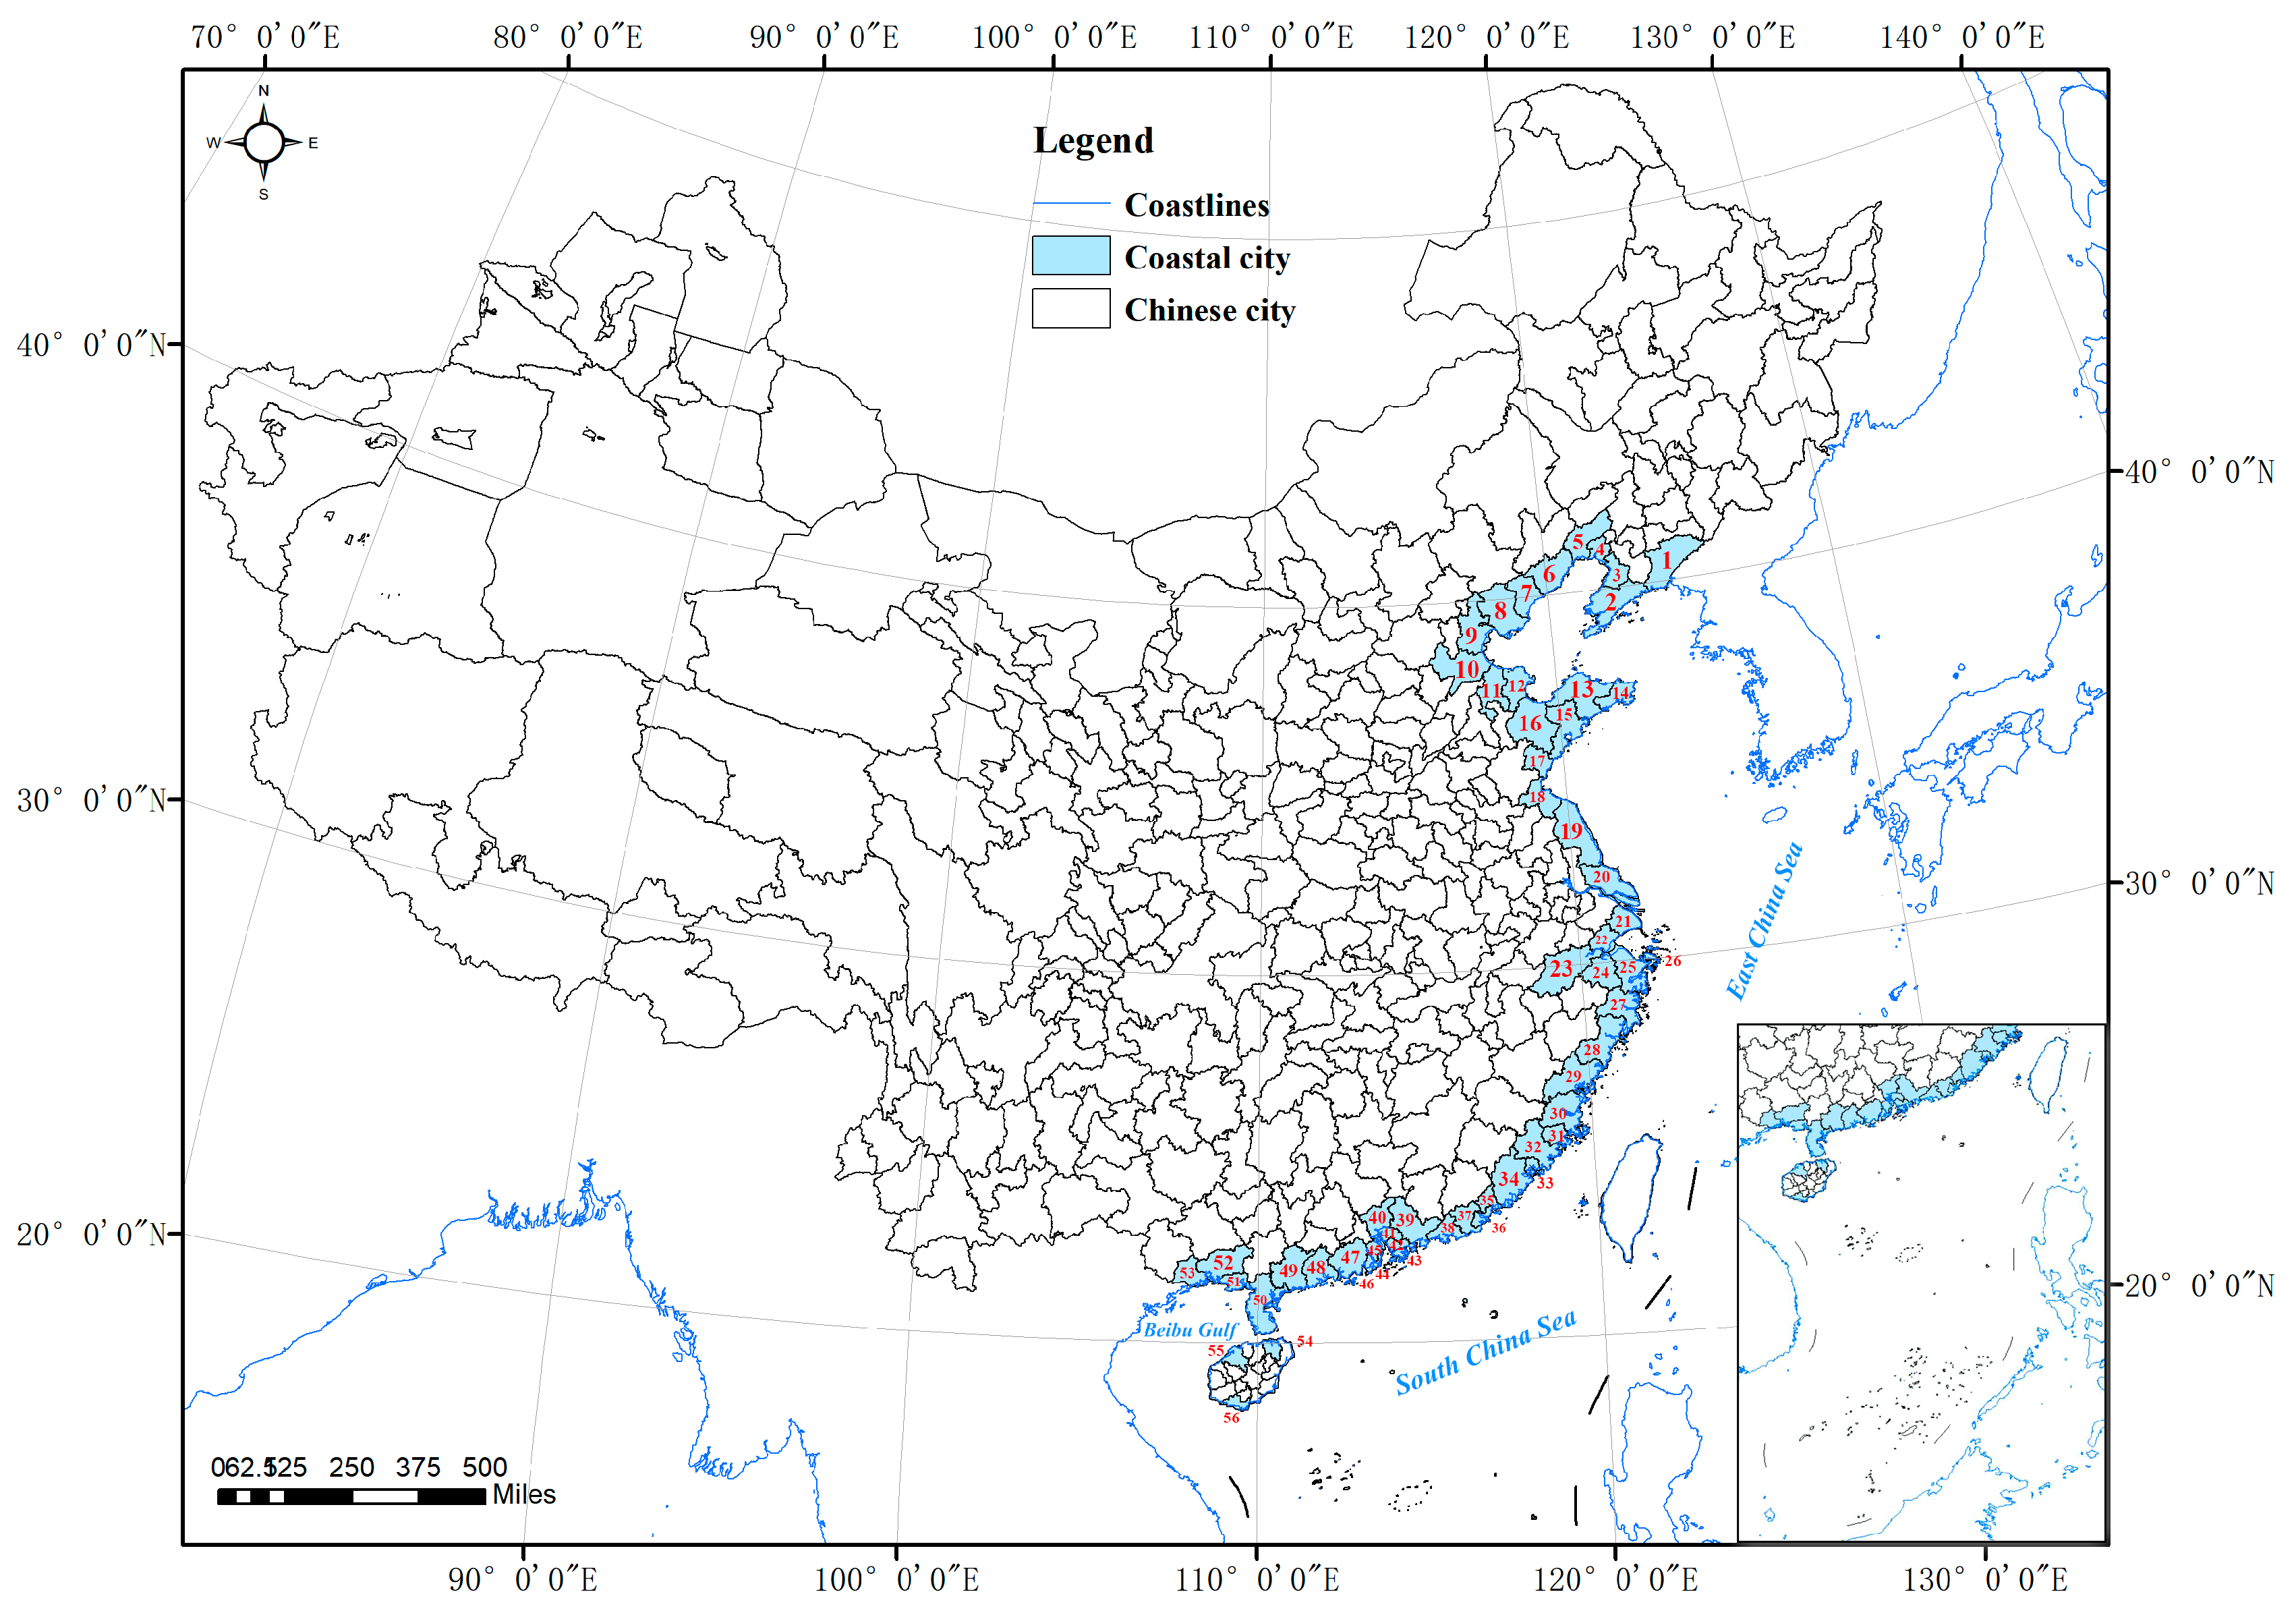
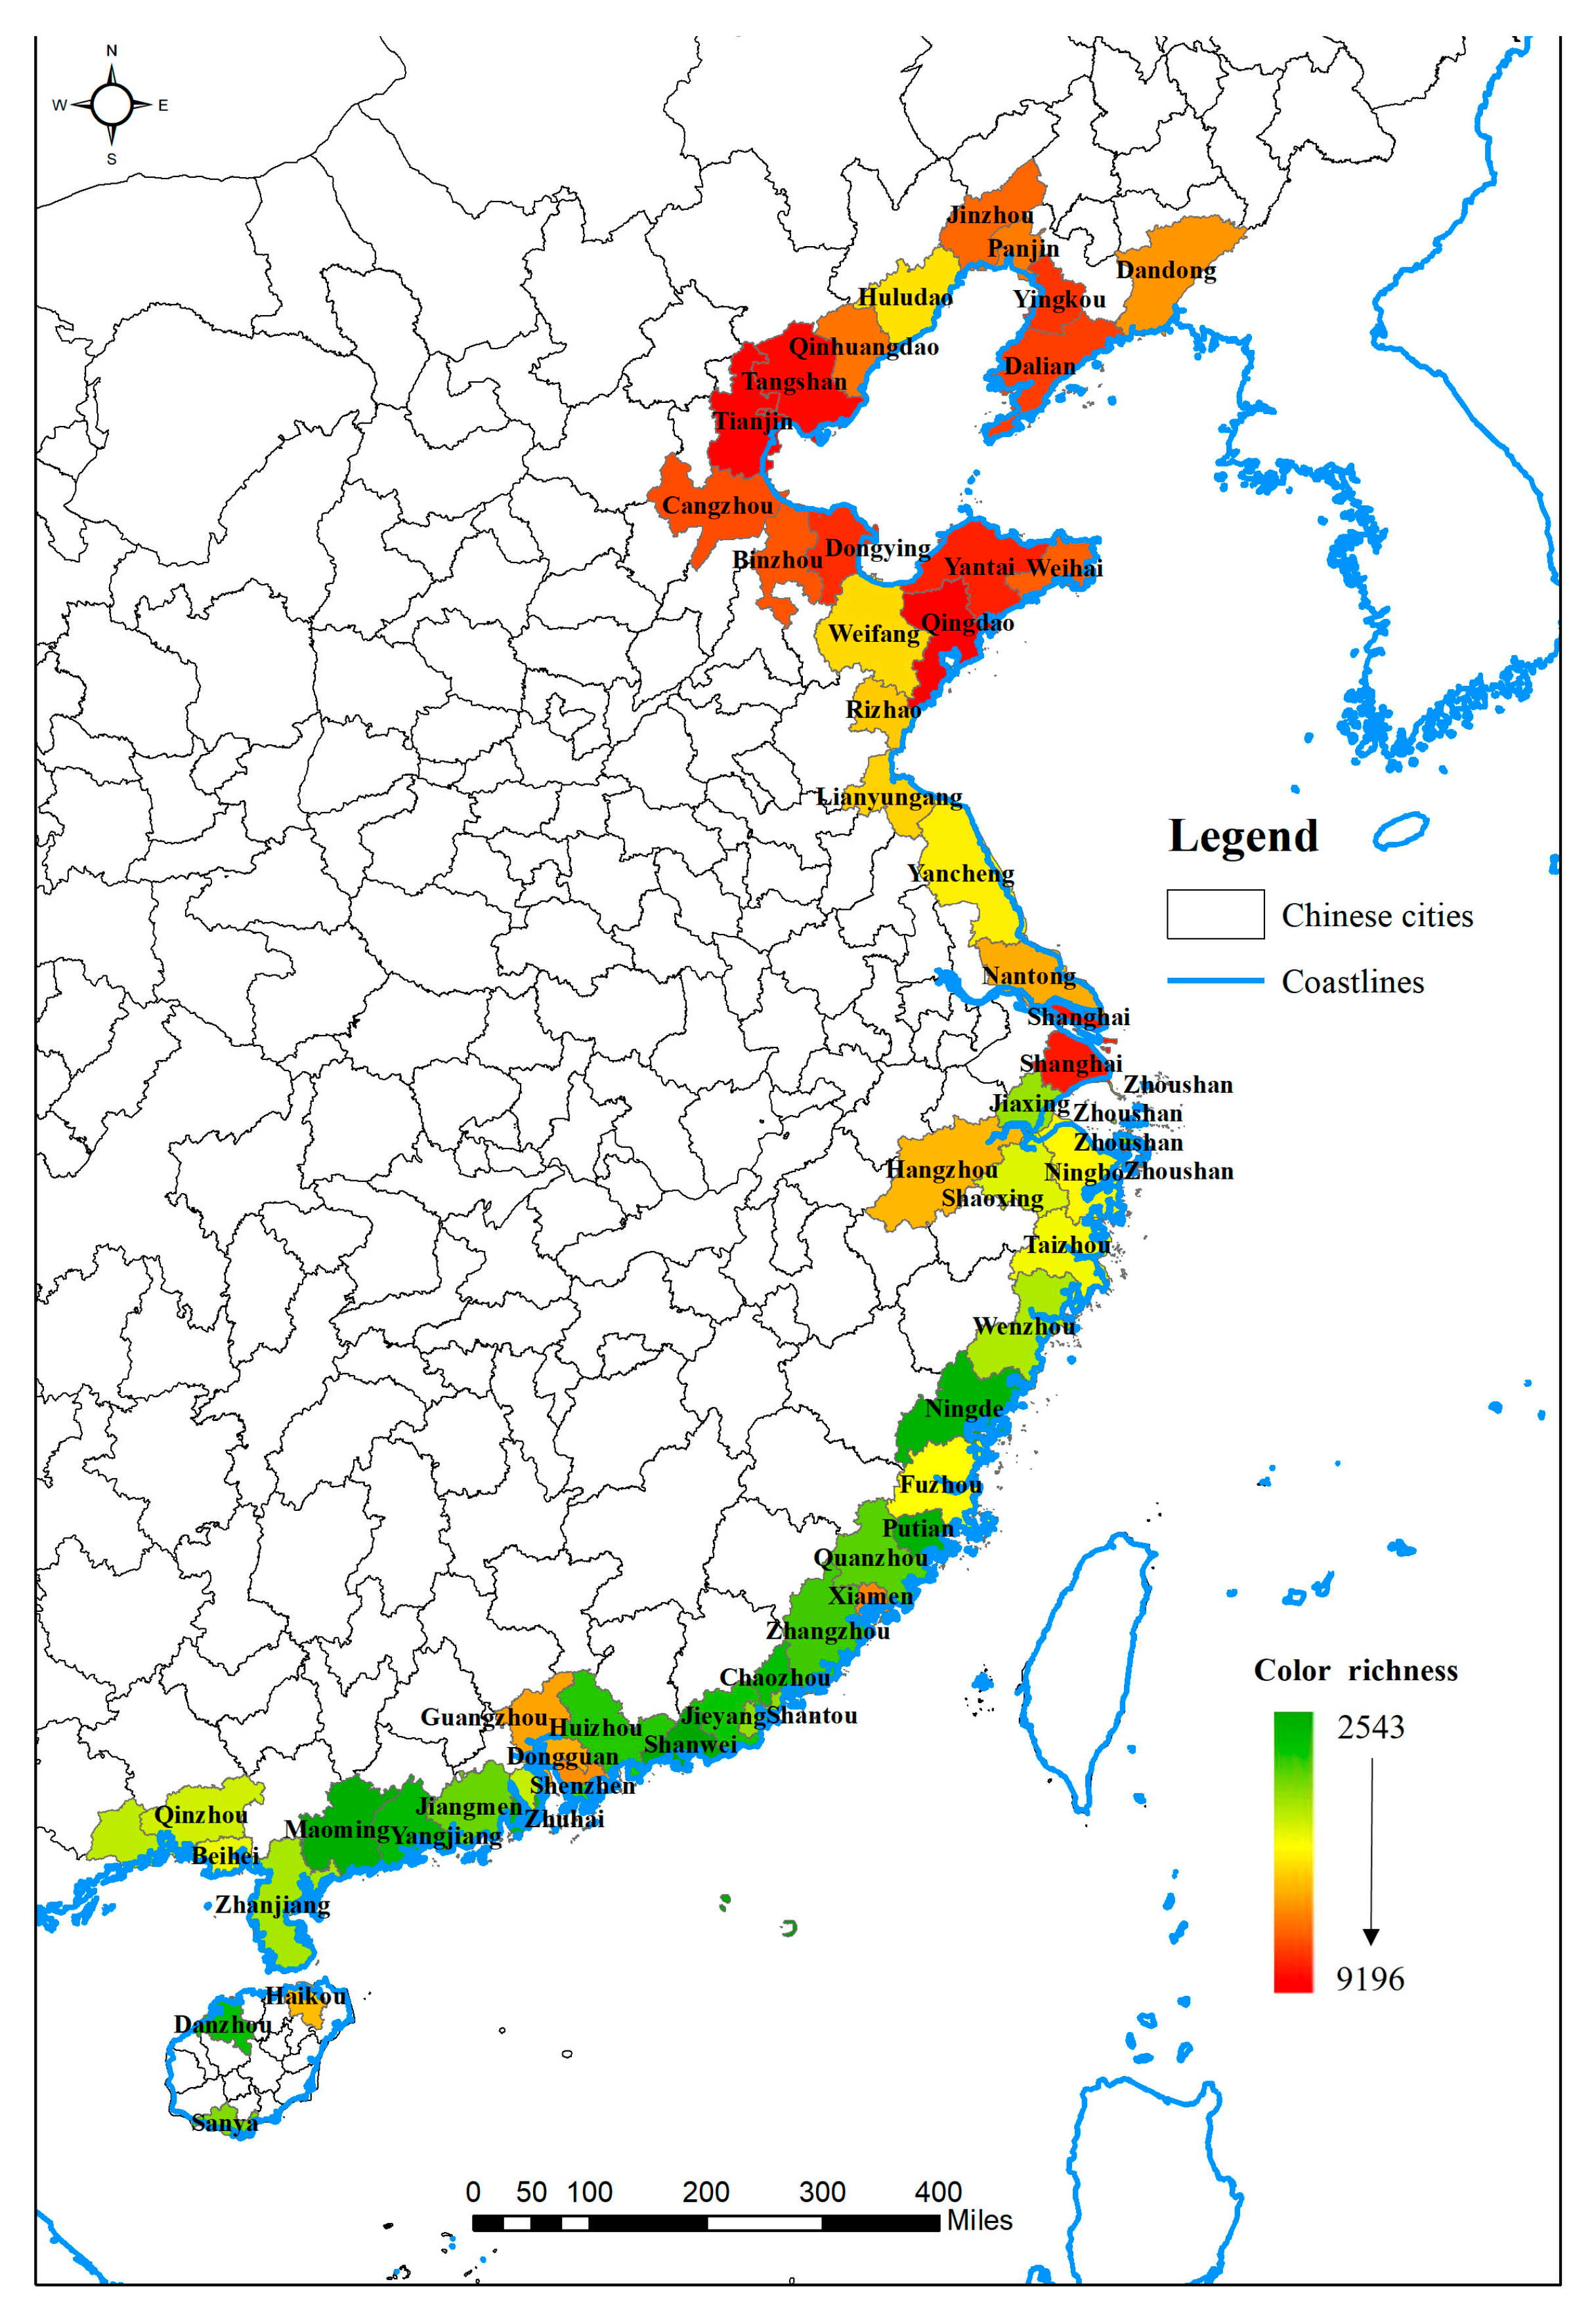
2.1. Study Area

As shown in Figure 1 and Table 1, China has 56 prefecture-level coastal cities directly adjacent to the sea (excluding Taiwan Province). Due to data availability constraints, this study did not include coastal cities in Taiwan Province. Furthermore, Sansha City in Hainan Province was excluded from the study due to its minimal built-up area.
Coastal cities were selected for FFC analysis out the following reasons:
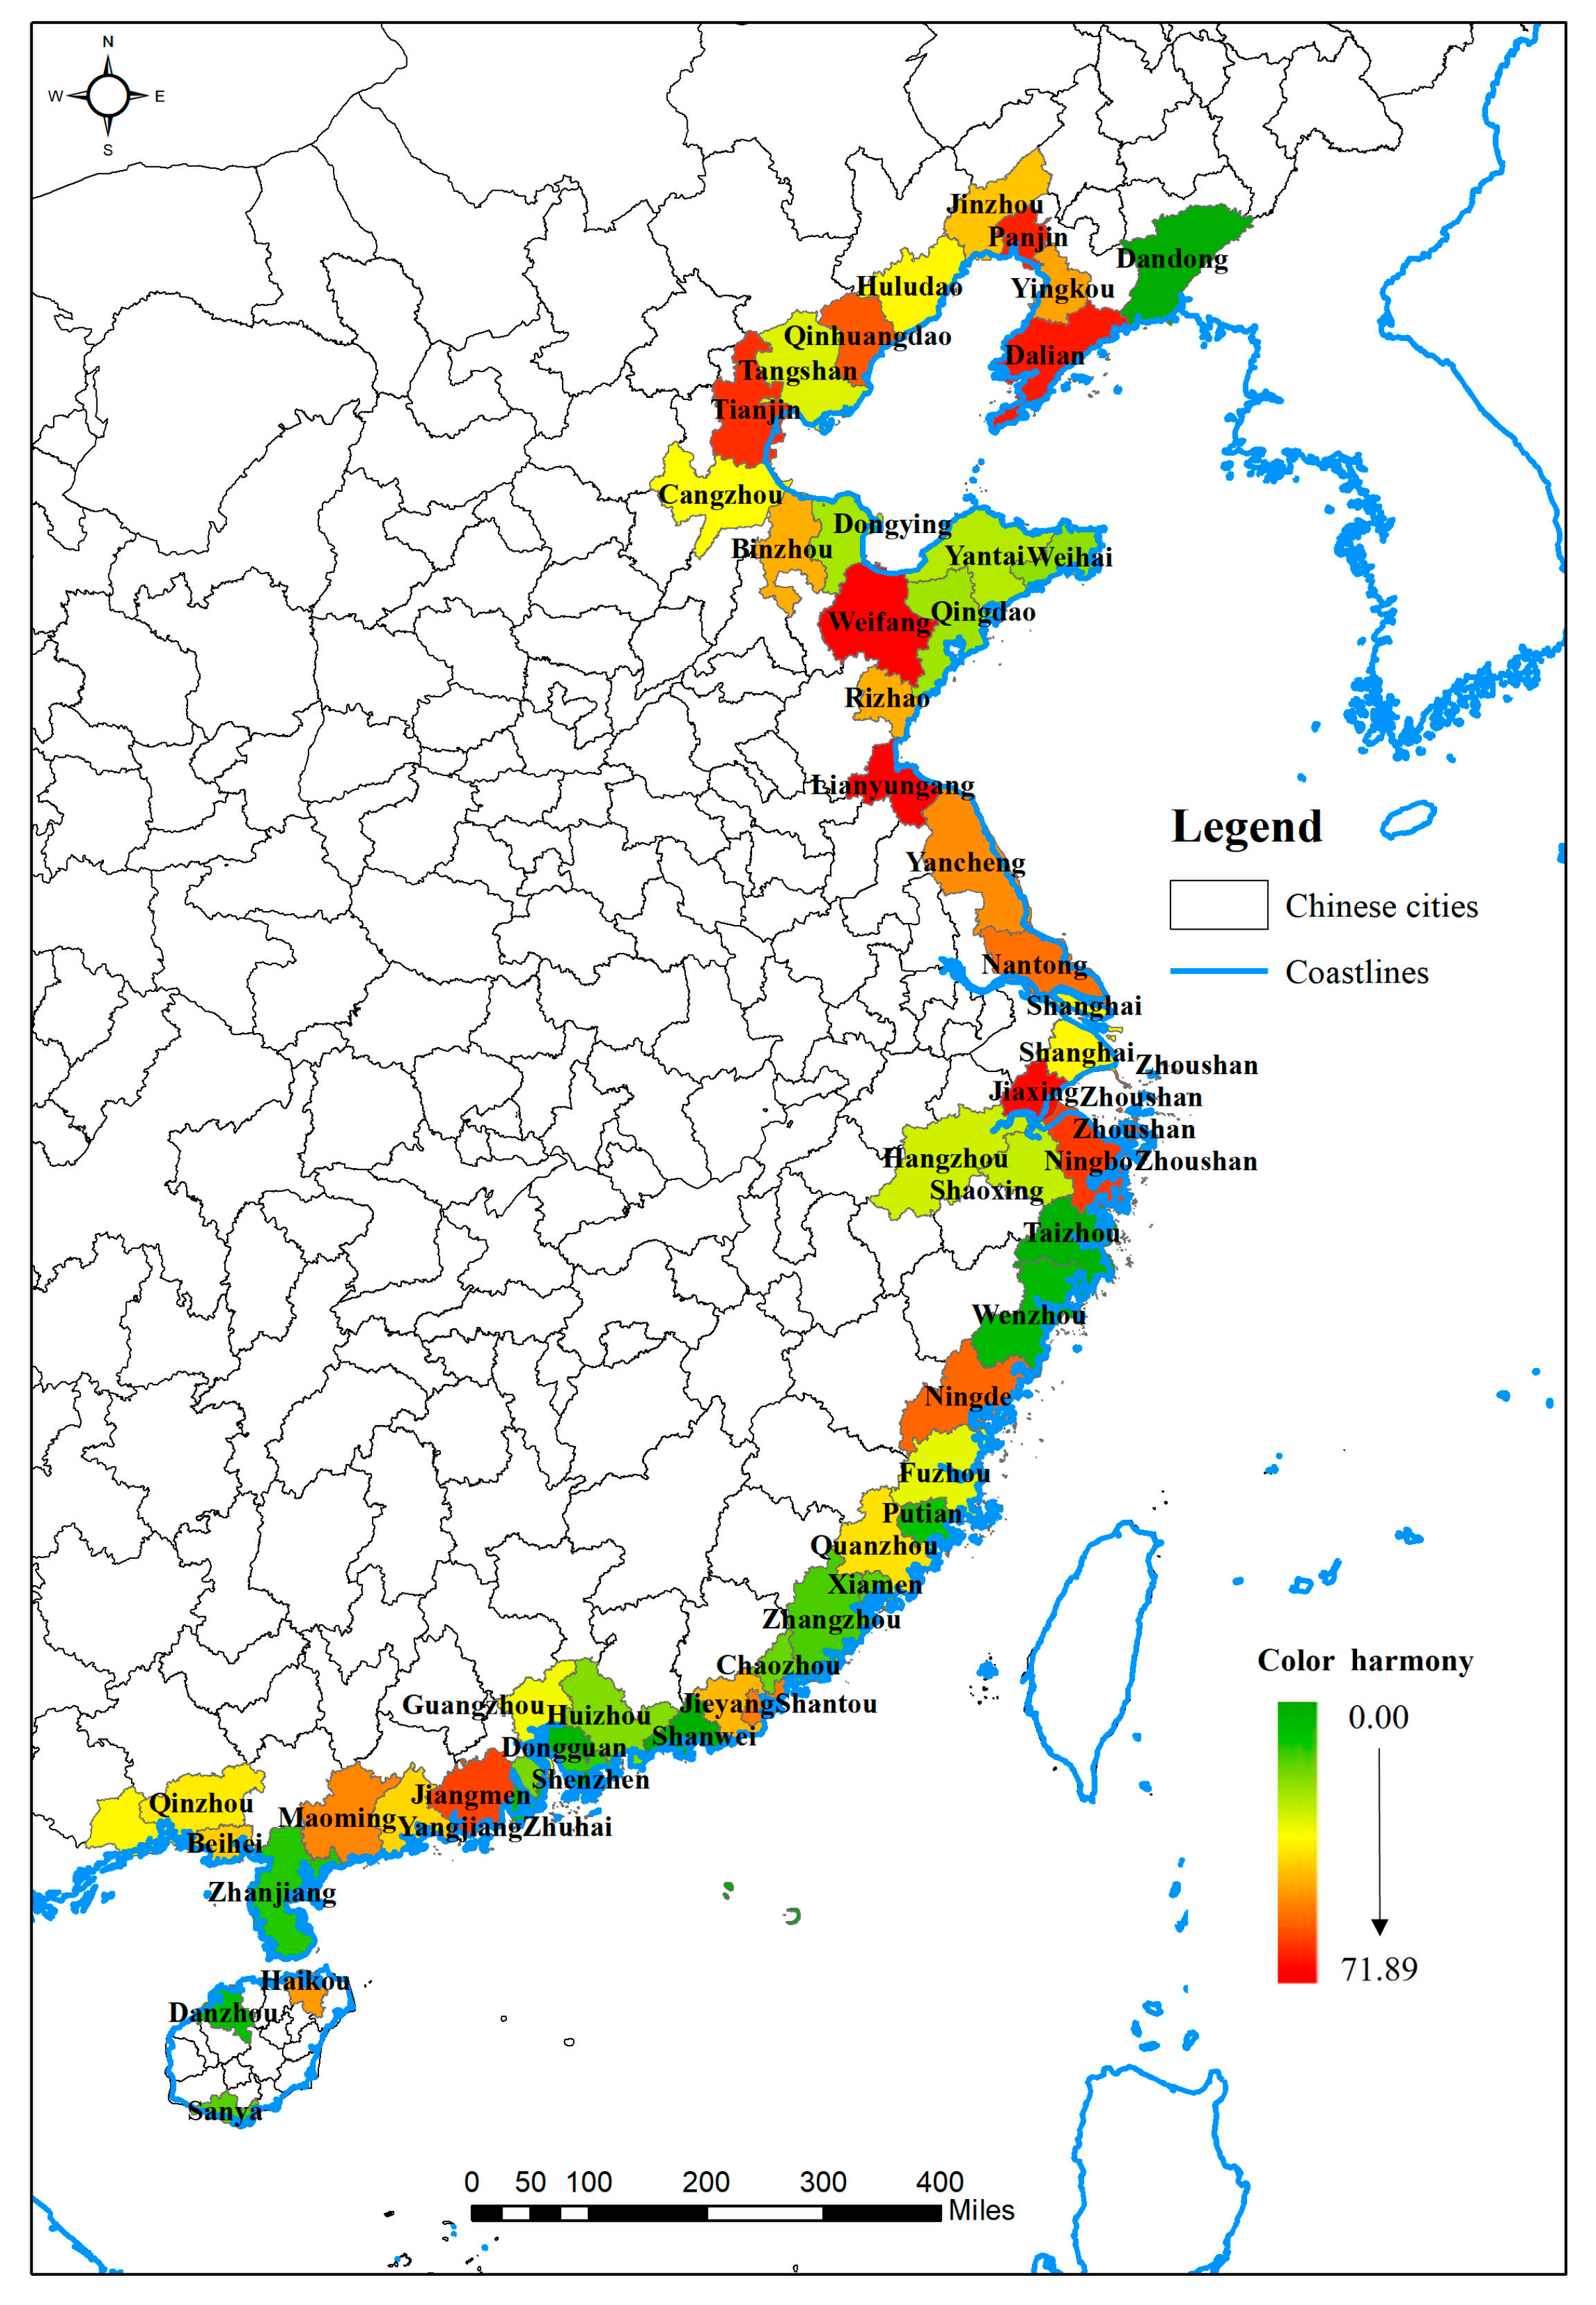
  • Wide spatial distribution. China’s coastal cities are distributed in a belt-like pattern (Figure 1), spanning from 18.36°N (Sanya) to 41.45°N (Jinzhou) and from 108.01°E (Fangchenggang) to 124.40°E (Dandong). They comprehensively cover tropical, subtropical, and temperate zones, making them ideal for analyzing spatial variations in FFC.
  • Complex natural and built environments. Coastal areas feature diverse ecosystems, including wetlands, estuaries, and mangroves. Proximity to the sea means factors like salt spray, humidity, and sea breezes significantly influence land surface colors and composition, giving these areas unique natural characteristics. Additionally, over 70% of China’s medium-to-large cities are located in coastal regions, which are more urbanized than other areas [23]. This combination of natural and urban landscapes makes coastal cities ideal for studying FFC complexity.
  • Thriving tourism industry. Coastal cities often rely heavily on tourism and leisure industries. Understanding their FFC can help analyze how colors influence tourist behavior and support decision-making in land use and landscape development.
More importantly, multi-city analysis can provide national-level references for the justification of results.

2.2. China’s Urban Built-Up Dataset

This study focused on the core areas of cities, as their FFC is more closely related to residents’ well-being and tourism development. The 2020 urban built-up area dataset for China, published by Sun et al. [24], was used to delineate these core areas. The dataset was constructed based on impervious surfaces extracted from Sentinel-1 and Sentinel-2 remote sensing data. By processing impervious surface layers and high-resolution Google Earth imagery, urban built-up areas were defined based on four principles: (1) minimum urban land area and distance between cities; (2) minimum mapping unit for urban land; (3) the inclusion of closely related suburban impervious areas; and (4) the inclusion of public permeable areas within cities. The final dataset covers 433 Chinese cities with populations over 300,000. Linear modeling with official 2020 statistical yearbook data showed a fitting accuracy (R2) of 0.82. The dataset can be acquired at http://csdata.org/p/675/3/ (accessed on 1 April 2024).

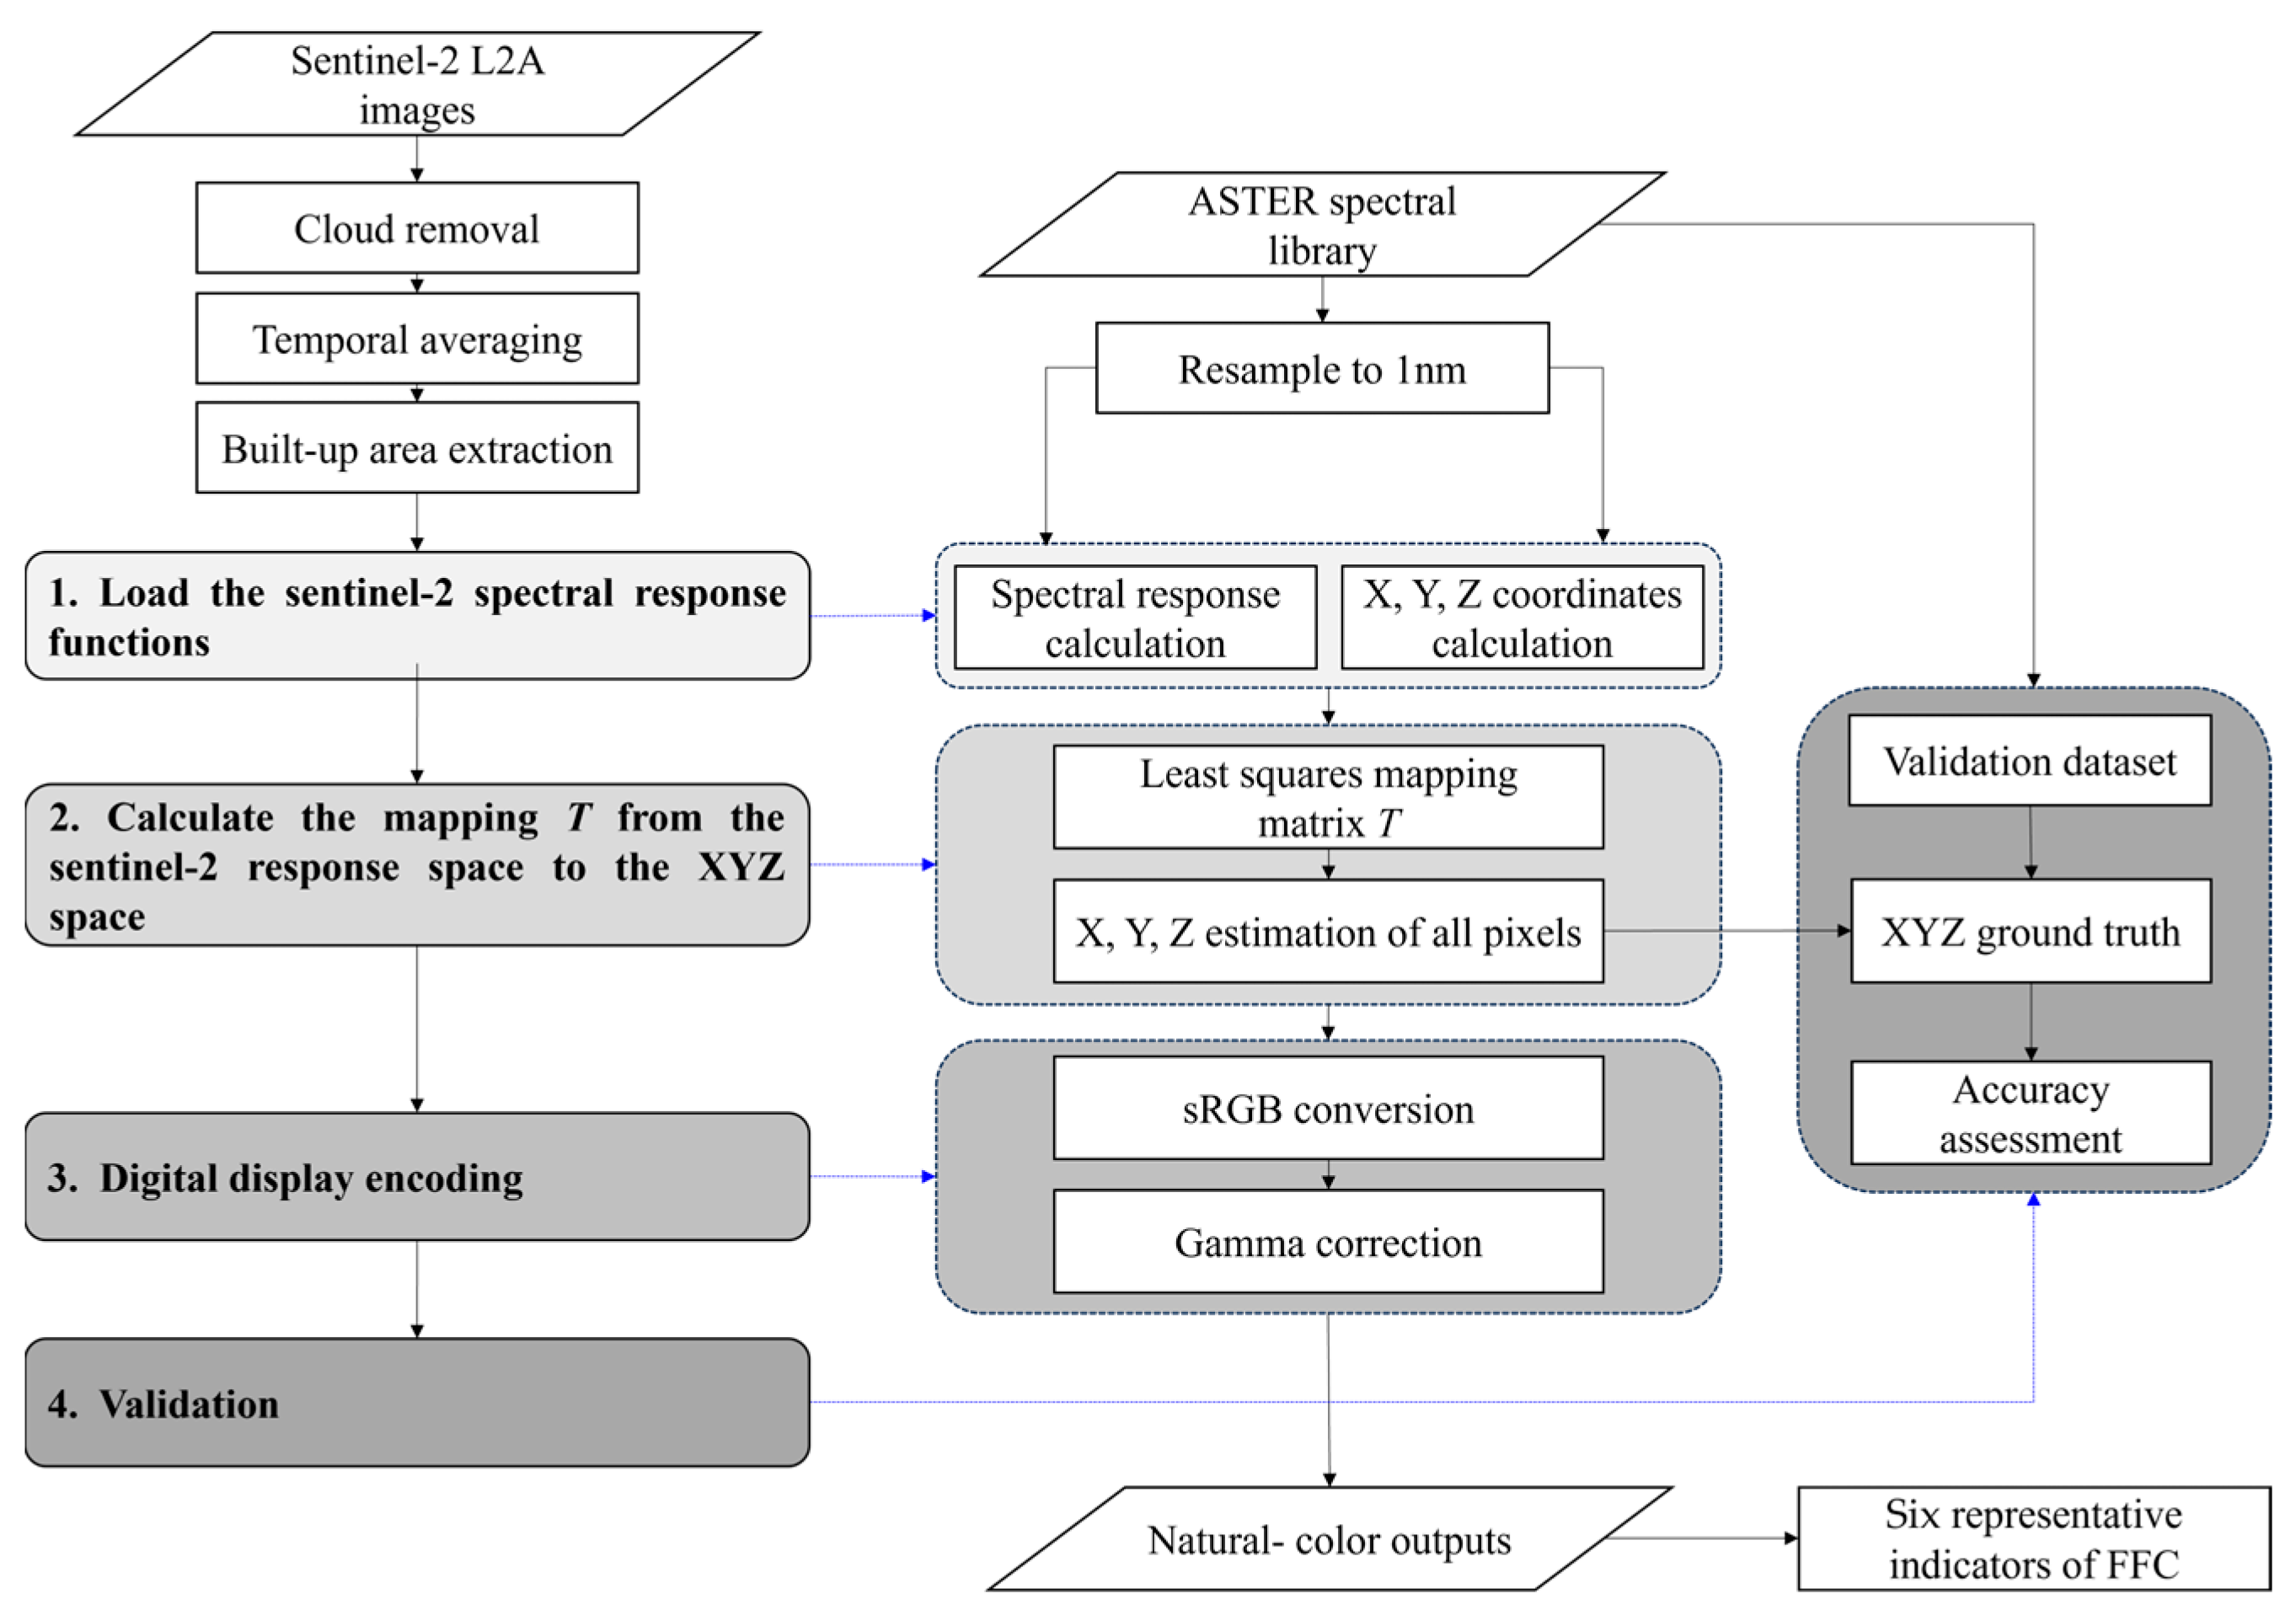
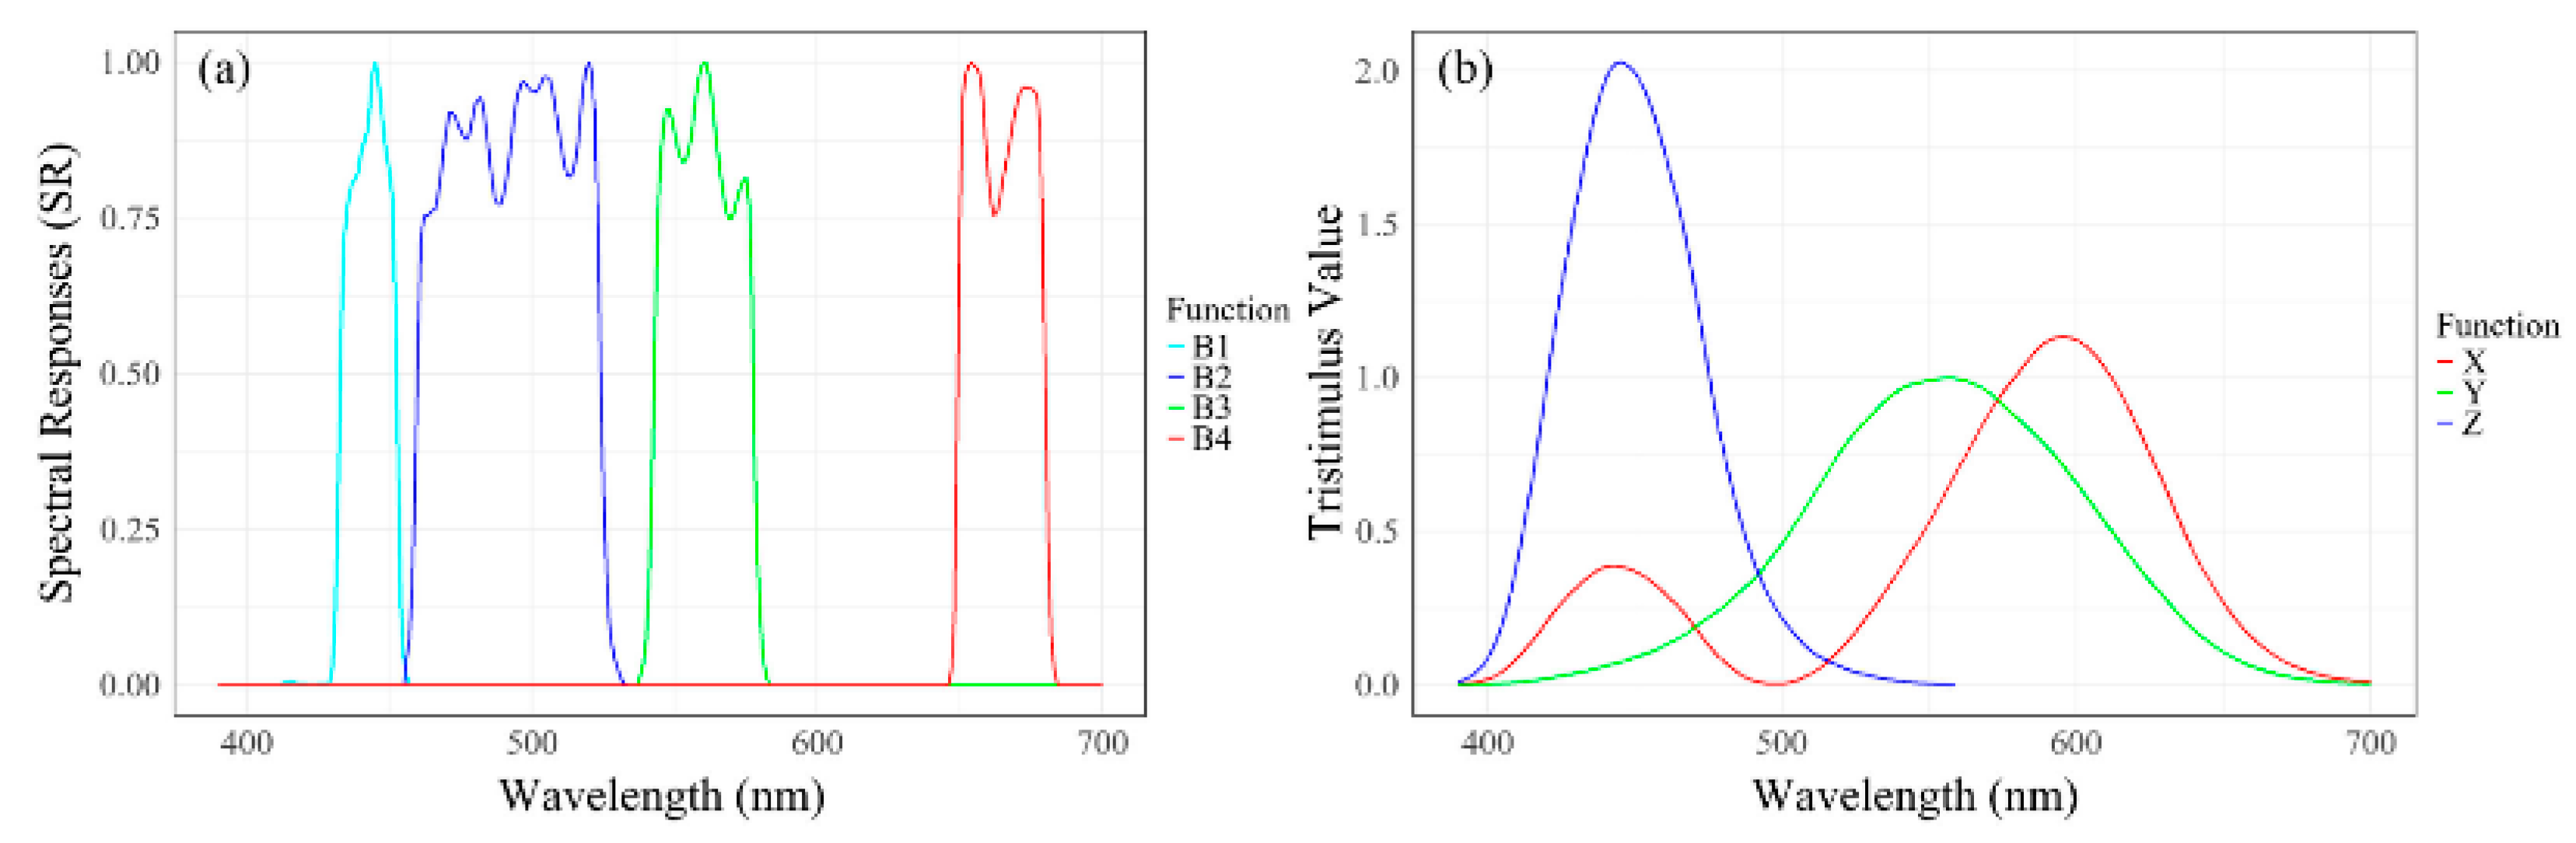
2.3. Natural Color Optimization Algorithm for Sentinel-2 Images

As mentioned above, true-color images often suffer from color distortion, since human eyes have nonlinear sensitivity to colors, being most sensitive to green, followed by red, and least sensitive to blue [25]. When spectral information captured by satellite sensors does not perfectly match human visual sensitivity, the direct combination of R, G, and B bands may cause oversaturated or unnatural colors. Additionally, atmospheric scattering and absorption affect these bands differently, with stronger scattering in the blue band (Rayleigh scattering) and less impact on red and near-infrared bands [26]. This can cause blue tones to appear washed out, while other colors, such as green vegetation and red deserts, appear more saturated. Therefore, the natural color optimization of satellite imagery is necessary to produce images that better align with human perception and support accurate FFC analysis.
This study used Sentinel-2 satellite imagery as the primary data source for FFC analysis, available at http://glovis.usgs.gov (accessed on 1 April 2024). Sentinel-2 is part of the EU’s Copernicus Program, launched by the European Space Agency (ESA) to provide high-resolution multispectral images for global environmental monitoring. The Sentinel-2 series includes Sentinel-2A (launched in 2015) and Sentinel-2B (launched in 2017), which together provide global coverage every five days, enabling frequent observations of land and coastal areas. It covers 13 bands, including visible, near-infrared, and shortwave infrared, with resolutions ranging from 10 to 60 m [27]. This allows the effective detection of various environmental elements, such as vegetation, water bodies, and atmospheric particles (Table 2).
The high-frequency, multispectral, and high-resolution Sentinel-2 image dataset not only enhances environmental monitoring accuracy but also lowers research and application barriers due to its free and open data policy, benefiting global research institutions, governments, and individual users. Therefore, Sentinel-2 data are the most suitable source for this study’s need for large-scale, fine-grained, multi-spectral analysis.
To align with the time of the urban built-up dataset, this study collected all Sentinel-2 Level-2A products from 2020 with less than 10% cloud cover for each city. This dataset comprises surface reflectance data generated through the atmospheric correction of raw Level-1C imagery, effectively removing atmospheric interference (e.g., aerosols, clouds, and water vapor) to enhance fidelity to ground-truth conditions. Given the frequent cloud and rain in coastal regions, 5–30 usable images were typically obtained per city. The acquired images underwent cloud removal and temporal averaging to produce stabilized high-quality inputs for subsequent color optimization.
Colors perceived by sensors or human eyes are typically represented using color space models. The CIE 1931 XYZ standard color space, established by the International Commission on Illumination (CIE) in 1931, was widely adopted early on [28]. This model quantifies the relationship between the electromagnetic spectrum of an object and the visual color perceived by humans, based on observers’ responses to color tests. The CIE 1931 XYZ color space has three stimulus values of X, Y, and Z, which correspond to sensitivity curves (XYZ color-matching functions, CMF) across different spectral ranges. These values do not directly represent specific colors but are used in linear combinations to describe the entire visible spectrum (approximately 390 nm to 700 nm). The X and Z components roughly relate to red and blue wavelengths, while the Y component represents luminance. In 1964, the CIE recognized that the CIE 1931 standard observer data were based on a 2° field of view, which is smaller than the typical viewing conditions in daily life. To address this, the CIE developed the “CIE 1964 standard colorimetric system (10° field of view)” to better accommodate color measurements in larger fields of view [29].
In previous studies, Sovdat et al. [21] proposed a method that approximates the fitting between satellite spectral bands and XYZ tristimulus values through a linear combination first, and then corrects the color by adjusting the hue angle in the xy plane projected from the CIE XYZ color space. This method has been proven to be highly accurate and operable, so the current study primarily referenced it for the pixel-by-pixel natural color correction of the acquired Sentinel-2 remote sensing images. The technical process is summarized in Figure 2.
1. Obtain Sentinel-2 spectral response functions. Each of the Sentinel-2 bands is characterized by spectral response functions provided in the Sentinel-2 documentation. These functions, when applied to radiance spectra, produce the spectral responses. The latest version of these functions (COPE-GSEG-EOPG-TN-15-0007-Sentinel-2 Spectral Response Functions 2024—4.0.xlsx) was obtained from the Sentinel-2 official website (https://sentiwiki.copernicus.eu/web/s2-mission, accessed on 1 April 2024) and plotted in Figure 3a.
2. Calculate the mapping f from the Sentinel-2 response space to the XYZ space. Here, a set of ground-measured spectral data (from the ASTER spectral library, http://speclib.jpl.nasa.gov, accessed on 1 April 2024) was used as a medium to calculate the respective Sentinel-2 responses and XYZ responses.
The ASTER spectral library provides over 2300 ground spectra [30]. Since the spectral resolution of ASTER is 2 nm, we resampled them to 1 nm resolution using linear interpolation. Let α 1 , α 2 , …, α n be the spectral reflectance sequences of n ground objects as ground-measured data. Each ground object is illuminated by the D65 standard light source, producing a series of spectral reflectance β 1 , β 2 , …, β n , where β i λ = D 65 λ · α i λ (CIE standard illuminant D65 data from CIE standard illuminant D65|CIE). Assuming the satellite sensor records the spectral reflectance of the ground object, its spectral response value in the j th band of the remote sensing image is as follows:
B ^ j β = 1 e j 0 e j λ β λ d λ
Here, λ represents the wavelength, and e j represents the spectral response function of the j th band of the Sentinel-2 image.
Similarly, the X, Y, and Z components of the ground object in the XYZ color space can be represented as follows:
X β = 1 0 D 65 λ y ¯ λ d λ 0 β λ x ¯ λ d λ
Y β = 1 0 D 65 λ y ¯ λ d λ 0 β λ y ¯ λ d λ
Z β = 1 0 D 65 λ y ¯ λ d λ 0 β λ z ¯ λ d λ
Here, x ¯ λ , y ¯ λ and z ¯ λ are the CIE 1964 color-matching functions under a 10-degree observer (Figure 3b), with data from CIE 1964 color-matching functions, 10 degree observer|CIE. For any given set of n ground object spectral reflectance sequences, their respective Sentinel-2 responses and XYZ component coordinates can be calculated as above, and then the linear mapping T from the spectral space to the XYZ space can be fitted by solving the following least squares problem:
T · B 1 β i B j β i = X β i Y β i Z β i
After determining the matrix T , the preprocessed Sentinel-2 images were subjected to pixel-by-pixel mapping to obtain the estimated XYZ values for each pixel.
3. Digital display encoding. Considering that remote sensing images and their derivatives are increasingly used on web platforms, it is necessary to further convert them into a color space suitable for electronic device display. Most digital encoding colors currently use the sRGB (Standard RGB, IEC 61966-2-2, 2003) color space, aiming to achieve color consistency across different devices [31,32].
To convert the XYZ vectors to sRGB, a transformation from the CIE XYZ color space to the linear sRGB color space is performed:
s R s G s B = E · X Y Z = E · T · B 1 B j
where E is the standard matrix defined by the CIE [31], with values of 3.2404542 1.5371385 0.4985314 0.9692660 1.8760108 0.0415560 0.0556434 0.2040259 1.0572252 . At this point, the linear adjustment of the original image spectral values was completed.
Next, a nonlinear adjustment function is needed to obtain 8-bit encoded sRGB values:
s R s G s B = δ s R δ s G δ s B
where the adjustment function δ L = 255 · 12.92 · L , L 0.0031308 255 · 1.055 · L 1 2.4 0.055 , L > 0.0031308 . Applying the nonlinear adjustment (also known as “gamma correction”) can produce brighter and less saturated output images, which is more consistent with human color perception on platforms.
4. Validation. A total of 653 sets of spectral measurements of ground objects within the visible spectrum range (390–700 nm) were randomly selected from the ASTER database as validation data. The XYZ coordinates estimated by Sentinel-2 spectra were linearly fitted with the real XYZ coordinates calculated by the xyz CMFs. The results showed that the R2 for X, Y, and Z were 0.996, 0.997, and 0.985, respectively (Figure 4a), with a root mean square error (RMSE) of 1.77 ± 1.12 (Figure 4b), indicating that the estimated results were of high accuracy.

2.4. Characteristic Indicators of FFC

This study described the FFC of coastal urban built-up areas using four dimensions: dominant colors, hue–saturation–value (HSV), color richness, and color harmony, aiming to comprehensively understand characteristics of urban FFC.

2.4.1. Dominant Colors

Dominant colors are the most frequent and largest-area colors in urban exteriors, representing a city’s typical color traits. This study used clustering algorithms to extract dominant colors from Sentinel-2 natural-color products. Generally, K-Means is the most common clustering algorithm. It is based on partitional clustering, with the principle of initializing K cluster centers and assigning samples to clusters based on the distance between samples and centers, iteratively achieving the goal of minimizing the distance between samples and their assigned cluster centers [33].
Considering that pixel-by-pixel RGB clustering on 10-m resolution remote sensing images requires significant computational power, this study adopted the mini-batch K-means clustering method for efficiency. This algorithm is an optimized variant of the K-means algorithm. Through using small-scale random data subsets as training data in each iteration and optimizing the objective function, it can reduce the convergence time of the K-means algorithm while ensuring accuracy [34]. The algorithm was set to extract 20 dominant colors and stop after 10 iterations in this study.

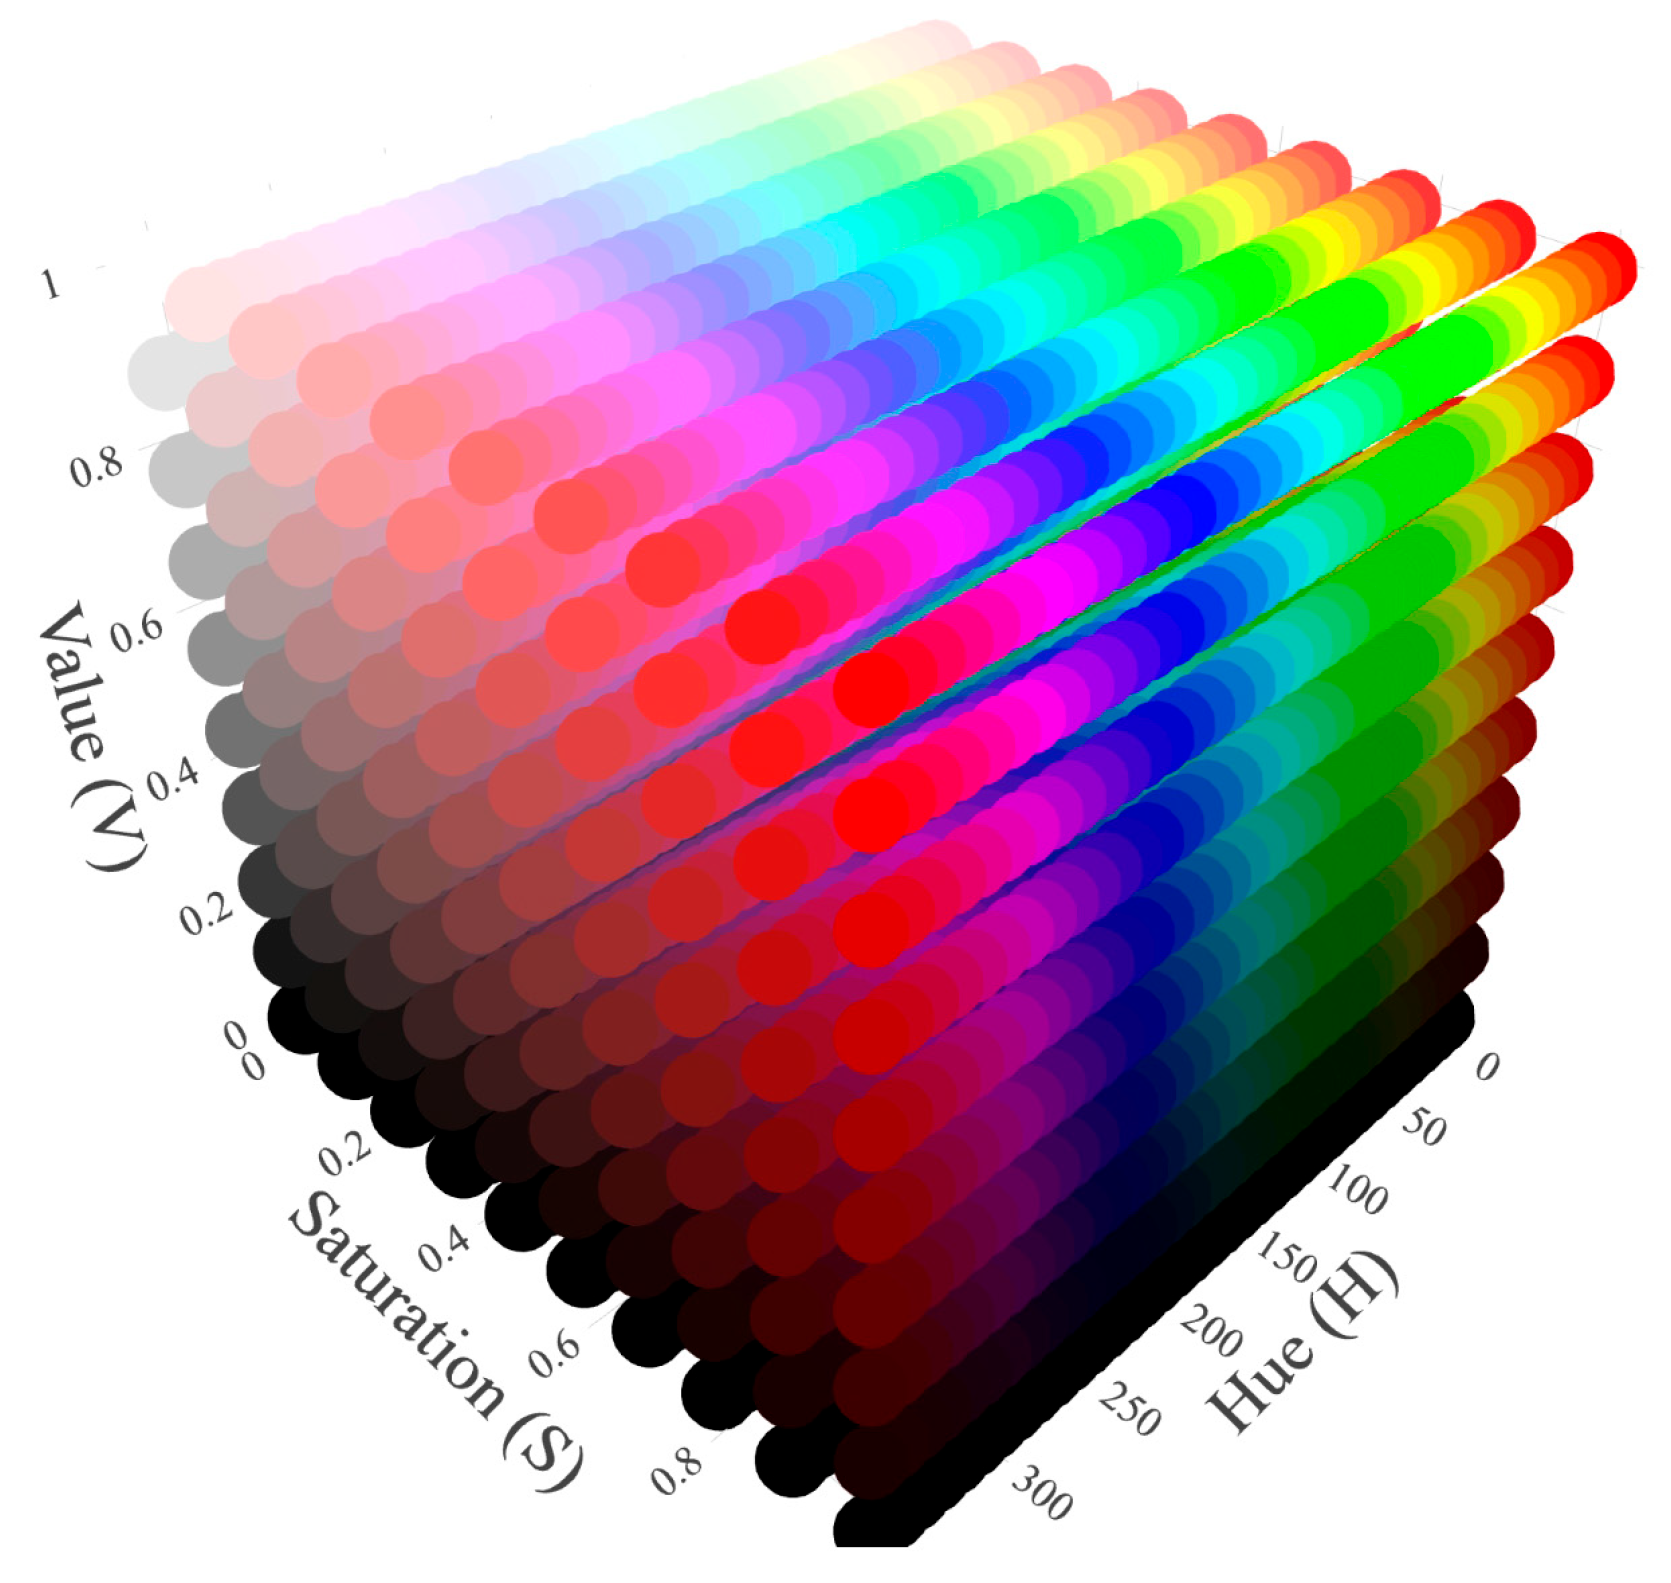
2.4.2. HSV Color Space

Color is a visual byproduct of the spectrum, as it is either transmitted through a transparent medium or absorbed and reflected by a surface [35]. Essentially, color is the wavelength of light received and processed by the human eye from a reflective source. According to classical color theory, color can be described using three elements (Figure 5): hue, saturation, and value (collectively known as the “HSV color space”) [36].
Hue is the fundamental attribute of color, determined by the dominant wavelength of the object’s spectrum. It describes the most easily perceived dimension of color when observed, such as red, green, or blue. Hue is represented by an angle ranging from 0° to 360° in the HSV color space, with specific colors determined by their position on the color wheel. For example, 0° represents red, 120° represents green, and 240° represents blue.
Saturation represents the purity of a color, indicating the amount of gray mixed into the color. When saturation is 0, the color has no hue and appears gray, while when saturation is 100% (or 1), the color is pure and contains no gray.
Value represents the amount of reflected light, indicating the brightness or darkness of a color. A value of 0 represents pure black, while 100% (or 1) represents the brightest color. Higher values result in brighter/lighter colors, while lower values result in darker/deeper colors.
Hue, saturation, and value can be calculated from the [sR, sG, sB] values of the Sentinel-2 natural-color product using Formulas (8) to (10):
H u e = 0 ° , m a x = m i n 60 ° × s G s B m a x m i n + 0 ° ,   m a x = s R   a n d   s G s B   60 ° × s G s B m a x m i n + 360 ° , m a x = s R   a n d   s G < s B 60 ° × s B s R m a x m i n + 120 ° , m a x = s G 60 ° × s R s G m a x m i n + 240 ° , m a x = s B
S a t u r a t i o n = 0 ,                                                                                     m a x = 0 m a x m i n m a x = 1 m i n m a x ,   o t h e r w i s e
Value   =   max

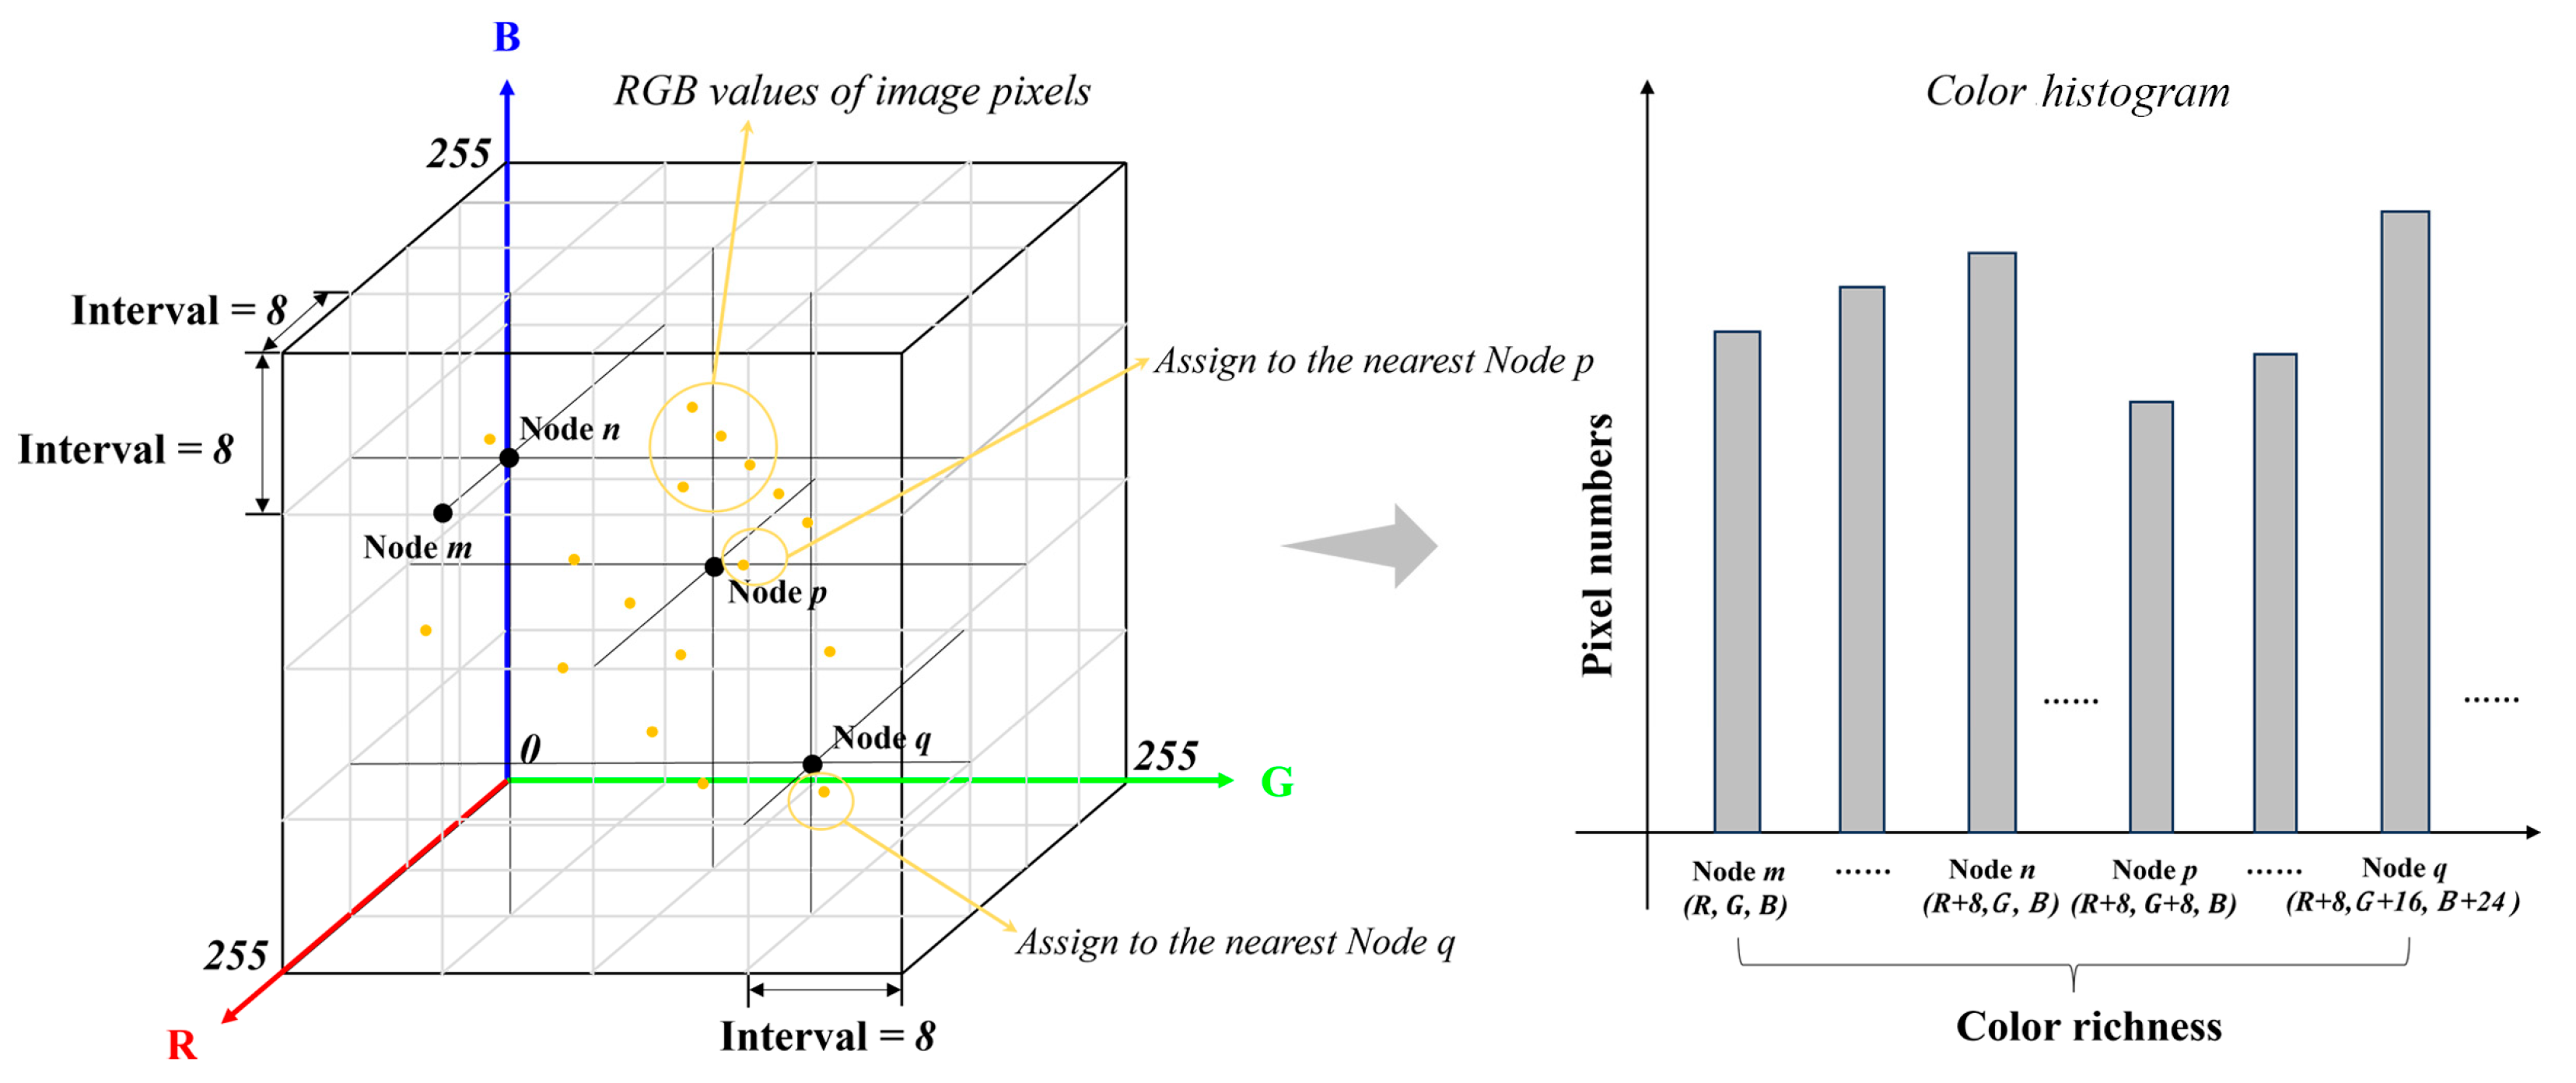
2.4.3. Color Richness

The color richness index was designed to describe the FFC diversity by constructing a color histogram. This involves dividing the RGB values of all pixels in a city into several color spaces and then counting the frequency of colors in each interval. If the colors are distributed across more intervals, the color richness is considered higher. The calculation steps are as follows (Figure 6):
Step 1: Construct a three-dimensional RGB color space (R ∈ [0, 255], G ∈ [0, 255], B ∈ [0, 255]), and divide the R, G, and B channels into intervals of 8. The intersection points of these intervals are referred to as “Nodes”.
Step 2: Assign the RGB values of all pixels to the nearest node. For example, if a pixel has an RGB value of (55, 64, 88), it is assigned to the node (55, 63, 87).
Step 3: Construct a color histogram by counting the number of pixels at each node. The number of nodes with non-zero pixel counts is used as the color richness index. A higher value of this index indicates greater color richness.

2.4.4. Color Harmony

Based on the model proposed by Ou and Luo [37], color harmony can be measured by comprehensively evaluating hue harmony, saturation balance, and value balance. Therefore, this study attempted to calculate the harmony of the dominant colors in urban FFC by the following formula:
C o l o r   H a r m o n y = H u e   H a r m o n y w 1 + S a t u r a t i o n   B a l a n c e w 2 + V a l u e   B a l a n c e w 3
Here, H u e   H a r m o n y represents the hue matching degree of pixels. According to traditional color theory, complementary or similar colors have the highest hue matching degree (judgment statements in the code: if |hue_difference-180| < 30 (complementary) or |hue_difference| < 30 (similar), H u e   H a r m o n y = H u e   H a r m o n y + 1 ) [38].
S a t u r a t i o n   B a l a n c e represents the saturation difference of pixels, with smaller differences resulting in higher values (judgment statements in the code: if |saturation_difference | < 0.1, S a t u r a t i o n   B a l a n c e = S a t u r a t i o n   B a l a n c e + 1 ).
V a l u e   B a l a n c e represents the value difference of pixels, with smaller differences resulting in higher values (judgment statements in the code: if |value_difference | < 0.1, V a l u e   B a l a n c e = V a l u e   B a l a n c e + 1 ).
w 1 , w 2 , and w 3 represent the contributions of hue, saturation, and value to color harmony, respectively. Based on previous experimental literature, these are set to 0.6, 0.2, and 0.2 in this study [39].

3. Results

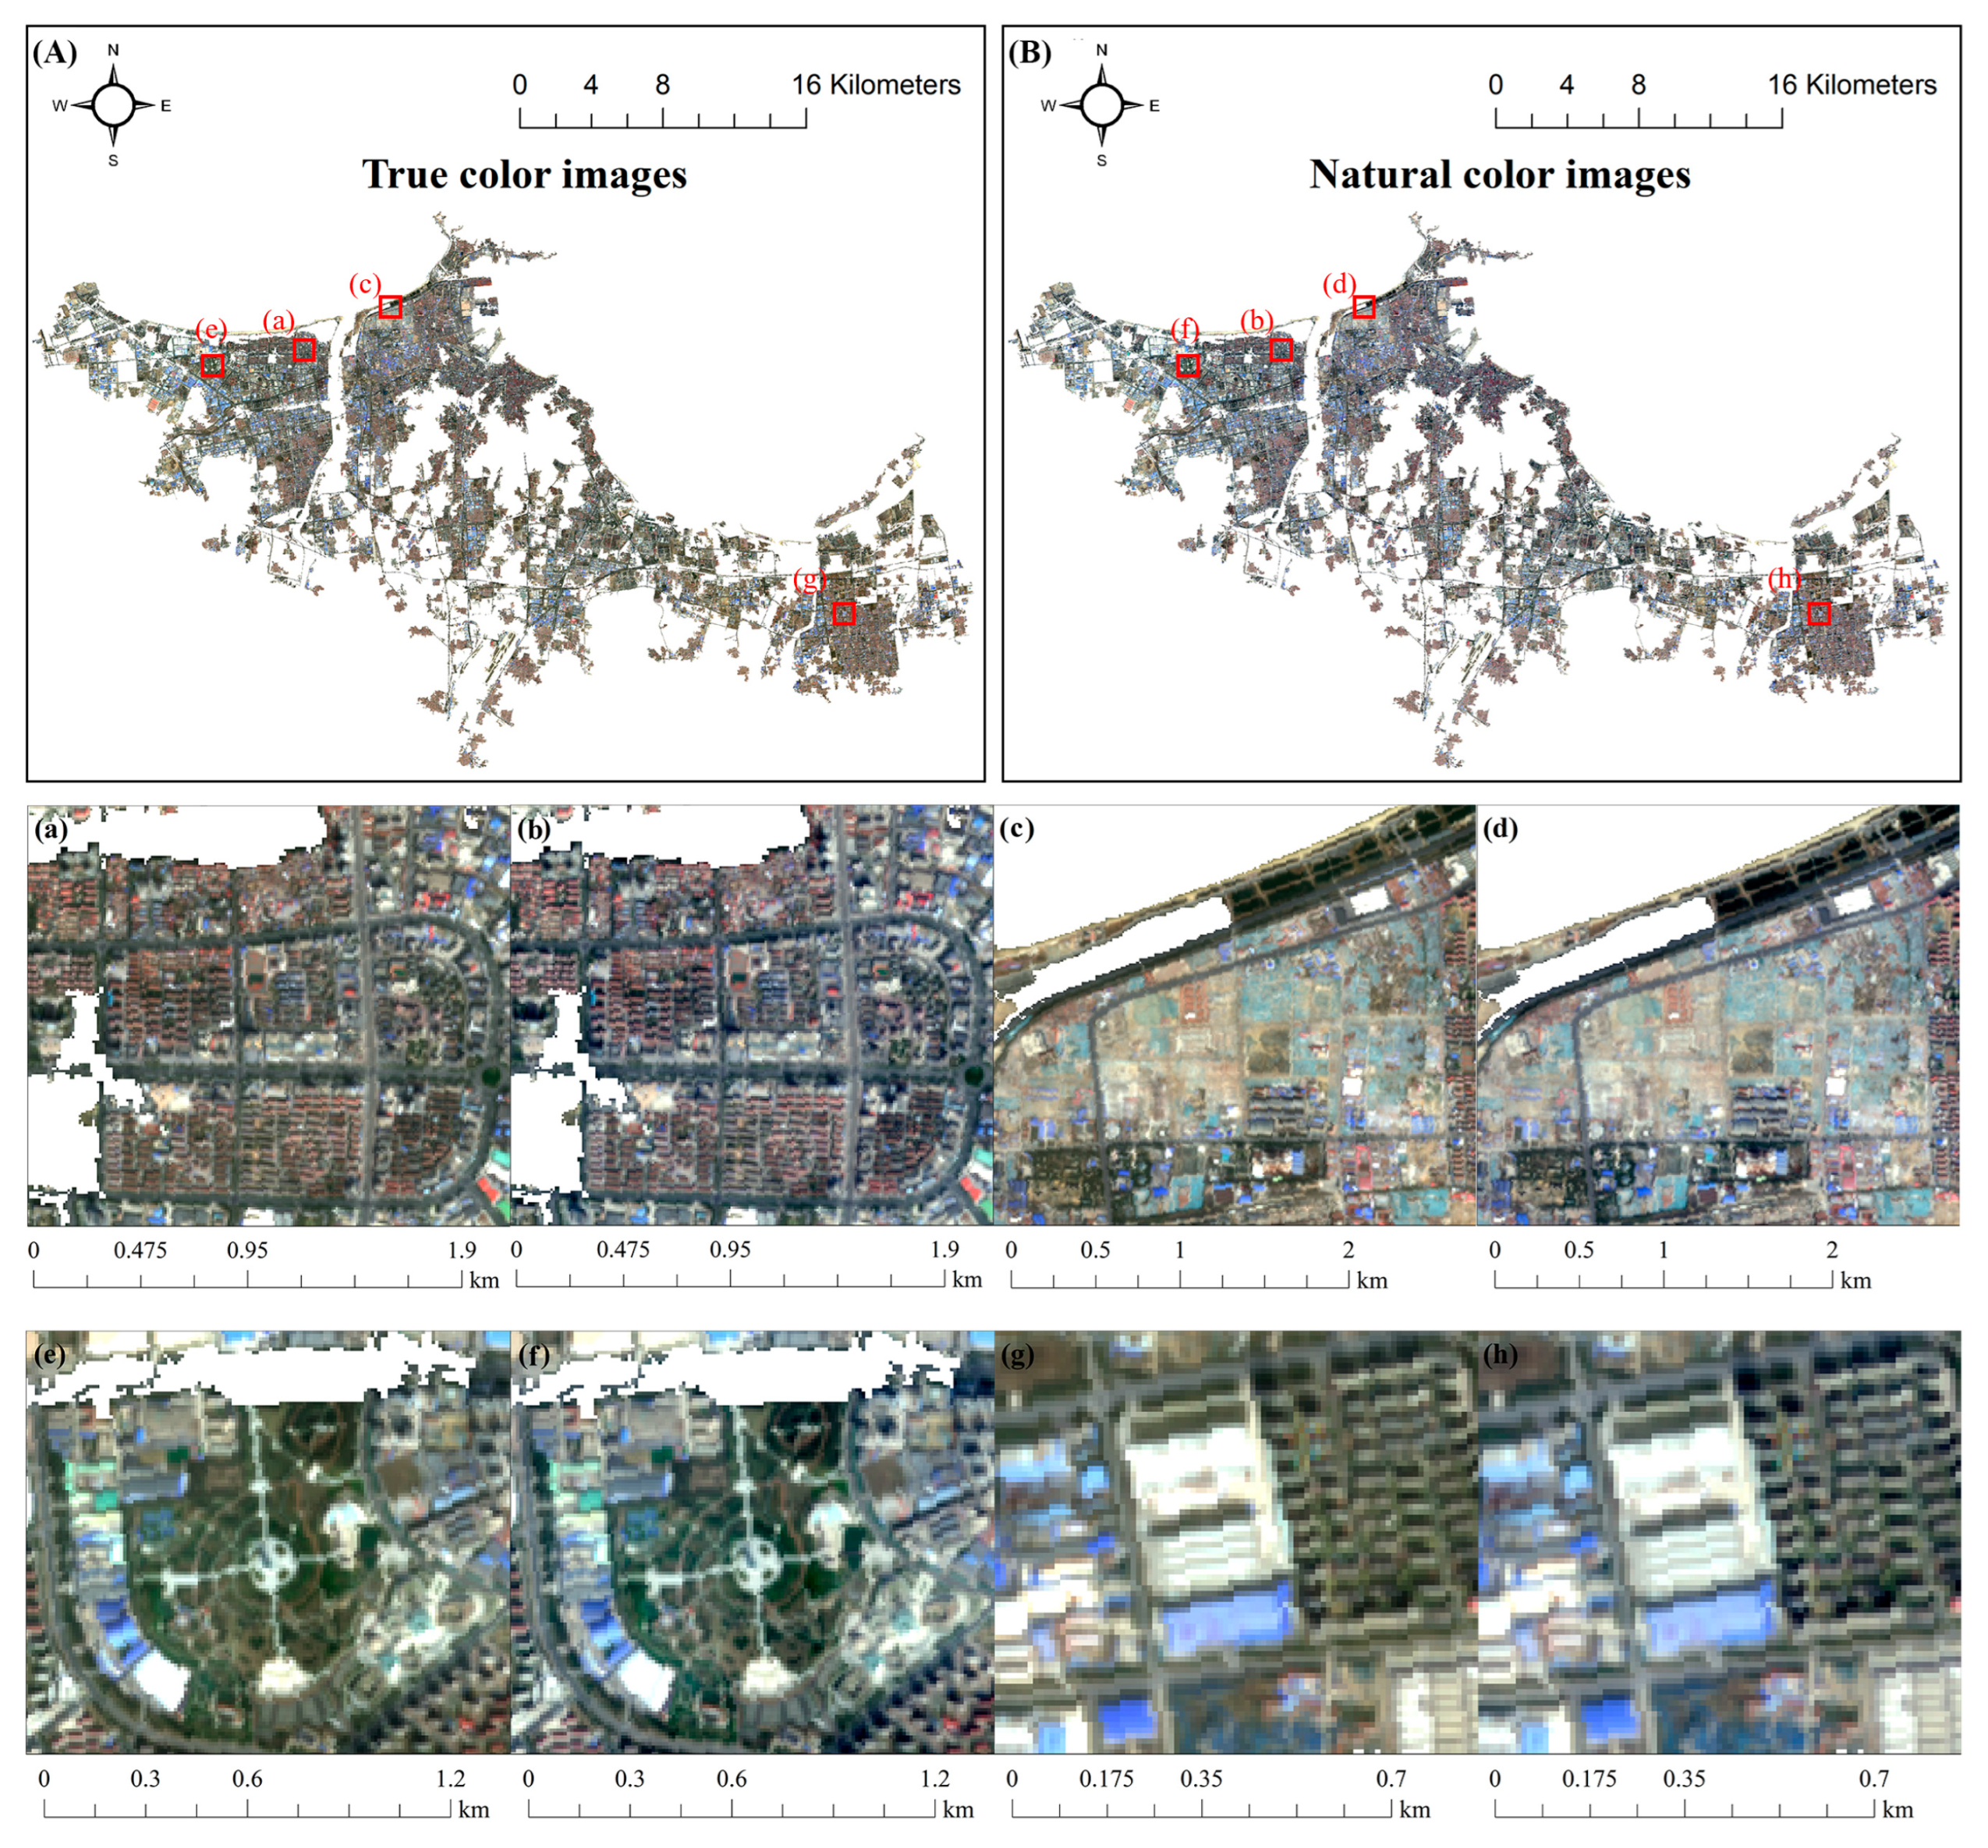
3.1. True-Color Composite Remote Sensing Images vs. Optimized Natural-Color Products

Figure 7 takes a southern Chinese coastal city (Zhuhai) as an example to compare the true-color image (Figure 7A) and the optimized natural-color product (Figure 7B) from Sentinel-2 satellite, with zoom-in comparative analysis conducted on randomly selected representative landscape features (Figure 7a–h). It can be seen that the true-color image has some noticeable color distortions. First, it presents a deep and dark visual effect, which may obscure details. In Figure 7a,e, building clusters blend almost seamlessly with dark green vegetation. Second, the true-color image has high saturation. In Figure 7c, bare land appears almost orange-red, which deviates significantly from the actual color of undeveloped land as perceived by the human eye. Similar color deviations are often observed in true-color remote sensing images of desert areas. Third, white objects in the true-color image, due to their high reflectivity, lose spectral and texture information. In Figure 7g, the lines on the white roofs of buildings are severely blurred. In this study, these distortion issues are effectively resolved in the optimized natural-color product, as shown in the details in Figure 7b,d,f,h.
Similarly, Figure 8 shows the true-color Sentinel-2 image and the natural-color product of another northern Chinese coastal city (Yantai). From the overall distribution and detailed views, the true-color image of this city has an overall yellowish-green tone. Buildings, roads, and vegetation in the image exhibit colors that do not align with common perceptions. The natural-color product developed in this study effectively corrects this tonal deviation, as shown in the details in Figure 8b,d,f,h.
The color distortion in true-color images is influenced by various external factors such as solar elevation angle, lighting conditions, cloud thickness, aerosol scattering, terrain, and humidity. Therefore, the types of color distortion in true-color images of southern and northern cities differ. Figure 7 and Figure 8 analyzed the typical characteristics of two types of color distortion using Zhuhai and Yantai as examples.
The natural-color product developed in this study applies a series of linear and nonlinear adjustments to the true-color remote sensing image, increasing brightness, reducing saturation, and eliminating severe color casts. This color optimization of remote sensing images is similar to applying filters to photos taken with a phone or camera. As a result, the optimized natural-color products showed clearer boundaries and more human-eye-perceived colors for buildings, roads, vegetation, and other landscapes.

3.2. Typical Characteristics of Fifth Facade Colors (FFCs) in China’s Coastal Cities

3.2.1. Dominant Colors

Using the mini-batch K-means algorithm, a pixel-by-pixel clustering of RGB values in natural-color images was performed to extract the dominant FFCs (i.e., the top 20 FFCs in terms of area share) for each coastal city in China (Figure 9, Table S1). A visual comparison between the natural-color images and their corresponding dominant colors shows that the accuracy of the clustering algorithm is satisfactory. From the composition and proportions of colors in the pie charts, it is evident that the FFCs of almost all urban built-up areas are dominated by gray, black, and brown tones, reflecting the high urbanization of China’s coastal cities. Steel, cement, and concrete have created a modern urban aesthetic characterized by neutral colors.
Despite the significant artificial transformation of urban surfaces, differences in natural conditions, economic structures, and cultural environments have laid the foundation for the uniqueness of urban FFCs. For instance, many industrially developed cities (e.g., Qinhuangdao, Tianjin, Dalian, Weihai, Qingdao, Yancheng, Nantong, Guangzhou, and Fangchenggang) exhibit blue tones in their FFCs, typically due to PVC anti-corrosion roofing on factories (Figure 10a–d). This material is resistant to chemical corrosion and is widely used in coastal cities with severe salt spray erosion. Additionally, blue helps reflect solar heat, reducing indoor temperatures in high-temperature environments, thereby saving energy and preventing fires. Moreover, some cities (e.g., Cangzhou, Dandong, Qingdao, and Quanzhou) feature red tones in their FFCs, mainly from traditional red-brick roofs in local villages, symbolizing regional cultural identity (Figure 10e–h).
From the spatial distribution shown in Figure 9, the dominant FFCs of cities in different regions display distinct regional characteristics and clustering patterns. Northern coastal cities feature grays that are neutral or slightly warm, creating a soft and warm tone. These cities have a more subdued style, reflecting historical depth or a low-key atmosphere. Eastern coastal cities include purplish-gray and bluish-gray tones, adding elegance and warmth. Their style tends to be softer, more refined, and artistic, suitable for expressing cultural heritage or poetic ambiance. Southern coastal cities also feature gray tones, but with a more even distribution of shades. Compared to northern and eastern cities, their grays are cooler, conveying a modern and minimalist feel. The overall style reflects the cool and elegant atmosphere of coastal cities. This study acquired some drone aerial images of representative cities for clearer and more intuitive observation (Figure 11).

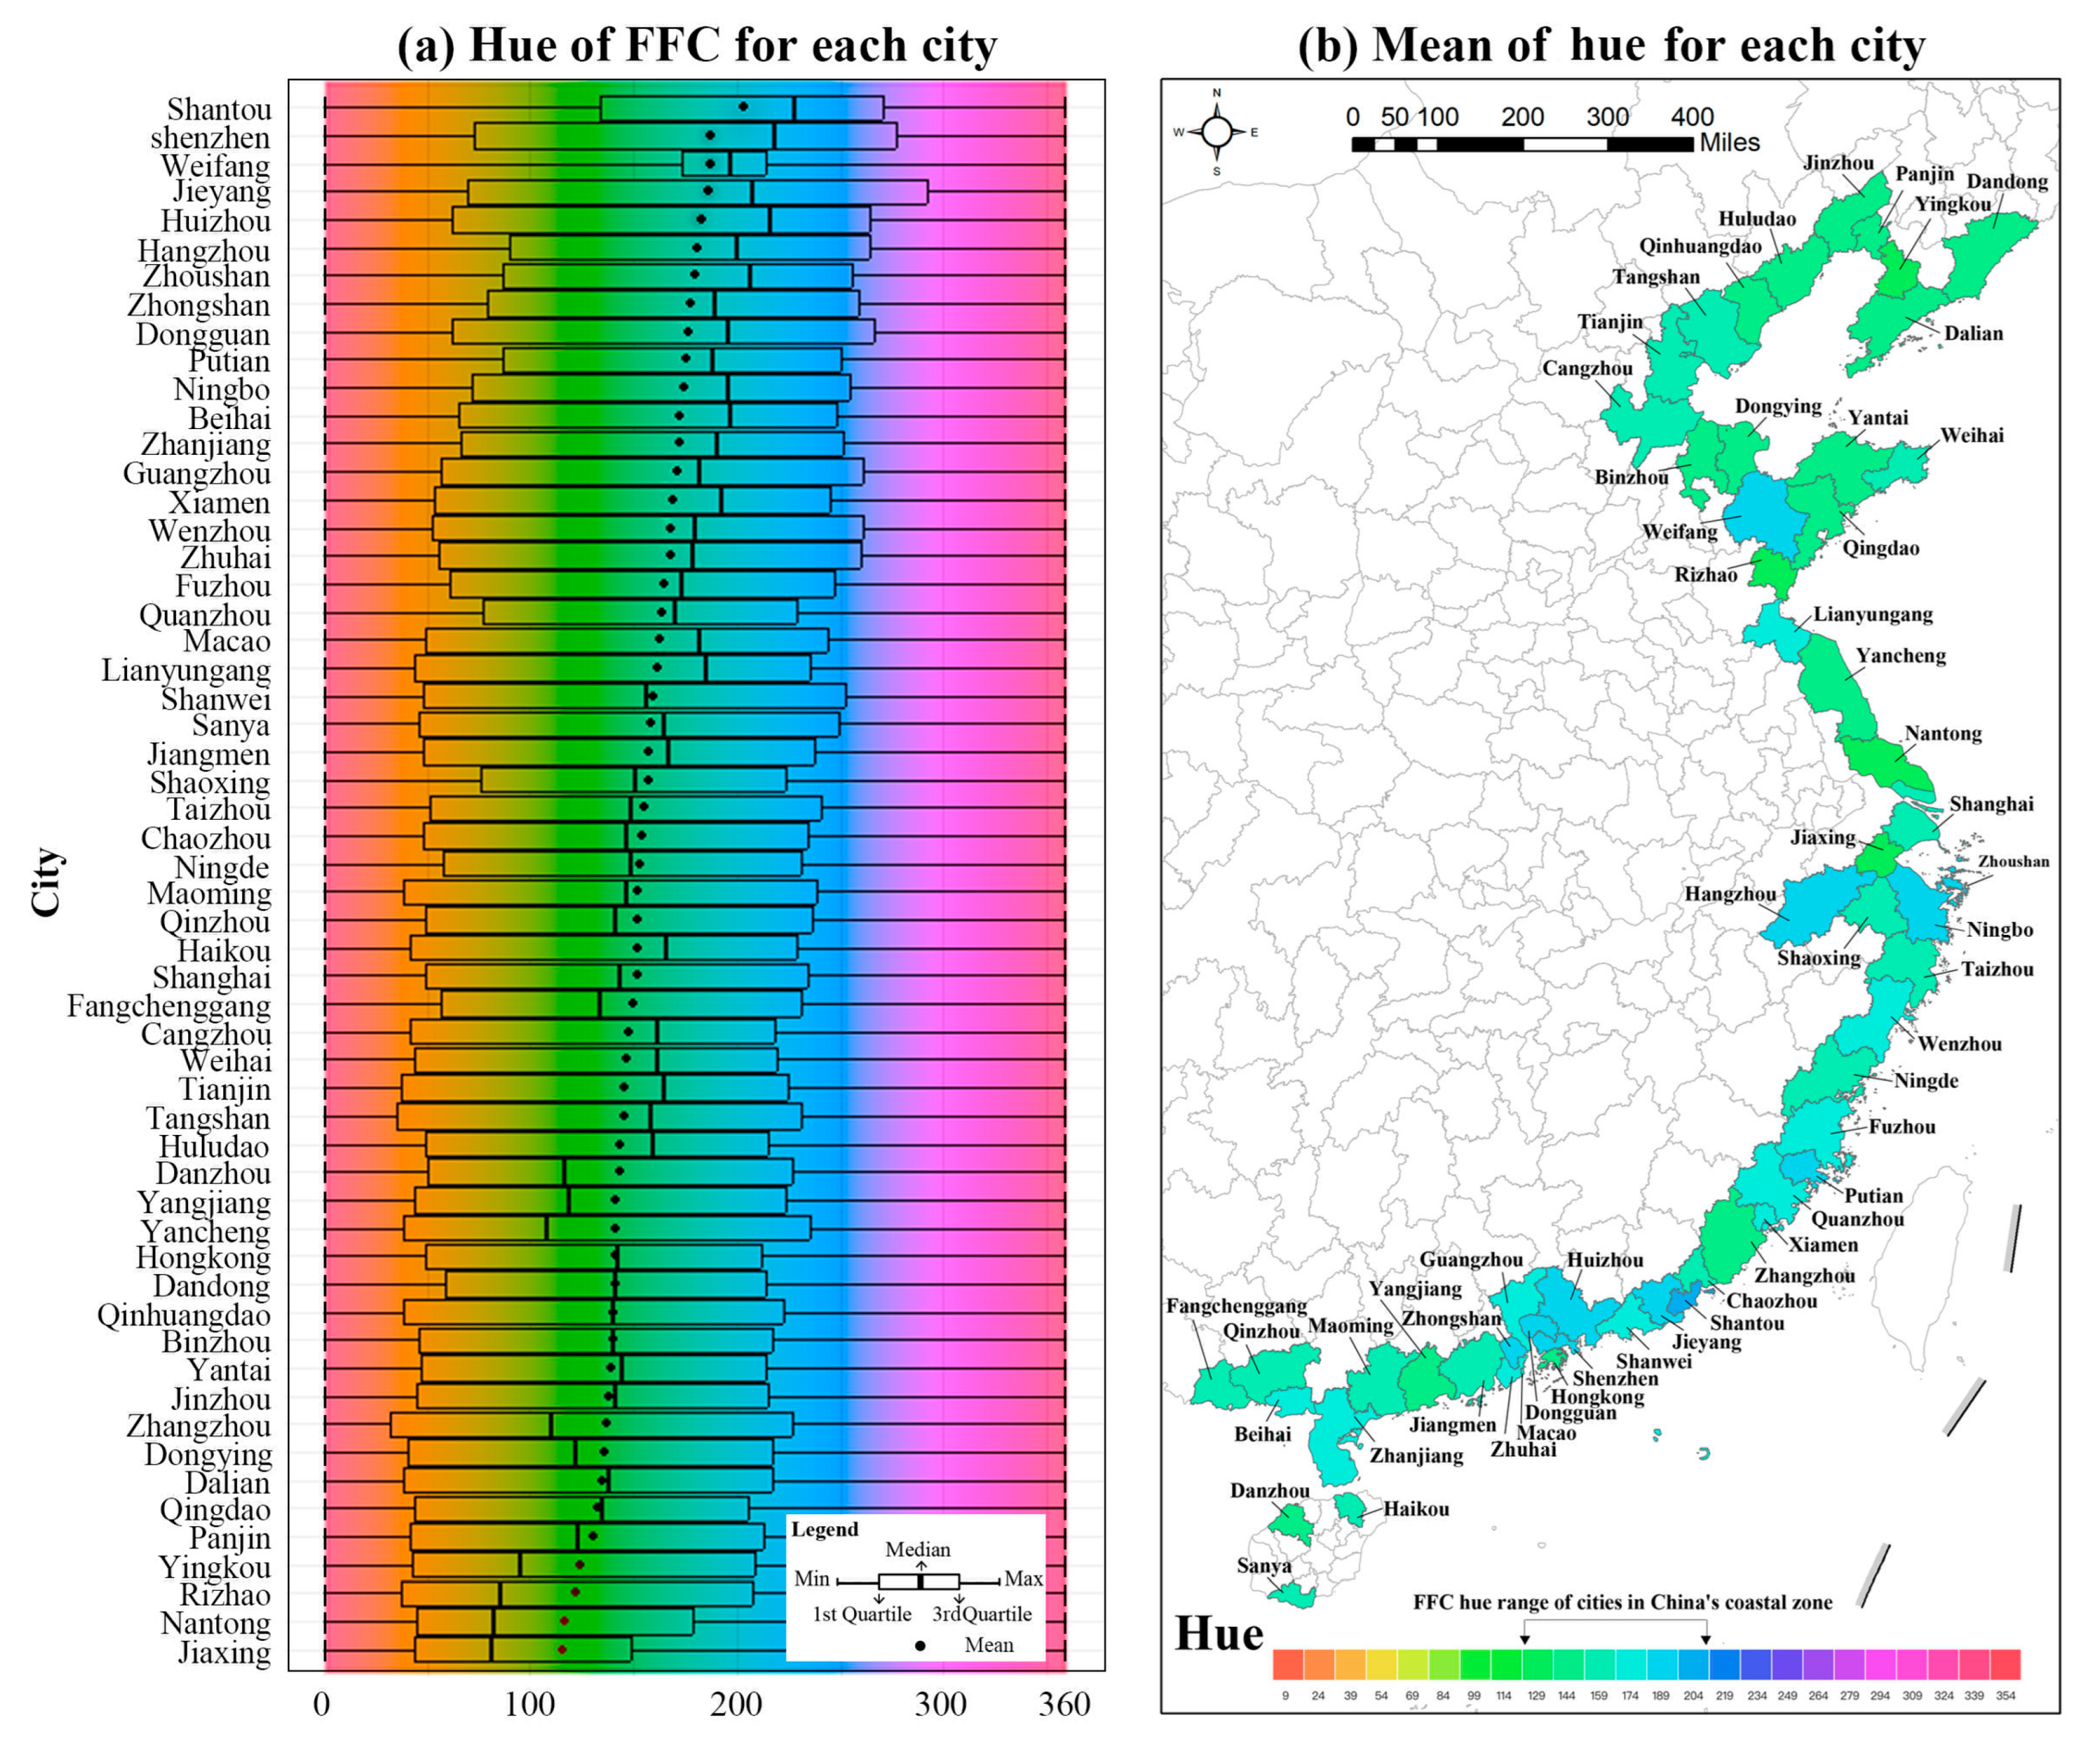
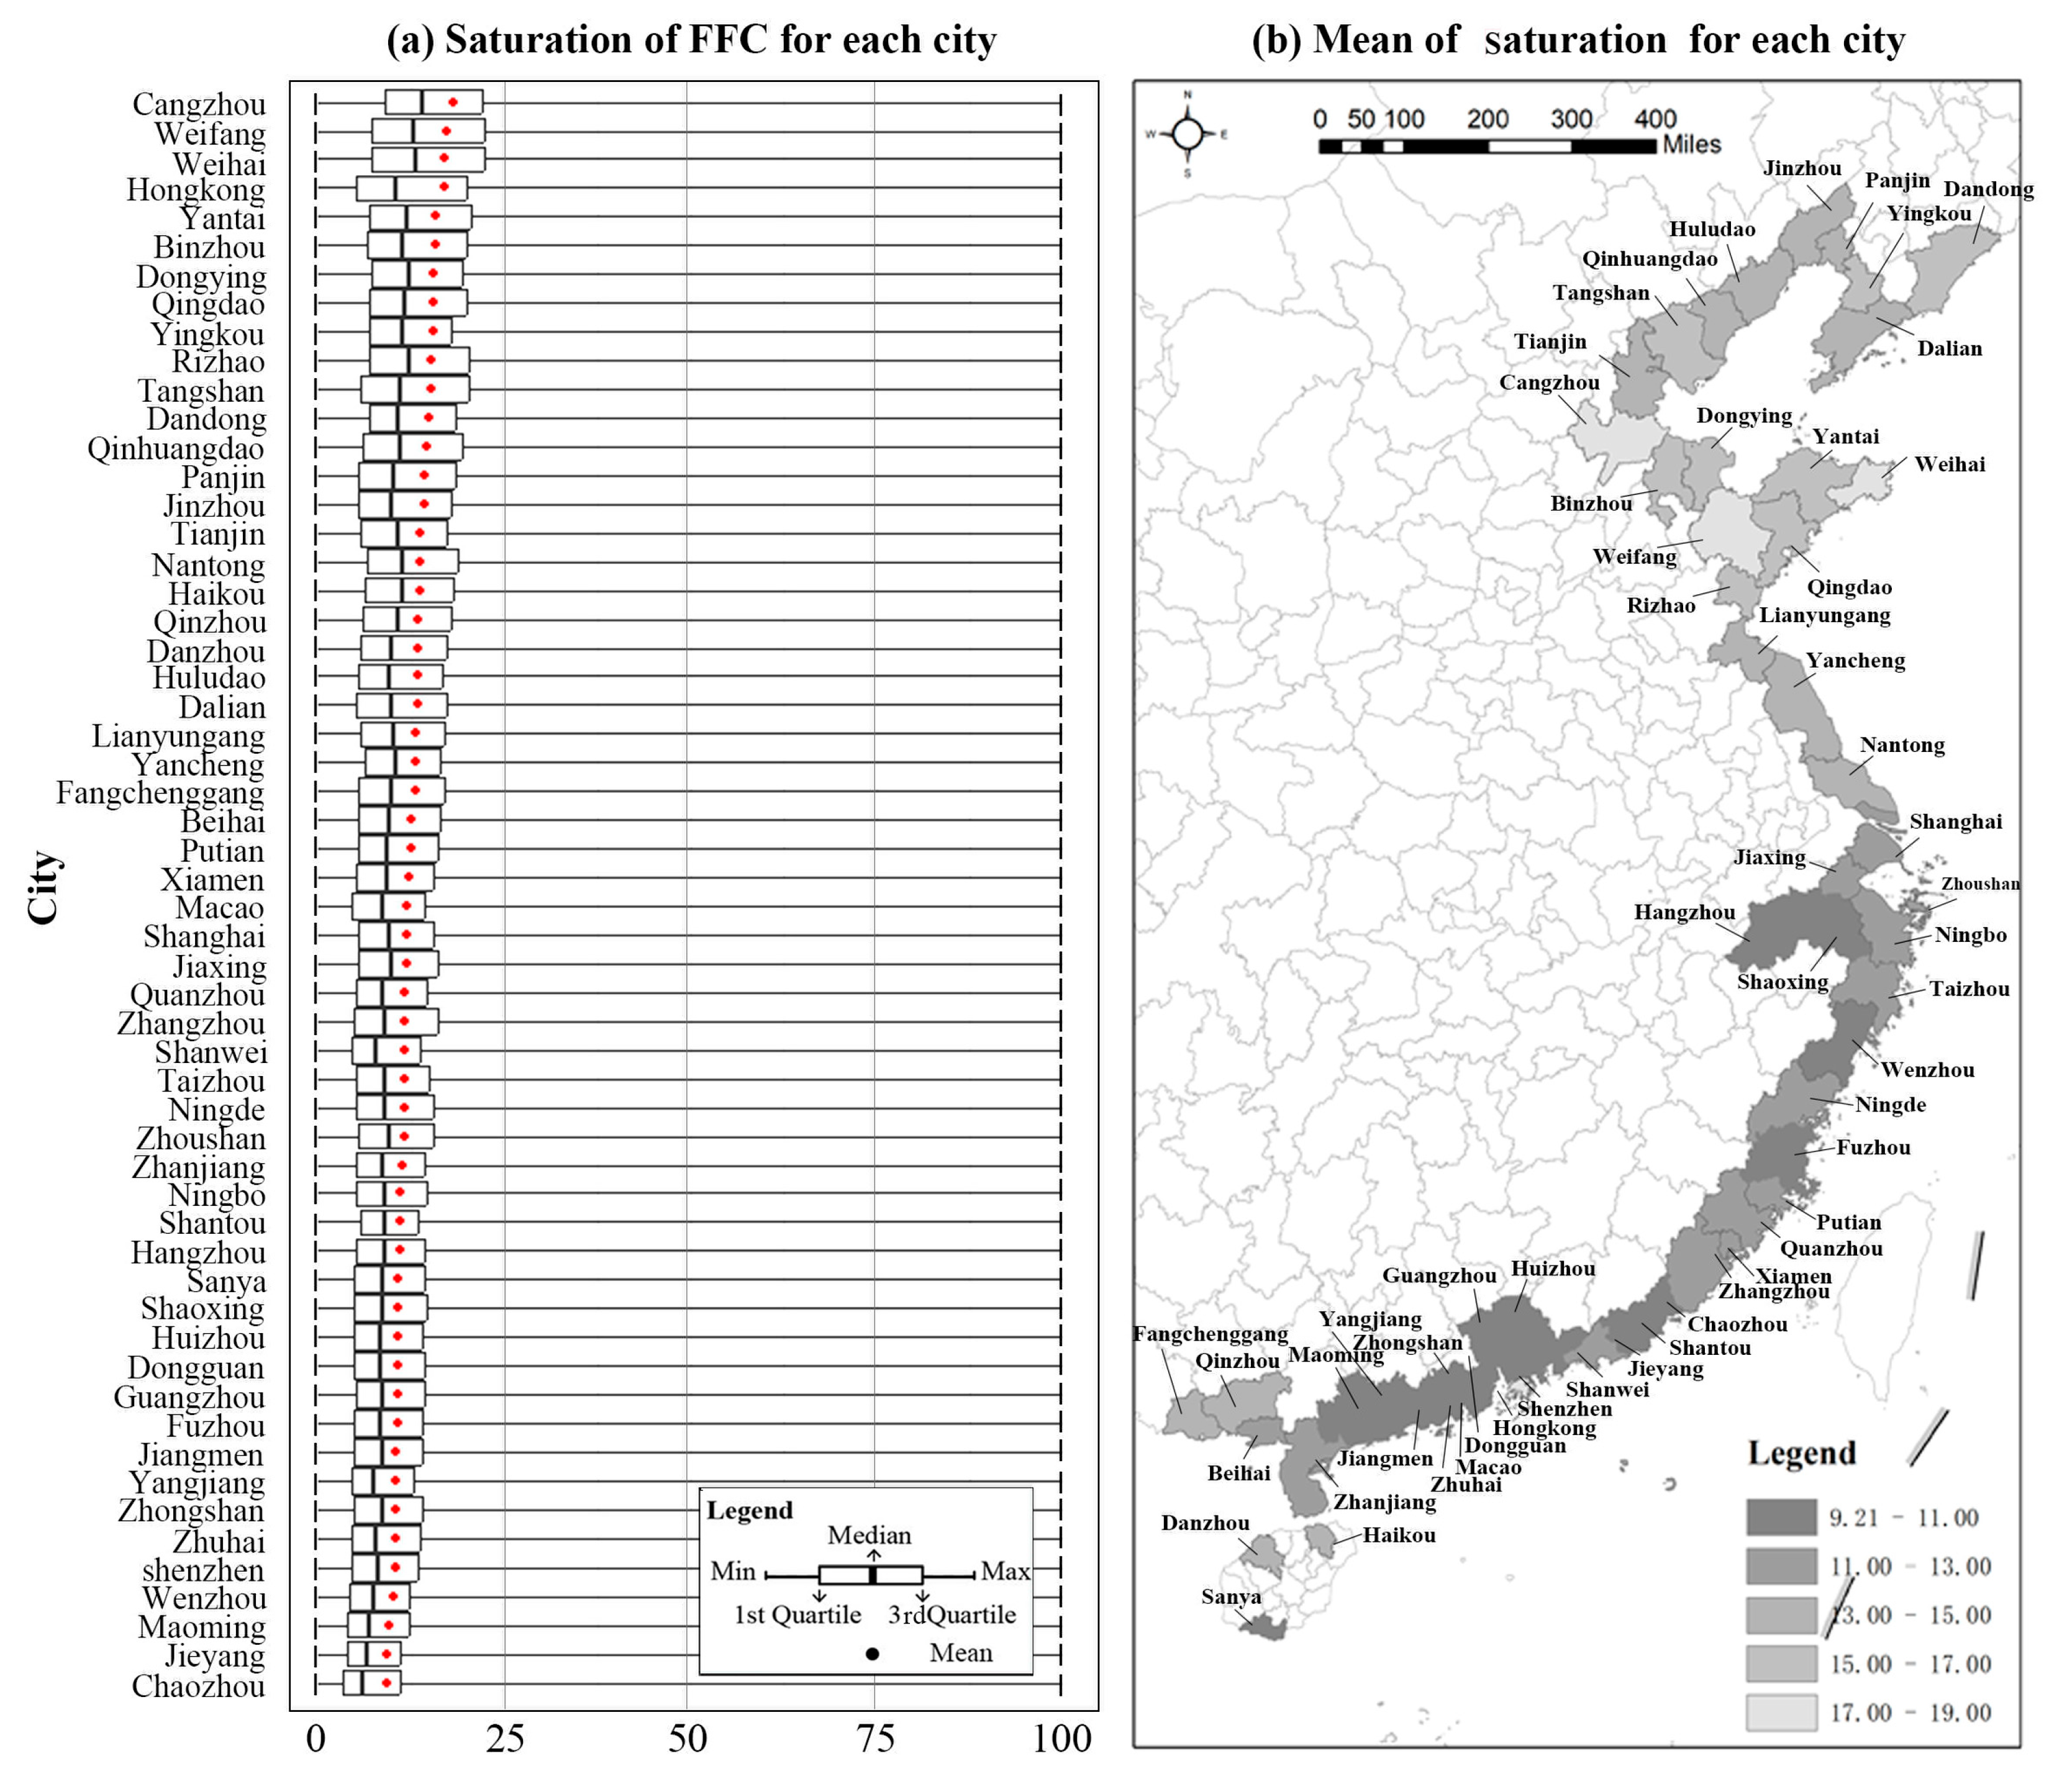
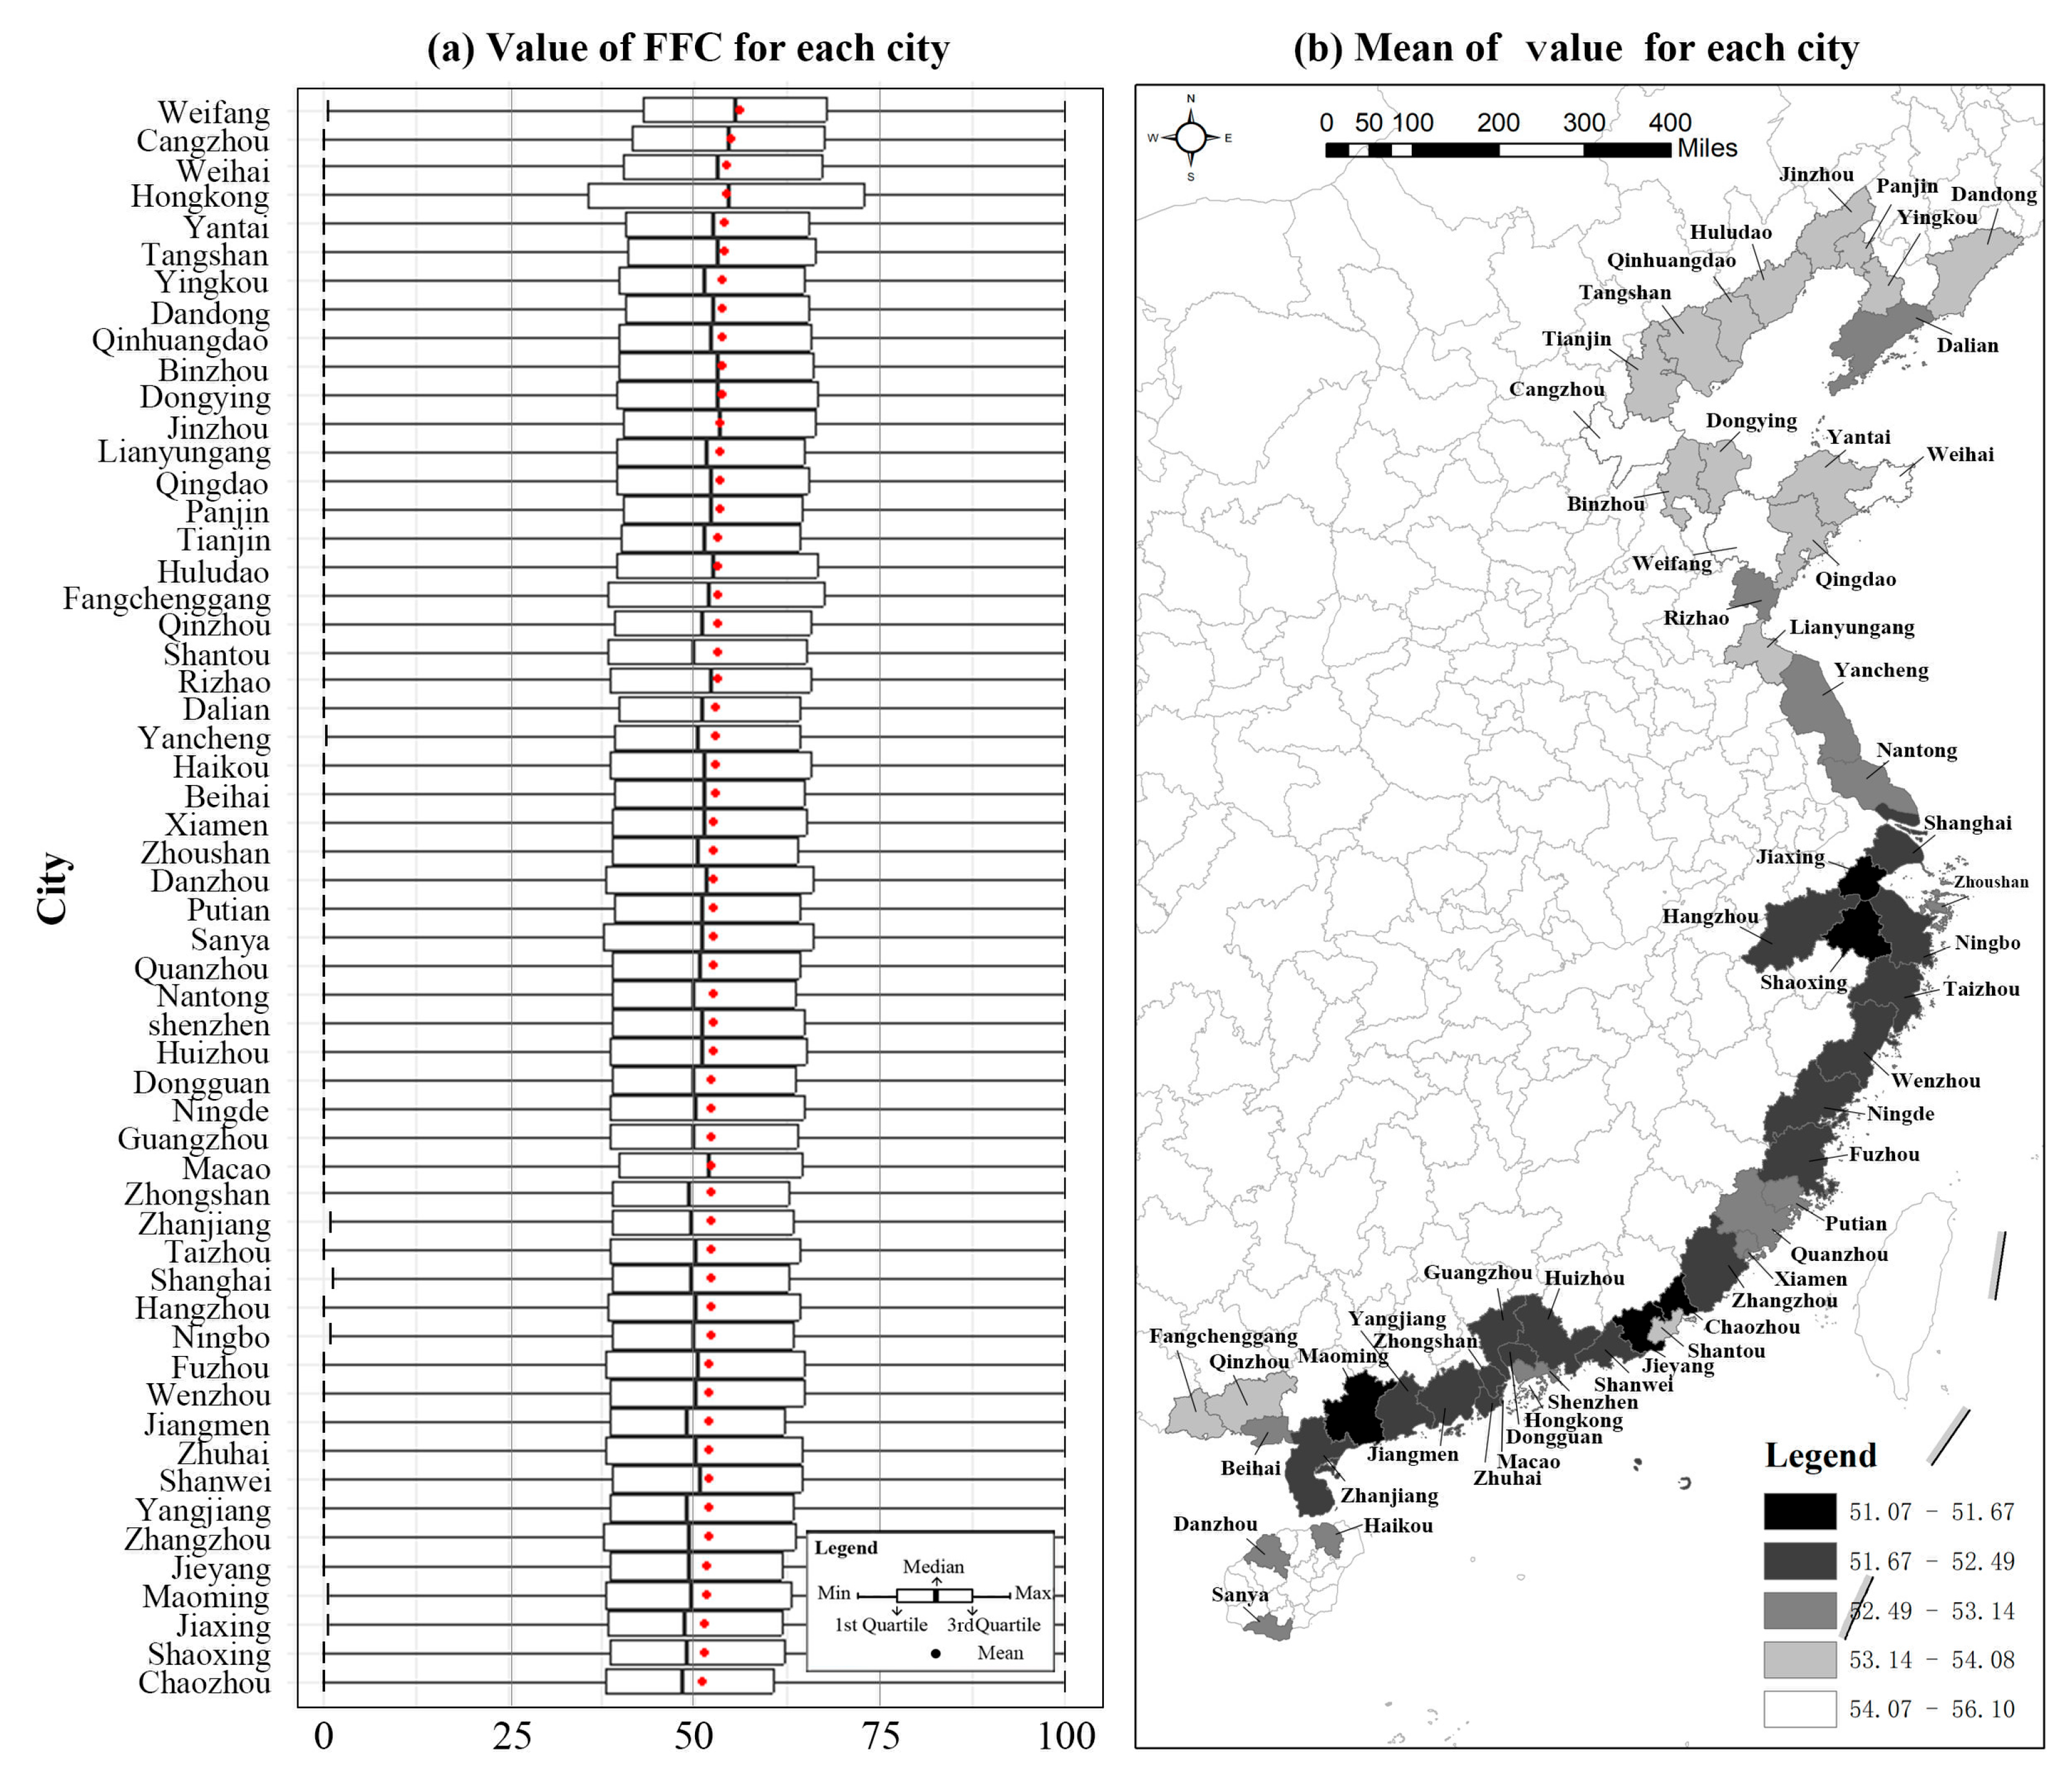
3.2.2. Hue, Saturation, and Value

Hue reflects the fundamental attribute of color and is the most memorable color feature. As shown in Figure 12a and Table S2, FFCs in most cities have hue values ranging from 30° to 290°, manifesting that the dominant colors of these cities fall within the orange-yellow to blue-purple spectrum. Among them, Jieyang city in the south has the widest hue range (69.67–292.69°), covering various hues from yellow-green to purple-red, while Weifang city in the north has the narrowest hue range (172.97–312.85°), dominated by blue and purple hues.
In terms of the mean hue, the spatial distribution of FFC hue types also reveals clustering effects. As seen in Figure 12b, coastal cities in the Greater Bay Area (e.g., Shantou (203.16°), Shenzhen (187.60°), Jieyang (186.85°), and Huizhou (181.18°)) have hue distributions leaning toward the blue-purple spectrum, representing cool-toned cities. This is followed by some eastern coastal cities, such as Hangzhou (181.18°), Zhoushan (179.63°), and Ningbo (174.68°). In contrast, some cities around Hangzhou Bay (e.g., Jiaxing (115.41°), Nantong (117.27°)) and the Bohai Bay region (e.g., Rizhao (121.73°), Yingkou (124.66°), Panjin (131.00°), Qingdao (132.84°), Dalian (135.13°), and Dongying (136.24°)) have hue distributions leaning toward the yellow-green spectrum, representing warm-toned cities. This may be attributed to climate, building/road materials, and natural environments. For example, the high temperatures and rainfall in the south may lead to the use of cool-colored materials that reflect sunlight, while northern regions tend to use traditional warm-colored heat-absorbing materials.
Saturation demonstrates the vividness of urban exterior colors and is the most indicative feature of color quality. As shown in Figure 13a and Table S3, the saturation of FFCs in all cities ranges from 0 to 100%, meaning that all cities have areas with zero saturation (gray or colorless) and areas with maximum saturation (pure colors). The average saturation values generally fluctuate between 9% and 18%, with medians mostly below 20%, indicating that these coastal cities have overall low-saturation color distributions. The standard deviation ranges from 8% to 20%, with some cities (e.g., Hongkong) having a high standard deviation of 20.49%, suggesting significant variations between low- and high-saturation areas in their urban fifth facades. In contrast, cities like Guangzhou, Zhongshan, Jiangmen, Shaoxing, and Hangzhou have lower standard deviations (around 8%), indicating more uniform and similar saturation distributions in their urban fifth facades.
As displayed in Figure 13b, with the eastern coastal cities (Shanghai) as the boundary, the northern coastal region (e.g., Cangzhou, Weifang, Weihai, Yantai, and Binzhou) generally has higher average saturation, while southern cities (e.g., Chaozhou, Jieyang, Maoming, Wenzhou, and Shenzhen) have lower averages. This expresses a clear north–south heterogeneity in the FFC saturation in China’s coastal cities; that is, northern cities have more vivid and intense colors, while southern cities are duller and more subdued.
Value reflects the brightness (or darkness) of colors and serves as the backbone of spatial color, playing an important role in color harmony. Figure 14a and Table S4 show the value statistics for FFCs in each city. In broad terms, the FFC value, especially the upper quartile and median, in many cities is concentrated between 50% and 55%, indicating that most cities have medium brightness. However, the standard deviation varies significantly among cities. For example, Hongkong (25.77%) has a much higher standard deviation than other cities, while Shanghai (18.75%), Guangzhou (18.99%), and Fuzhou (19.40%) have relatively lower standard deviations.
As seen in Figure 14b, similar to the spatial distribution of saturation averages, value averages also present a clear pattern of “darker in the south, and lighter in the north”. Except for Hongkong (54.35%) and Shantou (53.21%), the FFC values in southern cities (generally south of Shanghai) are almost below 53%, while in northern cities, all values are above 53%, particularly Weifang (56.10%), Cangzhou (55.00%), and Weihai (54.45%). This demonstrates that the FFC value has distinct latitudinal characteristics, possibly related to urban surface materials, architectural styles, industrialization levels, sky colors, and soil colors.

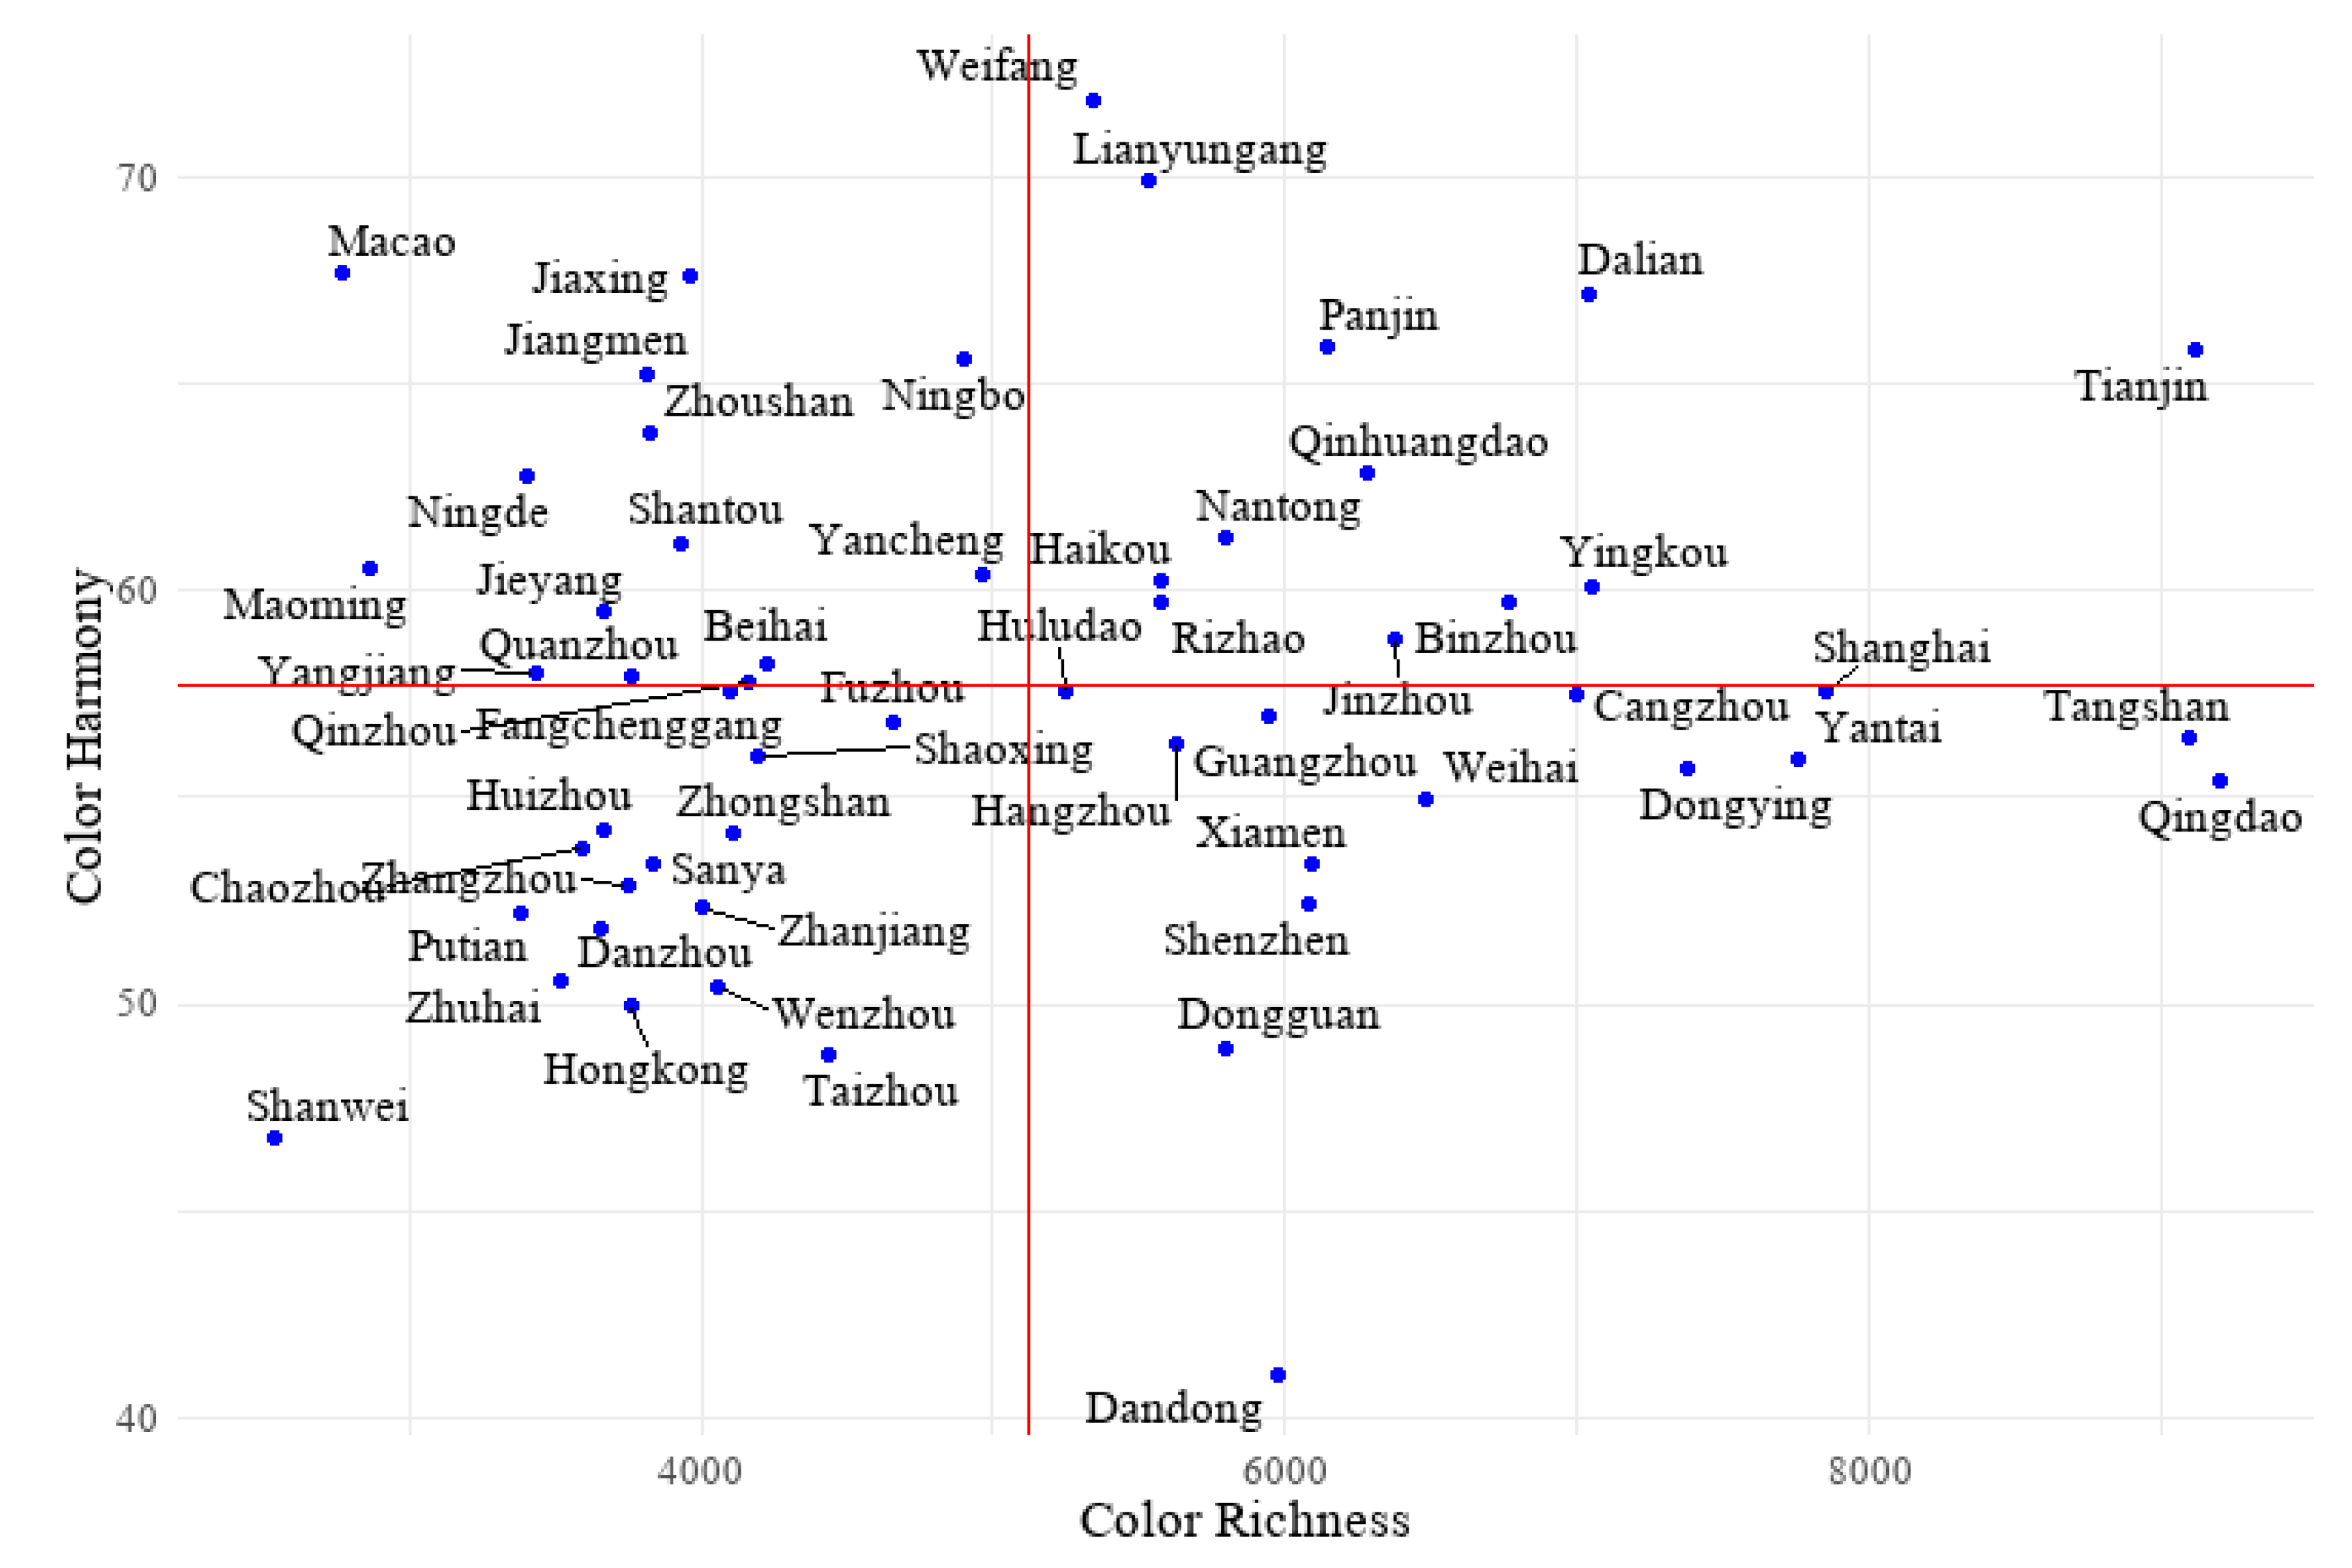
3.2.3. Color Richness and Color Harmony

Figure 15 illustrates the spatial distribution of the color richness of FFCs in China’s coastal cities, and Table S5 lists their quantitative values. The result exhibits a significant latitudinal effect, that is, the color richness decreases from north to south. Moreover, it is worth noting that five major coastal cities (Shanghai, Xiamen, Shenzhen, Guangzhou, and Hangzhou) show obviously high FFC richness values of 7854, 6087, 6077, 5944, and 5629, respectively. This phenomenon means that FFC richness is very likely to be highly correlated with the degree of regional development, so it can be regarded as a symbolic indicator of economic, social, and cultural aspects of the city.
Figure 16 displays the spatial distribution of color harmony in FFCs of China’s coastal cities, and Table S5 lists their quantitative values. The harmony values range from 41.05 (Dandong) to 71.89 (Weifang), with no clear spatial clustering or latitudinal patterns. Cities with higher FFC harmony include Weifang (71.89), Lianyungang (69.89), and Macao (67.68), while cities with lower harmony include Dandong (41.05), Shanwei (46.73), and Taizhou (48.73). Architectural styles and natural conditions are key factors determining FFC harmony. Generally, cities with a similar hue, saturation, and value (HSV) of their fifth facades tend to have better visual experiences and color distributions, whereas cities with contrastive HSV relationships often exhibit more distinctive urban personalities.
Figure 17 presents the quadrant distribution of FFC richness and harmony values for each coastal city. The red axes divide the plot into four quadrants, each with the following characteristics:
(1)
First quadrant (top right): Cities like Weifang, Lianyungang, and Tianjin excel in both richness and harmony, indicating well-planned and diverse fifth facades with aesthetic harmony. Geographically, most cities in this quadrant are located in northern coastal regions, except for Haikou, Shanghai, and Nantong.
(2)
Second quadrant (top left): Cities like Macao, Jiaxing, and Ningbo have low richness but high harmony, indicating a clear dominant color tone that creates a simple and coordinated visual aesthetic. These cities are mostly located in southern and southeastern coastal regions.
(3)
Third quadrant (bottom left): Cities like Shanwei, Zhuhai, and Taizhou have low richness and harmony, suggesting a lack of consideration for the color coordination between dominant FFC tones and scattered landscapes. These cities are also located in southern and eastern coastal regions.
(4)
Fourth quadrant (bottom right): Cities like Qingdao, Tangshan, and Yantai have high richness but low harmony, indicating potential severe color pollution in their fifth facades.
Overall, the plot does not demonstrate a clear positive or negative correlation between FFC richness and harmony, meaning they are independent from each other. Cities at the extremes of the quadrants require special attention to their color issues, such as Macao (high harmony, low richness), Shanwei (low harmony, low richness), and Dandong (low harmony, high richness).

4. Discussion

4.1. Perceiving Urban Image from the FFC Perspective

Color creates the initial impression of a city, acting as its visual “skin”. Since human settlements emerged as cities, color has been integral to the coupled development of human–land relations. Jean-Philippe’s “color geography” theory highlights the connection between color and regional culture [40]. Undoubtedly, color reflects a city’s cultural temperament and regional identity. In 2014, China National Geographic Journal published a column titled “What Color Is Your City?”, which inspired this study to explore this topic further.
Unlike past studies focusing on typical colors of specific urban areas, this research employs a remote sensing approach to comprehensively perceive urban colors from a broader perspective. It aims to identify general patterns in regional colors to support the revival and cultivation of urban spirit. Urban color comprises natural and human elements, which are inseparable, like bones and flesh. Natural colors form the “bones”, setting constraints and a broad framework, while human colors add the “flesh”, enriching this framework with human intent—either filling it, emphasizing certain aspects, or adding distinct touches [41]. Together, they create a rich and diverse urban color backdrop, existing in both spatial and temporal dimensions. Remote sensing method reveals the fifth facade of cities, and it remains the best tool for documenting the spatiotemporal archives and characteristic patterns of urban color [42].
This study examines the urban image of Chinese coastal cities through the lens of the fifth facade color (FFC), uncovering color’s multidimensional role as a visual language. While a previous study observed notable marine characteristics and regional homogeneity in coastal cities [43], such as landscapes and urban style, our research demonstrates striking spatial divergences in FFC features between northern and southern coastal cities despite their shared maritime positioning. In terms of hue, northern cities feature warm gray tones (hue < 120°, generally, as shown in Figure 12), contrasting with the cool grays (hue > 120°, generally) of the south. This reflects both climate adaptation (e.g., warmer tones in the north to counter cold, cooler tones in the south for a refreshing feel) and temperament differences (northern solidity vs. southern modern elegance) [44,45]. Regarding saturation and value, southern and some eastern cities exhibit lower values (saturation < 13% and value < 52.49%, generally, as shown in Figure 13 and Figure 14), adapting to intense sunlight at lower latitudes to avoid color pollution and visual strain, while northern cities’ brighter fifth facades add vitality to their “shadowed” landscapes. Thus, while the dominant gray base of FFC reflects the commonality of urbanization, regional variations in hue, saturation, and value highlight unique urban personalities and adaptive planning styles, just as the role of street facade color in urban image characterization [9].
Moreover, our analysis reveals how FFC serves as both a functional code and cultural text. The pervasive use of blue rooftops in industrial zones transcends mere anticorrosion utility—it embodies what Beyes (2024) terms “chromatic capitalism”, where technical specifications evolve into visual markers of industrial modernity [46]. Conversely, historic enclaves like Quanzhou’s red-brick clusters resist globalized grayscale homogenization through vernacular chromatic signatures, aligning with UNESCO’s Historic Urban Landscape guidelines that prioritize “color heritage” as intangible cultural capital [47].
The significantly positive correlation coefficients between color richness and urban socio-economic factors (0.42 **, 0.40 **, and 0.48 ** for population, GDP, and residential area, respectively, as shown in Figure S1) demonstrate that advanced cities, through diverse architectural styles and international designs, create inclusive and vibrant visual landscapes. In contrast, some relatively undeveloped cities (e.g., Jiangmen) exemplify the aesthetic paradox of latecomer cities: excessive harmony sacrifices vibrancy for visual safety, which coincides with Yi and Jeon’s (2022) color theory of conspicuity and harmony [48]. Notably, the nonlinear relationship between color harmony and richness indicates that aesthetic value lies not in color quantity but in the balance of coordination and cultural logic. For instance, harmonious northern cities like Weifang use adjacent hues for beauty, while less harmonious ones like Qingdao expose planning disorder through color clashes.
The findings also reveal the transformation and erosion of Earth’s natural surface colors led by urbanization. The diversity of global soil colors is fading, replaced by homogenized urban color types, especially in highly developed megacities [49]. Vast gray expanses signal efficiency and modernity but also hint at the loss of humanistic spirit and poetic living. As noted in [50], “color initially played a pivotal role in facade treatment and was carefully selected for its symbolic significance. For example, green represents spring, symbolizing eternity and peace, while pink, another favored color, is a sign of good fortune and happiness”. Only by viewing urbanization as a “warm color narrative” can we craft unique city images blending nature and humanity amid artificial transformation.

4.2. Advantages of Natural Color Optimization in Remote Sensing Data

Since the 1970s, when Landsat’s Multispectral Scanner (MSS) introduced true-color imagery, this concept has gained traction in remote sensing research [51]. In 2002, NASA released Blue Marble, a true-color Earth image based on MODIS data developed by Stöckli et al. [52]. Via optimized color mapping, it generated highly realistic images of the earth’s surface and popularized the use of true-color images in public communication and science.
However, mapping red, green, and blue bands directly to RGB channels can lead to oversaturation or color distortion [53,54]. For instance, the green band (B3, 560–585 nm) of Sentinel-2 exceeds the sensitivity range (540–570 nm) of the human eye, amplifying or skewing the reflectance of certain features in remote sensing images. More importantly, human color perception relies on three types of cone cells, which are, respectively, sensitive to short, medium, and long wavelengths, while the spectral responses of remote sensing sensors are linear, failing to mimic the eye’s nonlinear perception [55]. Thus, the direct mapping approach of true-color products may result in distortions, especially in vegetation and deserts.
Existing studies typically utilized remote sensing technology for biophysical analysis, but rarely applied it to depict perceived natural landscape appearances. For professional research, minimizing color discrepancies between remote sensing and ground-truth images is necessary. Tsagaris and Anastassopoulos [56] integrated human color perception into a multispectral fusion process to produce high-quality RGB images without extra transformation. Sunoj et al. [57] proposed a color correction algorithm of agricultural digital imagery for precise phenological comparison, and this method is also adaptable to remote sensing images. Wang et al. [58] pioneered color correction in multispectral data of Mars, converting sensor color components into independent chromatic spaces to align with human vision, akin to the use of the CIE color space in this study.
Natural color optimization offers technical and practical advantages in remote sensing studies. First, precise color mapping closely mimics human perception, addressing oversaturation issues (e.g., exaggerated vegetation greenness or desert distortion) for more realistic imagery. Second, its algorithmic efficiency and scalability support large-scale applications. Using cloud platforms like Google Earth Engine (GEE), the natural color image of a city can be generated in about 20 min (depending on size), meeting needs from research to disaster response. Finally, its framework is sensor-agnostic, and can be easily extended to other satellite data, promoting color standardization across sources. This facilitates long-term global surface monitoring and interdisciplinary visual analysis.

4.3. Implications for Coastal City Planning and Industry Development

As China’s coastal cities lead in openness and economic vitality, their fifth facade color (FFC) reflects not just visual identity but a blend of economic structure, industrial layout, ecology, climate, and cultural history, offering strategic paradigms for distinctive urban development [59,60]. The chromatic challenges confronting coastal cities stem from their unique marine environmental factors. The oceanic climate presents unique adversities—intense solar exposure, saltwater corrosion, and elevated humidity—which collectively compromise the durability and maintenance of color applications, leading to accelerated fading, discoloration, and increased upkeep costs [61]. Furthermore, these coastal settlements frequently exhibit chromatic monotony. While the prevalent blues and neutral tones authentically capture the marine essence, their limited diversity results in visually repetitive urban landscapes devoid of aesthetic vitality. Our systematic analysis of FFC patterns across 56 major Chinese coastal cities reveals profound interconnections between color planning and urban development trajectories, yielding significant insights for future coastal construction and industrial growth.
Economic structure and industry shape building materials and colors [62]. Northern industrial cities (e.g., Tianjin, Dalian, and Qingdao) feature “blue components” in FFC from PVC anticorrosive roofing, meeting functional needs (durability, cooling) while crafting a modern industrial image. Southern cities (e.g., Shenzhen and Guangzhou) favor cool grays, reflecting service- and tech-driven economies with sleek, nature-harmonized designs (e.g., coastal blue-green tones). Economically advanced cities (e.g., Shanghai, Shenzhen) boast high color richness tied to diverse industries (e.g., creative sectors, tourism), making diversity and harmony an implicit competitive edge. Future planning should integrate color. For example, heavy industry zones can use functional hues for efficiency, while service hubs leverage aesthetics for appeal.
Ecological fragility and climate in coastal zones also demand tailored color planning [63]. Southern cities (e.g., Shantou and Jieyang) use cool tones to suit humid, hot subtropical conditions and complement lush vegetation. Northern cities (e.g., Weifang and Weihai) adopt warm grays to match cold, dry climates and blend with stark winter landscapes. Coastal challenges like salt spray and erosion drive blue anticorrosive materials, becoming a signature trait. In wetland cities (e.g., Yancheng), low-saturation colors minimize light pollution for wildlife. Future efforts should enhance ecological adaptability, integrating green roofs or solar panels to merge function and aesthetics.
Color planning impacts sustainability twofold. On one hand, high-harmony designs (e.g., Weifang) boost psychological comfort and reduce visual pollution for residents [64], while disharmony (e.g., Qingdao and Yantai) signals a need to balance function and aesthetics in industrial growth. On the other hand, rich-colored and harmonious landscapes (e.g., Shanghai and Xiamen) spur tourism and investment. A robust empirical study reveals a sophisticated nonlinear relationship between color characteristics and emotional perception, with optimal responses observed at 0.86 color complexity and 0.84 harmony. Notably, under unconventional conditions, more pronounced color features, particularly increased diversity in color types, demonstrate significant positive effects on visitors’ emotional responses [65]. These findings align precisely with the conclusion in this study, that is, the strong positive correlation between urban color richness and regional development. In addition, color can also be synergized with industry development [66], such as blue-roof zones with solar power, and red heritage areas with cultural tourism, so as to form a “color + industry” mode.
Currently, coastal city color planning is spontaneous, lacking systematic guidance. Future breakthroughs include: (1) linking color to sustainability for carbon neutrality and ecological restoration; (2) creating a Chinese coastal color corridor (e.g., Blue Dalian and Red Qingdao) for distinct cultural-tourism brands; and (3) establishing a color monitoring and evaluation system to prevent pollution and disorder.
FFC is more than aesthetics—it mirrors economy, ecology, and culture. Moving forward, China’s coastal cities should use color to unify industrial upgrades, environmental care, and cultural revival, crafting globally competitive and regionally distinct colorful city models.

4.4. Future Work and Limitations

In the future, we will further explore the temporal evolution and driving factors of urban FFC using time-series data. By integrating geographic big data and artificial intelligence, we aim to investigate the impact of FFC on residents’ physical and mental health and the urban heat environment. Another intriguing topic could be comparing the FFC of Chinese coastal cities with global counterparts (e.g., Barcelona and Greek cities) to uncover how cultural backgrounds shape color choices and urban identity. In the methodological aspects, enhancing color mapping models with machine learning or incorporating dynamic lighting conditions could improve the accuracy and adaptability of natural color optimization, making remote sensing an essential bridge between scientific analysis and human perception.
This study has some limitations. First, the spatial resolution (10 m) of Sentinel-2 data limits the detection of fine-grained color details in the urban fifth facade, potentially hindering precise FFC perception. Second, to achieve stable color representation, we averaged multi-temporal images within a year, overlooking seasonal color shifts due to vegetation phenology. Lastly, the mini-batch K-means clustering uses randomly initialized centroids, and parameter settings may affect accuracy. Though robustness tests were conducted, some bias may persist.

5. Conclusions

The fifth facade, a key aspect of urban image, has been underexplored in prior research. Depicting urban image through FFC offers not just an aesthetic experience of external beauty but a deep insight into the intrinsic traits of a city. With innovative remote sensing techniques and a multidimensional framework, this study reveals the socioeconomic, cultural, and geographic factors behind FFC, breaking new ground in methodology, analysis dimension, and conclusions compared to past work, providing new perspectives on urban image.
The main findings include the following: (1) The natural color optimization method enhances brightness, reduces saturation, and corrects severe color bias in remote sensing imagery, aligning it with human perception. (2) FFC in Chinese coastal cities is dominated by gray, black, and brown, reflecting modern urban landscapes of cement and concrete. Northern cities show warm grays, while southern ones lean toward cool grays. Blue PVC roofs in industrial cities and red-brick roofs in historic ones highlight the dual role of FFC in functionality and cultural uniqueness. (3) In HSV features, cool tones cluster in the Guangdong–Hong Kong–Macao Bay Area, while warm tones dominate the Bohai Rim. Northern coastal cities have higher saturation (15–18%) than southern ones (9–13%), showing bolder FFC in the north and softer tones in the south. Values (or brightness) follow a “darker south, lighter north” pattern (e.g., Weifang 56.10% vs. Shantou 53.21%), possibly tied to climate (stronger southern sunlight) and materials (lighter coatings). (4) Economically advanced cities (e.g., Shanghai and Shenzhen) exhibit greater color richness, which generally decreases from north to south by latitude. Color harmony shows no clear spatial trend, influenced mainly by architectural style and natural surroundings.
Ultimately, urban color research aims to express and shape city spirit. In today’s globalized world, countering uniform, soulless, or visually chaotic cities requires strategic color planning and design. With a rich historical foundation in China, modern urban color planning revives cultural traditions. The FFC of Chinese coastal cities vividly reflects functional needs, cultural memory, and environmental adaptation in urbanization. Moving forward, under a sustainability framework, color can balance modern efficiency with regional heritage, crafting readable and warm urban identities.

Supplementary Materials

The following supporting information can be downloaded at: https://www.mdpi.com/article/10.3390/rs17122075/s1, Figure S1: Pearson correlation analysis between color richness index and socio-economic factors; Table S1: RGB values of Top20 dominant FFCs in China’s coastal cities; Table S2: Statistical description of hue for FFCs in 56 coastal cities (Unit: °); Table S3: Statistical description of saturation for FFCs in 56 coastal cities (Unit: %); Table S4: Statistical description of value for FFCs in 56 coastal cities (Unit: %); Table S5: Color richness and color harmony of FFCs in 56 coastal cities (Unit: /).

Author Contributions

Conceptualization, Y.L.; methodology, Y.L. and R.Y.; data curation, R.Y.; formal analysis, Y.L. and J.S.; software, Z.H.; validation, Q.Y. and W.J.; investigation, X.Y.; re-sources, W.J.; writing—original draft preparation, Y.L.; writing—review and editing, R.Y., H.H., S.S. and J.Y.; visualization, J.S. and Q.Y.; supervision, W.J. and J.Y.; project administration, X.Y.; funding acquisition, Y.L., W.J., X.Y., H.H. and J.Y. All authors have read and agreed to the published version of the manuscript.

Funding

This research was funded by the National Natural Science Foundation of China, grant numbers 42401566, 42271479, and 42471432; the Postdoctoral Science Foundation of China, grant number 2023M730735; the National Key R&D Program of China, grant number 2022YFF0711602; the GDAS’ Project of Science and Technology Development, grant numbers 2022GDASZH-2022010111 and 2022GDASZH-2022020402-01; the Science and Technology Program of Guangdong, grant numbers 2024B1212040001 and 2024B1212080002; the Guangdong Basic and Applied Basic Research Foundation, grant number 2022A1515240041.

Data Availability Statement

The original contributions presented in this study are included in the article. Further inquiries can be directed to the corresponding author.

Conflicts of Interest

Author Richen Ye was employed by the company Guangzhou Urban Planning & Design Survey Research Institute Co., Ltd. The remaining authors declare that the research was conducted in the absence of any commercial or financial relationships that could be construed as a potential conflict of interest.

Abbreviations

The following abbreviations are used in this manuscript:
FFCThe Fifth Facade Color
RGBRed, Green, and Blue
CIEInternational Commission on Illumination
CMFColor-Matching Functions
ASTERAdvanced Spaceborne Thermal Emission and Reflection Radiometer
RMSERoot Mean Square Error
HSVHue, Saturation, and Value
MODISModerate-resolution Imaging Spectroradiometer
GEEGoogle Earth Engine
PVCPolyvinyl Chloride
NASANational Aeronautics and Space Administration

References

  1. Wang, H.; Wang, H.; Hu, X. Artistic Expression of Urban Community Landscape Color. In Proceedings of the 2014 2nd International Conference on Education Technology and Information System (ICETIS 2014), Jinan, China, 26 April 2014. [Google Scholar]
  2. Zhang, C.; Chen, Y.; Dewancker, B.J.; Shentu, C.; Tian, H.; Liu, Y.; Wan, J.; Zhang, X.; Li, J. Emotional Landscapes in Urban Design: Analyzing Color Emotional Responses of the Elderly to Community Outdoor Spaces in Yi Jie Qu. Buildings 2024, 14, 793. [Google Scholar] [CrossRef]
  3. Xu, Z.; Zheng, X. Roadmap of moving urban colour toward cultural sustainability in China. Color Res. Appl. 2021, 46, 222–239. [Google Scholar] [CrossRef]
  4. Lynch, K. Reconsidering the Image of the City; Springer: Boston, MA, USA, 1984; pp. 151–161. [Google Scholar]
  5. Badami, A.A. Management of the image of the city in urban planning: Experimental methodologies in the colour plan of the Egadi Islands. Urban Des. Int. 2022, 30, 1–16. [Google Scholar] [CrossRef]
  6. Nguyen, L.; Teller, J. Color in the urban environment: A user-oriented protocol for chromatic characterization and the development of a parametric typology. Color Res. Appl. 2017, 42, 131–142. [Google Scholar] [CrossRef]
  7. Gou, A.; Shi, B.; Wang, J.; Wang, H. Color preference and contributing factors of urban architecture based on the selection of color samples—Case study: Shanghai. Color Res. Appl. 2022, 47, 454–474. [Google Scholar] [CrossRef]
  8. Jaglarz, A. Perception of color in architecture and urban space. Buildings 2023, 13, 2000. [Google Scholar] [CrossRef]
  9. Zhong, T.; Ye, C.; Wang, Z.; Tang, G.; Zhang, W.; Ye, Y. City-scale mapping of urban façade color using street-view imagery. Remote Sens. 2021, 13, 1591. [Google Scholar] [CrossRef]
  10. Cook, R.; Gilbert, J. The fifth façade: Designing nature into the city. Council. Tall. Build. Urban. Habitat. 2015, 1, 288. [Google Scholar]
  11. Köhler, M.; Clements, A.M. Green Roofs: Ecological Functions of the Fifth Facade. In Sustainable Built Environments. Encyclopedia of Sustainability Science and Technology Series; Loftness, V., Ed.; Springer: New York, NY, USA, 2020; pp. 495–518. [Google Scholar] [CrossRef]
  12. Liu, G.; Hong, S.; Wang, Y.; Dai, L.; Wei, W. Study of the fifth façade: Planning and controlling in the wuhan aerotropolis. In Human-Centered Urban Planning and Design in China: Volume II: Urban Design and Mobility; Springer: Cham, Switzerland, 2021; pp. 29–39. [Google Scholar] [CrossRef]
  13. Chen, T. Research on Industrial Building Facade Design in Urban Core Area. In Proceedings of the 2024 7th International Conference on Structural Engineering and Industrial Architecture (ICSEIA 2024), Guangzhou, China, 29 March 2024. [Google Scholar] [CrossRef]
  14. Robles Romera, A. Collective Space in Height: The Fifth Façade. Bachelor’s Thesis, Universitat Politècnica de Catalunya, Barcelona, Spain, 2021. [Google Scholar]
  15. Belgiu, M.; Stein, A. Spatiotemporal image fusion in remote sensing. Remote Sens. 2019, 11, 818. [Google Scholar] [CrossRef]
  16. Gao, C.; Cheng, D.; Liu, K. Research on small-area fish landscape from the perspective of the fifth facade: Taking the Chang’an Campus of Northwest University as an example. J. Cent. China. Norm. Univ. 2016, 50, 770. (In Chinese) [Google Scholar]
  17. Rizzo, R.; Wadoux, A.M.C.; Demattê, J.A.; Minasny, B.; Barrón, V.; Ben-Dor, E.; Francos, N.; Savin, I.; Poppiel, R.; Silvero, N.; et al. Remote sensing of the Earth’s soil color in space and time. Remote Sens. Environ. 2023, 299, 113845. [Google Scholar] [CrossRef]
  18. Ju, J.; Masek, J.G. The vegetation greenness trend in Canada and US Alaska from 1984–2012 Landsat data. Remote Sens. Environ. 2016, 176, 1–16. [Google Scholar] [CrossRef]
  19. Zhong, Q.; Li, Z. Long-term trends of vegetation greenness under different urban development intensities in 889 global cities. Sustain. Cities Soc. 2024, 106, 105406. [Google Scholar] [CrossRef]
  20. Xie, Y.; Han, X.; Zhu, S. Synthesis of true color images from the Fengyun advanced geostationary radiation imager. J. Meteorol. Res. 2021, 35, 1136–1147. [Google Scholar] [CrossRef]
  21. Sovdat, B.; Kadunc, M.; Batič, M.; Milčinski, G. Natural color representation of Sentinel-2 data. Remote Sens. Environ. 2019, 225, 392–402. [Google Scholar] [CrossRef]
  22. Wernand, M.; Woerd, H.J. WACODI: A generic algorithm to derive the intrinsic color of natural waters from digital images. Limnol. Oceanogr. Methods 2015, 13, 697–711. [Google Scholar] [CrossRef]
  23. Jia, M.; Zeng, H.; Chen, Z.; Wang, Z.; Ren, C.; Mao, D.; Zhao, C.; Zhang, R.; Wang, Y. Nighttime light in China’s coastal zone: The type classification approach using SDGSAT-1 Glimmer Imager. Remote Sens. Environ. 2024, 305, 114104. [Google Scholar] [CrossRef]
  24. Sun, J.; Sun, Z.; Guo, H.; Jiang, H.; Gao, J.; Wang, J. Dataset of Chinese Cities Built-Up Area in 2020 (DS/OL); Science Data Bank: Beijing, China, 2021; Volume 1. [Google Scholar] [CrossRef]
  25. Webster, M.A. Human colour perception and its adaptation. Netw.-Comp. Neural Sys. 1996, 7, 587–634. [Google Scholar] [CrossRef]
  26. Gordon, H.R. Remote sensing of ocean color: A methodology for dealing with broad spectral bands and significant out-of-band response. Appl. Opt. 1995, 34, 8363–8374. [Google Scholar] [CrossRef]
  27. Drusch, M.; Del Bello, U.; Carlier, S.; Colin, O.; Fernandez, V.; Gascon, F.; Hoersch, B.; Isola, C.; Laberinti, P.; Martimort, P.; et al. Sentinel-2: ESA’s optical high-resolution mission for GMES operational services. Remote Sens. Environ. 2012, 120, 25–36. [Google Scholar] [CrossRef]
  28. Smith, T.; Guild, J. The CIE colorimetric standards and their use. Trans. Optic. Soc. 1931, 33, 73. [Google Scholar] [CrossRef]
  29. Wyman, C.; Sloan, P.P.; Shirley, P. Simple analytic approximations to the CIE XYZ color matching functions. J. Comput. Graph. Tech. 2013, 2, 11. [Google Scholar]
  30. Baldridge, A.M.; Hook, S.J.; Grove, C.I.; Rivera, G. The ASTER spectral library version 2.0. Remote Sens. Environ. 2009, 113, 711–715. [Google Scholar] [CrossRef]
  31. Green, P. Colour Encodings. In Fundamentals and Applications of Colour Engineering; John Wiley & Sons: Hoboken, NJ, USA, 2023; pp. 143–154. [Google Scholar] [CrossRef]
  32. IEC/PWI 61966-2-1/Amd 1:2003; Multimedia Systems and Equipment-Color Measurement and Management-Part 2–1: Color Management-Default RGB Color Space-sRGB. International Electrotechnical Commission: Geneva, Switzerland, 2003.
  33. MacQueen, J. Some methods for classification and analysis of multivariate observations. In Proceedings of the Fifth Berkeley Symposium on Mathematical Statistics and Probability, Volume 1: Statistics; University of California Press: Berkeley, CA, USA, 1967; Volume 5, pp. 281–298. [Google Scholar]
  34. Hicks, S.C.; Liu, R.; Ni, Y.; Purdom, E.; Risso, D. Mbkmeans: Fast clustering for single cell data using mini-batch k-means. PLoS Comput. Biol. 2021, 17, e1008625. [Google Scholar] [CrossRef]
  35. Kuehni, R.G. Color: An Introduction to Practice and Principles; John Wiley & Sons: New York, NY, USA, 2015. [Google Scholar]
  36. Smith, A.R. Color gamut transform pairs. ACM. Siggraph Comput. Graphics 1978, 12, 12–19. [Google Scholar] [CrossRef]
  37. Ou, L.C.; Luo, M.R. A colour harmony model for two-colour combinations. Color Res. Appl. 2006, 31, 191–204. [Google Scholar] [CrossRef]
  38. Pridmore, R.W. Complementary colors theory of color vision: Physiology, color mixture, color constancy and color perception. Color Res. Appl. 2011, 36, 394–412. [Google Scholar] [CrossRef]
  39. Nemcsics, A. Experimental determination of the laws of color harmony. Part 4: Color preference and the color harmony content. Color Res. Appl. 2009, 34, 210–224. [Google Scholar] [CrossRef]
  40. Lenclos, J.P. The geography of colour. In Colour for Architecture Today; Taylor & Francis: Oxfordshire, UK, 2019; pp. 39–44. [Google Scholar]
  41. Xing, Z.; Guo, W. Addressing cities’ color issues and planning urban colors with regional features to preserve the history and culture of cities: The case of Suzhou, Wuxi, and Changzhou (China). J. Asian Archit. Build. Eng. 2024, 1–13. [Google Scholar] [CrossRef]
  42. Karasov, O.; Külvik, M.; Burdun, I. Deconstructing landscape pattern: Applications of remote sensing to physiognomic landscape mapping. GeoJournal 2021, 86, 529–555. [Google Scholar] [CrossRef]
  43. Di, Q.; Ji, L. Analysis and Evaluation of Coastal Cities Marine Characteristics from the Perspective of Regional Identity. Sci. Geogr. Sin. 2016, 36, 1688–1696. [Google Scholar] [CrossRef]
  44. Yu, Z. Regulation of Urban Character: Style, Colour and Historic Character in a Modern Chinese City—The Case of Harbin; The University of Manchester: Manchester, UK, 2013. [Google Scholar]
  45. Özcan, E.K.; Çelik, K. Environmental color analysis and facade color design in a street rehabilitation: Adana, Kayalıbağ. Color Res. Appl. 2024, 49, 433–448. [Google Scholar] [CrossRef]
  46. Beyes, T. Organizing Color: Toward a Chromatics of the Social; Stanford University Press: Redwood City, CA, USA, 2024. [Google Scholar]
  47. O’Donnell, P. Historic urban landscape: A new UNESCO tool for a sustainable future. In Conserving Cultural Landscapes; Routledge: New York, NY, USA, 2014; pp. 163–181. [Google Scholar]
  48. Yi, J.; Jeon, J. A study on color conspicuity and color harmony of wayfinding signs according to outdoor environment types. Color Res. Appl. 2022, 47, 1259–1294. [Google Scholar] [CrossRef]
  49. Gou, A.; Wang, J. A comparison between wishes and status: Gray is not the preference for residents while the city shows neutral colors. Color Res. Appl. 2017, 42, 650–663. [Google Scholar] [CrossRef]
  50. Gretchen, M. Pastel Portraits: Singapore’s Architecture Heritage; Singapore Coordinating Committee: Singapore, 1984. [Google Scholar]
  51. Schott, J.R. Remote Sensing: The Image Chain Approach; Oxford University Press: Oxford, OH, USA, 2007. [Google Scholar]
  52. Stöckli, R.; Vermote, E.; Saleous, N.; Simmon, R.; Herring, D. The Blue Marble Next Generation—A True Color Earth Dataset Including Seasonal Dynamics from MODIS; NASA Earth Observatory: Greenbelt, MD, USA, 2005. [Google Scholar]
  53. Yamaguchi, M.; Haneishi, H.; Ohyama, N. Beyond red–green–blue (RGB): Spectrum-based color imaging technology. J. Imaging Sci. Technol. 2008, 52, 10201. Available online: https://jglobal.jst.go.jp/en/detail?JGLOBAL_ID=200902209340203559 (accessed on 1 January 2025). [CrossRef]
  54. Crameri, F.; Shephard, G.E.; Heron, P.J. The misuse of colour in science communication. Nat. Commun. 2020, 11, 5444. [Google Scholar] [CrossRef] [PubMed]
  55. Garcia, J.E.; Girard, M.B.; Kasumovic, M.; Petersen, P.; Wilksch, P.A.; Dyer, A.G. Differentiating biological colours with few and many sensors: Spectral reconstruction with RGB and hyperspectral cameras. PLoS ONE 2015, 10, e0125817. [Google Scholar] [CrossRef]
  56. Tsagaris, V.; Anastassopoulos, V. Multispectral imag fusion for improved RGB representation based on perceptual attributes. Int. J. Remote Sens. 2005, 26, 3241–3254. [Google Scholar] [CrossRef]
  57. Sunoj, S.; Igathinathane, C.; Saliendra, N.; Hendrickson, J.; Archer, D. Color calibration of digital images for agriculture and other applications. ISPRS. J. Photogram. Remote Sens. 2018, 146, 221–234. [Google Scholar] [CrossRef]
  58. Wang, H.; Yang, J.; Xue, B.; Yan, X.; Tao, J. A novel color calibration method of multi-spectral camera based on normalized RGB color model. Results Phys. 2020, 19, 103498. [Google Scholar] [CrossRef]
  59. Rangel-Buitrago, N. Coastal Scenery: Evaluation and Management, 1st ed.; Springer: Berlin, Germany, 2018; Volume 26. [Google Scholar]
  60. Wang, J.; Liu, M.; Li, W. Color matching simulation of ocean landscape decoration pattern based on visual communication. J. Coast. Res. 2020, 108, 173–177. [Google Scholar] [CrossRef]
  61. Zhang, L.; Kim, C. Chromatics in urban landscapes: Integrating interactive genetic algorithms for sustainable color design in marine cities. Appl. Sci. 2023, 13, 10306. [Google Scholar] [CrossRef]
  62. Martosenjoyo, T. Color in architecture: Before and after industry revolution. J. Soc. Political Sci. 2021, 4, 9. Available online: https://ssrn.com/abstract=3964301 (accessed on 1 January 2025). [CrossRef]
  63. Chu, D. Aesthetic visual ecology and urban landscape planning. Adv. Mater. Res. 2011, 255, 1479–1483. [Google Scholar] [CrossRef]
  64. Divers, E. Theory to practice: Pleasure-Arousal-Dominance (PAD) theory for architectural color design. Color Res. Appl. 2023, 48, 445–452. [Google Scholar] [CrossRef]
  65. Qi, Z.; Li, J.; Yang, X.; He, Z. How the characteristics of street color affect visitor emotional experience. Comput. Urban Sci. 2025, 5, 7. [Google Scholar] [CrossRef]
  66. Hunjet, A.; Glogar, M.I.; Osterman, D.P.; Kozina, G. The importance of color as a marketing tool in tourism. In Proceedings of the 13th International Scientific Conference on Economic and Social Development, Barcelona, Spain, 14–16 April 2016. [Google Scholar]
Figure 1. Geographic locations of coastal cities in China (city numbers correspond to Table 1).
Remotesensing 17 02075 g001
Figure 2. The technical process of the study.
Remotesensing 17 02075 g002
Figure 3. (a) Sentinel-2 spectral response functions. (b) Normalized CIE 1964 XYZ color matching functions (D65 10°). Each curve’s color indicates its sensitivity to a specific part of the visible spectrum (red, green, or blue).
Remotesensing 17 02075 g003
Figure 4. (a) Scatter plot of true vs. estimated XYZ values with fitted lines and (b) RMSE of estimated XYZ values.
Remotesensing 17 02075 g004
Figure 5. HSV color space.
Remotesensing 17 02075 g005
Figure 6. Illustration of the color richness index calculation method.
Remotesensing 17 02075 g006
Figure 7. The top two images show the true-color Sentinel-2 image (A) and the optimized natural-color product (B) of the built-up area of Zhuhai City. In the lower panels, (a), (c), (e), and (g), respectively, show residential areas, bare land, forest, and white-roofed buildings in the true-color images, while (b), (d), (f), and (h), respectively, show the corresponding areas in the natural-color product.
Remotesensing 17 02075 g007
Figure 8. The top two images show the true-color Sentinel-2 image (A) and the optimized natural-color product (B) of the built-up area of Yantai City. In the lower panels, (a), (c), (e), and (g), respectively, show residential areas, bare land, forest, and white-roofed buildings in the true-color product, while (b), (d), (f), and (h), respectively, show the corresponding areas in the natural-color product.
Remotesensing 17 02075 g008
Figure 9. Pie charts of the top 20 dominant FFCs in 56 of China’s coastal cities, extracted from natural-color images using clustering algorithms. The area of each color corresponds to its proportion in the city. The RGB values of each color can be found in Table S1.
Remotesensing 17 02075 g009
Figure 10. Typical building complex with blue roofs (ad) and red roofs (eh) in coastal cities (images captured from Baidu Maps).
Remotesensing 17 02075 g010
Figure 11. Drone aerial views of cities: (a) and (b) show Dalian and Qinhuangdao, representing northern coastal cities; (c) and (d) show Ningbo and Wenzhou, representing eastern coastal cities; and (e) and (f) show Shantou and Qinzhou, representing southern coastal cities (photos captured from https://www.720yun.com/, accessed on 1 August 2024).
Remotesensing 17 02075 g011
Figure 12. (a) Box plots of hue for FFCs in coastal cities. (b) Spatial distribution of the mean hue in coastal cities.
Remotesensing 17 02075 g012
Figure 13. (a) Box plots of saturation for FFCs in coastal cities. (b) Spatial distribution of the mean saturation values in coastal cities.
Remotesensing 17 02075 g013
Figure 14. (a) Box plots of value for FFCs in coastal cities. (b) Spatial distribution of the mean value in coastal cities.
Remotesensing 17 02075 g014
Figure 15. Color richness of FFCs in China’s coastal cities.
Remotesensing 17 02075 g015
Figure 16. Color harmony of FFCs in China’s coastal cities.
Remotesensing 17 02075 g016
Figure 17. Four-quadrant plot of FFC richness and harmony in China’s coastal cities, with the horizontal and vertical axes representing the median values of color richness and color harmony, respectively.
Remotesensing 17 02075 g017
Table 1. List of 56 coastal cities in this study.
Province LevelNo.City LevelLong.
(°E)
Lat.
(°N)
Province LevelNo.City LevelLong.
(°E)
Lat.
(°N)
Liaoning1Dandong124.4040.54Fujian29Ningde119.4926.97
2Dalian122.1939.58 30Fuzhou119.2026.05
3Yingkou122.4540.39 31Putian118.9025.44
4Panjin121.9941.07 32Quanzhou118.2725.19
5Jinzhou121.6141.46 33Xiamen118.1224.66
6Huludao120.2140.62 34Zhangzhou117.4524.33
Hebei7Qinhuangdao119.1940.09Guangdong35Chaozhou116.7923.79
8Tangshan118.3339.71 36Shantou116.6023.33
10Cangzhou116.7738.27 37Jieyang116.1223.34
Tianjin9Tianjin117.3439.28 35Shanwei115.5922.88
Shandong11Binzhou117.8437.54 39Huizhou114.5023.24
12Dongying118.6437.64 40Guangzhou113.5423.33
13Yantai120.8037.24 41Dongguan113.8822.93
14Weihai121.9937.12 42Shenzhen114.1422.65
15Qingdao120.1536.45 45Zhongshan113.3922.52
16Weifang119.0736.55 46Zhuhai113.3622.15
17Rizhao119.1435.58 47Jiangmen112.6722.27
Jiangsu18Lianyungang119.1434.54 48Yangjiang111.7822.03
19Yancheng120.2033.51 49Maoming110.9522.01
20Nantong121.0432.18 50Zhanjiang110.1721.08
Shanghai21Shanghai121.4831.21Hongkong43Hongkong114.1722.32
Zhejiang22Jiaxing120.7830.62Macao44Macao113.5422.20
23Hangzhou119.4729.90Guangxi51Beihai109.3421.66
24Shaoxing120.6429.73 52Qinzhou109.0222.17
25Ningbo121.4829.73 53Fangchenggang108.0121.87
26Zhoushan122.1830.12Hainan54Haikou110.4219.85
27Taizhou121.1428.76 55Danzhou109.3919.58
28Wenzhou120.4627.90 56Sanya109.4218.364
Table 2. Spectral information from the Sentinel-2 MSI sensor.
BandDescriptionWavelength
(nm)
Resolution (m)
B1Aerosols433–45360
B2Blue458–52310
B3Green543–57810
B4Red650–68010
B5Red Edge 1698–71320
B6Red Edge 2733–74820
B7Red Edge 3773–79320
B8NIR785–90010
B8ARed Edge 4855–87520
B9Water Vapor935–95560
B10SWIR/Cirrus Clouds1360–139060
B11SWIR 11565–165520
B12SWIR 22100–228020
QC60Cloud Mask/60
Disclaimer/Publisher’s Note: The statements, opinions and data contained in all publications are solely those of the individual author(s) and contributor(s) and not of MDPI and/or the editor(s). MDPI and/or the editor(s) disclaim responsibility for any injury to people or property resulting from any ideas, methods, instructions or products referred to in the content.

