Article

PCLC-Net: Parallel Connected Lateral Chain Networks for Infrared Small Target Detection

by
Jielei Xu
1,†,
Xinheng Han
1,†,
Jiacheng Wang
1,
Xiaoxue Feng
1,
Zhenxu Li
2 and
Feng Pan
1,*
1
School of Automation, Beijing Institute of Technology, Beijing 100081, China
2
SDIC Yunnan Dachaoshan Hydropower Co., Ltd., Kunming 650213, China
*
Author to whom correspondence should be addressed.
These authors contributed equally to this work.
Remote Sens. 2025, 17(12), 2072; https://doi.org/10.3390/rs17122072
Submission received: 6 May 2025 / Revised: 10 June 2025 / Accepted: 14 June 2025 / Published: 16 June 2025

Abstract

:
Given the widespread influence of U-Net and FPN network architectures on infrared small target detection tasks on existing models, these structures frequently incorporate a significant number of downsampling operations, thereby rendering the preservation of small target information and contextual interaction both challenging and computation-consuming. To tackle these challenges, we introduce a parallel connected lateral chain network (PCLC-Net), an innovative architecture in the domain of infrared small target detection, that preserves large-scale feature maps while minimizing downsampling operations. The PCLC-Net preserves large-scale feature maps to prevent small target information loss, integrates causal-based retention gates (CBR Gates) within each chain for improved feature selection and fusion, and leverages the attention-based network-wide feature map aggregation (AN-FMA) output module to ensure that all feature maps abundant with small target information contribute effectively to the model’s output. The experimental results reveal the PCLC-Net, with minimal nodes and just a single downsampling, achieves near state-of-the-art performance using just 0.16M parameters (40% of the current smallest model), yielding an I o U of 80.8%, P d of 95.1%, and F a of 28.6 × 10 6 on the BIT-SIRST dataset.

1. Introduction

Object detection plays a crucial role in vision tasks, while the Convolutional Neural Network (CNN) is an important tool for object detection tasks. Researchers have extensively explored CNNs’ depth and connectivity patterns, developing many unique and distinctive network architectures [1,2,3,4,5,6]. Single-frame Infrared Small Target (SIRST) detection represents a prominent branch within object detection, occupying a crucial position in applications including maritime surveillance [7], early warning systems [8], and precise guidance [9]. Owing to the progress in CNN, U-Net series [10,11,12,13], and feature pyramids [14], segmentation-based SIRST detection methodologies have emerged as the predominant trend.
However, the undeniable truth is that current CNN-based detectors endeavor to retain small object information within the deeper network layers to overcome the information loss caused by downsampling. This necessitates implementing iterative feature fusion and enhancement techniques for exchanging high-level semantics and subtle low-level details, specifically designed to uphold the integrity of small object information in these network sections [15].
For instance, ACM [15] and ALCNet [16] introduce bottom-up modulation pathways into the network. ISTDU-Net [17] introduces feature map groups in network downsampling, sensing, and enhancing the weights of small target feature map groups and introduces a fully connected layer in jump connection. AGPCNet [18] introduces an attention-guided context block, context pyramid module, and asymmetric fusion module to achieve global correlation and integration of low-level and deep-level semantics. UIUNet [19] introduces the “U-Net in U-Net” framework, enabling the multi-level and multi-scale representation learning of objects. FCNet [20] proposes a flexible convolutional network that combines dilated and deformable convolutions to achieve adaptive receptive field adjustment. The architecture employs a Feature Enhancement Module (FEM) to fuse standard and dilated convolutions for precise feature extraction, a Context Fusion Module (CFM) to maintain contextual information during downsampling, and a Semantic Fusion Module (SFM) to integrate multi-level features during upsampling, with squeeze-and-excitation blocks further enhancing channel-wise feature representation. DNA-Net [21] fuses both shallow and deep features from fine to coarse, through dense nested connections from inside to outside, then strengthens the feature propagation and reuse to a large extent. HCFNet [22] introduces the parallelized patch-aware attention module, dimension-aware selective integration module, and multi-dilated channel refiner module to achieve feature fusion. FMADNet [23] employs a U-Net backbone and integrates two key components: a Residual Multi-Scale Feature Enhancement (RMFE) module for adaptive multi-scale feature refinement to enhance small target detection, and an Adaptive Feature Dynamic Fusion (AFDF) module that intelligently combines encoder–decoder features during upsampling while highlighting spatially significant regions, ultimately improving detection accuracy. WGFFNet [24] adopts a conventional encoder–decoder architecture. During the encoding phase, the incorporated Stepped Fusion Block (SFB) extracts multi-scale local contextual details with enhanced precision. In the decoding pathway, a Fully Gated Interaction (FGI) module systematically combines features from different levels to strengthen feature representation.
These distinctive modules and operations have been demonstrated to be effective through both experimental validation and theoretical analysis. However, the integration of these modules entails a notable augmentation in both parameter count and computational cost. Additionally, existing models lack adequate emphasis on feature channel selection during feature fusion, despite experimental confirmation of channel redundancy [25].
To strike a better balance between model performance and computational cost, we have reconsidered the architecture of segmentation models, emphasizing the incorporation of learnable feature channel selection during the feature fusion phase.
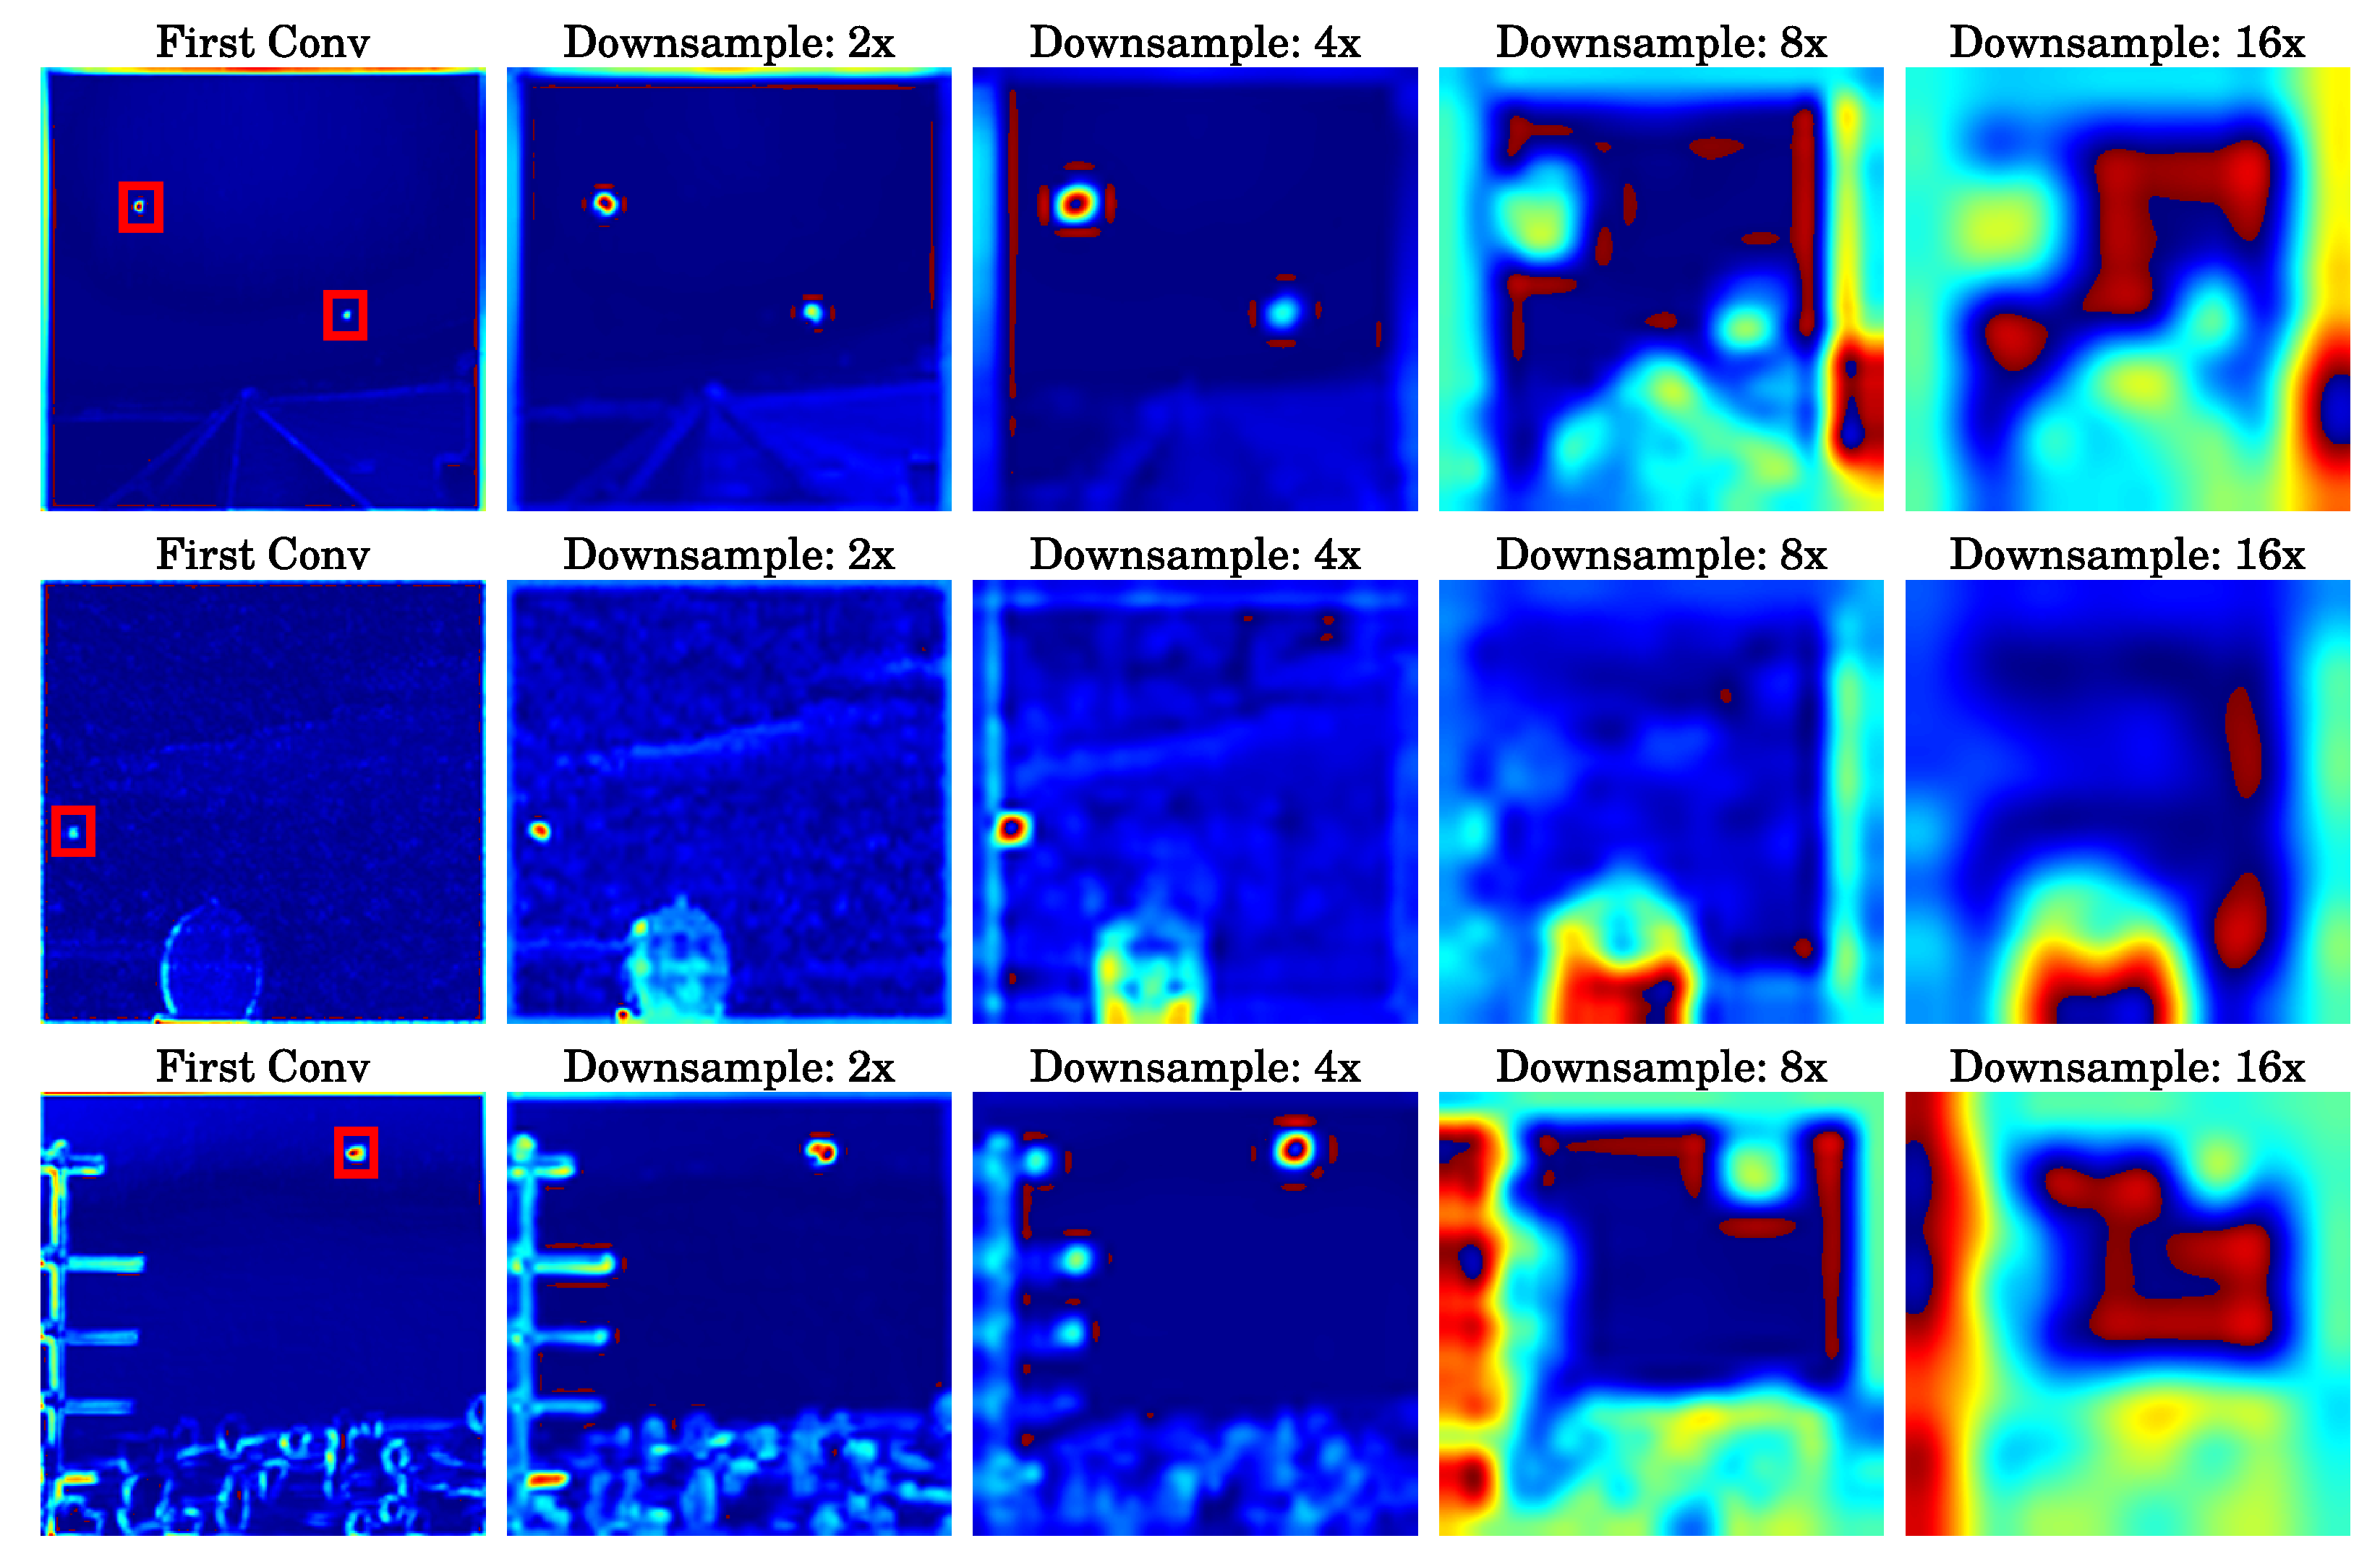
In segmentation tasks, U-Net++ [12] has shown that the optimal depth of the model is not known beforehand, requiring extensive searches for the appropriate architecture or inefficient ensemble of models of varying depths. Yet, regarding the SIRST detection, we can formulate the following conclusions: (1) The shallow layers of the network are rich in information about small targets. To validate this viewpoint, we conduct effective training of the U-Net [10] network on an infrared small target dataset. After training, the model is analyzed for the heatmap distribution of feature maps following each downsampling operation, as shown in Figure 1. The heatmaps reveal that in the shallow layers, specifically following the first convolutional operation, the first downsampling, and the second downsampling, the feature maps distinctly and prominently capture the information of small targets. However, in the deeper layers, with 8× downsampling and beyond, the information pertaining to small targets is largely overwhelmed. (2) Convolutional operations inherently possess filtering capabilities, which are proven to be effective for SIRST [26,27,28,29].
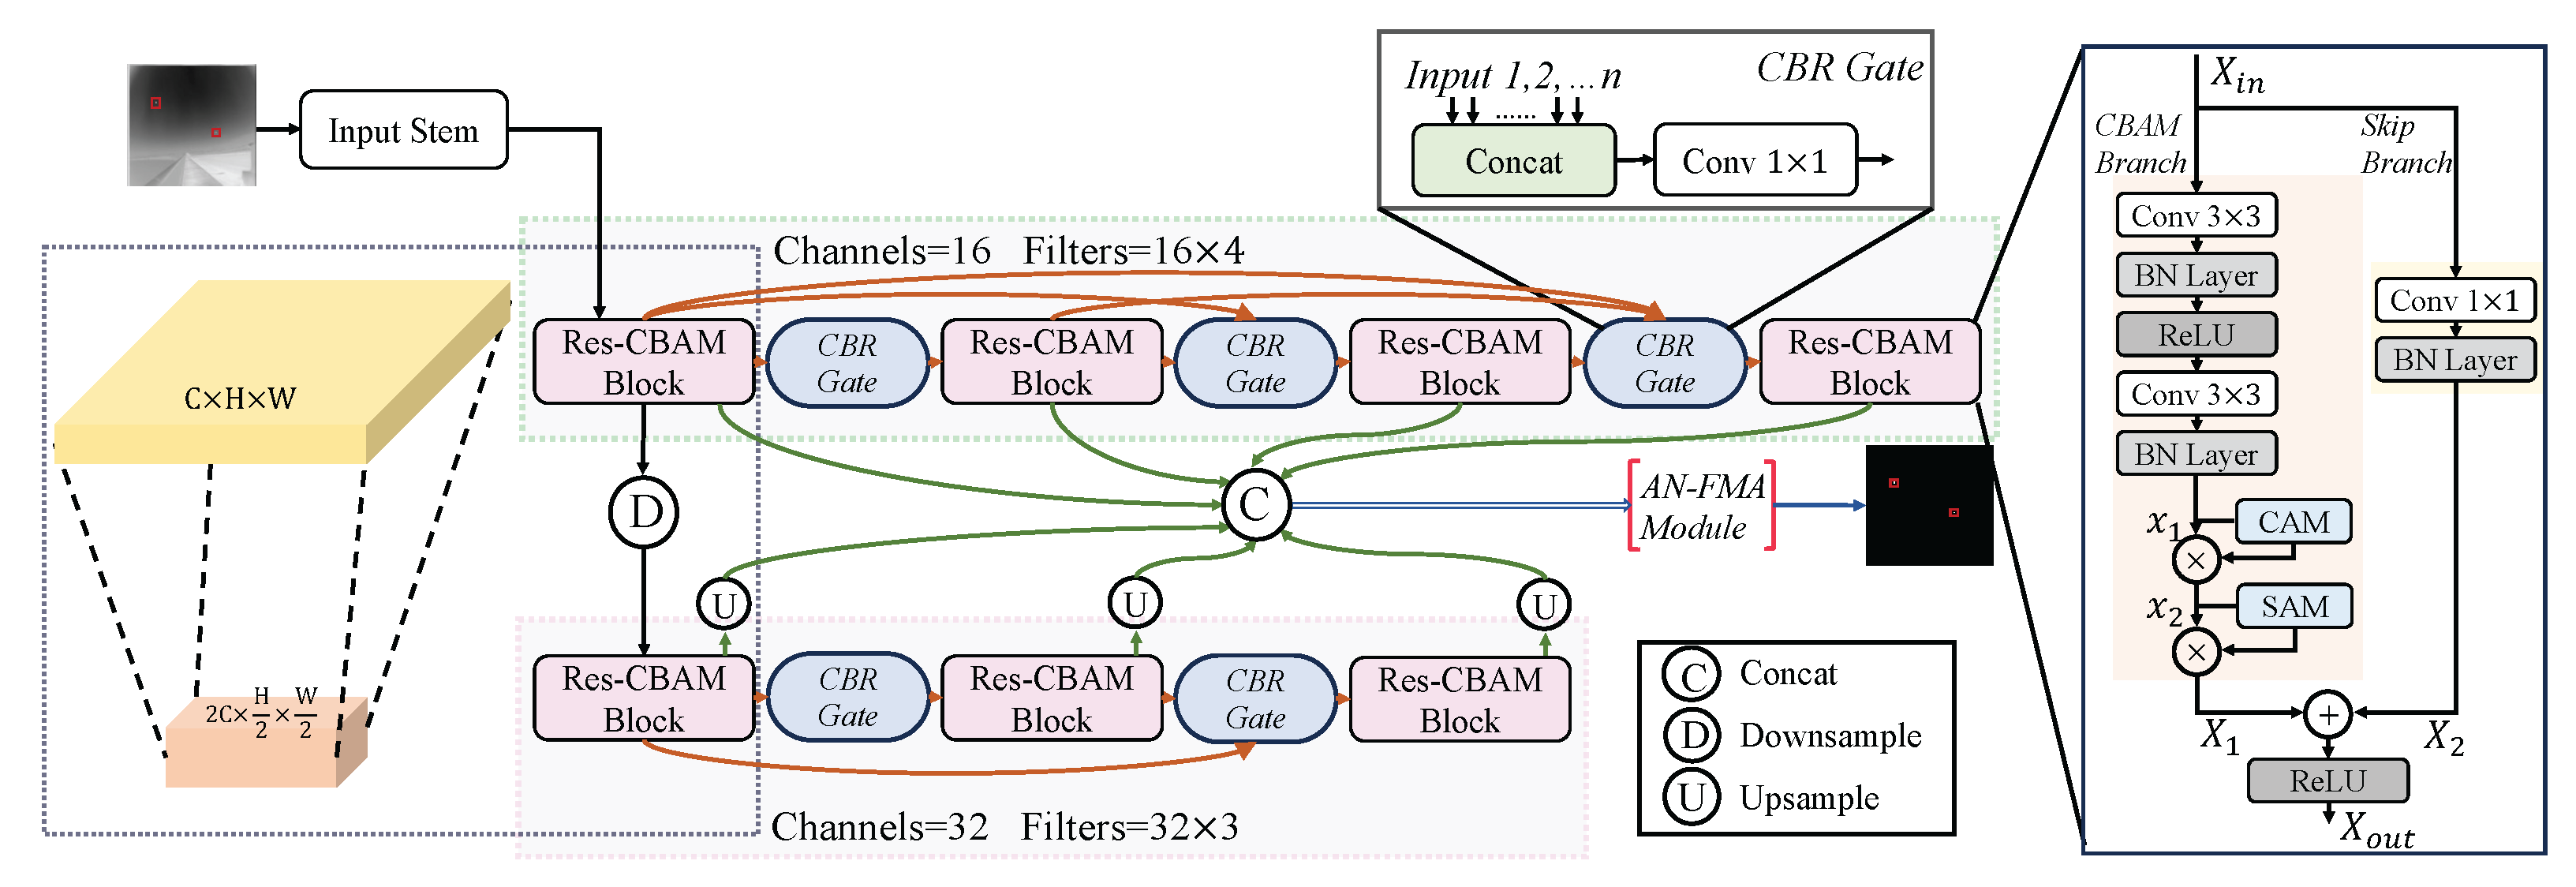
Drawing inspiration from the concepts above, we have rethought the architecture of current SIRST detection models, ultimately leading to the design of the Parallel Connected Lateral Chain Network (PCLC-Net), as shown in Figure 2. A key highlight of the PCLC-Net is its minimalist approach to downsampling, where only a single downsampling operation is performed throughout the entire network. Furthermore, it promotes selective information fusion among feature maps of identical scales, culminating in the aggregation of feature maps from all nodes at the network’s output. To sum up, our paper makes the following contributions:
  • We propose and confirm that merely a single downsampling step while maintaining large-scale feature maps, can effectively achieve the detection of SIRST with minimum parameters.
  • The CBR Gate and AN-FMA module are proposed, ensuring nodes in the parallel connected lateral chain networks integrate information from all of the preceding nodes for selective target feature fusion with causal inference, and selective output feature map fusion.
  • The PCLC-Net, featuring the parallel connected lateral chain structure, effectively utilizes the rich information of small targets in large-scale feature maps, thereby eliminating the difficulty of maintaining small target information in deep layers.
  • Extensive experiments confirm that the PCLC-Net, leveraging dual-chain parallelism, outperforms existing detectors. Additionally, we offer guidelines for selecting chain and node counts in the network.

2. Materials and Methods

2.1. Res-CBAM, CBR Gate, and AN-FMA Module

The majority of existing models for SIRST detection are restricted to U-shape or pyramid architectures for feature extraction, inevitably leading to the loss of small target information due to excessive downsampling operations. Therefore, current networks have incorporated sophisticated interaction modules to enhance the preservation and fusion of small target information, resulting in increasingly complex networks and substantial computational cost.
To avoid excessive downsampling operations and tackle the complexity of the network, we propose a lightweight parallel connected lateral chain structure, effectively minimizing downsampling operations while preserving large-scale feature maps to circumvent the loss of small target information. In addition, the feature fusion modules in current networks treat all channels of all feature maps uniformly, despite research indicating that not all feature maps positively impact the model’s performance [25]. Hence, we introduce the residual connection and convolutional block attention module-based block (Res-CBAM Block) and causal-based retention gate (CBR Gate) for selective channel fusion among diverse feature maps during feature integration and propose the attention-based network-wide feature map aggregation (AN-FMA) module for further selective fusion of the output features of all nodes. To facilitate a detailed description, we further abstract and simplify the Figure 2, as shown in Figure 3.
(1) Res-CBAM Block: Serves as a crucial node in constructing the PCLC-Net, playing a fundamental role in its architecture. As in Figure 2, this structure enables the Res-CBAM Block to effectively capture and enhance discriminative features from the input data, while simultaneously preserving important spatial and contextual information through the skip branch. The CBAM branch, in particular, introduces attention mechanisms that allow the model to focus on the most relevant features for detecting infrared small targets, thereby improving the overall performance and robustness of the PCLC-Net. The Res-CBAM Block process can be summarized as follows:
x 1 = F B 3 × 3 ( R ( F B 3 × 3 ( X i n ) ) ) , x 2 = M c ( x 1 ) x 1 , X 1 = M s ( x 2 ) x 2 , X 2 = F B 1 × 1 ( X i n ) , X o u t = R ( X 1 X 2 ) ,
where X i n , X o u t denote the input map and output map of the Res-CBAM Block; x 1 , x 2 denote the intermediate feature maps, as shown in Figure 2; R denotes the ReLU activation function [30]; F B n × n denotes n × n convolution with BN layer; M c denotes the channel attention map; M s denotes the spatial attention map; ⊗ denotes element-wise multiplication; and ⊕ denotes element-wise addition.
(2) CBR Gate: Serving as a vital module for feature integration among nodes within a lateral chain, it is essential for maintaining contextual coherence in lateral structures. The interconnections among nodes are pivotal, as they foster the integration and retention of information across various nodes. The feature map outputted by each node is regarded as the result of applying a multitude of filters to the input, outcoming a sufficient number of filters are in place (as in Figure 2, the first lateral chain has 64 filters and the second has 96 filters). Nevertheless, an inevitable challenge lies in the varying quality of filters learned through data-driven methods, where some excel while others fall short. The CBR Gate adeptly tackles this challenge by autonomously learning gating weights, thereby enabling selective, gated weighted fusion of all filtering results from preceding nodes.
The design of the CBR Gate is straightforward, as shown in Figure 2, comprising a concat operation and a 1 × 1 convolutional layer that functions to perform gated, weighted selection across feature channels. Within a lateral chain configuration, the input to the nth CBR Gate comprises the outputs from the preceding n Res-CBAM Blocks ( N , 1 , N , 2 , . . . , N , n , as shown in Figure 3), with the output of the nth CBR Gate subsequently serving as the input for the (n + 1)th Res-CBAM Block ( N , n + 1 , as shown in Figure 3). Given feature maps I , n = { X o u t , 1 , X o u t , 2 , . . . , X o u t , n } as the input of the nth CBR Gate, the CBR Gate process can be summarized as follows:
X i n , n + 1 = O , n = F 1 × 1 ( C i = 1 n ( X o u t , i ) ) ,
where O , n denotes the output map of nth CBR Gate, F n × n denotes n × n convolution without BN layer, and C denotes concat operation; * indicates Equation (2) holds for nodes within the same lateral chain.
The CBR Gate is specifically designed to handle the causal relationship between the (n + 1)th node in the architecture and the previous n nodes, i.e., the features of the (n + 1)th node are jointly determined by the features of the previous n nodes. As in Equation (2) and Figure 3, this relationship reflects both the logical dependency and temporal computational sequence in the actual computation graph. This means that when calculating the input to node N i , j + 1 via the CBR Gate, it both temporally and logically depends on the feature map outputs from the preceding nodes N i , 1 , N i , 2 , , N i , j .
(3) AN-FMA Module: Serving as the output module of the PCLC-Net, this component is responsible for receiving the output feature maps from all nodes within the network, which are then utilized as its input for further processing and analysis. Prior to any further processing, this module involves resizing all received feature maps to match the dimensions of the features in the first lateral chain, followed by concatenating them along the channel dimension, as shown in Figure 4. The rationale behind designing the AN-FMA module is to consider each channel of each feature map as the output of a convolutional filtering process and to subsequently integrate and selectively utilize the outcomes from all filters within the network. Adopting this strategy leverages the complementary information encoded within diverse filter responses, enabling the AN-FMA module to capture a richer, more comprehensive input data representation, thereby augmenting our model’s robustness and facilitating more efficient feature extraction and fusion. We denote the output feature maps of all nodes within the ith lateral chain as M i = { X o u t i , 1 , X o u t i , 2 , . . . , X o u t i , l i } , where X o u t i , j represents output map of the node N i , j , and l i represents the count of nodes in the ith chain. The process of the AN-FMA module can be summarized as follows:
X o u t i , j = X o u t i , j , i = 1 , U ( X o u t i , j ) , o t h e r w i s e , O u t p u t = W C i C j = 1 l i ( X o u t i , j ) ,
where U denotes the upsampling operation, X o u t i , j denotes the result of upsampling X o u t i , j from the initial feature map scale, W denotes the attention weights of each channel.

2.2. Parallel Connected Lateral Chain Networks

To comprehensively extract and utilize the features from shallow networks, we introduce the PCLC-Net, which is designed by laterally expanding through alternating connections of Res-CBAM Blocks and CBR Gates, and employing the AN-FMA module to derive the output. The structure of the PCLC-Net is shown in Figure 2. This architecture transcends the traditional network forms of U-Net [10] and FPN [14] by integrating the unique characteristics of small infrared targets and adhering to the principle of minimizing downsampling operations. It executes convolutional operations and feature fusion only at the feature map scales corresponding to [ H , W ] and [ H 2 , W 2 ] , respectively.
This results in a lateral chain-like structure where feature extraction blocks and feature fusion blocks alternate. A second lateral chain is introduced, originating from the initial downsampling operation at the head of the first chain. This structure minimizes downsampling and retains rich small-target information in large-scale feature maps, while effectively balancing model performance and computational cost due to its simplicity.
Within this architecture, the Res-CBAM Block, which leverages residual connections [5] and the convolutional block attention module [31], is employed to extract information pertaining to small infrared targets from the input feature maps. Each channel of the output feature maps from this block is viewed as a filtered representation of the input feature maps. These blocks are termed as nodes. The CBR Gate, leveraging causal connections, is employed to integrate the output features of all preceding nodes within a given lateral chain, serving as the input for subsequent nodes. The AN-FMA module upsamples the outputs of all nodes in the network to match the feature map scale of the first lateral chain. By learning attention weights of each channel, it integrates the output feature maps of all these nodes to produce the network’s output. Essentially, this operation involves selecting and aggregating filters corresponding to each channel.

2.3. Model Complexity

In Section 2.1 and Section 2.2, we presented the PCLC-Net and delved into its crucial modules’ design concepts and detailed implementations. In this part, we will engage in a discussion about the quantity of parallel connected lateral chains and the number of nodes within each chain in the PCLC-Net, while also providing further insights into the underlying design philosophy.
As defined by SPIE [28], infrared small targets occupy a total spatial range of fewer than 80 pixels (9 × 9) within a 256 × 256 image frame, characterized by their weak signals and the absence of texture information.
The process of downsampling entails a notable reduction in detailed information as it decreases the number of image pixels. For small targets that are inherently small in size and possess limited informational content, this loss of information is especially acute, potentially causing their features to become indistinct or entirely lost within the image, thereby undermining the precision of target detection. Consequently, we recommend minimizing downsampling to just a single instance and constructing the PCLC-Net with dual parallel connected lateral chains. This strategy ensures that rich information related to small targets in the feature maps is preserved to the fullest extent. Additionally, this single downsampling step allows the model to grasp global image features on a higher level. The necessity and effectiveness of using dual parallel lateral chains will be verified in the experiments of Section 3.4.
Assuming that the ith chain comprises l i nodes, with the first node possessing an input feature map characterized by c i channels and dimensions of ( h i , w i ) .
The computational complexity associated with each node N i , j within the PCLC-Net can be formulated as:
O ( N i , j ) = c i × f N ( h i , w i ) , j = 1 , ( j 1 ) c i × f N ( h i , w i ) , o t h e r w i s e ,
where f N ( · ) denotes a function related to h i and w i , which is used to denote the influence of h i and w i on the computational complexity of node N i , j , and f N ( · ) h i × w i .
The computational complexity associated with each CBR Gate G i , j within the PCLC-Net can be formulated as:
O ( G i , j ) = j c i × f G ( h i , w i ) ,
where f G ( · ) denotes a function related to h i and w i , which is used to denote the influence of h i and w i on the computational complexity of CBR Gate G i , j , and f G ( · ) h i × w i .
The computational complexity associated with each lateral chain L i within the PCLC-Net can be formulated as:
O ( L i ) = i = 1 l i O ( N i , j ) + i = 1 l i 1 O ( G i , j ) = l i 2 l i + 2 2 c i × f N ( h i , w i ) + l i 2 l i 2 c i × f G ( h i , w i ) ,
Further, the computational complexity of the whole network can be obtained:
O ( N e t ) = i O ( L i ) ,
Restricting the network structure to i = 2 , l 1 l 2 = 1 , c 1 = c 2 / 2 , h 1 = 2 × h 2 and w 1 = 2 × w 2 , its computational complexity can be simplied as:
O ( N e t ) = 3 l 1 2 5 l 1 + 8 4 c 1 × f N ( h 1 , w 1 ) + l 1 2 2 l 1 + 1 2 c 1 × f G ( h 1 , w 1 ) .
The computational complexity of the PCLC-Net approximates a quadratic relationship concerning the number of nodes, implying that as the number of nodes increases, the computational complexity of the model rises quadratically.
To achieve a balance between model performance and computational complexity, it is imperative to utilize a combination of testing experiments and model architecture search strategies, aiming to identify the optimal number of nodes that minimize complexity while maintaining the model’s robustness and effectiveness. Based on extensive experimental results, this paper recommends adopting the node parameter of l 1 = 4 , l 2 = 3 .

3. Results

3.1. Implementation Details

Throughout all experiments, commonly used public datasets, including SIRST [15], NUDT-SIRST [21], and BIT-SIRST [32], were employed for the training and evaluation of the model. Specifically, the SIRST dataset encompasses 427 images split into training and test datasets in a 1:1 ratio; the NUDT-SIRST dataset comprises 1327 images split into training and test datasets in a 1:1 ratio; and the BIT-SIRST dataset contains 10,568 images split into training and test datasets in a 7:3 ratio. Before training, all images underwent conversion to single-channel grayscale format. Then, these images were resized to a resolution of 256 × 256 before being fed into the network.
All networks employed for comparison, along with our proposed network, were trained using the Soft-IoU loss function and optimized by the Adagrad method [33] with the CosineAnnealingLR [34] scheduler. We initialized the weights and bias of all models using the Xavier method [35]. The learning rate was set to 0.05 after a grid search over a range of values (e.g., 0.1, 0.05, 0.01), where 0.05 demonstrated the best trade-off between convergence speed and stability. The batch size was chosen as 8, determined through empirical testing to balance memory constraints and generalization performance—larger batches led to unstable training due to GPU memory limitations. The number of epochs was fixed at 500 to allow sufficient convergence without overfitting, based on observing validation performance across multiple training runs. All models were implemented in PyTorch [36] on a computer with a 12th Gen Intel Core i5-12400F CPU and an NVIDIA GeForce RTX4060 GPU.

3.2. Evaluation Metrics

Intersection over union, probability of detection, and false alarm rate are utilized as evaluation metrics in our study.
(1) Intersection Over Union (IoU): IoU serves as a pixel-based evaluation metric, assessing the algorithm’s capacity to delineate profiles accurately. It is computed by determining the ratio of the intersection areas to the union of areas between the predictions and the corresponding labels, i.e.,
I o U = A i A u ,
where A i , A u denote the interaction areas and union areas, respectively.
(2) Probability of Detection ( P d ): P d is a target-level evaluation metric that quantifies the effectiveness of predictions by measuring the ratio of correctly predicted targets ( N c o r r e c t ) to the total number of targets ( N a l l ). P d is defined as follows:
P d = N c o r r e c t N a l l .
(3) False Alarm Rate ( F a ): F a represents another pixel-level evaluation metric, employed to assess the ratio of falsely predicted pixels ( P f a l s e ) to the entire population of image pixels ( P A l l ). F a is defined as follows:
F a = P f a l s e P a l l .
Additionally, model parameter count (Params), inference speed (FPS) and floating-point operations (FLOPs) are also considered as evaluation metrics.

3.3. Comparison to the SOTA Methods

To demonstrate the superiority of our method, we compare our PCLC-Net to several state-of-the-art (SOTA) methods, including ACM [15], ALCNet [16], ISTDU-Net [17], RDIAN [37], AGPCNet [18], UIU-Net [19], DNA-Net [21] and HCFNet [22] on the SIRST [15], NUDT-SIRST [21] and BIT-SIRST [32] datasets. For all of these methods, the fixed threshold of 0.5 was adopted, while all remaining parameters were kept unchanged as specified in their original papers. Furthermore, the variant that performs better is selected from their original paper.
(1) Quantivate Results: The quantitative results achieved by different SIRST methods are shown in Table 1 and Table 2. Overall, the PCLC-Net ( l 1 = 4 , l 2 = 3 ) demonstrates balanced and superior performance. It attains comparable results to state-of-the-art methods with minimal parameters. Moreover, despite not being the best in FLOPs and FPS, methods with lower FLOPs and higher FPS, such as ACM [15] and ALCNet [16], lag significantly behind the PCLC-Net ( l 1 = 4 , l 2 = 3 ) in IoU, P d , and F a .
Furthermore, we visualize some representative data in the tables into images for intuitive comparison. Initially, Figure 5a, Figure 6a, and Figure 7a are crafted with consideration of IoU, Params, and FLOPs. The arrangement of circular markers within the figures serves as a visual representation of the models’ overall performance across these dimensions, with those situated closer to the top-left corner indicating superior performance. Secondly, we generate Figure 5b, Figure 6b, and Figure 7b, which depict the comprehensive performance of the models’ P d , F a , and FPS. The positions of the octagonal markers on the figures reflect the overall efficacy of the models with these indicators, with superior performance being indicated by closer proximity to the top-left corner.
The results demonstrate that our PCLC-Net achieves significant improvements in overall model performance compared to existing methods. Specifically, it attains the best performance among current models in terms of IoU, P d , and F a . Furthermore, Params and FLOPs values are notably lower than those of models with equivalent performance. The PCLC-Net ( l 1 = 4 , l 2 = 3 ) attains equivalent IoU, P d , and F a metrics to the current state-of-the-art models—UIU-Net and DNA-Net—while requiring only 0.32% and 3.4% of their respective parameter counts. This superior performance underscores its effectiveness in handling complex tasks and demonstrates its potential for widespread application in SIRST domains.
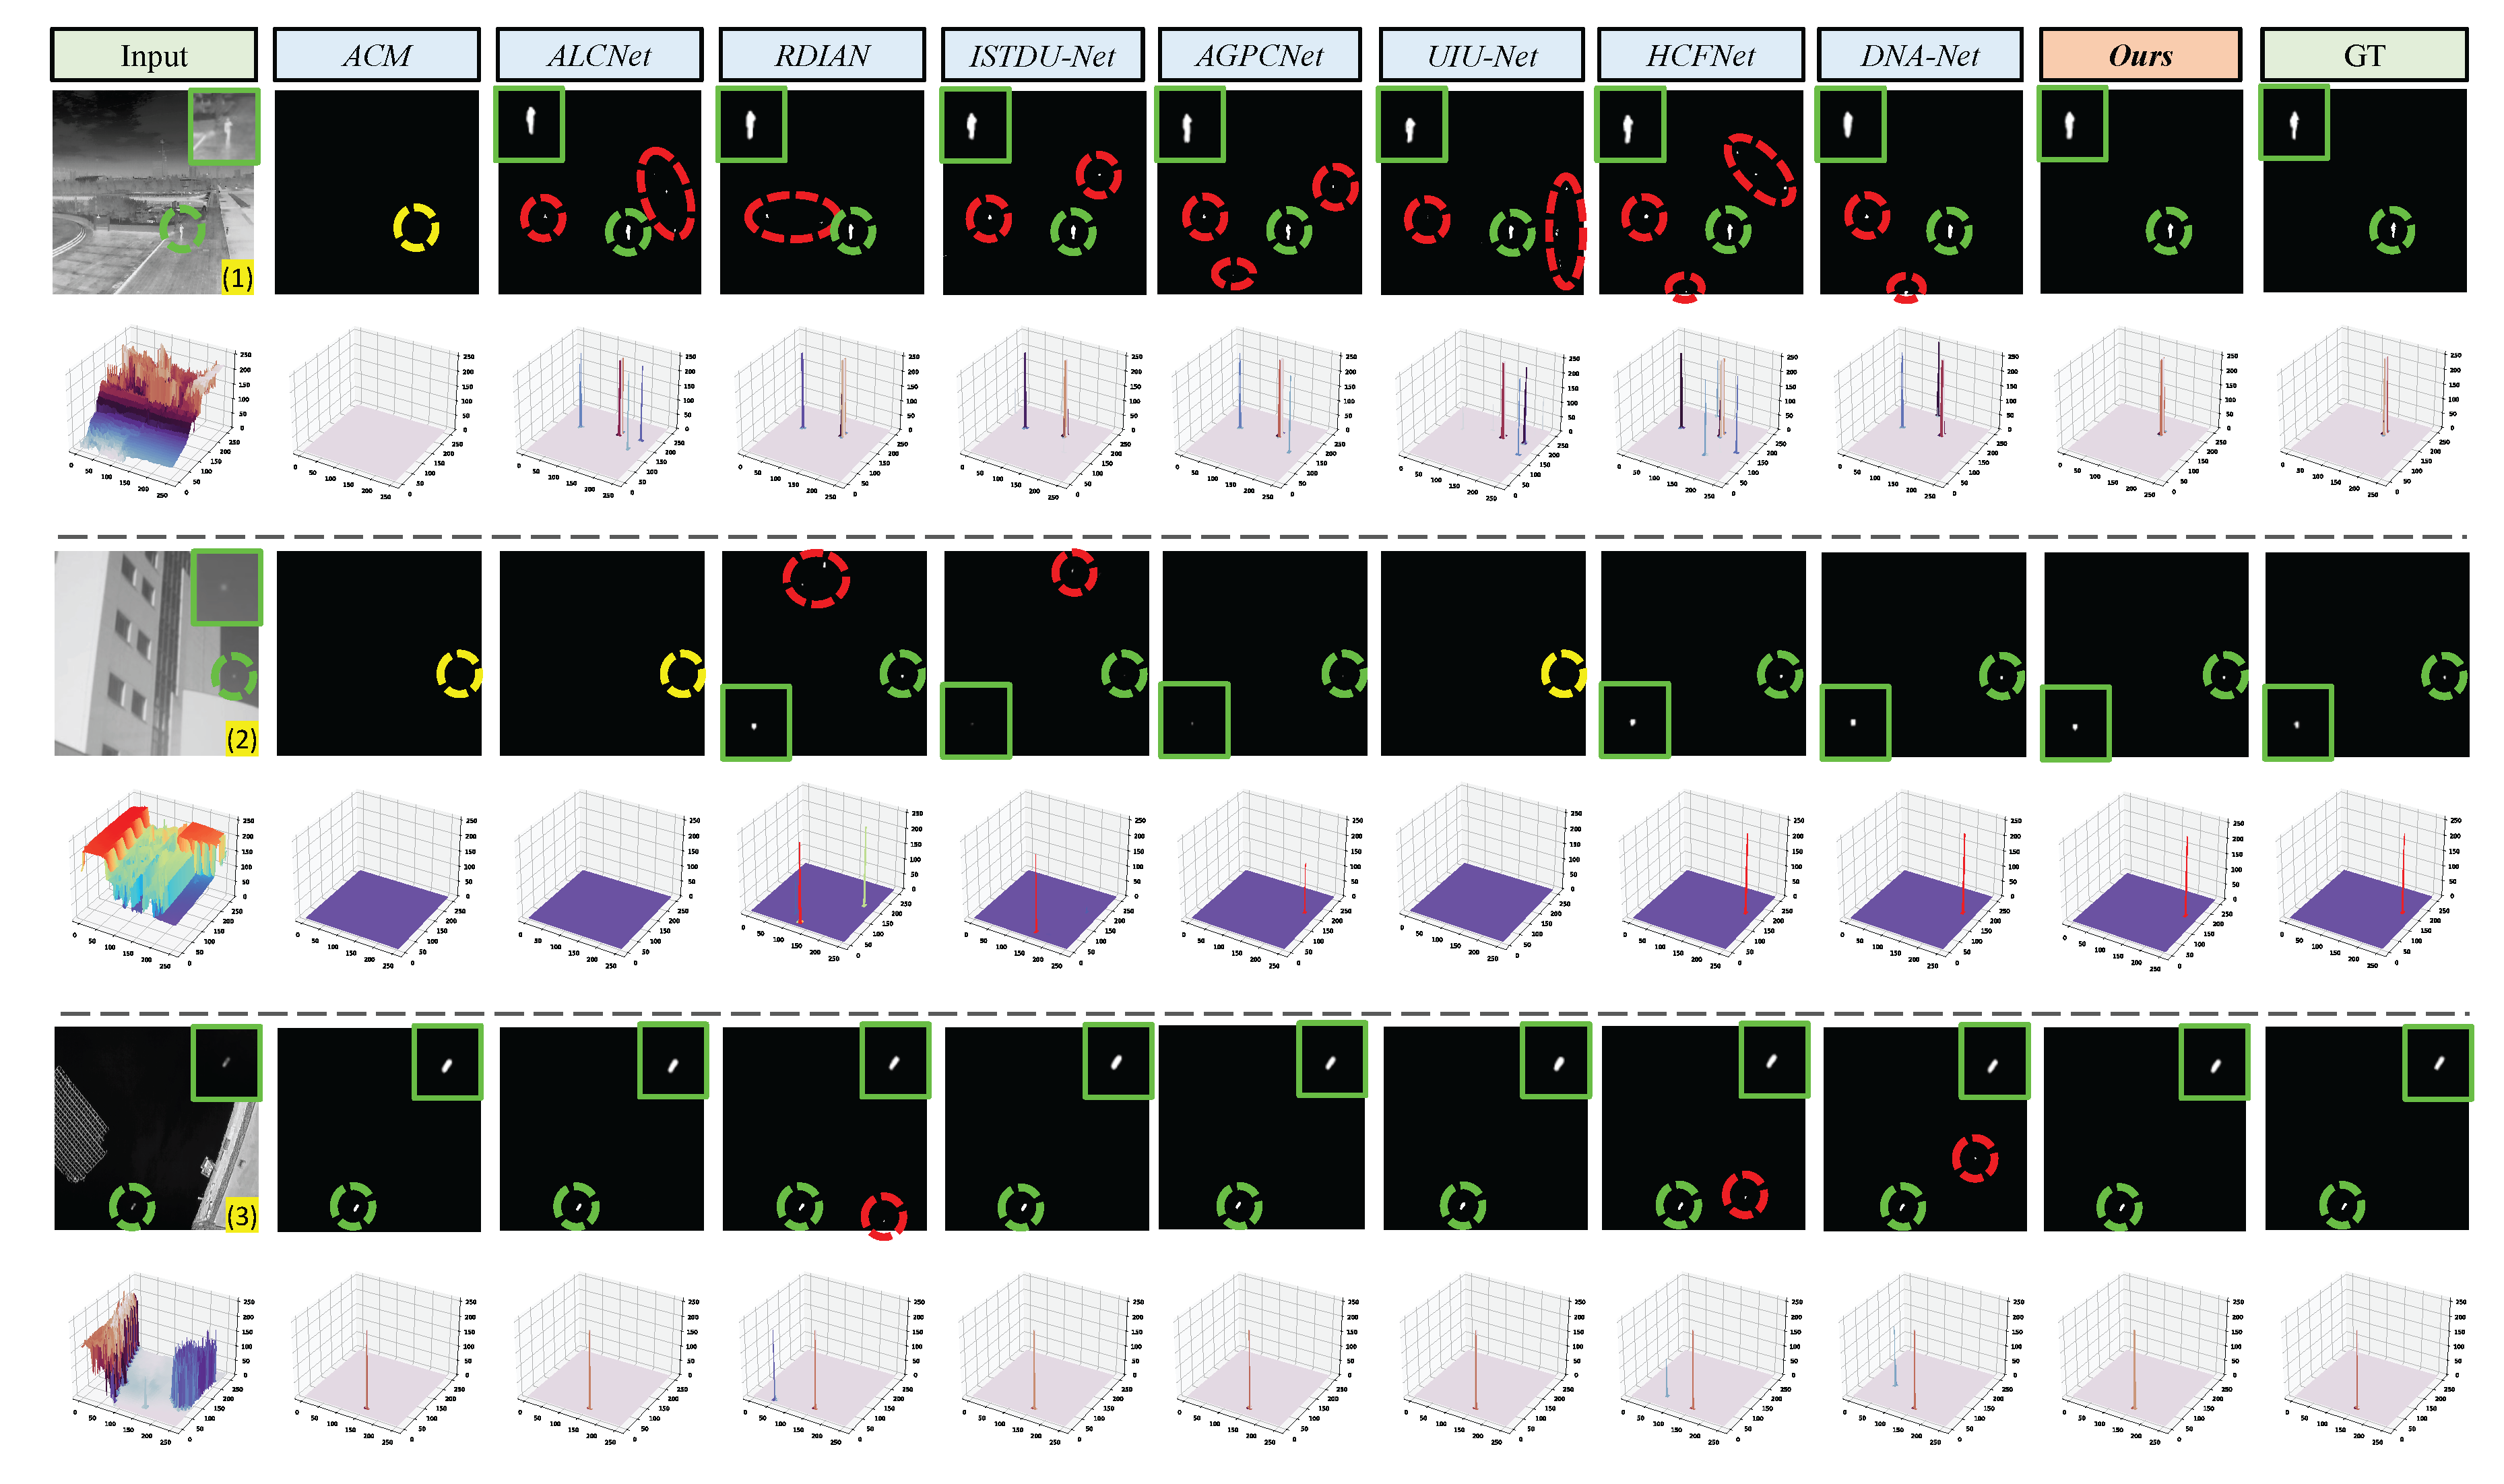
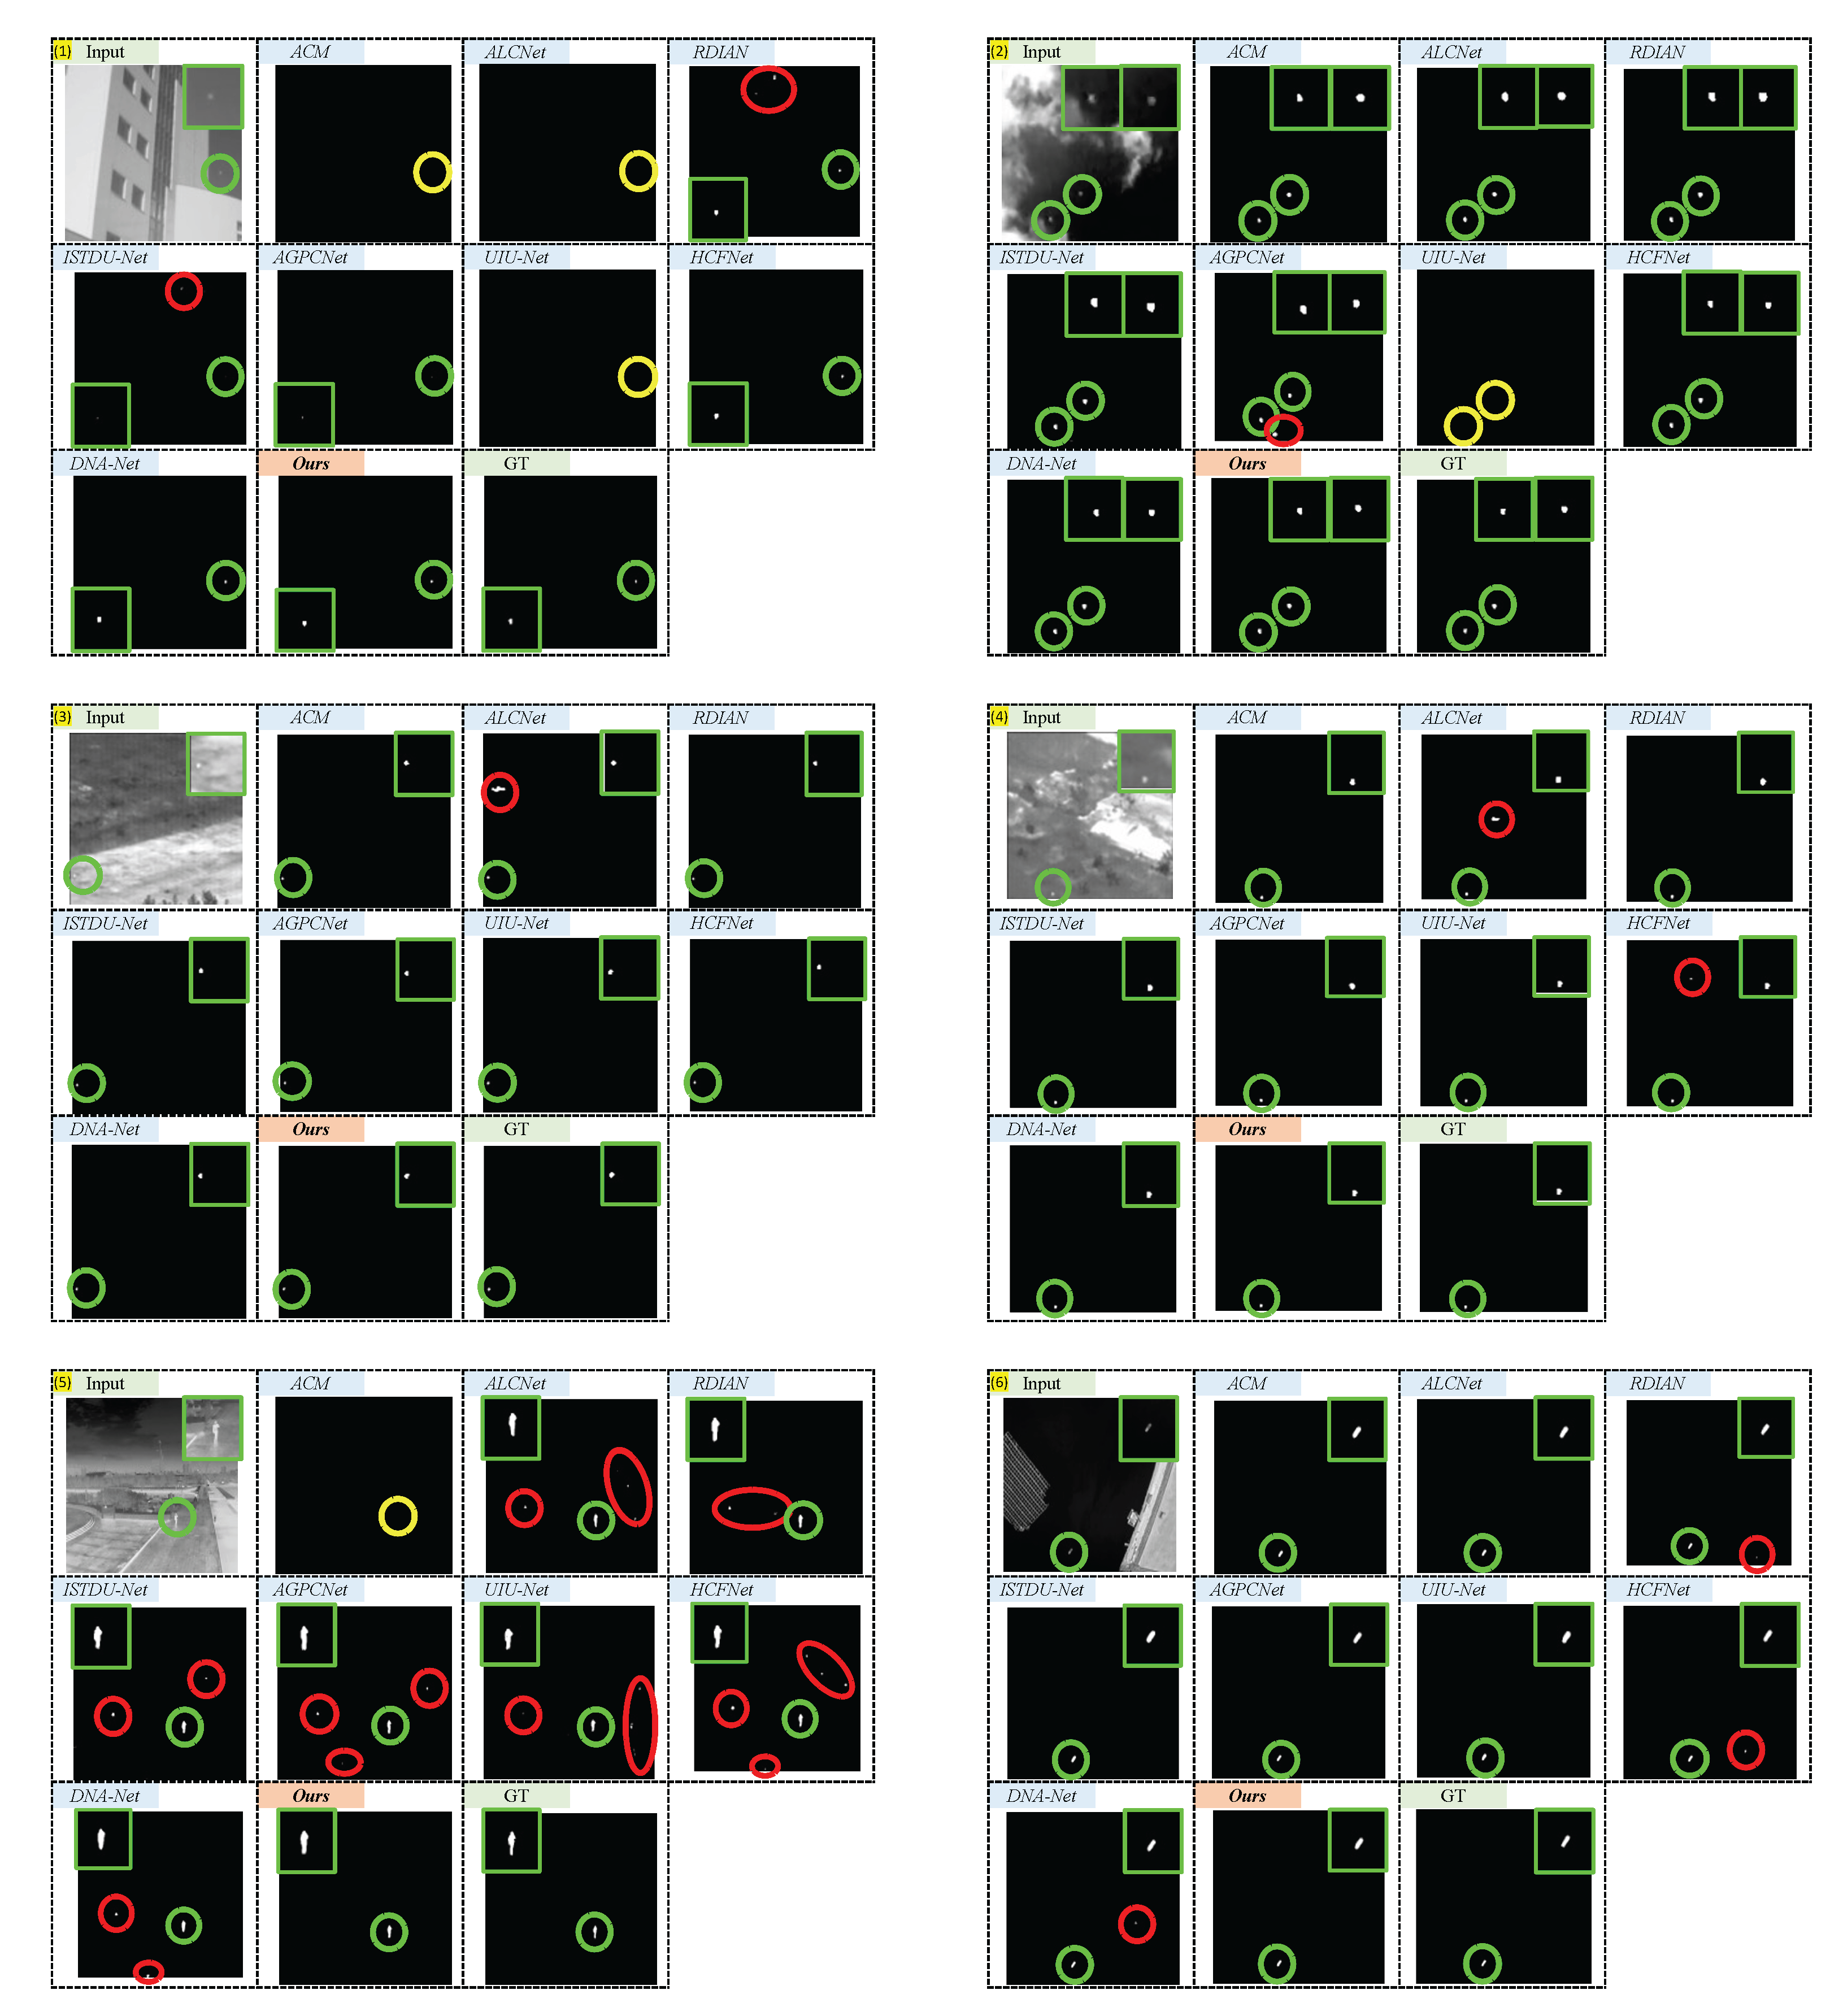
(2) Qualitative Results: The qualitative results are shown in Figure 8. The PCLC-Net ( l 1 = 4 , l 2 = 3 ) exhibits exceptional performance in diverse scenarios, encompassing varying target sizes, shapes, brightness levels, and complexities. Regarding image-(1) this type of input image, its complex distribution of brightness levels presents significant challenges to object detection; for image-(2) this type of input image, the target points are minute and have very low brightness; whereas for image-(3) this type of input image, although the background is relatively clear, the brightness distribution varies extremely. When subjected to these inputs, existing models exhibit varying degrees of false alarms or missed detections, whereas the PCLC-Net delivers satisfactory performance. This is attributed to the design of the PCLC-Net, which is centered around preserving infrared small target information, ensuring that all feature maps within the network maintain rich information pertaining to small targets. Consequently, the network exhibits enhanced specificity towards infrared small targets and robustness against complex environmental backgrounds and interferences.

3.4. Ablation Study

In this part, we compare our PCLC-Net with several variants on the BIT-SIRST dataset [32] to investigate the potential benefits introduced by our network modules and design choices, as shown in Table 3. We fine-tune and manage the number of nodes within the network, decide on the application of CBR Gate and the AN-FMA module, and subsequently assess its performance. We also conduct ablation experiments on the Res-CBAM block. However, since the Res-CBAM block constitutes a core component of the PCLC-Net backbone, it cannot be entirely removed from the network architecture. Therefore, in the ablation study, we evaluate the presence or absence of the CBAM mechanism and the skip branch within the Res-CBAM block.
The results demonstrate that the adoption of the CBR Gate alone increases I o U by 8.85%, increases P d by 2.29%, and decreases F a by 42.6%. Similarly, the adoption of the AN-FMA module alone increases I o U by 7.02%, marginally increases P d by 0.33%, and significantly decreases F a by 47.6%. When both are integrated, the improvements are even more pronounced, with I o U increasing by 13.5%, P d by 3.59%, and F a decreasing by a substantial 69.3%. Furthermore, we conduct a comparative analysis on the inclusion of the CBAM mechanism and the skip branch within the Res-CBAM block. The experimental results demonstrate that incorporating these components yields a positive performance gain. Specifically, the integration of the CBAM mechanism and skip branch improves IoU by 2.80%, P d by 2.48%, and reduces F a by 5.61%. This demonstrates that the Res-CBAM block, CBR Gate, and AN-FMA module contribute positively to the network, and notably, their integration does not lead to a substantial increase in model parameters or FLOPs.
We experimented with further minimizing the number of downsampling operations by constructing the network solely with a single lateral chain, without incorporating any downsampling operations. The results revealed that the inclusion of at least one downsampling operation and the presence of a second lateral chain are indispensable. Specifically, when the network is configured with just one lateral chain, the I o U decreases by 23.1%, P d decreases by 10.3%, and the F a increases by 260.1%.
Furthermore, we conducted a series of experiments by systematically varying the number of nodes within the network, while meticulously ensuring that the condition l 1 l 2 = 1 remained satisfied throughout. This approach allowed us to explore the impact of node count on network performance while maintaining a consistent structural constraint. When the number of nodes is reduced to l 1 = 3 , l 2 = 2 , there is a notable decline in network performance, with I o U decreasing by 3.59%, P d decreasing by 2.31%, and F a increasing by 81.8%. However, when the number of nodes is increased to l 1 = 5 , l 2 = 4 , there is a slight, albeit marginal, improvement in the overall network performance, with I o U increasing by 0.12%, P d increasing by 0.63%, while F a increasing by 15.4% instead.
An intuitive notion is that augmenting the number of nodes to enhance model complexity should lead to superior outcomes. Yet, experimental findings reveal that a network configured with l 1 = 4 , l 2 = 3 already demonstrates exceptional performance. Any subsequent increment in node count merely yields minor enhancements or even degradation in model performance, while simultaneously triggering a quadratic surge in both the number of parameters and floating-point operations.

3.5. Experiments on Additional Datasets

To further investigate and validate the performance of the PCLC-Net across datasets of varying scales and scenarios, this section expands the experimental dataset pool to eight, including NUST-SIRST [38], SIRST [15], IRSTD-1k [39], SIRST v2 [40], NUDT-SIRST [21], IRDST-real [37], ISTDD [18], and BIT-SIRST [32]. Additionally, a comparative analysis is primarily conducted with DNA-Net, which is the model exhibiting the best overall performance in Table 1 and selected for benchmarking purposes.
Given the limited total data volume of SIRST, SIRST v2, IRSTD-1k, and NUDT-SIRST datasets, it is essential to ensure an adequate number of test images for accurately assessing the model’s true performance. Therefore, we decided to split these datasets into training and test sets at a 1:1 ratio. For the IRDST-real dataset, due to its extensive data volume, we also adopted a 1:1 split ratio for practicality during the training process. As for the remaining datasets, which contain an image count ranging from a few thousand to ten thousand, a split ratio of 7:3 is considered more suitable. The training environment and other training-related parameter settings remain consistent with those described in the Section 3.1.
As in Table 4, experimental findings reveal that the PCLC-Net consistently demonstrates outstanding performance across all these prevalent datasets. Specifically, the P d is never less than 85%, and the F a consistently remains within the order of magnitude of 10 5 . Comparative results with DNA-Net reveal that both models achieved highly comparable performance across all eight tested datasets, with the PCLC-Net securing a greater number of best results. Notably, as demonstrated in Table 2, the PCLC-Net exhibits a substantially reduced computational footprint, requiring only 32.9% of the floating-point operations (FLOPs) and 3.4% of the parameters compared to DNA-Net.

4. Discussion

4.1. Training Time Comparison

The design of our proposed PCLC-Net is concise, with an experimental validation of its inference speed presented in Table 2. Herein, we extend our analysis to quantify the training time required by the model, further corroborating that the PCLC-Net constitutes a lightweight network architecture.
The parameter settings for model training and the hardware platform configuration remain consistent with those described in Section 3.1.
The results, as shown in Table 5, offer additional insights into its efficiency, while the PCLC-Net may not boast the fastest training speed, the duration it takes is still deemed acceptable, particularly when training is executed using a solitary NVIDIA RTX 4060, which adequately supports the completion of the training process. It is also important to recognize that methods with faster training times, such as ACM [15], ALCNet [16], and RDIAN [37], significantly lag behind the PCLC-Net in evaluation metrics, highlighting the balance the PCLC-Net achieves between efficiency and performance.

4.2. Extended Discussion on More Variants

In Section 2.3, the relationship between model complexity and the number of nodes designed in the network is discussed in detail. In this part, we present additional quantitative performance metrics for networks with varying numbers of nodes specifically tailored to the SIRST detection task, alongside an extended discussion on model complexity. The objective is to further emphasize that the PCLC-Net, configured with l 1 = 4 and l 2 = 3 , exhibits superior overall performance.
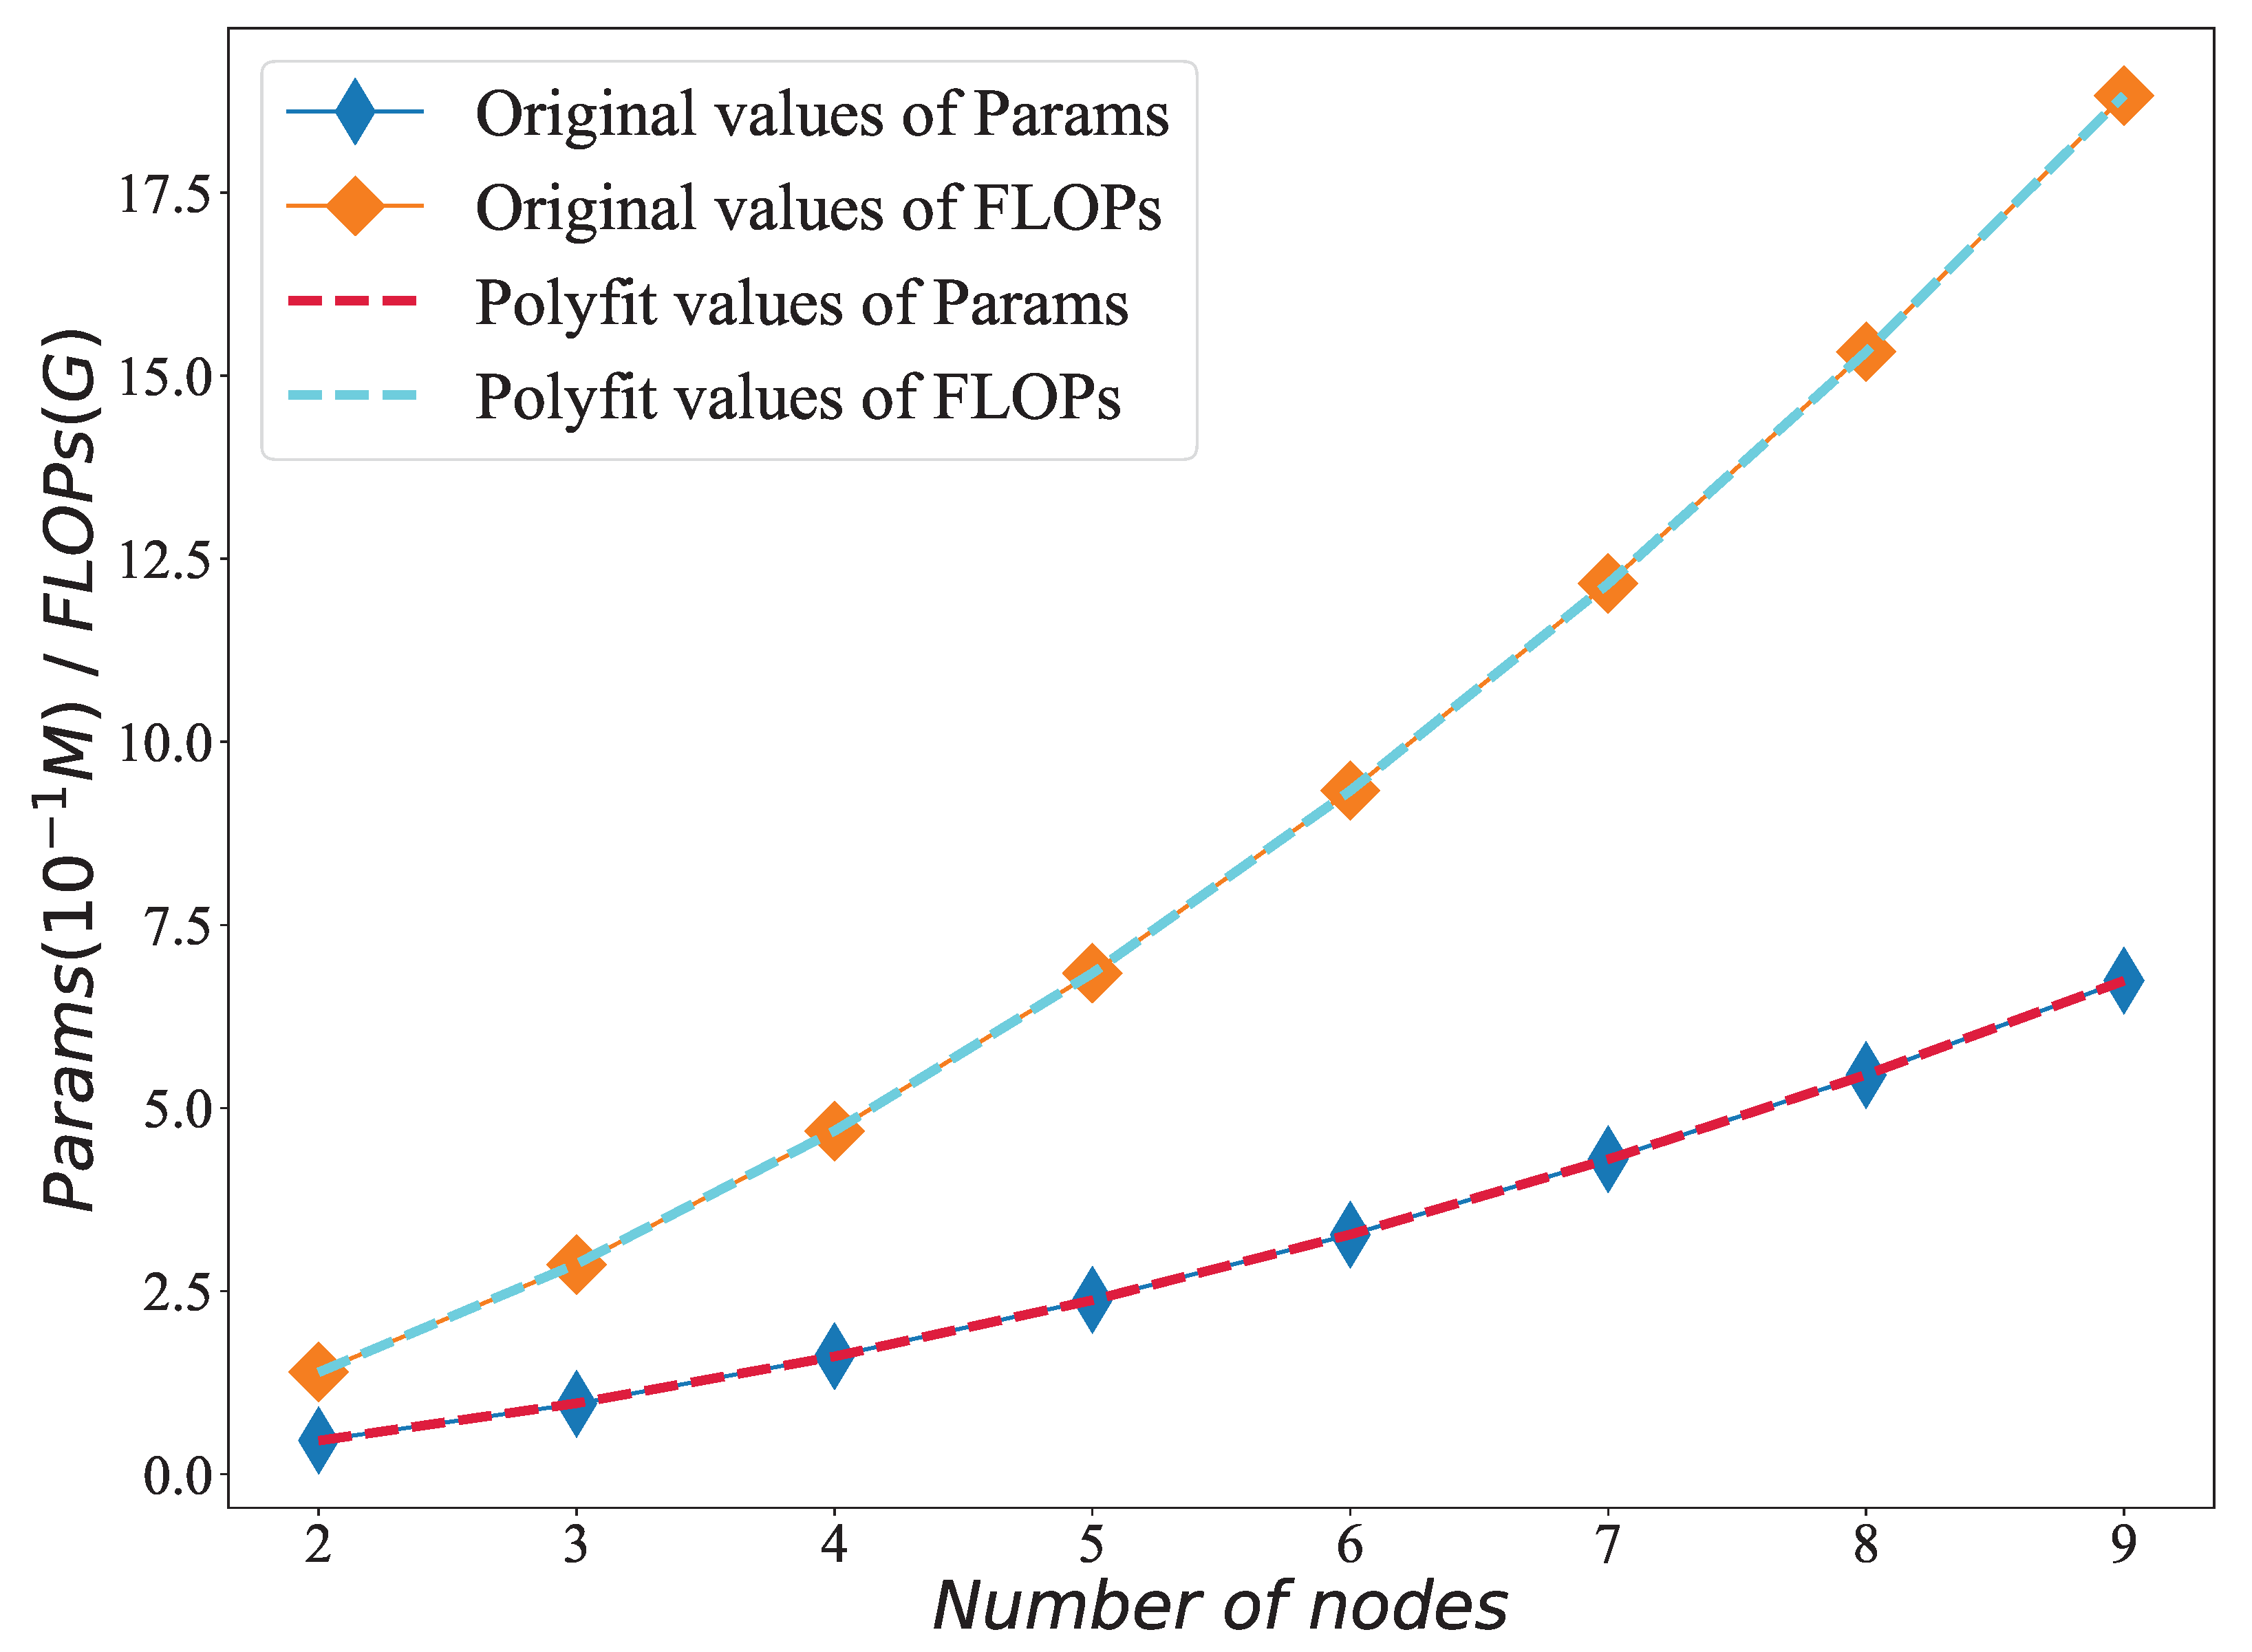
These comprehensive experiments were carried out on the NUDT-SIRST dataset [21], and the detailed results are summarized in Table 6. All experimental hyperparameter configurations remain consistent with those outlined in Section 3.1. We built networks with different numbers of nodes and compiled statistics on the number of parameters and floating-point operations, as shown in Figure 9 and Table 6.
Using Equation (8) as the foundation, we applied a second-order polynomial to model the relationship between chain length l 1 and both the number of parameters (P) and the floating-point operations (F), as detailed below:
P = 0.006446 l 1 2 + 0.01882 l 1 0.01771 , F = 0.1686 l 1 2 + 0.6368 l 1 0.5575 .
We also conduct experiments to explore the impact of the number of lateral chains on network performance, utilizing the NUDT-SIRST dataset [21] for this purpose. As we altered the number of lateral chains within the network, we introduced specific constraints to its structure. Precisely, the number of nodes in the ith chain exceeded that of the (i + 1)th chain by one, while the number of input feature map channels for each node in the (i + 1)th chain was doubled relative to its counterpart in the ith chain. In both Section 2.3 and the experiments conducted herein, we propose and adhere to the constraint l n l ( n + 1 ) = 1 . The primary objective of imposing this constraint is as follows:
  • Maintain consistent node counts from input nodes (chain heads, e.g., N 1 , 1 in Figure 3) to terminal nodes (e.g., N 1 , 4 , N 2 , 3 in Figure 3 and N 3 , 2 , N 4 , 1 in Table 7) throughout the network;
  • Simplifying the expression of the computational complexity of the model, i.e., Equation (8), can provide more concise and explicit complexity guidance for network design;
  • Facilitate systematic ablation studies on model architecture.
Notably, the AN-FMA module stayed constant, continuing to process the output feature maps of all nodes across the network. The detailed configuration of the network’s specific parameters is presented in Table 8.
The results are shown in Table 7. The experimental findings reveal that augmenting the number of lateral chains in the network structure according to a specific pattern, which involves incrementing the number of downsampling operations within the network, fails to yield a notable improvement in model performance. Conversely, it incurs a considerable surge in both the parameter count and the floating-point operations. Notably, the PCLC-Net ( l 1 = 4 , l 2 = 3 ) stands out as the optimal model, delivering exceptional performance with minimal parameter and floating-point operation requirements. This outcome further validates the perspective outlined in this paper, which posits that current network architectures are redundant owing to the incorporation of an excessive number of downsampling operations.

4.3. Supplementary Visualization Results

Figure 10 shows additional qualitative results attained by various methods, whereas 3D-Figure 11 exhibits the corresponding 3D gray-value distribution maps for these results.
Among the seven sets of results presented in the two figures, the eight existing state-of-the-art models being compared exhibited varying degrees of false alarms and missed detections, particularly in scenarios where the targets were small and the backgrounds were complex. This issue was prevalent across the different models, highlighting the challenges associated with detecting infrared small targets against intricate backgrounds. However, despite the significant variations in target sizes, intensities, and background distributions within the input images, our PCLC-Net ( l 1 = 4 , l 2 = 3 ) consistently demonstrates commendable performance.

4.4. Discussion on Feature Map Dimensions

As shown in Equation (8), the dimensions of the feature maps directly affect the computational complexity of the network. Specifically, under the overall architectural constraints of the PCL-Net, the computational complexity is proportional to the height and width of the feature maps in the first lateral chain of the network, i.e., h 1 and w 1 .
To further investigate the impact of feature map dimensions on detection accuracy, we conduct supplementary experiments by varying the height and width of the feature maps in the first lateral chain. We train and test the model using feature maps with dimensions of 64 × 64 , 128 × 128 , 256 × 256 , and 512 × 512 on the BIT-SIRST dataset [32], with the 256 × 256 feature map dimension being the most prevalent setting in current SIRST detection tasks [18,21,23]. The experimental results are summarized in Table 9.
Intuitively, higher-dimensional feature maps are expected to preserve more detailed target information, thereby leading to improved detection performance. Our experimental results consistently support this hypothesis. As shown in Table 9, increasing the feature map dimensions from 64 × 64 to 512 × 512 results in a steady improvement in I o U , P d , and F a metrics. Among all evaluation metrics, I o U exhibits the most noticeable variation with respect to the feature map dimensions, indicating its strong dependence on spatial resolution. However, considering the trade-off between detection accuracy and computational cost, the 256 × 256 setting achieves the most favorable balance, making it the optimal choice for practical deployment.

4.5. Test on Custom Set

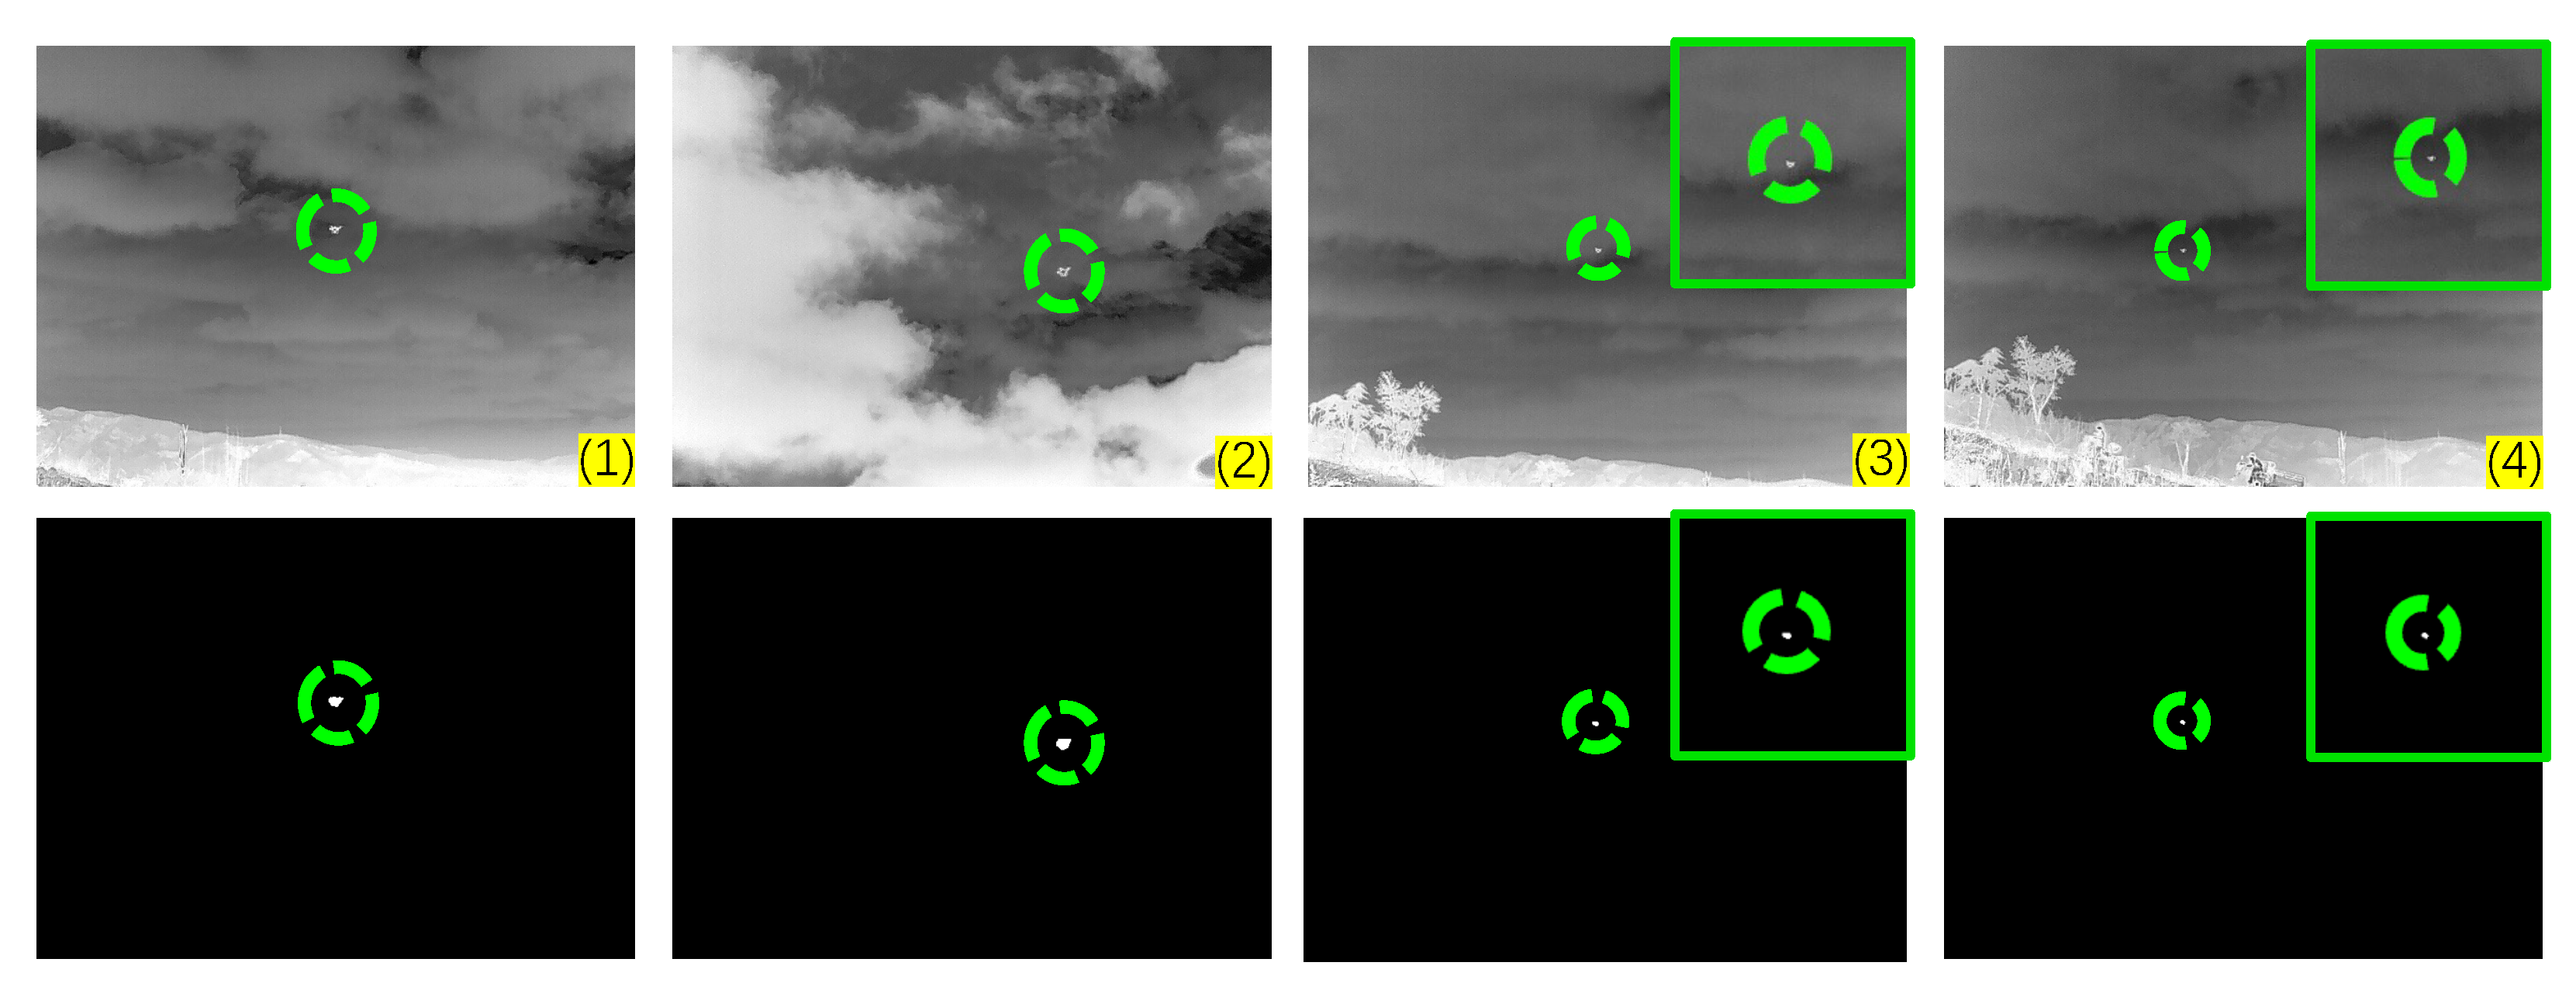
To further evaluate the performance of the PCLC-Net, we compiled the eight open-source datasets referenced in this paper to conduct comprehensive pre-training of the model ( l 1 = 4 , l 2 = 3 ). Furthermore, a collection of real-world infrared images of small drones was gathered to serve as a custom set, without mask annotations and not used for training, specifically aimed at assessing the generalization capabilities of the PCLC-Net. The evaluation results are presented in Figure 12. These results include four sets of test images that depict the progression of drone targets from those with clear contours to those without any distinguishable outline, effectively evolving into point targets. Across all these test cases, the PCLC-Net exhibited robust performance, successfully detecting and segmenting the target from the background throughout the entire spectrum of target characteristics.

4.6. Future Research Direction

SIRST detection is a long-standing research endeavor. Advancements in methods, including CNN and attention mechanisms, have progressively led to the emergence of network architectures grounded in U-Net [10], FPN [14], and attention-guided designs.
ACM [15] serves as the herald for SIRST detection based on segmentation, presenting modules specifically tailored for exchanging high-level semantics and low-level details. Leveraging U-Net and FPN, ACM-U-Net and ACM-FPN are subsequently developed. ALCNet [16] utilizes a bottom-up attention modulation technique to incorporate minute, small-scale details from low-level features into deeper, high-level features, constructing its network framework upon the FPN. Following this, intricate network architectures rooted in the U-Net framework, including ISTDU-Net [17], UIU-Net [19], DNANet [21], and HCF-Net [22], were devised. Furthermore, attention-directed complex network structures like RDIAN [37] and AGPCNet [18] were also proposed.
Regardless of their theoretical foundations, all networks incorporate multiple downsampling operations in their architectures, making at least three layers deep, so these networks face issues concerning how to retain small target information in deeper layers, perform context modulation, and accomplish top-down and bottom-up feature integration.
From the perspective of minimizing downsampling operations to maximize the retention of infrared small target information, this paper proposes Parallel Lateral Chained Networks (PCLC-Nets) aimed at addressing the limitations of existing networks. Experimental results demonstrate that the proposed PCLC-Net, along with its integrated CBR Gate and AN-FMA modules, is effective in achieving an optimal trade-off between computational cost and detection accuracy on SIRST detection field. When examining the impact of target size, small target detection in visible-light images similarly faces the risk of information loss for small targets as downsampling operations intensify. In this paper, we primarily propose and rigorously validate the outstanding performance of the PCLC-Net for the SIRST detection task. Looking forward, leveraging the unique properties of visible-light imagery to further refine, evaluate, and adapt the PCLC-Net for cross-modal small target detection presents a promising research avenue.

5. Conclusions

To address small target information loss in SIRST detection and optimize performance-cost balance, a novel PCLC-Net is proposed. The network uses the CBR Gate for node-wise large-scale feature fusion and the AN-FMA module for the final fusion of all node feature maps. Experimental results confirm that the PCLC-Net ( l 1 = 4 , l 2 = 3 ), with the smallest parameter count, achieves P d values of 95.8%, 98.1%, and 95.1% across the varying-scale and background SIRST, NUDT-SIRST, and BIT-SIRST datasets, respectively, comparable to state-of-the-art models. We have confirmed that using just a single downsampling and relying solely on large-scale feature maps can effectively achieve SIRST detection.

Author Contributions

Conceptualization, J.X. and F.P.; funding acquisition, X.F.; investigation, J.W. and Z.L.; methodology, J.X. and F.P.; software, J.X. and X.H.; validation, J.X., X.H., and J.W.; writing—original draft preparation, J.X., X.H., J.W., and X.F.; writing—review and editing, J.X., X.H., and F.P. All authors have read and agreed to the published version of the manuscript.

Funding

This research was funded by National Natural Science Foundation of China (Grant Nos. 62261160575, 61991414, and 61973036).

Data Availability Statement

The data presented in this study are cited within the article.

Conflicts of Interest

Zhenxu Li is an employee of SDIC Yunnan Dachaoshan Hydropower Co., Ltd. He contributed to the investigation during the research and writing of this paper, providing valuable expert guidance and experimental support. The authors confirm that there are no other potential conflicts of interest.

Abbreviations

The following abbreviations are used in this manuscript:
SPIESociety of Photo-Optical Instrumentation Engineers

References

  1. LeCun, Y.; Bottou, L.; Bengio, Y.; Haffner, P. Gradient-based learning applied to document recognition. Proc. IEEE 1998, 86, 2278–2324. [Google Scholar] [CrossRef]
  2. Krizhevsky, A.; Sutskever, I.; Hinton, G.E. ImageNet classification with deep convolutional neural networks. Commun. ACM 2012, 60, 84–90. [Google Scholar] [CrossRef]
  3. Simonyan, K.; Zisserman, A. Very deep convolutional networks for large-scale image recognition. arXiv 2014, arXiv:1409.1556. [Google Scholar]
  4. Szegedy, C.; Liu, W.; Jia, Y.; Sermanet, P.; Reed, S.; Anguelov, D.; Erhan, D.; Vanhoucke, V.; Rabinovich, A. Going deeper with convolutions. In Proceedings of the IEEE Conference on Computer Vision and Pattern Recognition, Boston, MA, USA, 7–12 June 2015; pp. 1–9. [Google Scholar]
  5. He, K.; Zhang, X.; Ren, S.; Sun, J. Deep residual learning for image recognition. In Proceedings of the IEEE Conference on Computer Vision and Pattern Recognition, Las Vegas, NV, USA, 27–30 June 2016; pp. 770–778. [Google Scholar]
  6. Huang, G.; Liu, Z.; Van Der Maaten, L.; Weinberger, K.Q. Densely connected convolutional networks. In Proceedings of the IEEE Conference on Computer Vision and Pattern Recognition, Honolulu, HI, USA, 21–26 July 2017; pp. 4700–4708. [Google Scholar]
  7. Teutsch, M.; Krüger, W. Classification of small boats in infrared images for maritime surveillance. In Proceedings of the 2010 International WaterSide Security Conference, Carrara, Italy, 3–5 November 2010; pp. 1–7. [Google Scholar]
  8. Deng, H.; Sun, X.; Liu, M.; Ye, C.; Zhou, X. Small infrared target detection based on weighted local difference measure. IEEE Trans. Geosci. Remote Sens. 2016, 54, 4204–4214. [Google Scholar] [CrossRef]
  9. Sun, Y.; Yang, J.; An, W. Infrared dim and small target detection via multiple subspace learning and spatial-temporal patch-tensor model. IEEE Trans. Geosci. Remote Sens. 2020, 59, 3737–3752. [Google Scholar] [CrossRef]
  10. Ronneberger, O.; Fischer, P.; Brox, T. U-net: Convolutional networks for biomedical image segmentation. In Medical Image Computing and Computer-Assisted Intervention—MICCAI 2015, Proceedings of the 18th International Conference (MICCAI 2015), Munich, Germany, 5–9 October 2015; Springer: Cham, Switzerland, 2015; Proceedings, Part III 18; pp. 234–241. [Google Scholar]
  11. Lou, A.; Guan, S.; Loew, M. DC-UNet: Rethinking the U-Net architecture with dual channel efficient CNN for medical image segmentation. In Proceedings of the Medical Imaging 2021: Image Processing, Virtual Event, 28–30 June 2021; pp. 758–768. [Google Scholar]
  12. Zhou, Z.; Siddiquee, M.M.R.; Tajbakhsh, N.; Liang, J. Unet++: Redesigning skip connections to exploit multiscale features in image segmentation. IEEE Trans. Med. Imaging 2019, 39, 1856–1867. [Google Scholar] [CrossRef]
  13. Huang, H.; Lin, L.; Tong, R.; Hu, H.; Zhang, Q.; Iwamoto, Y.; Han, X.; Chen, Y.-W.; Wu, J. Unet 3+: A full-scale connected unet for medical image segmentation. In Proceedings of the ICASSP 2020-2020 IEEE International Conference on Acoustics, Speech and Signal Processing (ICASSP), Barcelona, Spain, 4–8 May 2020; pp. 1055–1059. [Google Scholar]
  14. Lin, T.-Y.; Dollár, P.; Girshick, R.; He, K.; Hariharan, B.; Belongie, S. Feature pyramid networks for object detection. In Proceedings of the IEEE Conference on Computer Vision and Pattern Recognition, Honolulu, HI, USA, 21–26 July 2017; pp. 2117–2125. [Google Scholar]
  15. Dai, Y.; Wu, Y.; Zhou, F.; Barnard, K. Asymmetric contextual modulation for infrared small target detection. In Proceedings of the IEEE/CVF Winter Conference on Applications of Computer Vision, Virtual, 5–9 January 2021; pp. 950–959. [Google Scholar]
  16. Dai, Y.; Wu, Y.; Zhou, F.; Barnard, K. Attentional local contrast networks for infrared small target detection. IEEE Trans. Geosci. Remote Sens. 2021, 59, 9813–9824. [Google Scholar] [CrossRef]
  17. Hou, Q.; Zhang, L.; Tan, F.; Xi, Y.; Zheng, H.; Li, N. Istdu-net: Infrared small-target detection u-net. IEEE Geosci. Remote Sens. Lett. 2022, 19, 1–5. [Google Scholar] [CrossRef]
  18. Zhang, T.; Li, L.; Cao, S.; Pu, T.; Peng, Z. Attention-guided pyramid context networks for detecting infrared small target under complex background. IEEE Trans. Aerosp. Electron. Syst. 2023, 59, 4250–4261. [Google Scholar] [CrossRef]
  19. Wu, X.; Hong, D.; Chanussot, J. UIU-Net: U-Net in U-Net for infrared small object detection. IEEE Trans. Image Process. 2022, 32, 364–376. [Google Scholar] [CrossRef]
  20. Guo, F.; Ma, H.; Li, L.; Lv, M.; Jia, Z. FCNet: Flexible convolution network for infrared small ship detection. Remote Sens. 2024, 16, 2218. [Google Scholar] [CrossRef]
  21. Li, B.; Xiao, C.; Wang, L.; Wang, Y.; Lin, Z.; Li, M.; An, W.; Guo, Y. Dense nested attention network for infrared small target detection. IEEE Trans. Image Process. 2022, 32, 1745–1758. [Google Scholar] [CrossRef] [PubMed]
  22. Xu, S.; Zheng, S.; Xu, W.; Xu, R.; Wang, C.; Zhang, J.; Teng, X.; Li, A.; Guo, L. Hcf-net: Hierarchical context fusion network for infrared small object detection. In Proceedings of the 2024 IEEE International Conference on Multimedia and Expo (ICME), Niagra Falls, ON, Canada, 15–19 July 2024; pp. 1–6. [Google Scholar]
  23. Xiong, Z.; Sheng, Z.; Mao, Y. Feature Multi-Scale Enhancement and Adaptive Dynamic Fusion Network for Infrared Small Target Detection. Remote Sens. 2025, 17, 1548. [Google Scholar] [CrossRef]
  24. Wang, Y.; Wang, X.; Qiu, S.; Chen, X.; Liu, Z.; Zhou, C.; Yao, W.; Cheng, H.; Zhang, Y.; Wang, F. Multi-Scale Hierarchical Feature Fusion for Infrared Small-Target Detection. Remote Sens. 2025, 17, 428. [Google Scholar] [CrossRef]
  25. Han, K.; Wang, Y.; Tian, Q.; Guo, J.; Xu, C.; Xu, C. Ghostnet: More features from cheap operations. In Proceedings of the IEEE/CVF Conference on Computer Vision and Pattern Recognition, Seattle, WA, USA, 13–19 June 2020; pp. 1580–1589. [Google Scholar]
  26. Rivest, J.-F.; Fortin, R. Detection of dim targets in digital infrared imagery by morphological image processing. Opt. Eng. 1996, 35, 1886–1893. [Google Scholar] [CrossRef]
  27. Deshpande, S.D.; Er, M.H.; Venkateswarlu, R.; Chan, P. Max-mean and max-median filters for detection of small targets. In Proceedings of the Signal and Data Processing of Small Targets 1999, Denver, CO, USA, 19–23 July 1999; pp. 74–83. [Google Scholar]
  28. Zhang, W.; Cong, M.; Wang, L. Algorithms for optical weak small targets detection and tracking. In Proceedings of the International Conference on Neural Networks and Signal Processing, 2003. Proceedings of the 2003; Nanjing, China, 14–17 December 2003, pp. 643–647.
  29. Han, J.; Moradi, S.; Faramarzi, I.; Liu, C.; Zhang, H.; Zhao, Q. A local contrast method for infrared small-target detection utilizing a tri-layer window. IEEE Geosci. Remote Sens. Lett. 2019, 17, 1822–1826. [Google Scholar] [CrossRef]
  30. Glorot, X.; Bordes, A.; Bengio, Y. Deep sparse rectifier neural networks. In Proceedings of the Fourteenth International Conference on Artificial Intelligence and Statistics, Ft. Lauderdale, FL, USA, 11–13 April 2011; pp. 315–323. [Google Scholar]
  31. Woo, S.; Park, J.; Lee, J.-Y.; Kweon, I.S. Cbam: Convolutional block attention module. In Proceedings of the European Conference on Computer Vision (ECCV), Munich, Germany, 8–14 September 2018; pp. 3–19. [Google Scholar]
  32. Bao, C.; Cao, J.; Ning, Y.; Zhao, T.; Li, Z.; Wang, Z.; Zhang, L.; Hao, Q. Improved dense nested attention network based on transformer for infrared small target detection. arXiv 2023, arXiv:2311.08747. [Google Scholar]
  33. Duchi, J.; Hazan, E.; Singer, Y. Adaptive subgradient methods for online learning and stochastic optimization. J. Mach. Learn. Res. 2011, 12, 2121–2159. [Google Scholar]
  34. Loshchilov, I.; Hutter, F. Sgdr: Stochastic gradient descent with warm restarts. In Proceedings of the International Conference on Learning Representations (ICLR), Toulon, France, 24–26 April 2017. [Google Scholar]
  35. Glorot, X.; Bengio, Y. Understanding the difficulty of training deep feedforward neural networks. In Proceedings of the Thirteenth International Conference on Artificial Intelligence and Statistics, Sardinia, Italy, 13–15 May 2010; pp. 249–256. [Google Scholar]
  36. Paszke, A. Pytorch: An imperative style, high-performance deep learning library. arXiv 2019, arXiv:1912.01703. [Google Scholar]
  37. Sun, H.; Bai, J.; Yang, F.; Bai, X. Receptive-field and direction induced attention network for infrared dim small target detection with a large-scale dataset IRDST. IEEE Trans. Geosci. Remote Sens. 2023, 61, 1–13. [Google Scholar] [CrossRef]
  38. Wang, H.; Zhou, L.; Wang, L. Miss detection vs. false alarm: Adversarial learning for small object segmentation in infrared images. In Proceedings of the IEEE/CVF International Conference on Computer Vision, Seoul, Republic of Korea, 27 October–2 November 2019; pp. 8509–8518. [Google Scholar]
  39. Zhang, M.; Zhang, R.; Yang, Y.; Bai, H.; Zhang, J.; Guo, J. ISNet: Shape matters for infrared small target detection. In Proceedings of the IEEE/CVF Conference on Computer Vision and Pattern Recognition, New Orleans, LA, USA, 18–24 June 2022; pp. 877–886. [Google Scholar]
  40. Dai, Y.; Li, X.; Zhou, F.; Qian, Y.; Chen, Y.; Yang, J. One-stage cascade refinement networks for infrared small target detection. IEEE Trans. Geosci. Remote Sens. 2023, 61, 1–17. [Google Scholar] [CrossRef]
Figure 1. The heatmap distributions of feature maps at different downsampling network layers are presented. In this series of images, the first column shows the result after the network performs its first convolution operation on the input image, with a red box indicating the location of the actual target. The figures sequentially present the analysis results of feature maps at 2 × , 4 × , 8 × , and 16 × downsampling ratios. Notably, in the shallow layers of the network where the downsampling ratio is relatively low, the information pertaining to small targets is more prominent.
Remotesensing 17 02072 g001
Figure 2. An illustration of the proposed parallel connected lateral chain network (PCLC-Net). The Res-CBAM Block is used for feature extraction, while the CBR Gate plays a role in multi-node feature selection and fusion. The red box in the input image is used to highlight the target area.
Remotesensing 17 02072 g002
Figure 3. An abstract and simplified network architecture diagram of the PCLC-Net. N i , j corresponds to the node of Res-CBAM Block and G i , j corresponds to the CBR Gate in the network.
Remotesensing 17 02072 g003
Figure 4. Illustration of the AN-FMA module along with its preceding frontend processing. The AN-FMA serves the purpose of integrating the feature maps across all nodes within the network.
Remotesensing 17 02072 g004
Figure 5. Quantitative results present the performance of various models on the SIRST dataset. (a) The number of model parameters is plotted along the horizontal axis, while the vertical axis represents the IoU evaluation metric, a crucial indicator of model accuracy. The area of the circular markers is proportional to the model’s FLOPs, visually representing computational complexity. (b) The horizontal axis represents the F a , while the vertical axis represents the P d . The area of the octagonal markers signifies the model’s inference speed.
Remotesensing 17 02072 g005
Figure 6. Quantitative results present the performance of various models on the NUDT-SIRST dataset. (a) The number of model parameters is plotted along the horizontal axis, while the vertical axis represents the IoU evaluation metric, a crucial indicator of model accuracy. The area of the circular markers is proportional to the model’s FLOPs, visually representing computational complexity. (b) The horizontal axis represents the F a , while the vertical axis represents the P d . The area of the octagonal markers signifies the model’s inference speed.
Remotesensing 17 02072 g006
Figure 7. Quantitative results present the performance of various models on the BIT-SIRST dataset. (a) The number of model parameters is plotted along the horizontal axis, while the vertical axis represents the IoU evaluation metric, a crucial indicator of model accuracy. The area of the circular markers is proportional to the model’s FLOPs, visually representing computational complexity. (b) The horizontal axis represents the F a , while the vertical axis represents the P d . The area of the octagonal markers signifies the model’s inference speed.
Remotesensing 17 02072 g007
Figure 8. Qualitative results and 3D visualization results achieved by different SIRST detection methods. The correctly detected target, false alarm, and miss detection areas are highlighted by green, red, and yellow dotted circles, respectively. The area outlined in green indicates the magnified portion for enhanced visualization. Our PCLC-Net can generate output with precise target localization and shape segmentation under a lower false alarm rate.
Remotesensing 17 02072 g008
Figure 9. A diagram depicting the statistical outcomes of network parameter quantities and floating-point operations for varying node counts, accompanied by a quadratic polynomial fitting curve.
Remotesensing 17 02072 g009
Figure 10. Qualitative results achieved by ACM, ALCNet, RDIAN, ISTDU-Net, AGPCNet, UIU-Net, HCFNet, DNA-Net, and our PCLC-Net ( l 1 = 4 , l 2 = 3 ). Green, red, and yellow dotted circles highlight the correctly detected target, false alarm, and miss detection areas, respectively. The area outlined in green indicates the magnified portion for enhanced visualization.
Remotesensing 17 02072 g010
Figure 11. The 3D visualization results of different methods on 6 test images.
Remotesensing 17 02072 g011
Figure 12. The visualization results of the PCLC-Net on the custom set. The first row displays the original test images, with the target regions marked by green circles. The second row illustrates the corresponding detection outcomes, where the successfully detected targets are circled in green.
Remotesensing 17 02072 g012
Table 1. I o U , P d , and F a values achieved by different state-of-the-art methods on the SIRST, NUDT-SIRST, and BIT-SIRST datasets. For I o U and P d , larger values indicate higher performance. For F a , smaller values indicate higher performance. The best results are underlined.
MethodsSIRST [15]NUDT-SIRST [21]BIT-SIRST [32]
IoU ( 10 2 ) P d ( 10 2 ) F a ( 10 6 ) IoU ( 10 2 ) P d ( 10 2 ) F a ( 10 6 ) IoU ( 10 2 ) P d ( 10 2 ) F a ( 10 6 )
ACM [15]42.793.125.064.994.413.661.793.162.1
ALCNet [16]43.291.518.868.897.127.365.293.772.5
ISTDU-Net [17]42.691.936.485.497.317.179.994.236.5
RDIAN [37]41.593.556.479.196.327.476.491.663.7
AGPCNet [18]42.593.846.982.997.810.979.094.742.1
UIU-Net [19]---91.298.140.180.893.752.9
DNA-Net [21]43.994.224.093.298.05.081.395.134.6
HCFNet [22]43.594.715.790.198.132.078.694.052.3
Ours ( l 1 = 4 , l 2 = 3 )44.095.814.892.998.14.3380.895.128.6
Table 2. Params, FLOPs, and FPS values achieved by different state-of-the-art methods on the SIRST, NUDT-SIRST, and BIT-SIRST datasets.
MethodsParams (M) ↓FLOPs (G) ↓FPS ↑
ACM [15]0.400.4089
ALCNet [16]0.430.3890
ISTDU-Net [17]2.757.9442
RDIAN [37]0.223.7254
AGPCNet [18]12.4343.2625
UIU-Net [19]50.5454.4322
DNA-Net [21]4.7014.2619
HCFNet [22]14.4023.2429
Ours ( l 1 = 4 , l 2 = 3 )0.164.6955
Table 3. I o U ( × 10 2 ) , P d ( × 10 2 ) , F a ( × 10 6 ) , Params(M), and FLOPs(G) values achieved by main variants of the PCLC-Net on the BIT-SIRST dataset.
l 1 l 2 Res-CBAMCBR GateAN-FMA IoU P d F a Params ↓FLOPs ↓
43××71.291.893.10.1403.90
43×77.593.953.40.1604.63
43×76.292.148.80.1413.95
43×78.692.830.30.1544.48
4380.895.128.60.1614.69
4062.185.31030.0402.64
3277.992.952.00.0962.86
5480.995.733.00.2386.84
Table 4. The performance metrics of the PCLC-Net on 8 datasets. The best results are underlined.
DatasetSplitPCLC-Net ( l 1 = 4 , l 2 = 3 )DNA-Net
IoU ( 10 2 ) P d ( 10 2 ) F a ( 10 6 ) IoU ( 10 2 ) P d ( 10 2 ) F a ( 10 6 )
NUST-SIRST [38]7:390.397.06.6489.496.73.59
SIRST [15]1:144.095.814.843.994.224.0
IRSTD-1k [39]1:177.887.532.370.389.733.8
SIRST v2 [40]1:167.795.432.669.693.828.7
NUDT-SIRST [21]1:192.998.14.3393.298.05.0
IRDST-real [37]1:174.795.61.6470.196.71.66
ISTDD [18]7:363.497.96.5463.697.03.26
BIT-SIRST [32]7:380.895.128.681.395.134.6
Table 5. Training times for every 10 epochs, achieved by various state-of-the-art methods, on the SIRST, NUDT-SIRST, and BIT-SIRST datasets.
MethodsSIRST [15]NUDT-SIRST [21]BIT-SIRST [32]
ACM [15]38 s43 s8 min
ALCNet [16]36 s44 s8 min
ISTDU-Net [17]2 min 2 s5 min 11 s45 min
RDIAN [37]52 s1 min 45 s13 min
AGPCNet [18]2 min 20 s6 min 2 s54 min
UIU-Net [19]4 min 37 s11 min 20 s160 min
DNA-Net [21]2 min5 min 45 s46 min
HCFNet [22]2 min 38 s6 min 45 s62 min
Ours ( l 1 = 4 , l 2 = 3 )1 min 27s3 min 29s28 min
Table 6. Evaluation outcomes of network variants of the PCLC-Net across various node quantities on the NUDT-SIRST dataset, and Params and FLOPs values achieved by these variants.
ConfigureNUDT-SIRST [15]Params (M) ↓FLOPs (G) ↓
IoU ( 10 2 ) P d ( 10 2 ) F a ( 10 6 )
l 1 = 2 , l 1 = 1 83.093.227.90.0461.396
l 1 = 3 , l 2 = 2 83.393.618.70.0962.863
l 1 = 4 , l 2 = 3 92.998.14.330.1614.685
l 1 = 5 , l 2 = 4 90.098.318.00.2386.842
l 1 = 6 , l 2 = 5 90.198.314.70.3279.335
l 1 = 7 , l 2 = 6 90.898.921.10.43012.163
l 1 = 8 , l 2 = 7 91.298.57.900.54515.327
l 1 = 9 , l 2 = 8 91.399.09.220.67418.827
Table 7. The outcomes of training and evaluating network models featuring different numbers of lateral chains on the NUDT-SIRST dataset.
NUDT-SIRST [15]Params (M) ↓FLOPs (G) ↓
IoU ( 10 2 ) P d ( 10 2 ) F a ( 10 6 )
PCLC-Net-483.997.616.30.0402.638
PCLC-Net-4392.998.14.330.1614.685
PCLC-Net-43290.399.123.40.4435.939
PCLC-Net-432192.198.613.20.9746.602
Table 8. The model’s network structure parameter settings encompass adjustments to the number of lateral chains and their respective channel counts. In this context, - signifies the absence of a particular chain.
PCLC-Net-4PCLC-Net-43PCLC-Net-432PCLC-Net-4321
Chains ( l 1 , l 2 , l 3 , l 4 )(4, -, -, -)(4, 3, -, -)(4, 3, 2, -)(4, 3, 2, 1)
Channels ( c 1 , c 2 , c 3 , c 4 )(16, -, -, -)(16, 32, -, -)(16, 32, 64, -)(16, 32, 64, 128)
Table 9. The performance of the PCLC-Net ( l 1 = 4 , l 2 = 3 ) on the BIT-SIRST dataset, in terms of I o U , P d , and F a , was evaluated by varying the feature map dimensions.
h 1 w 1 BIT-SIRST [32]Computational Complexity
IoU ( 10 2 ) P d ( 10 2 ) F a ( 10 6 )
646426.690.38340.0625 ×
12812871.891.272.30.25 ×
25625680.895.128.61.0×
51251290.197.213.64.0 ×
Disclaimer/Publisher’s Note: The statements, opinions and data contained in all publications are solely those of the individual author(s) and contributor(s) and not of MDPI and/or the editor(s). MDPI and/or the editor(s) disclaim responsibility for any injury to people or property resulting from any ideas, methods, instructions or products referred to in the content.