
Agricultural Greenhouse Extraction Based on Multi-Scale Feature Fusion and GF-2 Remote Sensing Imagery
 , and
, and
Abstract

1. Introduction
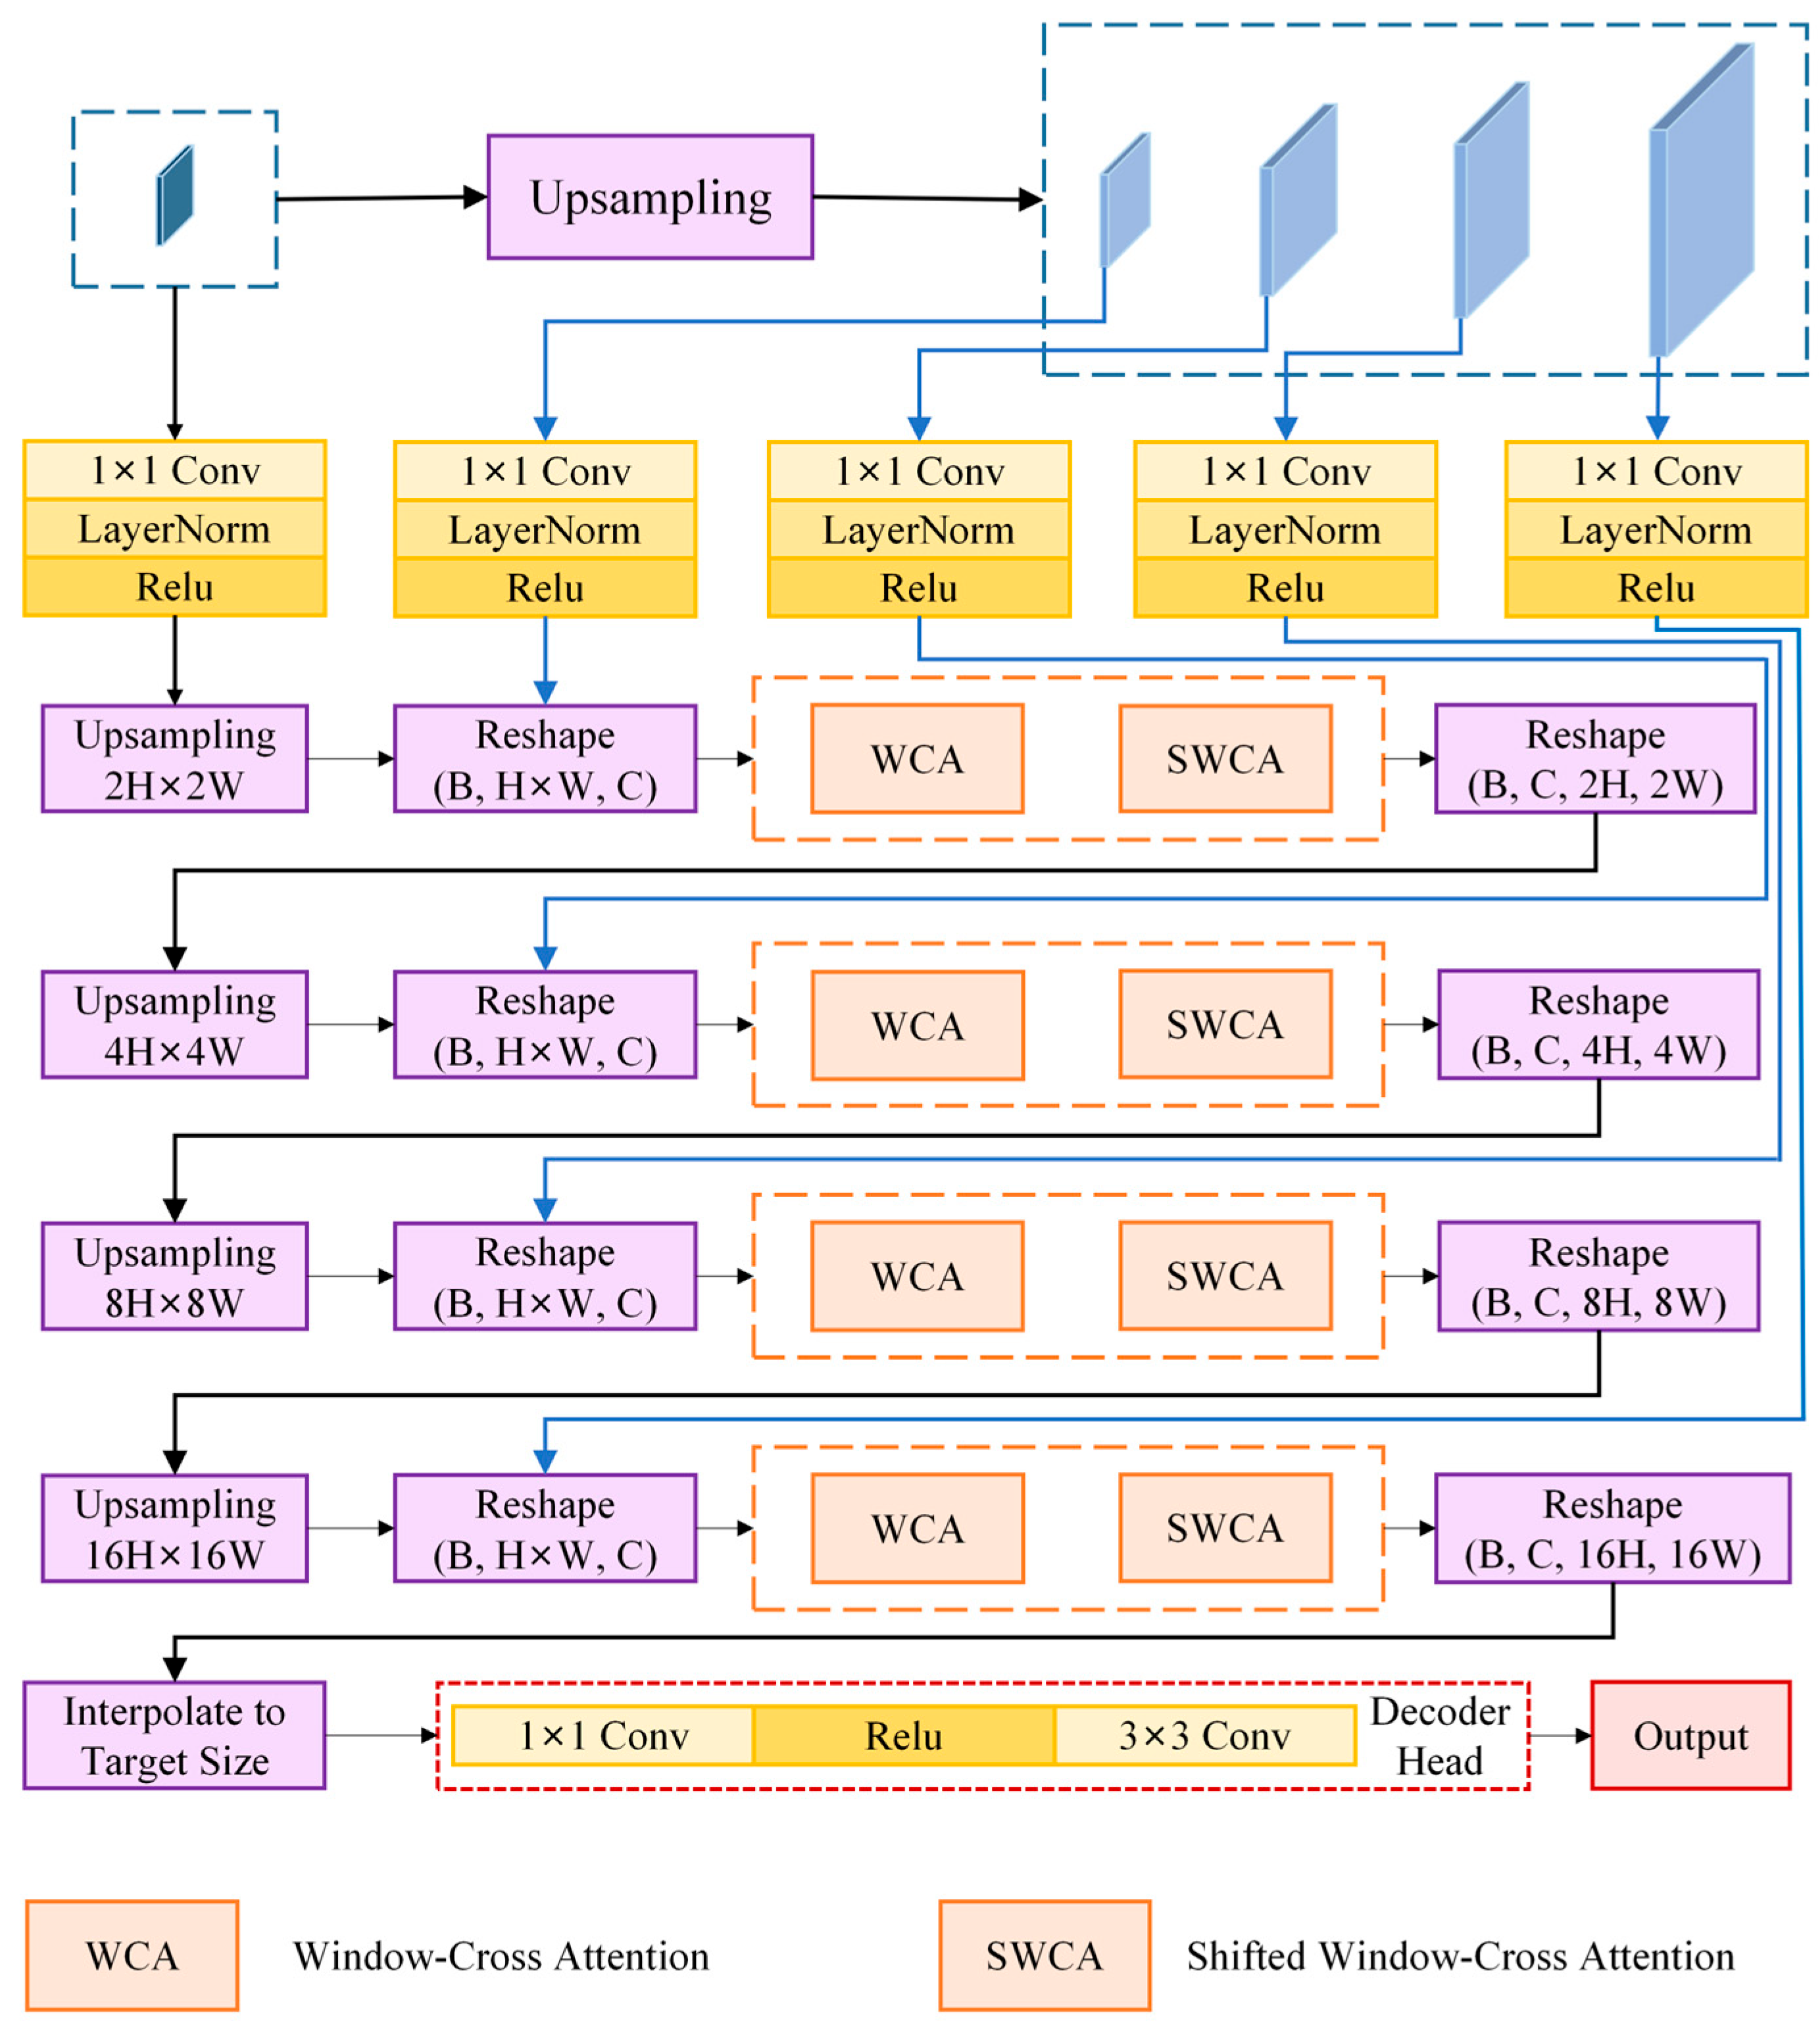
- Development of a Multi-scale Transformer Decoder (MTD) module: A novel decoder architecture is constructed by integrating hierarchical attention mechanisms and adaptive feature fusion for cross-scale dependency modeling. The MTD module incorporates lateral connections and cross-attention mechanisms to effectively aggregate greenhouse edge information across multiple spatial scales. By progressively refining feature representations from high-level semantics to low-level details, the module significantly improves the precision of edge detection.
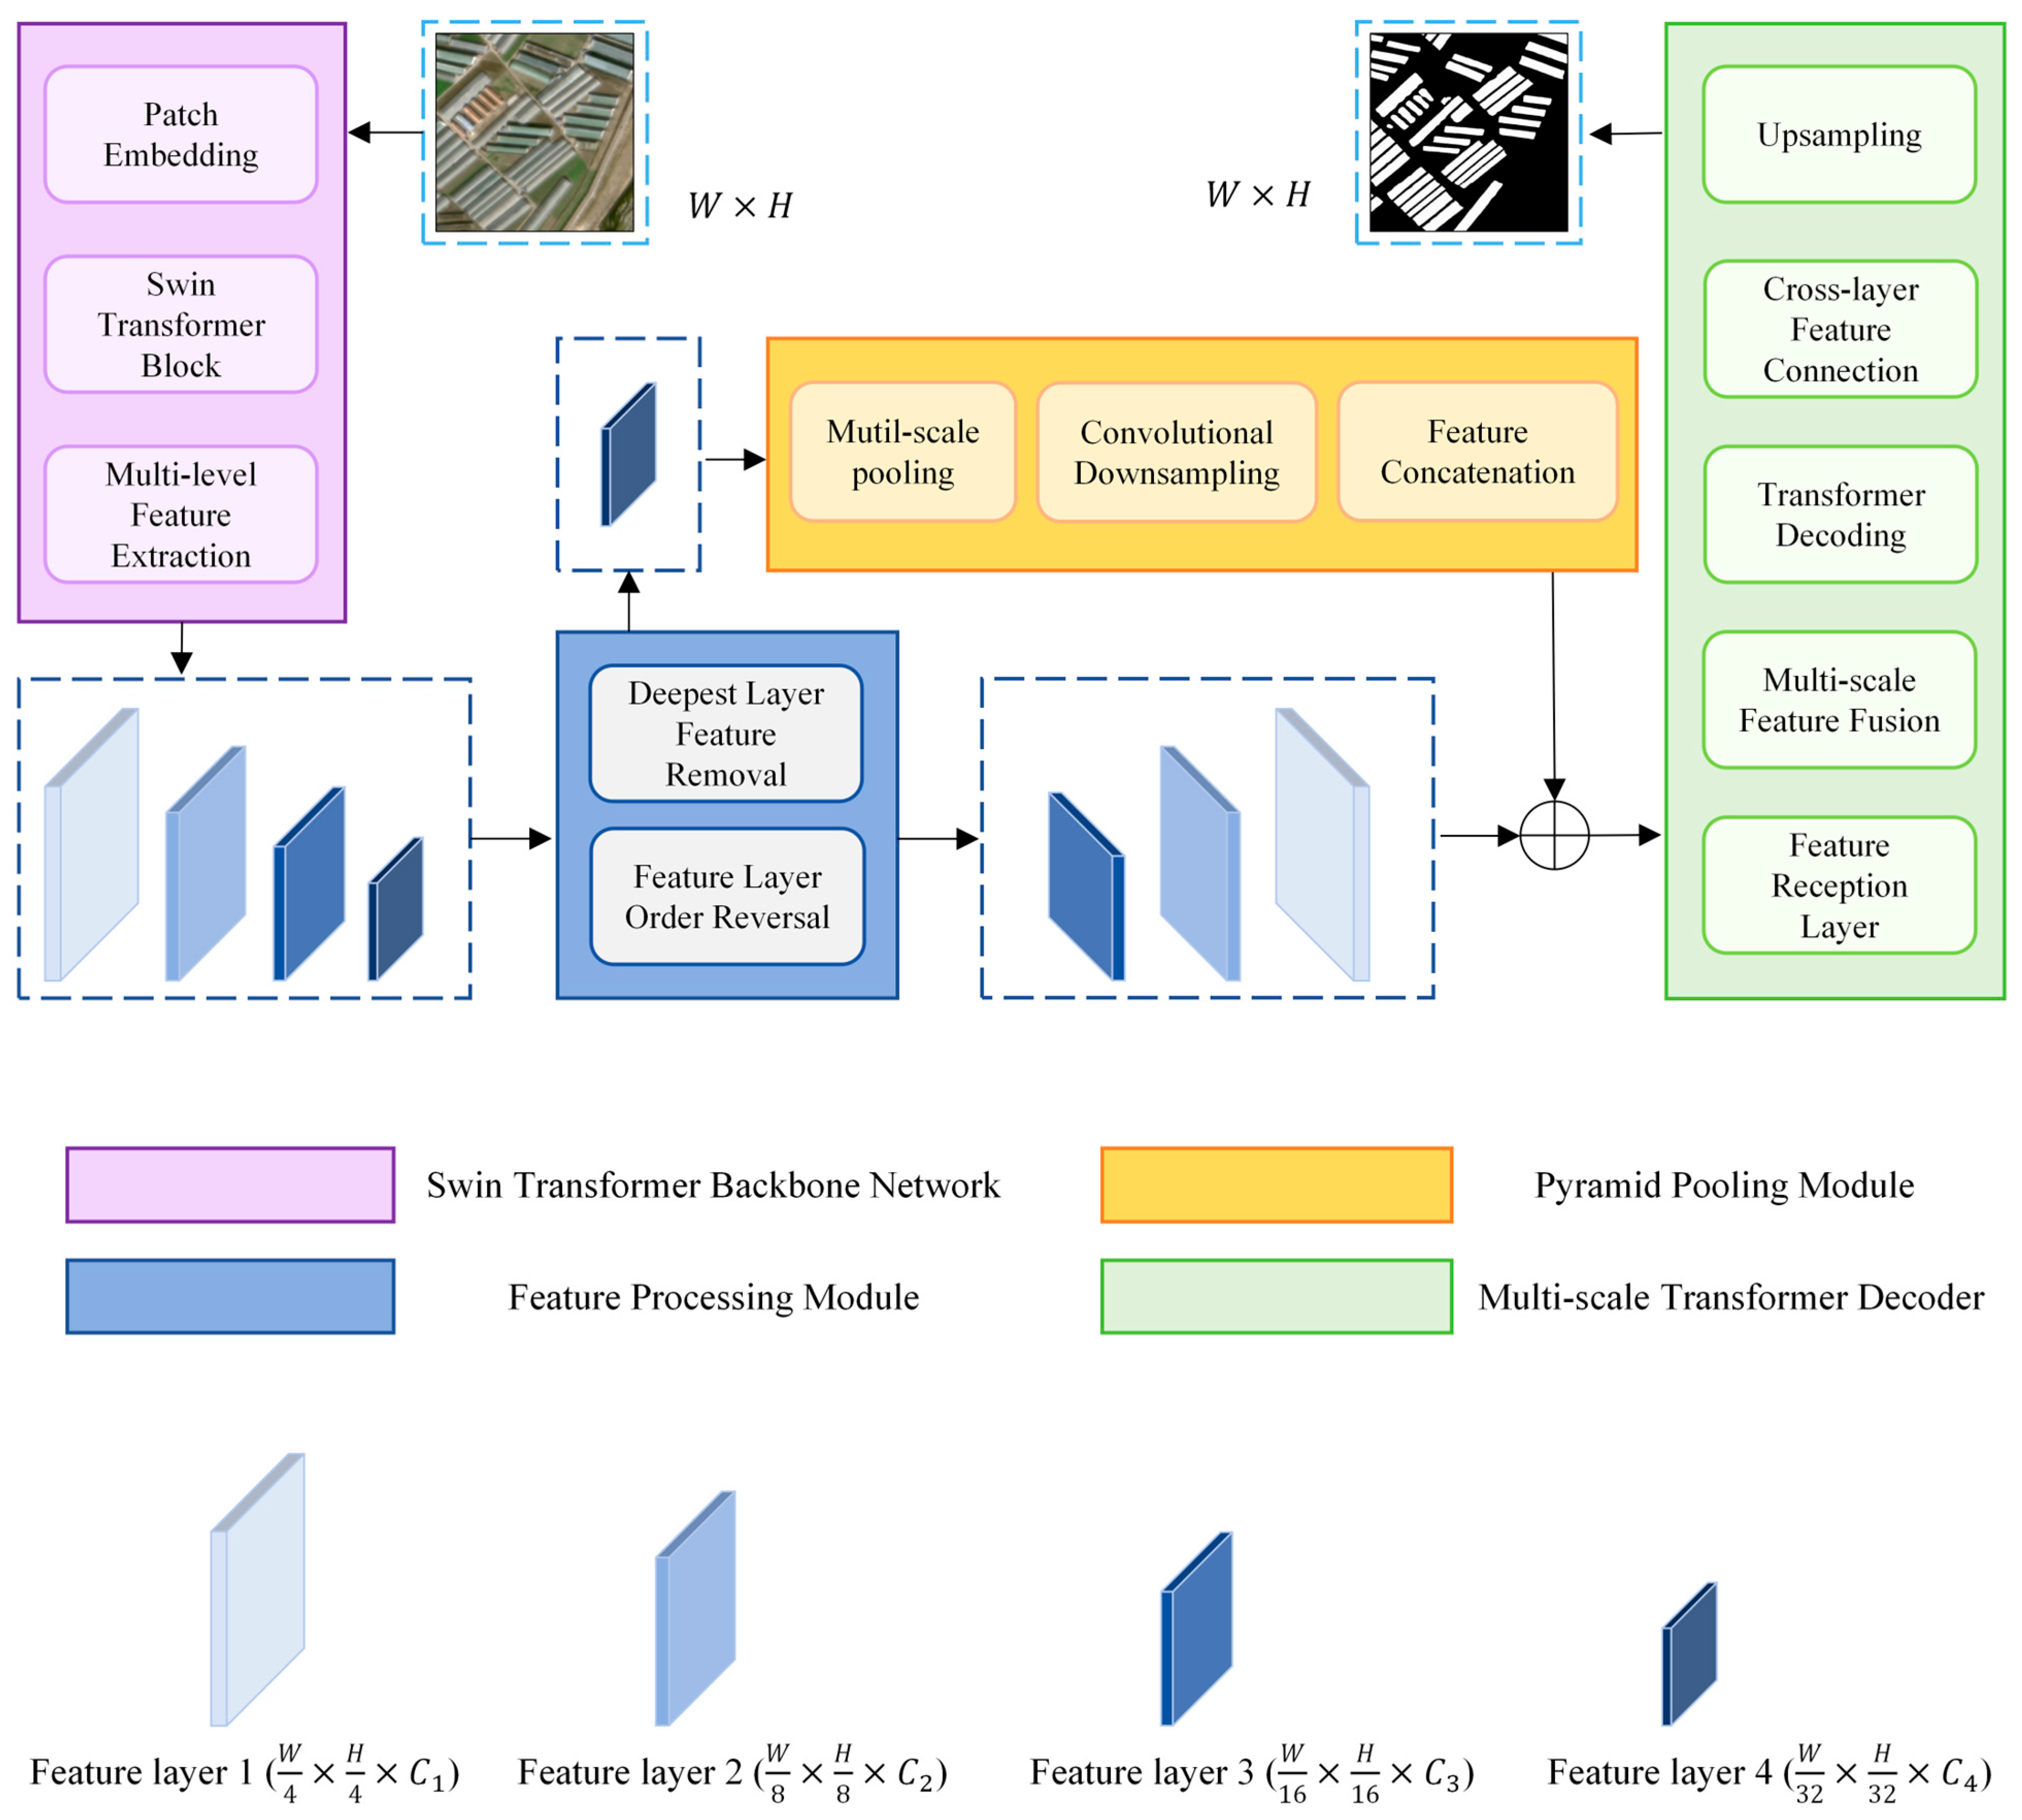
- Design of the MTDSNet architecture: A new network, termed MTDSNet (Multi-scale Transformer Decoder Swin-UNet), is proposed to enhance the model’s sensitivity to edge features in complex background environments. The architecture effectively mitigates adhesion artifacts caused by insufficient spacing between adjacent greenhouses, improving the delineation of individual structures.
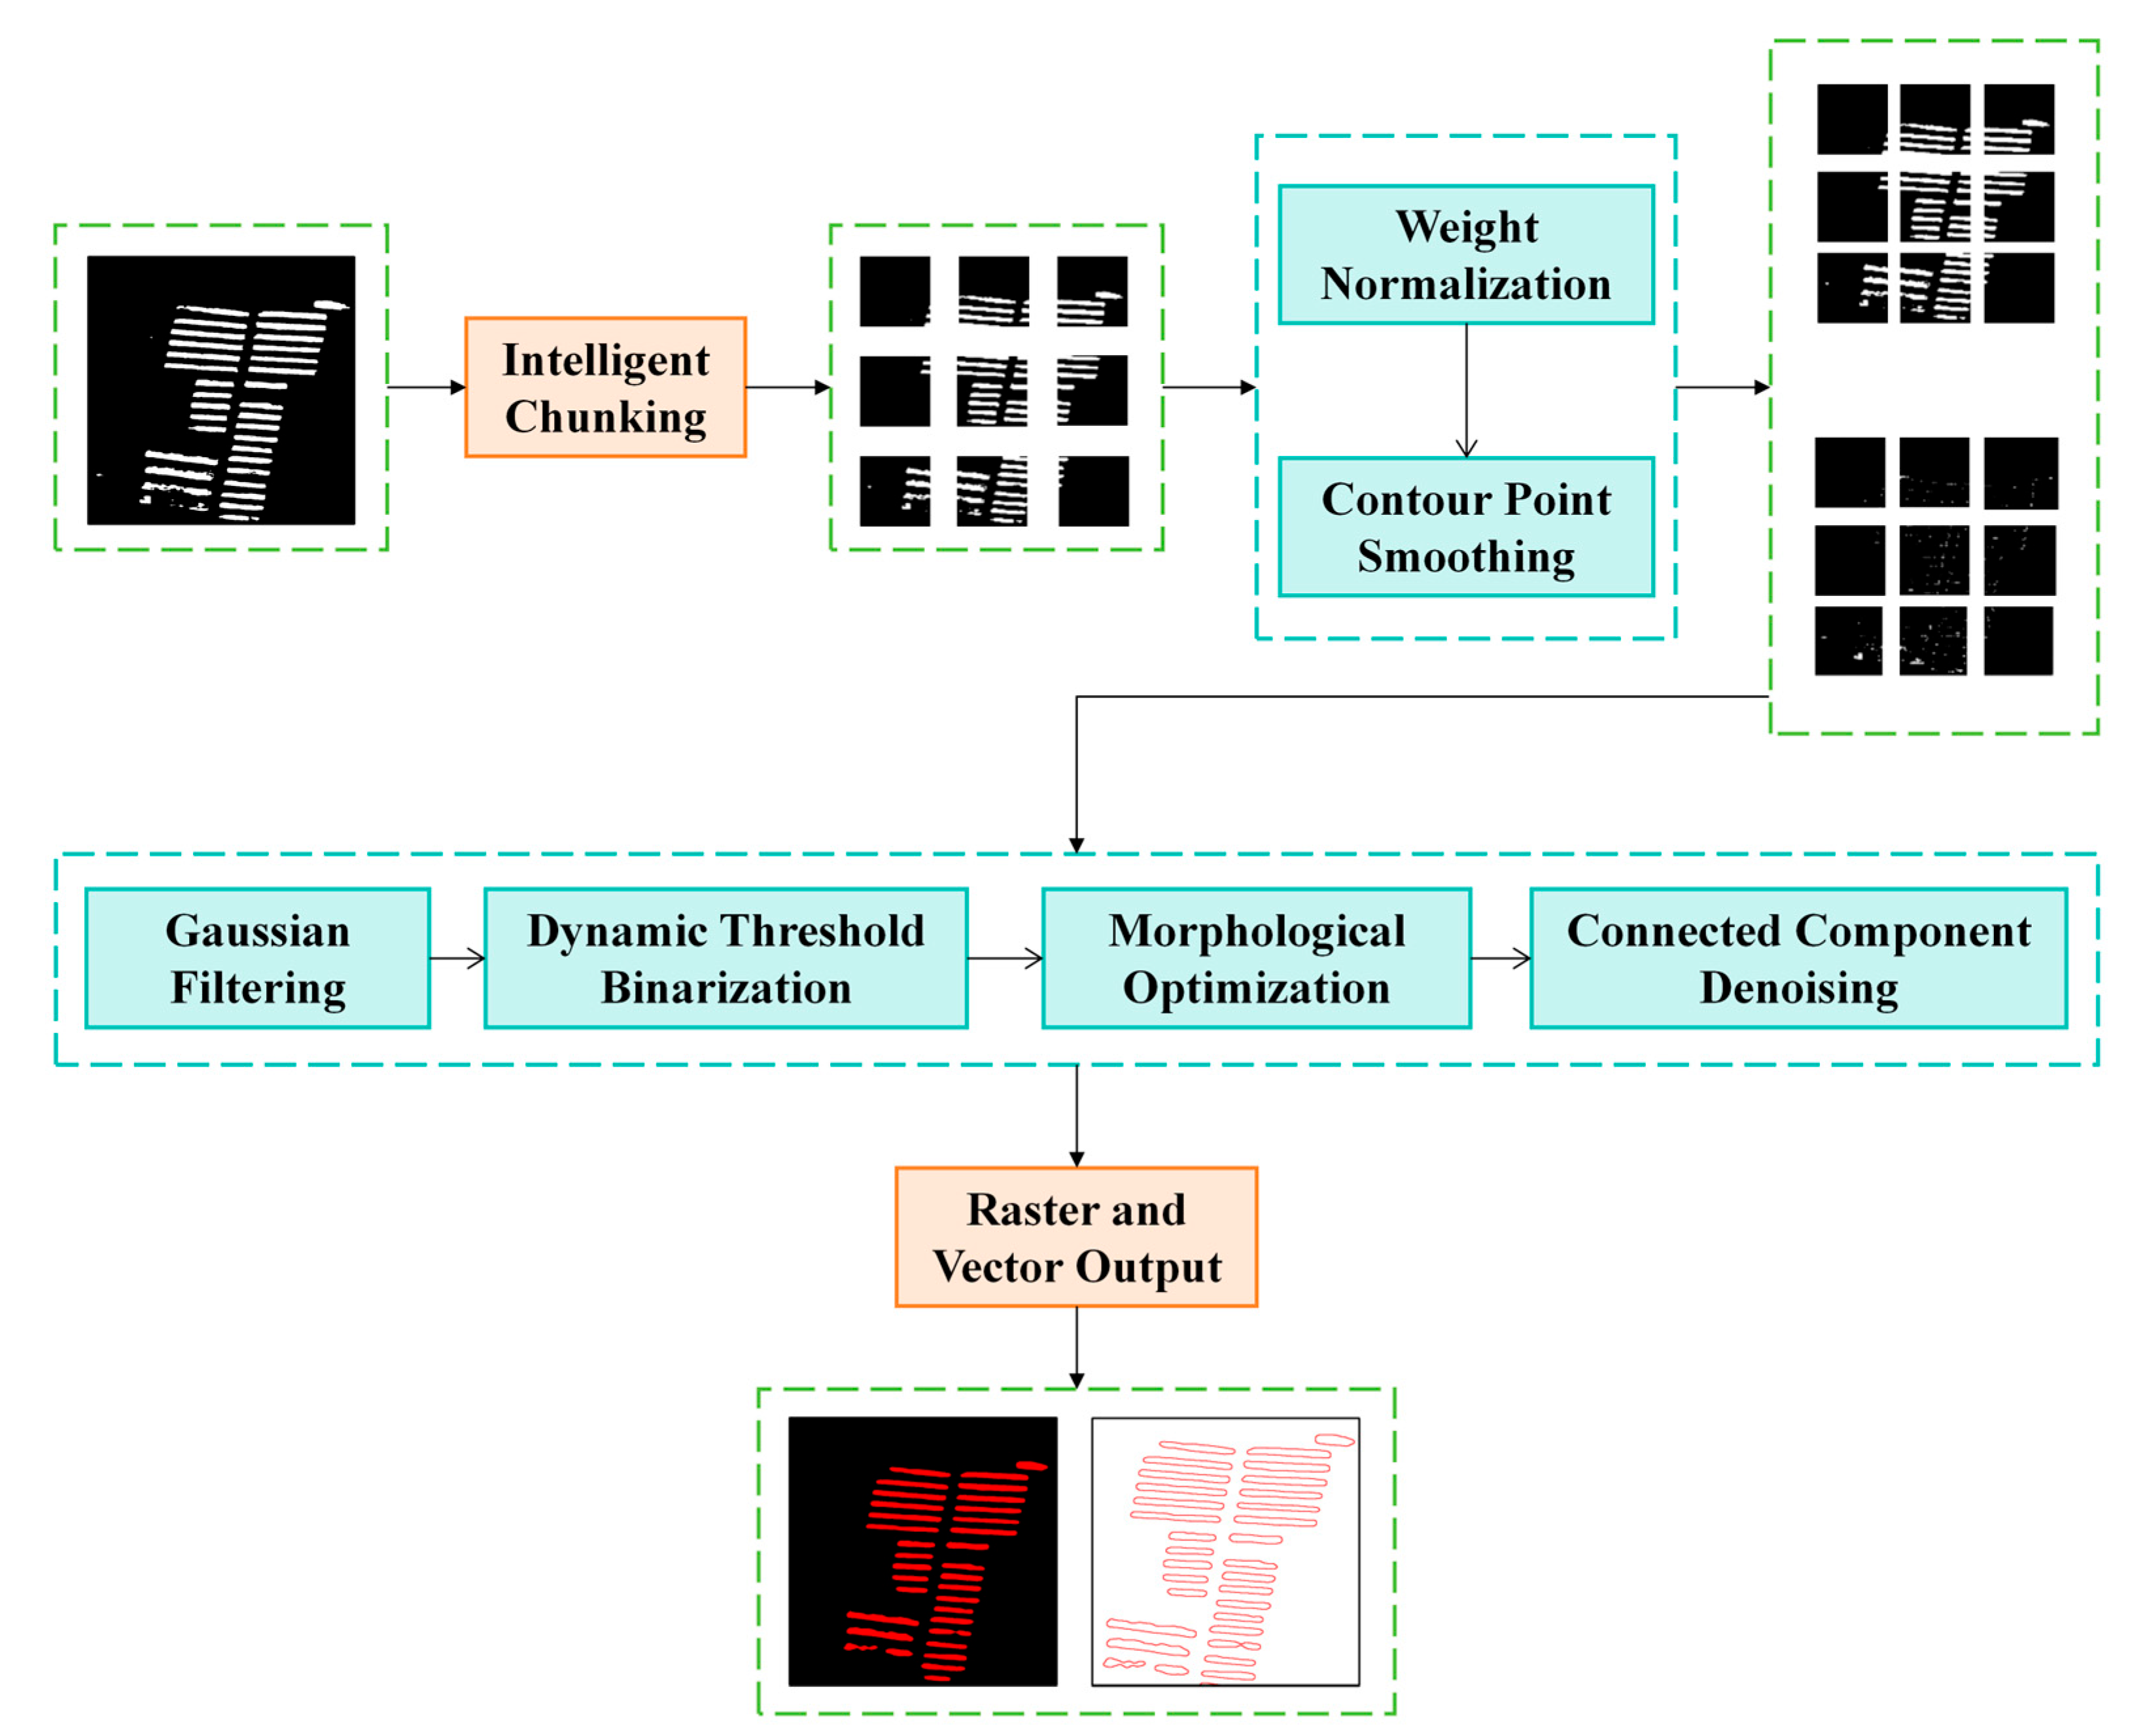
- Introduction of an image post-processing strategy: A Denoising and Smoothing (DS) module is developed to refine the preliminary segmentation results. This module performs patch-level denoising and edge smoothing, thereby reducing fragmentation and improving the geometric regularity of extracted greenhouse boundaries.
- Experimental validation of the proposed method: A series of deep learning-based experiments were conducted to evaluate the method’s performance in extracting individual greenhouses at sub-meter accuracy. The results confirm that the proposed framework delivers high-precision extraction, providing reliable remote sensing data support for facility agriculture census and the fine-scale management of cultivated land resources.
2. Materials and Methods
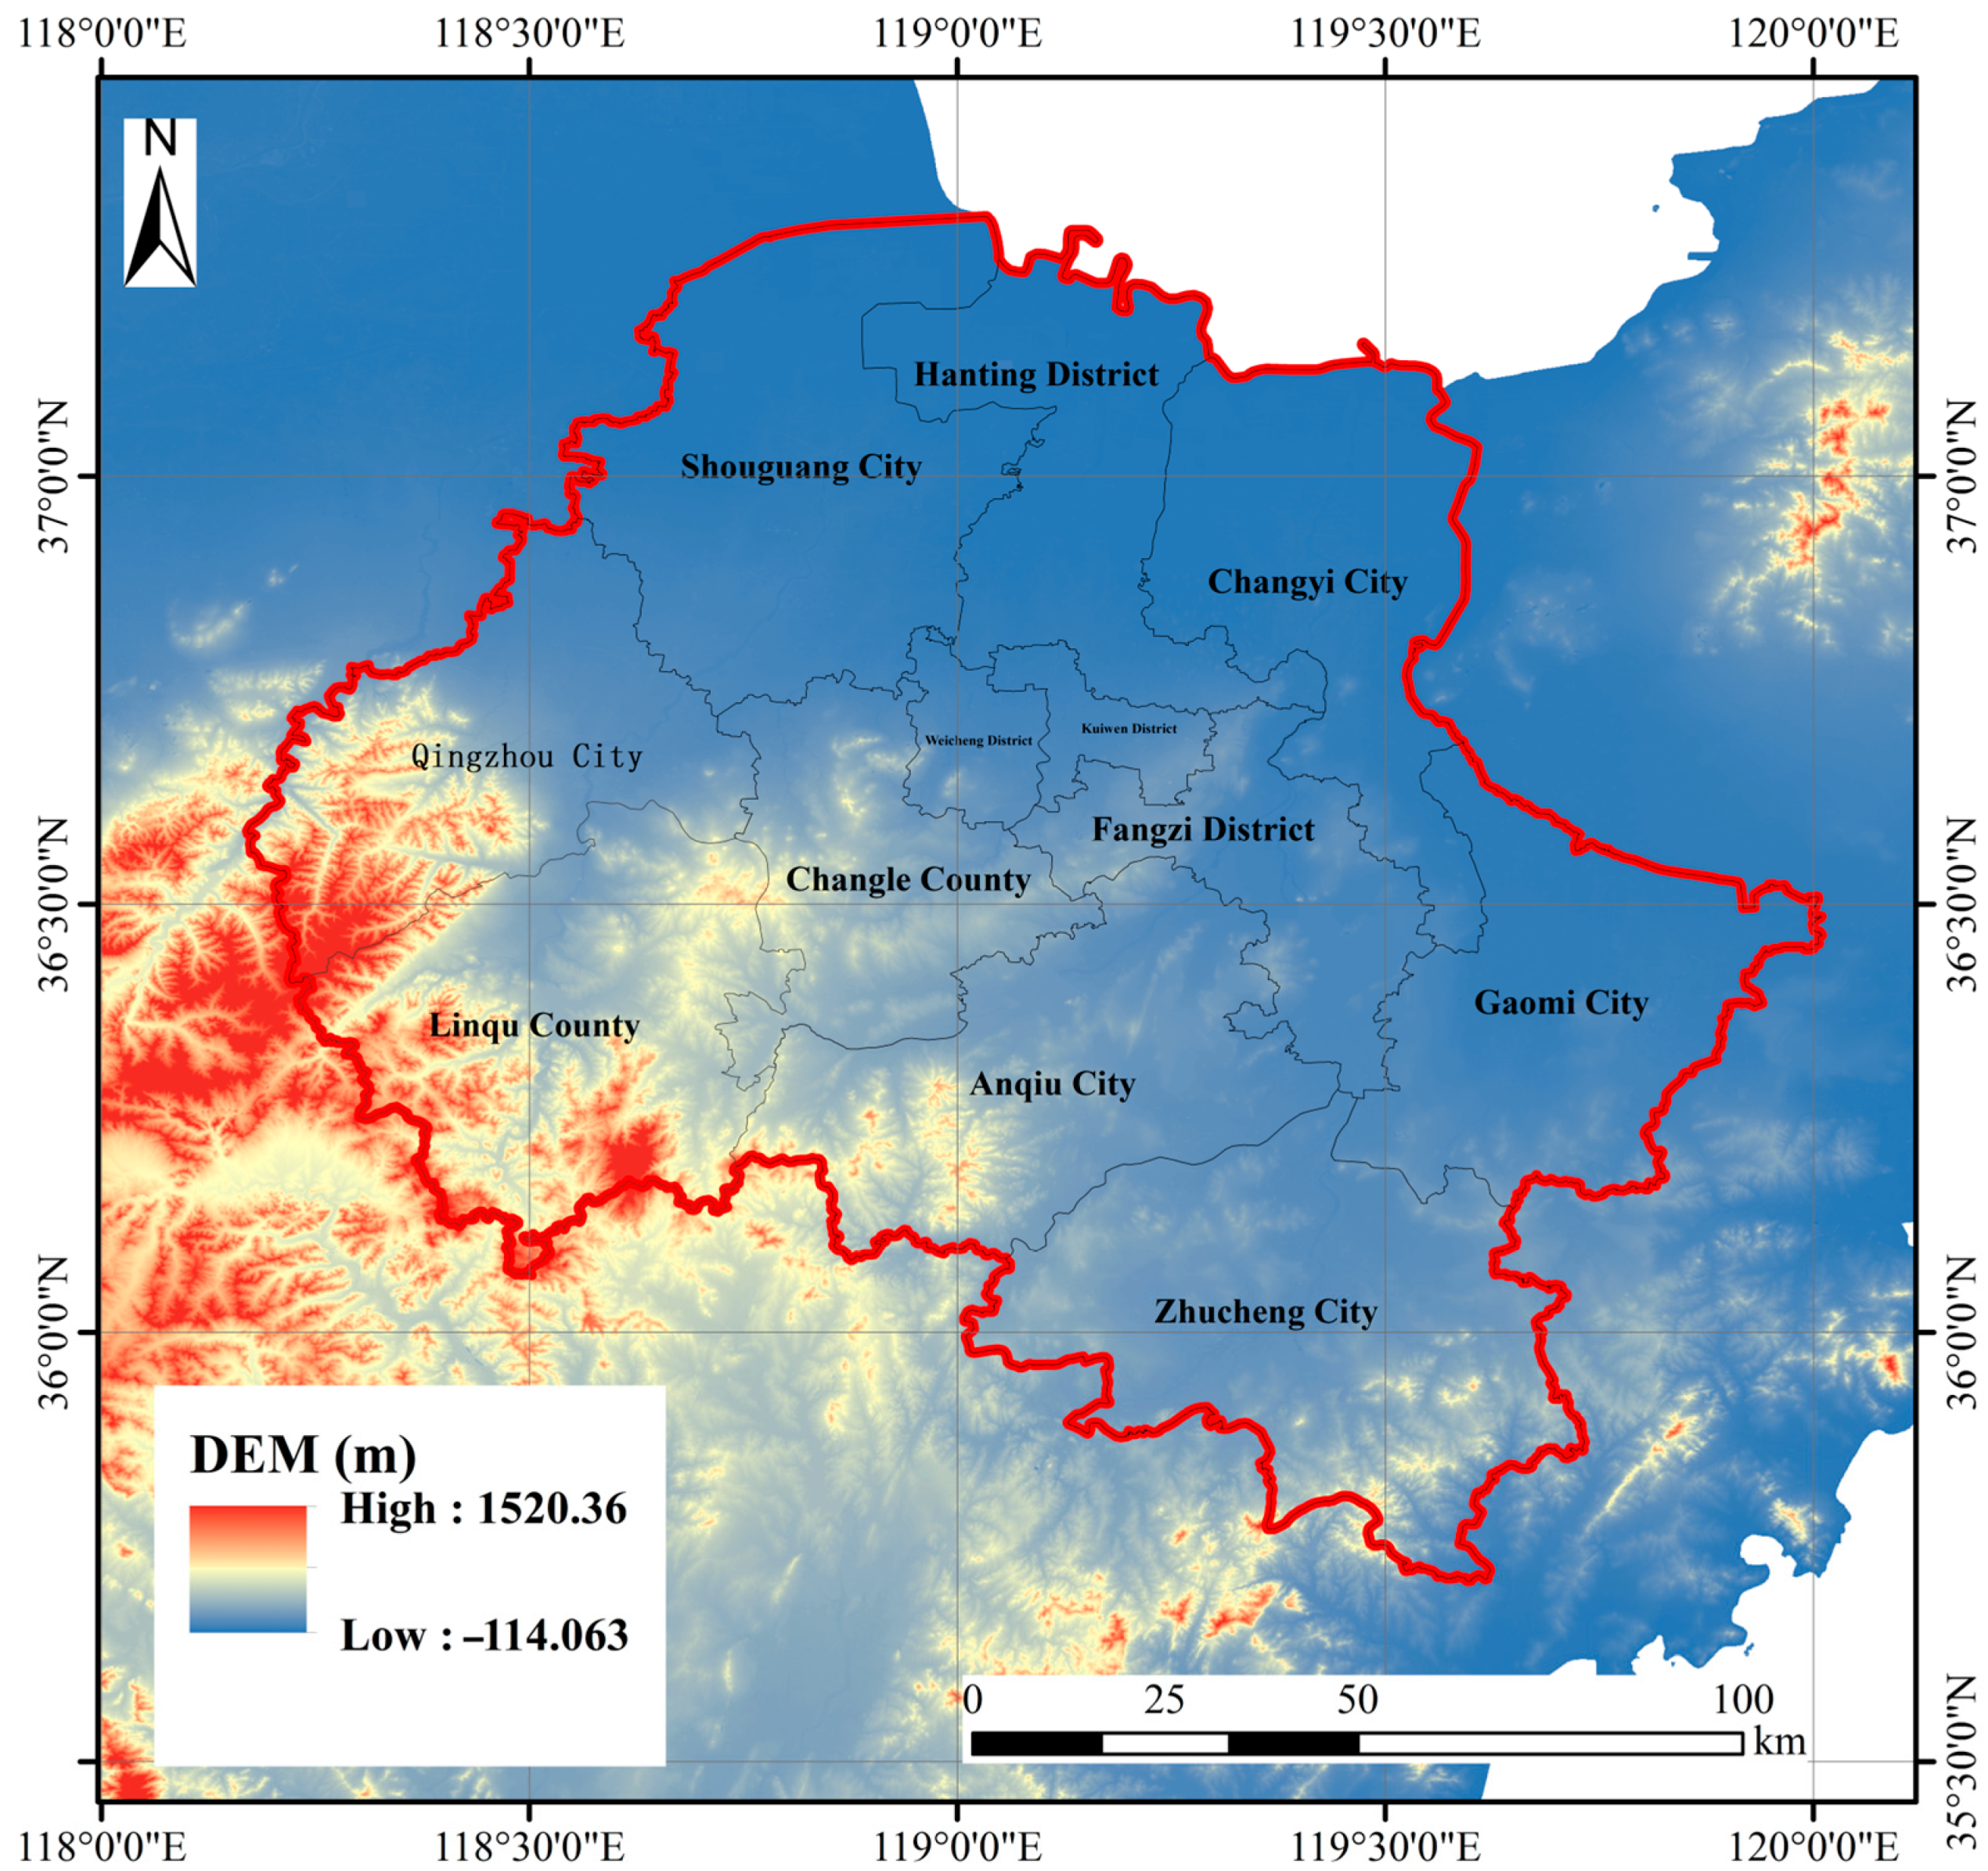
2.1. Study Area
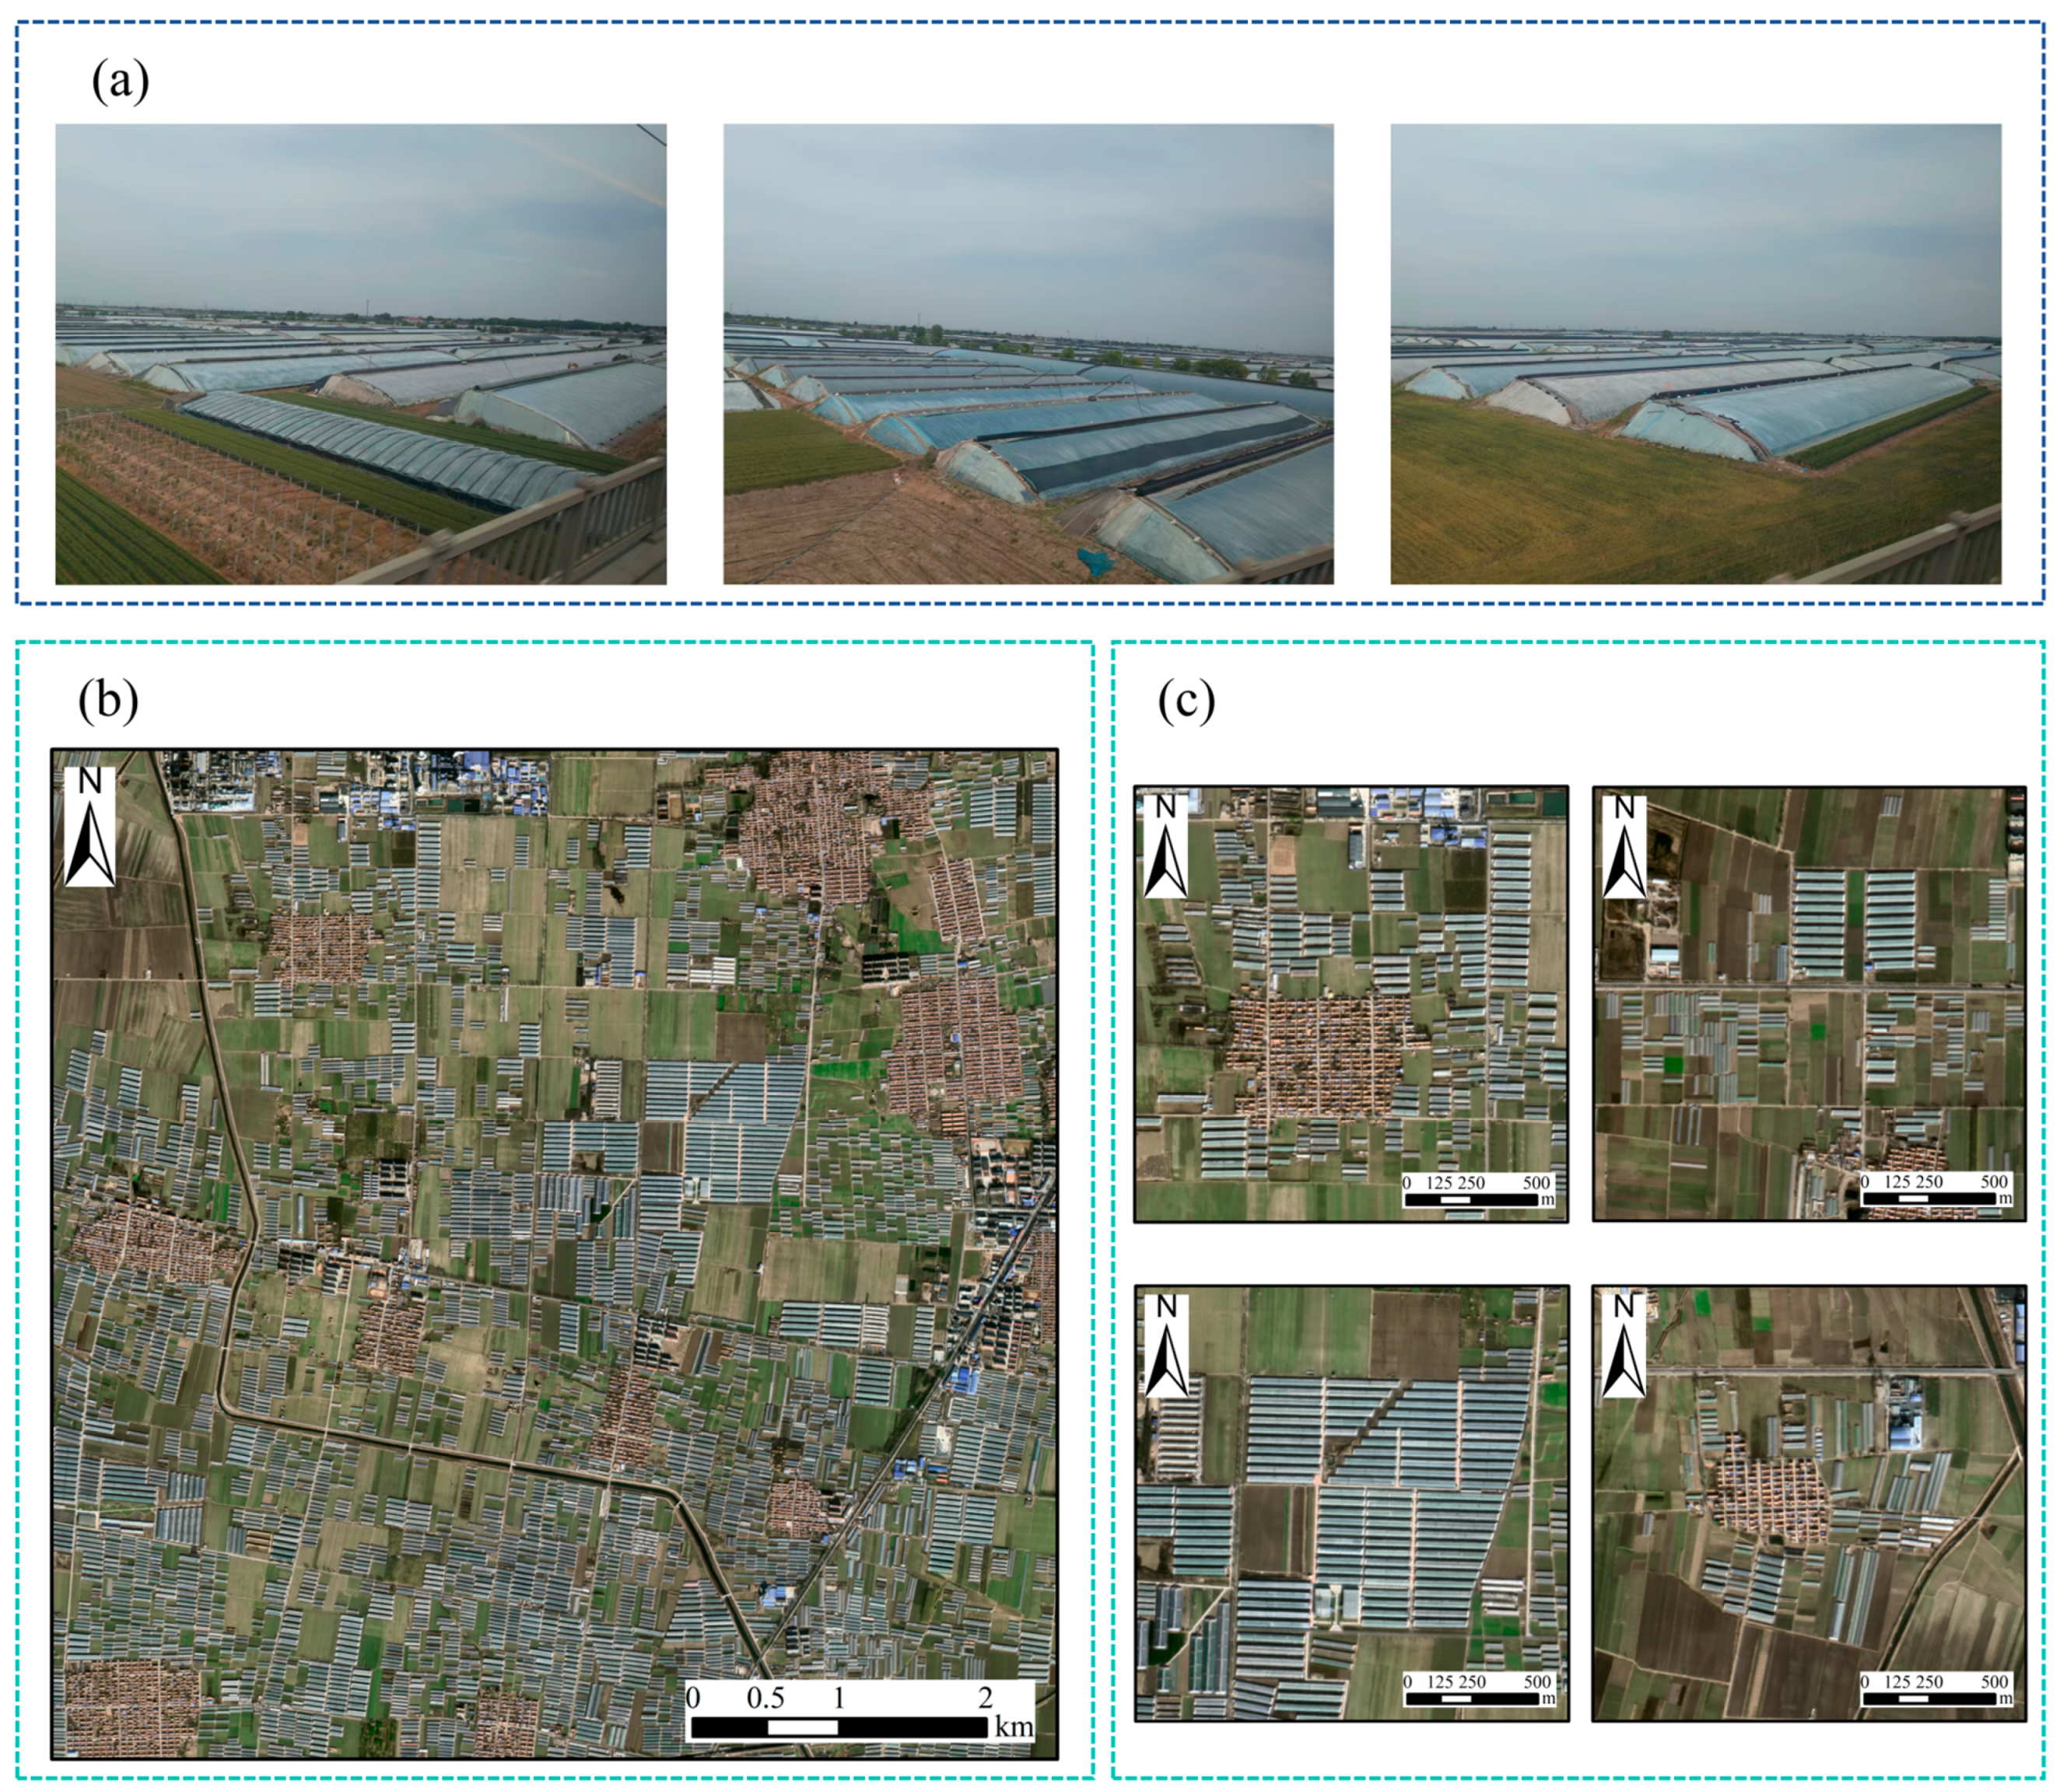
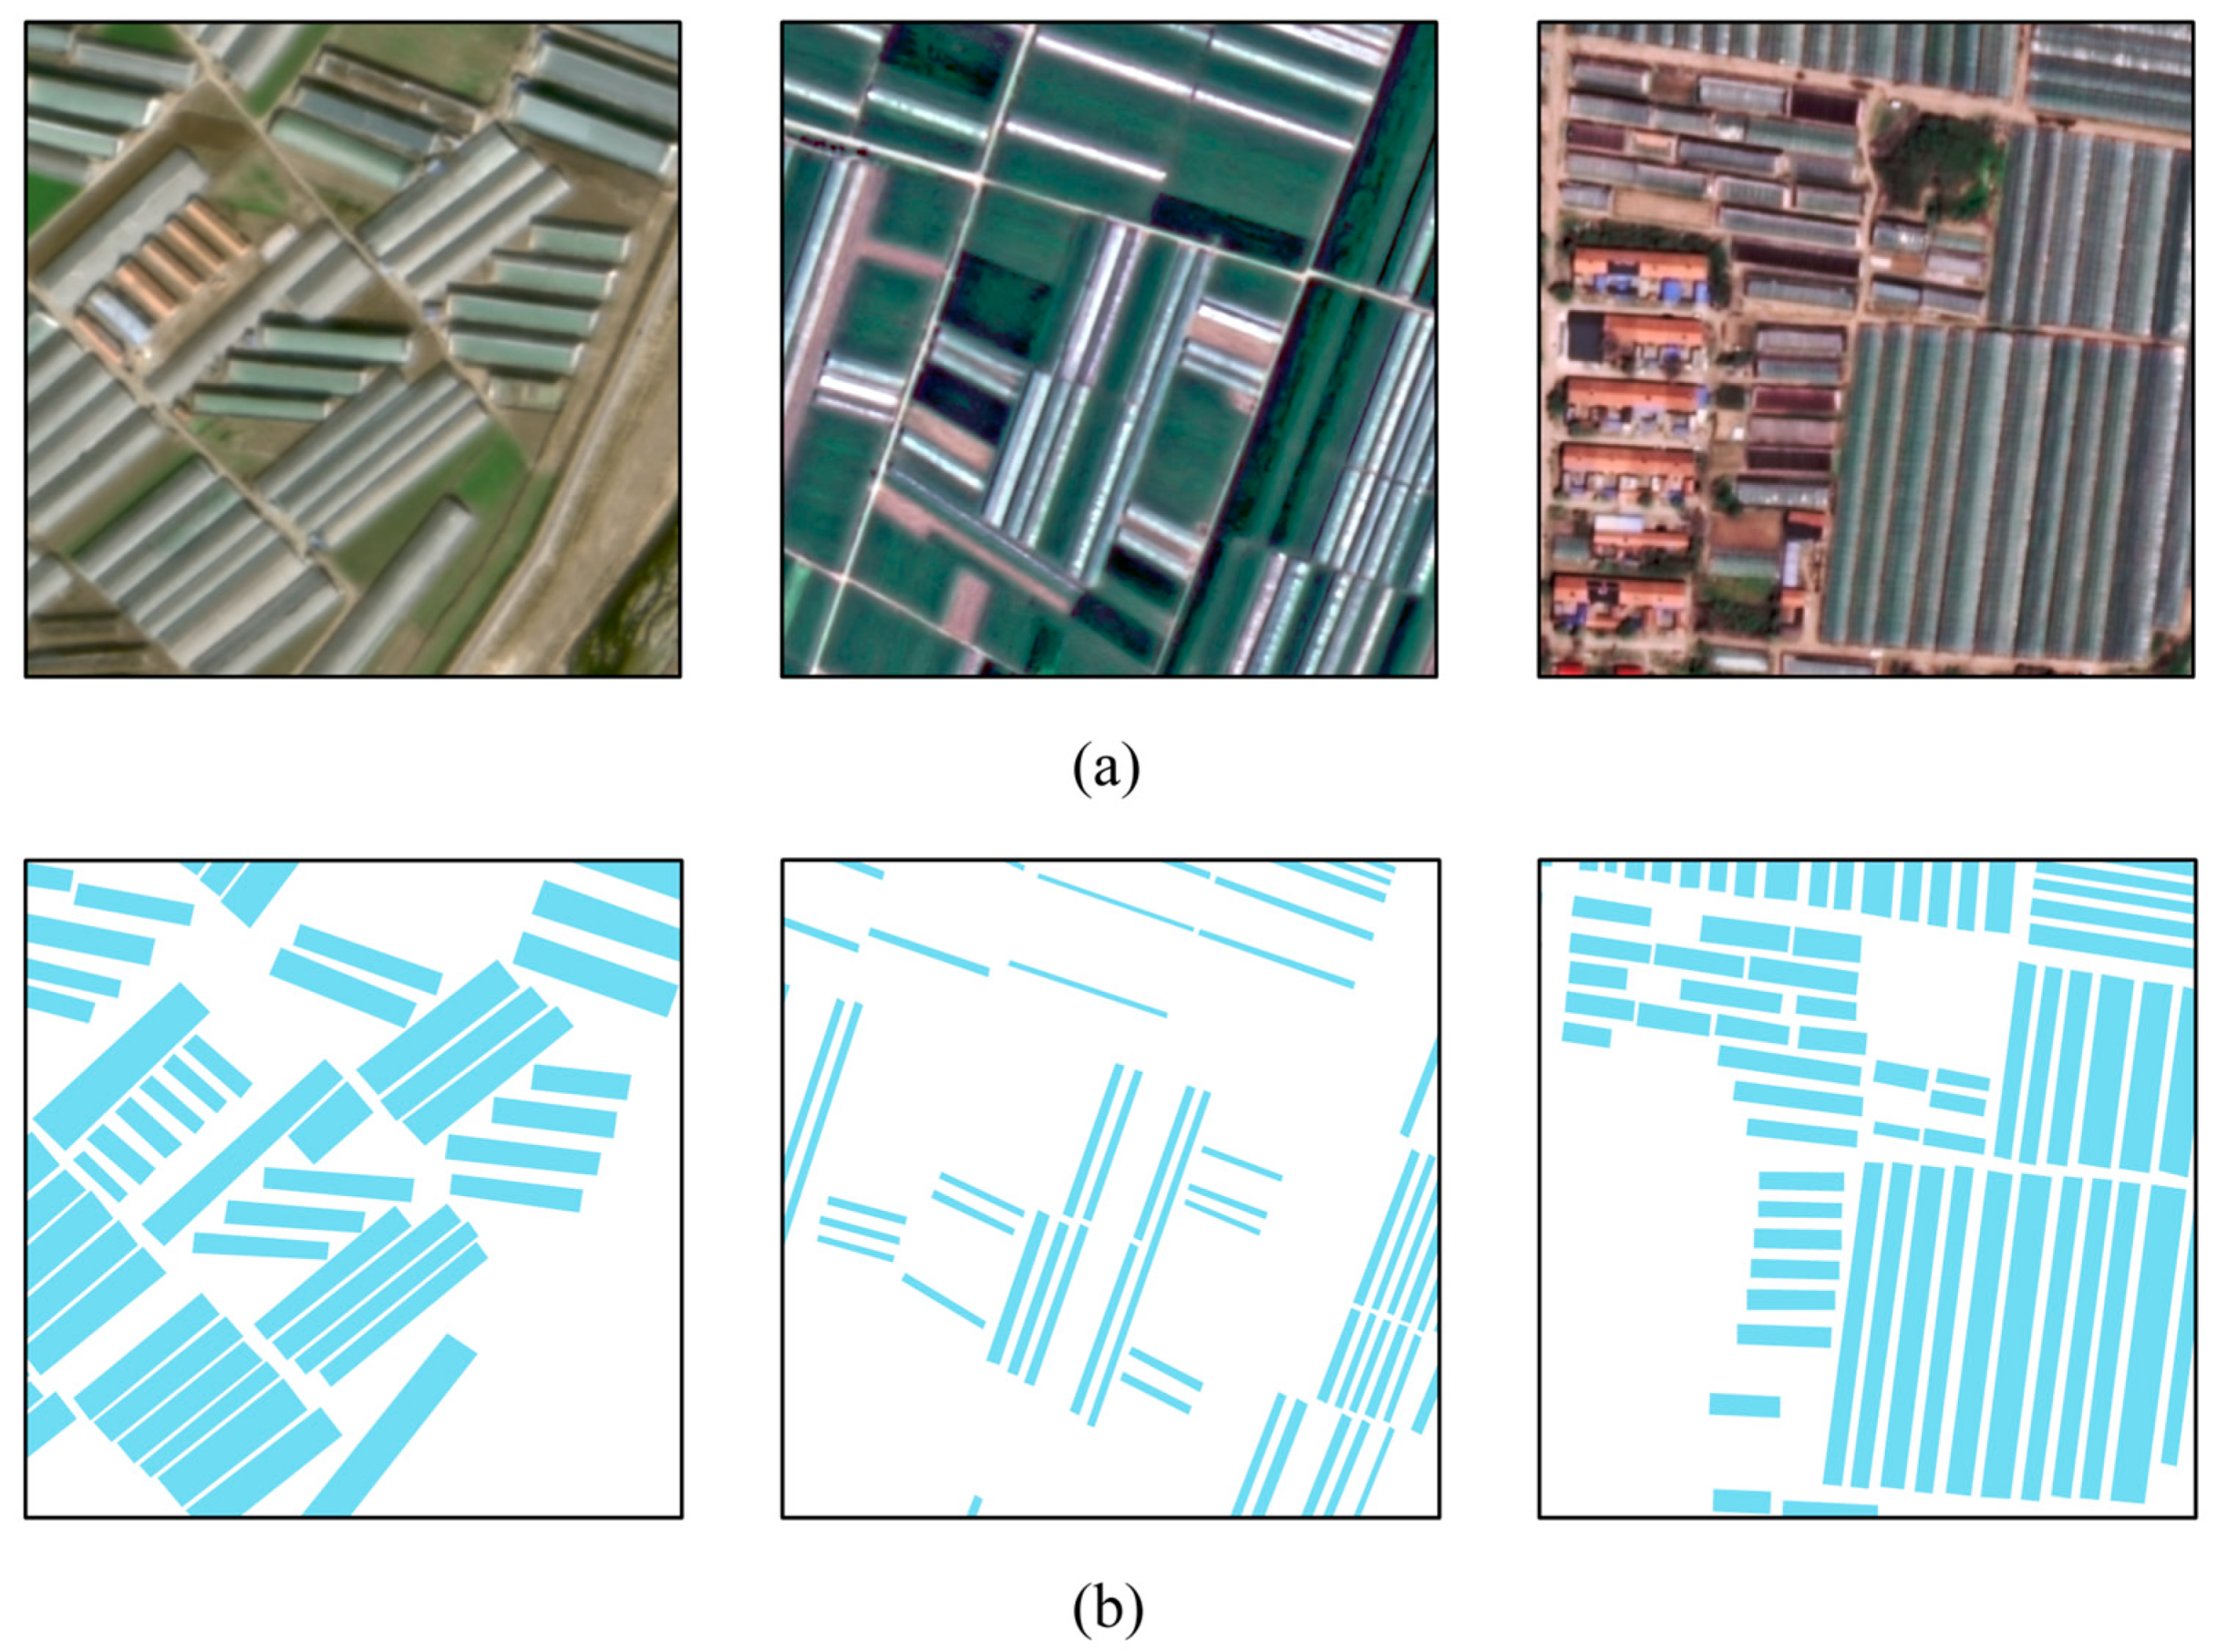
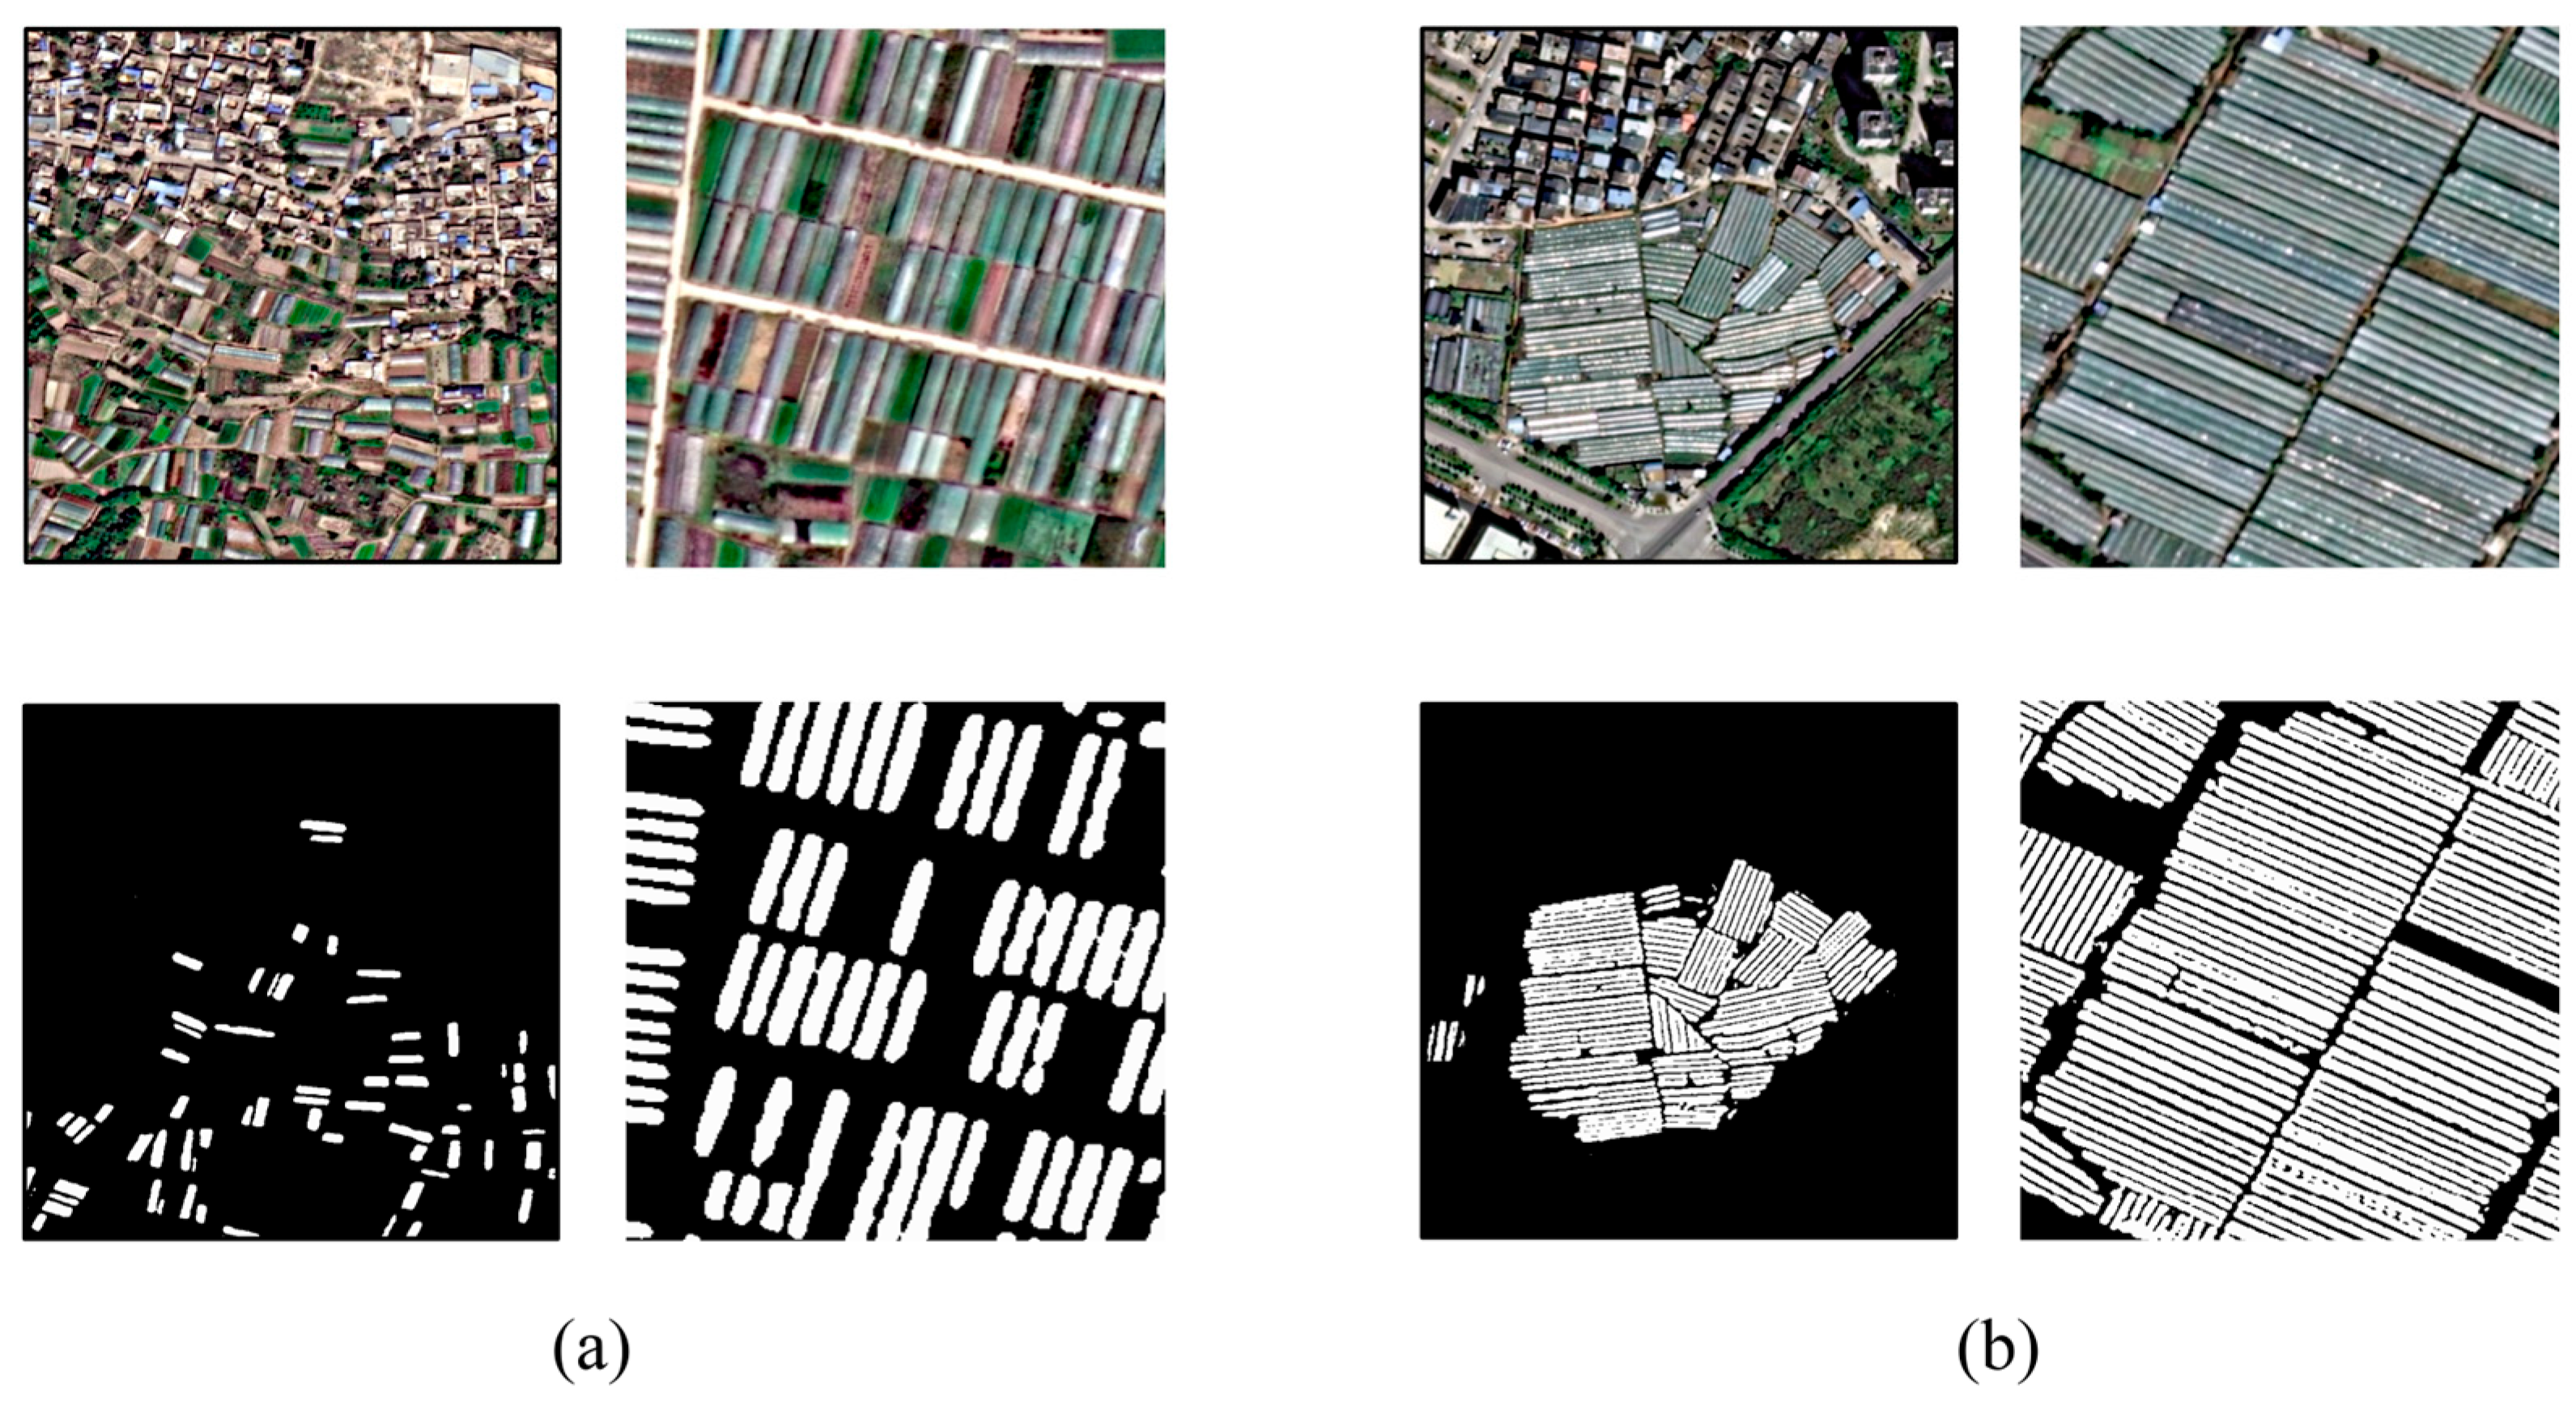
2.2. Datasets
2.3. Methods
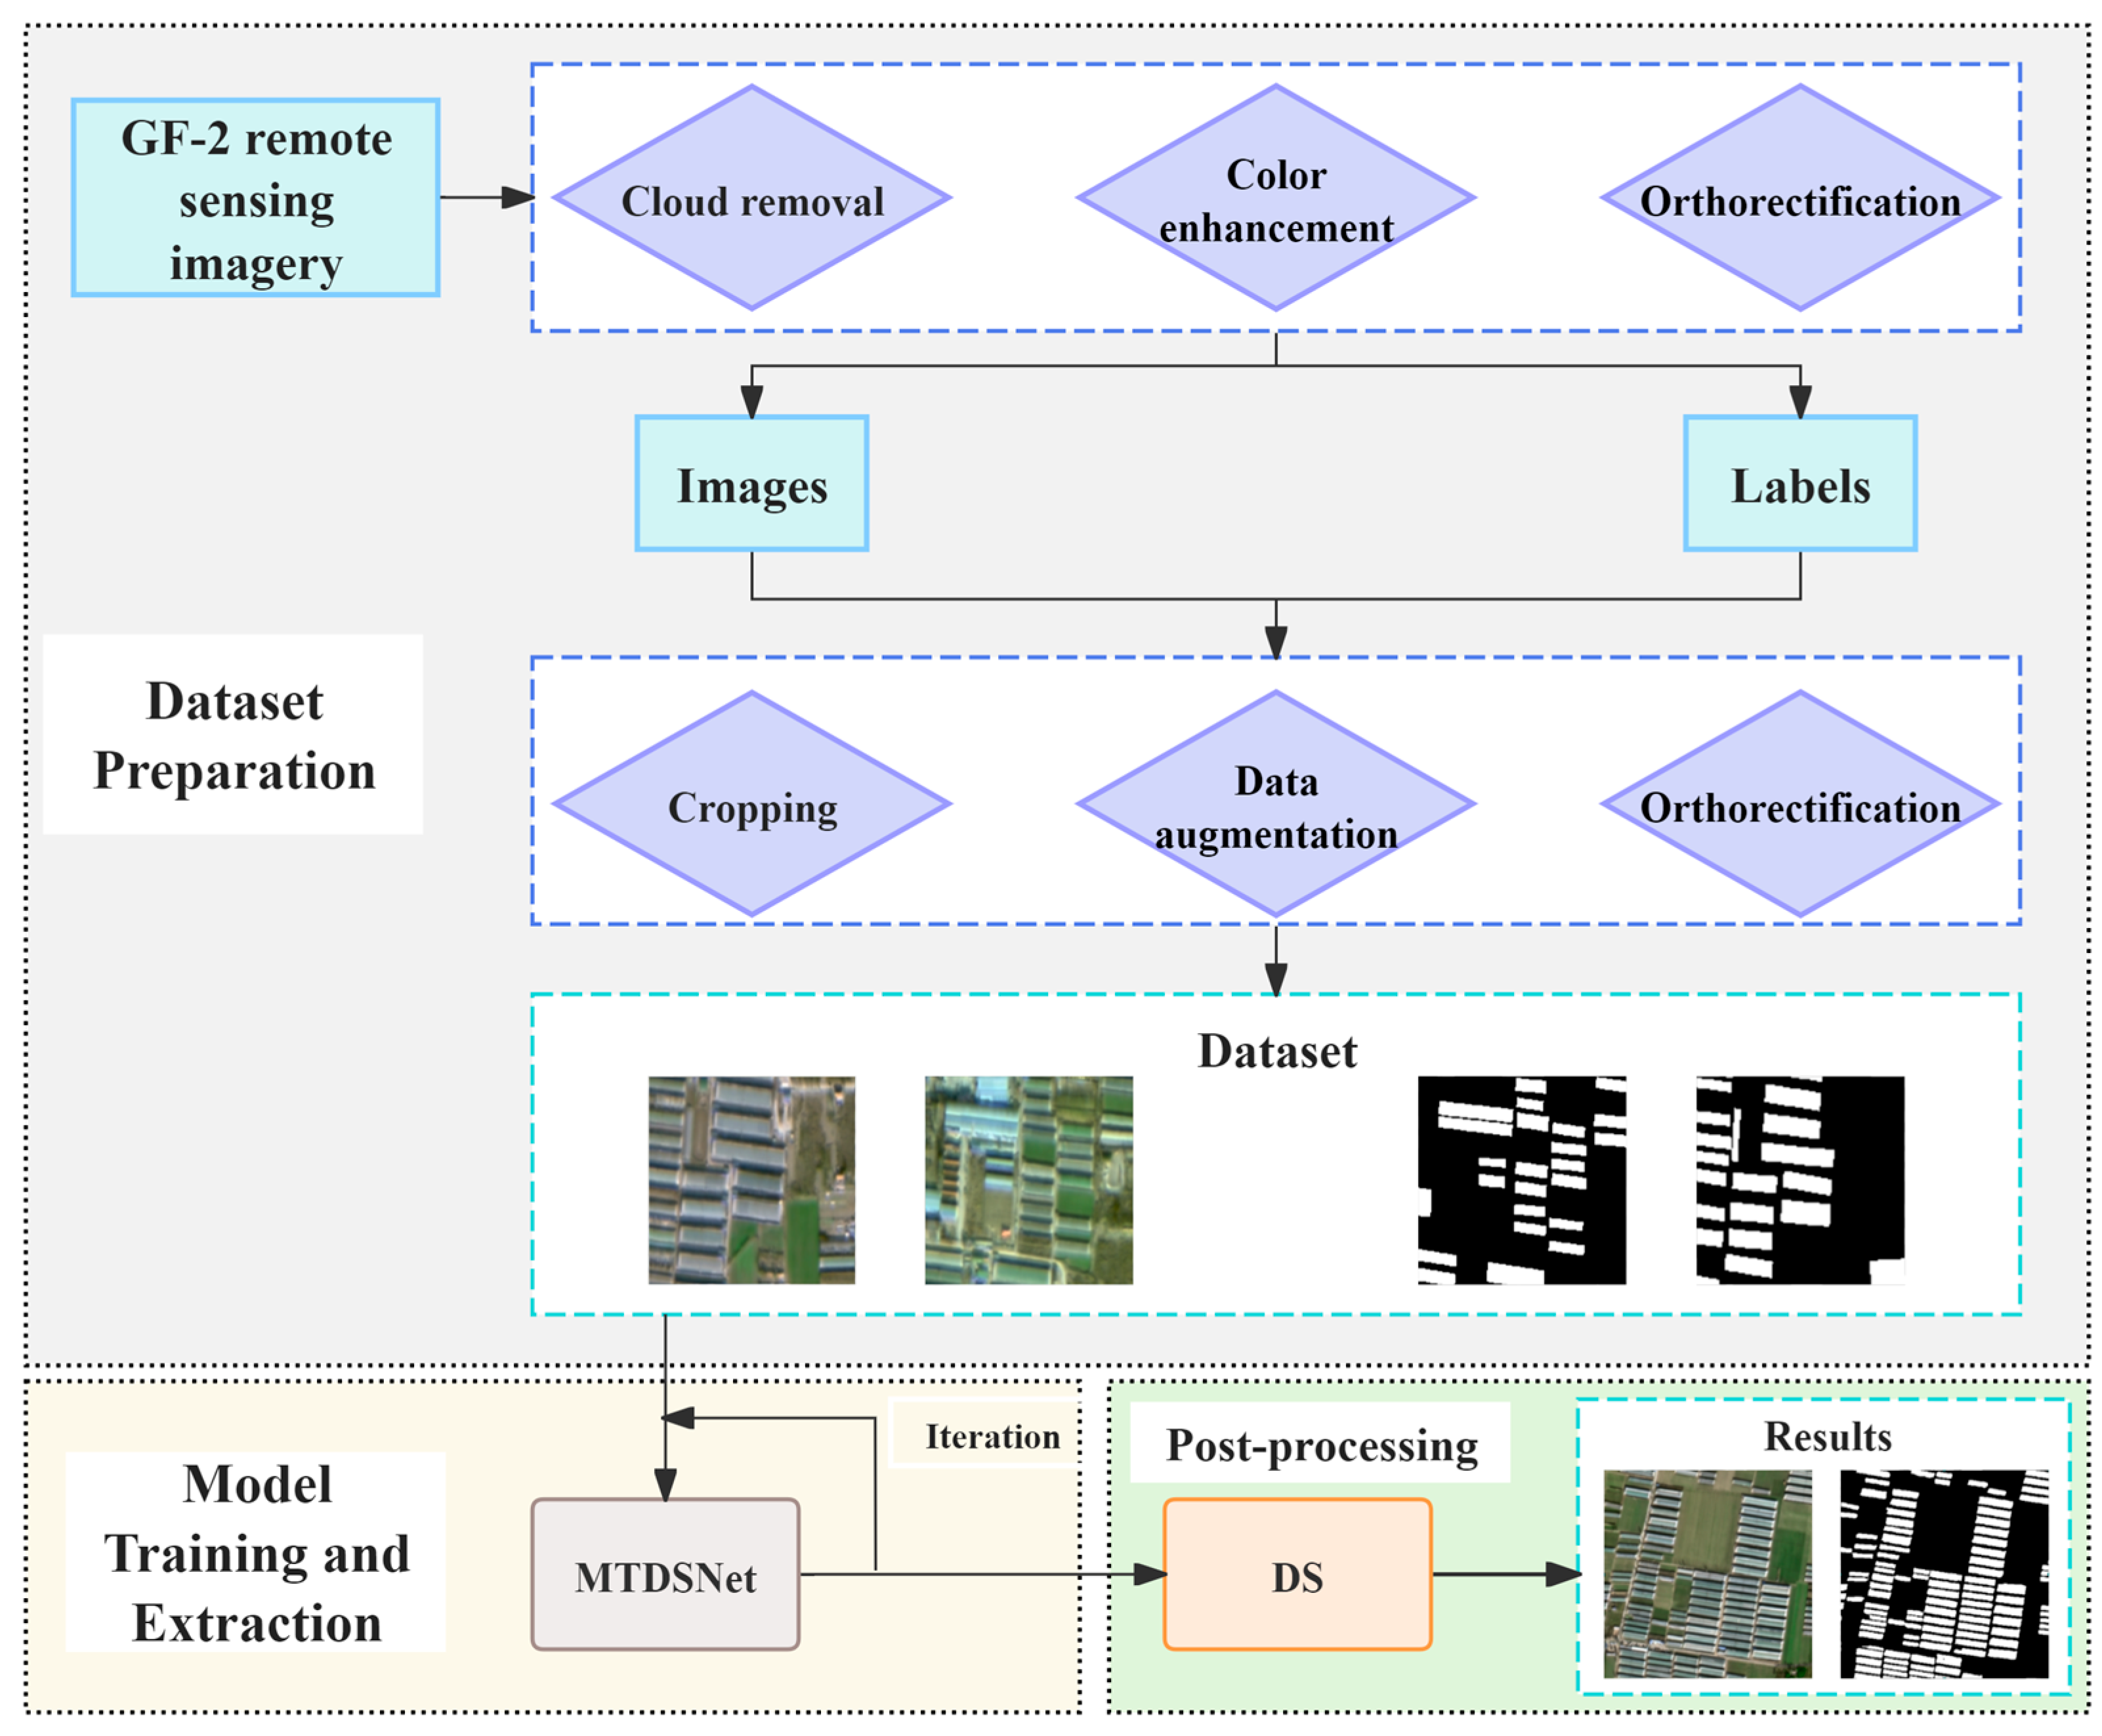
2.3.1. Extraction Workflow
2.3.2. MTDSNet Architecture
2.3.3. Multi-Scale Transformer Decoder (MTD)
- (1)
- Initial stage :
- (2)
- Multi-stage decoding:
- (3)
- Final results:
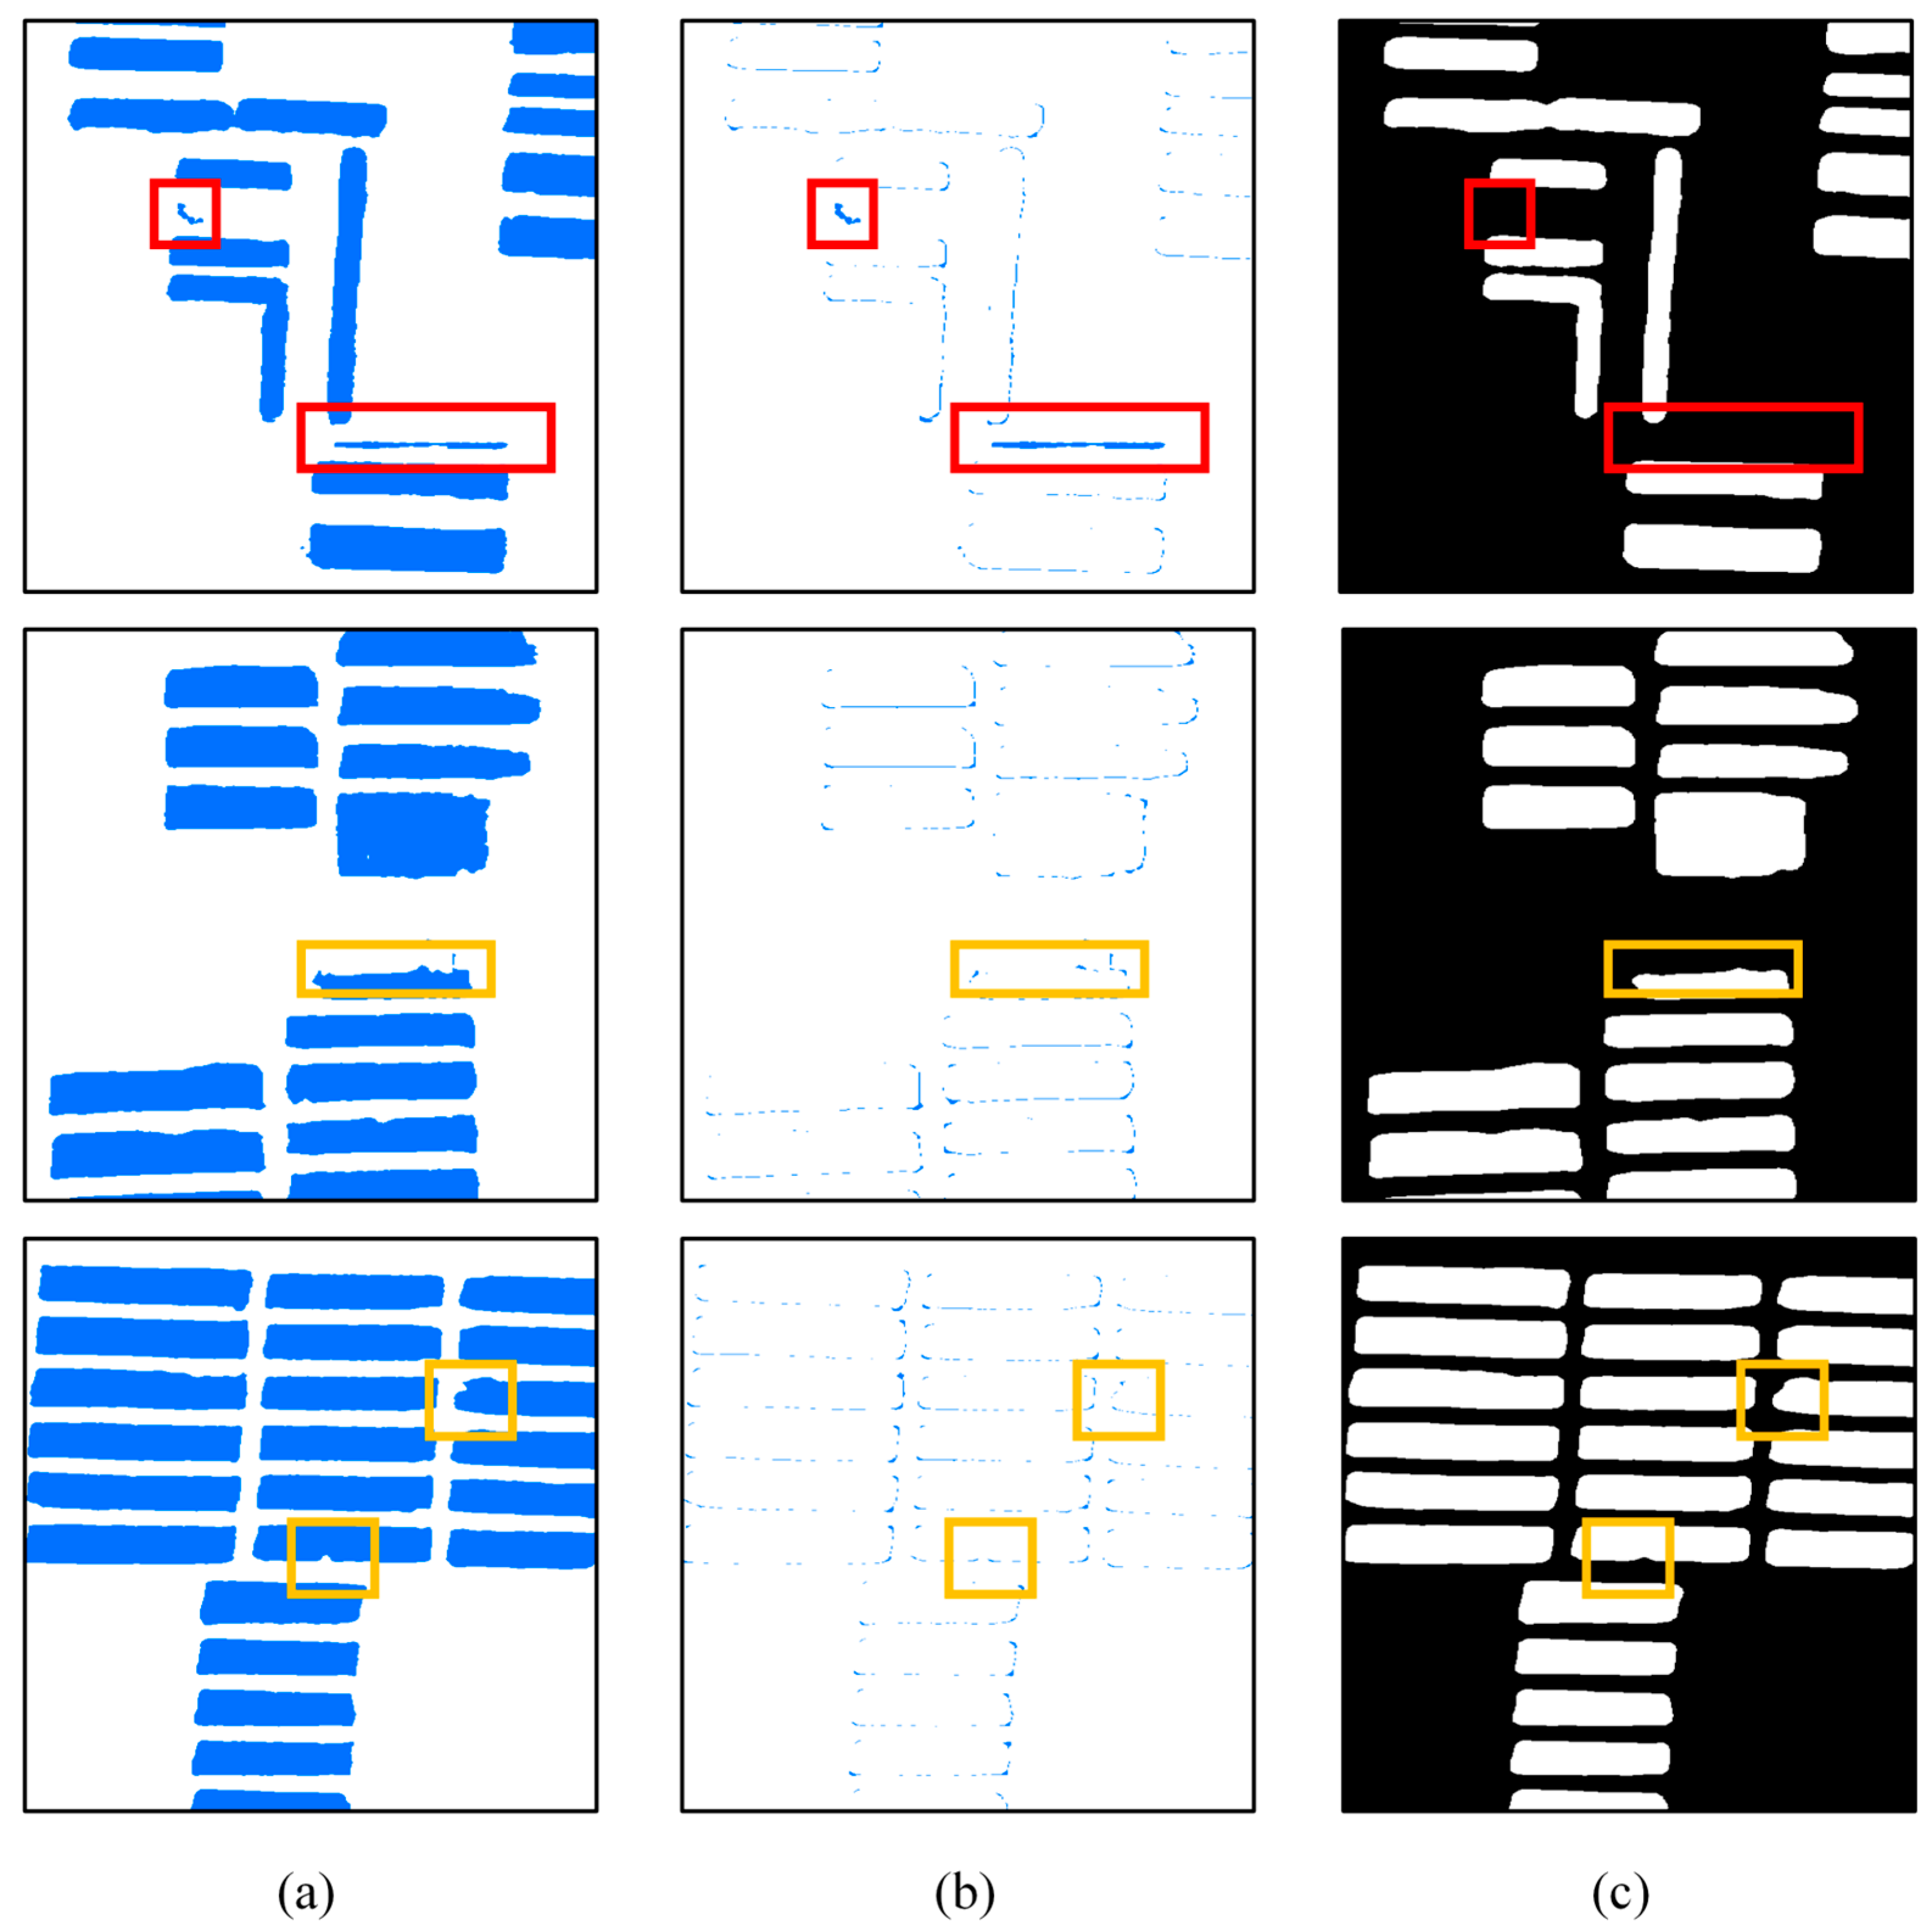
2.3.4. Denoising and Smoothing (DS) Module
2.3.5. Accuracy Evaluation Metrics
3. Results
3.1. Ablation Study
3.1.1. Quantitative Comparisons
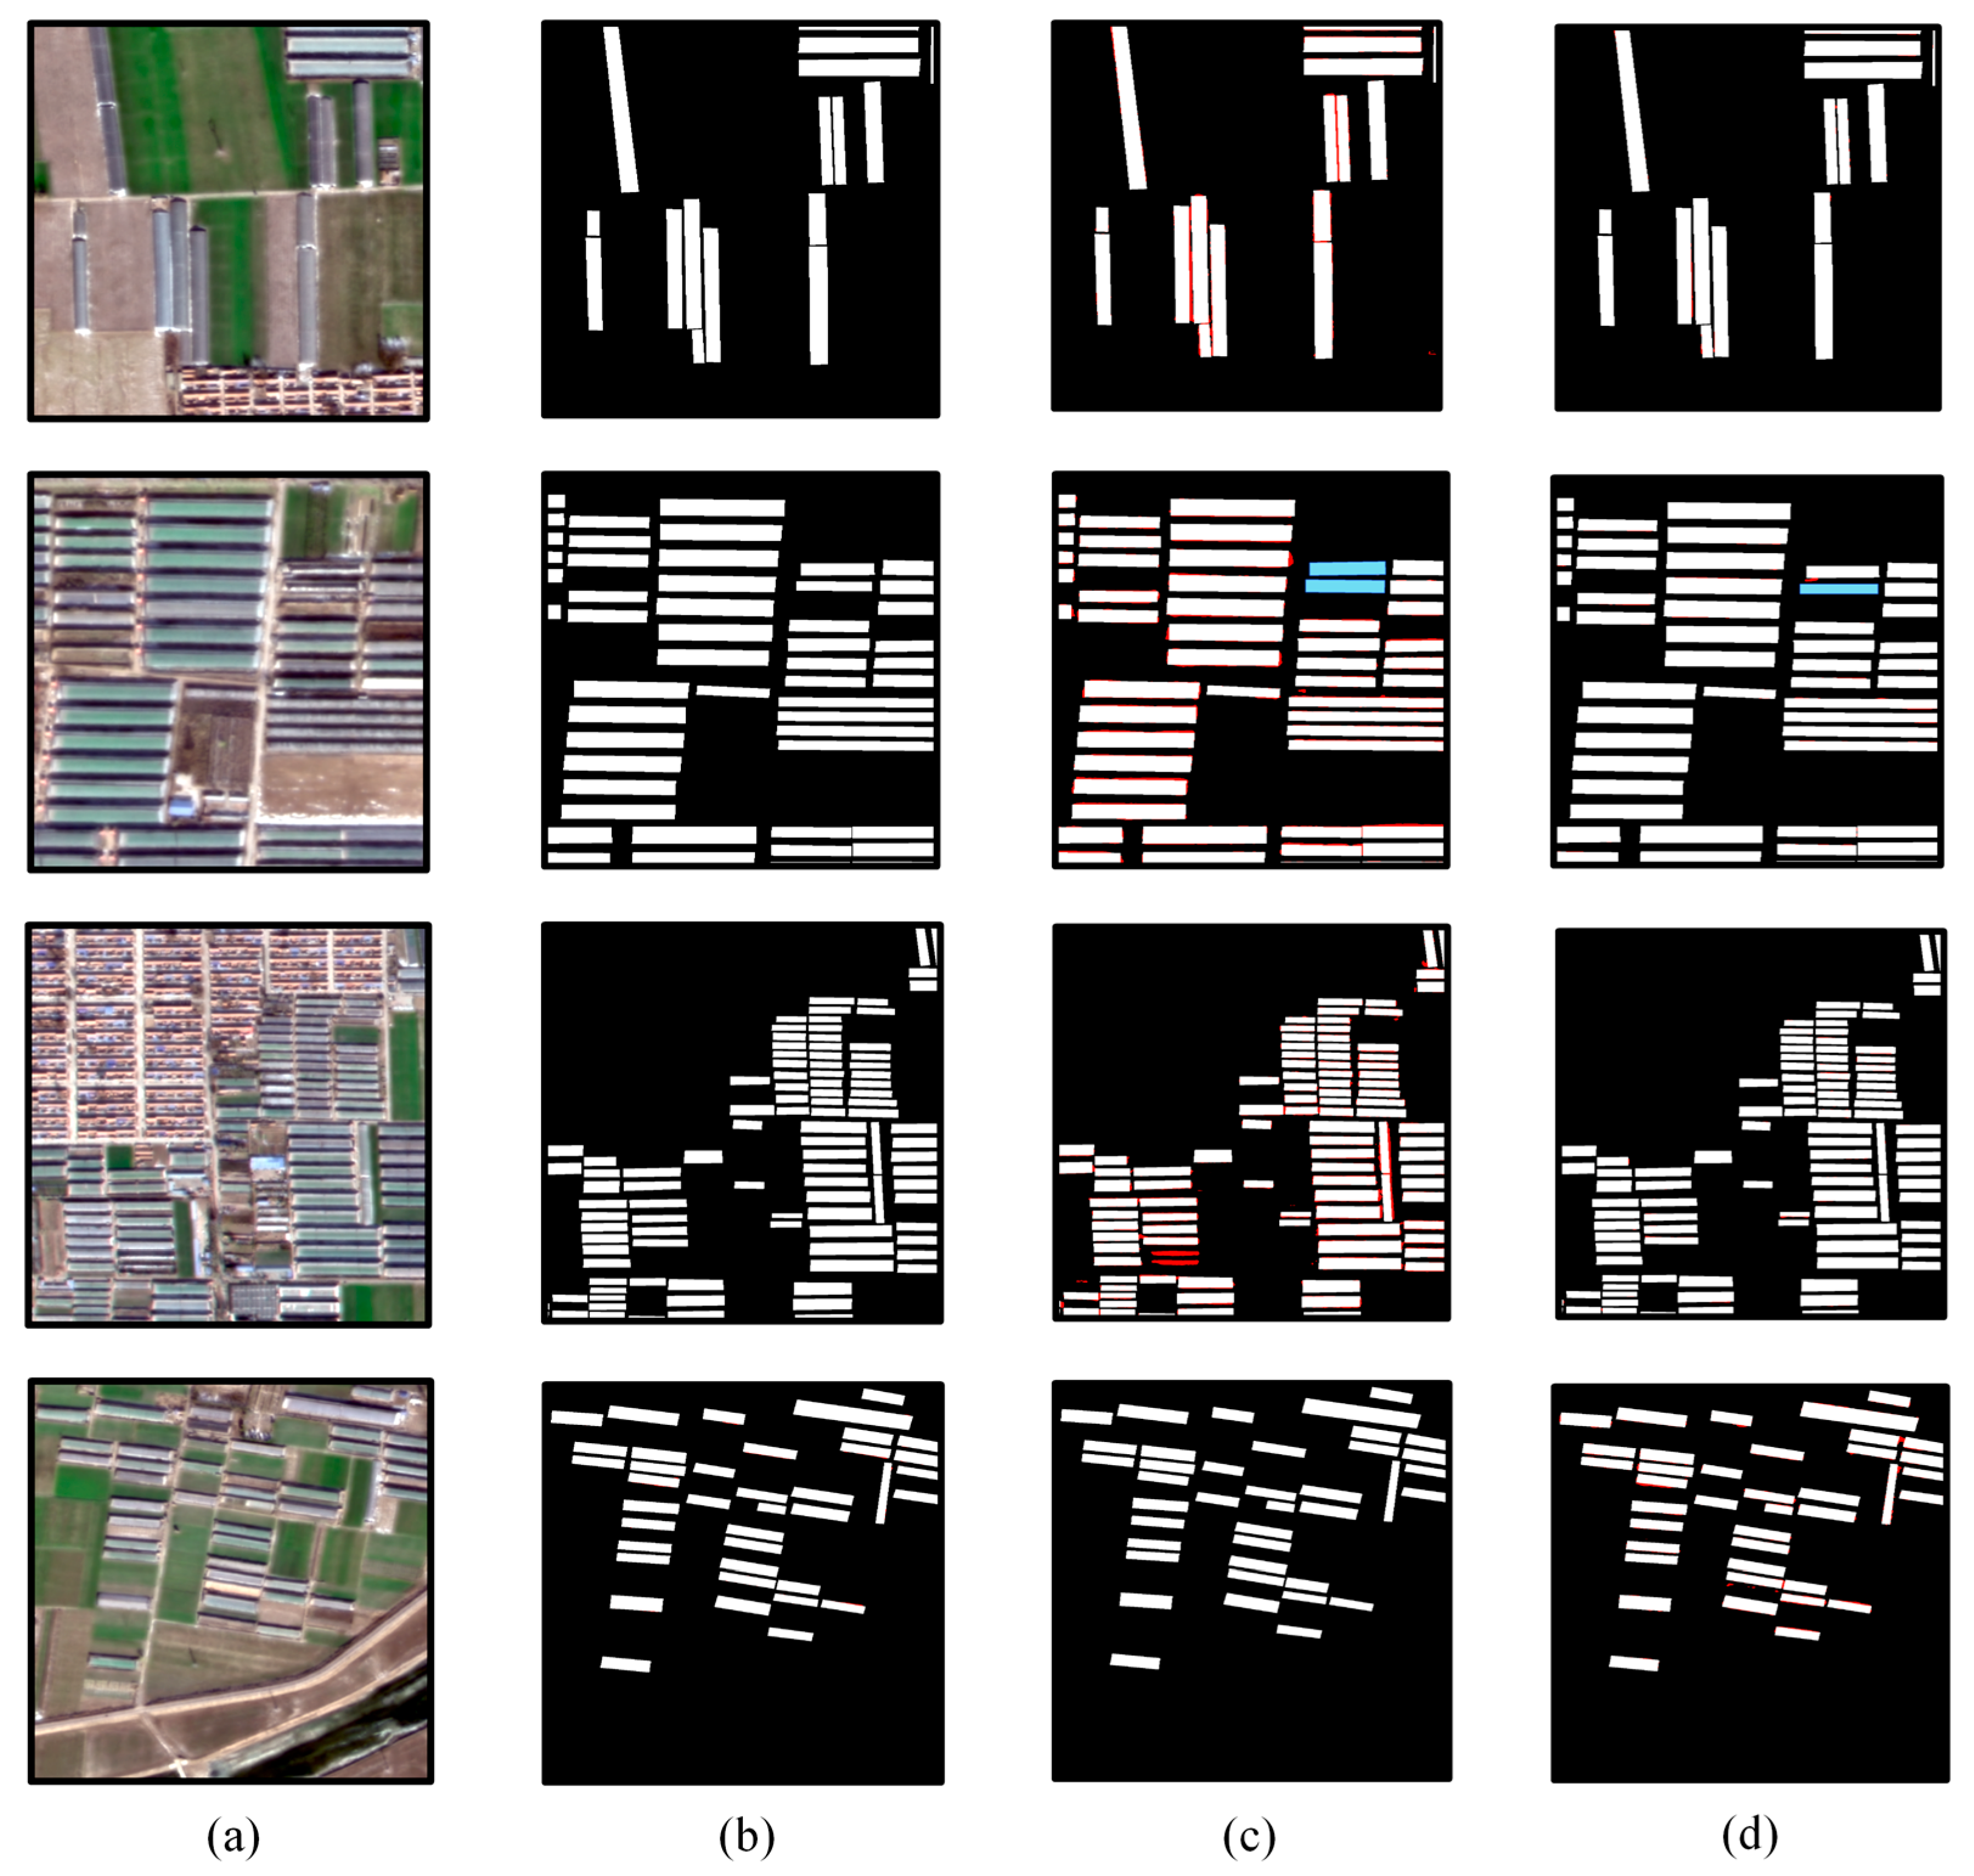
3.1.2. Extraction Result Comparison
3.2. Comparison of Methods
3.2.1. Quantitative Comparisons
3.2.2. Extraction Result Comparison
3.3. DS Module Post-Processing
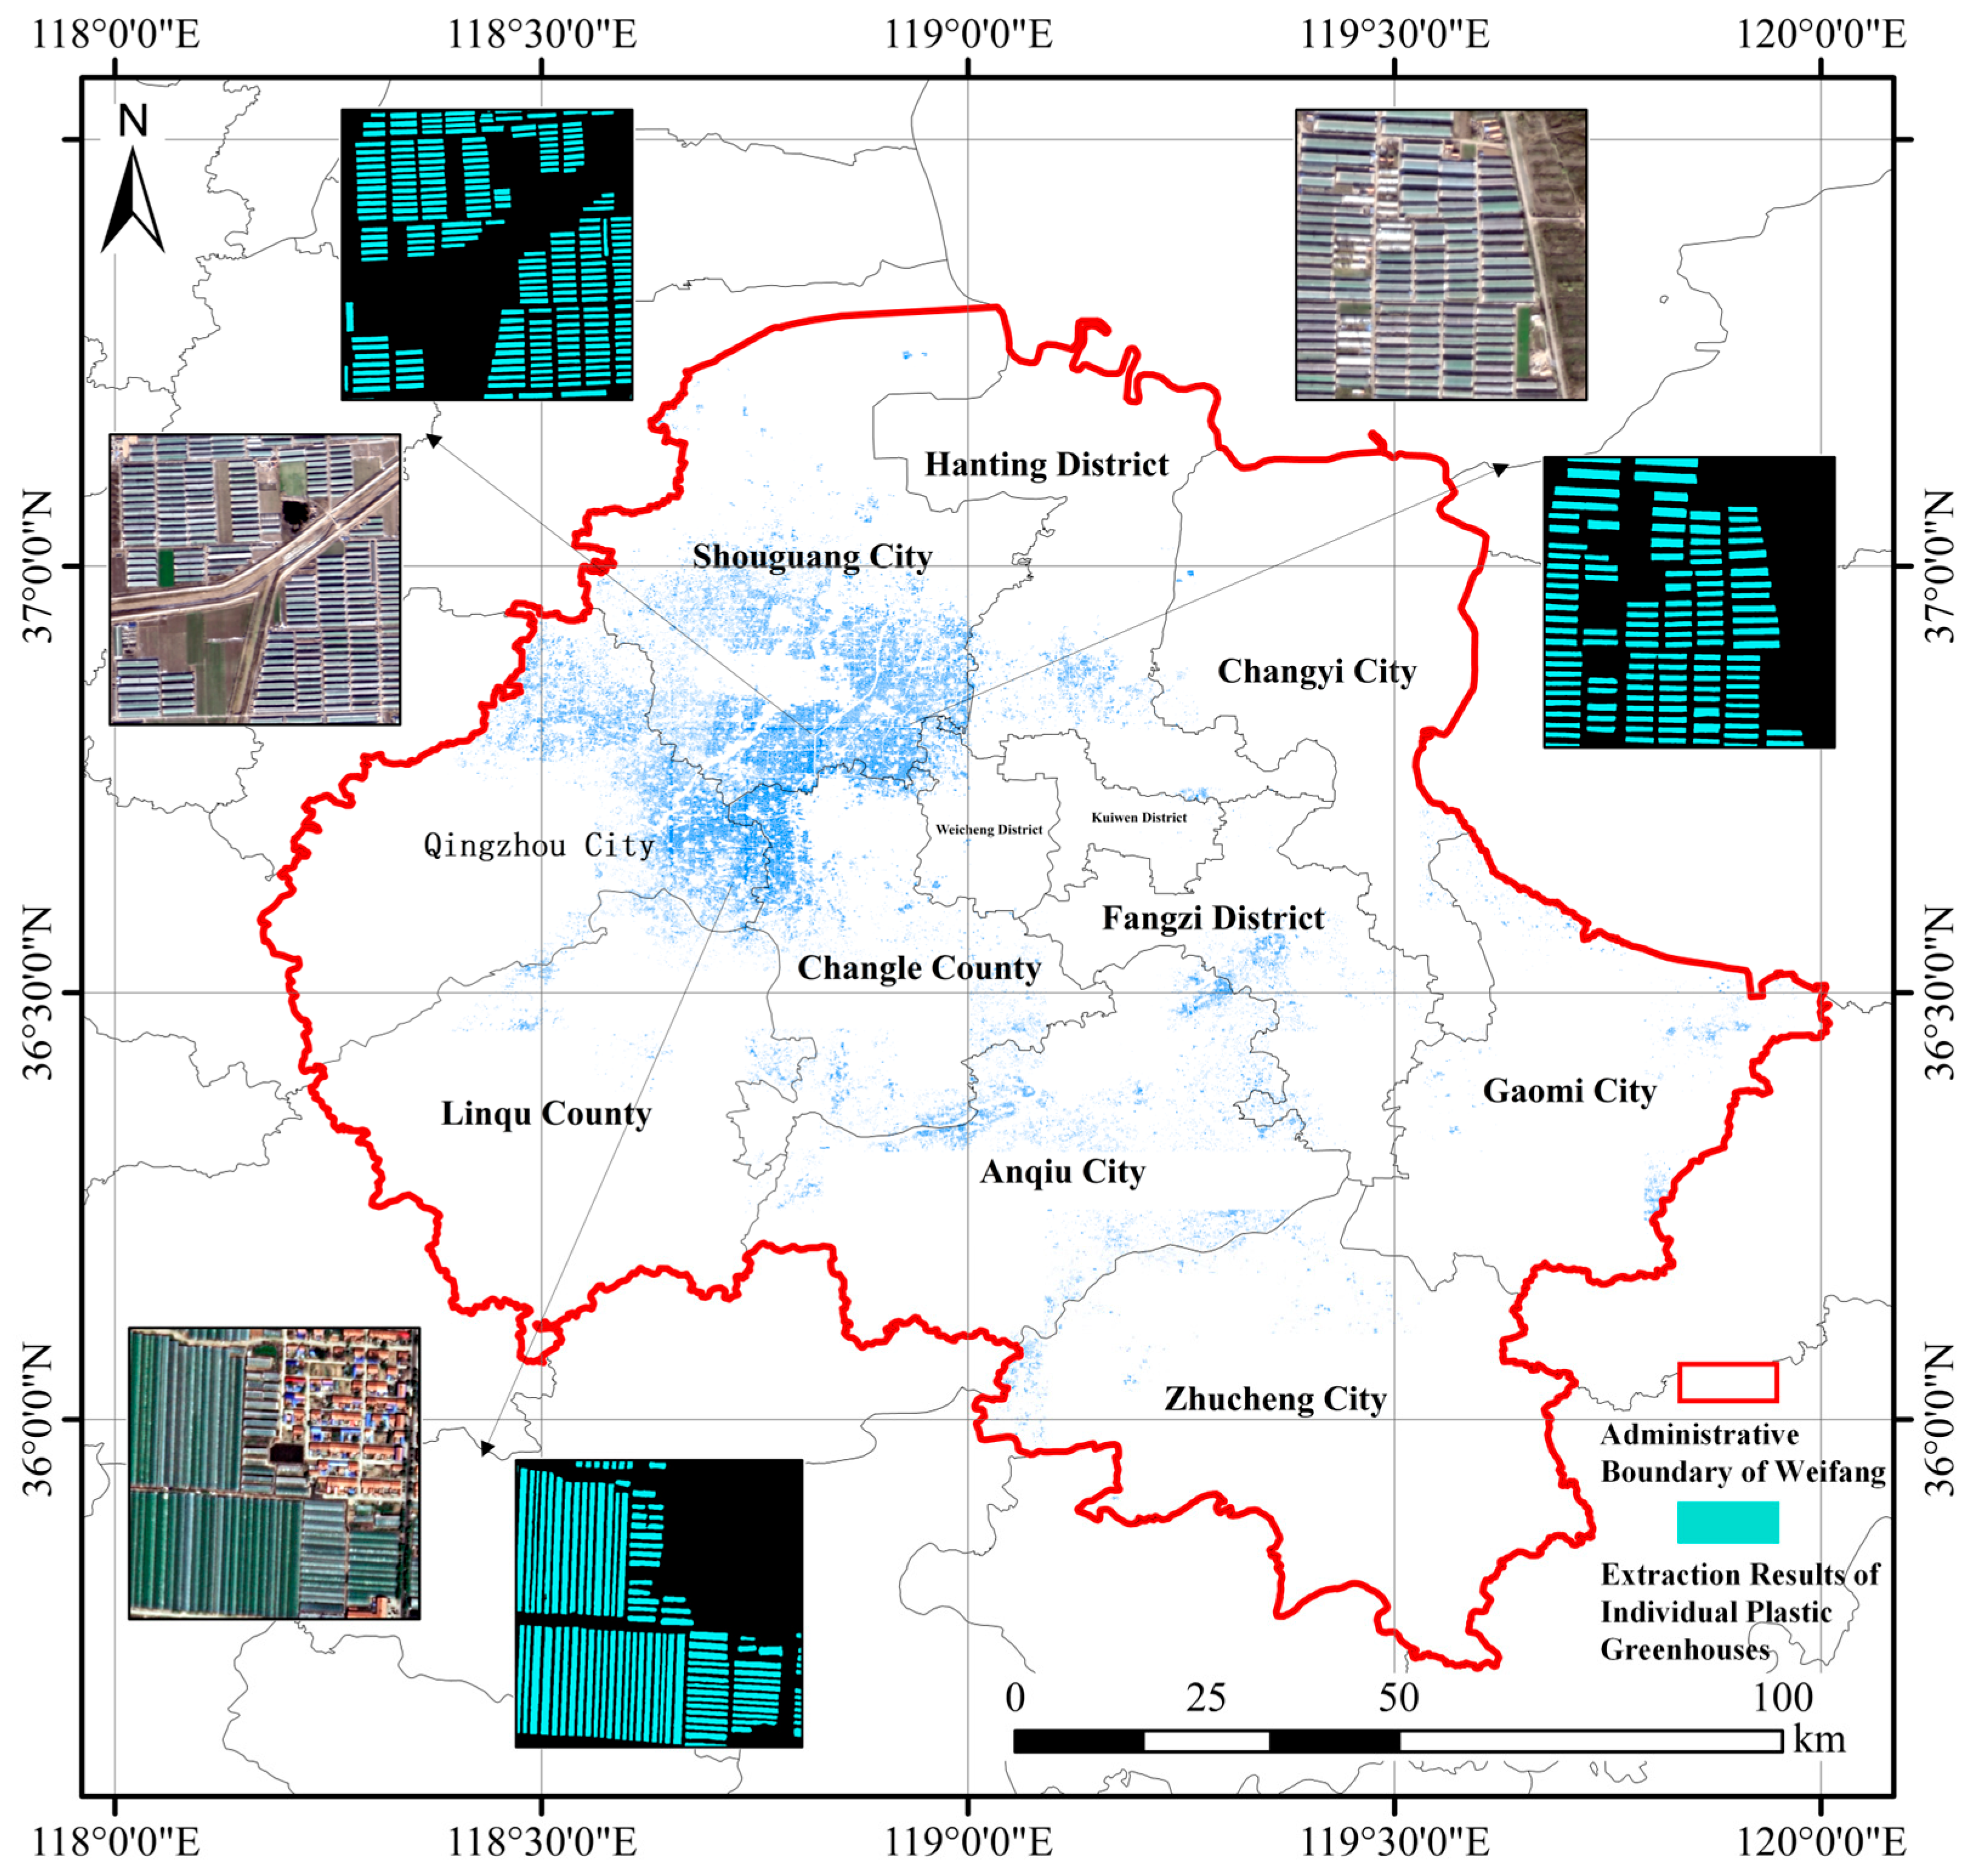
3.4. Mapping of Individual Plastic Greenhouses in Weifang City
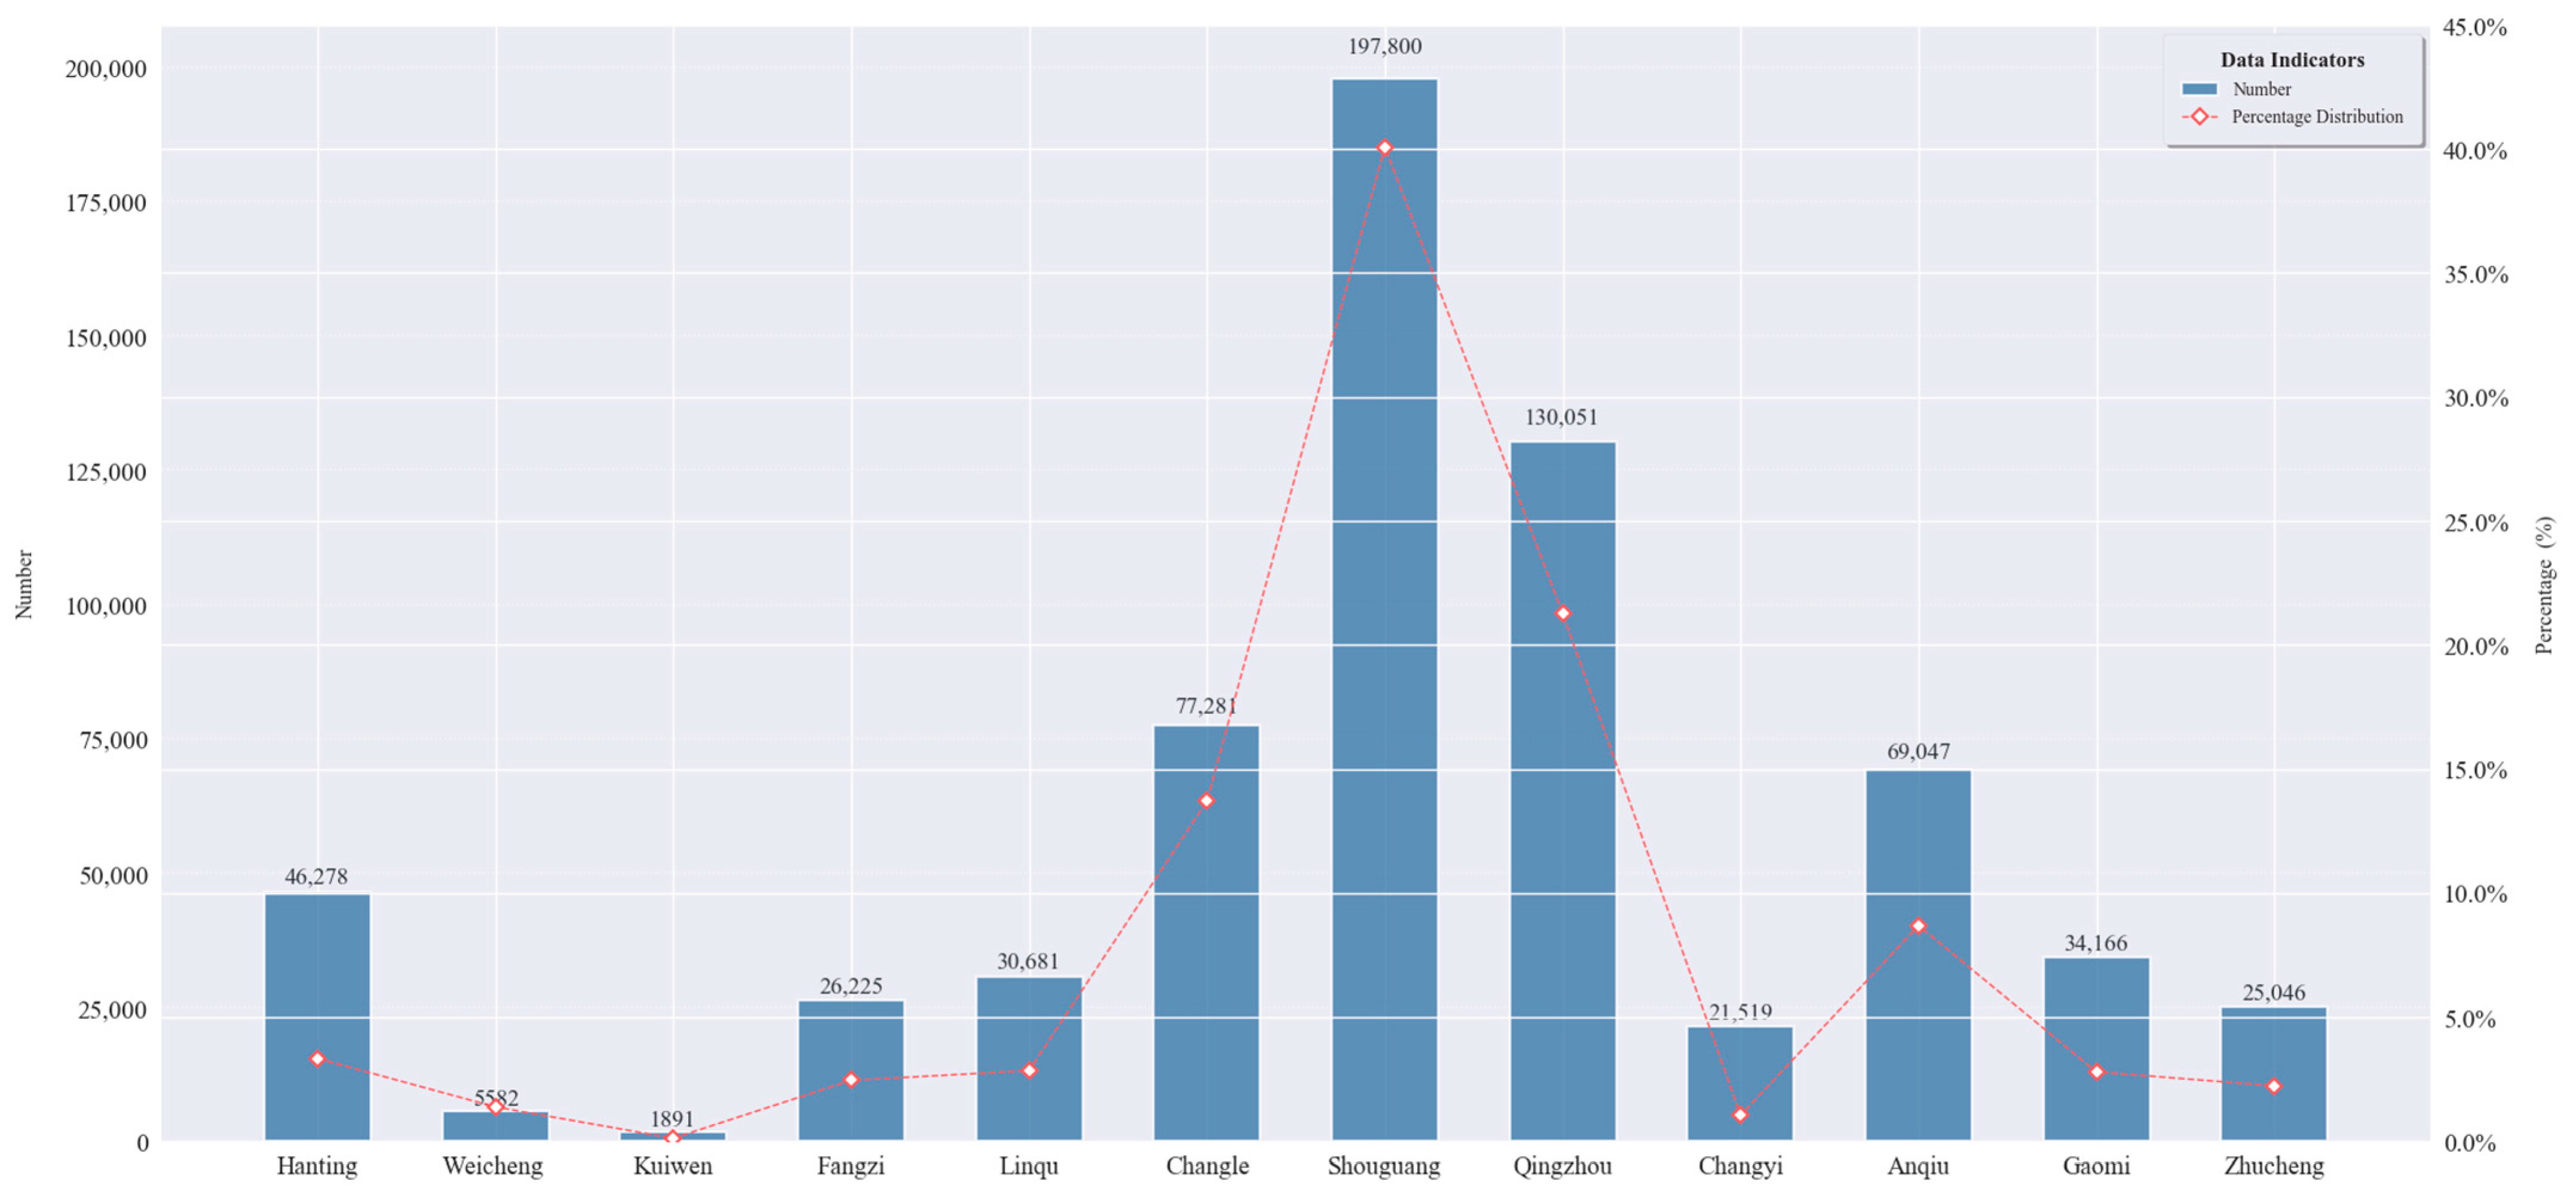
3.5. Statistics and Analysis of Individual Plastic Greenhouses
4. Discussion
4.1. Advantage
4.2. Limitations and Future Directions
5. Conclusions
Author Contributions
Funding
Data Availability Statement
Acknowledgments
Conflicts of Interest
Abbreviations
| MTDSNet | Multi-scale Transformer Decoder Swin-UNet |
| MTD | Multi-scale Transformer Decoder |
| DS | Denoising and Smoothing |
| DEM | Digital Elevation Model |
| HR | High-Resolution |
| CCA | Connected Component Analysis |
| MO | Morphological Operations |
| PPM | Pyramid Pooling Module |
| IoU | Intersection over Union |
References
- McMahon, R.W. An Introduction to Greenhouse Production. Curriculum Materials Service, Ohio State University, 254 Agricultural Administration Building, 2120 Fyffe Road, Columbus, OH 43210-1067 (Stock No. 9502M, $42.95). 2000. Available online: https://eric.ed.gov/?id=ED451356 (accessed on 11 June 2025).
- Guo, B.; Zhou, B.; Zhang, Z.; Li, K.; Wang, J.; Chen, J.; Papadakis, G. A critical review of the status of current greenhouse technology in China and development prospects. Appl. Sci. 2024, 14, 5952. [Google Scholar] [CrossRef]
- Chen, Y.; Hu, W.; Huang, B.; Weindorf, D.C.; Rajan, N.; Liu, X.; Niedermann, S. Accumulation and health risk of heavy metals in vegetables from harmless and organic vegetable production systems of China. Ecotoxicol. Environ. Saf. 2013, 98, 324–330. [Google Scholar] [CrossRef] [PubMed]
- Ma, H.; Feng, T.; Shen, X.; Luo, Z.; Chen, P.; Guan, B. Greenhouse extraction with high-resolution remote sensing imagery using fused fully convolutional network and object-oriented image analysis. J. Appl. Remote Sens. 2021, 15, 046502. [Google Scholar] [CrossRef]
- Aguilar, M.Á.; Jiménez-Lao, R.; Nemmaoui, A.; Aguilar, F.J.; Koc-San, D.; Tarantino, E.; Chourak, M. Evaluation of the consistency of simultaneously acquired Sentinel-2 and Landsat 8 imagery on plastic covered greenhouses. Remote Sens. 2020, 12, 2015. [Google Scholar] [CrossRef]
- Van Delden, S.H.; SharathKumar, M.; Butturini, M.; Graamans, L.J.A.; Heuvelink, E.; Kacira, M.; Kaiser, E.; Klamer, R.S.; Klerkx, L.; Kootstra, G.; et al. Current status and future challenges in implementing and upscaling vertical farming systems. Nat. Food 2021, 2, 944–956. [Google Scholar] [CrossRef]
- Hu, W.; Zhang, Y.; Huang, B.; Teng, Y. Soil environmental quality in greenhouse vegetable production systems in eastern China: Current status and management strategies. Chemosphere 2017, 170, 183–195. [Google Scholar] [CrossRef]
- Wang, Y.; Li, L.; Zhang, X.; Ji, M. Pesticide residues in greenhouse leafy vegetables in cold seasons and dietary exposure assessment for consumers in Liaoning Province, Northeast China. Agronomy 2024, 14, 322. [Google Scholar] [CrossRef]
- Liu, X.; Xin, L. Spatial and temporal evolution and greenhouse gas emissions of China’s agricultural plastic greenhouses. Sci. Total Environ. 2023, 863, 160810. [Google Scholar] [CrossRef]
- Chen, W.; Li, J.; Wang, D.; Xu, Y.; Liao, X.; Wang, Q.; Chen, Z. Large-scale automatic extraction of agricultural greenhouses based on high-resolution remote sensing and deep learning technologies. Environ. Sci. Pollut. Res. 2023, 30, 106671–106686. [Google Scholar] [CrossRef]
- Levin, N.; Lugassi, R.; Ramon, U.; Braun, O.; Ben-Dor, E. Remote sensing as a tool for monitoring plasticulture in agricultural landscapes. Int. J. Remote Sens. 2007, 28, 183–202. [Google Scholar] [CrossRef]
- Picuno, P. Innovative material and improved technical design for a sustainable exploitation of agricultural plastic film. Polym.-Plast. Technol. Eng. 2014, 53, 1000–1011. [Google Scholar] [CrossRef]
- Agüera, F.; Aguilar, F.J.; Aguilar, M.A. Using texture analysis to improve per-pixel classification of very high resolution images for mapping plastic greenhouses. ISPRS J. Photogramm. Remote Sens. 2008, 63, 635–646. [Google Scholar] [CrossRef]
- Chi, M.; Plaza, A.; Benediktsson, J.A.; Sun, Z.; Shen, J.; Zhu, Y. Big data for remote sensing: Challenges and opportunities. Proc. IEEE 2016, 104, 2207–2219. [Google Scholar] [CrossRef]
- Chen, W.; Xu, Y.; Zhang, Z.; Yang, L.; Pan, X.; Jia, Z. Mapping agricultural plastic greenhouses using Google Earth images and deep learning. Comput. Electron. Agric. 2021, 191, 106552. [Google Scholar] [CrossRef]
- Taşdemir, K.; Koc-San, D. Unsupervised extraction of greenhouses using WorldView-2 images. In Proceedings of the 2014 IEEE Geoscience and Remote Sensing Symposium, Quebec City, QC, Canada, 13–18 July 2014; pp. 4914–4917. [Google Scholar] [CrossRef]
- Yang, D.; Chen, J.; Zhou, Y.; Chen, X.; Chen, X.; Cao, X. Mapping plastic greenhouse with medium spatial resolution satellite data: Development of a new spectral index. ISPRS J. Photogramm. Remote Sens. 2017, 128, 47–60. [Google Scholar] [CrossRef]
- Tarantino, E.; Figorito, B. Mapping rural areas with widespread plastic covered vineyards using true color aerial data. Remote Sens. 2012, 4, 1913–1928. [Google Scholar] [CrossRef]
- Aguilar, M.A.; Vallario, A.; Aguilar, F.J.; García Lorca, A.; Parente, C. Object-based greenhouse horticultural crop identification from multi-temporal satellite imagery: A case study in Almeria, Spain. Remote Sens. 2015, 7, 7378–7401. [Google Scholar] [CrossRef]
- Wu, C.F.; Deng, J.S.; Wang, K.; Ma, L.G.; Tahmassebi, A.R.S. Object-based classification approach for greenhouse mapping using Landsat-8 imagery. Int. J. Agric. Biol. Eng. 2016, 9, 79–88. [Google Scholar] [CrossRef]
- Balcik, F.B.; Senel, G.; Goksel, C. Object-based classification of greenhouses using Sentinel-2 MSI and SPOT-7 images: A case study from Anamur (Mersin), Turkey. IEEE J. Sel. Top. Appl. Earth Obs. Remote Sens. 2020, 13, 2769–2777. [Google Scholar] [CrossRef]
- Ma, A.; Chen, D.; Zhong, Y.; Zheng, Z.; Zhang, L. National-scale greenhouse mapping for high spatial resolution remote sensing imagery using a dense object dual-task deep learning framework: A case study of China. ISPRS J. Photogramm. Remote Sens. 2021, 181, 279–294. [Google Scholar] [CrossRef]
- Deng, J.; Bai, Y.; Chen, Z.; Shen, T.; Li, C.; Yang, X. A convolutional neural network for coastal aquaculture extraction from high-resolution remote sensing imagery. Sustainability 2023, 15, 5332. [Google Scholar] [CrossRef]
- Tian, X.; Chen, Z.; Li, Y.; Bai, Y. Crop classification in mountainous areas using object-oriented methods and multi-source data: A case study of Xishui county, China. Agronomy 2023, 13, 3037. [Google Scholar] [CrossRef]
- Chen, H.; Li, Z.; Wu, J.; Xiong, W.; Du, C. SemiRoadExNet: A semi-supervised network for road extraction from remote sensing imagery via adversarial learning. ISPRS J. Photogramm. Remote Sens. 2023, 198, 169–183. [Google Scholar] [CrossRef]
- Xie, J.; Tian, T.; Hu, R.; Yang, X.; Xu, Y.; Zan, L. A Novel Detector for Wind Turbines in Wide-Ranging, Multi-Scene Remote Sensing Images. IEEE J. Sel. Top. Appl. Earth Obs. Remote Sensing. 2024, 17, 17725–17738. [Google Scholar] [CrossRef]
- Chen, Z.; Wu, Z.; Gao, J.; Cai, M.; Yang, X.; Chen, P.; Li, Q. A convolutional neural network for large-scale greenhouse extraction from satellite images considering spatial features. Remote Sens. 2022, 14, 4908. [Google Scholar] [CrossRef]
- Tong, X.; Zhang, X.; Fensholt, R.; Jensen, P.R.D.; Li, S.; Larsen, M.N.; Reiner, F.; Tian, F.; Brandt, M. Global area boom for greenhouse cultivation revealed by satellite mapping. Nat. Food 2024, 5, 513–523. [Google Scholar] [CrossRef]
- Cao, H.; Wang, Y.; Chen, J.; Jiang, D.; Zhang, X.; Tian, Q.; Wang, M. Swin-unet: Unet-like pure transformer for medical image segmentation. In Computer Vision—ECCV 2022 Workshops, Proceedings of the European Conference on Computer Vision, Tel Aviv, Israel, 23–27 October 2022; Springer Nature: Cham, Switzerland, 2023; pp. 205–218. [Google Scholar] [CrossRef]
- Xiao, H.; Li, L.; Liu, Q.; Zhu, X.; Zhang, Q. Transformers in medical image segmentation: A review. Biomed. Signal Process. Control 2023, 84, 104791. [Google Scholar] [CrossRef]
- Kim, B.; Mun, J.; On, K.W.; Shin, M.; Lee, J.; Kim, E.S. MSTR: Multi-Scale Transformer for End-to-End Human-Object Interaction Detection. arXiv 2022, arXiv:2203.14709. [Google Scholar] [CrossRef]
- Wu, H.; Huang, P.; Zhang, M.; Tang, W.; Yu, X. CMTFNet: CNN and multiscale transformer fusion network for remote-sensing image semantic segmentation. IEEE Trans. Geosci. Remote Sens. 2023, 61, 1–12. [Google Scholar] [CrossRef]
- Ronneberger, O.; Fischer, P.; Brox, T. U-net: Convolutional networks for biomedical image segmentation. In Medical Image Computing and Computer-Assisted Intervention–MICCAI, Proceedings of the MICCAI 2015 18th International Conference, Munich, Germany, 5–9 October 2015; Springer International Publishing: Berlin/Heidelberg, Germany, 2015; pp. 234–241. [Google Scholar] [CrossRef]
- Xiao, T.; Liu, Y.; Zhou, B.; Jiang, Y.; Sun, J. Unified Perceptual Parsing for Scene Understanding. arXiv 2018, arXiv:1807.10221. [Google Scholar] [CrossRef]
- Gan, J.; Cai, K.; Fan, C.; Deng, X.; Hu, W.; Li, Z.; Wei, P.; Liao, T.; Zhang, F. CPS-RAUnet++: A Jet Axis Detection Method Based on Cross-Pseudo Supervision and Extended Unet++ Model. Electronics 2025, 14, 441. [Google Scholar] [CrossRef]
- Shaker, A.; Maaz, M.; Rasheed, H.; Khan, S.; Yang, M.H.; Khan, F.S. UNETR++: Delving into efficient and accurate 3D medical image segmentation. IEEE Trans. Med. Imaging 2024, 43, 3377–3390. [Google Scholar] [CrossRef] [PubMed]


| Methods | Recall (%) | Precision (%) | IoU (%) | F1-Score (%) |
|---|---|---|---|---|
| Baseline | 89.51 | 88.72 | 80.36 | 89.11 |
| +MTD | 92.44 | 91.47 | 85.13 | 91.95 |
| Methods | Recall (%) | Precision (%) | IoU (%) | F1-Score (%) |
|---|---|---|---|---|
| UperNet | 90.08 | 85.65 | 78.27 | 87.81 |
| CPS-RAUnet++ | 91.24 | 90.61 | 83.45 | 90.92 |
| UNet | 90.83 | 88.79 | 81.48 | 89.80 |
| UNETR++ | 91.87 | 90.78 | 84.21 | 91.28 |
| Swin-UNet | 89.51 | 88.72 | 80.36 | 89.11 |
| Our | 92.44 | 91.47 | 85.13 | 91.95 |
| District, County, City | Number | Percentage of Total Quantity (%) | Area(km2) | Percentage of Total Area (%) |
|---|---|---|---|---|
| Hanting District | 46,278 | 6.95 | 21.70 | 3.34 |
| Weicheng District | 5582 | 0.84 | 9.06 | 1.39 |
| Kuiwen District | 1891 | 0.28 | 0.83 | 0.13 |
| Fangzi District | 26,225 | 3.94 | 16.02 | 2.46 |
| Linqu County | 30,681 | 4.61 | 18.55 | 2.85 |
| Changle County | 77,281 | 11.61 | 89.10 | 13.7 |
| Shouguang City | 197,800 | 29.72 | 260.70 | 40.09 |
| Qingzhou City | 130,051 | 19.54 | 138.24 | 21.26 |
| Changyi City | 21,519 | 3.23 | 6.85 | 1.05 |
| Anqiu City | 69,047 | 10.37 | 56.52 | 8.69 |
| Gaomi City | 34,166 | 5.13 | 18.23 | 2.80 |
| Zhucheng City | 25,046 | 3.78 | 14.55 | 2.24 |
Disclaimer/Publisher’s Note: The statements, opinions and data contained in all publications are solely those of the individual author(s) and contributor(s) and not of MDPI and/or the editor(s). MDPI and/or the editor(s) disclaim responsibility for any injury to people or property resulting from any ideas, methods, instructions or products referred to in the content. |
© 2025 by the authors. Licensee MDPI, Basel, Switzerland. This article is an open access article distributed under the terms and conditions of the Creative Commons Attribution (CC BY) license (https://creativecommons.org/licenses/by/4.0/).
Share and Cite
Chang, Y.; Yu, X.; Yang, X.; Chen, Z.; Chen, P.; Yang, X.; Bai, Y. Agricultural Greenhouse Extraction Based on Multi-Scale Feature Fusion and GF-2 Remote Sensing Imagery. Remote Sens. 2025, 17, 2061. https://doi.org/10.3390/rs17122061
Chang Y, Yu X, Yang X, Chen Z, Chen P, Yang X, Bai Y. Agricultural Greenhouse Extraction Based on Multi-Scale Feature Fusion and GF-2 Remote Sensing Imagery. Remote Sensing. 2025; 17(12):2061. https://doi.org/10.3390/rs17122061
Chicago/Turabian StyleChang, Yuguang, Xiaoyu Yu, Xu Yang, Zhengchao Chen, Pan Chen, Xuan Yang, and Yongqing Bai. 2025. "Agricultural Greenhouse Extraction Based on Multi-Scale Feature Fusion and GF-2 Remote Sensing Imagery" Remote Sensing 17, no. 12: 2061. https://doi.org/10.3390/rs17122061
APA StyleChang, Y., Yu, X., Yang, X., Chen, Z., Chen, P., Yang, X., & Bai, Y. (2025). Agricultural Greenhouse Extraction Based on Multi-Scale Feature Fusion and GF-2 Remote Sensing Imagery. Remote Sensing, 17(12), 2061. https://doi.org/10.3390/rs17122061