Abstract
Under the context of global warming, extreme precipitation events have become more frequent and intense, causing substantial environmental and societal impacts. Using the daily gridded precipitation dataset (CHM_PRE) for mainland China, this study investigates the spatiotemporal evolution of extreme precipitation events from 1961 to 2022, focusing on regional disparities in frequency, event duration, and total precipitation. Events are further categorized based on peak frequency and the timing of peak intensity to reveal their distinct spatial and temporal characteristics. The results indicate the following: (1) From 1961 to 2022, the frequency of extreme precipitation events across most regions of mainland China exhibited a statistically significant increasing trend, especially in Xinjiang, where the average annual frequency rose by 56 times from 1961–1980 to 2000–2022. (2) Event durations show a general trend, with the most pronounced decline in Southwest China, where the overall duration and the duration above the 90th percentile decreased at Sen’s slopes of −6.4 × 10⁻² and −6 × 10⁻³ days·year−1, respectively. (3) Event intensity has increased, especially in Southeast China, with peak and daily intensities rising at 2.9 × 10⁻² mm·year−1 and 1.9 × 10⁻² mm·day−1·year−1. (4) Short-duration events dominate Xinjiang, averaging 102 times per year and accounting for 35.58% of all events. (5) Events of varying durations display clear spatial differences: 2-day events are most frequent in Xinjiang, the Tibetan Plateau, Northwest China, and Northern China, while 4-day events are concentrated in Southeast China. Moreover, a nonlinear positive correlation between event duration and total precipitation volume suggests a complex interplay between precipitation persistence and intensity.
1. Introduction
Extreme precipitation events can trigger a range of secondary disasters, including farmland waterlogging, urban flooding, and large-scale inundation, which are often highly destructive, difficult to predict, and capable of causing extensive damage [1]. These events pose serious threats to social stability, economic development, and ecological integrity, as well as human life and livelihoods [2,3,4,5]. The Sixth Assessment Report of the Intergovernmental Panel on Climate Change (IPCC, 2021) concludes that global warming has clearly contributed to a significant increase in both the frequency and intensity of extreme precipitation events in many regions [6,7]. China, already among the countries most frequently affected by flooding disasters, has experienced increasingly severe and recurrent floods as a result of intensified extreme precipitation, leading to substantial human and economic losses [8,9,10,11]. For example, in July 2021, north-central China experienced an extreme rainfall event delivering 624 mm of precipitation within 24 h, resulting in 398 fatalities and direct economic losses of RMB 120.06 billion [12]. Similarly, in June 2022, the Pearl River Basin was hit by a severe flood, with cumulative precipitation reaching 357 mm, affecting 6.49 million people and causing direct economic losses of RMB 27.82 billion [13,14].
In response to these severe impacts, considerable research has been dedicated to analyzing the spatiotemporal characteristics of extreme precipitation. The World Meteorological Organization (WMO) and the World Climate Research Programme (WCRP) jointly established the Expert Team on Climate Change Detection and Indices (ETCCDI), which proposed 11 standardized indices to characterize extremes in precipitation intensity, amount, and duration [6,15]. These indices have been widely applied in regional and global studies to reveal patterns and trends in extreme precipitation [16,17]. For instance, Li et al. [18] analyzed global extreme precipitation from 1950 to 2019 using nine ETCCDI indices, while Han et al. [11] employed ten ETCCDI indices to examine spatial trends in China between 1961 and 2021.
However, precipitation in nature typically unfolds as a continuous process, encompassing initiation, development, and dissipation stages [19]. Although ETCCDI indices offer a simplified means to capture the intensity and frequency of extremes, they often treat fixed time windows as single events and thus overlook the temporal continuity and structure of precipitation processes [15,19,20], which impedes a full understanding of independent precipitation events. To address this shortcoming, recent studies have proposed defining extreme precipitation events based on event continuity, commonly by applying an extreme precipitation threshold (EPT) to identify consecutive days of threshold exceedance [21,22,23]. EPTs can be absolute using fixed precipitation values or relative based on statistical percentiles to reflect spatial variability. For instance, thresholds such as the 95th [24,25], 97.5th [26], and 99th percentiles [27] have been used to define extreme events. Hong et al. [23] employed an absolute threshold of 25 mm/day over at least three days, while Deng et al. [22] used a relative threshold exceeding the 95th percentile for at least one day. In addition, the 90th percentile is also widely used to define extreme precipitation events [28,29,30]. This threshold strikes a good balance between the “sufficiently high” critical value required for defining extreme events and the need for a sufficient number of threshold-exceeding samples [31]. Considering the sample size issue, this study, building on existing research, also adopts the 90th percentile as the threshold for extreme precipitation. Although effective in capturing event continuity, these definitions often neglect the influence of preceding and subsequent rainfall periods that may contribute significantly to the hydrological impact of an event [21]. For example, antecedent precipitation may increase soil moisture, thereby amplifying the runoff response to subsequent rainfall [32], while the cumulative effects of later precipitation may trigger extreme hydrological events, such as flooding [33].
Extended periods of moderate rainfall that fall below traditional extreme thresholds can still result in severe flooding and damage, especially when occurring before or after peak intensity [34]. Therefore, a more comprehensive definition of extreme precipitation events should encompass the full development process, including near-threshold rainfall [28,29,35,36,37]. For example, Shang et al. [28] and Guo et al. [38] defined extreme events as sustained precipitation processes exceeding the 90th percentile, capturing more of the event duration than traditional threshold-only methods. Wu et al. [35] further classified extreme precipitation events into frontal, post-frontal, and bimodal types based on the temporal distribution of peak rainfall within events, though this method does not fully address the frequency of peak intensities. For instance, extreme precipitation events often involve the occurrence of intense rainfall over short periods, which may lead to more severe impacts.
Mainland China is highly susceptible to extreme precipitation, with substantial spatial heterogeneity in event characteristics [10,39]. Since 1961, precipitation in China has shown a trend of overall increase with intensifying extremes [11]. Southeastern coastal regions have experienced significant rises in annual total precipitation, event intensity, and frequency [40,41]. In the arid and semi-arid northwest, sudden extreme events have become more frequent [42,43,44]. In contrast, Southwest China has witnessed shorter event durations but increased intensity [45], while North China has seen sharp increases in extreme hourly precipitation [46]. The Tibetan Plateau has also experienced increases in total and extreme precipitation [47]. These regional disparities underscore the need for detailed and spatially explicit analyses of extreme precipitation characteristics and their trends across China and its sub-regions [48]. Nevertheless, most existing studies either rely solely on ETCCDI or fail to comprehensively consider the full lifecycle, structural evolution, and classification of precipitation events.
To fill this gap, the present study defines extreme precipitation events using the CHM_PRE gridded dataset, with full consideration of event development processes. A classification framework is applied to group events into seven distinct types, enabling a comprehensive assessment of event characteristics, spatial patterns, and duration-dependent regional variations across mainland China from 1961 to 2022. This study aims to achieve the following three objectives: (1) Identifying and defining extreme precipitation events across mainland China based on run theory, quantifying their key characteristic variables, and systematically analyzing their spatiotemporal evolution and regional disparities from 1961 to 2022. (2) Classifying extreme precipitation events according to their temporal evolution processes, identifying typical event types such as unimodal and multimodal patterns, and examining their spatial distribution characteristics and spatiotemporal variation across different regions. (3) Investigating regional differences in extreme precipitation events with varying durations, and further analyzing the relationship between event duration and total precipitation through curve fitting, thereby revealing the correlation between event persistence and precipitation amount. To address these objectives, the remainder of this paper is structured as follows: Section 2 introduces the study area, data sources, and methodological framework. Section 3 presents the results, including the spatiotemporal evolution of extreme precipitation characteristics, classification-based analysis of event types, and duration-related regional differences. Section 4 offers a discussion of the key findings, and Section 5 concludes with a summary of the major outcomes.
2. Materials and Methods
2.1. Study Area
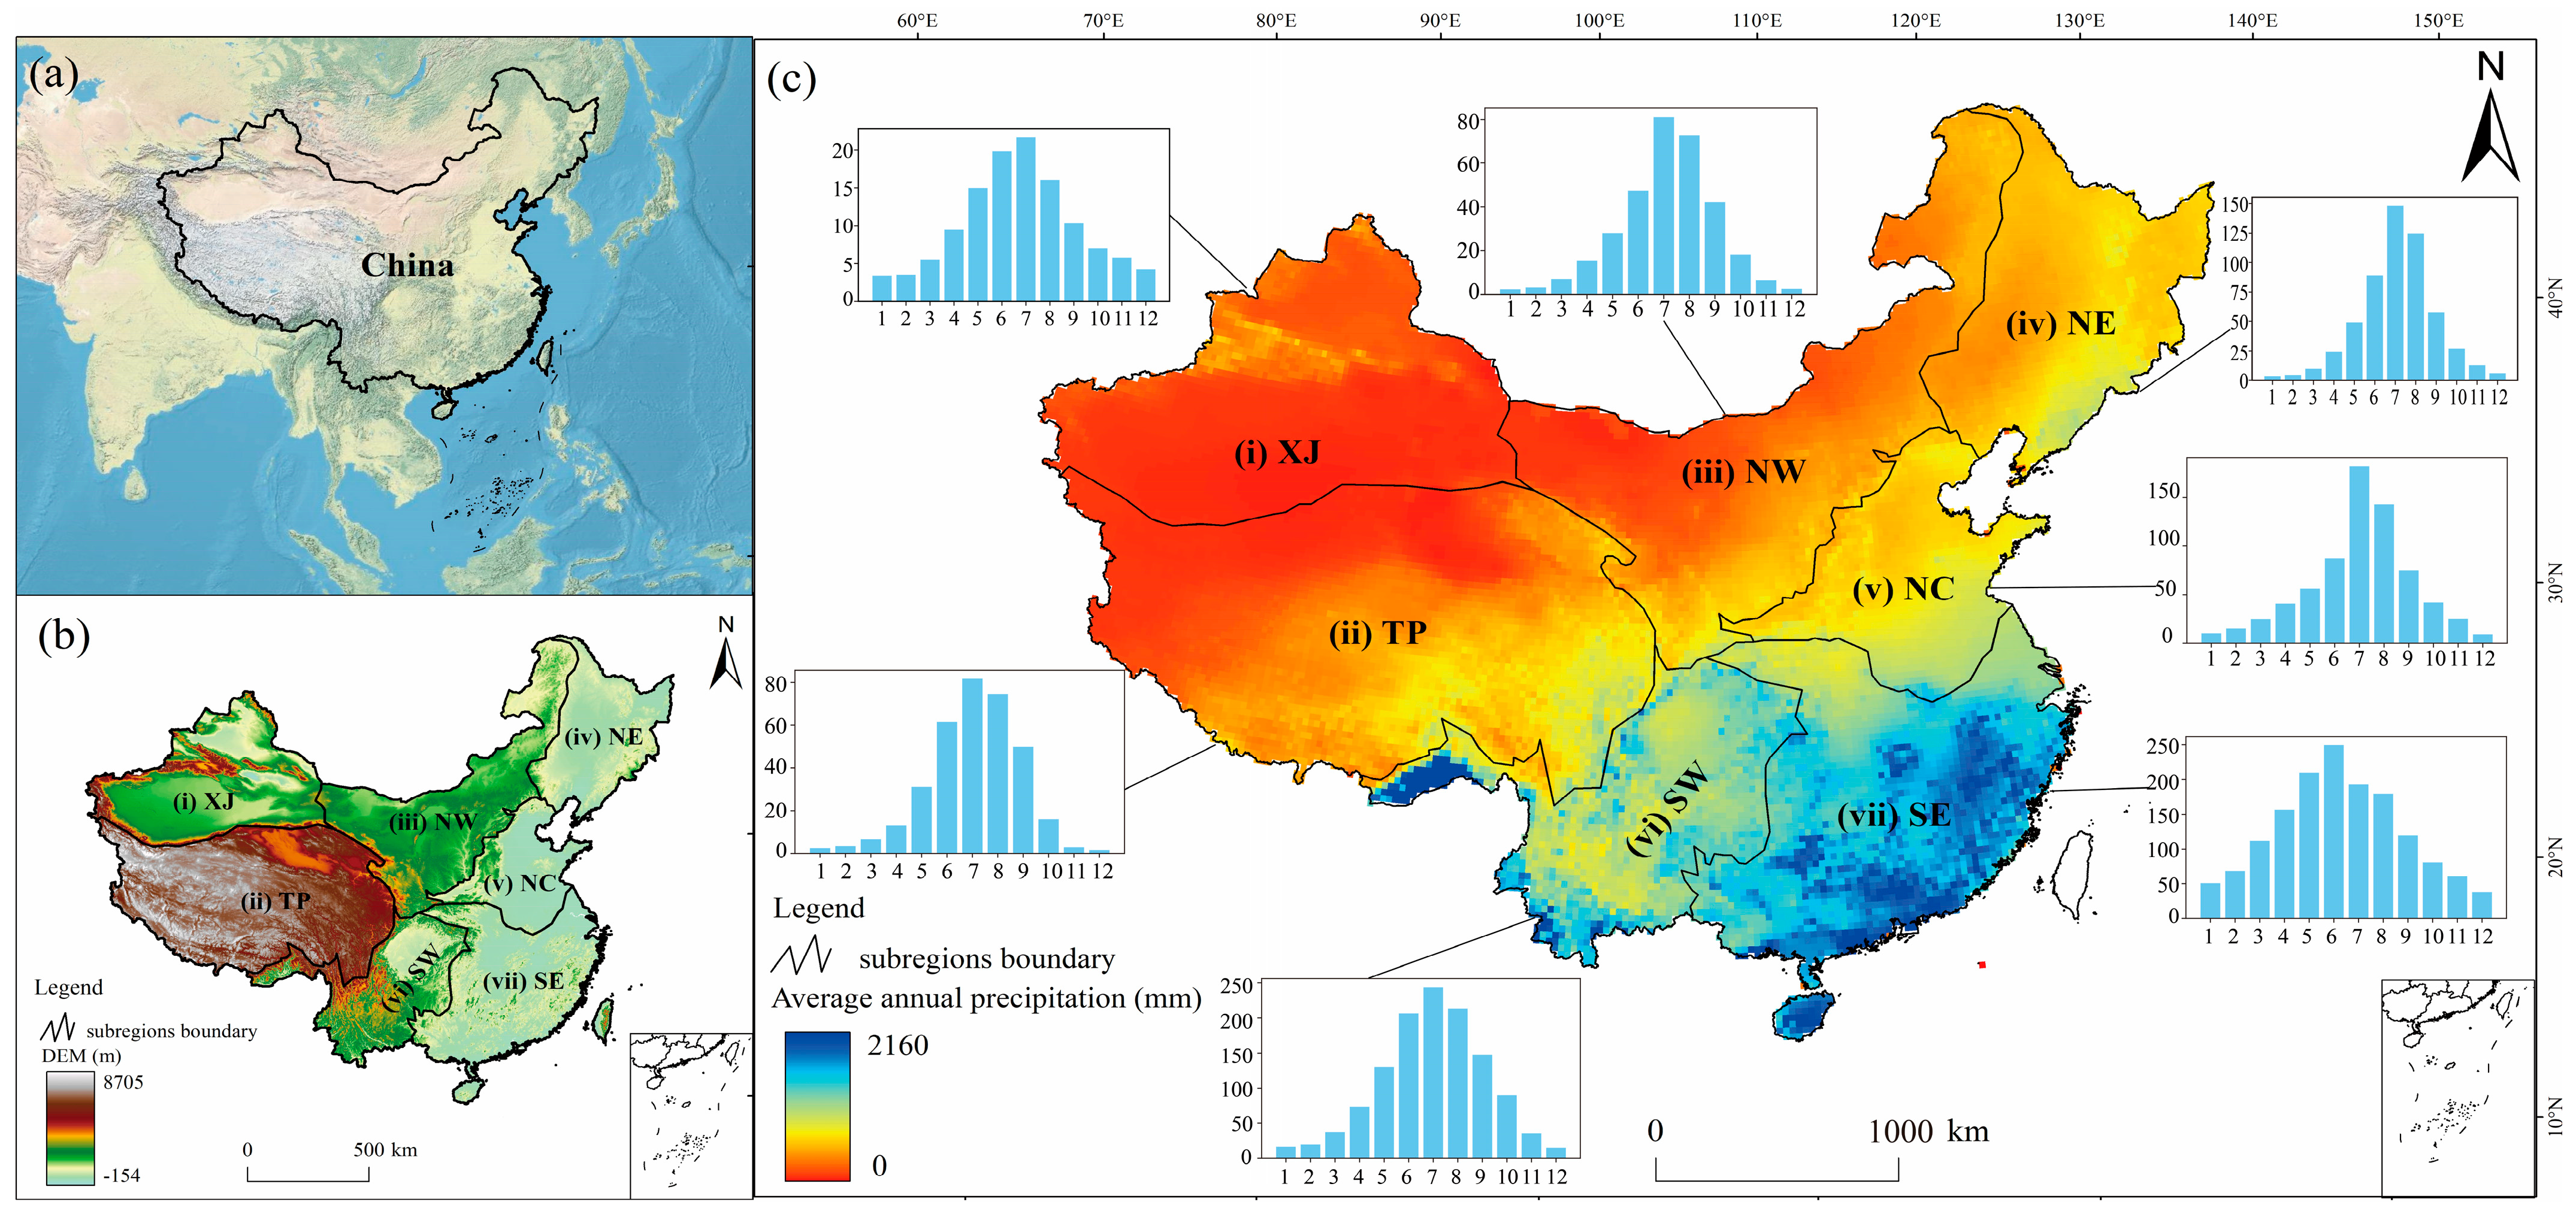
Mainland China is located in the eastern part of Asia (73°33′E–135°05′E, 3°51′N–53°33′N), characterized by diverse climate types and pronounced regional variability in precipitation patterns (Figure 1a,b). Drawing on a previous study [49], this research comprehensively considers factors such topography, mountain systems, and the distribution of long-term average precipitation to divide mainland China into seven distinct sub-regions (Figure 1). These include (I) Xinjiang (XJ), (II) Qinghai-Tibetan Plateau (TP), (III) Northwest China (NW), (IV) Northeast China (NE), (V) North China (NC), (VI) Southwest China (SW), and (VII) Southeast China (SE). Overall, precipitation in China decreases gradually from the southeastern coastal areas toward the northwest inland areas [39,50,51], with rainfall concentrated in the summer months; however, significant regional differences in precipitation exist. For instance, the average monthly precipitation in July in the SE can reach 148 mm, while in XJ, it is only 21 mm (Figure 1c).

Figure 1.
(a) Geographic location of China. (b) Digital elevation model (DEM) of China. (c) Distribution map of long-term average annual precipitation in mainland China from 1961 to 2022. Panel (c) also shows bar chart of monthly average precipitation (mm).
2.2. Dataset
This study employs the daily grid precipitation dataset for mainland China (CHM_PRE) with a resolution of 0.25° and a temporal coverage from 1961 to 2022. The dataset, available from the National Tibetan Plateau Data Center (https://cstr.cn/18406.11.Atmos.tpdc.300523) (accessed on 14 October 2024), was developed by Han et al. [52] based on daily precipitation observations from 2839 meteorological stations across mainland China. The interpolation method was carefully selected to balance the accuracy of precipitation estimates in complex terrain with computational efficiency. The dataset adopts the classical “precipitation background field + precipitation ratio field” framework and integrates monthly precipitation constraints along with terrain correction techniques to enhance interpolation precision. Validation against 45,992 high-density stations yielded a median correlation coefficient of 0.78, a root mean square error of 8.8 mm/day, and a Kling–Gupta efficiency coefficient of 0.69. Compared with widely used products such as China Gauge-Based Daily Precipitation Analysis (CGDPA) [53] and daily 10 m wind speed observation dataset over China (CN05.1) [54], CHM_PRE exhibits improved consistency in capturing spatial precipitation variability and detecting extreme events, and has been recognized as a reliable dataset. It has been widely applied in a range of recent studies [55,56].
The justifications for dataset selection are as follows: (1) The CHM_PRE dataset provides full spatial coverage of mainland China. (2) As this study focuses on the processes of extreme precipitation events, a long-term time series is essential to ensure sufficient sample size for robust analysis. The CHM_PRE dataset spans over 60 years, making it particularly suitable for this purpose. (3) This dataset is constructed from daily precipitation observations at 2839 meteorological stations across mainland China from 1961 to 2022. It also incorporates extensive station data for bias correction, resulting in high data quality.
2.3. Methods
2.3.1. Definition and Characteristics of Extreme Precipitation Events
- (1)
- Definition of Extreme Precipitation Event (EPE)
EPEs were identified at the pixel scale using a dynamic thresholding framework that incorporates three key criteria: (1) a minimum precipitation threshold (Lim_Valid), (2) a minimum event duration threshold (LimD), (3) an extreme precipitation intensity threshold defined by the 90th percentile (P90) of the daily precipitation distribution. P90 was calculated by ranking all valid daily precipitation values at each grid point throughout the entire study period and identifying the 90th percentile.
A precipitation event was defined as a sequence of consecutive wet days with daily precipitation ≥ Lim_Valid (0.1 mm in this study). An event was classified as an EPE if it met both of the following criteria: (1) the duration of the event was equal to or greater than LimD (set as 1 day in this study), (2) at least one day within the event recorded precipitation exceeding P90. Within each EPE, the portion of precipitation exceeding the P90 was designated as the extreme exceedance component (EPEExt).
To address the potential fragmentation of events caused by short dry intervals, any two precipitation events separated by a minimum inter-event time (MIT) of one day or less were merged into a single, continuous event. This merging rule enhances the continuity and accuracy in representing closely spaced extreme precipitation processes.
- (2)
- Characteristics of EPEs
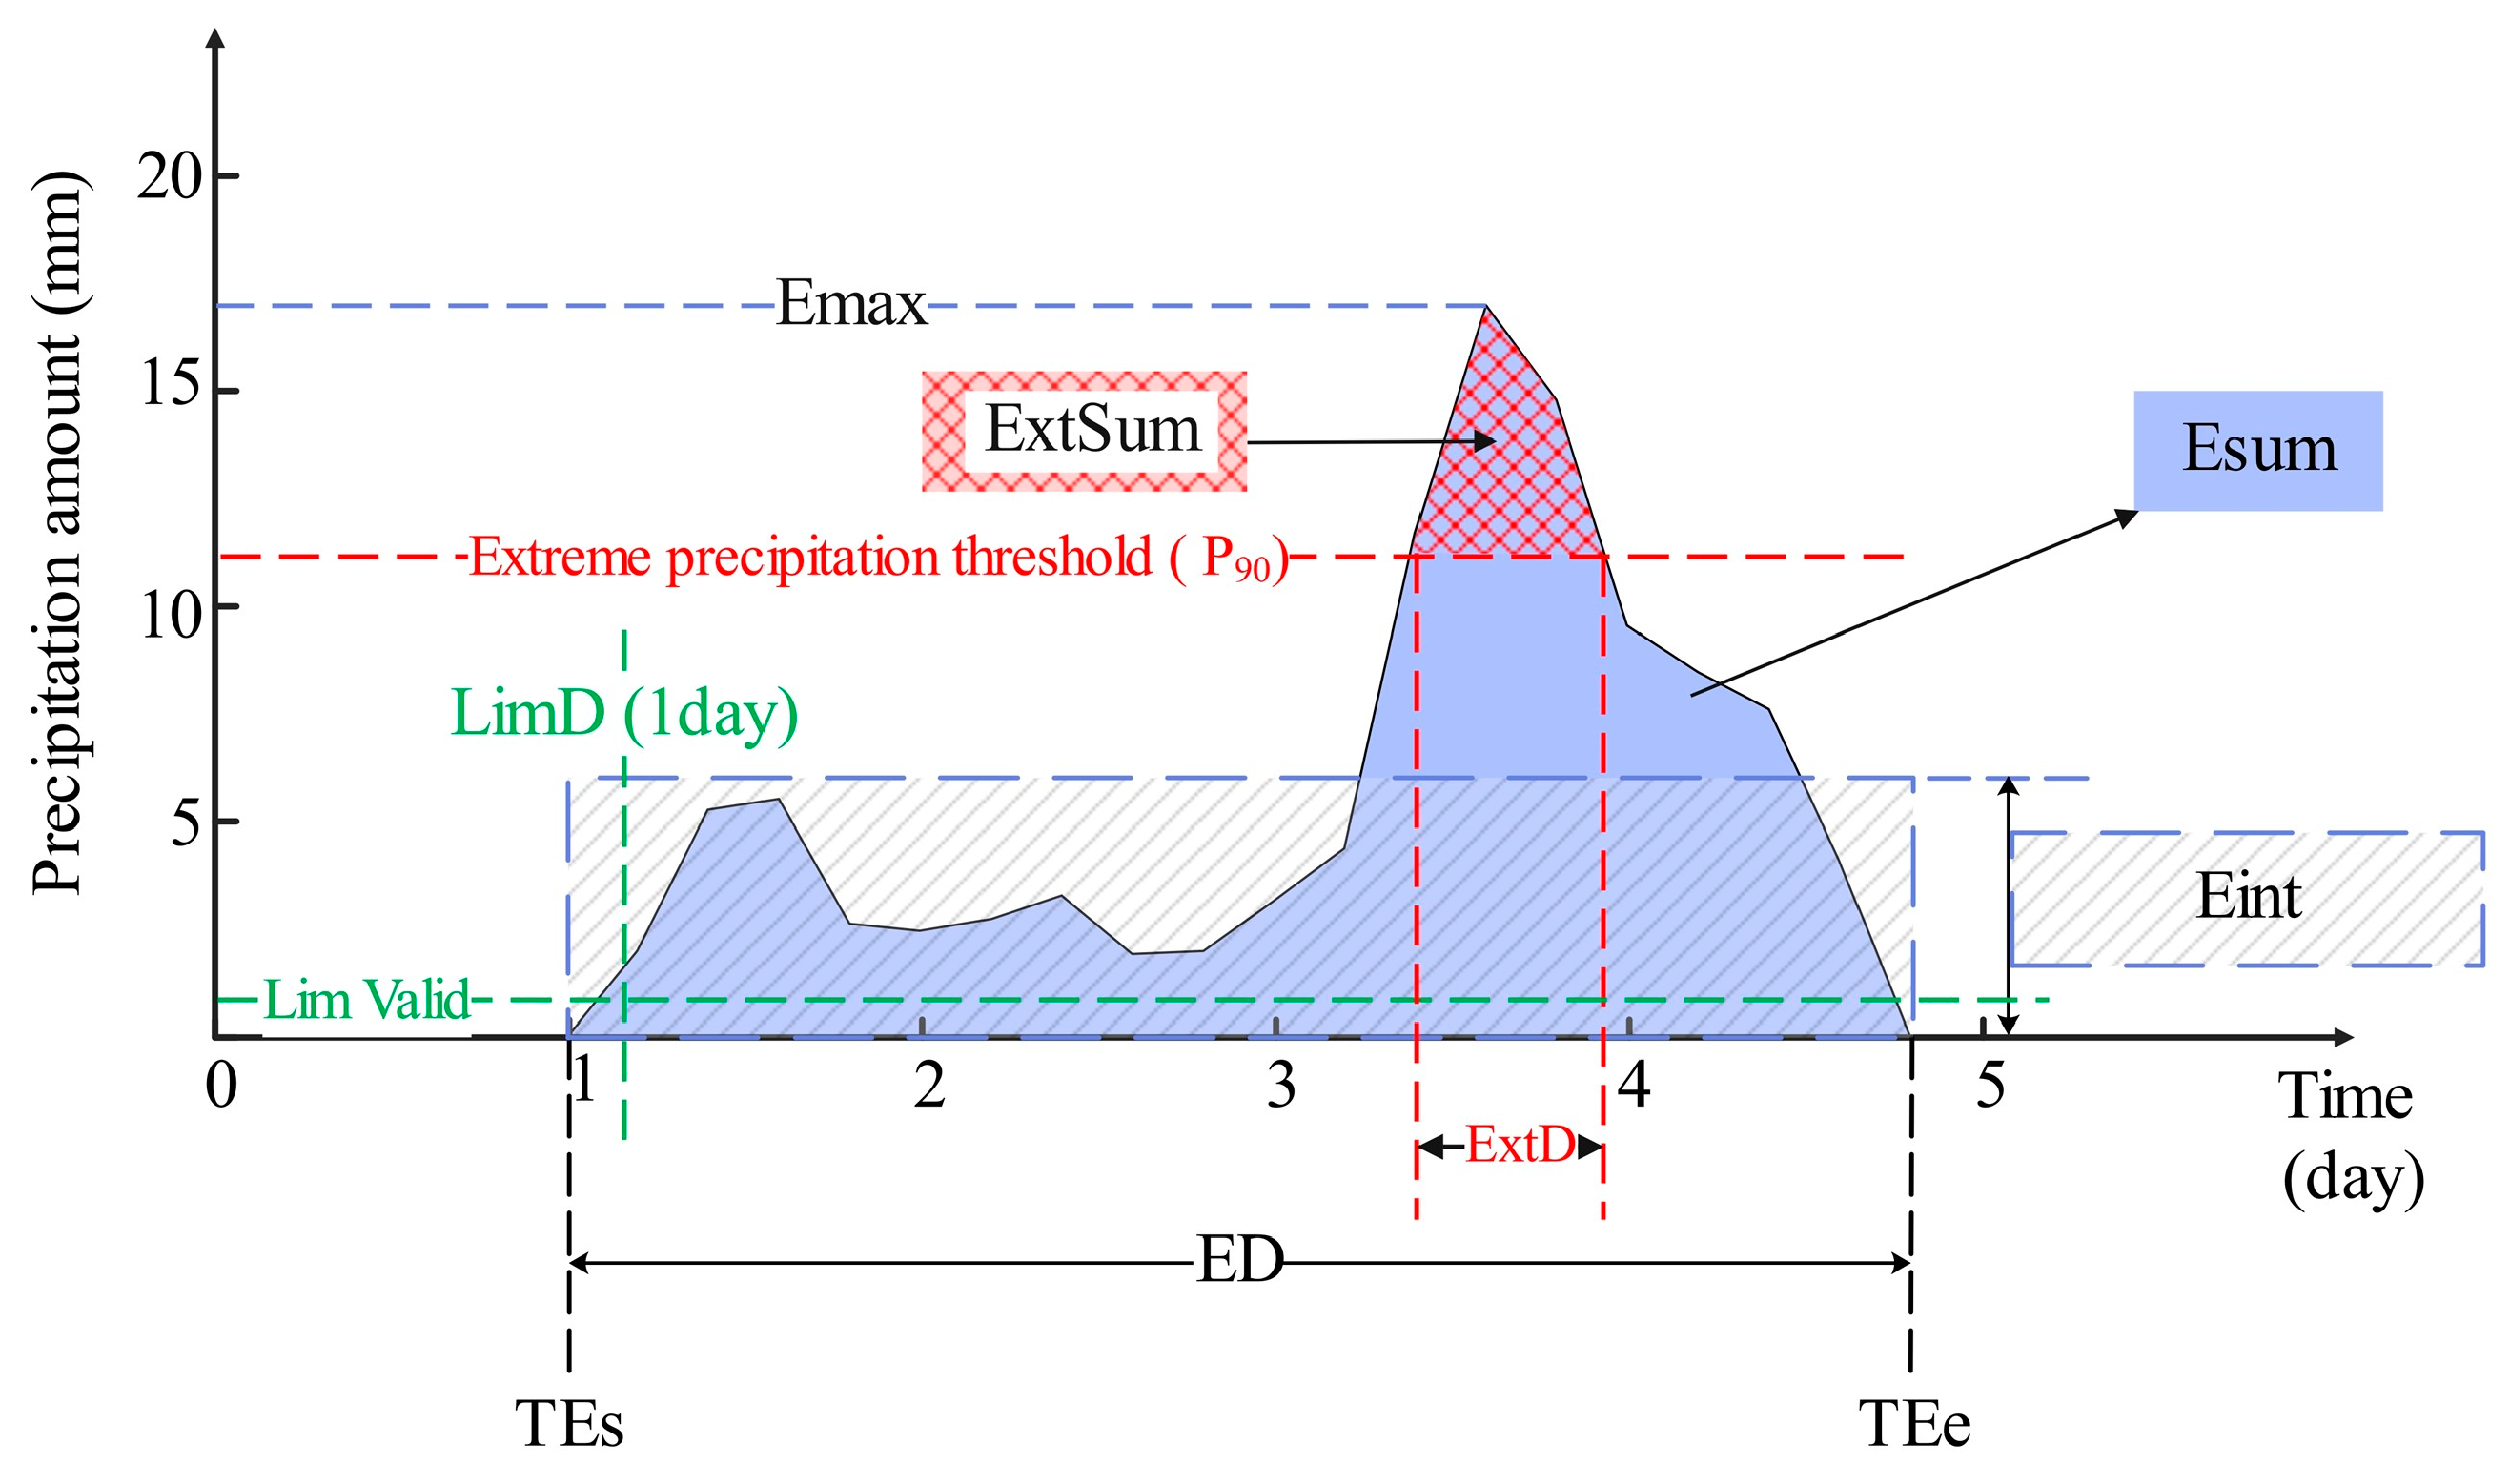
Once an EPE is identified, it is characterized using four characteristics (Figure 2): event duration (ED), total precipitation (Esum), peak precipitation (Emax), and mean intensity (Eint). Specifically, ED refers to the number of days from the event start (TEs) to the end time (TEe). Esum represents the cumulative precipitation over the entire duration of the event. Emax denotes the maximum daily precipitation within the event. Eint is the average precipitation intensity, calculated as Esum divided by ED.
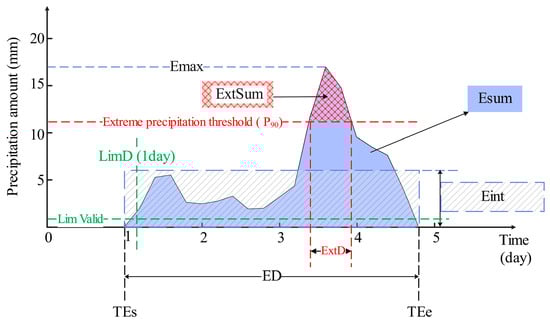
Figure 2.
A schematic diagram of extreme precipitation event and its features. TEs denotes the event start time, TEe the end time, Lim_Valid is the minimum precipitation threshold which is marked as the bottom green dashed line, and LimD the minimum event duration which is marked as the vertical green dashed line. ED represents event duration, Esum is the total precipitation marked as blue area, Emax the maximum daily precipitation which is marked as blue dash line, and Eint the average intensity of the event marked by a blue dashed box with gray shading. ExtD refers to the duration of the exceedance portion above the threshold, and ExtSum is the total precipitation during this exceedance period marked as the red grid area.
In addition to overall event characteristics, this study also quantifies the exceedance portion of each event defined as the period during which daily precipitation exceeds the P90. The exceedance characteristics include exceedance duration (ExtD), exceedance total precipitation (ExtSum), and exceedance intensity (ExtInt). ExtD is the number of consecutive days during which precipitation remains above the P90. ExtSum is the cumulative precipitation during ExtD and ExtInt is its average intensity, computed as ExtSum divided by ExtD.
EF refers to the frequency of EPEs at each pixel. To facilitate analysis and presentation of results, this study computes the arithmetic mean of key EPEs characteristics for each pixel. These include average event duration (MED, (Equation (1)), average total precipitation (MEsum, (Equation (2))), average peak precipitation (MEmax, (Equation (3))), and average precipitation intensity (MEint, (Equation (4))). Similarly, for the exceedance portion of the EPE, the following mean values are computed: mean exceedance duration (MExtD, (Equation (5))), mean exceedance total precipitation (MExtSum, (Equation (6))), and mean exceedance intensity (MExtInt, (Equation (7))).
In the above equations, ED denotes the duration of an EPE, i represents the number of occurrences of EPEs, t refers to the number of days on which EPEs occur, y indicates the number of EPEExts, Ext is the number of days the exceedance portion lasts, P stands for the precipitation amount, N represents the total number of EPEs observed during the study period, and M refers to the number of exceedance portions of EPEs observed during the study period.
- (3)
- Types of EPEs
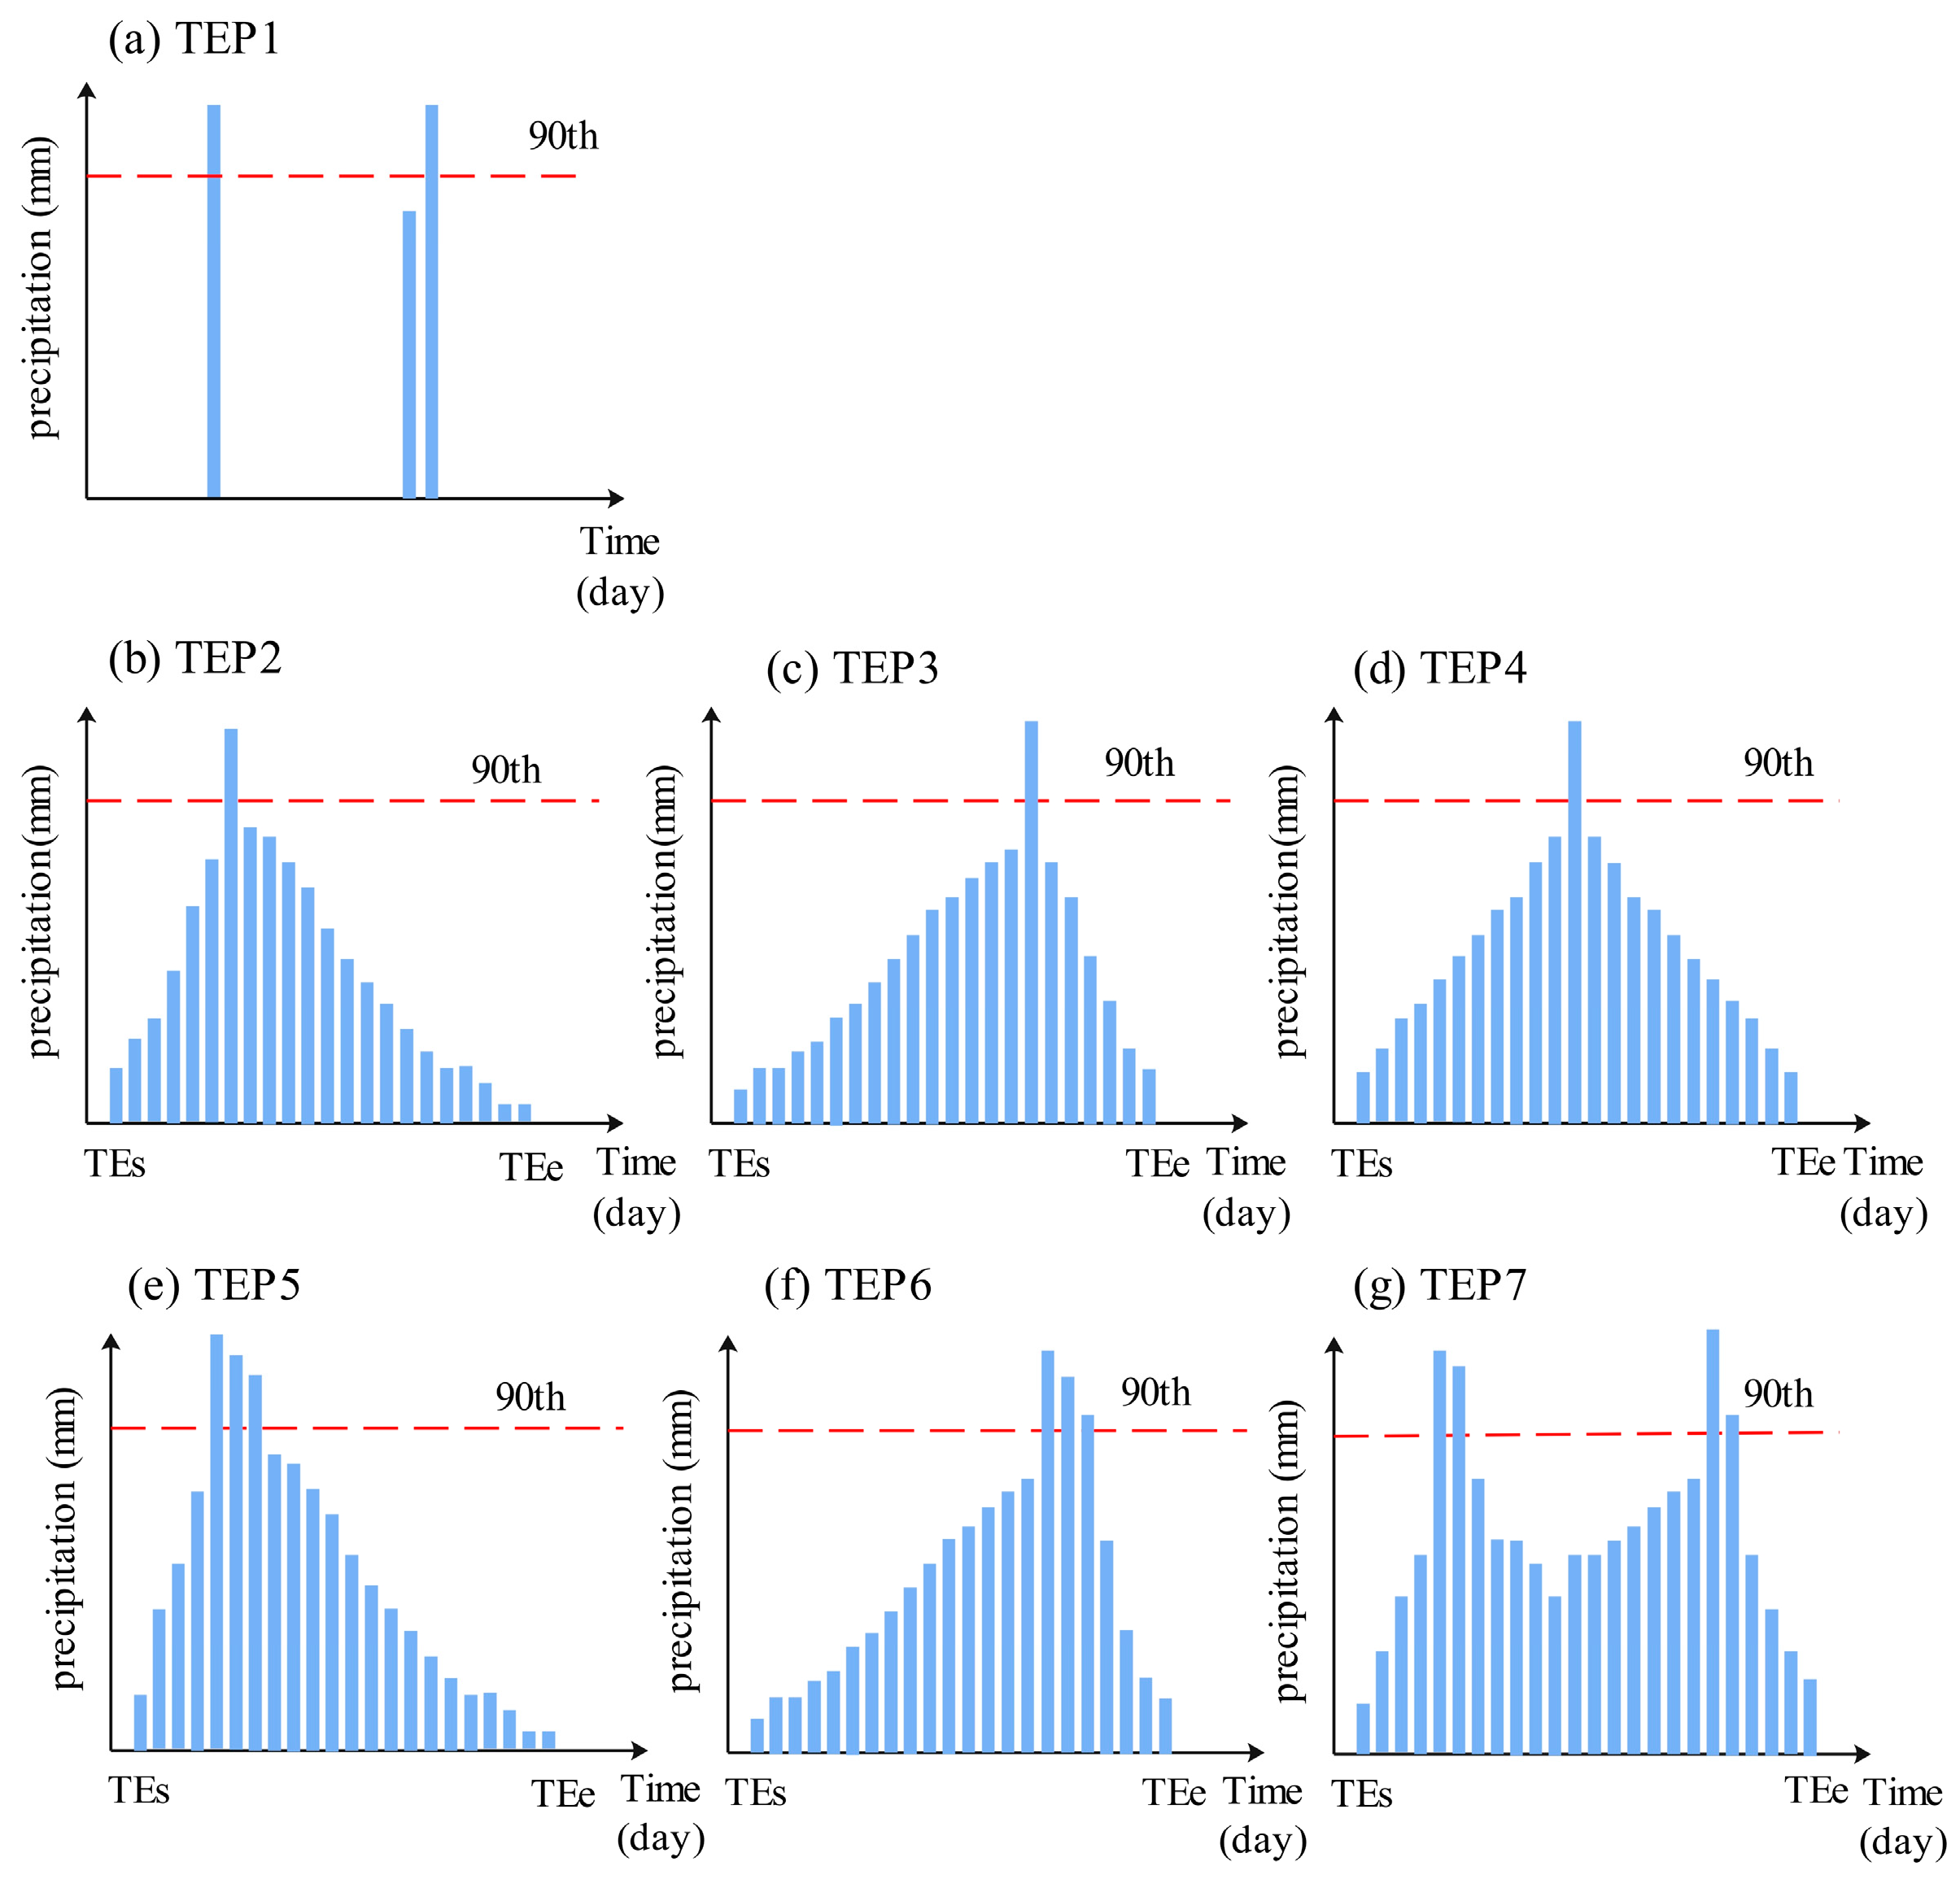
EPEs are further categorized into seven distinct types based on ED, the number of EPEExts, and the temporal positioning of these exceedance days within the event, as illustrated in Figure 3. The first category includes short-duration EPEs (TEP1), which last fewer than 3 days, encompassing both 1-day and 2-day events. Among longer events, three single-peak types are defined based on when the exceedance portion occurs: single-peak left (TEP2) refers to events where EPEExts are concentrated in the early stage, typically indicating rapid onset and a lack of extreme precipitation in the latter stages; single-peak right (TEP3) captures events with EPEExts in the later stage, reflecting a slow build-up of precipitation followed by a sharp increase and subsequent decline; and single-peak mid (TEP4) refers to events in which exceedance occurs centrally, usually preceded by steady accumulation and followed by a notable reduction in rainfall. Multi-peak events are further divided into multi-peak left (TEP5), where multiple exceedance days occur early in the event, and multi-peak right (TEP6), characterized by multiple exceedance days in the latter part of the event, often following substantial early-stage accumulation. Finally, the double-peak type (TEP7) includes events with multiple exceedance days occurring in both the early and later phases, suggesting complex dynamics with sustained periods of intense precipitation.
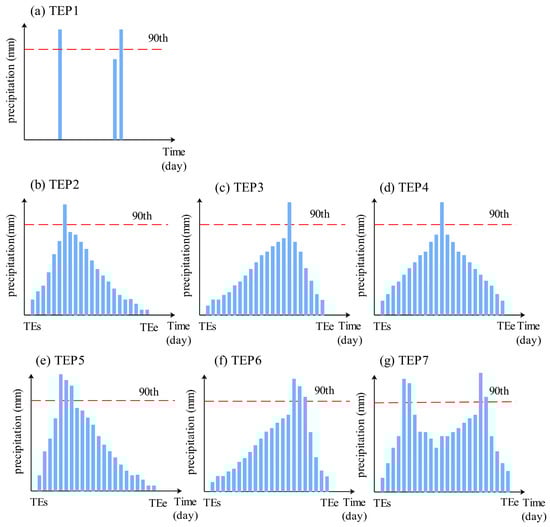
Figure 3.
EPEs types.
2.3.2. Sen’s Slope and Mann–Kendall Trend Analysis
This study employs the non-parametric trend estimator (Theil–Sen) and Mann–Kendall (MK) method to analyze the change trends and significance of EPE characteristics. Sen’s Slope Estimator is a non-parametric statistical method used to quantify the magnitude of monotonic trends in time series data [57]. This method imposes no specific requirements on the data distribution, making it robust against outliers, and is particularly suitable for analyzing long-term time series data in fields such as environmental science, hydrology, and meteorology. The specific formula is as follows:
In Equation (8), represents the slope, and and refer to the time series indices. and are the observed values at times and , respectively. When > 0, it indicates an increasing trend, whereas when < 0, it signifies a decreasing trend.
Mann–Kendall (MK) trend analysis is a non-parametric statistical test widely used for long-term trend analysis in fields such as climate change and hydrology. It effectively identifies monotonic increasing or decreasing trends in data sequences. For further details, refer to [58,59].
2.3.3. Correlation Analysis
The correlation between the characteristic variables ED and Esum of EPEs was analyzed in this study to reveal the relationship between the two. Polynomial, power, and exponential functions were used to fit the data, with the most appropriate function chosen to describe the correlation between ED and Esum. Polynomial functions can effectively capture the nonlinear relationships in the data, power functions are suitable for describing proportional relationships between variables, and exponential functions are well-suited to reveal growth or decay trends in the data. During the fitting process, parameters were adjusted to ensure that the fitting curve best reflects the relationship between ED and Esum. The goodness of fit (R2) was used to evaluate the reliability of the fitting results.
3. Results
3.1. The Temporal Evolution Trend of the Characteristic Variables of EPEs
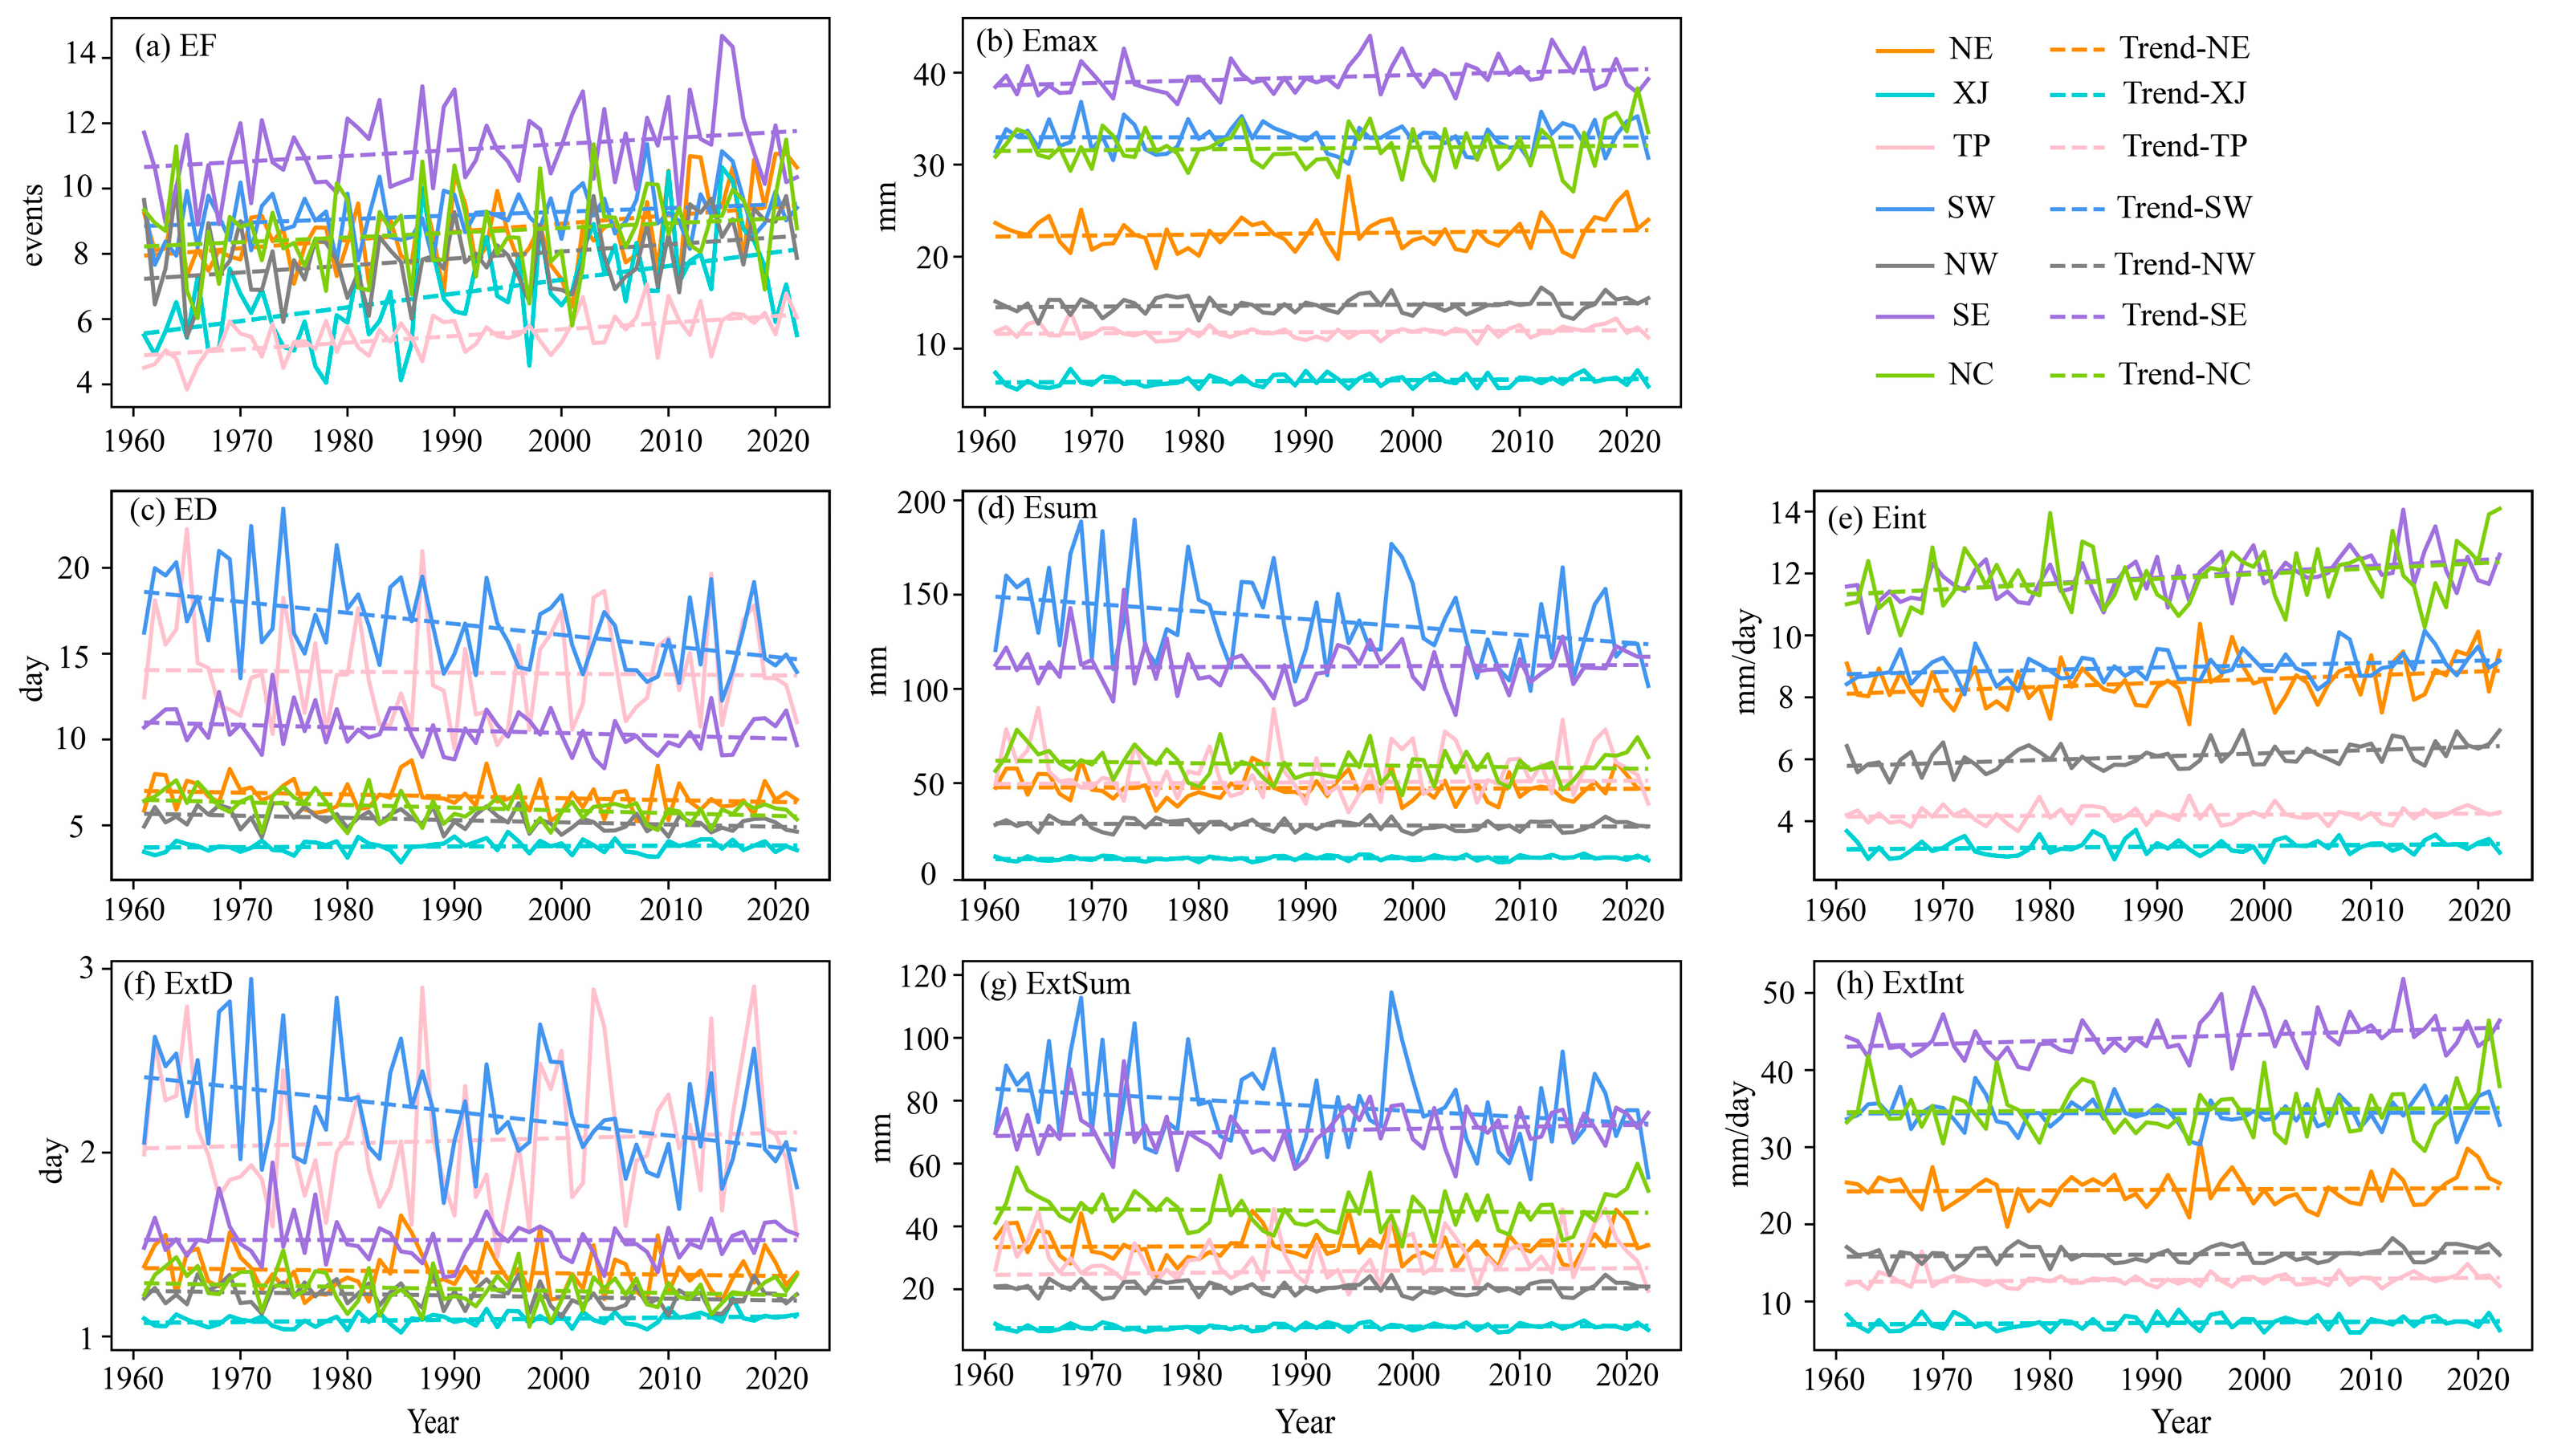
Analyzing the temporal evolution trends of EPE characteristic variables is crucial for understanding the dynamics of extreme precipitation under changing climatic conditions. As illustrated in Figure 4, EF exhibits a generally increasing trend across all sub-regions, with particularly notable growth in XJ. Where Sen’s slope reaches 4.2 × 10⁻² events·year−1, NC shows a weaker and statistically insignificant increase (1.4 × 10⁻² events·year−1). Emax reveals an overall slight upward trend, with the SE experiencing the most pronounced increase (2.9 × 10⁻² events·year−1), in contrast to a marginal decline in the SW (−7 × 10⁻⁴ events·year−1). ED generally shows a decreasing trend, particularly in SW, which exhibits the steepest decline at −6.4 × 10⁻² day·year−1. Other regions such as the NE, TP, and SE also display decreasing trends, albeit less significant, while XJ is the only region showing a slight and insignificant increase (2 × 10⁻³ day·year−1). Esum varies notably across regions, with insignificant increases observed in XJ, TP, and SE (1.5 × 10⁻², 2.9 × 10⁻², and 2.6 × 10⁻² mm·year−1, respectively), whereas NE, SW, NW, and NC experience decreasing trends, with the most substantial decline occurring in SW (−4.13 × 10⁻¹ mm·year−1). Eint exhibits an increasing trend in all regions, with eastern areas showing more rapid intensification than western counterparts; SE shows the strongest increase (1.9 × 10⁻² mm·day−1·year−1), while XJ and TP display smaller, non-significant increases (3 × 10⁻³ and 2 × 10⁻³ mm·day−1·year−1, respectively). These trends largely align with those of EPEExts, although some variables exhibit opposite trends in certain regions. For instance, in NE, Esum decreases (−1.3 × 10⁻² mm·year−1) while ExtSum increases (1.4 × 10⁻² mm·year−1); similarly, in TP, ED and ExtD show divergent trends (−5 × 10⁻³ and 1 × 10⁻³ day·year−1, respectively). Overall, the extremity of EPEs, as characterized by Emax and Eint, is increasing, with more rapid intensification observed in the eastern regions. Except for SW, Emax shows an upward trend nationwide, and both Eint and ExtInt exhibit rising trends as well, with SE again leading in magnitude (Sen’s slopes of 2.9 × 10⁻² mm·year−1, 1.9 × 10⁻² mm·day−1·year−1, and 4.1 × 10⁻² mm·day−1·year−1, respectively).
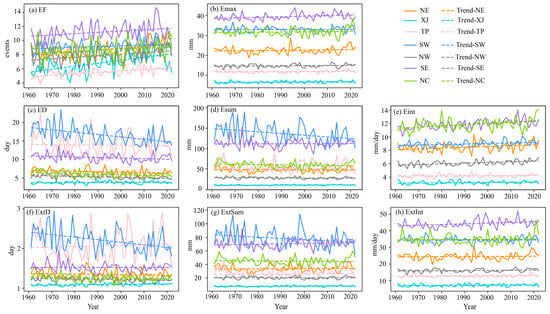
Figure 4.
Time series line plots of the characteristic variables of EPEs in seven sub-regions of mainland China from 1961 to 2022, along with Sen’s slope trend lines.
3.2. The Evolution of the Spatial Pattern of EPE Characteristics
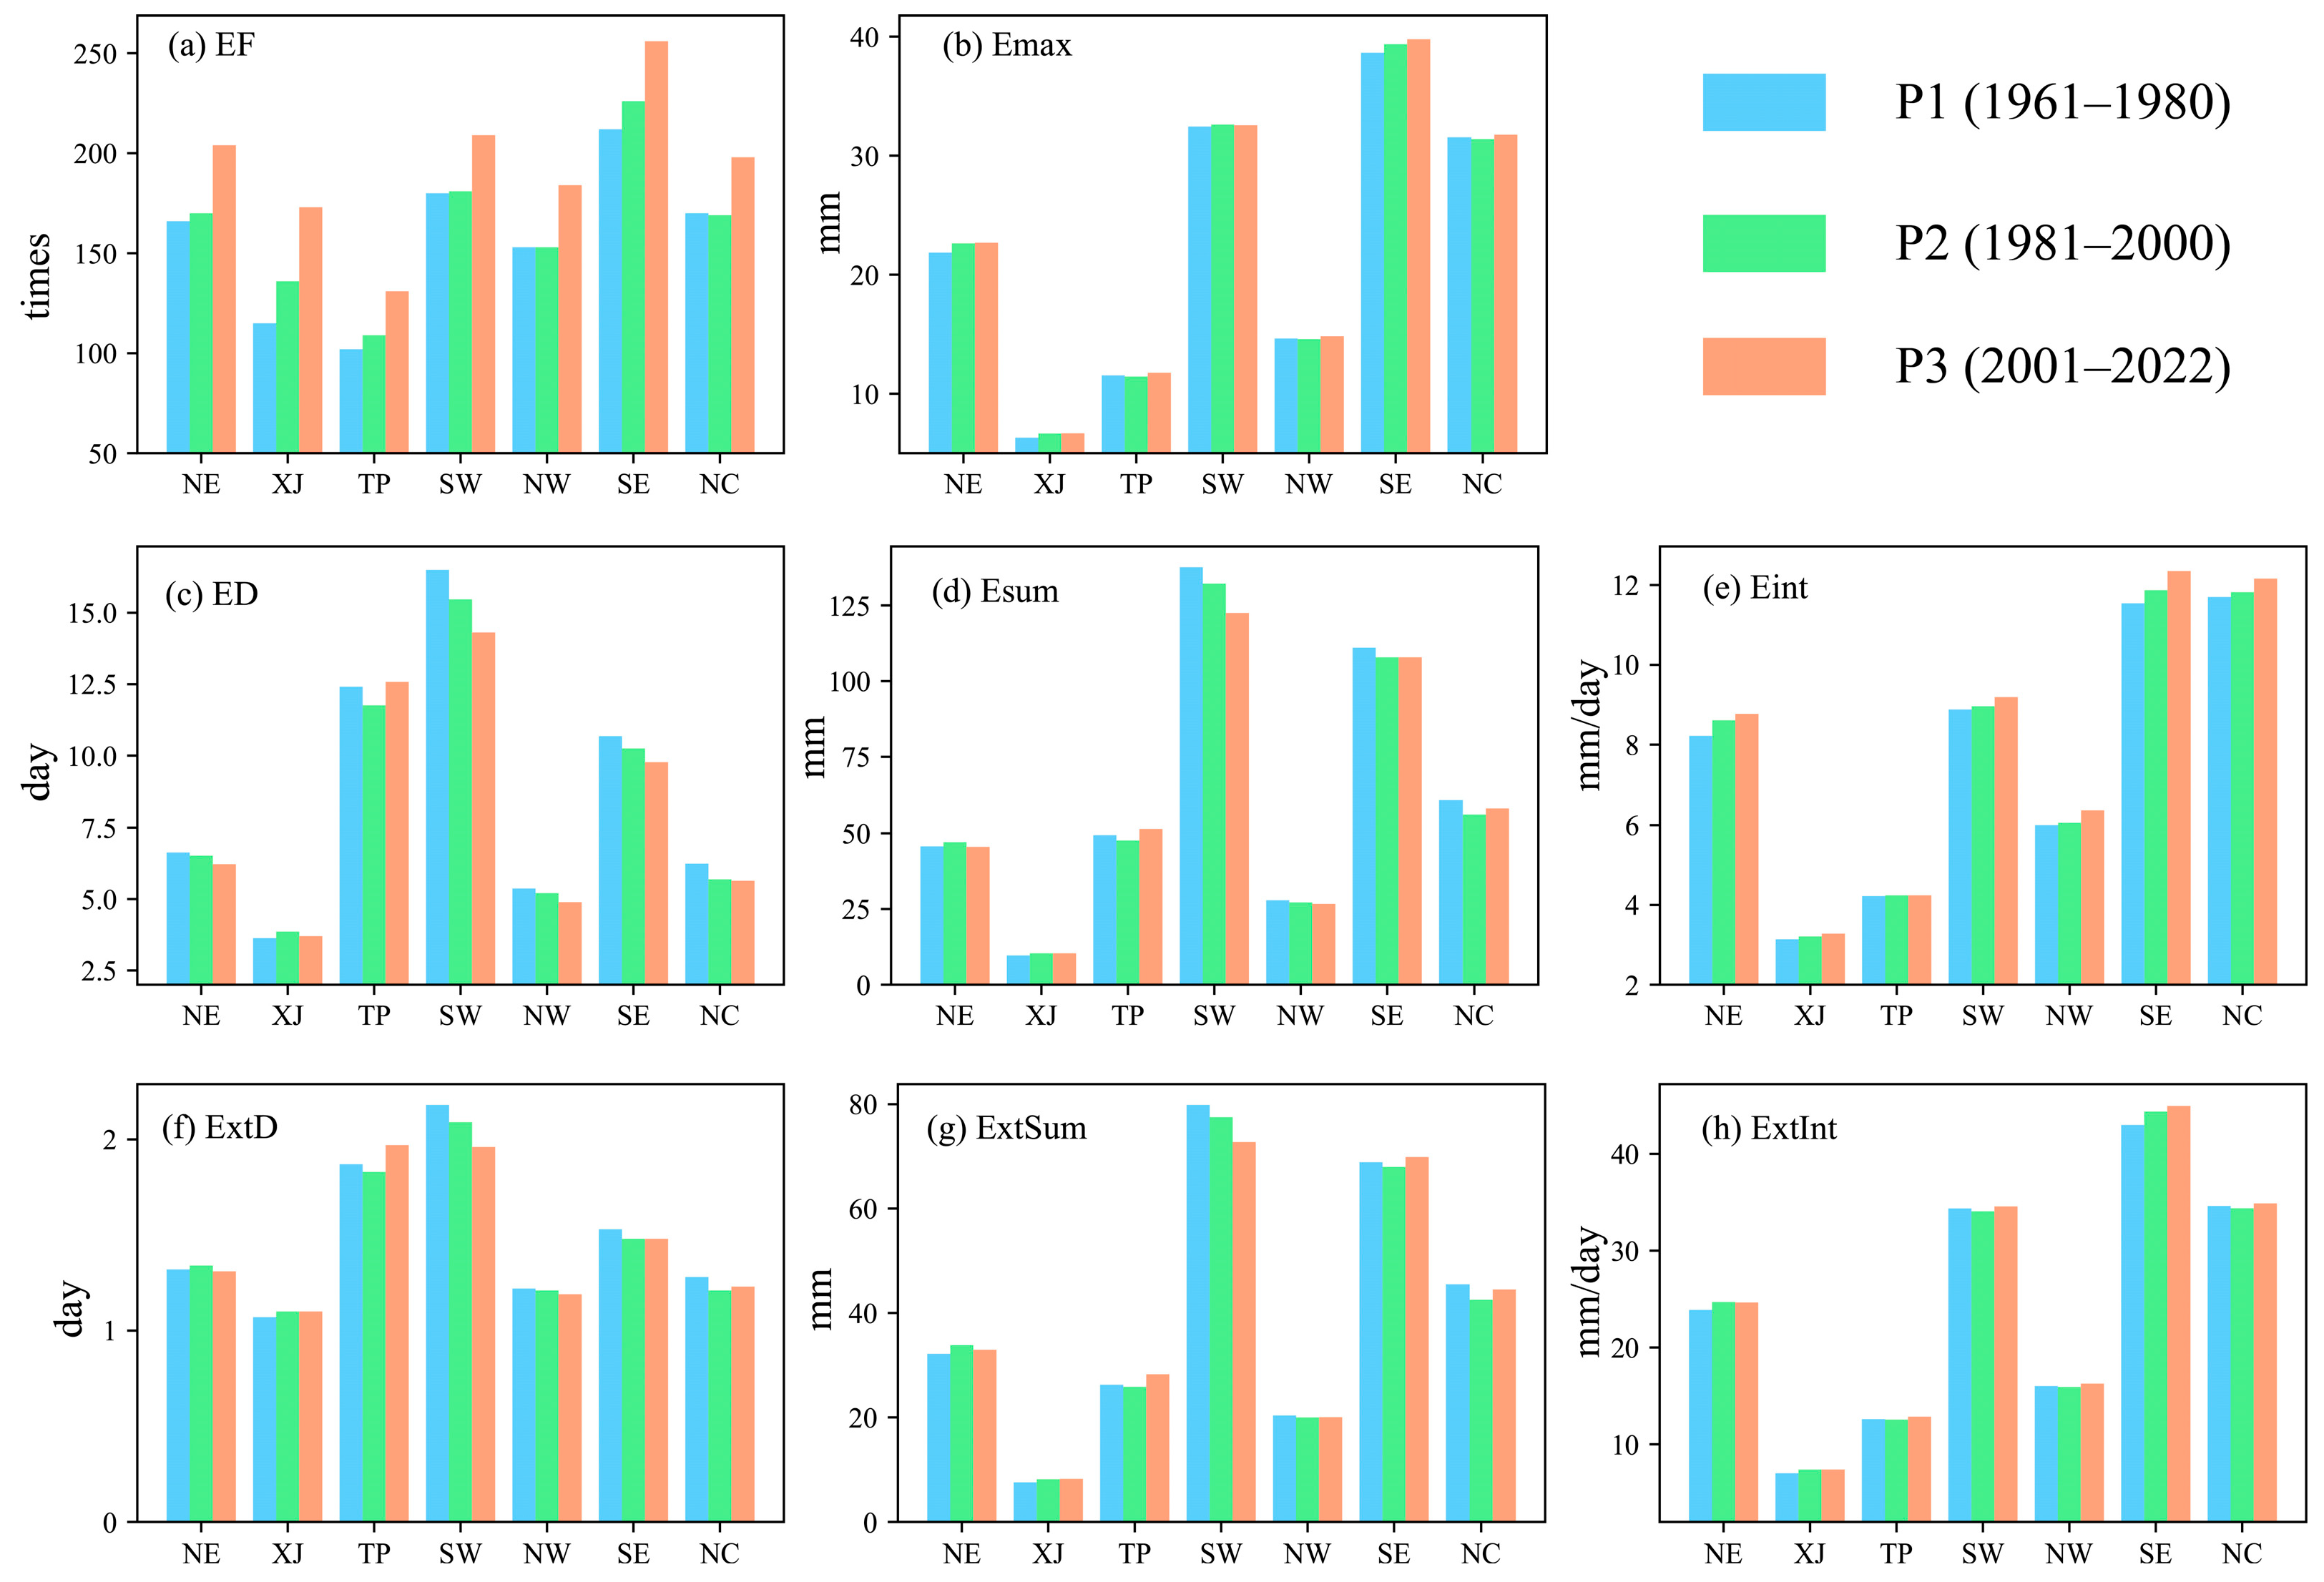
To more clearly reveal the spatial evolution patterns of EPEs, the study period was divided into three stages at 20-year intervals: P1 (1961–1980), P2 (1981–2000), and P3 (2001–2022). Based on this segmentation, regional average values of the EPE characteristic variables were calculated for seven sub-regions in each stage (Appendix B, Figure A2), and spatial difference maps were produced to illustrate the temporal and spatial evolution (Figure 5). The results indicate the following:

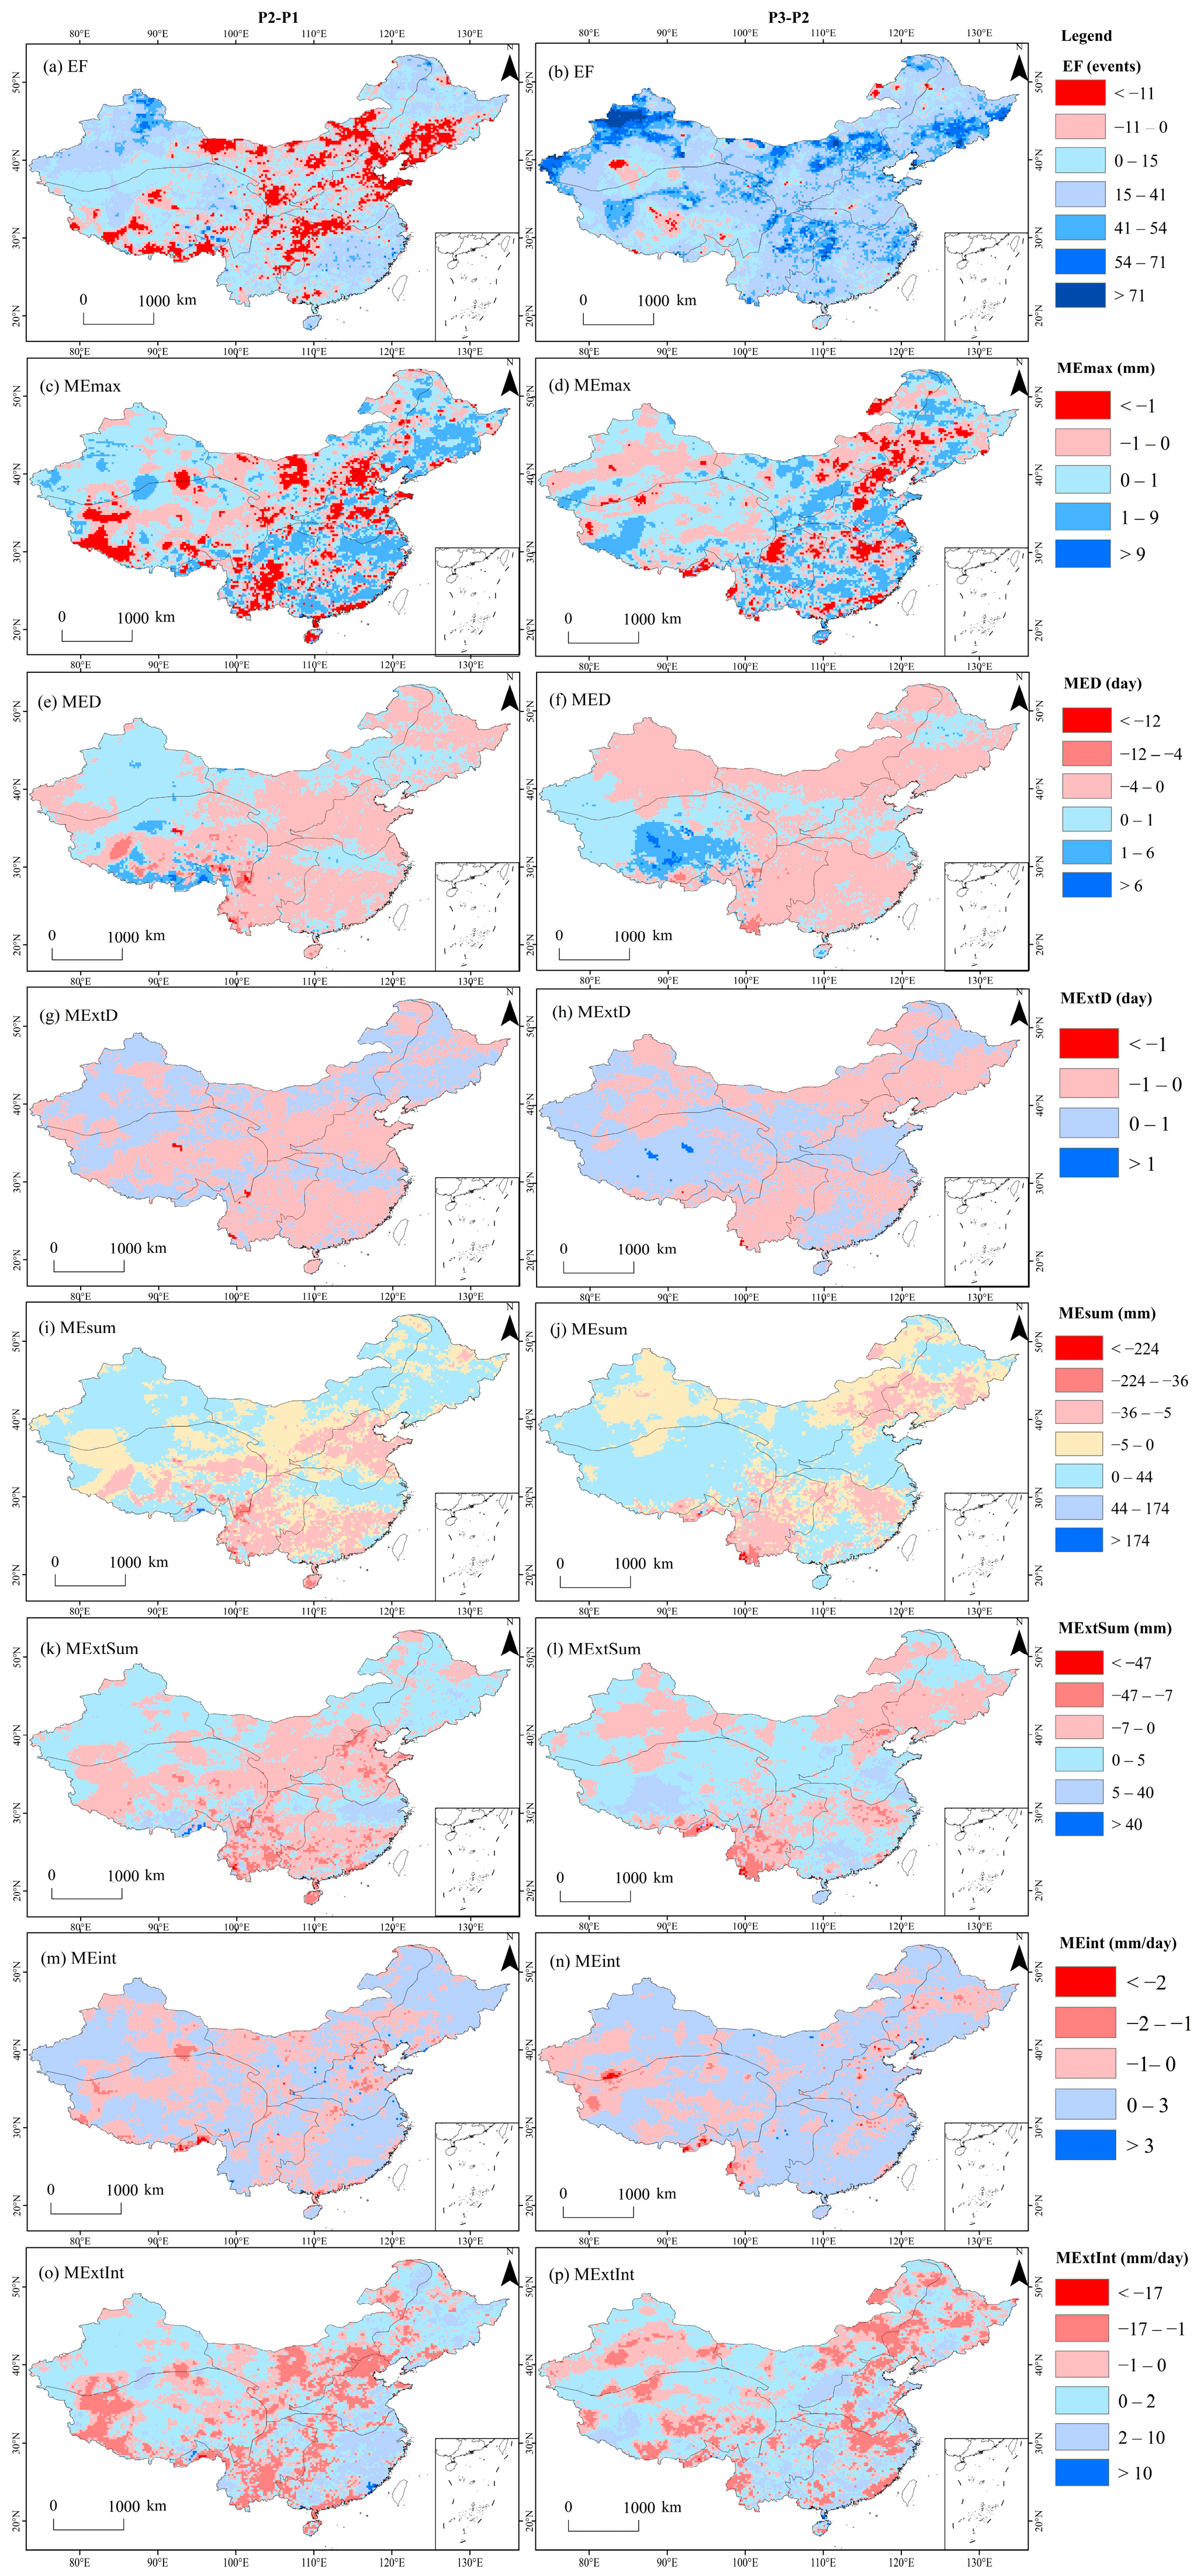
Figure 5.
Spatial difference maps of the multi-year average EPEs characteristic variables. P2 (1981–2000) − P1 (1961–1980) phase (left column); P3 (2001–2022) − P2 (1981–2000) phase (right column).
EF exhibited a persistent upward trend with pronounced stage-dependent differences. From P1 to P2, EF increased slightly across most regions, with only modest increases observed in NE, TP, and SW (regional averages rising by fewer than 6 events), while XJ experienced a notable increase of approximately 20 events. From P2 to P3, EF increased significantly nationwide. XJ continued to record the largest increase (approximately 36 events), and even TP, which had the smallest change, showed a considerable increase of 22 events.
Emax showed no significant overall trend, but regional variations were evident. From P1 to P2, MEmax declined in TP, NW, and NC by 0.108 mm, 0.049 mm, and 0.143 mm, respectively. In contrast, NE, XJ, SW, and SE experienced increases, with NE showing the most substantial rise (0.779 mm). Between P2 and P3, MEmax increased in all regions except SW, which showed a slight decline (0.053 mm), with SE registering the most prominent increase (0.418 mm).
ED displayed a consistent decreasing trend across the three stages. From P1 to P2, ED decreased in most regions, with SW showing the largest reduction (1.029 days). This trend continued from P2 to P3, with further reductions in most regions, exceeding the declines observed in the earlier stage. SW again recorded the greatest decrease (1.161 days).
Esum presented marked spatial and temporal heterogeneity. From P1 to P2, all regions except NE and XJ (which increased by 1.385 mm and 0.73 mm, respectively) experienced decreases, with SW showing the largest reduction (5.395 mm). From P2 to P3, SW exhibited a further sharp decrease (9.713 mm), while TP, SE, and NC showed rebounds, increasing by 3.799 mm, 0.005 mm, and 2.017 mm, respectively. Notably, NE reversed its previous increasing trend, decreasing by 1.550 mm during this period.
Eint showed a steady intensification across all regions from P1 to P3. Between P1 and P2, NE experienced the largest increase (0.391 mm·day−1), followed by SE (0.332 mm·day−1), while TP had the smallest increase (0.022 mm·day−1). From P2 to P3, SE again recorded the largest increase (0.47 mm·day−1), followed by NW and NC (0.309 mm·day−1 and 0.334 mm·day−1, respectively), while TP continued to exhibit the smallest increase (0.003 mm·day−1).
Overall, the temporal evolution of EPEExts characteristic variables closely mirrored the trends observed in general EPE characteristics, indicating coherent patterns in both frequency and intensity over time and space.
3.3. Spatiotemporal Evolution of Different Types of EPEs
3.3.1. Temporal Evolution of Different Types of EPEs
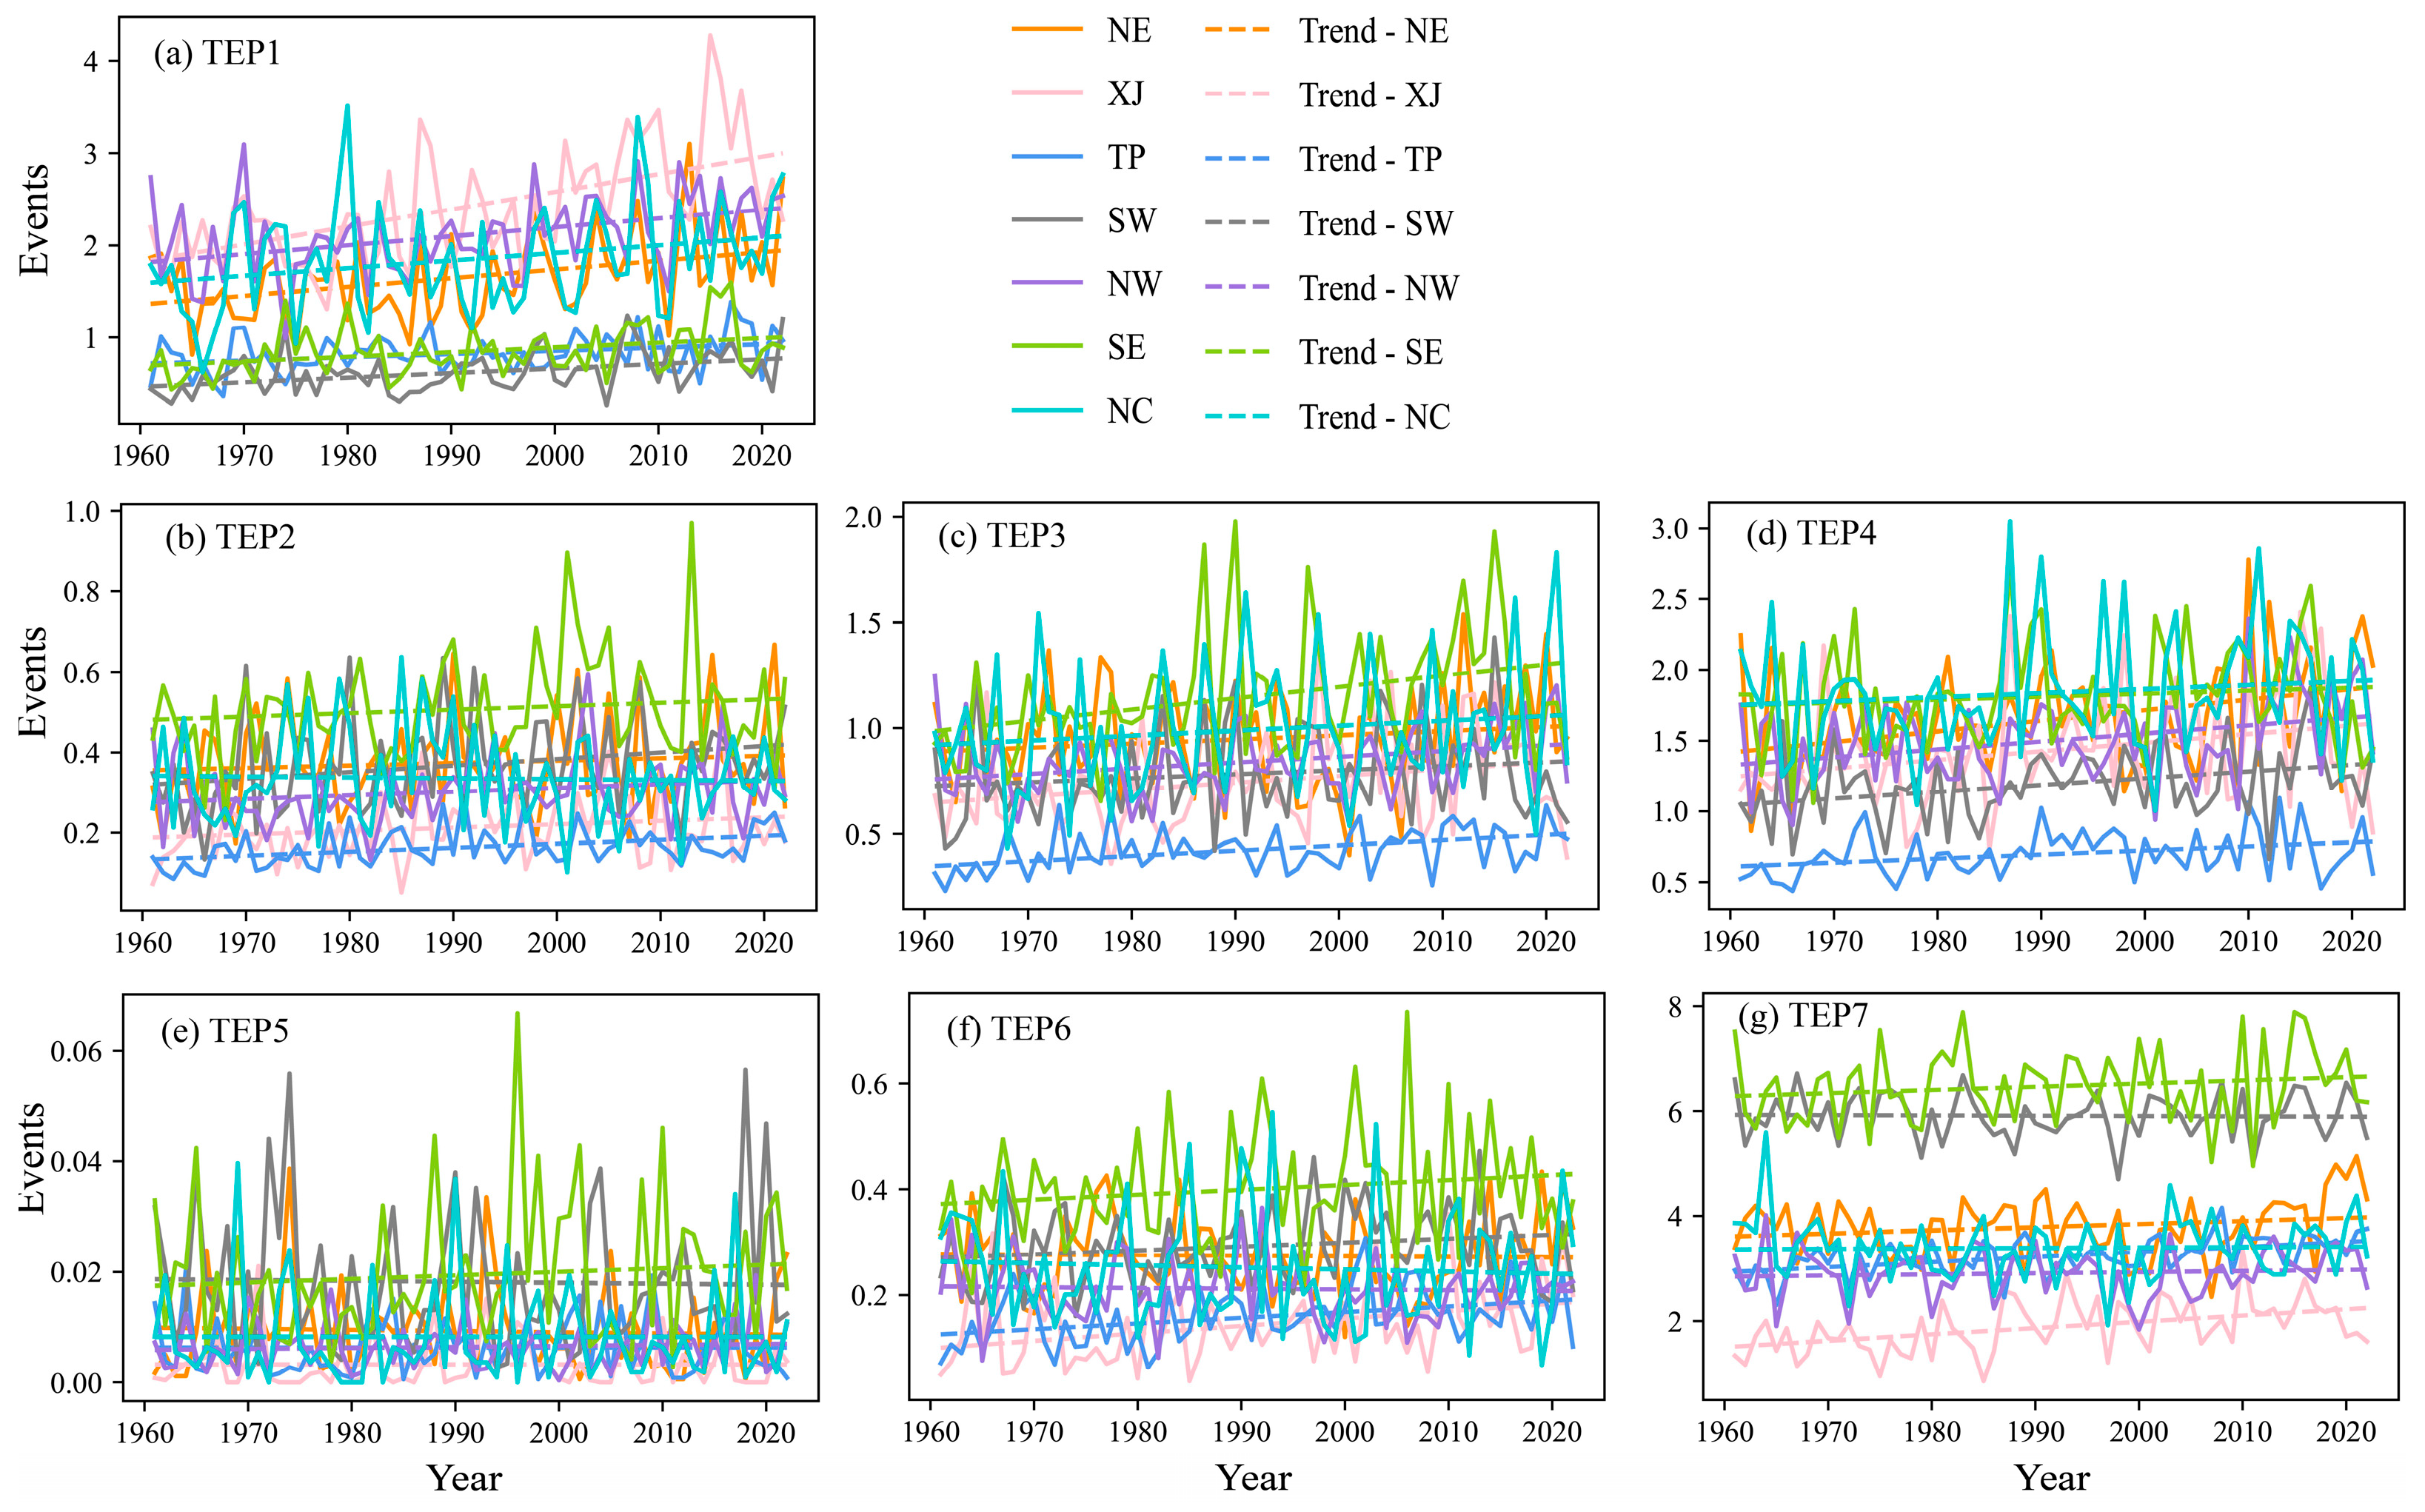
Figure 6 presents the temporal trends of different types of EPEs across various regions. TEP1 exhibits a statistically significant increasing trend across all sub-regions, with the most pronounced rise observed in XJ (Sen’s slope = 1.90 × 10⁻² events·year−1). TEP2 shows an upward trend in all regions except NC, where a slight decreasing trend is detected (−2.1 × 10⁻⁴ events·year−1); the strongest increase occurs in SW (1.63 × 10⁻³ events·year−1). TEP3 records the most significant upward trend in SE (5.35 × 10⁻³ events·year−1). TEP4 also displays a notable increasing trend in all sub-regions except SE and NC, with the sharpest growth in NE (7.45 × 10⁻³ events·year−1). In contrast, TEP5 remains largely stable over time, with near-zero changes across most regions. TEP6 shows increasing trends in XJ, TP, SW, and SE, with XJ experiencing the most significant rise (1.4 × 10⁻³ events·year−1), while NE, NW, and NC exhibit non-significant decreasing trends, the steepest of which is in NC (–3.9 × 10⁻⁴ events·year−1). TEP7 demonstrates increasing trends in all sub-regions except SW, where a non-significant decline is noted (–5.8 × 10⁻⁴ events·year−1), with the strongest upward trend again found in XJ (1.2 × 10⁻² events·year−1).

Figure 6.
Time series of regional average occurrence frequency of different types of EPEs from 1961 to 2022, along with Sen’s slope trend lines.
3.3.2. Different Types of EPEs Exhibit Significant Spatial Heterogeneity
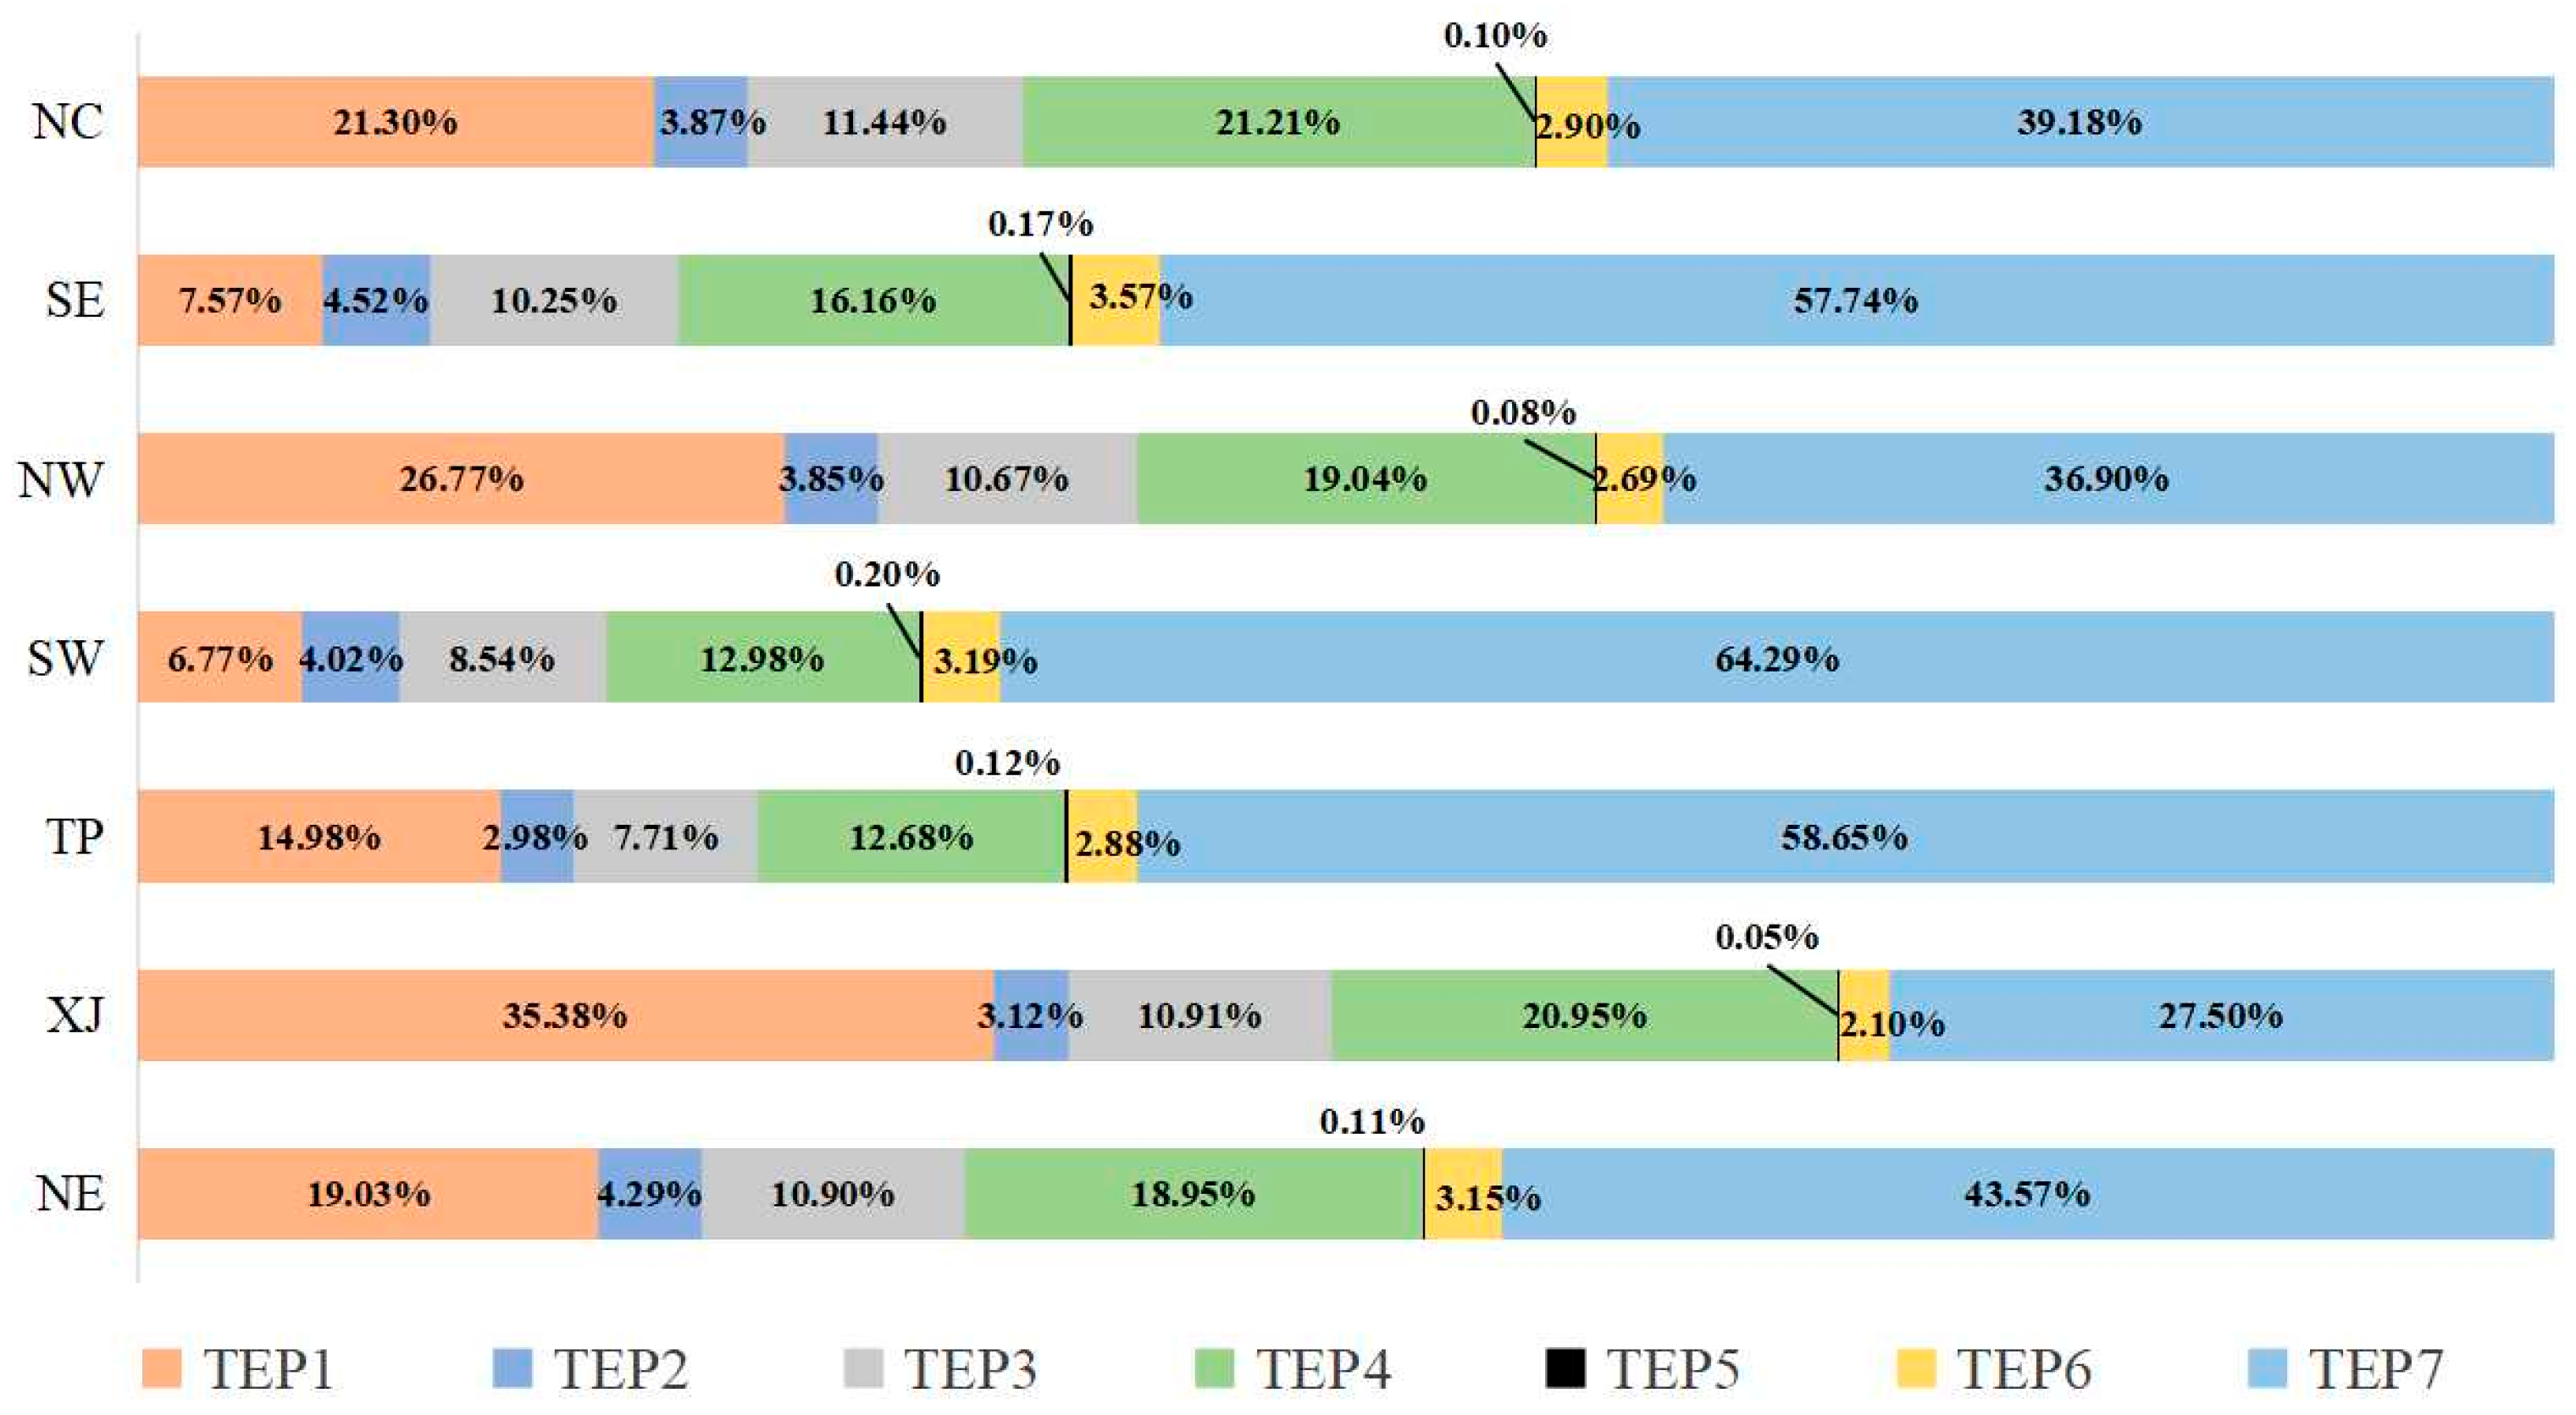
Figure 7 and Figure 8 illustrate the spatial distribution and proportion composition of different types of EPEs. The results reveal marked spatial heterogeneity in the occurrence of various EPE types across regions. TEP1 occurs most frequently in XJ, with a regional average of approximately 150 events. TEP2, TEP3, TEP5, and TEP6 exhibit relatively low average frequencies across regions, in sharp contrast to the substantially higher occurrences of TEP4 and TEP7. Together, these four types account for less than 20% of all EPEs across the regions. TEP4 is most frequent in NC (approximately 113 events), closely followed by SE (112 events), and least frequent in TP (43 events). TEP7 displays the highest regional average frequency, with SE averaging 401 events, and even in XJ, the frequency reaches 116 events. Despite the spatial heterogeneity in the distribution of different EPE types, their proportional composition across regions shows certain consistent patterns. As shown in Figure 8, TEP7 accounts for the largest proportion in all regions except XJ, reaching 64.29% in SW and 58.65% in TP. In contrast, TEP1 constitutes the highest proportion in XJ (35.38%) and is the second most common type in NE, TP, NW, and NC after TEP7. TEP5 consistently shows the smallest proportion, accounting for less than 1% across all regions.
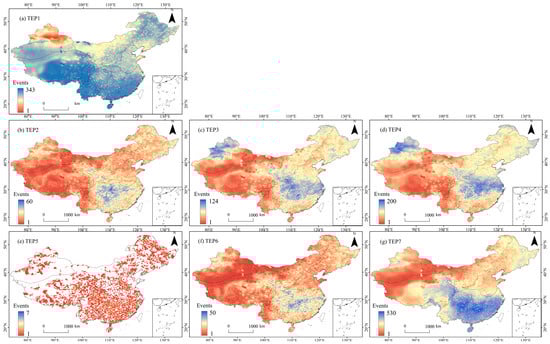
Figure 7.
Spatial distribution maps of the occurrence frequency of different types of EPEs from 1961 to 2022.
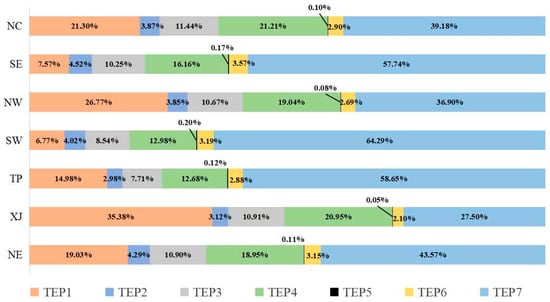
Figure 8.
Proportion of different types of EPEs in different regions of mainland China.
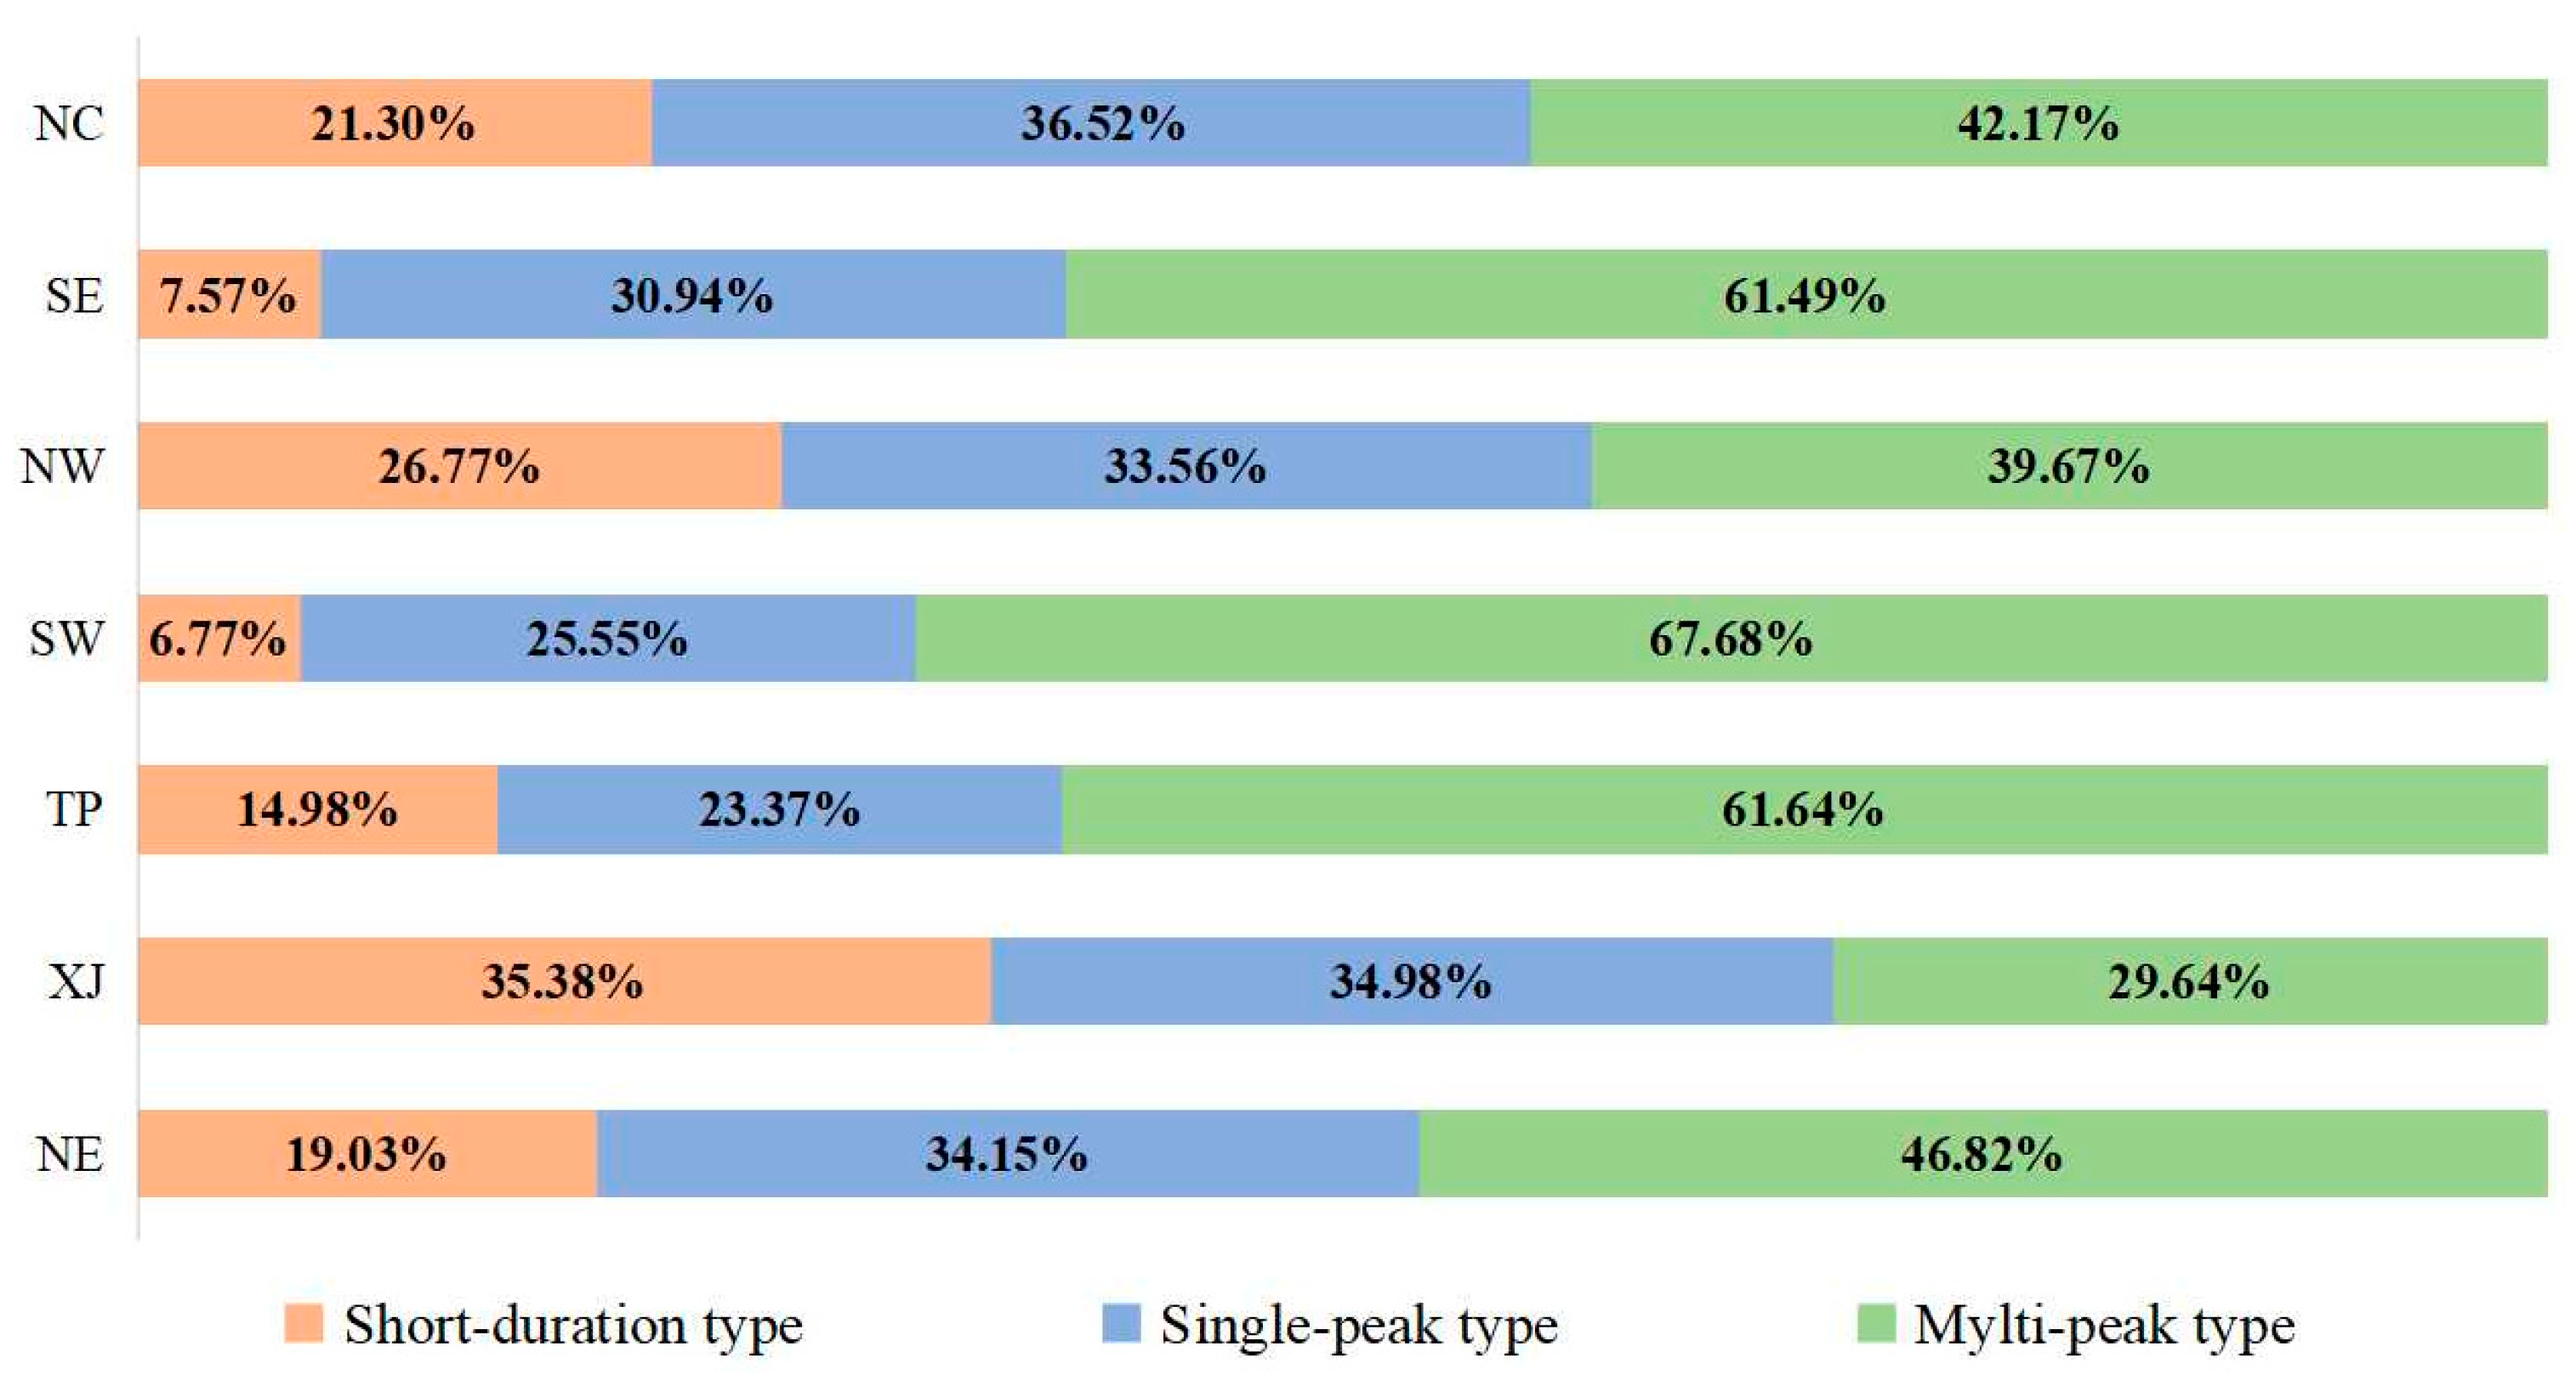
Given the pronounced imbalance in the frequency distribution of different types of EPEs, TEP2, TEP3, TEP5, and TEP6 occur relatively infrequently, resulting in sparse sample sizes. To mitigate the noise introduced by this sparsity, a simplified classification scheme is adopted, categorizing EPEs into three broader types: short-duration, single-peak, and multi-peak events. Figure A3 and Figure A4 present the spatial distribution and proportional composition of these reclassified EPEs. Except for the XJ region, multi-peak EPEs exhibit the highest regional average frequency and dominate in terms of proportion, with up to 427 events observed in the SE region. In SE, SW, and TP, multi-peak events account for over 60% of all occurrences. Conversely, in XJ, short-duration events are most frequent (150 events), followed closely by single-peak events (148 events).
3.4. Regional Differences in the Dependence of EPE Characteristics on ED
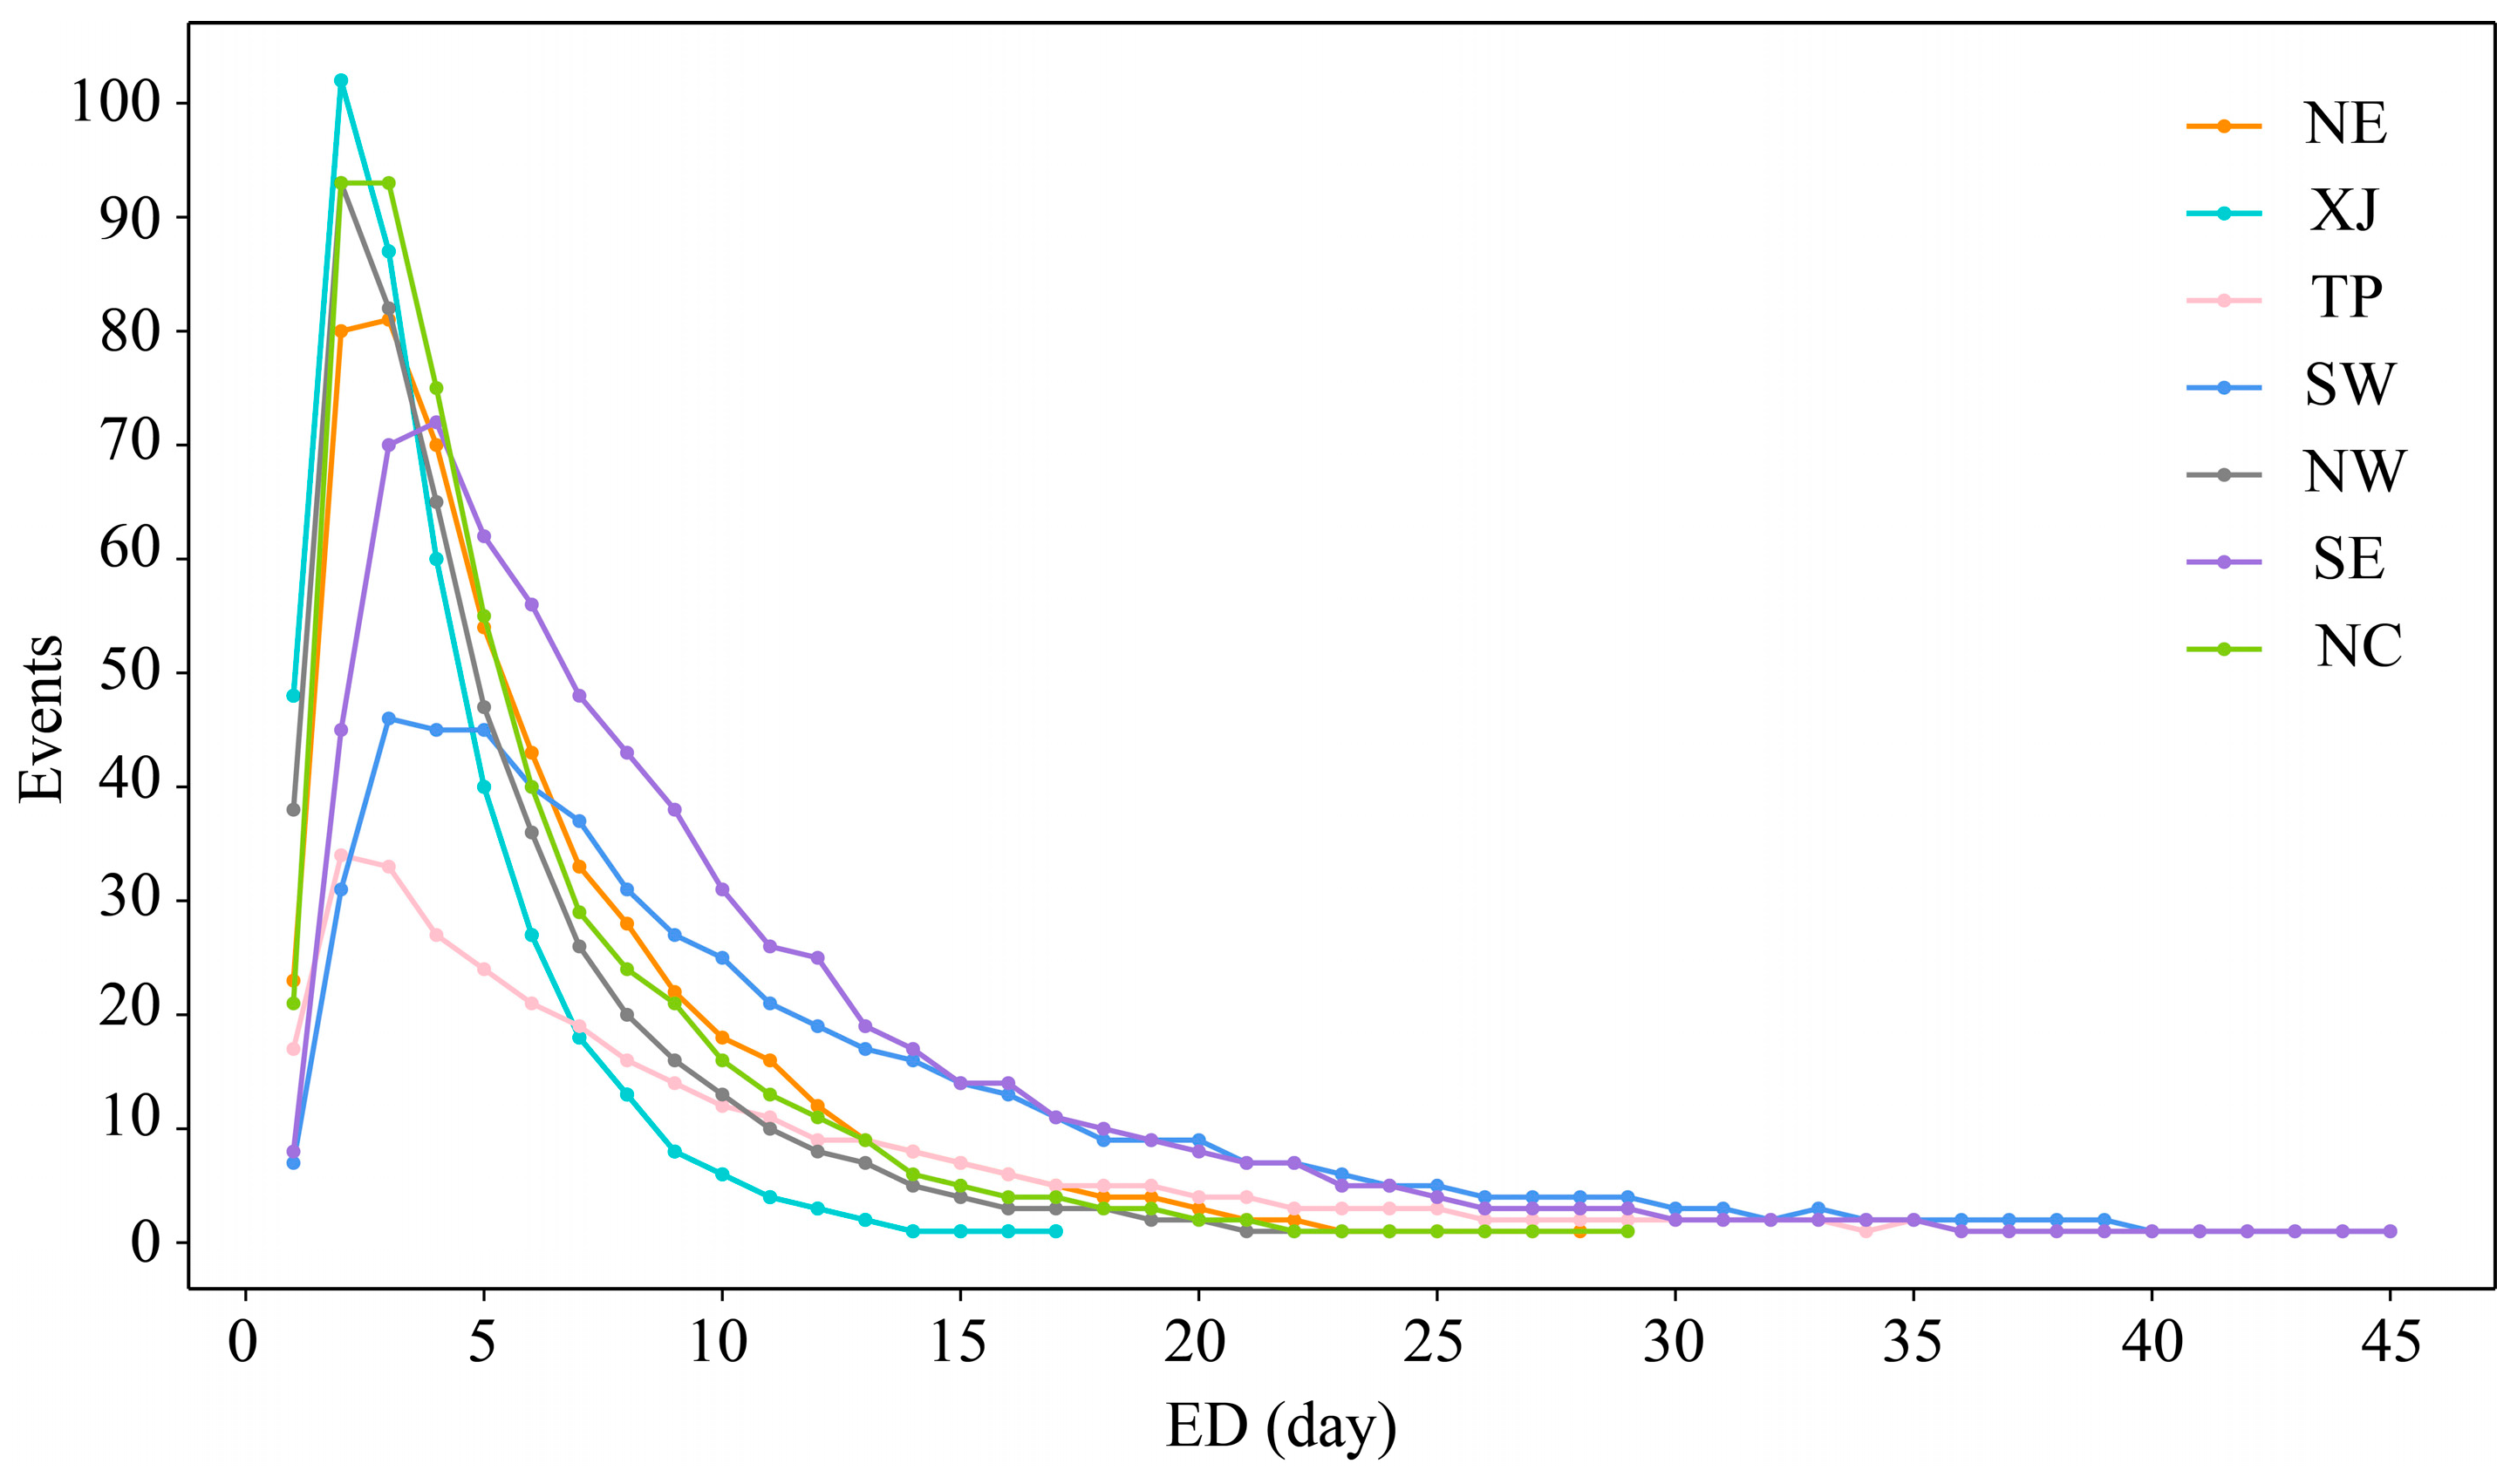
To assess whether different EPE characteristics are dependent on ED, this section focuses on analyzing the relationships among EF, Esum, and ED. Figure 9 presents the variation in EF across different EDs. The results show that in most regions, EPEs most frequently occur with durations of 2 or 3 days. Specifically, in XJ, TP, NW, and NC, the highest frequency is observed for 2-day events, with regional averages of 102, 34, 93, and 93 events, respectively. In contrast, in NE and SW, 3-day events are most frequent, with 81 and 46 events, respectively. In SE, 4-day events dominate, with a frequency of 72 events.

Figure 9.
Frequency of EPEs with different ED in different regions.
Moreover, in regions such as NE, XJ, NW, and NC, the frequency of long-duration EPEs is relatively low—particularly in XJ, where no events with a duration longer than 19 days are recorded. In contrast, regions like SW, SE, and TP exhibit a higher frequency of longer-duration EPEs. SE, in particular, shows a notable number of EPEs lasting more than 6 days, significantly exceeding those in other regions.
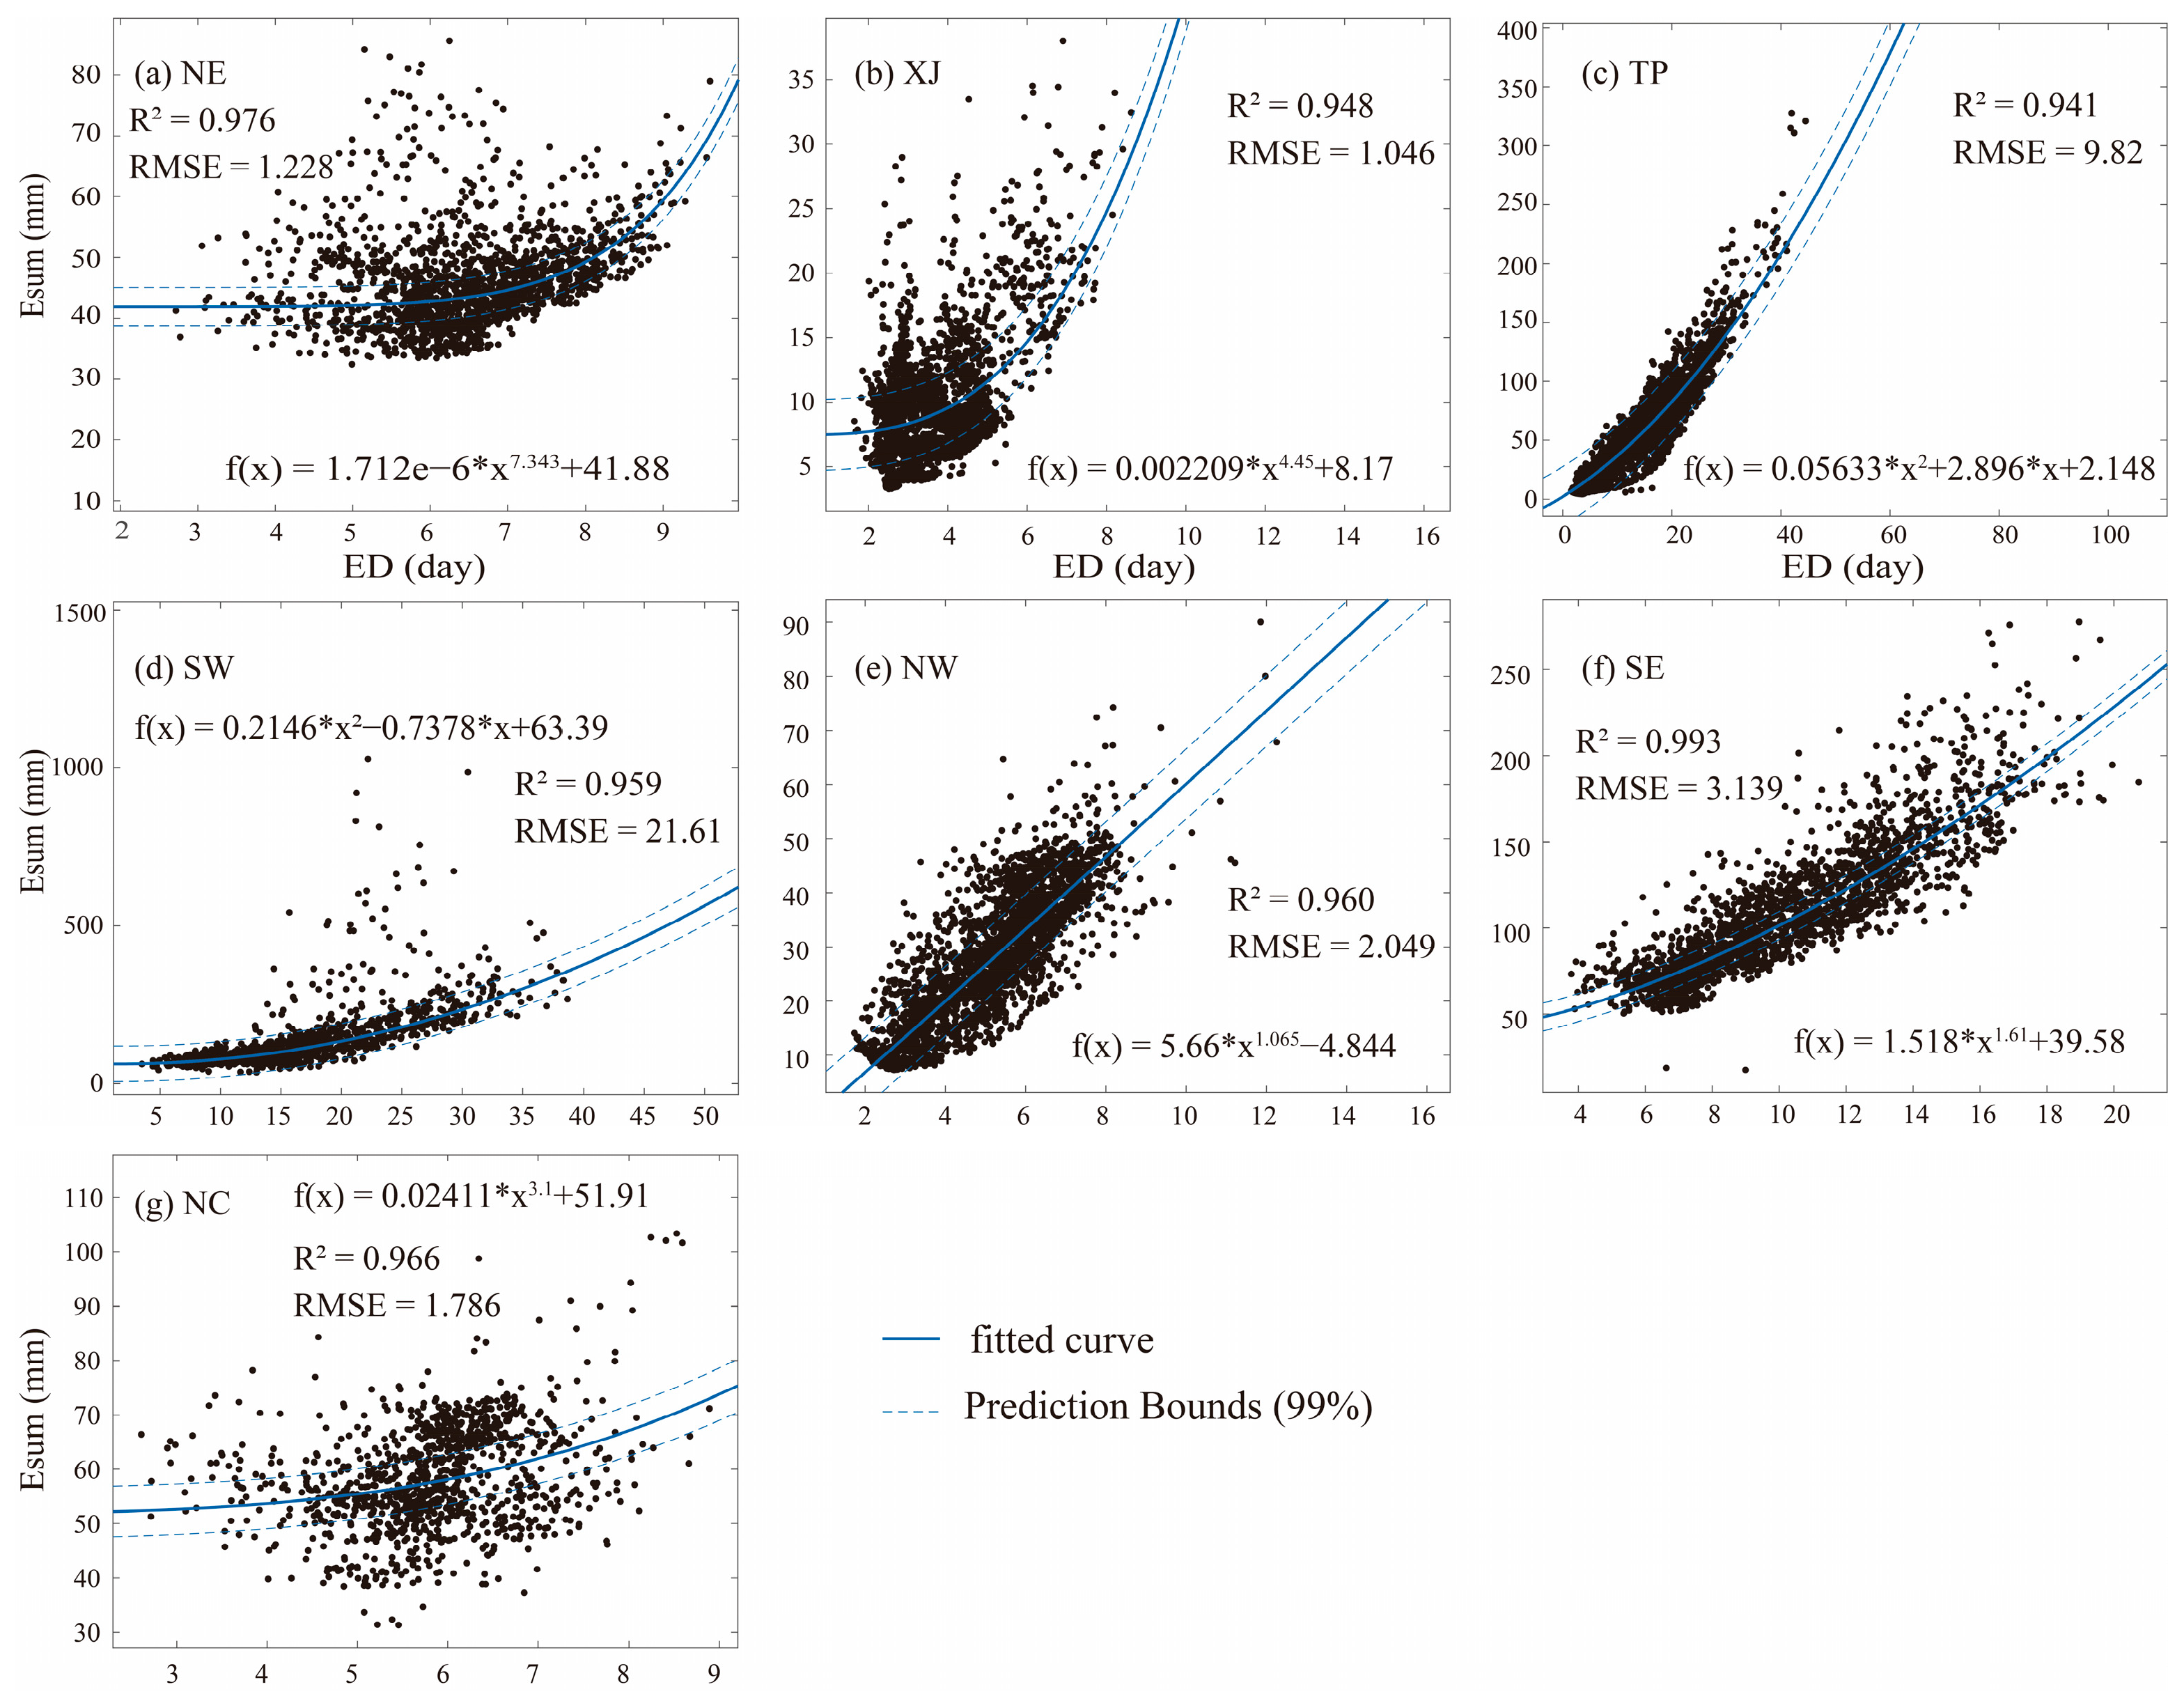
To further investigate the relationship between ED and Esum, we conducted correlation fitting using MATLAB’s Curve Fitter tool (R2022b version). Various fitting methods, including polynomial, power, and exponential fits, were tested, and the best-fitting model was selected. The fitting results are presented in Figure A1. The results show that all R2 values exceed 0.94, and the corresponding p-values are all less than 0.05, indicating that the fit is strong and statistically significant. Additionally, the 99% prediction interval (Prediction Bounds) shown in the fitting plot illustrates the error range of the model’s predictions, highlighting the variability in the fitting results. Overall, the fitting analysis reveals a nonlinear positive correlation between ED and Esum. As ED increases, Esum also increases. However, since Esum is influenced by multiple factors, the underlying mechanisms are complex. Therefore, we focus on a simple analysis of the correlation between ED and Esum in this study to avoid over-interpretation, and do not explore the specific mechanisms in detail.
4. Discussion
4.1. The Relationship Between EPE Types and ED
When analyzing the EF of different EDs, considerable variation was observed across regions. In most regions, the highest average frequency of EPEs occurred when the ED was 3 or 4 days. According to the classification of EPE types in this study, six types of extreme precipitation events may occur when ED ≥ 3 days, including single-peaked left, and others. To investigate the relationship between ED and EPE types, the durations were divided into three groups: 3 ≤ ED ≤ 7 days, 8 ≤ ED ≤ 12 days, and ED ≥ 13 days. The proportions of different EPE types within each group are presented in Figure 10.
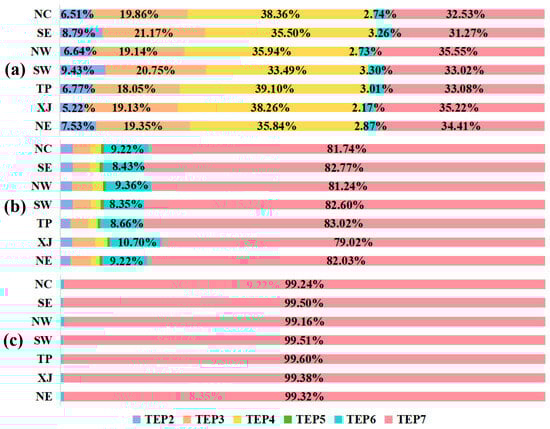
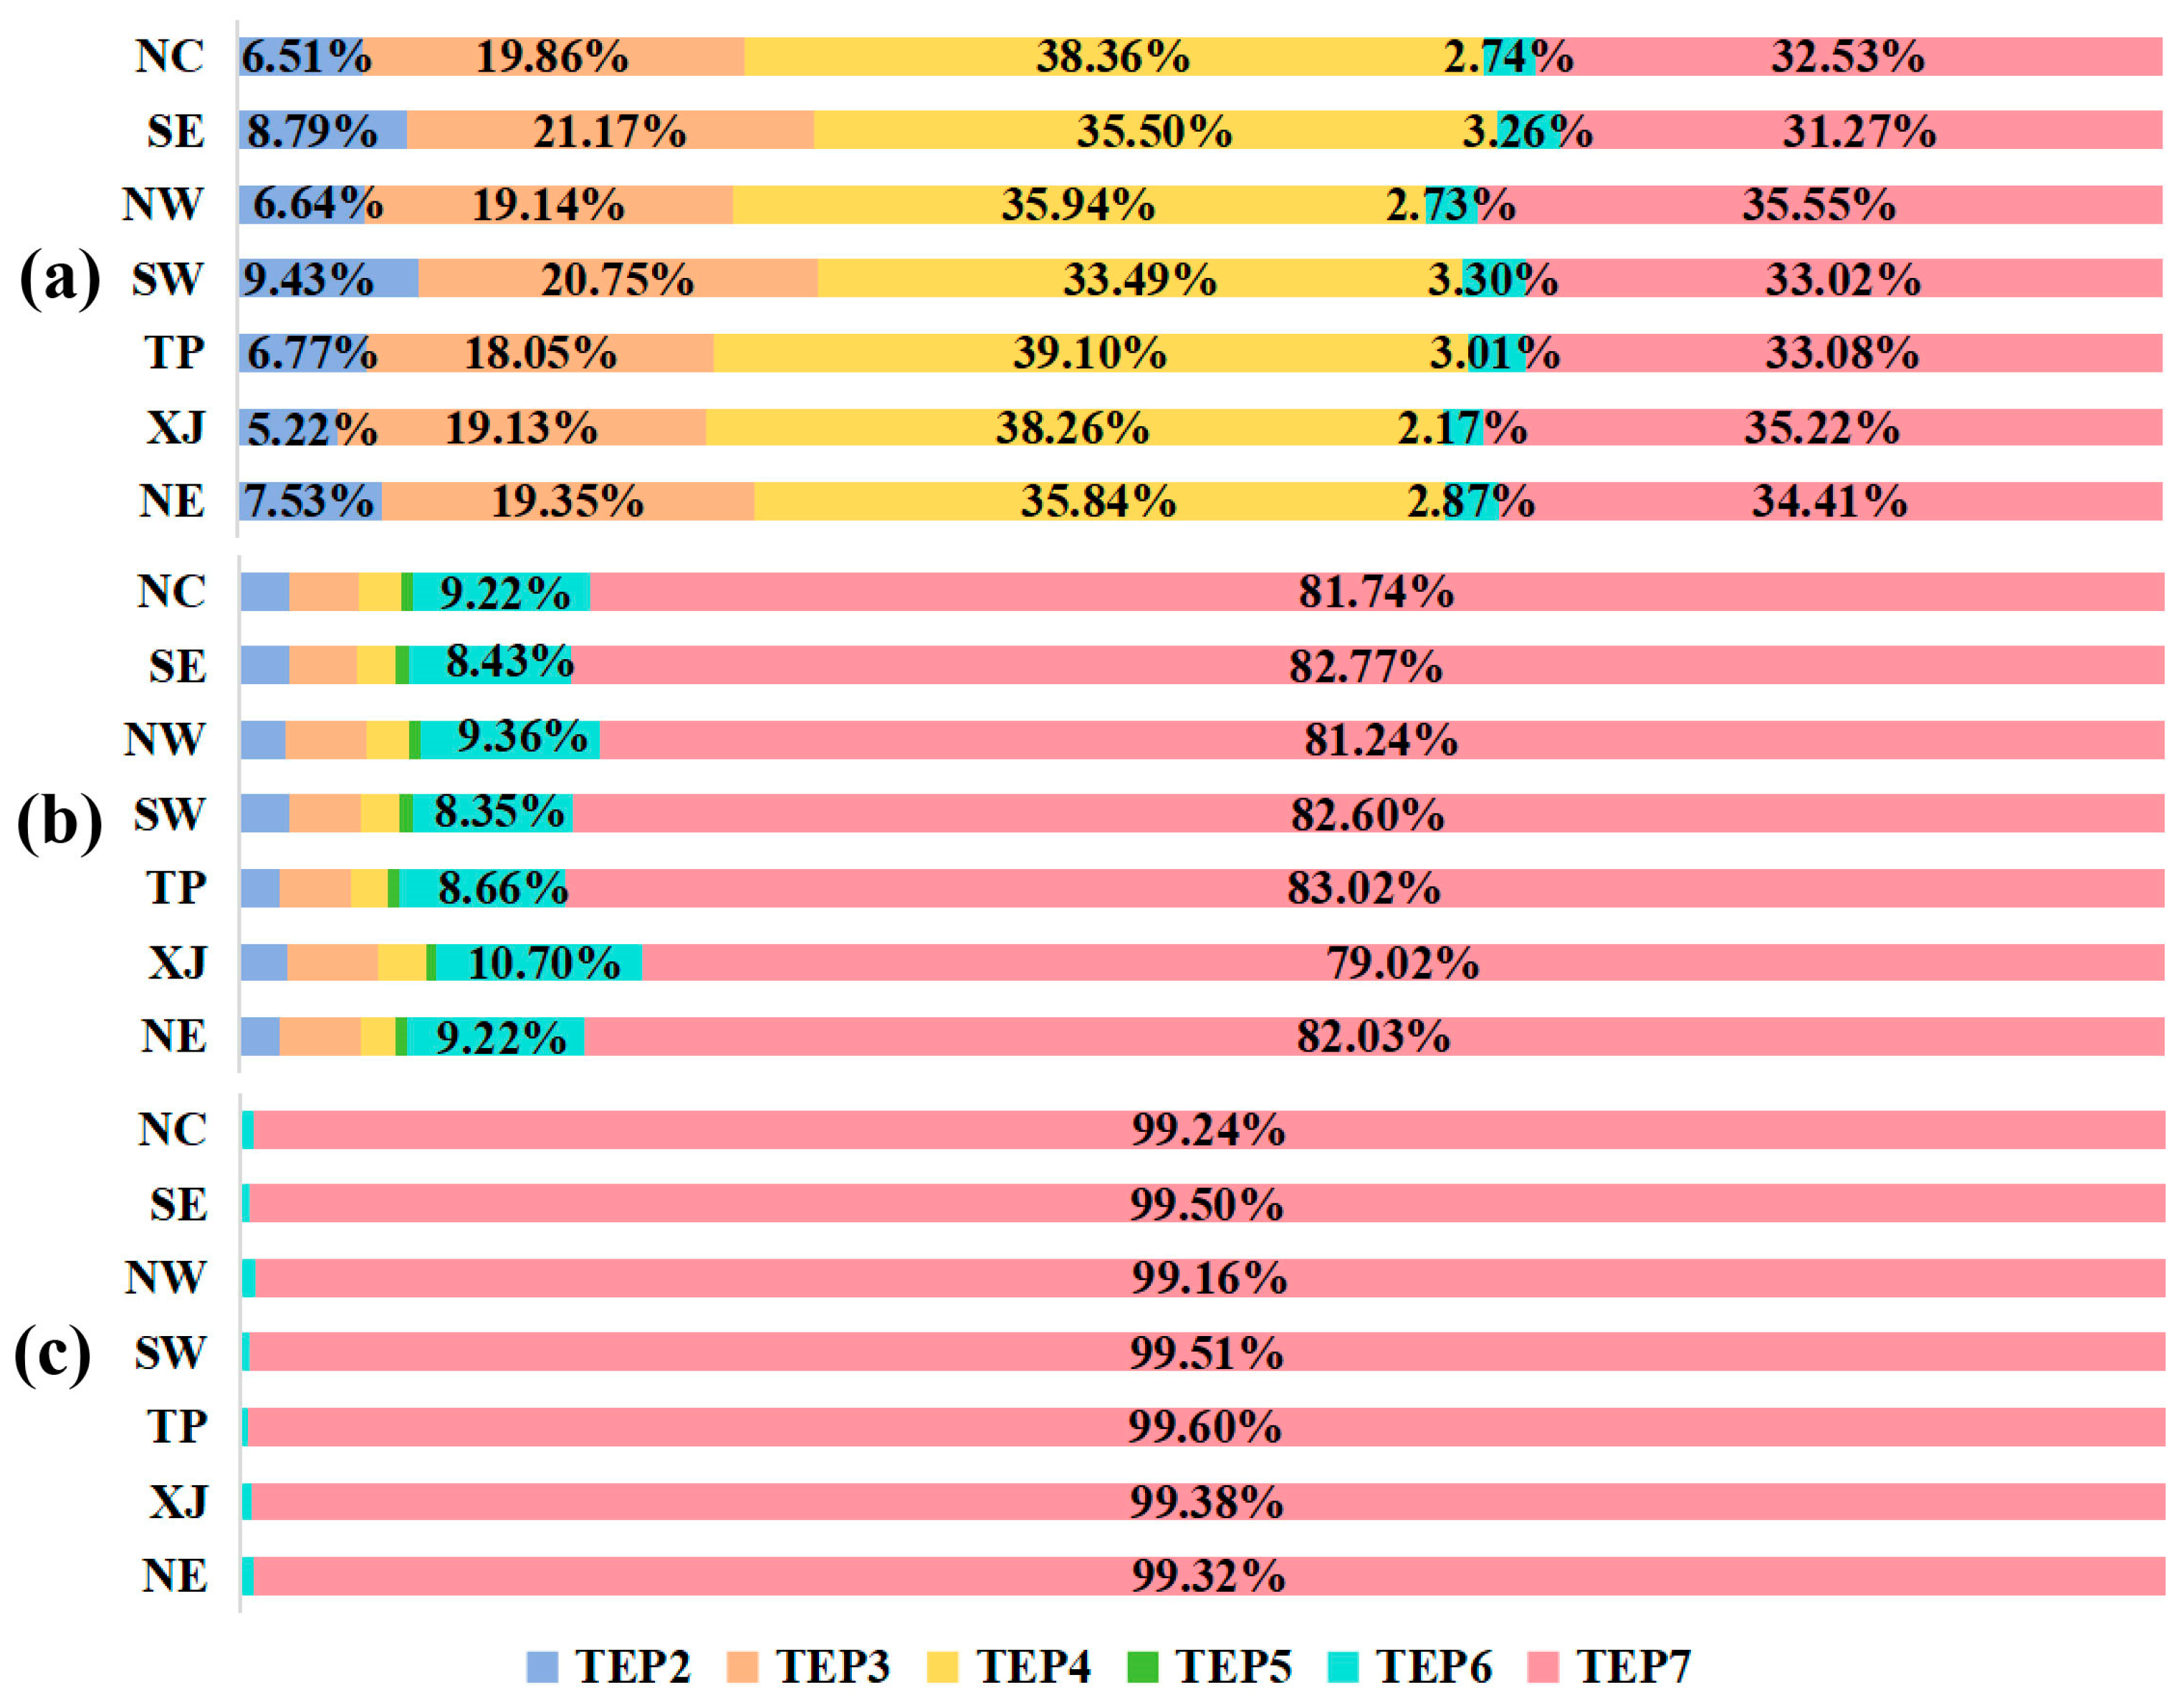
Figure 10.
Proportion of different types of EPEs with varying durations. (a) Proportion of different types of EPEs with 3 ≤ ED ≤ 7 days. (b) Proportion of different types of EPEs with 8 ≤ 12 days. (c) Proportion of different types of EPEs with ED ≥ 13 days.
The results show that for 3 ≤ ED ≤ 7 days, single-peaked EPEs dominate across all regions, with TEP4 exhibiting the highest proportion, reaching 39.10% in TP. TEP5 does not occur in any region within this duration range. For 8 ≤ ED ≤ 12 days, the proportion of double-peaked EPEs increases substantially, accounting for up to 90% of the total, with TEP7 being the most frequent type (up to 80% in some regions). Notably, TEP5 begins to appear in all regions in this group. When ED ≥ 13 days, the proportion of single-peaked EPEs drops below 1%, and TEP7 becomes overwhelmingly dominant in all regions, reaching 99%.
This analysis provides a preliminary understanding of the relationship between ED and EPE types. Shorter-duration EPEs are more likely to be single-peaked, while longer-duration EPEs tend to exhibit multiple peaks. Therefore, future classification schemes of EPEs should incorporate ED as a critical factor, rather than relying solely on peak positions within the event duration. This will enhance our understanding of EPE characteristics and their developmental dynamics.
4.2. Factors Contributing to the Increasing Severity of EPEs in Southwest China
Eint is derived from the ratio of Esum to ED, and therefore, changes in either Esum or ED will directly affect the variation in Eint. From P1 to P3, the SW region exhibits statistically significant changes in Eint, Esum, and ED (see Table A1), suggesting that the impact of Esum and ED on Eint is more robust and credible in this region than in others.
During the transition from P1 to P2, although Esum in the SW region decreases by up to 5.395 mm, Eint still increases by 0.81 × 10⁻¹ mm·day−1, primarily due to a notable reduction in ED (1.029 days). From P2 to P3, Esum continues to decline, with the largest decrease of 9.712 mm among all regions, yet Eint still shows a moderate increase of 0.228 mm·day−1, which can again be largely attributed to the reduction in ED (1.161 days).
Overall, the intensification of Eint in the SW region from P1 to P3 appears to be primarily driven by reductions in ED. Nevertheless, it is important to acknowledge that the intensification of extreme precipitation severity is a complex phenomenon influenced by multiple factors. The present analysis is based solely on the arithmetic relationship among Eint, Esum, and ED, and further research is necessary to elucidate the underlying mechanisms driving the observed changes.
4.3. Spatiotemporal Characteristics of Extreme Precipitation Events and Existing Studies
To gain a more comprehensive understanding of the spatiotemporal variability of extreme precipitation events across mainland China, it is essential to compare the results of this study with those of existing research to validate consistency and identify regional differences, thereby enhancing the understanding of the evolution of extreme precipitation patterns.
At the national scale, this study shows that from 1961 to 2022, the extremity of EPEs in mainland China has significantly increased. The EF, Emax, and Eint of events have generally risen, while ED has shown a widespread decline. This finding is broadly consistent with the conclusions of the IPCC AR6 regarding the intensification of extreme precipitation in East Asia [6]. Additionally, previous research supports these trends, indicating similar patterns of extreme precipitation events across mainland China [11,39].
In terms of regional characteristics, this study reveals that the SE experiences a high frequency of EPEs, with greater intensity and longer durations, reflecting a marked increase in extremity. Specifically, the Emax, Eint, and ExtInt all exhibit obvious upward trends, with Sen’s slopes of 2.9 × 10⁻² mm·year−1, 1.9 × 10⁻² mm·day−1·year−1, and 4.1 × 10⁻² mm·day−1·year−1, respectively. These results align with previous studies, indicating that the Eint in the SE is intensifying [11]. Meanwhile, the frequency and Eint of EPEs in the XJ and NW have also been increasing, especially in XJ, where the EF from the P1 to P3 stages is the most significant. However, these regions are mainly characterized by shorter-duration EPEs. The situation in the SW is more complex, as while the frequency of EPEs is rising, both the Esum and the ED of the events are showing a downward trend. In the TP, despite a notable increase in the frequency of EPEs, the trends in Eint and Esum are not as pronounced. These findings are consistent with the research by Han et al. [11] and Wan et al. [39] on extreme precipitation event characteristics across different regions of China.
In terms of EPE types, this study indicates that short-duration EPEs dominate in the XJ. In contrast, most regions across China primarily experience double-peak events, particularly in areas outside of XJ. However, Wu et al. suggested that single-day EPEs are predominant in the NW, with right-peak events being the most common across the majority of the country [35]. We guess these differences are mainly attributed to the different definitions of EPEs. Although the two studies show differences in the classification of event types, both highlight that EPEs in XJ are predominantly short-duration in nature. These discrepancies arise from variations in the criteria used for classifying event types in the respective studies, but they still reflect the typical characteristics of extreme precipitation in the XJ region.
5. Limitations and Future Works
Although this study provides valuable insights into the spatiotemporal characteristics of EPEs in mainland China, several limitations remain. These limitations offer opportunities for future research to refine and expand upon the findings.
- (1)
- Classification of EPE types
The classification of EPE types varies across studies. Different types of EPEs often exhibit distinct evolutionary processes. In this study, EPEs were categorized based on their temporal structure into types such as single-peak left and single-peak right, with relatively clear conceptual definitions. However, subsequent analysis revealed a significant imbalance in the frequency of different event types. Some types (e.g., TEP2, TEP3, TEP5, TEP6) occurred infrequently, resulting in sparse samples that may be more susceptible to noise, potentially introducing bias into the results. Future work could address this limitation by incorporating a longer time series or expanding the spatial coverage to include more EPE records, thereby increasing the sample size of rare event types. This would help reduce noise interference and improve the robustness and reliability of EPE-type classification.
- (2)
- Limited causal analysis
This study primarily focused on the spatiotemporal characteristics of EPEs across mainland China and its sub-regions. While it provides valuable insights into EPE patterns, it does not explore the underlying physical mechanisms and driving processes responsible for EPE occurrence. Future research should incorporate factors such as climate model outputs, circulation anomalies, and orographic effects to better understand the causal mechanisms and dynamic drivers of extreme precipitation.
- (3)
- Data limitations
Firstly, the CHM_PRE dataset exhibits certain errors when compared to station observational data. These errors may be amplified through the dataset’s construction process and the limitations of its spatial resolution. As a result, the CHM_PRE dataset presents some inaccuracies in capturing the intensity, spatial distribution, and temporal variations of extreme precipitation events. Future studies will employ multi-source precipitation products for cross-validation, which may help reduce the impact of these errors and further enhance the data quality and the reliability of the research findings.
Additionally, this study utilizes the CHM_PRE dataset with a spatial resolution of 0.25°, which may affect the identification of extreme precipitation events in certain localized regions. The relatively coarse spatial resolution may fail to capture some localized strong convection and small-scale precipitation events, leading to underestimation or misclassification of these extreme precipitation event types. Furthermore, while daily-scale analysis is beneficial for revealing long-term trends and periodic variations, it may overlook precipitation processes at shorter time scales, particularly sudden and intense precipitation events at the hourly scale. Future research could consider using datasets with higher spatial and temporal resolution to explore the spatiotemporal characteristics of extreme precipitation events at the hourly scale.
6. Conclusions
Based on the CHM_PRE dataset (1961–2022), this study defines and identifies extreme precipitation events (EPEs) by considering event process completeness, calculates their characteristic variables, and classifies EPE types. Using methods including Sen’s slope, Mann–Kendall (MK) trend analysis, and correlation analysis, the spatiotemporal characteristics of EPEs and their types in mainland China were examined. The main results are as follows:
- (1)
- From 1961 to 2022, the frequency of EPEs in mainland China shows a significant increasing trend across most regions, with the exception of northern China, where the upward trend is not statistically significant. The most notable increase occurs in Xingjiang (XJ), with a Sen’s slope of 4.2 ×10⁻² events·year−1. On average, regional EPE frequency increased by approximately 56 events from the P1 (1961–1980) to P3 (2000–2022) stages.
- (2)
- The duration of EPEs generally exhibits a declining trend. Southwestern China (SW) shows the most pronounced decrease in both event duration (ED) and extreme duration (ExtD), with Sen’s slopes of −6.4 × 10⁻² day·year−1 and −6 × 10⁻³ day·year−1, respectively. From P1 to P3, both the ED and ExtD decreased in most regions of mainland China, with SW experiencing the largest reductions, as regional averages declined by approximately 2.189 days and 2.221 days, respectively.
- (3)
- The extremity of EPEs has intensified, particularly in southeast of China. Emax, Eint, and ExtInt have increased at rates of 2.9 × 10⁻² mm·year−1, 1.9 × 10⁻² mm·day−1·year−1, and 4.1 × 10⁻² mm·day−1·year−1, respectively. Between P2 (1981–2000) and P3 (2000–2022), the extremity of EPEs intensified in most regions, as reflected by increases in Emax, Eint, and ExtInt. The southeastern (SE) region experienced the most significant rise, with respective values increasing by 4.18 × 10⁻¹ mm, 4.7 × 10⁻¹ mm·day−1, and 5.8 × 10⁻¹ mm·day−1.
- (4)
- Different EPE types show an upward trend across regions. Short-duration EPEs are increasing significantly in all regions, with the most pronounced increase in XJ (Sen’s slope = 1.9 × 10⁻² events·year−1). In all regions except XJ, double-peaked EPEs dominate, with proportions exceeding 50% in SE, SW, and the Tibetan Plateau (TP). In XJ, short-duration EPEs are most common, accounting for 35.38%.
- (5)
- EPEs of different durations show distinct spatial characteristics. In XJ, the most frequent EPEs last 2 days (102 events), with no occurrences beyond 19 days. In contrast, the SE region records the highest frequency at 4-day durations (72 events), and events with ED ≥ 6 days are significantly more common than in other regions. Additionally, Esum demonstrates a nonlinear positive relationship with ED, characterized by a modest increase during short events and markedly accelerated growth as the duration extends.
Author Contributions
Conceptualization, H.G.; methodology, W.G.; software, H.G. and W.G.; validation, W.G., Y.C. and N.Y.; formal analysis, W.G.; resources, H.G. and P.D.M.; data curation, W.G. and Y.C.; writing—original draft preparation, W.G.; writing—review and editing, H.G., W.W. and Y.W.; visualization, W.G.; supervision, H.G. and W.W.; project administration, H.G. and P.D.M.; funding acquisition, H.G. All authors have read and agreed to the published version of the manuscript.
Funding
This research was jointly funded by the College Student Innovation and Entrepreneurship Training Program (Grant No. S202410446040), the Youth Innovation Teams in Colleges and Universities of Shandong Province (2022KJ178) and the Open Foundation of State Key Laboratory of Desert and Oasis Ecology, the Chinese Academy of Sciences (G2023-02-03).
Data Availability Statement
The daily grid precipitation dataset for mainland China (CHM_PRE) was obtained from the National Tibetan Plateau Data Center (https://cstr.cn/18406.11.Atmos.tpdc.300523) (accessed on 14 October 2024).
Conflicts of Interest
The authors declare no conflicts of interest.
Appendix A
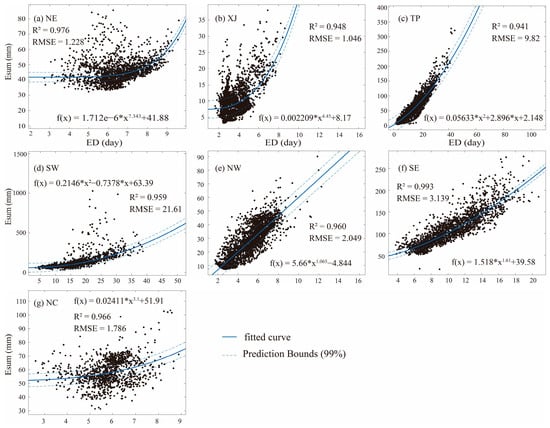
Figure A1.
Scatter plots of the fitting between Esum and ED for EPEs in different regions of mainland China from 1961 to 2022.
Appendix B

Figure A2.
The regional averages of characteristic variables for EPEs in the three stages (P1, P2, P3) across seven regions of mainland China.
Appendix C
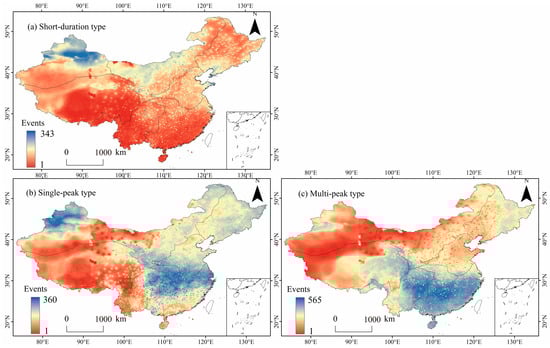
Figure A3.
The spatial distribution of the occurrence frequency of three types of EPEs (1961–2022).

Appendix D
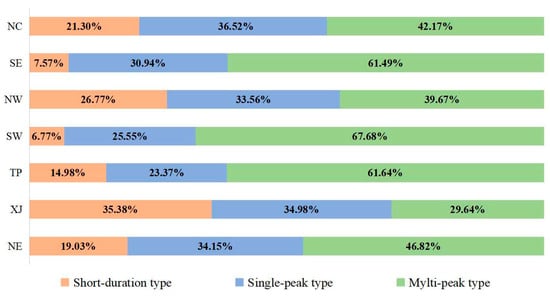
Figure A4.
Proportional distribution of short-duration, single-peak, and multi-peak EPEs across different regions of mainland China.
Appendix E

Table A1.
Sen’s slope values and MK significance test results for the characteristic variables of EPEs in seven regions of mainland China from 1961 to 2022.
Appendix F
Table A2.
Sen’s slope values and MK significance test results for EPE types across seven regions of mainland China from 1961 to 2022.
References
- Badawy, A.; Sultan, M.; Abdelmohsen, K.; Yan, E.; Elhaddad, H.; Milewski, A.; Torres-Uribe, H.E. Floods of Egypt’s Nile in the 21st century. Sci. Rep. 2024, 14, 27031. [Google Scholar] [CrossRef] [PubMed]
- Furtak, K.; Wolińska, A. The impact of extreme weather events as a consequence of climate change on the soil moisture and on the quality of the soil environment and agriculture—A review. CATENA 2023, 231, 107378. [Google Scholar] [CrossRef]
- Azadgar, A.; Nyka, L.; Salata, S. Advancing Urban Flood Resilience: A Systematic Review of Urban Flood Risk Mitigation Model, Research Trends, and Future Directions. Land 2024, 13, 2138. [Google Scholar] [CrossRef]
- Kundzewicz, Z.W.; Kanae, S.; Seneviratne, S.I.; Handmer, J.; Nicholls, N.; Peduzzi, P.; Mechler, R.; Bouwer, L.M.; Arnell, N.; Mach, K.; et al. Flood risk and climate change: Global and regional perspectives. Hydrol. Sci. J. 2014, 59, 1–28. [Google Scholar] [CrossRef]
- Choi, T.-M.; Lam, H.K.S.; Sarkis, J.; Zhan, Y.; Zhu, Q. Extreme weather and production economics: Insights, challenges, and future directions. Int. J. Prod. Econ. 2025, 281, 109504. [Google Scholar] [CrossRef]
- Intergovernmental Panel on Climate (Ed.) Annex VI: Climatic Impact-driver and Extreme Indices. In Climate Change 2021—The Physical Science Basis: Working Group I Contribution to the Sixth Assessment Report of the Intergovernmental Panel on Climate Change; Cambridge University Press: Cambridge, UK, 2023; pp. 2205–2214. [Google Scholar]
- Tran, T.-N.-D.; Lakshmi, V. Enhancing human resilience against climate change: Assessment of hydroclimatic extremes and sea level rise impacts on the Eastern Shore of Virginia, United States. Sci. Total Environ. 2024, 947, 174289. [Google Scholar] [CrossRef] [PubMed]
- Zhang, Y.; You, Q.; Ullah, S.; Chen, C.; Shen, L.; Liu, Z. Substantial increase in abrupt shifts between drought and flood events in China based on observations and model simulations. Sci. Total Environ. 2023, 876, 162822. [Google Scholar] [CrossRef]
- Zhou, X.; Zhang, Y.; Wang, W.; Li, X.; Yang, H.; Sun, Y. Social vulnerability assessment under different extreme precipitation scenarios: A case study in Henan Province, China. PLoS ONE 2024, 19, e0299956. [Google Scholar] [CrossRef]
- Tabari, H. Extreme value analysis dilemma for climate change impact assessment on global flood and extreme precipitation. J. Hydrol. 2021, 593, 125932. [Google Scholar] [CrossRef]
- Han, X.; Chen, Q.; Fu, D. Trends in Extreme Precipitation and Associated Natural Disasters in China, 1961–2021. Climate 2025, 13, 74. [Google Scholar] [CrossRef]
- Hsu, P.-C.; Xie, J.; Lee, J.-Y.; Zhu, Z.; Li, Y.; Chen, B.; Zhang, S. Multiscale interactions driving the devastating floods in Henan Province, China during July 2021. Weather Clim. Extrem. 2023, 39, 100541. [Google Scholar] [CrossRef]
- Hu, Y.; Dong, B.; Xie, J.; Tan, H.; Zhou, B.; Lin, S.; He, J.; Zhao, L. Anthropogenic Influence on 2022 Extreme January-February Precipitation in Southern China. Bull. Am. Meteorol. Soc. 2023, 104, E1935–E1940. [Google Scholar] [CrossRef]
- Liu, X.; Jie, H.; Zou, Y.; Liu, S.; Hu, Y.; Liu, S.; Yang, D.; Zhao, L.; He, J. Anthropogenic Influence on 2022 June Extreme Rainfall over the Pearl River Basin. Bull. Am. Meteorol. Soc. 2024, 105, 7. [Google Scholar] [CrossRef]
- Zhang, H.; Zhai, P. Temporal and spatial characteristics of extreme hourly precipitation over eastern China in the warm season. Adv. Atmos. Sci. 2011, 28, 1177–1183. [Google Scholar] [CrossRef]
- Rojpratak, S.; Supharatid, S. Regional extreme precipitation index: Evaluations and projections from the multi-model ensemble CMIP5 over Thailand. Weather Clim. Extrem. 2022, 37, 100475. [Google Scholar] [CrossRef]
- Gu, X.; Ye, L.; Xin, Q.; Zhang, C.; Zeng, F.; Nerantzaki, S.D.; Papalexiou, S.M. Extreme Precipitation in China: A Review on Statistical Methods and Applications. Adv. Water Resour. 2022, 163, 104144. [Google Scholar] [CrossRef]
- Li, S.; Chen, Y.; Wei, W.; Fang, G.; Duan, W. The increase in extreme precipitation and its proportion over global land. J. Hydrol. 2024, 628, 130456. [Google Scholar] [CrossRef]
- White, R.H.; Battisti, D.S.; Skok, G. Tracking precipitation events in time and space in gridded observational data. Geophys. Res. Lett. 2017, 44, 8637–8646. [Google Scholar] [CrossRef]
- Chen, J.; Zheng, Y.; Zhang, X.; Zhu, P. Distribution and diurnal variation of warm-season short-duration heavy rainfall in relation to the MCSs in China. Acta Meteorol. Sin. 2013, 27, 868–888. [Google Scholar] [CrossRef]
- She, D.; Shao, Q.; Xia, J.; Taylor, J.A.; Zhang, Y.; Zhang, L.; Zhang, X.; Zou, L. Investigating the variation and non-stationarity in precipitation extremes based on the concept of event-based extreme precipitation. J. Hydrol. 2015, 530, 785–798. [Google Scholar] [CrossRef]
- Deng, C.; Zhang, Y.; Ma, M.; Chen, Y.; Wei, J.; Kunstmann, H.; Gao, L. Compound temporal-spatial extreme precipitation events in the Poyang Lake Basin of China. J. Hydrol. Reg. Stud. 2025, 58, 102270. [Google Scholar] [CrossRef]
- Cao, F.; Gao, T.; Dan, L.; Ma, Z.; Chen, X.; Zou, L.; Zhang, L. Synoptic-scale atmospheric circulation anomalies associated with summertime daily precipitation extremes in the middle–lower reaches of the Yangtze River Basin. Clim. Dyn. 2019, 53, 3109–3129. [Google Scholar] [CrossRef]
- Xiao, C.; Wu, P.; Zhang, L.; Song, L. Robust increase in extreme summer rainfall intensity during the past four decades observed in China. Sci. Rep. 2016, 6, 38506. [Google Scholar] [CrossRef] [PubMed]
- Zhai, P.; Zhang, X.; Wan, H.; Pan, X. Trends in Total Precipitation and Frequency of Daily Precipitation Extremes over China. J. Clim. 2005, 18, 1096–1108. [Google Scholar] [CrossRef]
- Wang, Y.; Zhou, L. Observed trends in extreme precipitation events in China during 1961–2001 and the associated changes in large-scale circulation. Geophys. Res. Lett. 2005, 32, L09707. [Google Scholar] [CrossRef]
- Luo, Y.; Wu, M.; Ren, F.; Li, J.; Wong, W.-K. Synoptic Situations of Extreme Hourly Precipitation over China. J. Clim. 2016, 29, 8703–8719. [Google Scholar] [CrossRef]
- Shang, W.; Li, S.; Ren, X.; Duan, K. Event-based extreme precipitation in Central-Eastern China: Large-scale anomalies and teleconnections. Clim. Dyn. 2020, 54, 2347–2360. [Google Scholar] [CrossRef]
- Shang, W.; Ren, X.; Li, S.; Duan, K. Precursors and Formation Mechanisms of Event-Based Extreme Precipitation during Springtime in Central-Eastern China. J. Clim. 2022, 35, 373–385. [Google Scholar] [CrossRef]
- Li, S.; Wang, C.; Yan, J.; Liu, X. Variability of the event-based extreme precipitation in the south and north Qinling Mountains. Acta Geogr. Sin. 2020, 75, 989–1007. (In Chinese) [Google Scholar] [CrossRef]
- Liu, J.; Juan, D.; Yumeng, Y.; Wang, Y. Evaluating extreme precipitation estimations based on the GPM IMERG products over the Yangtze River Basin, China. Geomat. Nat. Hazards Risk 2020, 11, 601–618. [Google Scholar] [CrossRef]
- Ran, Q.; Wang, J.; Chen, X.; Liu, L.; Li, J.; Ye, S. The relative importance of antecedent soil moisture and precipitation in flood generation in the middle and lower Yangtze River basin. Hydrol. Earth Syst. Sci. 2022, 26, 4919–4931. [Google Scholar] [CrossRef]
- Upreti, P.; Ojha, C.S.P. Comparison of antecedent precipitation based rainfall-runoff models. Water Supply 2020, 21, 2122–2138. [Google Scholar] [CrossRef]
- Lu, W.; Cai, W. Temporal trends features in consecutive days of extreme precipitation over China, 1951–2017. Mausam J. Meteorol. Dep. India 2019, 70, 321–328. [Google Scholar] [CrossRef]
- Wu, X.; Guo, S.; Yin, J.; Yang, G.; Zhong, Y.; Liu, D. On the event-based extreme precipitation across China: Time distribution patterns, trends, and return levels. J. Hydrol. 2018, 562, 305–317. [Google Scholar] [CrossRef]
- Zaman, M.; Ahmad, I.; Usman, M.; Saifullah, M.; Anjum, M.N.; Khan, M.I.; Uzair Qamar, M. Event-based time distribution patterns, return levels, and their trends of extreme precipitation across Indus Basin. Water 2020, 12, 3373. [Google Scholar] [CrossRef]
- Zhang, Y.; Liang, K.; Liu, C. Time distribution pattern and spatial heterogeneity of hourly scale event-based extreme precipitation in China. J. Hydrol. 2023, 622, 129712. [Google Scholar] [CrossRef]
- Guo, C.; Ning, N.; Guo, H.; Tian, Y.; Bao, A.; De Maeyer, P. Does ERA5-Land Effectively Capture Extreme Precipitation in the Yellow River Basin? Atmosphere 2024, 15, 1254. [Google Scholar] [CrossRef]
- Wan, W.; Zhou, Y. Spatiotemporal patterns in persistent precipitation extremes of the Chinese mainland (1961–2022) and association with the dynamic factors. Atmos. Res. 2024, 310, 107600. [Google Scholar] [CrossRef]
- Li, X.; Zhang, K.; Gu, P.; Feng, H.; Yin, Y.; Chen, W.; Cheng, B. Changes in precipitation extremes in the Yangtze River Basin during 1960–2019 and the association with global warming, ENSO, and local effects. Sci. Total Environ. 2021, 760, 144244. [Google Scholar] [CrossRef]
- Zang, Z.; Luo, J.; Ha, Y. Interdecadal Increase in Summertime Extreme Precipitation over East China in the Late 1990’s. Front. Earth Sci. 2022, 10, 969853. [Google Scholar] [CrossRef]
- Dong, T.; Liu, J.; Liu, D.; He, P.; Li, Z.; Shi, M.; Xu, J. Spatiotemporal variability characteristics of extreme climate events in Xinjiang during 1960–2019. Environ. Sci. Pollut. Res. 2023, 30, 57316–57330. [Google Scholar] [CrossRef] [PubMed]
- Liang, Q.; Chen, Y.; Duan, W.; Wang, C.; Li, Y.; Zhu, J.; He, G.; Wei, W.; Yuan, M. Temporal and spatial changes of extreme precipitation and its related large-scale climate mechanisms in the arid region of Northwest China during 1961–2022. J. Hydrol. 2025, 658, 133182. [Google Scholar] [CrossRef]
- Yao, J.; Chen, Y.; Guan, X.; Zhao, Y.; Chen, J.; Mao, W. Recent climate and hydrological changes in a mountain–basin system in Xinjiang, China. Earth-Sci. Rev. 2022, 226, 103957. [Google Scholar] [CrossRef]
- Li, X.H.; Chen, Z.F.; Wang, L. Spatiotemporal variations and future projections of extreme precipitation events in Southwestern China. Appl. Ecol. Environ. Res. 2023, 21, 5389–5414. [Google Scholar] [CrossRef]
- Pei, Z.; Cui, X.; Jiang, R. 40-Year statistics of warm-season extreme hourly precipitation over North China. Weather Clim. Extrem. 2025, 48, 100761. [Google Scholar] [CrossRef]
- Hu, W.; Chen, L.; Shen, J.; Yao, J.; He, Q.; Chen, J. Changes in Extreme Precipitation on the Tibetan Plateau and Its Surroundings: Trends, Patterns, and Relationship with Ocean Oscillation Factors. Water 2022, 14, 2509. [Google Scholar] [CrossRef]
- Lamjiri, M.A.; Dettinger, M.D.; Ralph, F.M.; Guan, B. Hourly storm characteristics along the U.S. West Coast: Role of atmospheric rivers in extreme precipitation. Geophys. Res. Lett. 2017, 44, 7020–7028. [Google Scholar] [CrossRef]
- Guo, H.; Chen, S.; Bao, A.; Behrangi, A.; Hong, Y.; Ndayisaba, F.; Hu, J.; Stepanian, P.M. Early assessment of Integrated Multi-satellite Retrievals for Global Precipitation Measurement over China. Atmos. Res. 2016, 176–177, 121–133. [Google Scholar] [CrossRef]
- Wang, G.; Zhang, Q.; Yu, H.; Shen, Z.; Sun, P. Double increase in precipitation extremes across China in a 1.5 °C/2.0 °C warmer climate. Sci. Total Environ. 2020, 746, 140807. [Google Scholar] [CrossRef]
- Zhu, Z.; Cai, Y.; Dai, X.; Bai, X.; Yang, Y.; Li, X.; Yang, Z. Spatiotemporally contiguous precipitation events across China: Role of atmospheric rivers and tropical cyclones in heavy precipitation. Ecol. Indic. 2024, 158, 111426. [Google Scholar] [CrossRef]
- Han, J.; Miao, C.; Gou, J.; Zheng, H.; Zhang, Q.; Guo, X.Y. A new daily gridded precipitation dataset for the Chinese mainland based on gauge observations. Earth Syst. Sci. Data 2023, 15, 3147–3161. [Google Scholar] [CrossRef]
- Shen, Y.; Feng, M.; Zhang, H.; Gao, F. Interpolation Methods of China Daily Precipitation Data. J. Appl. Meteorol. Sci. 2010, 21, 279–286. [Google Scholar] [CrossRef]
- Jia, W.; Xue-Jie, G. A gridded daily observation dataset over China region and comparison with the other datasets. Chin. J. Geophys. Chin. Ed. 2013, 56, 1102–1111. (In Chinese) [Google Scholar] [CrossRef]
- Wei, L.; Jiang, S.; Ren, L.; Hua, Z.; Zhang, L.; Duan, Z. Detection of the 2022 extreme drought over the Yangtze River basin using two satellite-gauge precipitation products. Atmos. Res. 2025, 315, 107929. [Google Scholar] [CrossRef]
- Yang, H.; Wang, T.; Yang, D.; Yan, Z.; Wu, J.; Lei, H. Runoff and sediment effect of the soil-water conservation measures in a typical river basin of the Loess Plateau. CATENA 2024, 243, 108218. [Google Scholar] [CrossRef]
- Sen, P.K. Estimates of the Regression Coefficient Based on Kendall’s Tau. J. Am. Stat. Assoc. 1968, 63, 1379–1389. [Google Scholar] [CrossRef]
- Tatli, H. Detecting persistence of meteorological droughtviathe Hurst exponent. Meteorol. Appl. 2015, 22, 763–769. [Google Scholar] [CrossRef]
- Huang, J.; Sun, S.; Xu, D.; Lan, H.; Sun, H.; Wang, Z.; Bao, Y.; Wang, J.; Tang, H.; Zhang, H. A TFIIIA-type zinc finger protein confers multiple abiotic stress tolerances in transgenic rice (Oryza sativa L.). Plant Mol. Biol. 2012, 80, 337–350. [Google Scholar] [CrossRef]

Disclaimer/Publisher’s Note: The statements, opinions and data contained in all publications are solely those of the individual author(s) and contributor(s) and not of MDPI and/or the editor(s). MDPI and/or the editor(s) disclaim responsibility for any injury to people or property resulting from any ideas, methods, instructions or products referred to in the content. |
© 2025 by the authors. Licensee MDPI, Basel, Switzerland. This article is an open access article distributed under the terms and conditions of the Creative Commons Attribution (CC BY) license (https://creativecommons.org/licenses/by/4.0/).