Article

InfraredStereo3D: Breaking Night Vision Limits with Perspective Projection Positional Encoding and Groundbreaking Infrared Dataset

1
Shijiazhuang Campus, Army Engineering University of PLA, Shijiazhuang 050003, China
2
77123 Units of PLA, Mianyang 621000, China
*
Author to whom correspondence should be addressed.
Remote Sens. 2025, 17(12), 2035; https://doi.org/10.3390/rs17122035
Submission received: 4 April 2025 / Revised: 5 June 2025 / Accepted: 7 June 2025 / Published: 13 June 2025
(This article belongs to the Collection Visible Infrared Imaging Radiometers and Applications)

Abstract

:
In fields such as military reconnaissance, forest fire prevention, and autonomous driving at night, there is an urgent need for high-precision three-dimensional reconstruction in low-light or night environments. The acquisition of remote sensing data by RGB cameras relies on external light, resulting in a significant decline in image quality and making it difficult to meet the task requirements. The method based on lidar has poor imaging effects in rainy and foggy weather, close-range scenes, and scenarios requiring thermal imaging data. In contrast, infrared cameras can effectively overcome this challenge because their imaging mechanisms are different from those of RGB cameras and lidar. However, the research on three-dimensional scene reconstruction of infrared images is relatively immature, especially in the field of infrared binocular stereo matching. There are two main challenges given this situation: first, there is a lack of a dataset specifically for infrared binocular stereo matching; second, the lack of texture information in infrared images causes a limit in the extension of the RGB method to the infrared reconstruction problem. To solve these problems, this study begins with the construction of an infrared binocular stereo matching dataset and then proposes an innovative perspective projection positional encoding-based transformer method to complete the infrared binocular stereo matching task. In this paper, a stereo matching network combined with transformer and cost volume is constructed. The existing work in the positional encoding of the transformer usually uses a parallel projection model to simplify the calculation. Our method is based on the actual perspective projection model so that each pixel is associated with a different projection ray. It effectively solves the problem of feature extraction and matching caused by insufficient texture information in infrared images and significantly improves matching accuracy. We conducted experiments based on the infrared binocular stereo matching dataset proposed in this paper. Experiments demonstrated the effectiveness of the proposed method.

1. Introduction

In the current era of the vigorous development of computer vision and robotics technology, accurate three-dimensional (3D) scene reconstruction has become a crucial cornerstone for research and application in the fields of virtual reality (VR), robot navigation, and remote sensing [1,2,3]. To compute depth, compared with the monocular camera-based method [4,5,6], the binocular camera-based method is more accurate. The reason for this is that the intrinsic and extrinsic parameters of the camera are calibrated accurately [7,8,9,10,11,12]. However, traditional binocular stereo matching methods based on visible light face many challenges in practical applications [7,8,9,10,11,12], such as severe interference from external environmental factors like complex illumination conditions and harsh weather, which greatly limit their effectiveness in all-weather scenarios. Compared with the 3D reconstruction method of lidar, the infrared-based method has better imaging effects in rainy and foggy weather, close-range scenes, and scenes requiring thermal imaging data [13,14,15,16,17,18,19,20].
To address the problem of poor-quality remote sensing data acquired from RGB cameras and lidar in special environments, we can use infrared cameras to capture images without relying on external light. There are two main reasons for this situation: first, there is a lack of a dataset specifically for infrared binocular stereo matching [21,22,23]; second, the lack of texture information in infrared images causes a limit in the extension of the RGB method to the infrared reconstruction problem. To solve these problems, this study constructed an infrared binocular stereo-matching dataset. By mapping the 3D lidar point cloud data to the 2D coordinate system of infrared cameras, high-precision 3D spatial information is provided for infrared images. However, there are significant differences between lidar point clouds and infrared images. The former are sparsely and unevenly distributed, while the latter feature a dense and continuous pixel structure. To solve this problem, we designed a joint calibration board of infrared cameras and lidar for high-precision sensor alignment and optimized the depth map generation algorithm [24,25,26,27,28,29]. Finally, the dataset was successfully constructed.
As shown in Figure 1, to solve the problem of an unsatisfactory effect after the traditional RGB method is transferred, this research proposes an innovative perspective projection positional encoding-based transformer method to complete the infrared binocular stereo matching task. In this method, a stereo matching network combined with the transformer and cost volume is constructed. Based on the negative inverse Gaussian distribution theory, we innovatively designed the fusion of these aspects. As an important part of the transformer, positional encoding is critical to model performance. The existing work extensively uses the parallel projection model, which simplifies the calculation as an approximation but has some limitations. In contrast, we use a perspective projection model in the positional encoding part so that each pixel is associated with a different projection ray. Because this positional encoding module improves the encoding precision, the method proposed in this paper can capture the geometric features of each pixel in the image more accurately [30]. It effectively solves the problem of feature extraction and matching caused by insufficient texture information in infrared images and significantly improves the matching accuracy.
In summary, our contributions are as follows:
An infrared binocular stereo matching dataset is constructed;
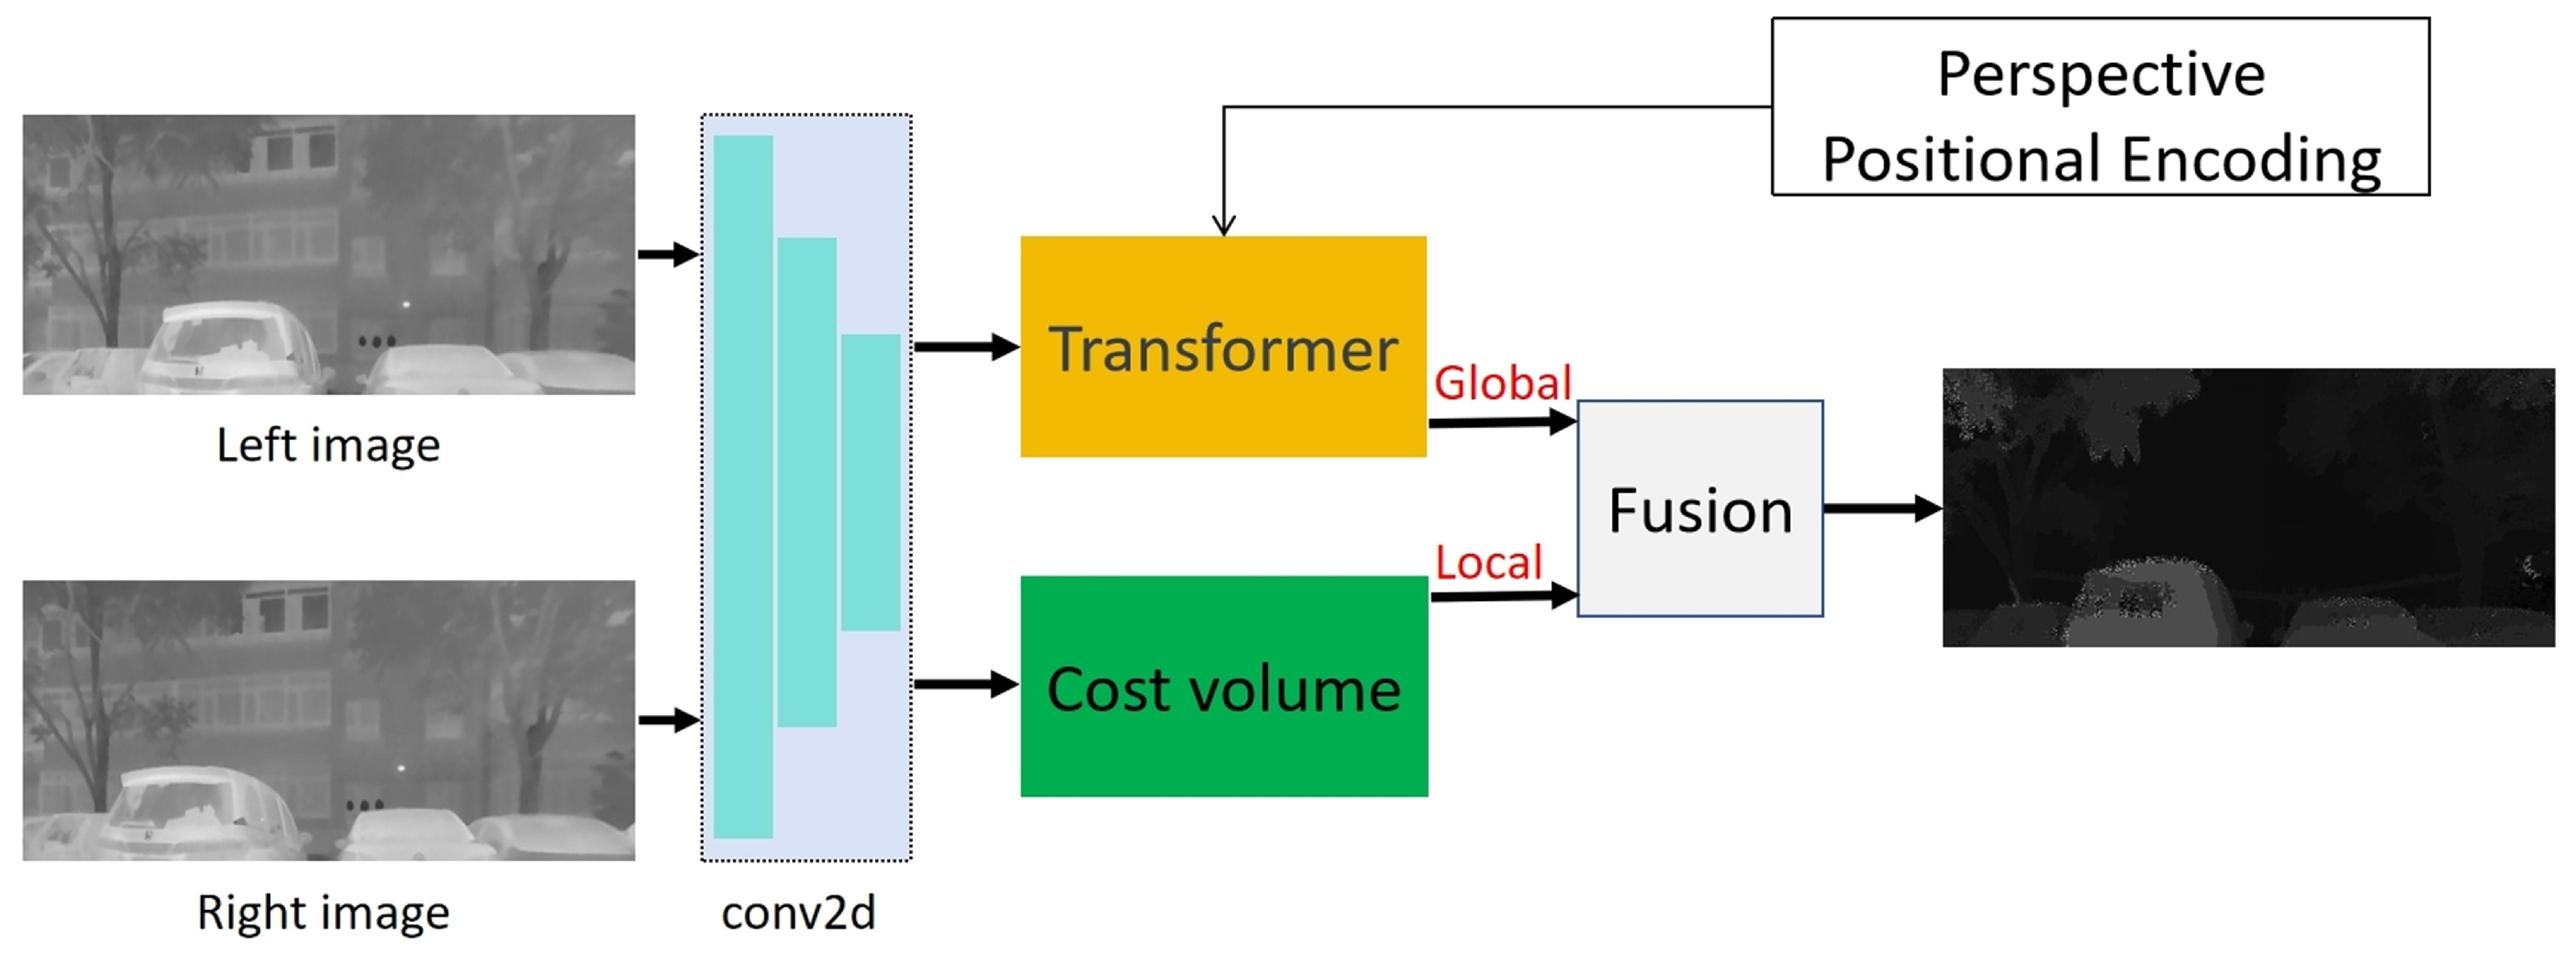
A binocular stereo matching network combined with the transformer and cost volume is created to complete global feature extraction and local feature extraction tasks, respectively;
The perspective projection model is embedded in the attention mechanism positional encoding part of the transformer network instead of the unrealistic parallel projection model.
We conducted experiments based on the infrared binocular stereo matching dataset proposed in this paper. Experiments demonstrated the effectiveness of the proposed method.

2. Related Works

First of all, we introduce the relevant stereo matching datasets. Then, we present the related work on 3D reconstruction from infrared images. Finally, the stereo matching network is introduced.

2.1. Datasets

In the 3D reconstruction task, datasets play a crucial role in providing the necessary data support for the quantitative evaluation of the model. For the time being, there is no mature infrared binocular dataset, so the datasets related to RGB are mainly introduced here. The generation of these datasets can be divided into two main categories: reality acquisition and annotation [31,32,33,34,35,36,37,38,39] and computer graphics-based data [40].
Scharstein et al. proposed the Middlebury stereo matching dataset, which pioneered the quantitative evaluation of stereo matching algorithms based on the dataset [31]. Subsequently, a series of Middlebury datasets based on this work were successively released [32,33,34,35]. Geiger et al. [21,22,23] proposed the KITTI dataset, which is a very famous stereoscopic vision evaluation dataset. The KITTI dataset mainly collects outdoor scene data. In addition to stereoscopic matching tasks, it can also be applied to autonomous driving tasks and includes dynamic scenes. Allan et al. [36] proposed the SCARED dataset. This dataset focuses on the depth estimation of endoscopic images. Shi et al. [37] proposed the stereo waterdrop removal dataset. This dataset is specifically designed to study the removal of raindrop effects. Knapitsch et al. [38] proposed ETH3D dataset. The dataset is a gray-scale stereo dataset containing indoor and outdoor scenes. Mayer et al. [39] proposed a scene flow dataset. This dataset is a virtual stereo dataset generated via software rendering, including disparity ground truth, optical flow, and scene flow data. At present, the binocular stereo dataset obtained by the infrared camera is still blank and cannot provide effective reference data for the quantitative evaluation of the infrared stereo matching algorithm.

2.2. 3D Reconstruction from Infrared Images

Lin et al. [13] used a tilt photogrammetry system composed of four infrared cameras and four RGB cameras to collect data. The Structure from Motion (SFM) method is used to generate an infrared point cloud and RGB point cloud for registration to realize thermal property mapping in large-scale regions. Ham et al. [14] proposed a method of 3D modeling with the help of RGB images and thermal images. This method uses SFM and Multi-View Stereo (MVS) to generate point clouds and then automatically stacks the point clouds according to the calibration parameters to complete 3D reconstruction. Vidas et al. [15] developed an imaging system composed of a thermal imager, distance sensor, and color camera. The system generated a 3D model through Simultaneous Localization and Mapping (SLAM) technology. Vidas et al. [16] used the handheld sensor system [15] and employed a risk-averse neighborhood weighting mechanism to reduce mismatching problems caused by an inaccurate temperature. Yang et al. [17] proposed a 3D infrared modeling method for data acquisition using a system composed of two smartphones and an infrared camera. In this method, the RGB 3D model is constructed first, and then the infrared image is fused with the 3D model to generate a 3D thermal model. Hoegner et al. [18] used Nistér’s five-point algorithm and image triplets to perform automatic Texture Mapping of infrared images on a given 3D building model. Hoegner et al. [19] proposed two mobile thermal imaging methods. The first step is to register the thermal image sequence with a given 3D model. The second step is to register the point cloud generated using high-resolution RGB images with an infrared point cloud to generate a 3D model with thermal texture. Cho et al. [20] pointed out that existing research on the 3D reconstruction of infrared images mainly focuses on two-dimensional infrared image data processing. This is mainly realized by mapping infrared image texture on the 3D model generated using mature technology. It is impossible to conduct an accurate quantitative evaluation of its performance because it is mainly evaluated using qualitative indicators such as the visualization effect. Therefore, in order to measure and optimize the performance of infrared imaging processing technology more accurately, future research requires exploring more quantitative evaluation methods.

2.3. Stereo Matching

Stereo matching is conducted using both traditional methods and deep learning methods. Due to the limited space, we mainly review the deep learning methods here. The deep learning methods are mainly divided into two categories. One is the stereo matching algorithm based on cost volume [40,41,42,43,44,45]. The other is the stereo matching algorithm based on the transformer [10,11,12,46].
Regarding cost volume-based methods, Kendall et al. [40] proposed the GC-Net. To better utilize context information, they creatively proposed using 3D convolution to obtain the cost volume and regress the disparity map by matching the cost volume. To better combine context information, Chang et al. [41] proposed the PSM-Net. They introduced a pyramid pooling module to aggregate multi-scale information and obtain the cost volume. To better utilize the contextual information, the cost volume is replicated by 3D CNN for stereo matching. Guo et al. [42] proposed GWCNet based on PSMNet. This method uses group-wise correlation to generate a cost volume and provide a better similarity measure for the network. Zhang et al. [43] proposed the GA-Net based on GC-Net and traditional SGM. The algorithm consists of two neural network layers (semi-global aggregation and locally guided aggregation), which capture the cost dependence of the local image and the whole image, respectively. Xu et al. [44] proposed AANet, which used the sparse point-based intra-scale cost aggregation method instead of 3D convolution for intra-scale cost aggregation to improve the operation speed. Shen et al. [45] proposed a multi-scale cost volume fusion module and an efficient warping volumetric-based disparity refinement module. The stereo matching performance of multi-resolution images is improved, and the difficulty of network search is reduced.
Regarding the tansformer-based method, Li et al. [10] proposed the STTR, which is a method of binocular disparity estimation using a transformer. It uses a transformer to replace traditional cost volume construction. By making full use of contextual information, the occlusion problem is solved effectively, and the limitation of the disparity range is extended. Ding et al. [11] proposed a feature matching transformer depth network architecture, applying the transformer to MVS for the first time. Guo et al. [12] proposed a transformer stereo matching estimation model based on a context enhancement path module. The model performs well in feature extraction in areas missing texture, mirror, and transparency information. Xu et al. [46] proposed a unified model to simultaneously solve three tasks: optical flow estimation, rectified stereo matching, and unrectified stereo depth estimation. The model uses a transformer to realize cross-task migration via cross-attention mechanism learning.
In summary, image-based stereo matching has been thoroughly studied. However, as far as we know, there is no mature binocular stereo matching method based on infrared images.

3. Infrared Depth Dataset

As pointed out in [35], the research progress of stereo vision in the field of computer vision is largely driven by datasets. By calculating metrics such as EPE and D1 using stereo-matching datasets, we can quantitatively measure the algorithm’s performance, thereby providing a clear optimization direction. The dataset constructed in this paper consists of 374 sets of binocular infrared image sequences after stereo correction and corresponding disparity maps of remaining images. When constructing the dataset, we referred to the commonly used stereo-matching datasets, including KITTI 2012 [21], KITTI 2015 [23], and Middlebury 2014 [35]. Referring to the production method of the KITTI2012 dataset in [21], the purpose of using lidar is to provide precise depth values and offer ground truth annotations for the construction of infrared stereo datasets. Compared with these datasets, our infrared stereo dataset is sizable. Its scale is on par with the KITTI 2012 and KITTI 2015 datasets and far exceeds that of the Middlebury 2014 dataset. We collected infrared data on the campus and residential areas. The data depict the library, teaching buildings, cars, and so on. Campus and residential areas include different background elements, such as trees, roads, and fences. These elements introduce rich texture features, lighting conditions, and object permutations and combinations, enhancing the dataset’s ability to represent complex real-world scenes. The raw data described in this paper can be accessed from https://github.com/n1227363905/Infrared-Binocular-Dataset (accessed on 6 June 2025).

3.1. Data Acquisition
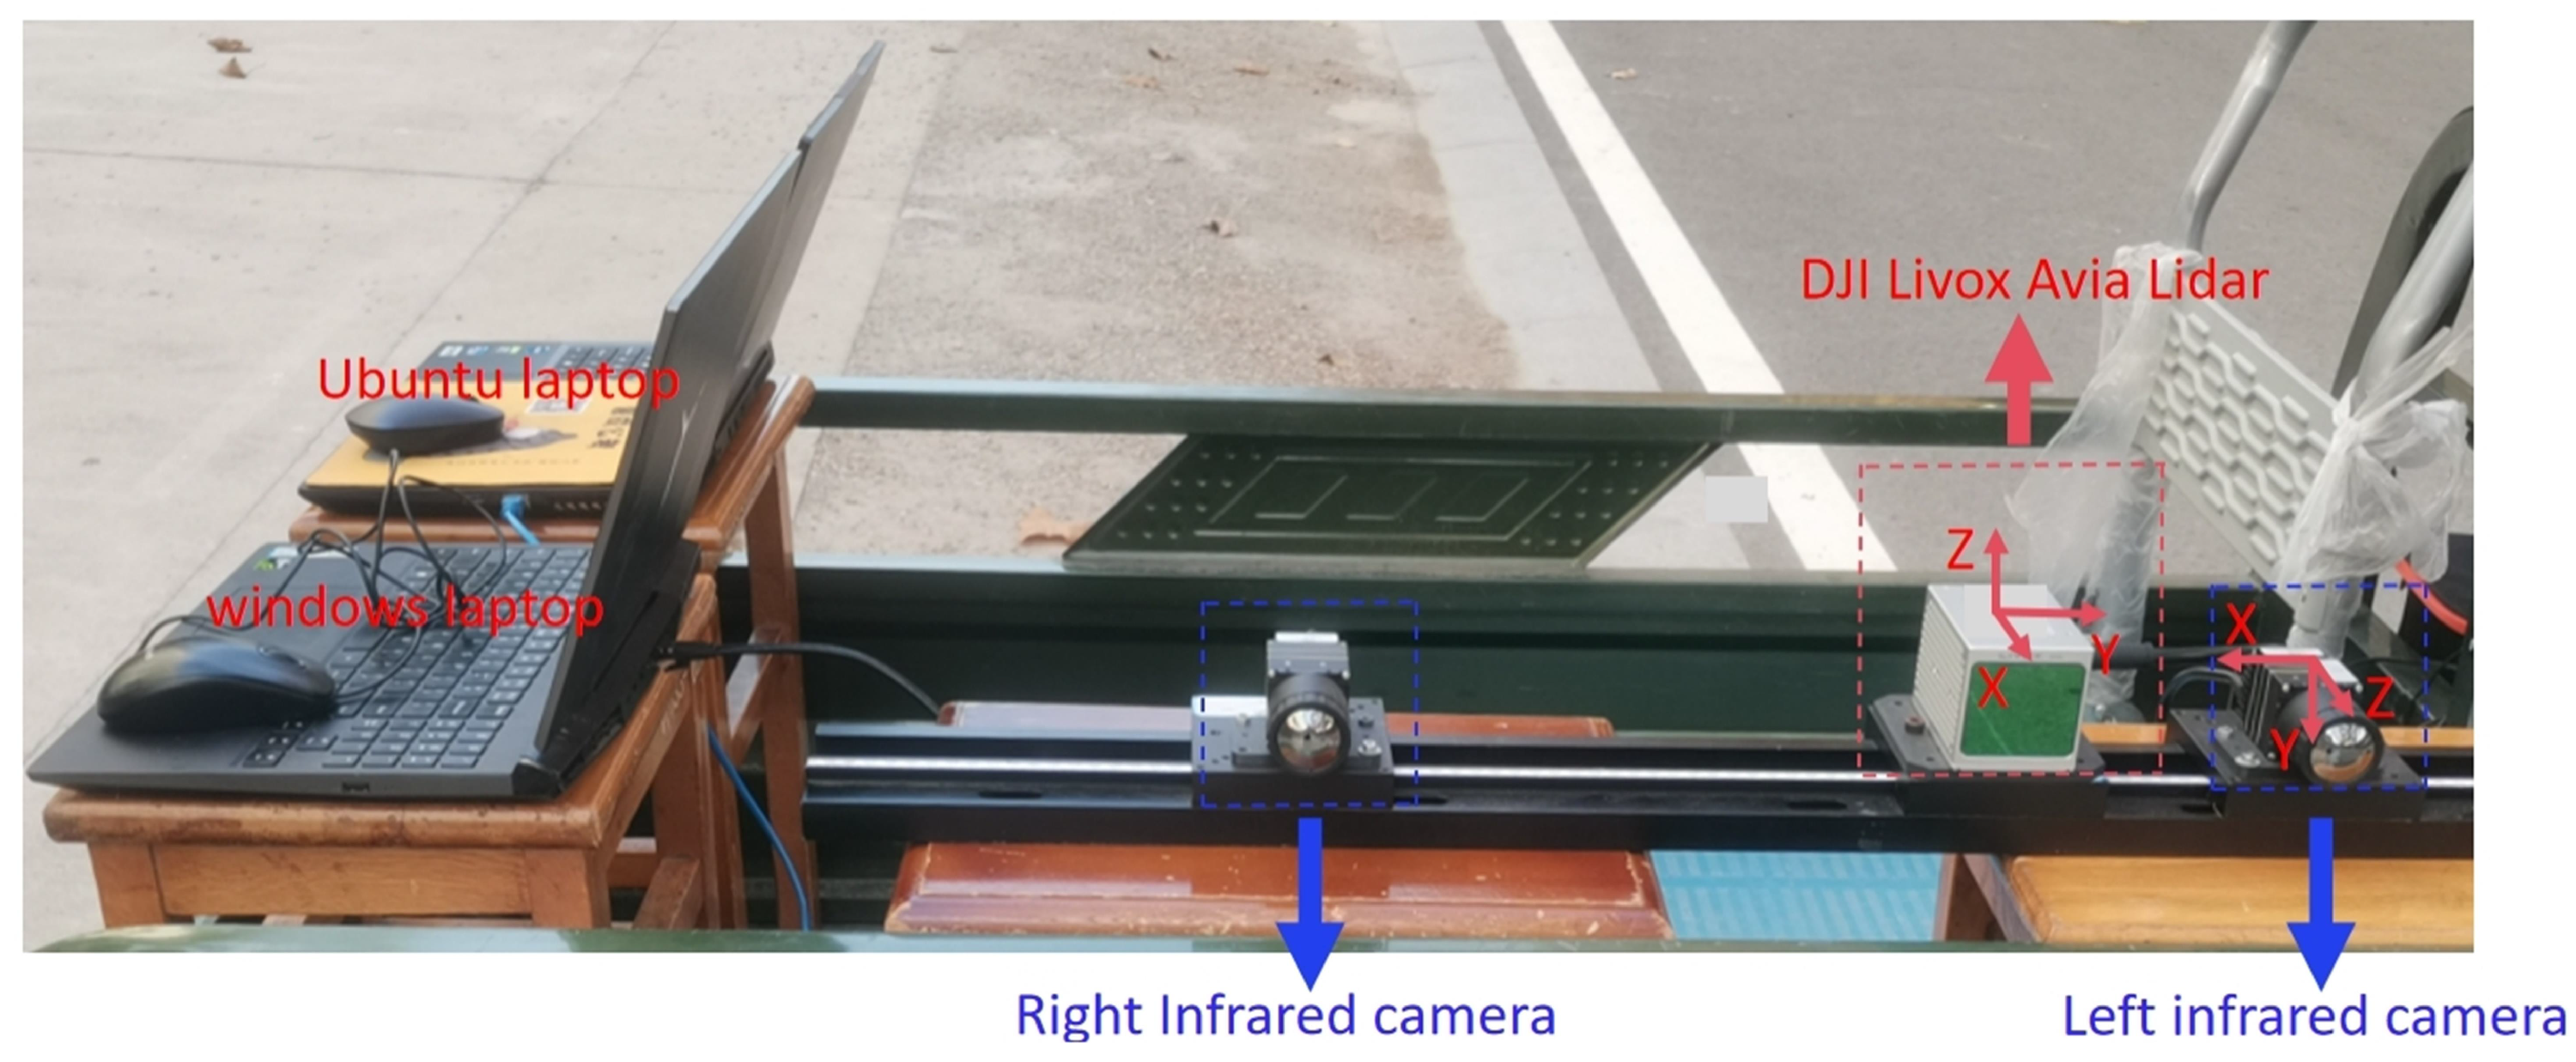
3.1.1. Sensor Setup

Our data acquisition platform is shown in Figure 2.
Two long-wave infrared cameras with a resolution of 640 × 480 (Huajingkang K26E4) operate in a wavelength range and pixel spacing of 8–14 um and 17 um, respectively.
DJI Livox Avia Lidar: wavelength is 950 nm, frequency is 10 Hz, ray divergence angle is 0.28 ° ( vertical ) × 0.03 ° ( horizontal ) , built-in IMU (Model: BMI088), 480,000 points/s in double echo mode, 77.2 ° ( vertical ) × 70.4 ° ( horizontal ) of view in the non-repeat scan mode, and the detection distance is 450 m.
Two laptops with Intel i7 processors running Ubuntu 18.046 and Windows 10 systems, respectively.

3.1.2. Data Acquisition

In this study, two laptops equipped with Intel Core i7 processors were used as terminal devices for data acquisition. Among them, the acquisition of lidar point cloud data was carried out on a laptop installed with the Ubuntu 18.046 LTS operating system. The data were acquired by starting the Robot Operating System (ROS) and using the command line interface. Meanwhile, the acquisition of infrared binocular image data was completed on another laptop running the Windows 10 operating system through the graphical interface provided by the Huajingkang manufacturer. Since the timestamp synchronization function between the systems cannot be automated, this study adopted the method of manually aligning the timestamps to synchronize the acquisition of lidar point cloud and infrared image data.

3.2. Equipment Calibration

3.2.1. Calibration of Infrared Binocular Cameras

Due to the thermal radiation imaging of infrared cameras, the temperature distribution on the surface of objects can be converted into infrared images. Based on this principle, this study designs an infrared calibration plate suitable for natural light environments. This calibration plate is made of infrared radiation materials with different infrared radiation reflectivities. Compared with traditional thermal radiation materials, this new type of calibration plate does not require additional heating materials to distinguish different areas of the checkerboard. In the highly reflective thermal radiation area, the calibration plate can emit infrared rays. Meanwhile, in the low-reflection thermal radiation area, it cannot emit infrared rays. This design effectively avoids the problem of inaccurate corner detection caused by heat conduction in the corner area of self-heating materials, thereby improving the accuracy and reliability of infrared image acquisition.
Using the binocular camera acquisition platform, the previously designed infrared calibration plate was photographed under natural light conditions, and a total of 50 groups of infrared binocular image data were collected. On this basis, the calibration work of the intrinsic and extrinsic parameters of the binocular infrared cameras was completed by minimizing the reprojection error using Zhang’s calibration method [24]. The internal and external parameters of the infrared binocular camera were calculated using the MATLAB R2021b stereo camera calibrator tool. This process not only improves the accuracy of calibration but also provides reliable camera model parameters for subsequent image processing and analysis.

3.2.2. Calibration Between Infrared Camera and Lidar

For the purpose of precisely estimating the relative positional relationship between the infrared camera and the lidar, this study utilizes the approach of manually selecting feature points to extract the essential corresponding points. By default, the left-eye camera is selected as the reference camera for the depth map. As mentioned above, we already obtained the intrinsic parameter matrix and distortion coefficients of the left-eye infrared camera. On this basis, we solved the PnP problem by minimizing the reprojection error using the Levenberg–Marquardt algorithm to facilitate subsequent data processing and analysis [25,26,27,28]. The external parameters of the lidar and infrared camera were calculated using cv::solvePnP(), and the calibration accuracy was evaluated by projecting onto the image plane with the help of the cv::projectPoints. This method can provide us with accurate camera pose information, thereby realizing the effective fusion of infrared camera and lidar data.

3.3. Infrared Image Processing

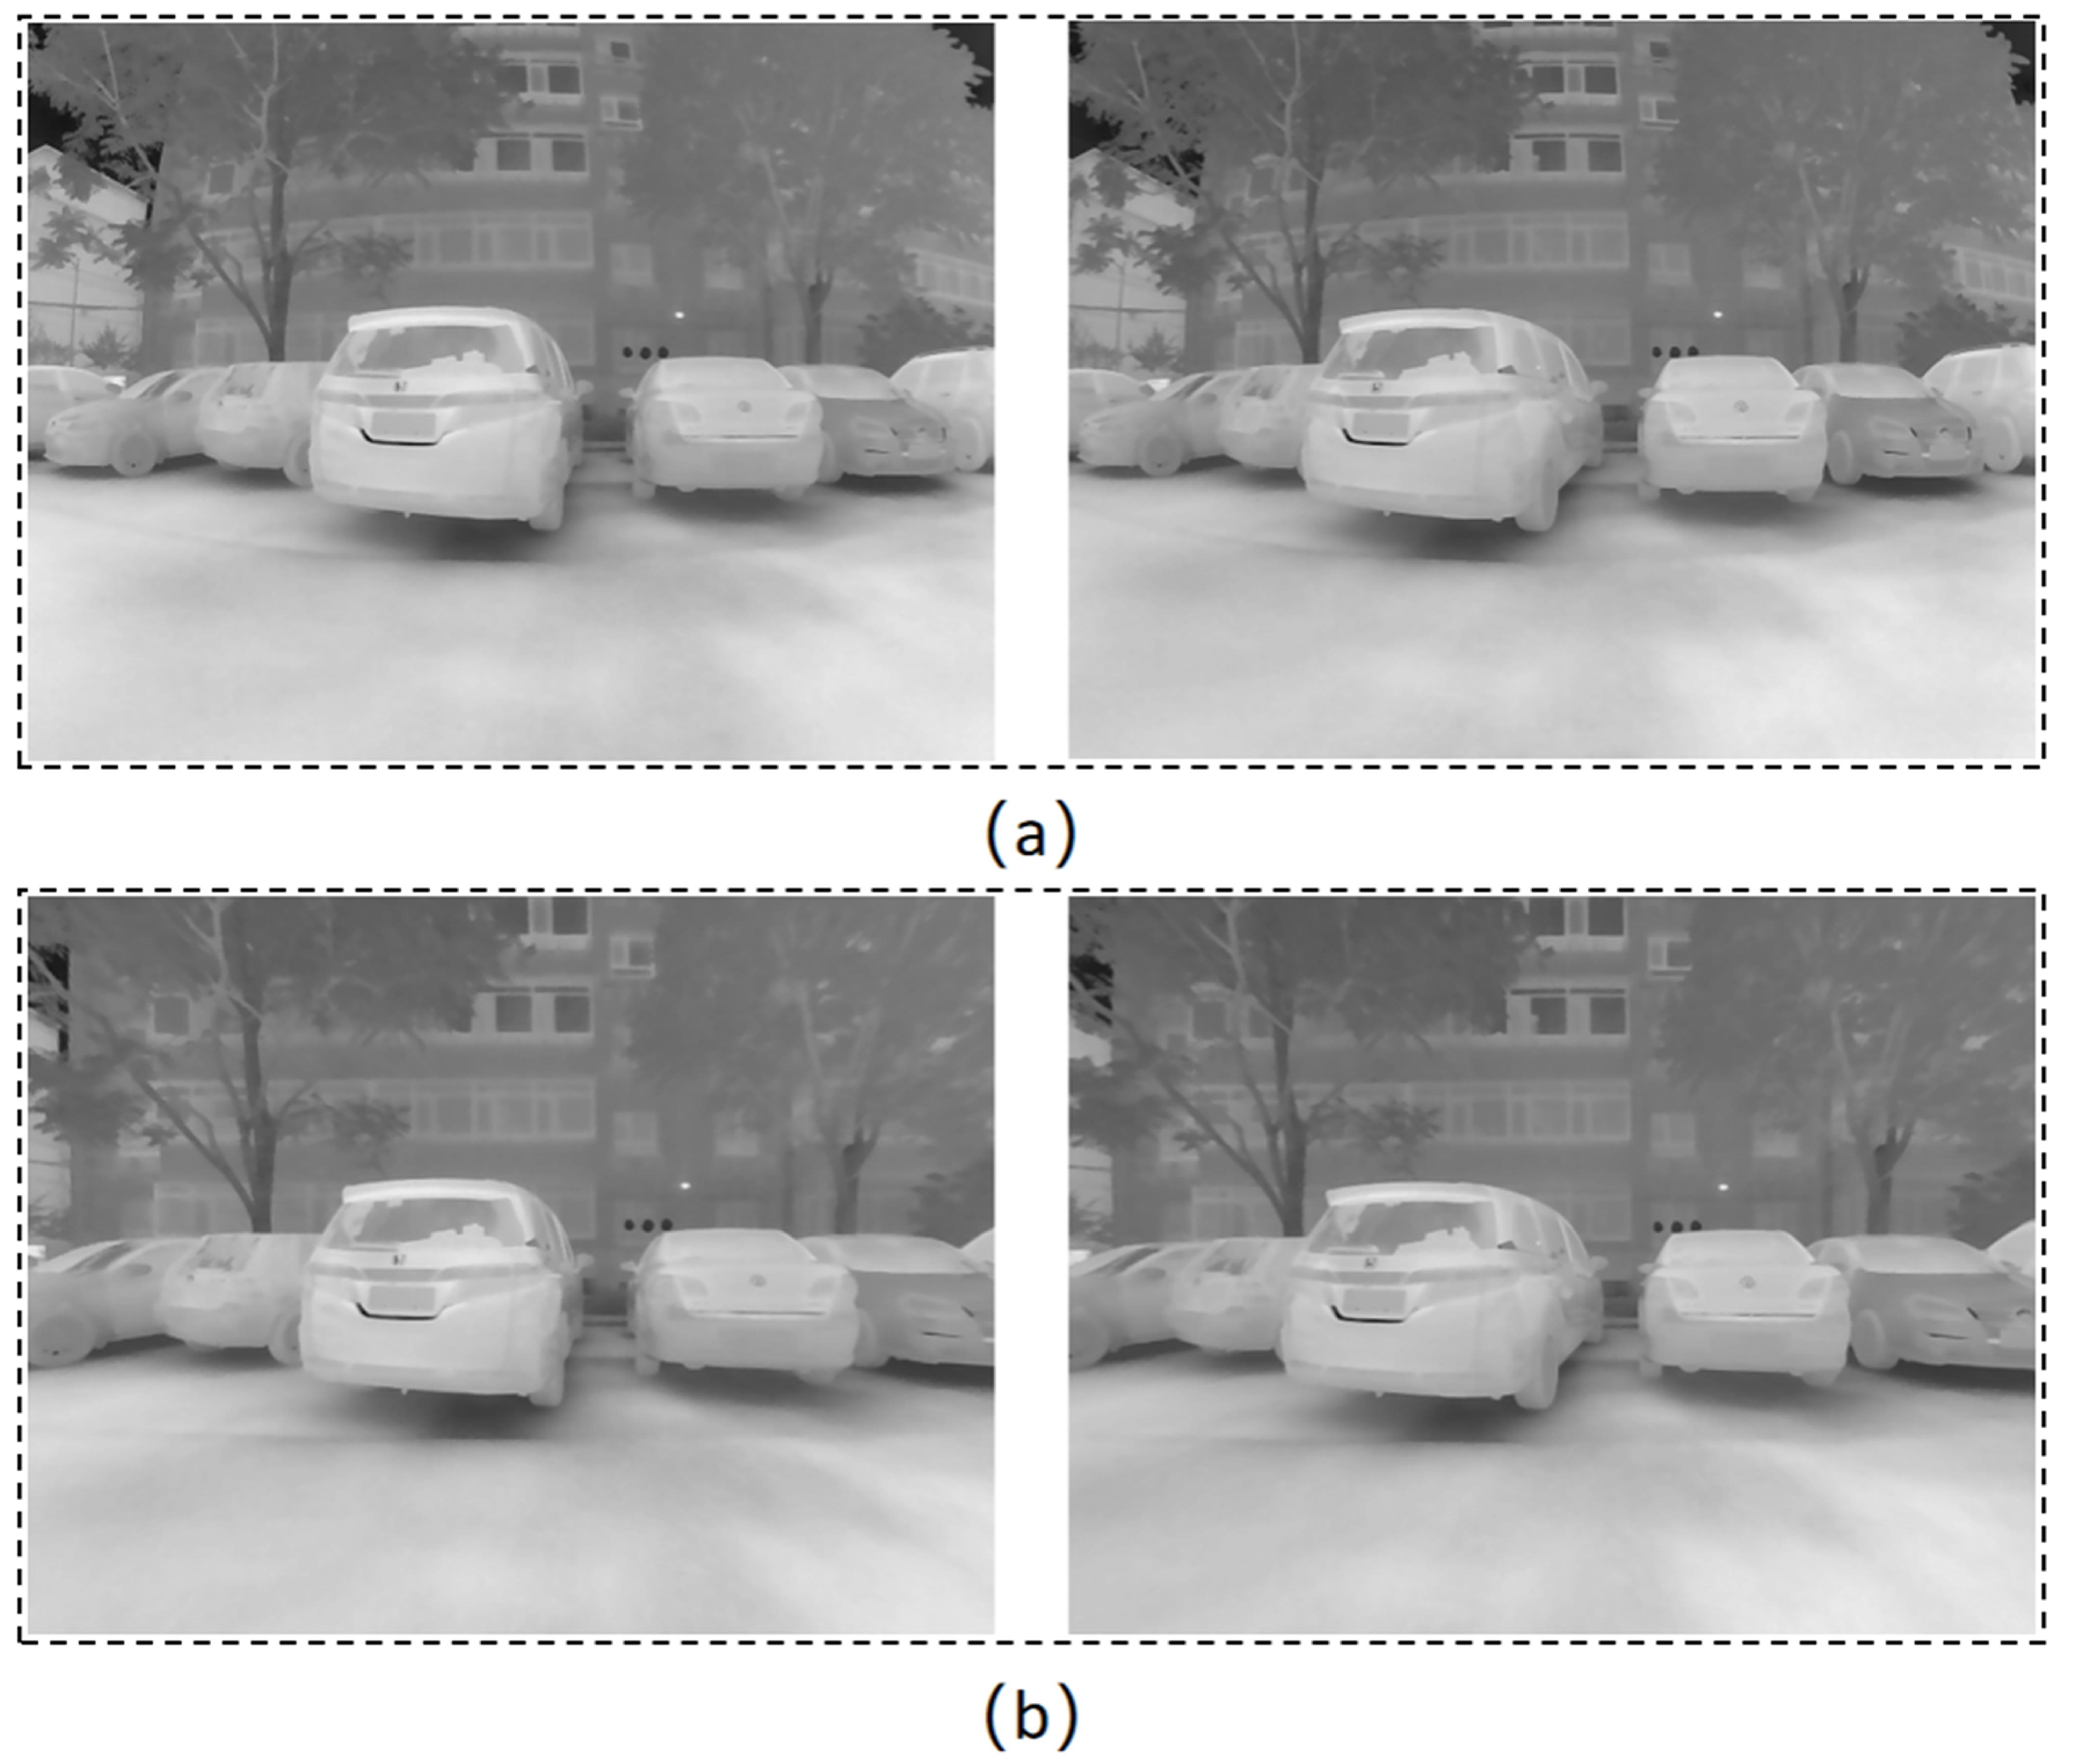
3.3.1. Distortion Removal

Distortion refers to the phenomenon that during the camera imaging process, the pixel points on the imaging plane deviate from the strict camera imaging model in terms of geometric distribution. First, the actual position of each pixel in the distorted image is calculated according to the intrinsic parameter matrix and distortion coefficient of the camera and then using the cv.undistort() to map these pixels back to the undistorted image to eliminate the influence of the distortion. The effect before and after distortion is shown in Figure 3.

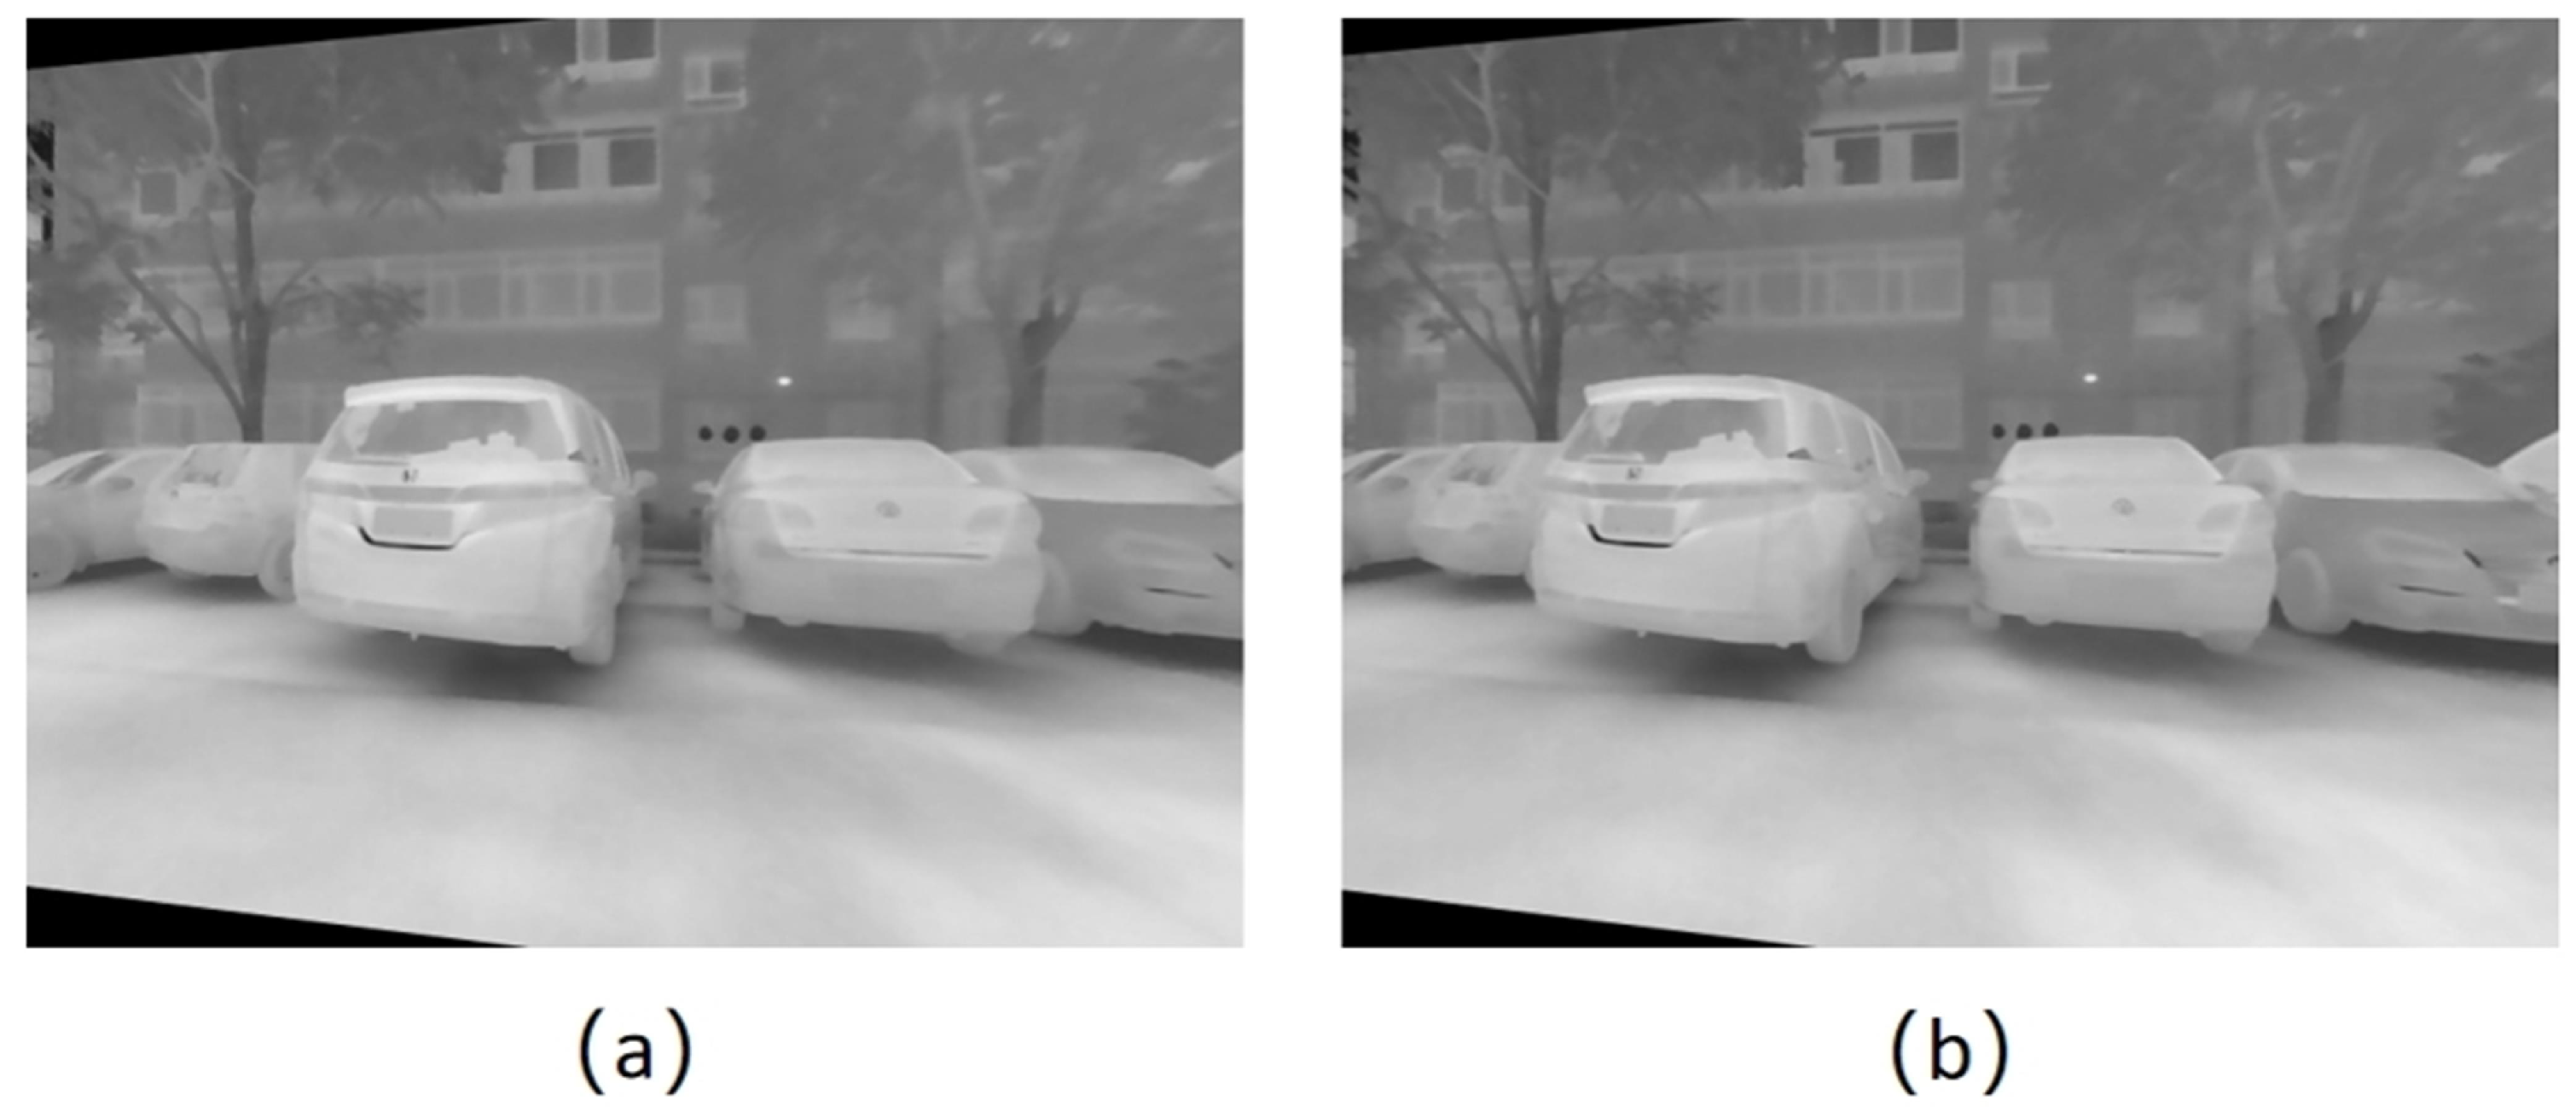
3.3.2. Stereo Rectification

According to the binocular camera calibration results, although the two cameras are fixed on parallel guide rails, the optical axes of these two cameras are not completely parallel. Therefore, a simple distortion removal treatment cannot achieve the ideal parallel view effect. So, it is necessary to perform stereo rectification on the left and right eye images according to the intrinsic and extrinsic parameters of the binocular camera to obtain parallel views. First, the binocular correction transformation matrix is calculated using cv.stereoRectify(), and then cv.initUndistortRectifyMap() is used to generate the mapping table; finally, the cv.remap() is used to complete the polar line correction. This operation can reduce the complexity of searching corresponding points in stereo matching. The stereo correction effect diagram is shown in Figure 4.

3.4. Generation of Disparity Map

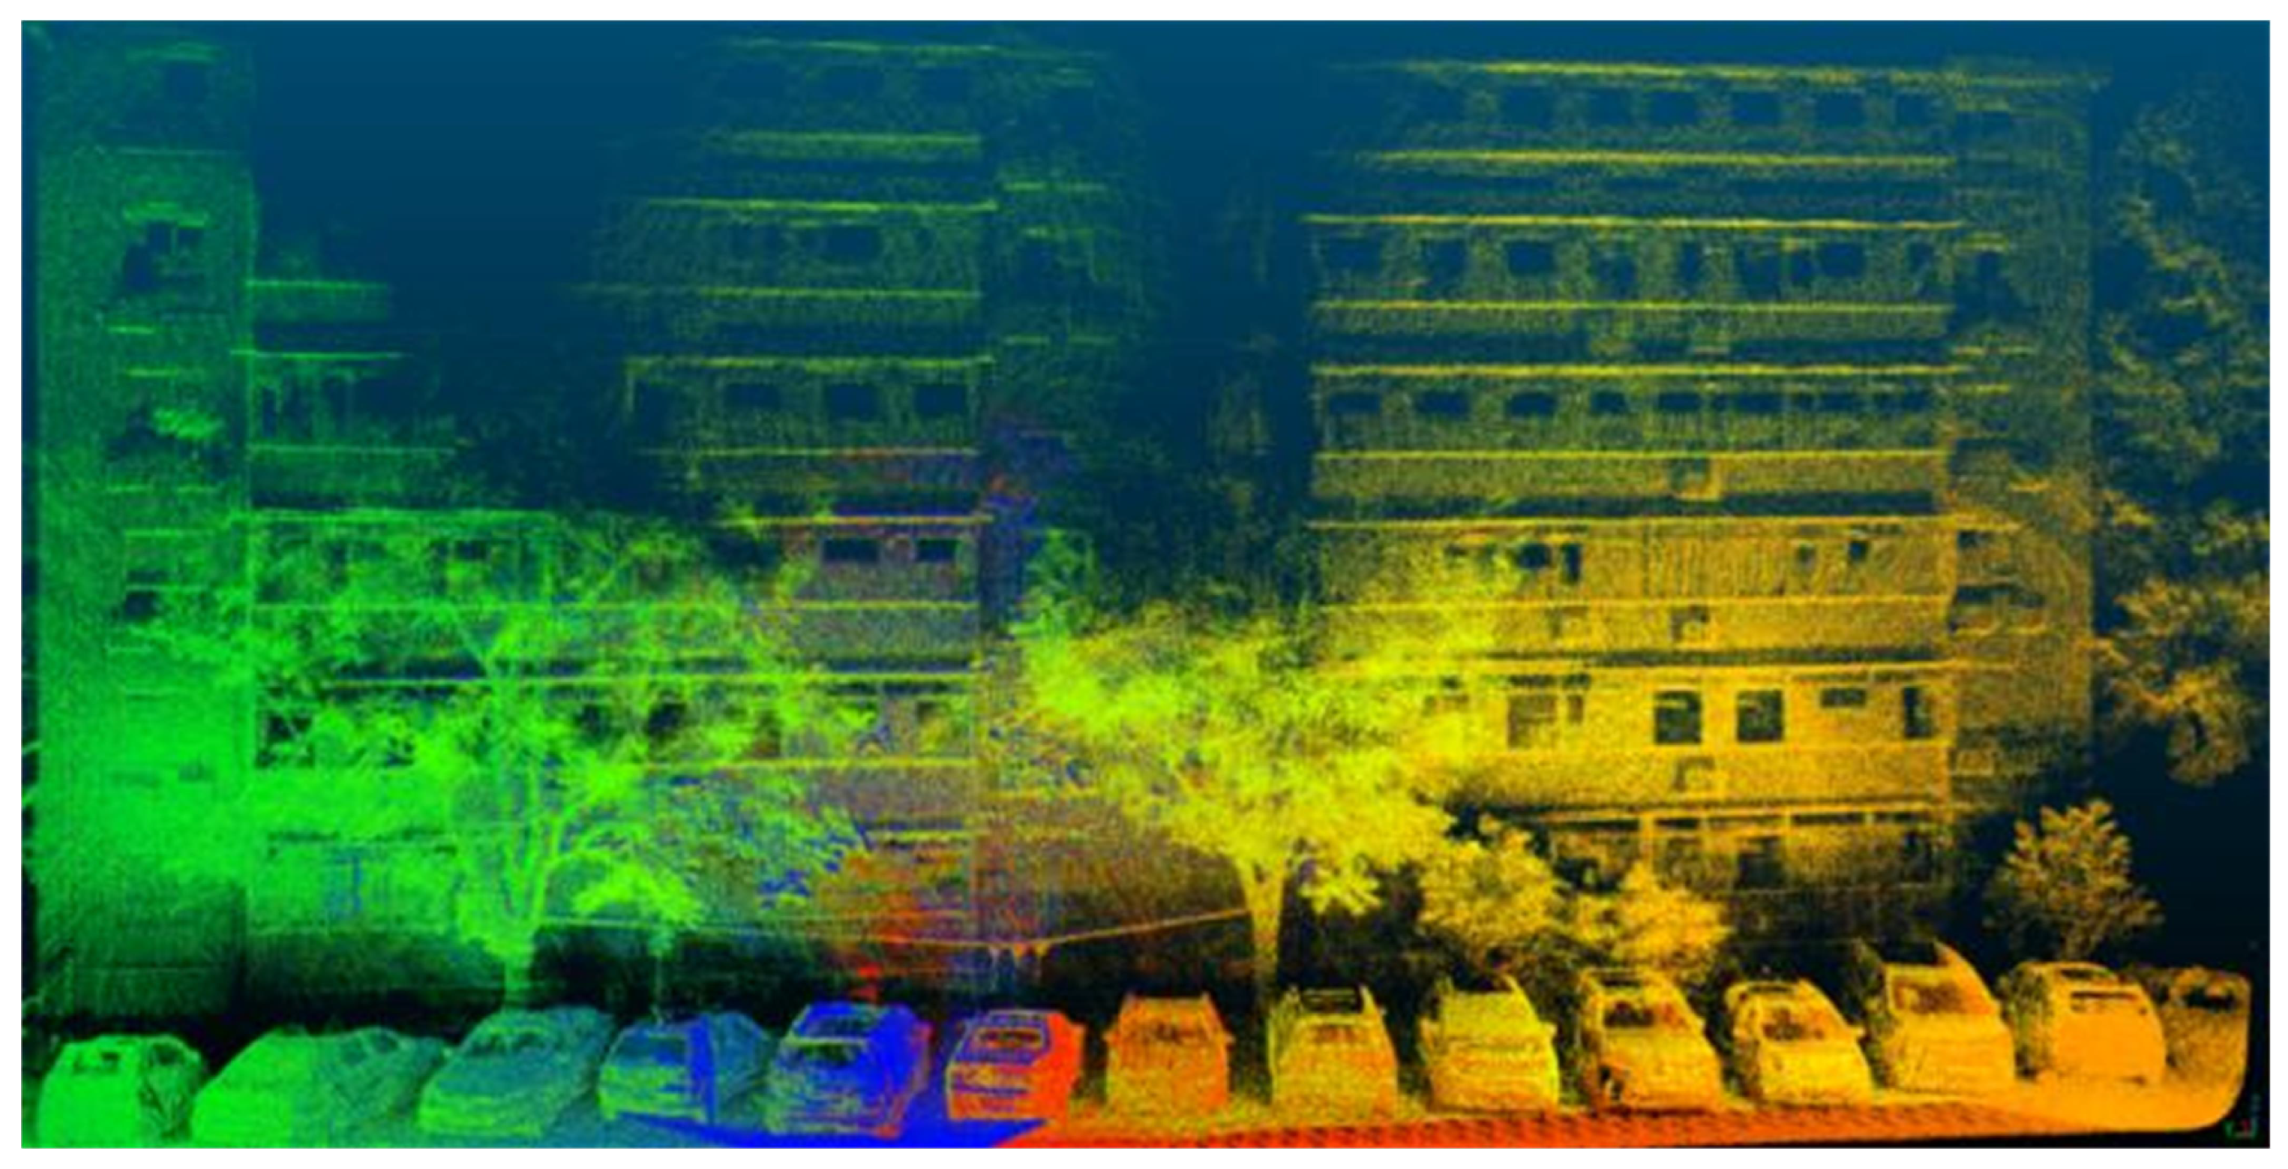
3.4.1. Generation of Lidar Point Cloud Map

Due to the narrow field of view of the lidar, the point cloud density in resolution is lower than that of the infrared camera and is affected by the divergence of the lidar ray. To label as many 3D coordinate objects as possible in the field of view of the infrared camera, it is necessary to process the multi-frame lidar point cloud to generate high-quality point cloud images. The generated point cloud image is shown in Figure 5.
In this paper, we adopt the FAST-LIO proposed by Zhang [47]. It is a laser inertial odometry method based on tightly coupled iterative Kalman filtering and is used to generate the point cloud map. The data source is the laser SLAM bag data packet collected by DJI Livox Avia Lidar. In the FAST-LIO algorithm, the initial location of lidar point cloud acquisition is set as the origin of the world coordinate system of the point cloud map. Since the lidar has built-in IMU, after effective state initialization, the point cloud map drift generated by the collected data through FAST-LIO processing is less than 0.05%.

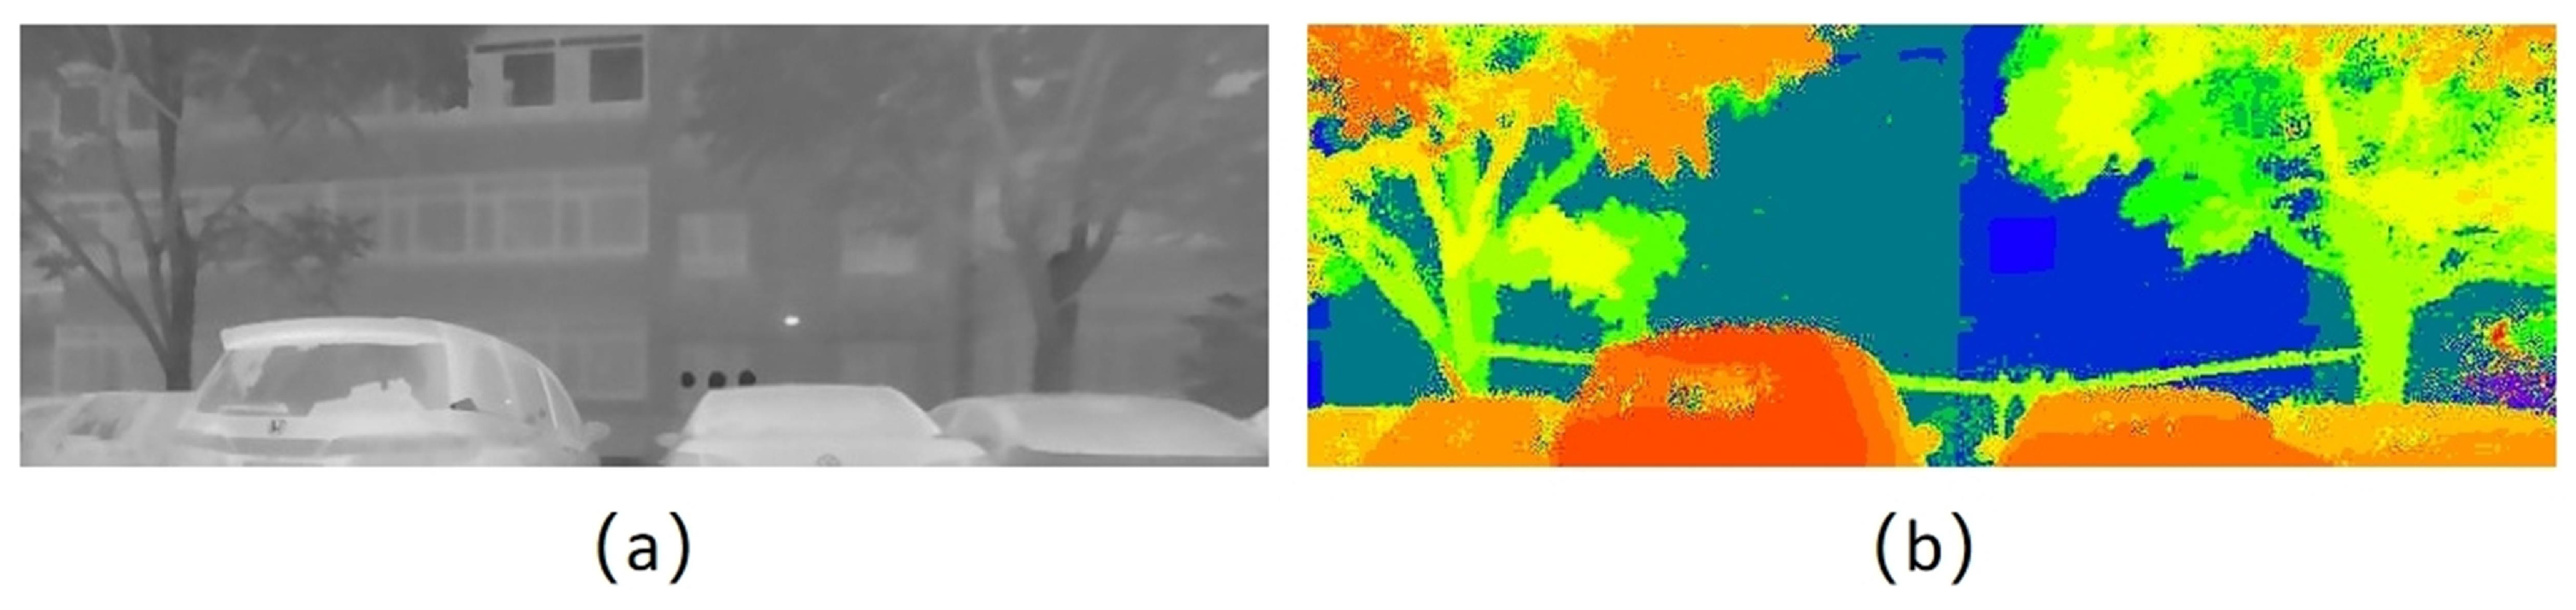
3.4.2. Generation of Depth Map

To obtain the corresponding depth map from the infrared camera image, we need to obtain the projection matrix of the lidar point cloud to the left eye camera plane [29]. The projection matrix is calculated using the calibration results of external parameters between the lidar and infrared camera and the stereo rectification matrix. The 3D coordinates of the lidar point cloud map data are projected into the image coordinate system of the left-eye camera to obtain the corresponding depth value of each pixel.
When mapping the 3D data of the lidar point cloud to the 2D coordinates of the infrared camera, the lidar point cloud data can provide high-precision three-dimensional spatial information for the infrared image. In the depth map generation stage, the three-dimensional points of the lidar point cloud are projected onto the two-dimensional image plane through cv.projectPoints() to achieve the conversion from the point cloud to the depth map. The projection transformation can be expressed as
μ υ 1 = f x 0 c x 0 f y c y 0 0 0 r 11 r 12 r 13 t 1 r 21 r 22 r 23 t 2 r 31 r 32 r 33 t 3 x y z 1 .
where ( x , y , z ) and ( u , v ) represent lidar point cloud coordinates and infrared camera image pixel coordinates, respectively, and ( t 1 , t 2 , t 3 ) represent the translation from the origin of the lidar coordinate system to the origin of the infrared camera coordinate system.
The projected depth diagram is shown in Figure 6. However, the characteristics of lidar point cloud and infrared image data are quite different. The laser point cloud data are sparse and unevenly distributed. The infrared image data are relatively dense and continuous. Therefore, mapping lidar point cloud data to the pixel positions of dense images requires necessary interpolation, which affects the accurate acquisition of infrared image depth values. In this process, we need to explain the following three points.
In the real scene, the object scanned by laser has an occlusion phenomenon. When multiple lidar points cover the same pixel, we select the point with the smaller depth value as the corresponding depth value of the pixel.
The depth of the surface of an object in a real scene is usually relatively continuous in a local area. So, when the point cloud cannot cover all the pixels, we fill in the void locations with an average depth of 8 pixels to obtain a more complete depth map.
The semi-solid lidar used in this paper has a detection blind area when it is less than 3 m.

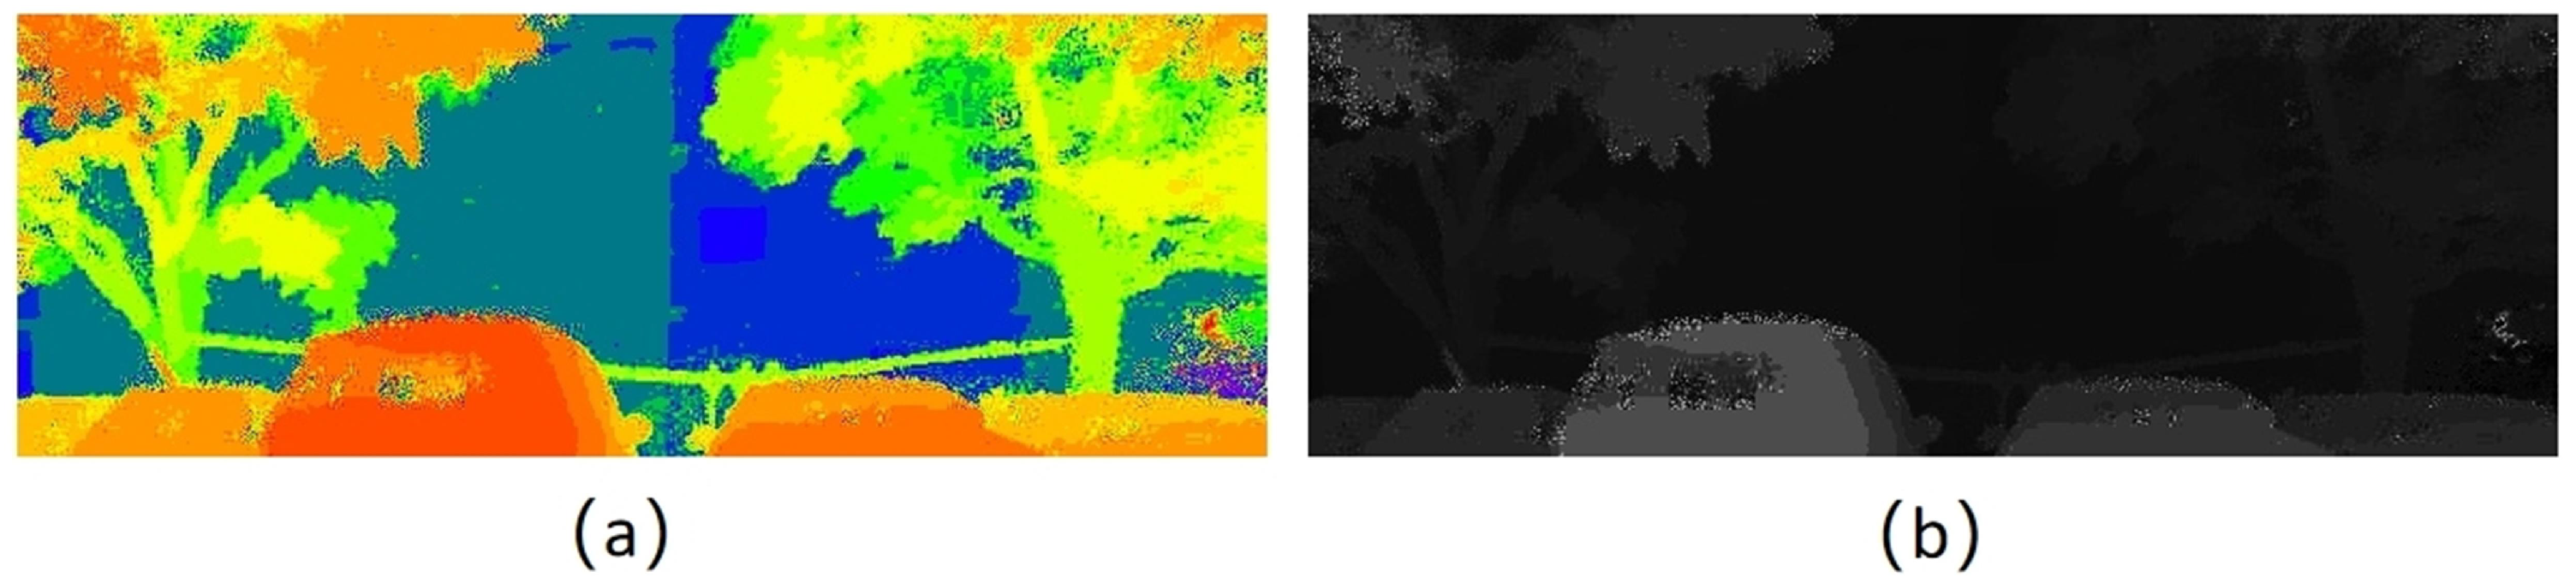
3.4.3. Generation of Disparity Map

In stereo matching related tasks, it is necessary to further convert the depth map into a disparity map for the quantitative evaluation of stereo matching algorithms. The generation of disparity maps is based on the implementation of the disparity calculation in Equation (2) using the NumPy library, and the ground truth of the disparity map is saved through cv.imwrite(). The disparity map is shown in Figure 7. According to the binocular stereo vision principle shown in Figure 8, the disparity value can be expressed as
d i s p = f b z .
Among them, f represents the focal length of the camera, b represents the baseline length, and z represents the depth.

4. Proposed Method

We proposed a new architecture, named ICVT (Integration of Cost Volume and Transformer). This method solves the stereo-matching problem of infrared images by integrating local feature extraction (Cost Volume) and global context modeling (Transformer). Furthermore, we introduced the Perspective Positional Encoding (PPE) module on the basis of ICVT to form the ICVT-PPE method in order to enhance the depth perception ability. In Section 4.1, we introduce the infrared binocular stereo matching network proposed in this paper by combining the transformer and cost volume. In Section 4.2, we introduce the transformer module because this paper focuses on innovation in the transformer positional encoding section. In Section 4.3, we introduce the transformer perspective projection positional encoding design, which allows each pixel to be associated with a different projected ray.

4.1. Stereo Matching Network Combined with Transformer and Cost Volume

Figure 1 shows the transformer network architecture based on infrared binocular vision stereo matching. This architecture is mainly divided into three core modules: the cost volume feature extraction module, the transformer feature extraction module, and the stereo matching estimation module. The features extracted by the first two modules are fused by the third module. This method can improve the performance of the infrared binocular stereo matching network significantly by combining the cost volume with the transformer. The main reason for this is that the cost volume is used to extract local features, and the transformer is used to capture global features. Since this paper focuses on innovation in the transformer section, we specifically introduce the transformer module in Section 4.2.

4.2. Transformer Network Architecture

The transformer module proposed by the infrared binocular stereo-matching network is based on self-attention and cross-attention and uses them alternately for feature extraction and matching. Self-attention is used to model the feature relationship along the polar line direction within a single image and extract the context information. Cross-attention calculates the feature relationship along the polar line direction of the left and right images for feature matching of the left and right images, preparing the matching for the best transmission. This scheme of alternating the use of self-attention and cross-attention can utilize the image context information to interact features with the left and right images and continuously update the features. The self-attention and cross-attention proposed in this paper both adopt the multi-head attention mechanism. The multi-head attention mechanism divides the input features into multiple heads according to their dimensions and calculates the attention. Assuming the dimension of the input features is d and the number of heads is n, then the dimension of each head is d i = d / n . Each head performs a linear transformation on the input feature ( F ) , respectively, to generate the query vector ( Q i ) , key vector ( K i ) , and value vector ( V i ) , which are expressed as
Q i = F W i Q + b i Q
K i = F W i K + b i K
V i = F W i V + b i V .
Among them, the weight matrices are W i Q , W i K , and W i V R d i × d i , and the bias vectors are b i Q , b i K , and b i V R d i . It is worth noting that the parallel projection model is widely used in the attention calculation of the transformer module in stereo matching networks, which simplifies the calculation but has certain limitations. We use the projection vector to represent the perspective projection model, which is connected to V i in the above formula through a convolutional layer and embedded into the attention calculation. Make each pixel associated with a different projected ray. The result of attention calculation can be expressed as
a i = s o f t max Q i K i d · c o n v V i v .
Among them, d is the scaling factors introduced to avoid the vanishing gradient caused by excessive dot product, and v R d i represents the perspective projection vector (for a specific introduction, see Section 4.3). ⊕ represents the splicing operation. Calculate the attention respectively, and finally concatenate them together. The output vector V0 can be expressed as
V 0 = W 0 c o n t a c t a 1 , a 2 , a n + b 0 .
Among them, the weight matrix is W 0 R d i , and the bias vector is W 0 R d i . After adding the output vector to the original feature F to form a residual connection, the final feature is obtained and expressed as
F = F + V 0 .
In the self-attention layer, Q i , K i and V i originate from the same image. In the cross-attention layer, Q i comes from the source image, and K i and V i come from the target image, enabling information interaction between different images on the left and right.

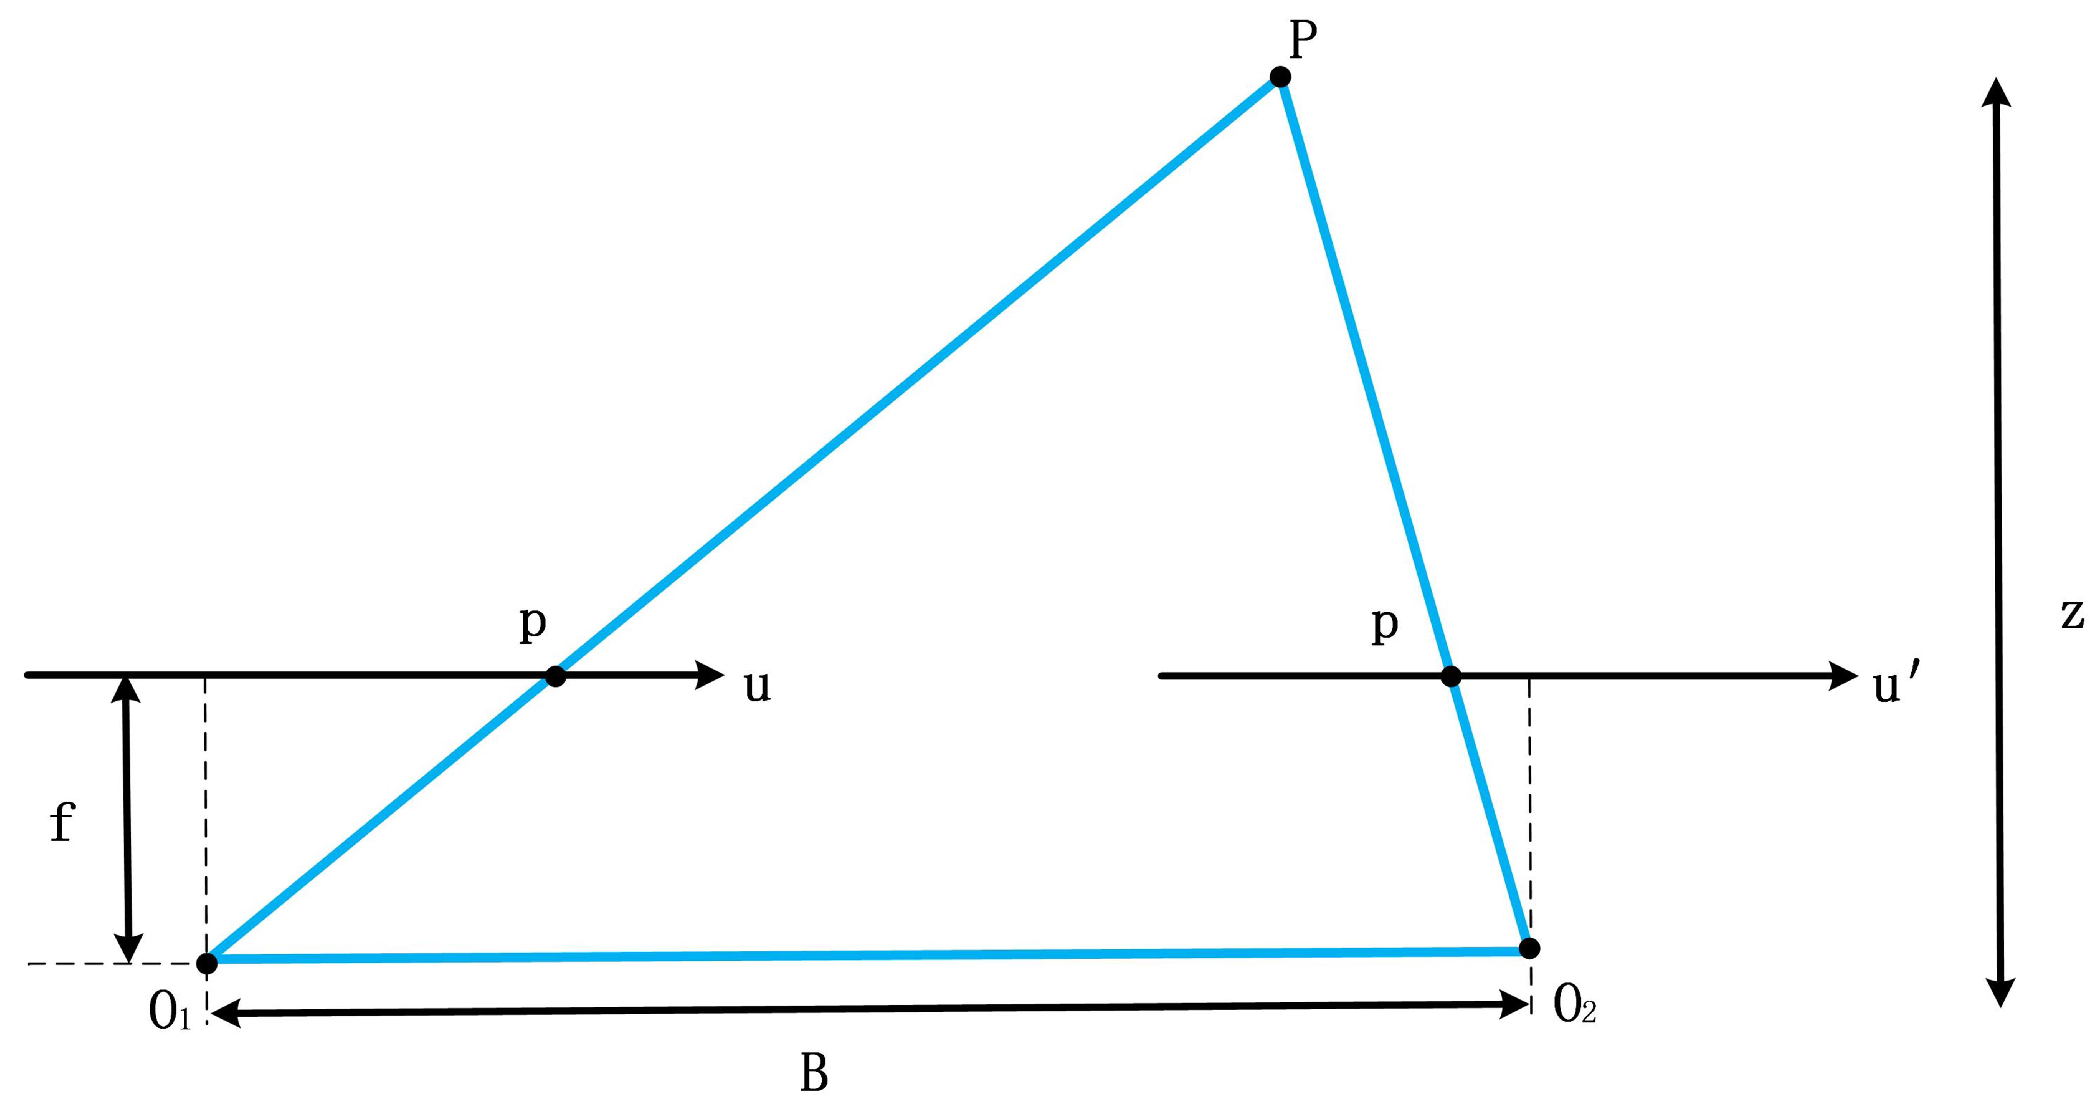
4.3. Perspective Projection for Transformer Positional Encoding

In the design of the stereo matching deep learning network, the traditional method often adopts the parallel projection model. The parallel projection model assumes that there is no difference in the image of the object along the ray direction at a long distance. This model cannot effectively capture the imaging characteristics of near objects appearing large and far objects appearing small in perspective projection, limiting the network’s accurate estimation of the scene’s depth information. The proposed transformer module cleverly simulates the perspective projection model through the principal point coordinates and focal length information of the camera and imparts it into the positional encoding of the attention mechanism. According to the perspective projection imaging principle, the 3D point coordinates in the camera coordinate system are converted to the image pixel coordinate system by using the intrinsic parameter matrix of the camera, which can be expressed as
f x 0 0 0 f y 0 0 0 1 X c Y c Z c = Z c u c x v c y 1 .
Among them, X c , Y c , Z c represent the coordinates of 3D points in the camera coordinate system, and ( u , v ) represent the coordinates of corresponding points in the image pixel coordinate system. Using Equation (9), we can derive the following equation:
Z c u c x f x v c y f y 1 = X c Y c Z c .
It can be seen that when the focal length is 1 and the origin is on the optical axis, the corresponding normalized pixel coordinates can be represented by
u * v * 1 = u c x f x v c y f y 1 .
When the infrared camera pixels used in this article are square, f x and f y are equal. We uniformly represent it as f. In the normalized coordinate system, z is 1. Given the coordinates of the principal point and the focal length f, the direction components v x , v y , and v z represented by each pixel in the perspective projection model can be calculated using the pixel coordinates ( u , x ) . Specifically, in the normalized coordinate system, the u and v coordinates, respectively, represent v x , v y , and the value of v z is 1. Therefore, the perspective projection vector can be expressed as
v = c o n t a c t v x , v y , v z .
We embedded the normalized planar pixel coordinates of Equation (11) into the positional encoding part of the attention mechanism to simulate the imaging process of the perspective projection camera [30]. This positional encoding allows each pixel to be associated with a different projected ray, thus capturing the geometric features of each pixel in the image more precisely. It can effectively solve the problem of feature extraction and matching caused by insufficient texture information in infrared images and significantly improve the matching accuracy.

5. Experiments

5.1. Experiments Setup

Evaluation metrics. To accurately measure the performance of the network in disparity estimation, we chose three evaluation metrics: the endpoint error (EPE), the percentage of outliers for 3-pixel disparity (D1-3px) [10], and the percentage of mismatched points for 1-pixel error (BMP-1px) [31]. Through the comprehensive evaluation of these metrics, the actual effect of the proposed network in processing disparity estimation can be objectively reflected.
Usage of datasets. Our infrared 3D dataset consists of 374 stereo image pairs with marked disparity maps. In this study, to avoid the risk of overfitting and truly reflect the network’s actual performance, we divided 90% of the dataset into the training set and 10% into the test set.
Implementation details. During the training process, the network goes through a total of 200 rounds of training. The learning rate of transformer-based part is initialized to 0.0002. The learning rate of the cost-volume-based part is initialized to 0.002, and the learning rate of the backbone network is initialized to 0.0002. The experiment was conducted on the Ubuntu 18.046 operating system workstation equipped with NVIDIA GeForce RTX 4090 GPU, and the configuration environment was Python 3.8.19, CUDA 11.7, and PyTorch 2.0.0. Through this well-designed network architecture and optimized training strategy, the stereo matching task can achieve significant performance improvement and provide a new solution for the stereo matching field of infrared binocular stereo vision.

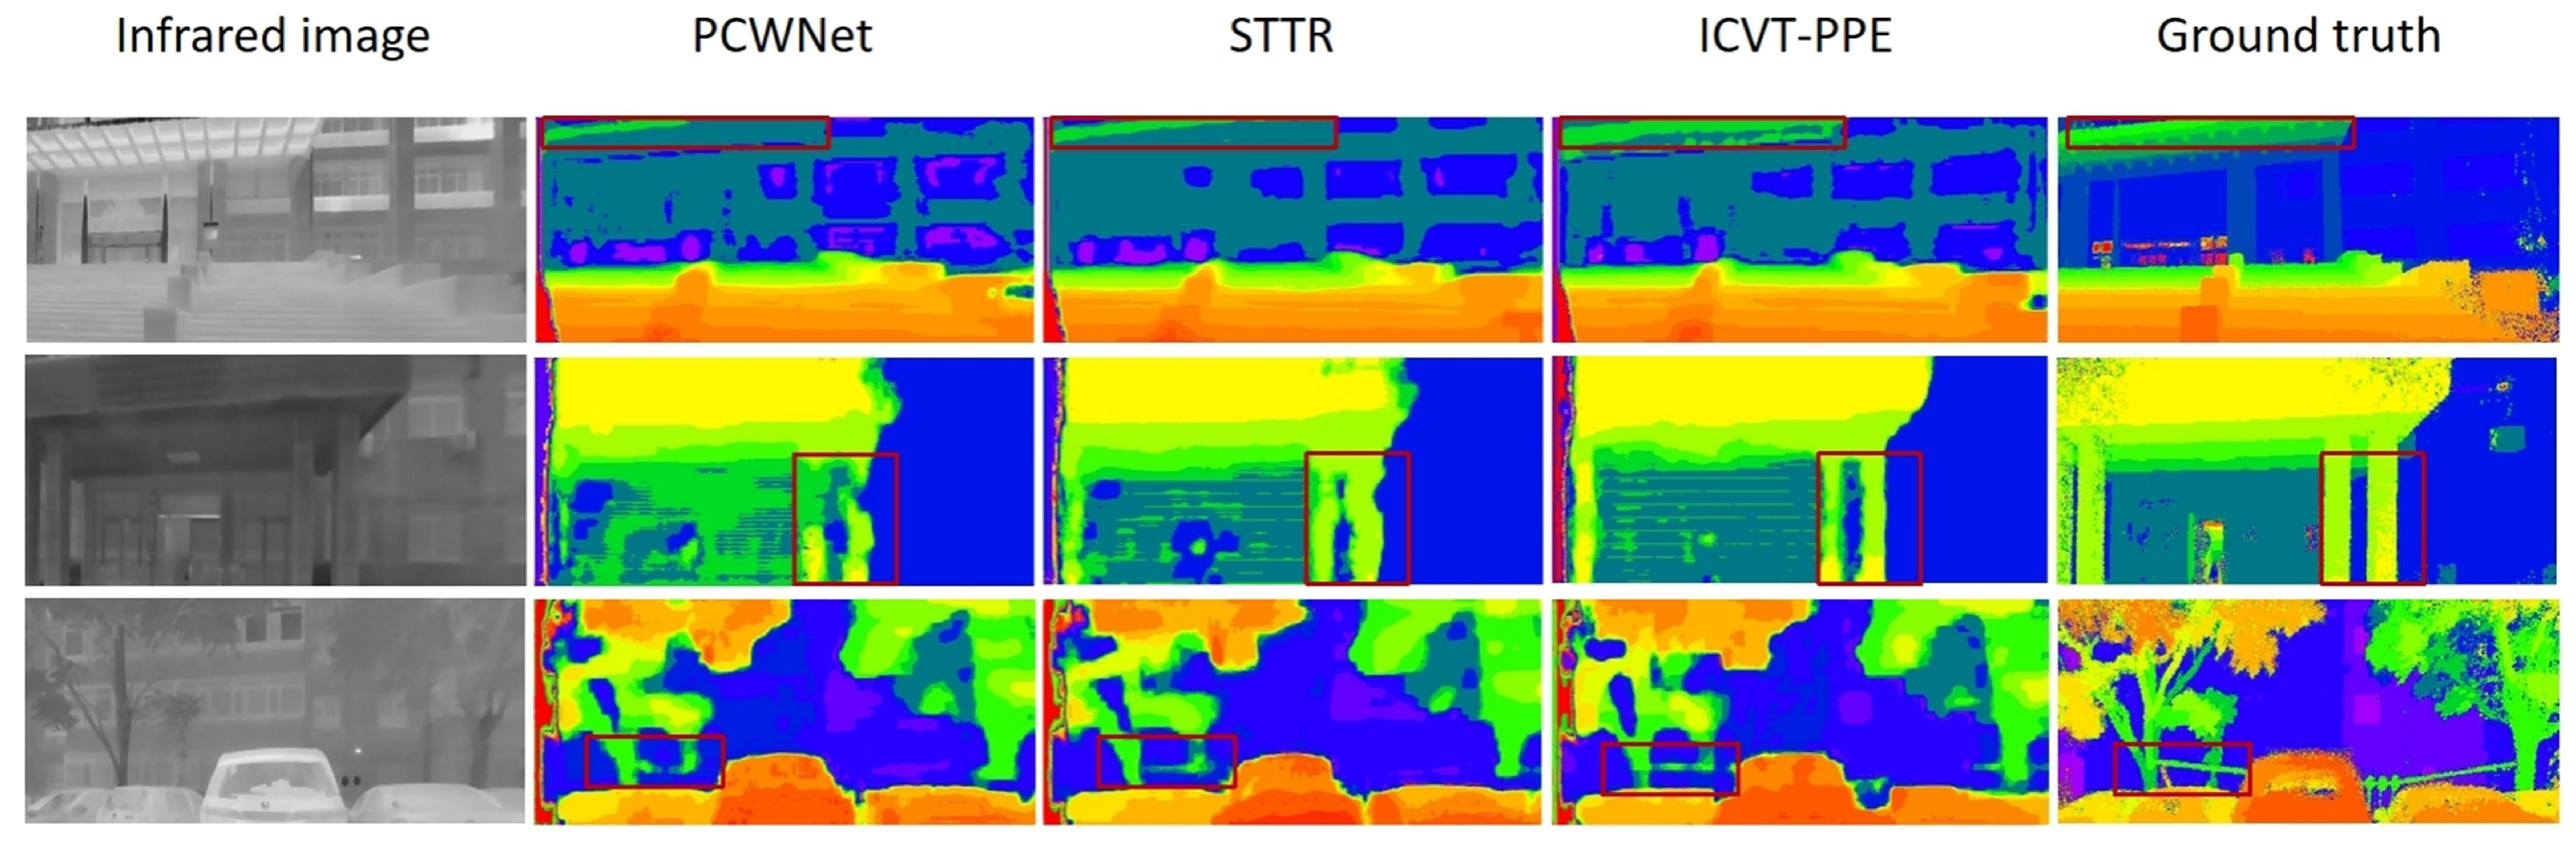
5.2. Comparison with Baselines
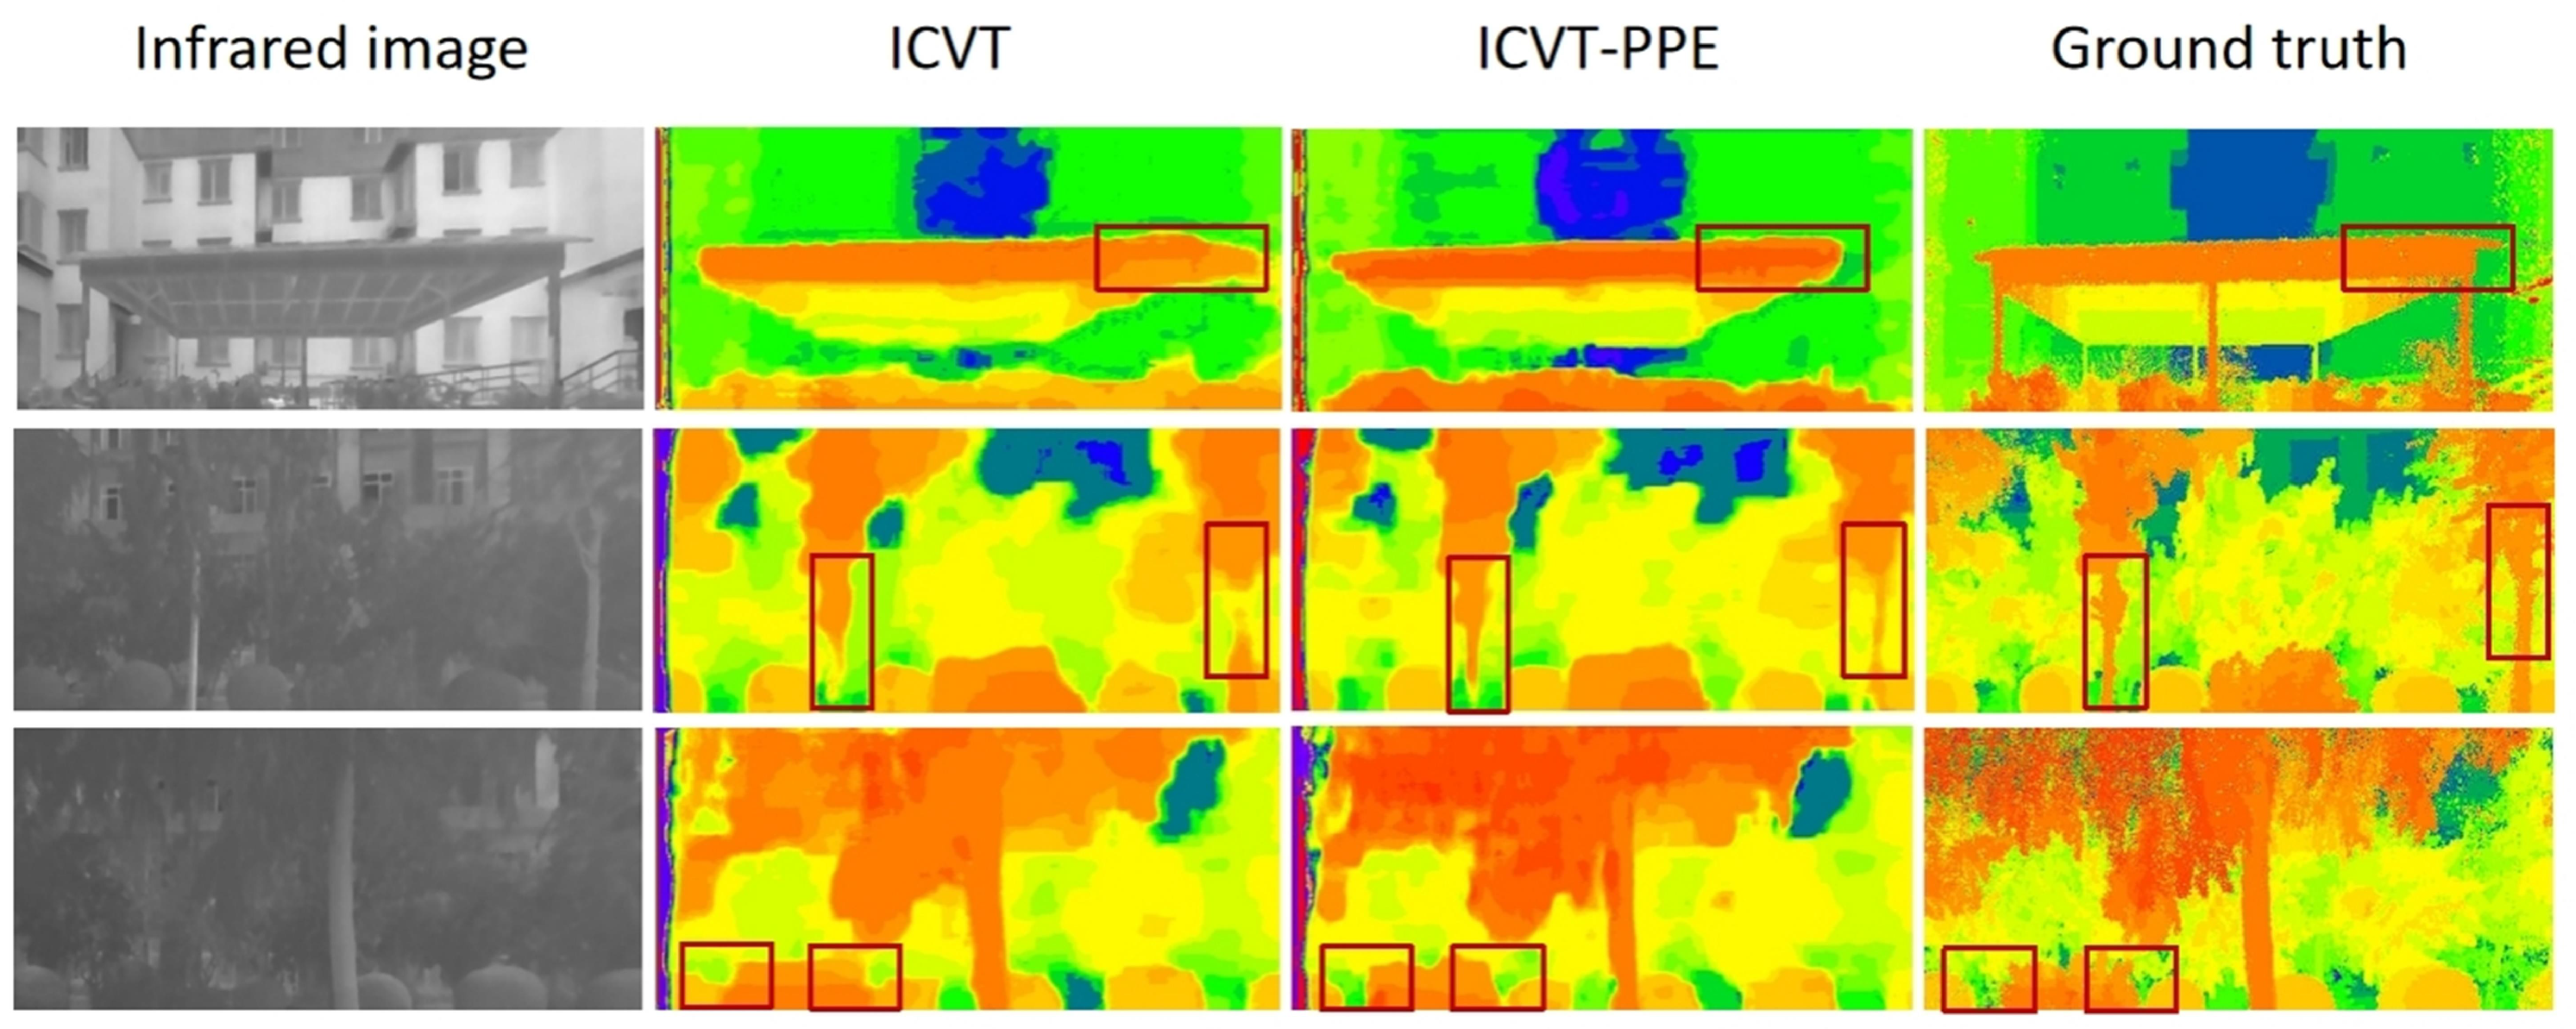
Methods for comparison. We denote our method that fuses the cost volume and transformer by ICVT-PPE. ICVT represents the integration of the cost volume and transformer method. PPE represents the perspective positional encoding module. Given that there is no mature method suitable for infrared stereo matching, we treat STTR [10] and PCWNet [45], which are originally designed for RGB images, as the baselines for comparison. We compare our method with these baselines as follows.
The experimental results are presented as shown in Table 1. Compared with PCWNet, ICVT-PPE has an improvement of 55.3% in EPE (from 2.799 to 1.25), 55.5% in D1-3px (from 0.242 to 0.1076), and 62.6% in BMP-1px (from 0.5123 to 0.1918). Compared with STTR, ICVT-PPE has an improvement of 11.5% in EPE (from 1.4125 to 1.25), 8.9% in D1-3px (from 0.1181 to 0.1076), and 17.0% in BMP-1px (from 0.231 to 0.1918).
As shown in the experimental results of Table 1, the infrared stereo matching scheme is deeply integrated with the transformer, and the cost volume demonstrates significant performance advantages. This is specifically reflected in the outstanding performance in three dimensions: global feature capture, local feature extraction, and dual-module collaborative optimization.
Global feature capture. In the following section, we analyze these results. For one thing, the transformer module shows a strong global feature extraction capability in stereo matching tasks. Through the attention mechanism, it can fully capture the correlation information between different regions of the image when processing stereo image data so as to build a comprehensive contextual understanding. This global information helps to identify the feature correspondence across a large spatial range in stereo image pairs, avoiding missing important matching clues due to local visual field limitation.
Local feature extraction. The cost volume module focuses on the capture and analysis of local features. It can accurately process the detailed information in the local area of the image and provide accurate basic data for feature matching. Specifically, when processing infrared images, the cost volume can effectively focus on local features such as the edges and textures of the target object. By determining the similarities and differences of these local features in stereo image pairs, the foundation is laid for accurate disparity calculation.
Dual-module collaborative optimization. As shown in Figure 9, when combined with the cost volume, the transformer provides complementary advantages. The global information provided by the transformer guides the cost volume to better encode the overall direction in the local feature extraction process so that it does not fall into the local optimal solution. Specifically, the fusion method based on the cost volume and transformer has obvious advantages in the face of complex infrared scenes (such as multiple overlapping objects or irregularly shaped objects in the image). Therefore, the above method can improve the adaptability of the whole stereo matching network to complex scenes. At the same time, rich local features extracted from the cost volume also provide more solid detail support for the construction of global features in the transformer, making global features not only a vague overall impression but also a comprehensive expression of rich local details.
Moreover, our designed transformer’s perspective-based location encoding module can further improve the performance of the proposed method. A detailed discussion about the effectiveness of PPE is provided in the next subsection.

5.3. Ablation Study

To verify the effectiveness of the PPE module, we conducted an ablation study. The quantitative results are provided in Table 1. We compared ICVT-PPE with ICVT. Compared to ICVT, ICVT-PPE had an improvement of 4.5% in EPE (from 1.309 to 1.25), 8.8% in D1-3px (from 0.118 to 0.1076), and 11.1% in BMP-1px (from 0.2157 to 0.1918). The specific comparison effect diagram is presented in Figure 10. By means of the positional encoding part, ICVT-PPE effectively enhances the disparity estimation performance of the infrared binocular stereo matching network. In the next part, we analyze in detail how to improve the disparity estimation accuracy of infrared binocular images after embedding the attention mechanism in the perspective projection model.
Differentiated processing of projected light. The existing work in the positional encoding of the transformer usually uses a parallel projection model to simplify the calculation. The PPE module is based on the actual perspective projection model so that each pixel is associated with a different projected ray.
3D spatial position modeling. The PPE module based on perspective projection position coding adopts optical geometric principles to construct a depth-aware correlation relationship between pixels. This module describes the coordinate transformation process of the points on the object surface projected onto the imaging plane. Therefore, we achieved high-precision spatial perception in the depth dimension by modeling the mapping relationship between the object’s spatial coordinates and the image’s pixel coordinates.
Feature matching optimization. During the attention calculation process, the PPE module can flexibly adjust the weights and matching strategies of features based on depth differences. For objects of different depths, their pixel features are assigned different weights. Therefore, the feature matching step can significantly improve the accuracy of feature matching and the precision of depth estimation.
As shown in Figure 10, when applied to infrared images with poor texture information, this method can effectively solve the difficulty of feature extraction and matching caused by limited texture information. The disparity estimation performance of the infrared binocular stereo matching network is significantly improved.

6. Conclusions

In this paper, an infrared stereo benchmark is constructed using a lidar point cloud. The construction of this dataset includes tasks such as calibrating extrinsic parameters between lidar and infrared camera using the PnP method, mapping lidar coordinates to the image coordinate system, and converting depth maps to disparity maps. The dataset provides the possibility of a quantitative evaluation of stereo matching tasks in infrared binocular images.
In addition, this research proposes an innovative perspective projection positional encoding-based transformer method to complete the infrared binocular stereo matching task. In this method, a stereo matching network combined with the transformer and cost volume is constructed. The existing work extensively uses the parallel projection model, which simplifies the calculation as an approximation but has some limitations. In contrast, we use a perspective projection model in the positional encoding part so that each pixel is associated with a different projection ray. This effectively solves the problem of feature extraction and matching caused by insufficient texture information in infrared images and significantly improves the matching accuracy. We conducted experiments based on the infrared binocular stereo matching dataset proposed in this paper. Experiments demonstrated the effectiveness of the proposed method.

Author Contributions

Conceptualization, Y.N., L.L. and S.C.; data curation, C.Z., Y.J. and T.A.; formal analysis, Z.Z.; funding acquisition, F.H.; methodology, L.L.; writing—original draft, Y.N.; writing—review and editing, Y.N., L.L. and J.M. All authors have read and agreed to the published version of the manuscript.

Funding

This research was funded by the National Natural Science Foundation of China (Grant No. 62171467).

Data Availability Statement

The original contributions presented in the study are included in the article, further inquiries can be directed to the corresponding author.

Conflicts of Interest

The authors declare no conflicts of interest.

References

  1. Haris, M.; Watanabe, T.; Fan, L.; Widyanto, M.R.; Nobuhara, H. Superresolution for UAV Images via Adaptive Multiple Sparse Representation and Its Application to 3-D Reconstruction. IEEE Trans. Geosci. Remote Sens. 2017, 55, 4047–4058. [Google Scholar] [CrossRef]
  2. Li, X.; Wang, M.; Fang, Y. Height Estimation From Single Aerial Images Using a Deep Ordinal Regression Network. IEEE Geosci. Remote Sens. Lett. 2020, 19, 6000205. [Google Scholar] [CrossRef]
  3. Cui, Y.; Li, Q.; Yang, B.; Xiao, W.; Chen, C.; Dong, Z. Automatic 3-D Reconstruction of Indoor Environment With Mobile Laser Scanning Point Clouds. IEEE J. Sel. Top. Appl. Earth Obs. Remote Sens. 2019, 12, 3117–3130. [Google Scholar] [CrossRef]
  4. Miclea, V.-C.; Nedevschi, S. Monocular Depth Estimation With Improved Long-Range Accuracy for UAV Environment Perception. IEEE Trans. Geosci. Remote Sens. 2021, 60, 5602215. [Google Scholar] [CrossRef]
  5. Li, W.; Hu, Z.; Meng, L.; Wang, J.; Zheng, J.; Dong, R.; He, C.; Xia, G.S.; Fu, H.; Lin, D. Weakly Supervised 3-D Building Reconstruction From Monocular Remote Sensing Images. IEEE Trans. Geosci. Remote Sens. 2024, 62, 5615315. [Google Scholar] [CrossRef]
  6. Zhao, G.; Cai, W.; Wang, Z.; Wu, H.; Peng, Y.; Cheng, L. Phenotypic Parameters Estimation of Plants Using Deep Learning-Based 3-D Reconstruction From Single RGB Image. IEEE Geosci. Remote Sens. Lett. 2022, 19, 2506705. [Google Scholar] [CrossRef]
  7. Jiang, L.; Wang, F.; Zhang, W.; Li, P.; You, H.; Xiang, Y. Rethinking the Key Factors for the Generalization of Remote Sensing Stereo Matching Networks. IEEE J. Sel. Top. Appl. Earth Obs. Remote Sens. 2025, 18, 4936–4948. [Google Scholar] [CrossRef]
  8. Khurshid, M.; Shahzad, M.; Khattak, H.A.; Malik, M.I.; Fraz, M.M. Vision-Based 3-D Localization of UAV Using Deep Image Matching. IEEE J. Sel. Top. Appl. Earth Obs. Remote Sens. 2024, 17, 12020–12030. [Google Scholar] [CrossRef]
  9. Peng, Y.; Yang, M.; Zhao, G.; Cao, G. Binocular-Vision-Based Structure from Motion for 3-D Reconstruction of Plants. IEEE Geosci. Remote Sens. Lett. 2022, 19, 8019505. [Google Scholar] [CrossRef]
  10. Li, Z.; Liu, X.; Drenkow, N.; Ding, A.; Creighton, F.X.; Taylor, R.H.; Unberath, M. Revisiting Stereo Depth Estimation From a Sequence-to-Sequence Perspective with Transformers. In Proceedings of the IEEE/CVF International Conference on Computer Vision, Montreal, QC, Canada, 10–17 October 2021; pp. 6177–6186. [Google Scholar]
  11. Ding, Y.; Yuan, W.; Zhu, Q.; Zhang, H.; Liu, X.; Wang, Y.; Liu, X. TransMVSNet: Global Context-aware Multi-view Stereo Network with Transformers. In Proceedings of the 2022 IEEE/CVF Conference on Computer Vision and Pattern Recognition (CVPR), New Orleans, LA, USA, 18–24 June 2022; pp. 8575–8584. [Google Scholar]
  12. Guo, W.; Li, Z.; Yang, Y.; Wang, Z.; Taylor, R.H.; Unberath, M.; Yuille, A.; Li, Y. Context-Enhanced Stereo Transformer. In Proceedings of the European Conference on Computer Vision, Tel Aviv, Israel, 23–27 October 2022; pp. 263–279. [Google Scholar]
  13. Lin, D.; Bannehr, L.; Ulrich, C.; Maas, H. Evaluating Thermal Attribute Mapping Strategies for Oblique Airborne Photogrammetric System AOS-Tx8. Remote Sens. 2020, 12, 112. [Google Scholar] [CrossRef]
  14. Ham, Y.; Golparvar-Fard, M. An automated vision-based method for rapid 3D energy performance modeling of existing buildings using thermal and digital imagery. Adv. Eng. Inform. 2013, 27, 395–409. [Google Scholar] [CrossRef]
  15. Vidas, S.; Moghadam, P. HeatWave: A handheld 3D thermography system for energy auditing. Energy Build. 2013, 66, 445–560. [Google Scholar] [CrossRef]
  16. Vidas, S.; Moghadam, P.; Sridharan, S. Real-Time Mobile 3D Temperature Mapping. IEEE Sens. J. 2015, 15, 1145–1152. [Google Scholar] [CrossRef]
  17. Yang, M.; Su, T.; Lin, H. Fusion of Infrared Thermal Image and Visible Image for 3D Thermal Model Reconstruction Using Smartphone Sensors. Sensors 2018, 18, 2003. [Google Scholar] [CrossRef]
  18. Hoegner, L.; Stilla, U. Thermal leakage detection on building facades using infrared textures generated by mobile mapping. In Proceedings of the 2009 Joint Urban Remote Sensing Event, Shanghai, China, 20–22 May 2009; pp. 1–6. [Google Scholar]
  19. Hoegner, L.; Stilla, U. Mobile thermal mapping for matching of infrared images with 3D building models and 3D point clouds. Quant. Infrared. Thermogr. J. 2018, 15, 252–270. [Google Scholar] [CrossRef]
  20. Cho, Y.; Ham, Y.; Golpavar-Fard, M. 3D as-is building energy modeling and diagnostics: A review of the state-of-the-art. Adv. Eng. Inform. 2015, 29, 184–195. [Google Scholar] [CrossRef]
  21. Peng, Y.; Yang, M.; Zhao, G.; Cao, G. Vision meets robotics: The KITTI dataset. Int. J. Rob. Res. 2013, 32, 1231–1237. [Google Scholar]
  22. Geiger, A.; Lenz, P.; Urtasun, R. Are we ready for autonomous driving? The KITTI vision benchmark suite. In Proceedings of the 2012 IEEE Conference on Computer Vision and Pattern Recognition, Providence, RI, USA, 16–21 June 2012; pp. 3354–3361. [Google Scholar]
  23. Menze, M.; Geiger, A. Object scene flow for autonomous vehicles. In Proceedings of the Conference on Computer Vision and Pattern Recognition (CVPR), Boston, MA, USA, 7–12 June 2015; pp. 3061–3070. [Google Scholar]
  24. Zhang, Z. Flexible camera calibration by viewing a plane from unknown orientations. In Proceedings of the Seventh IEEE International Conference on Computer Vision, Kerkyra, Greece, 20–27 September 1999; pp. 666–673. [Google Scholar]
  25. Lepetit, V.; Moreno-Noguer, F.; Fua, P. EPnP: An Accurate O(n) Solution to the PnP Problem. Int. J. Comput. Vis. 2009, 81, 155–166. [Google Scholar] [CrossRef]
  26. Hesch, J.A.; Roumeliotis, S.I. A Direct Least-Squares (DLS) method for PnP. In Proceedings of the IEEE International Conference on Computer Vision (ICCV 2011), Barcelona, Spain, 6–13 November 2021; pp. 383–390. [Google Scholar]
  27. Kneip, L.; Li, H.; Seo, Y. UPnP: An Optimal O(n) Solution to the Absolute Pose Problem with Universal Applicability. In Proceedings of the European Conference on Computer Vision, Zurich, Switzerland, 6–12 September 2014; pp. 127–142. [Google Scholar]
  28. Huang, C.; Guan, H.; Jiang, A.; Zhang, Y.; Spratling, M.; Wang, Y.F. Registration Based Few-Shot Anomaly Detection. In Proceedings of the European Conference on Computer Vision (ECCV 2022), Cham, Switzerland, 6 November 2022; pp. 303–319. [Google Scholar]
  29. Nie, L.; Lin, C.; Liao, K.; Liu, S.; Zhao, Y. Depth-Aware Multi-Grid Deep Homography Estimation With Contextual Correlation. IEEE Trans. Circuits Syst. 2022, 32, 4460–4472. [Google Scholar] [CrossRef]
  30. Huang, T.; Li, H.; He, K.; Sui, C.; Li, B.; Liu, Y.H. Learning Accurate 3D Shape Based on Stereo Polarimetric Imaging. In Proceedings of the IEEE/CVF Conference on Computer Vision and Pattern Recognition, Vancouver, BC, Canada, 17–24 June 2023; pp. 17287–17296. [Google Scholar]
  31. Scharstein, D.; Szeliski, R.; Zabih, R. A taxonomy and evaluation of dense two-frame stereo correspondence algorithms. In Proceedings of the IEEE Workshop on Stereo and Multi-Baseline Vision (SMBV 2001), Kauai, HI, USA, 9–10 December 2001; pp. 131–140. [Google Scholar]
  32. Scharstein, D.; Szeliski, R. High-accuracy stereo depth maps using structured light. In Proceedings of the 2003 IEEE Computer Society Conference on Computer Vision and Pattern Recognition, Madison, WI, USA, 18–20 June 2003; pp. 195–202. [Google Scholar]
  33. Scharstein, D.; Pal, C. Learning Conditional Random Fields for Stereo. In Proceedings of the 2007 IEEE Conference on Computer Vision and Pattern Recognition, Minneapolis, MN, USA, 17–22 June 2007; pp. 1–8. [Google Scholar]
  34. Hirschmuller, H.; Scharstein, D. Evaluation of Cost Functions for Stereo Matching. In Proceedings of the IEEE Conference on Computer Vision and Pattern Recognition, Minneapolis, MN, USA, 17–22 June 2007; pp. 1–8. [Google Scholar]
  35. Scharstein, D.; Hirschmüller, H.; Kitajima, Y.; Krathwohl, G.; Nešić, N.; Wang, X.; Westling, P. High-Resolution Stereo Datasets with Subpixel-Accurate Ground Truth. In Proceedings of the Pattern Recognition: 36th German Conference, GCPR 2014, Münster, Germany, 2–5 September 2014; pp. 31–42. [Google Scholar]
  36. Allan, M.; Mcleod, J.; Wang, C.; Rosenthal, J.C.; Hu, Z.; Gard, N.; Eisert, P.; Fu, K.X.; Zeffiro, T.; Xia, W.; et al. Stereo Correspondence And Reconstruction of Endoscopic Data. arXiv 2021, arXiv:2101.01133. [Google Scholar]
  37. Shi, Z.; Fan, N.; Yeung, D.Y.; Chen, Q. Stereo Waterdrop Removal with Row-wise Dilated Attention. In Proceedings of the 2021 IEEE/RSJ International Conference on Intelligent Robots and Systems (IROS), Prague, Czech Republic, 27 September–1 October 2021; pp. 3829–3836. [Google Scholar]
  38. Knapitsch, A.; Park, J.; Zhou, Q.; Koltun, V. Tanks and temples: Benchmarking large-scale scene reconstruction. ACM Trans. Graph. 2017, 36, 1–13. [Google Scholar] [CrossRef]
  39. Mayer, N.; Ilg, E.; Hausser, P.; Fischer, P.; Cremers, D.; Dosovitskiy, A.; Brox, T. A Large Dataset to Train Convolutional Networks for Disparity, Optical Flow, and Scene Flow Estimation. In Proceedings of the IEEE Conference on Computer Vision and Pattern Recognition, Las Vegas, NV, USA, 27–30 June 2016; pp. 4040–4048. [Google Scholar]
  40. Kendall, A.; Martirosyan, H.; Dasgupta, S.; Henry, P.; Kennedy, R.; Bachrach, A.; Bry, A. End-to-End Learning of Geometry and Context for Deep Stereo Regression. In Proceedings of the IEEE International Conference on Computer Vision, Venice, Italy, 22–29 October 2017; pp. 66–75. [Google Scholar]
  41. Chang, J.R.; Chen, Y.S. Pyramid Stereo Matching Network. In Proceedings of the IEEE Conference on Computer Vision and Pattern Recognition, Salt Lake City, UT, USA, 18–23 June 2018; pp. 5410–5418. [Google Scholar]
  42. Guo, X.; Yang, K.; Yang, W.; Wang, X.; Li, H. Group-Wise Correlation Stereo Network. In Proceedings of the IEEE/CVF Conference on Computer Vision and Pattern Recognition, Long Beach, CA, USA, 15–20 June 2019; pp. 3268–3277. [Google Scholar]
  43. Zhang, F.; Prisacariu, V.; Yang, R.; Torr, P.H.S. GA-Net: Guided Aggregation Net for End-To-End Stereo Matching. In Proceedings of the IEEE/CVF Conference on Computer Vision and Pattern Recognition, Long Beach, CA, USA, 15–20 June 2019; pp. 185–194. [Google Scholar]
  44. Xu, H.; Zhang, J. AANet: Adaptive Aggregation Network for Efficient Stereo Matching. In Proceedings of the IEEE/CVF Conference on Computer Vision and Pattern Recognition, Seattle, WA, USA, 13–19 June 2020; pp. 1956–1965. [Google Scholar]
  45. Shen, Z.; Dai, Y.; Song, X.; Rao, Z.; Zhou, D.; Zhang, L. PCW-Net: Pyramid Combination and Warping Cost Volume for Stereo Matching. In Proceedings of the European Conference on Computer Vision, Tel Aviv, Israel, 23–27 October 2022; pp. 280–297. [Google Scholar]
  46. Xu, H.; Zhang, J.; Cai, J.; Rezatofighi, H.; Yu, F.; Tao, D.; Geiger, A. Unifying Flow, Stereo and Depth Estimation. IEEE Trans. Pattern Anal. Mach. Intell. 2023, 45, 13941–13958. [Google Scholar] [CrossRef] [PubMed]
  47. Xu, W.; Zhang, F. FAST-LIO: A Fast, Robust LiDAR-Inertial Odometry Package by Tightly-Coupled Iterated Kalman Filter. IEEE Robot. Autom. Lett. 2021, 6, 3317–3324. [Google Scholar] [CrossRef]
Figure 1. The structure of the deep learning network that combines the transformer and the cost volume. Our method embeds the perspective projection module in transformer positional encoding and outputs disparity map after integrating global features obtained by the transformer and local features obtained using cost volume.
Remotesensing 17 02035 g001
Figure 2. Two infrared cameras and a lidar are fixed on the rail, and two laptops are used as data acquisition terminals to form the data acquisition platform.
Remotesensing 17 02035 g002
Figure 3. Results of image undistortion. (a) Before distortion. (b) After distortion.
Remotesensing 17 02035 g003
Figure 4. Results of image rectification. (a) Left image after stereo rectificaton. (b) Right image after stereo rectificaton.
Remotesensing 17 02035 g004
Figure 5. Point cloud map generated by FAST-LIO [47].
Remotesensing 17 02035 g005
Figure 6. Association between infrared images and depth maps. (a) The left image after stereo rectificaton. (b) The left depth map.
Remotesensing 17 02035 g006
Figure 7. Association between depth maps and disparity maps. (a) The depth map. (b) The disparity map.
Remotesensing 17 02035 g007
Figure 8. Schematic diagram of converting depth image to disparity map.
Remotesensing 17 02035 g008
Figure 9. Qualitative comparison between various relevant methods. Different colors encode different depths (red and blue represent the smallest and largest depths, respectively).
Remotesensing 17 02035 g009
Figure 10. Qualitative comparison between ICVT and ICVT-PPE. Different colors encode different depths (red and blue represent the smallest and largest depths, respectively).
Remotesensing 17 02035 g010
Table 1. The experimental results.
ModelEPED1-3pxBMP-1px
PCWNet [45]2.7990.2420.5123
STTR [10]1.41250.11810.231
ICVT (Ours)1.3090.1180.2157
ICVT-PPE (Ours)1.250.10760.1918
Disclaimer/Publisher’s Note: The statements, opinions and data contained in all publications are solely those of the individual author(s) and contributor(s) and not of MDPI and/or the editor(s). MDPI and/or the editor(s) disclaim responsibility for any injury to people or property resulting from any ideas, methods, instructions or products referred to in the content.

