
PSNet: Patch-Based Self-Attention Network for 3D Point Cloud Semantic Segmentation


Abstract

1. Introduction
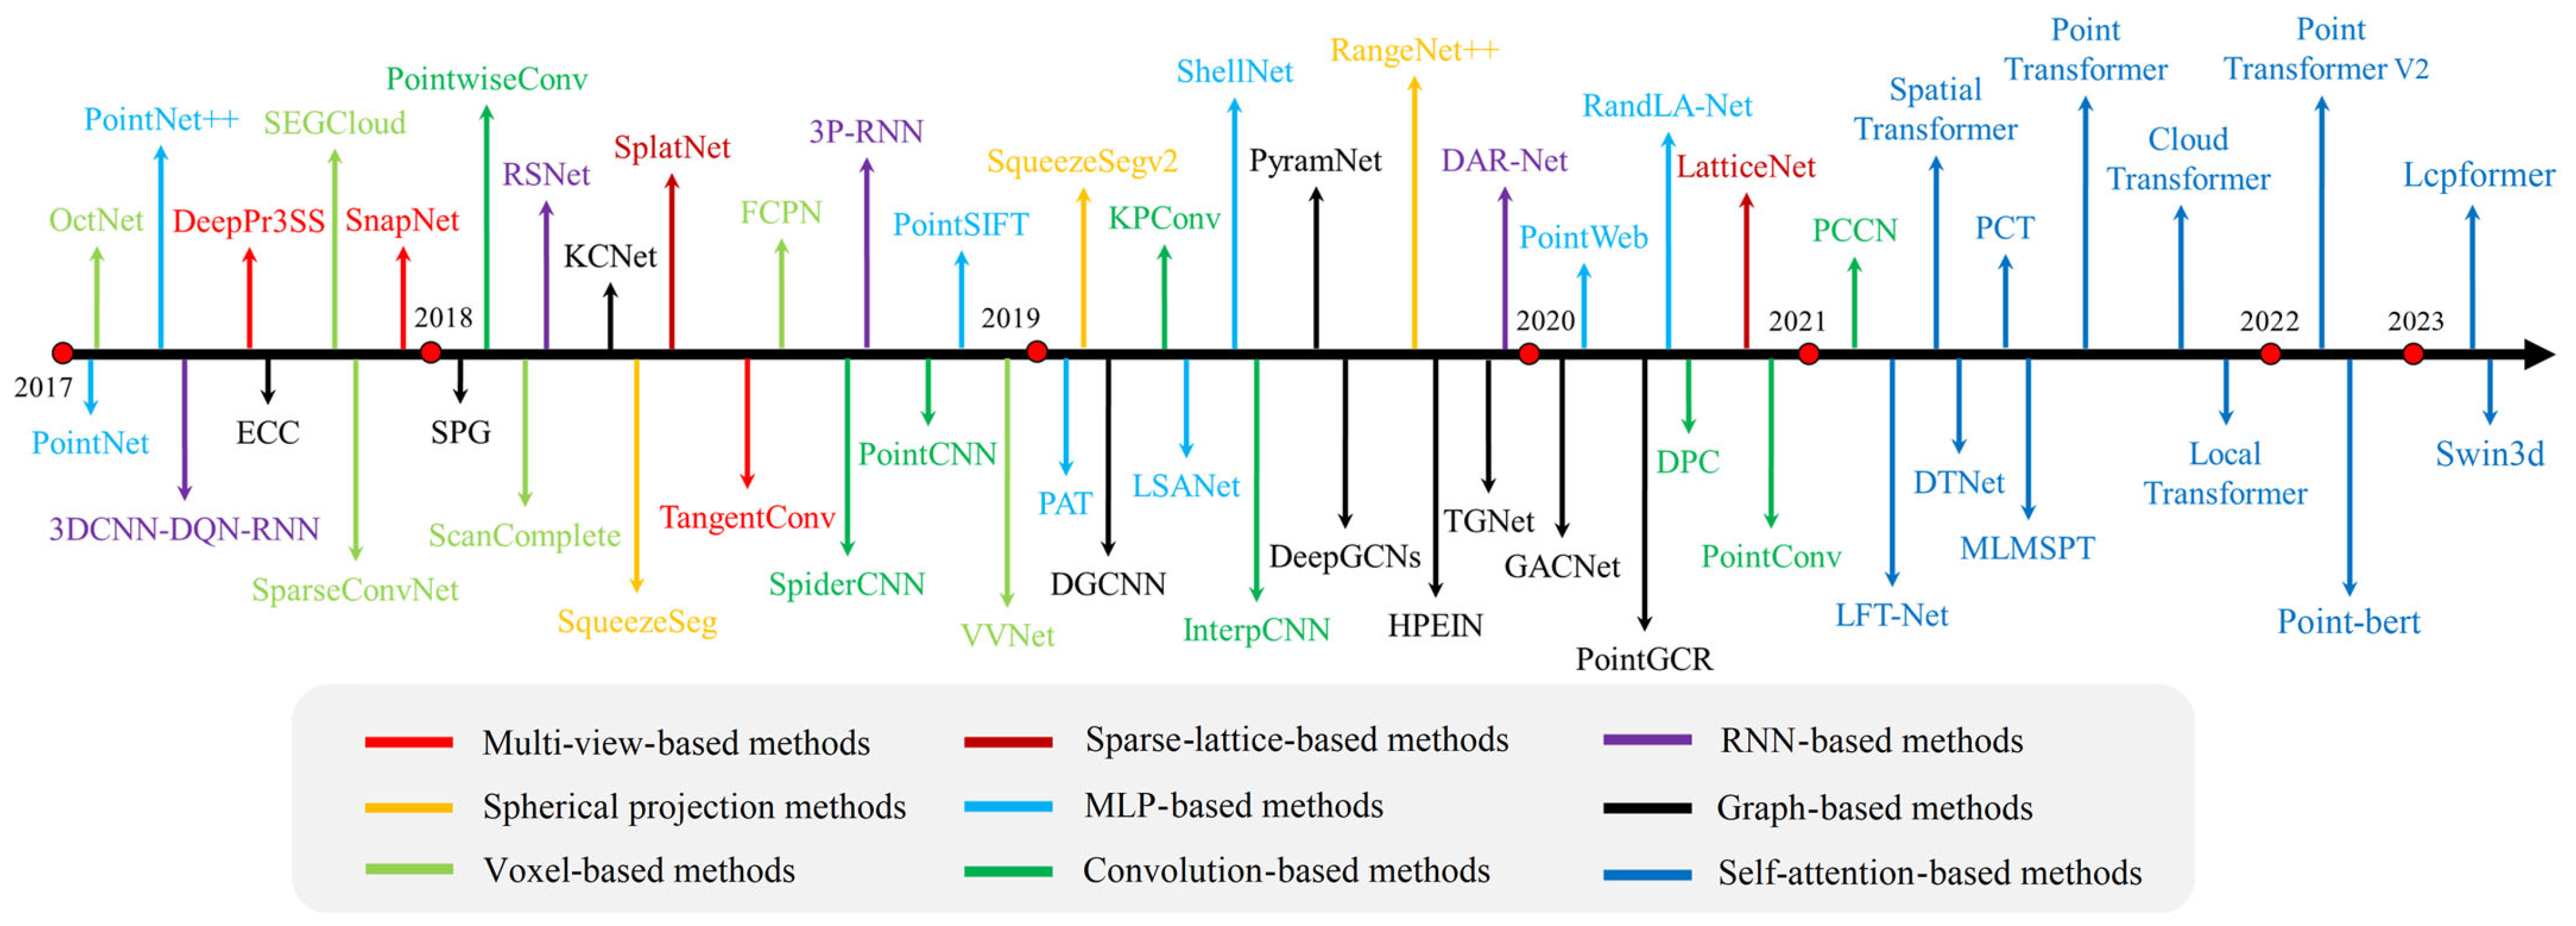
2. Related Works
2.1. Self-Attention Mechanism
2.2. Downsampling Method
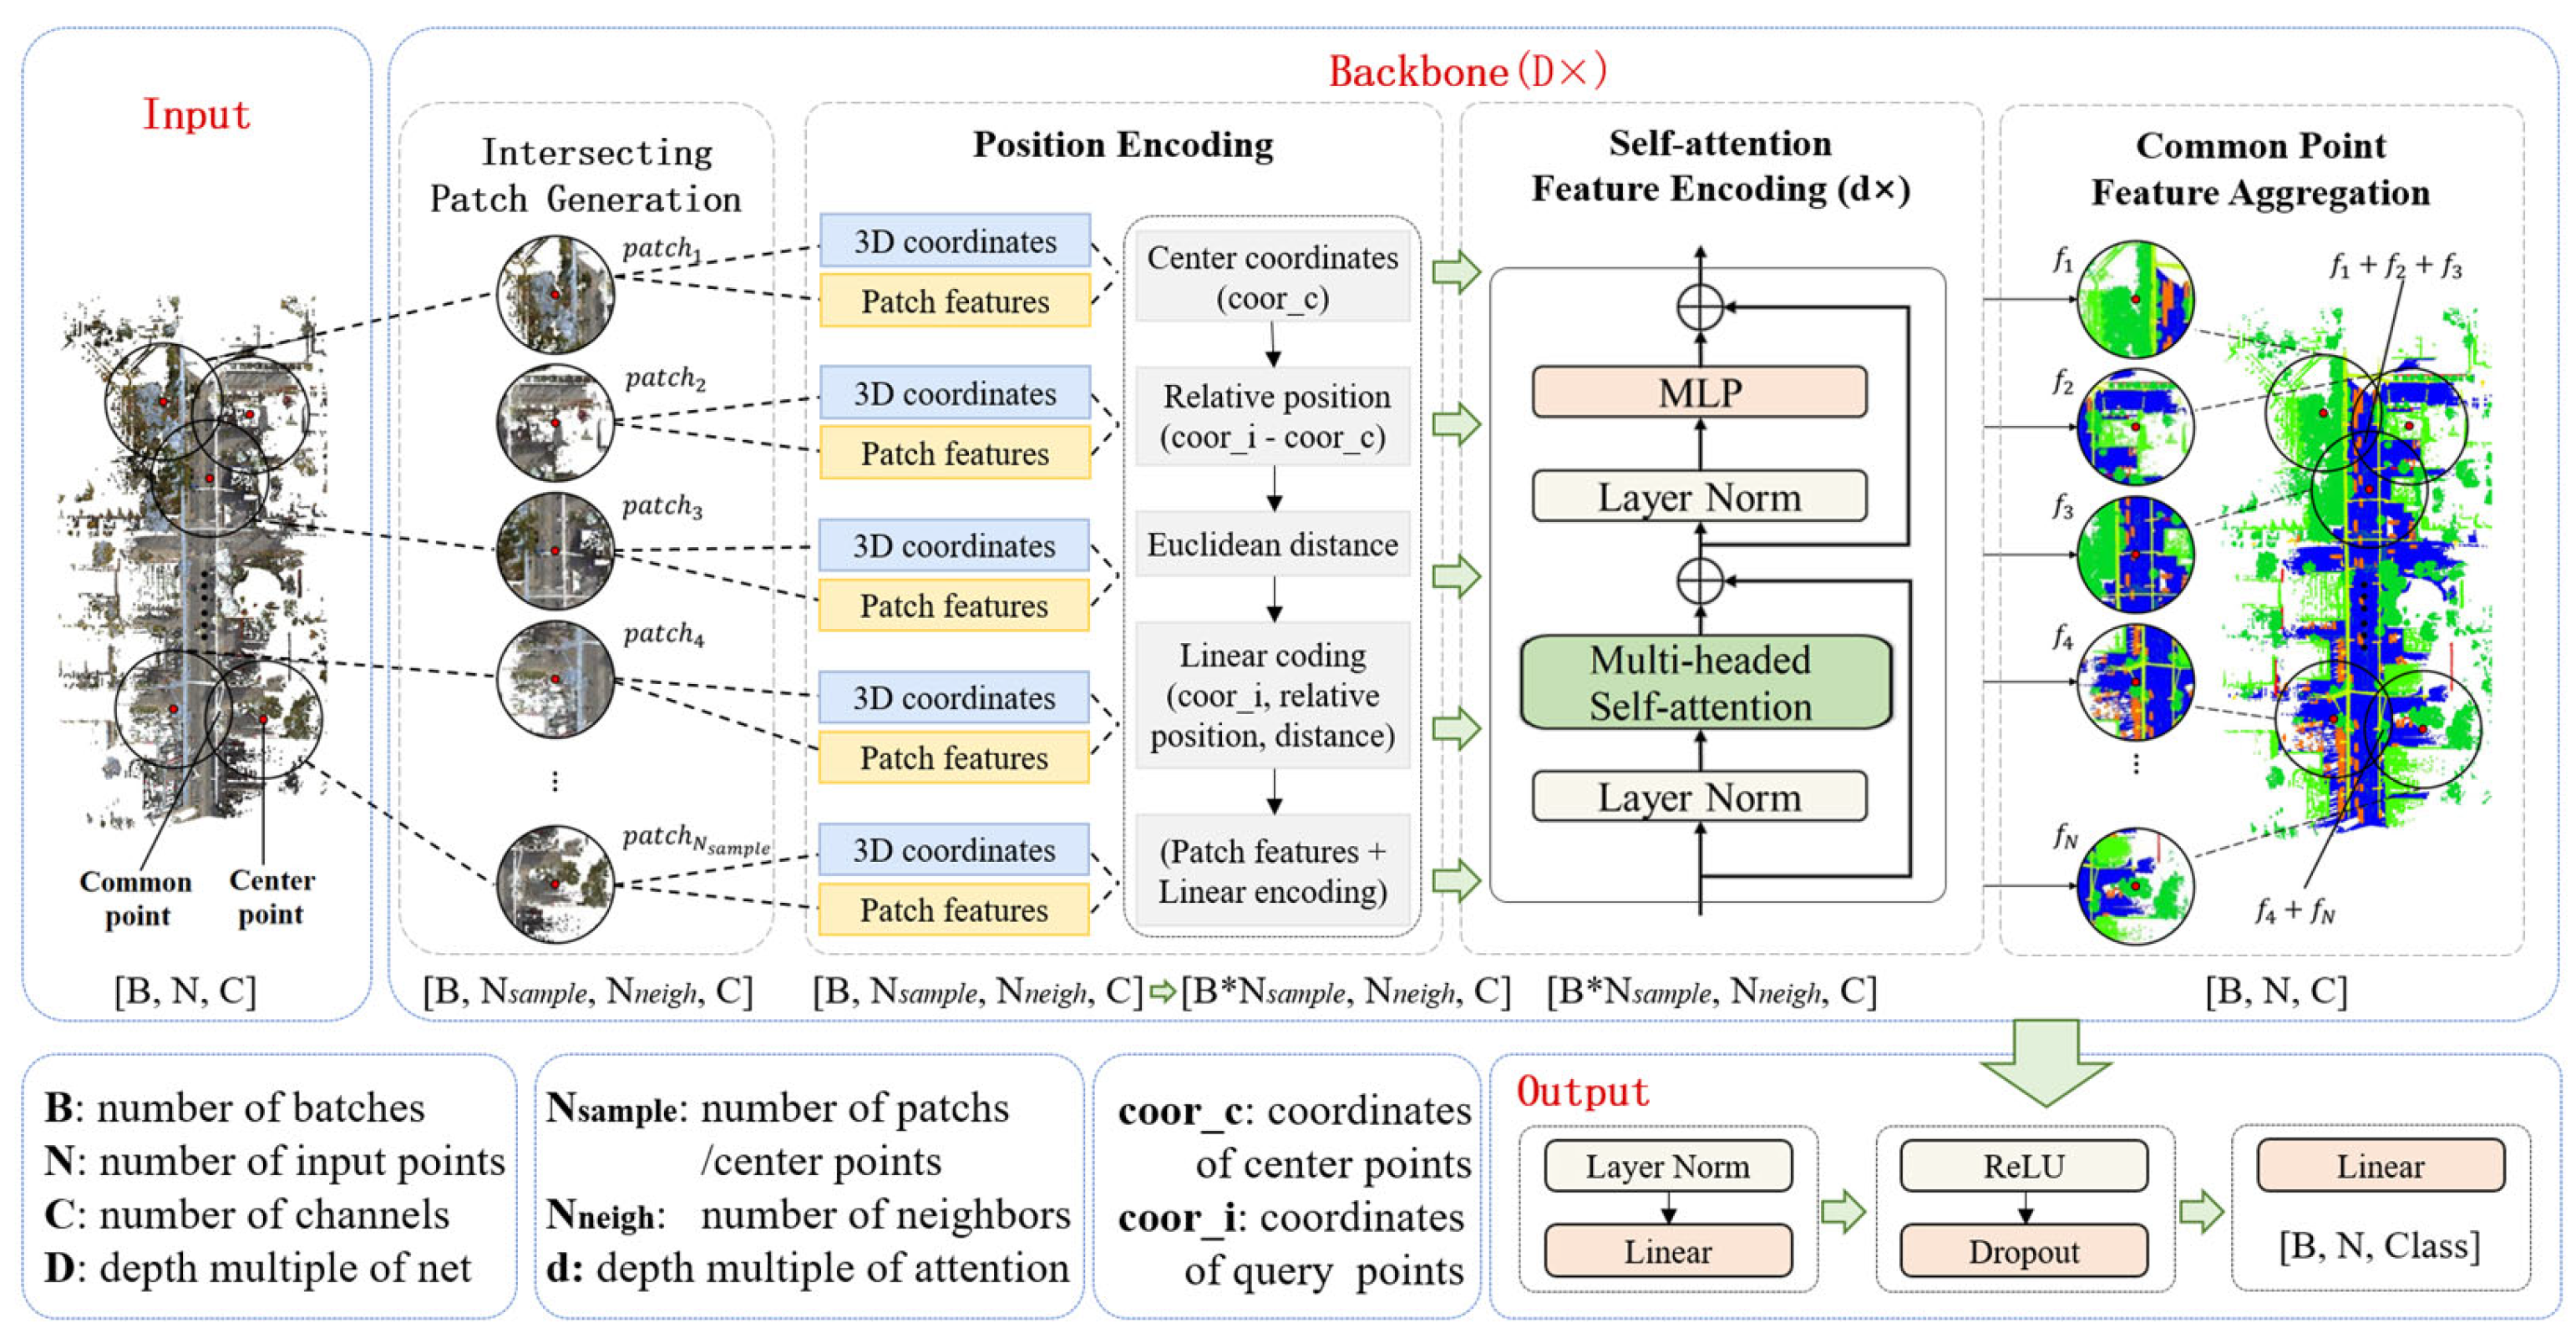
3. Methods
3.1. Intersecting Patch Generation (IPG)
3.2. Position Encoding (PE)
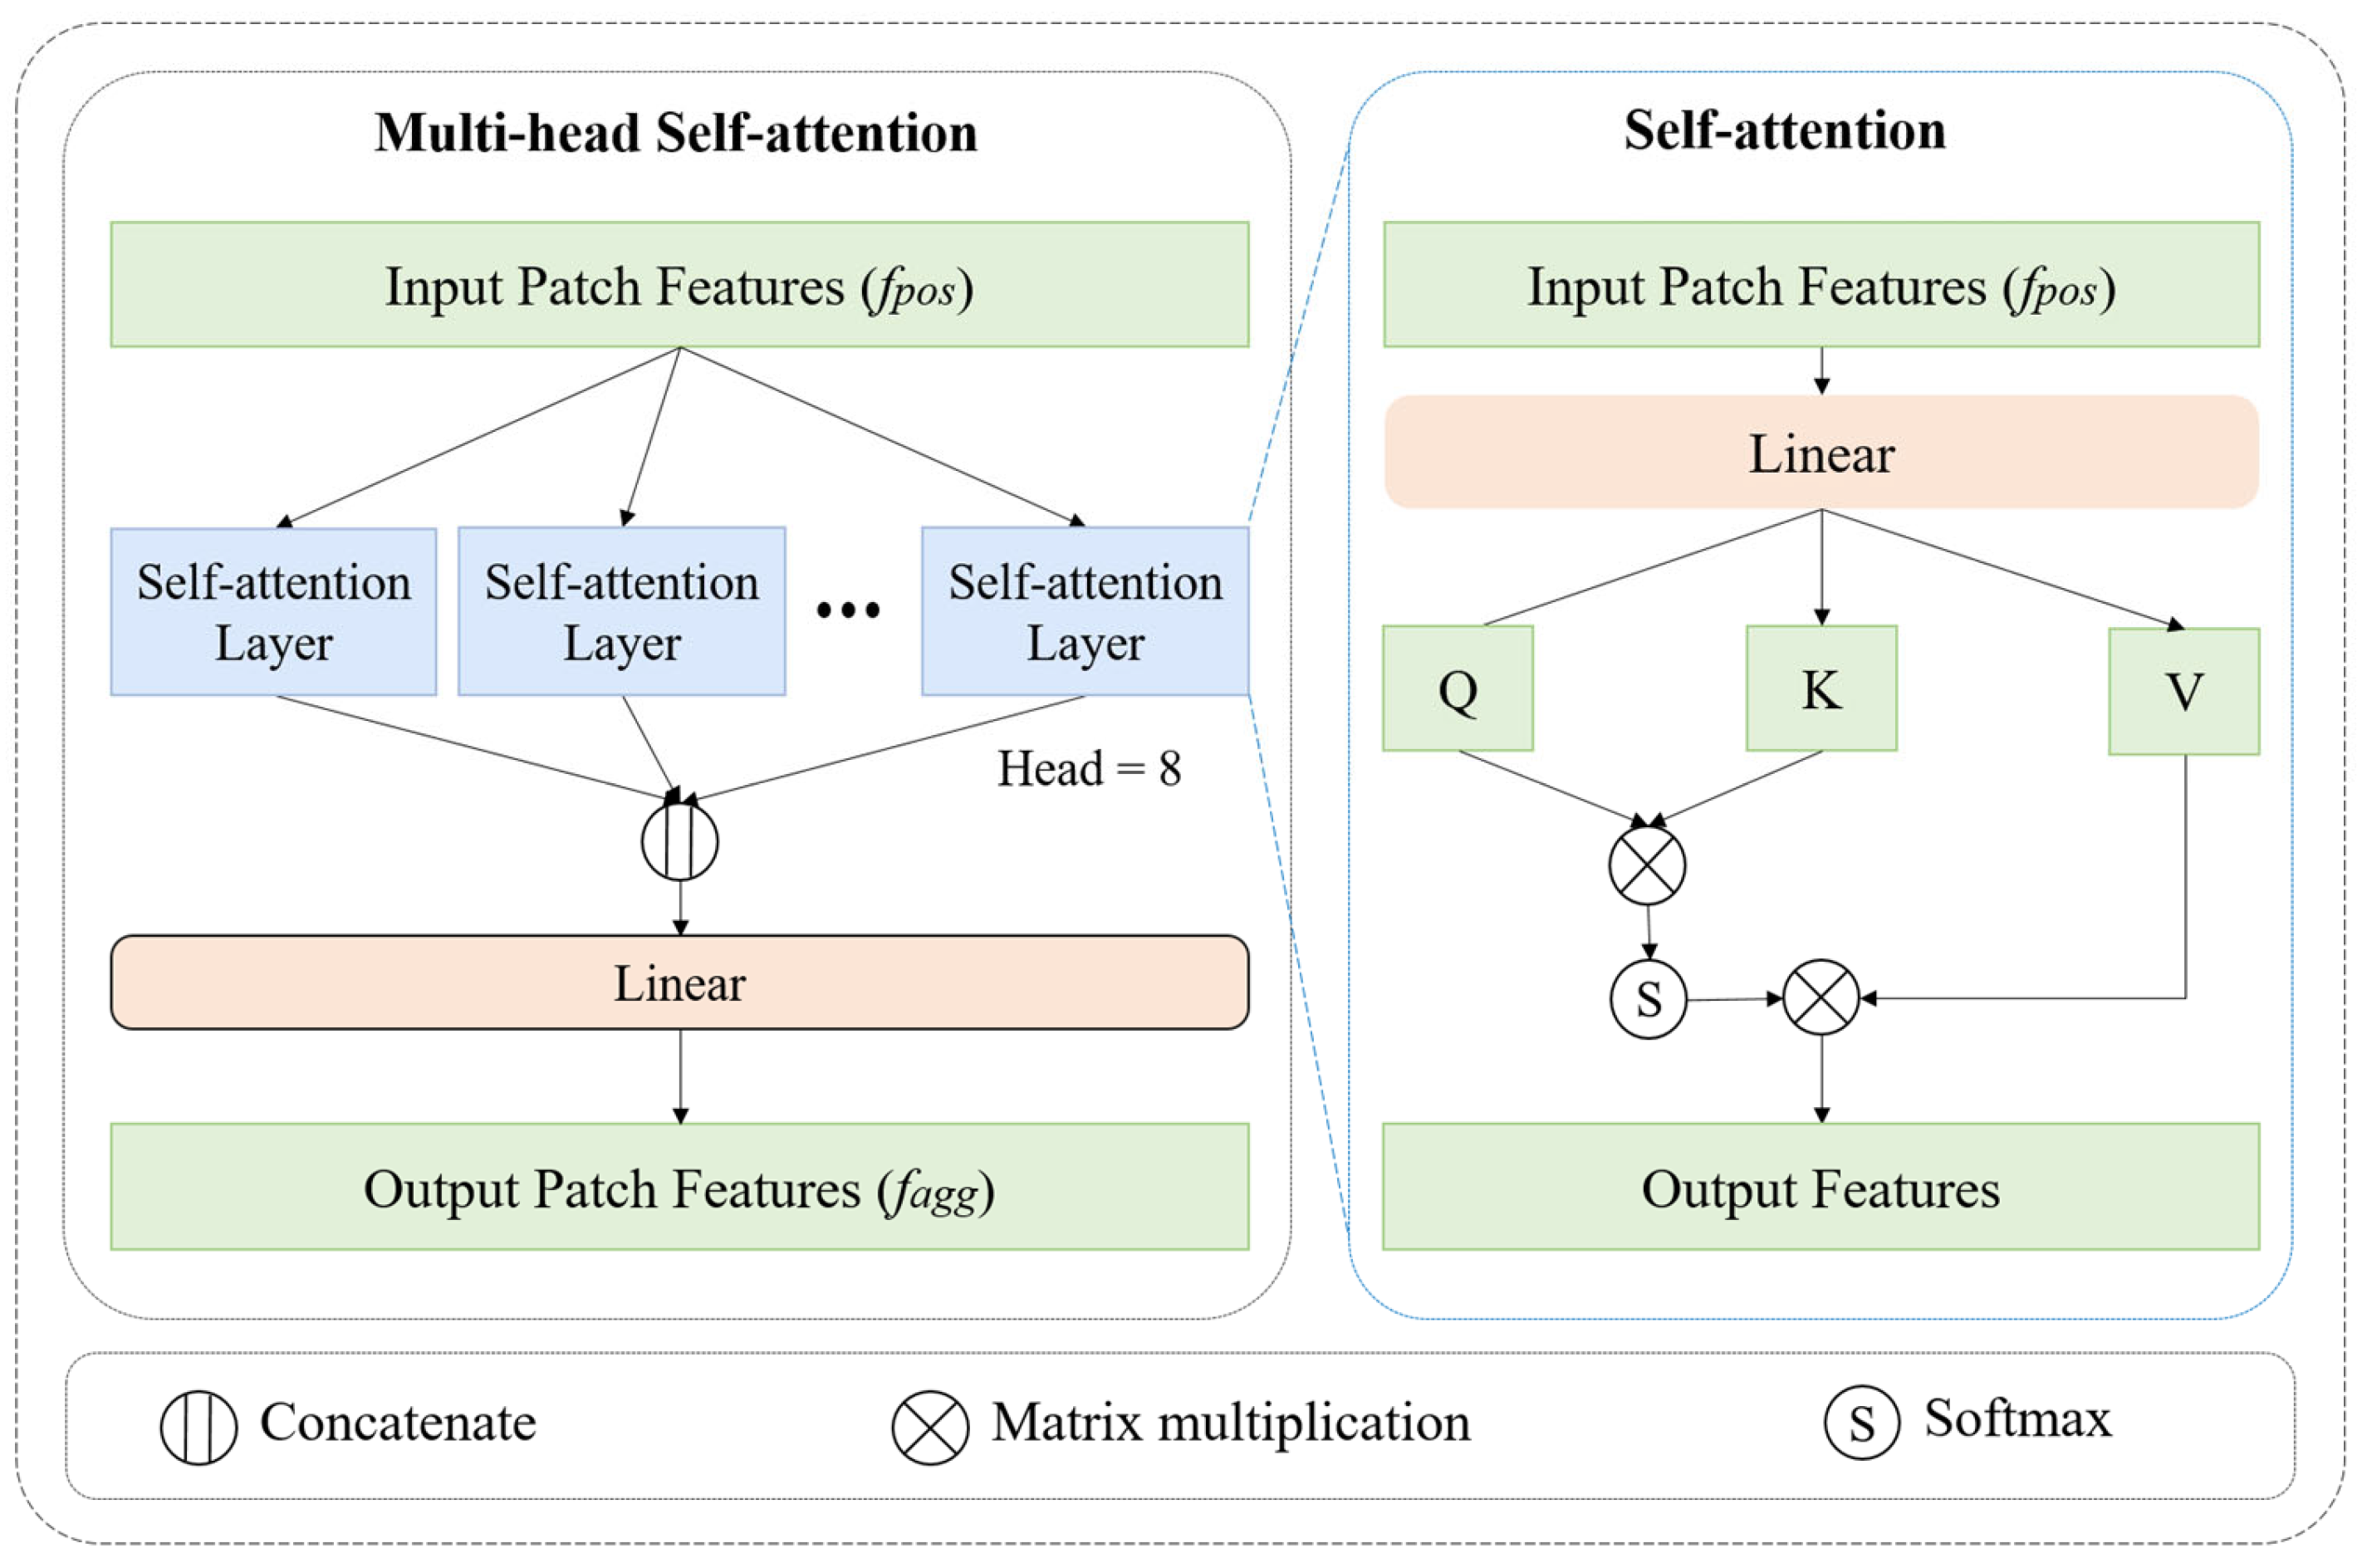
3.3. Self-Attention Feature Encoding (SFE)
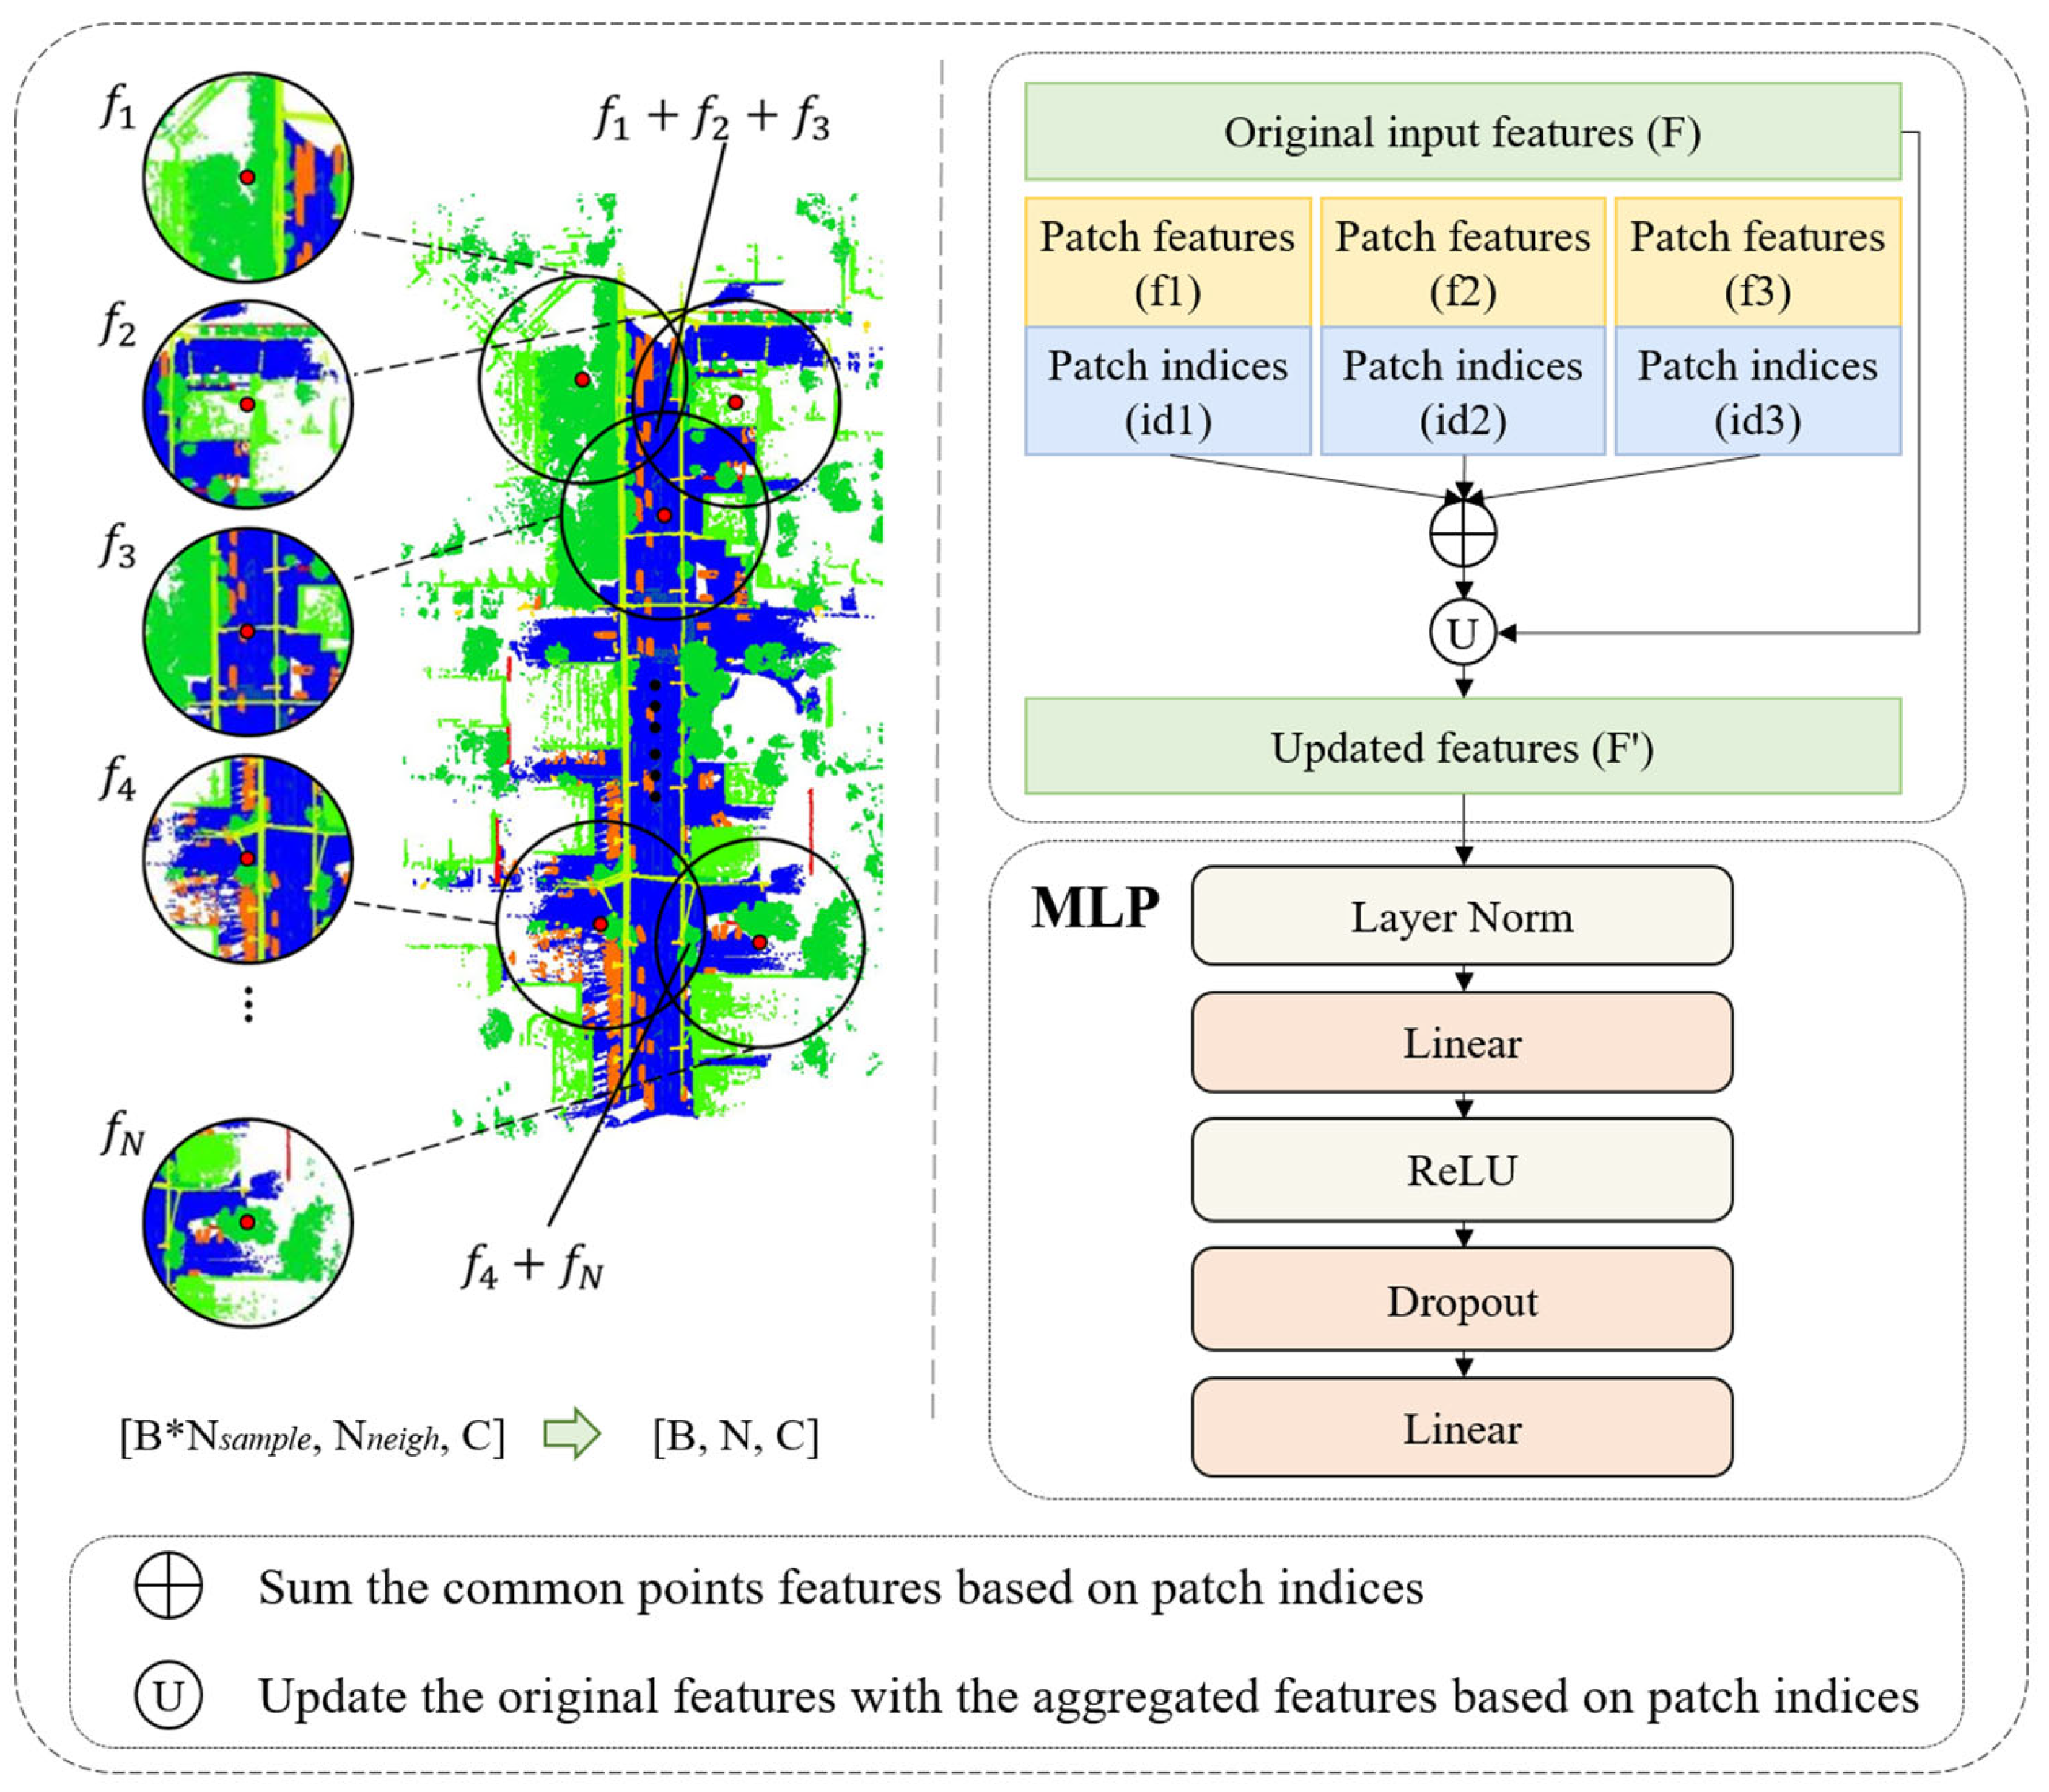
3.4. Common Point Feature Aggregation (CPFA)
3.5. Loss Function
4. Results
4.1. Datasets
4.2. Implementation Details
4.3. Evaluation Metrics
4.4. Performance Comparison
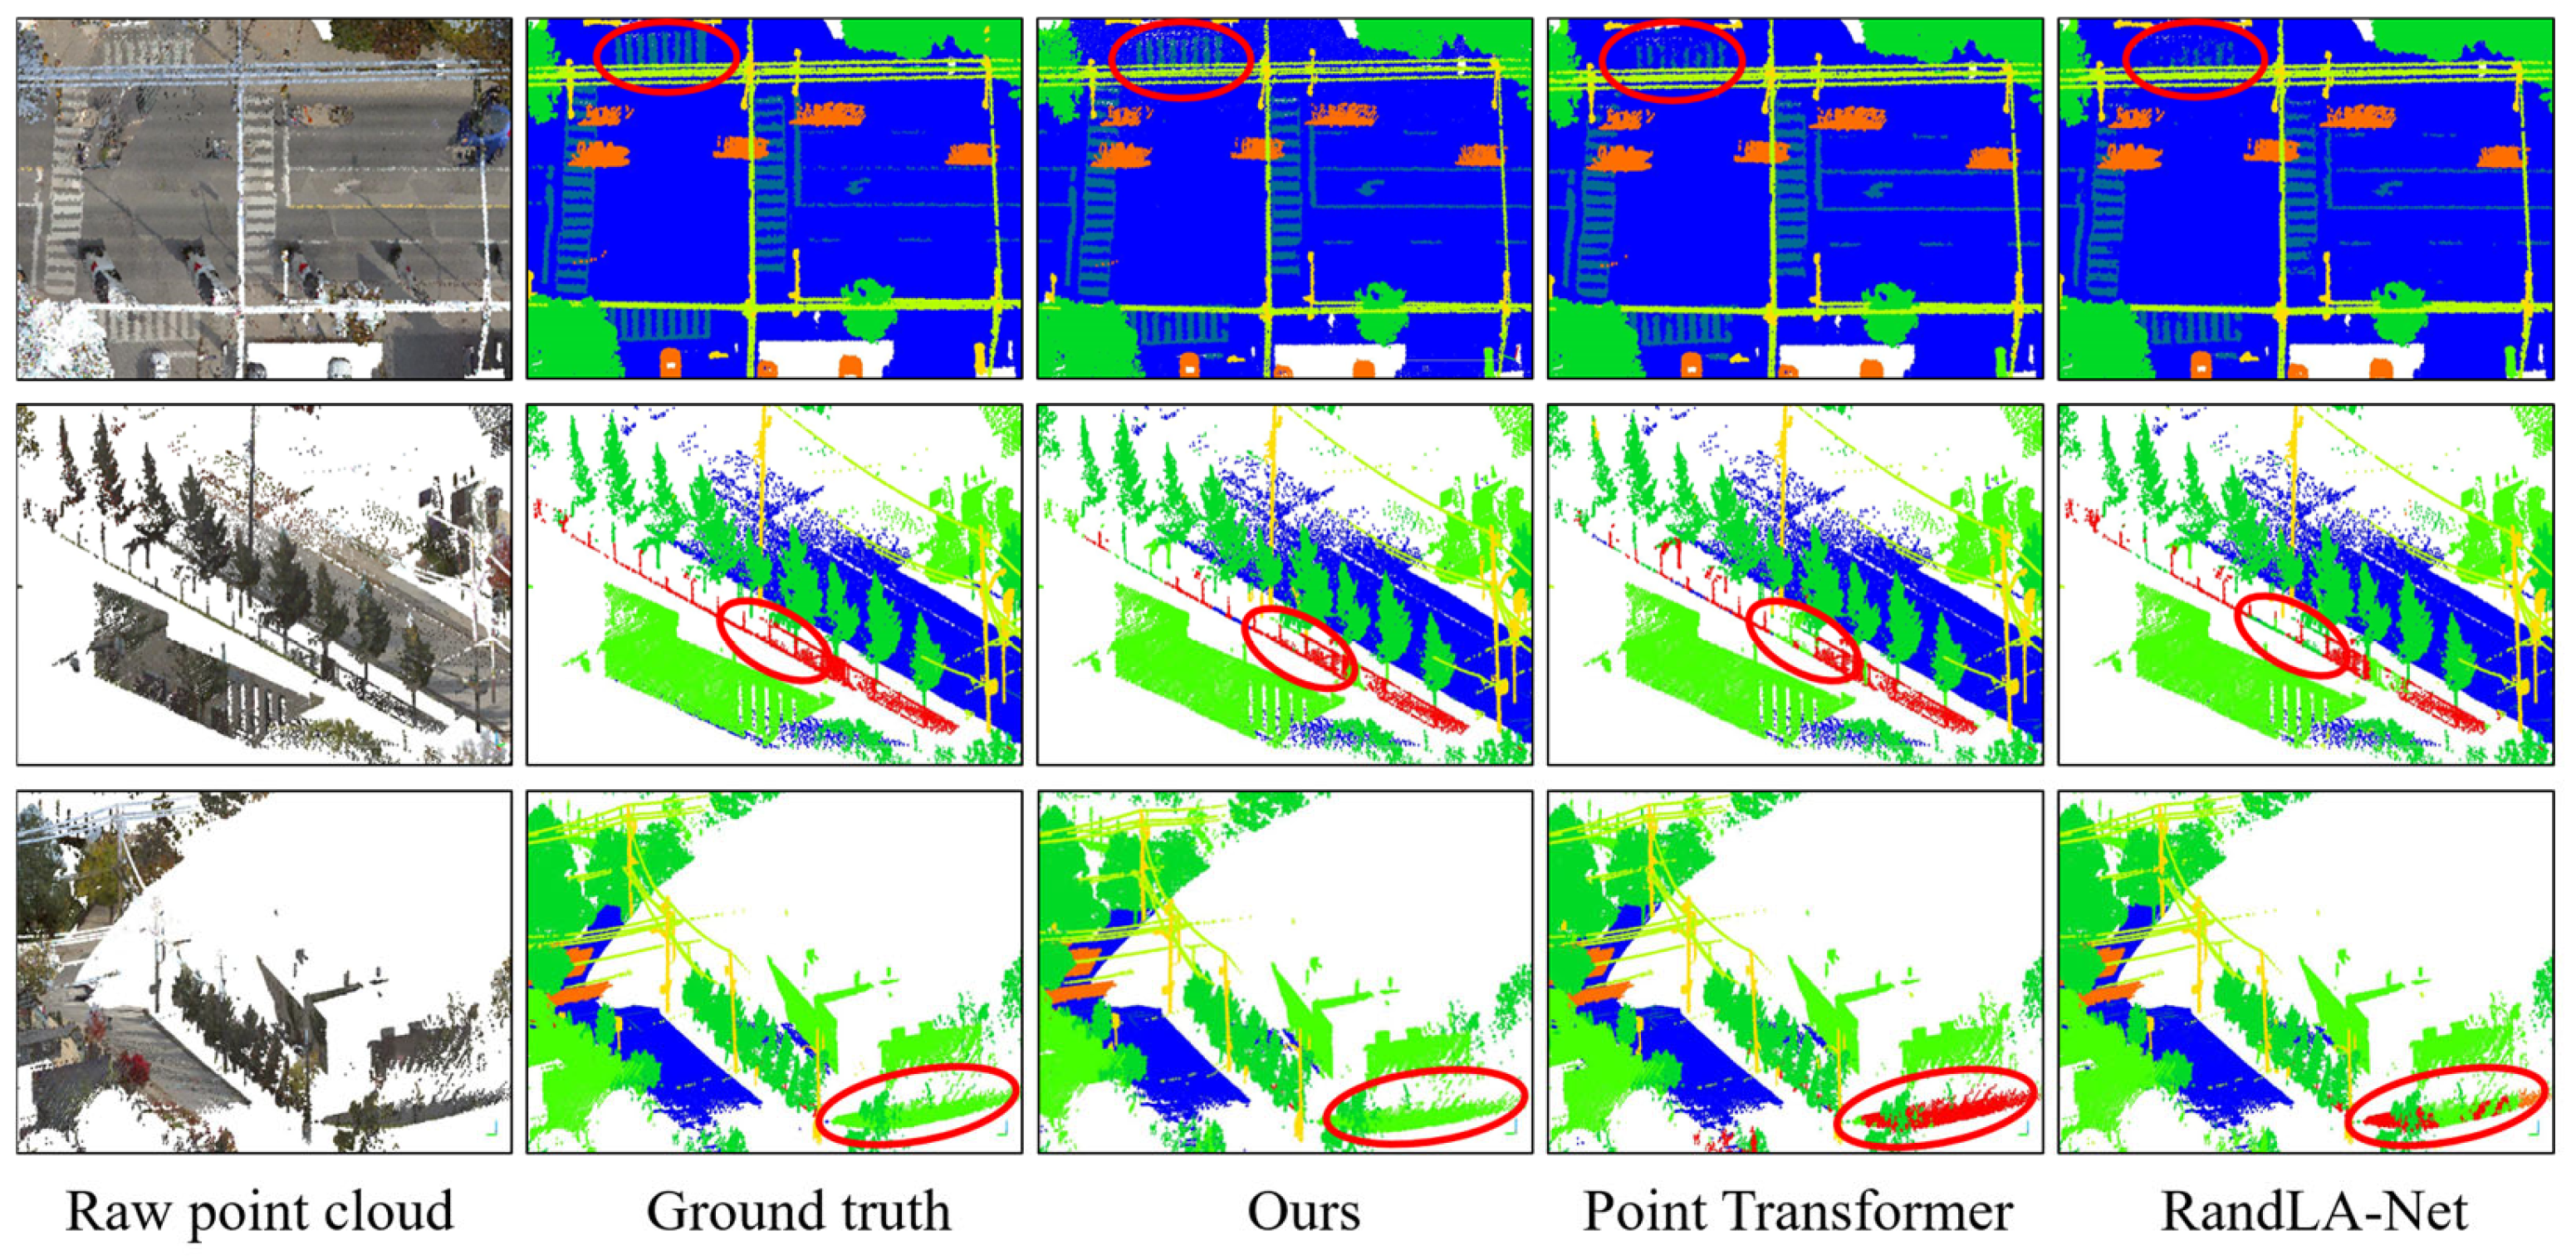
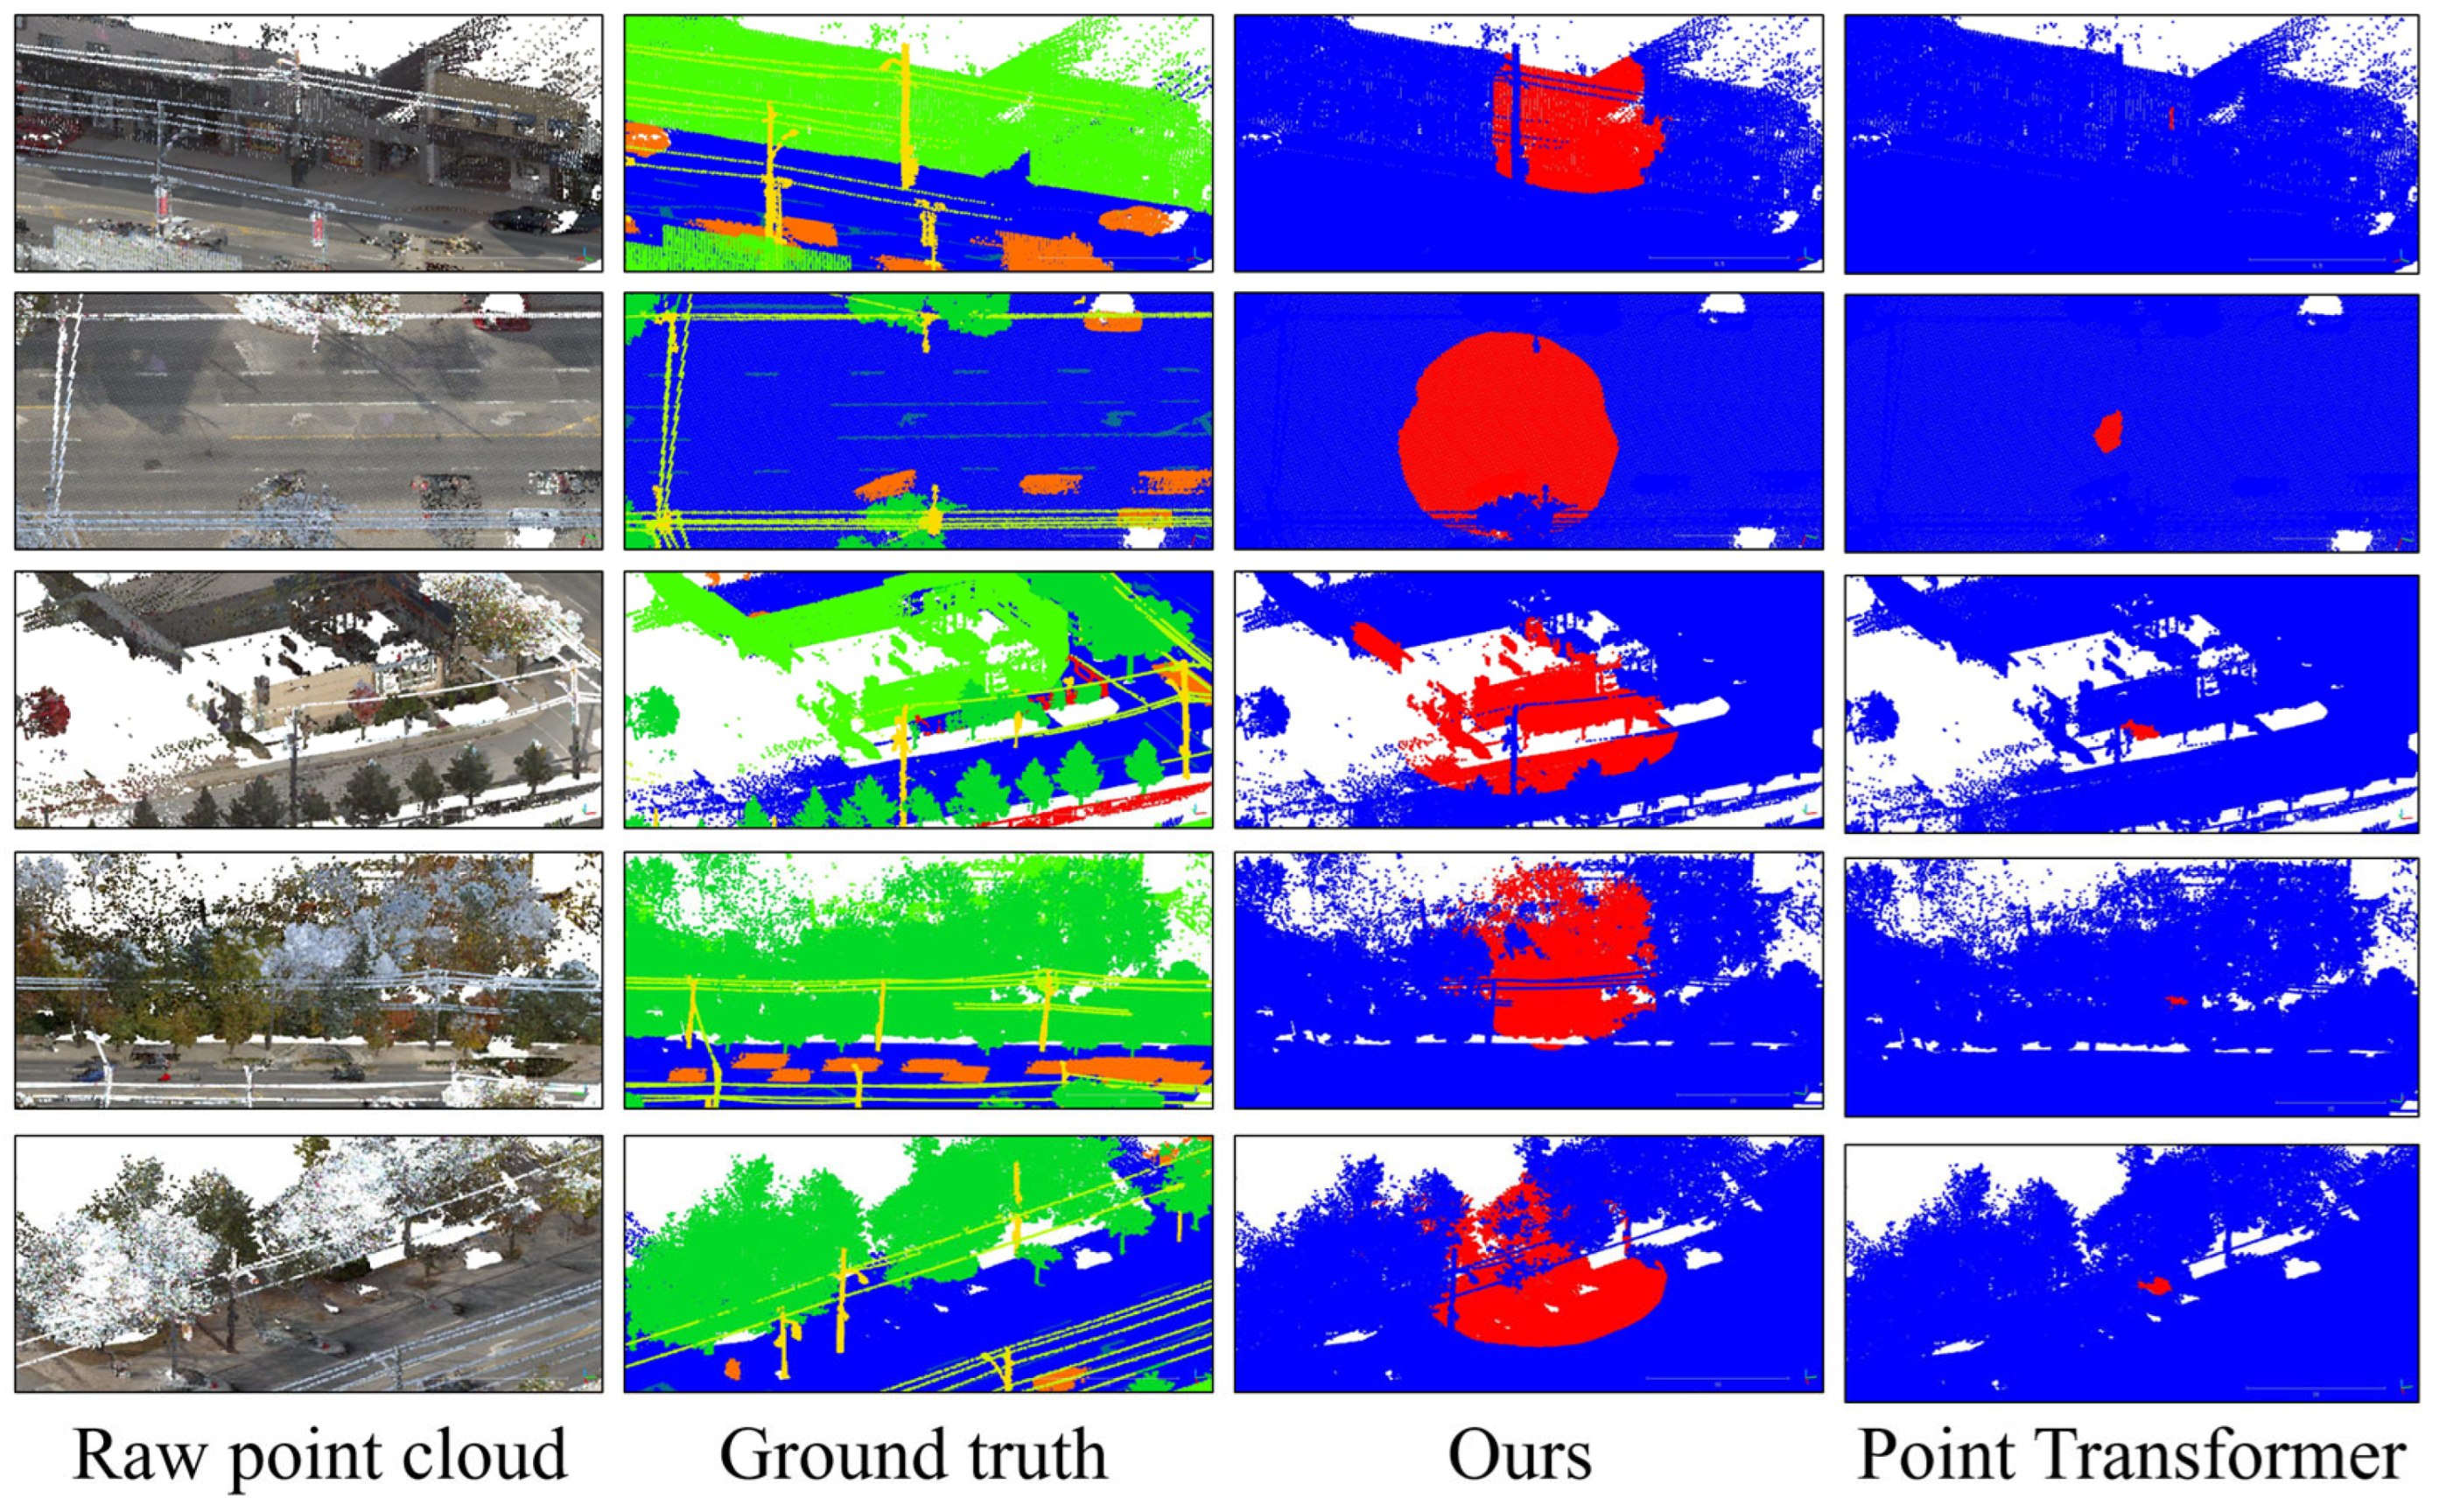
4.5. Result Visualization
4.6. Ablation Study
5. Discussion
6. Conclusions
Author Contributions
Funding
Data Availability Statement
Acknowledgments
Conflicts of Interest
References
- Guo, Y.; Wang, H.; Hu, Q.; Liu, H.; Liu, L.; Bennamoun, M. Deep Learning for 3D Point Clouds: A Survey. IEEE Trans. Pattern Anal. Mach. Intell. 2021, 43, 4338–4364. [Google Scholar] [CrossRef] [PubMed]
- Xie, Y.; Tian, J.; Zhu, X.X. Linking Points With Labels in 3D: A Review of Point Cloud Semantic Segmentation. IEEE Geosci. Remote Sens. Mag. 2020, 8, 38–59. [Google Scholar] [CrossRef]
- Qiu, S.; Anwar, S.; Barnes, N. PU-Transformer: Point Cloud Upsampling Transformer. In Proceedings of the Asian Conference on Computer Vision, Macao, China, 4–8 December 2022; pp. 2475–2493. [Google Scholar]
- Zhang, Y.; Zhou, Z.; David, P.; Yue, X.; Xi, Z.; Gong, B.; Foroosh, H. PolarNet: An Improved Grid Representation for Online LiDAR Point Clouds Semantic Segmentation. In Proceedings of the IEEE/CVF Conference on Computer Vision and Pattern Recognition, Seattle, WA, USA, 13–19 June 2020; pp. 9601–9610. [Google Scholar]
- Hackel, T.; Savinov, N.; Ladicky, L.; Wegner, J.D.; Schindler, K.; Pollefeys, M. Semantic3D.Net: A New Large-Scale Point Cloud Classification Benchmark. arXiv 2017, arXiv:1704.03847. [Google Scholar] [CrossRef]
- Landrieu, L.; Raguet, H.; Vallet, B.; Mallet, C.; Weinmann, M. A Structured Regularization Framework for Spatially Smoothing Semantic Labelings of 3D Point Clouds. ISPRS J. Photogramm. Remote Sens. 2017, 132, 102–118. [Google Scholar] [CrossRef]
- Tatarchenko, M.; Park, J.; Koltun, V.; Zhou, Q.-Y. Tangent Convolutions for Dense Prediction in 3D. In Proceedings of the IEEE Conference on Computer Vision and Pattern Recognition, Salt Lake City, UT, USA, 18–23 June 2018; pp. 3887–3896. [Google Scholar]
- Milioto, A.; Vizzo, I.; Behley, J.; Stachniss, C. RangeNet ++: Fast and Accurate LiDAR Semantic Segmentation. In Proceedings of the 2019 IEEE/RSJ International Conference on Intelligent Robots and Systems (IROS), Macao, China, 3–8 November 2019; pp. 4213–4220. [Google Scholar] [CrossRef]
- Graham, B.; Engelcke, M.; van der Maaten, L. 3D Semantic Segmentation With Submanifold Sparse Convolutional Networks. In Proceedings of the IEEE Conference on Computer Vision and Pattern Recognition, Salt Lake City, UT, USA, 18–23 June 2018; pp. 9224–9232. [Google Scholar]
- Su, H.; Jampani, V.; Sun, D.; Maji, S.; Kalogerakis, E.; Yang, M.-H.; Kautz, J. SPLATNet: Sparse Lattice Networks for Point Cloud Processing. In Proceedings of the IEEE Conference on Computer Vision and Pattern Recognition, Salt Lake City, UT, USA, 18–23 June 2018; pp. 2530–2539. [Google Scholar]
- Qi, C.R.; Yi, L.; Su, H.; Guibas, L.J. PointNet++: Deep Hierarchical Feature Learning on Point Sets in a Metric Space. In Advances in Neural Information Processing Systems; Curran Associates, Inc.: San Francisco, CA, USA, 2017; Volume 30. [Google Scholar]
- Engelmann, F.; Kontogianni, T.; Leibe, B. Dilated Point Convolutions: On the Receptive Field Size of Point Convolutions on 3D Point Clouds. In Proceedings of the 2020 IEEE International Conference on Robotics and Automation (ICRA), Paris, France, 31 May–31 August 2020; pp. 9463–9469. [Google Scholar] [CrossRef]
- Ye, X.; Li, J.; Huang, H.; Du, L.; Zhang, X. 3D Recurrent Neural Networks with Context Fusion for Point Cloud Semantic Segmentation. In Proceedings of the European Conference on Computer Vision (ECCV), Munich, Germany, 8–14 September 2018; pp. 403–417. [Google Scholar]
- Ma, Y.; Guo, Y.; Liu, H.; Lei, Y.; Wen, G. Global Context Reasoning for Semantic Segmentation of 3D Point Clouds. In Proceedings of the IEEE/CVF Winter Conference on Applications of Computer Vision, 2020, Snowmass Village, CO, USA, 1–5 March 2020; pp. 2931–2940. [Google Scholar]
- Wu, X.; Lao, Y.; Jiang, L.; Liu, X.; Zhao, H. Point Transformer V2: Grouped Vector Attention and Partition-Based Pooling. Adv. Neural Inf. Process. Syst. 2022, 35, 33330–33342. [Google Scholar]
- Huang, Z.; Zhao, Z.; Li, B.; Han, J. LCPFormer: Towards Effective 3D Point Cloud Analysis via Local Context Propagation in Transformers. IEEE Trans. Circuits Syst. Video Technol. 2023, 33, 4985–4996. [Google Scholar] [CrossRef]
- Wang, B.; Liu, K.; Zhao, J. Inner Attention Based Recurrent Neural Networks for Answer Selection. In Proceedings of the 54th Annual Meeting of the Association for Computational Linguistics (Volume 1: Long Papers); Erk, K., Smith, N.A., Eds.; Association for Computational Linguistics: Berlin, Germany, 2016; pp. 1288–1297. [Google Scholar] [CrossRef]
- Lin, Z.; Feng, M.; dos Santos, C.N.; Yu, M.; Xiang, B.; Zhou, B.; Bengio, Y. A Structured Self-Attentive Sentence Embedding. International Conference on Learning Representations. arXiv 2017, arXiv:1703.03130. [Google Scholar] [CrossRef]
- Niu, Z. A Review on the Attention Mechanism of Deep Learning. Neurocomputing 2021, 452, 48–62. [Google Scholar] [CrossRef]
- Luong, M.-T.; Pham, H.; Manning, C.D. Effective Approaches to Attention-Based Neural Machine Translation. arXiv 2015, arXiv:1508.04025. [Google Scholar] [CrossRef]
- Miller, A.; Fisch, A.; Dodge, J.; Karimi, A.-H.; Bordes, A.; Weston, J. Key-Value Memory Networks for Directly Reading Documents. arXiv 2016, arXiv:1606.03126. [Google Scholar] [CrossRef]
- Vaswani, A.; Shazeer, N.; Parmar, N.; Uszkoreit, J.; Jones, L.; Gomez, A.N.; Kaiser, Ł.; Polosukhin, I. Attention Is All You Need. In Advances in Neural Information Processing Systems; Curran Associates, Inc.: San Francisco, CA, USA, 2017; Volume 30. [Google Scholar]
- Ruan, L. Survey: Transformer Based Video-Language Pre-Training. AI Open 2022, 3, 1–13. [Google Scholar] [CrossRef]
- Daniluk, M.; Rocktäschel, T.; Welbl, J.; Riedel, S. Frustratingly Short Attention Spans in Neural Language Modeling. arXiv 2017, arXiv:1702.04521. [Google Scholar] [CrossRef]
- Gulcehre, C.; Chandar, S.; Cho, K.; Bengio, Y. Dynamic Neural Turing Machine with Soft and Hard Addressing Schemes. arXiv 2017, arXiv:1607.00036. [Google Scholar] [CrossRef]
- Li, J.; Tu, Z.; Yang, B.; Lyu, M.R.; Zhang, T. Multi-Head Attention with Disagreement Regularization. arXiv 2018, arXiv:1810.10183. [Google Scholar] [CrossRef]
- DeepSeek-AI; Liu, A.; Feng, B.; Xue, B.; Wang, B.; Wu, B.; Lu, C.; Zhao, C.; Deng, C.; Zhang, C.; et al. DeepSeek-V3 Technical Report. arXiv 2025, arXiv:2412.19437. [Google Scholar] [CrossRef]
- Han, X.; Dong, Z.; Yang, B. A Point-Based Deep Learning Network for Semantic Segmentation of MLS Point Clouds. ISPRS J. Photogramm. Remote Sens. 2021, 175, 199–214. [Google Scholar] [CrossRef]
- Hu, Q.; Yang, B.; Xie, L.; Rosa, S.; Guo, Y.; Wang, Z.; Trigoni, N.; Markham, A. RandLA-Net: Efficient Semantic Segmentation of Large-Scale Point Clouds. In Proceedings of the IEEE/CVF Conference on Computer Vision and Pattern Recognition, Seattle, WA, USA, 13–19 June 2020; pp. 11108–11117. [Google Scholar]
- Yang, Z.; Sun, Y.; Liu, S.; Shen, X.; Jia, J. STD: Sparse-to-Dense 3D Object Detector for Point Cloud. In Proceedings of the IEEE/CVF International Conference on Computer Vision, Seoul, Republic of Korea, 27 October–2 November 2019; pp. 1951–1960. [Google Scholar]
- Nezhadarya, E.; Taghavi, E.; Razani, R.; Liu, B.; Luo, J. Adaptive Hierarchical Down-Sampling for Point Cloud Classification. In Proceedings of the IEEE/CVF Conference on Computer Vision and Pattern Recognition, Seattle, WA, USA, 13–19 June 2020; pp. 12956–12964. [Google Scholar]
- Zhang, Y.; Hu, Q.; Xu, G.; Ma, Y.; Wan, J.; Guo, Y. Not All Points Are Equal: Learning Highly Efficient Point-Based Detectors for 3D LiDAR Point Clouds. In Proceedings of the IEEE/CVF Conference on Computer Vision and Pattern Recognition, New Orleans, LA, USA, 18–24 June 2022; pp. 18953–18962. [Google Scholar]
- He, L.; Wang, M. SliceSamp: A Promising Downsampling Alternative for Retaining Information in a Neural Network. Appl. Sci. 2023, 13, 11657. [Google Scholar] [CrossRef]
- Liu, Z.; Lin, Y.; Cao, Y.; Hu, H.; Wei, Y.; Zhang, Z.; Lin, S.; Guo, B. Swin Transformer: Hierarchical Vision Transformer Using Shifted Windows. In Proceedings of the IEEE/CVF International Conference on Computer Vision, 2021, Montreal, BC, Canada, 11–17 October 2021; pp. 10012–10022. [Google Scholar]
- Tan, W.; Qin, N.; Ma, L.; Li, Y.; Du, J.; Cai, G.; Yang, K.; Li, J. Toronto-3D: A Large-Scale Mobile LiDAR Dataset for Semantic Segmentation of Urban Roadways. In Proceedings of the IEEE/CVF Conference on Computer Vision and Pattern Recognition Workshops, Seattle, WA, USA, 13–19 June 2020; pp. 202–203. [Google Scholar]
- Tong, G.; Li, Y.; Chen, D.; Sun, Q.; Cao, W.; Xiang, G. CSPC-Dataset: New LiDAR Point Cloud Dataset and Benchmark for Large-Scale Scene Semantic Segmentation. IEEE Access 2020, 8, 87695–87718. [Google Scholar] [CrossRef]
- Wang, Y.; Sun, Y.; Liu, Z.; Sarma, S.E.; Bronstein, M.M.; Solomon, J.M. Dynamic Graph CNN for Learning on Point Clouds. ACM Trans. Graph. 2019, 38, 1–12. [Google Scholar] [CrossRef]
- Thomas, H.; Qi, C.R.; Deschaud, J.-E.; Marcotegui, B.; Goulette, F.; Guibas, L.J. KPConv: Flexible and Deformable Convolution for Point Clouds. In Proceedings of the IEEE/CVF International Conference on Computer Vision, Seoul, Republic of Korea, 27 October–2 November 2019; pp. 6411–6420. [Google Scholar]
- Li, Y.; Ma, L.; Zhong, Z.; Cao, D.; Li, J. TGNet: Geometric Graph CNN on 3-D Point Cloud Segmentation. IEEE Trans. Geosci. Remote Sens. 2020, 58, 3588–3600. [Google Scholar] [CrossRef]
- Boulch, A.; Guerry, J.; Le Saux, B.; Audebert, N. SnapNet: 3D Point Cloud Semantic Labeling with 2D Deep Segmentation Networks. Comput. Graph. 2018, 71, 189–198. [Google Scholar] [CrossRef]
- Huang, J.; You, S. Point Cloud Labeling Using 3D Convolutional Neural Network. In Proceedings of the 2016 23rd International Conference on Pattern Recognition (ICPR), Cancun, Mexico, 4–8 December 2016; pp. 2670–2675. [Google Scholar] [CrossRef]
- Zhao, H.; Jiang, L.; Jia, J.; Torr, P.H.S.; Koltun, V. Point Transformer. In Proceedings of the IEEE/CVF International Conference on Computer Vision, Montreal, BC, Canada, 11–17 October 2021; pp. 16259–16268. [Google Scholar]
- Xu, M.; Ding, R.; Zhao, H.; Qi, X. PAConv: Position Adaptive Convolution with Dynamic Kernel Assembling on Point Clouds. In Proceedings of the IEEE Conference on Computer Vision and Pattern Recognition, Nashville, TN, USA, 26 April 2021. [Google Scholar] [CrossRef]
- Park, C.; Jeong, Y.; Cho, M.; Park, J. Fast Point Transformer. In Proceedings of the IEEE Conference on Computer Vision and Pattern Recognition, New Orleans, LA, USA, 4 April 2022. [Google Scholar] [CrossRef]
- Lai, X.; Liu, J.; Jiang, L.; Wang, L.; Zhao, H.; Liu, S.; Qi, X.; Jia, J. Stratified Transformer for 3D Point Cloud Segmentation. In Proceedings of the IEEE Conference on Computer Vision and Pattern Recognition, New Orleans, LA, USA, 28 March 2022. [Google Scholar] [CrossRef]
- Qian, G.; Li, Y.; Peng, H.; Mai, J.; Hammoud, H.A.A.K.; Elhoseiny, M.; Ghanem, B. PointNeXt: Revisiting PointNet++ with Improved Training and Scaling Strategies. In Proceedings of the Conference and Workshop on Neural Information Processing Systems, New Orleans, LA, USA, 12 October 2022. [Google Scholar] [CrossRef]


| Methods | IoU | mIoU | OA | |||||||
|---|---|---|---|---|---|---|---|---|---|---|
| Road | Road Marking | Natural | Building | Utility Line | Pole | Car | Fence | |||
| PointNet++ | 91.4 | 7.6 | 89.8 | 74.0 | 68.6 | 59.5 | 54.0 | 7.5 | 56.6 | 91.2 |
| PointNet++ (MSG) | 90.7 | 0.0 | 86.7 | 75.8 | 56.2 | 60.9 | 44.5 | 10.2 | 53.1 | 90.6 |
| DGCNN | 90.6 | 0.4 | 81.3 | 64.0 | 47.1 | 56.9 | 49.3 | 7.3 | 49.6 | 89.0 |
| KPFCNN | 90.2 | 0.0 | 86.8 | 86.8 | 81.1 | 73.1 | 42.9 | 21.6 | 60.3 | 91.7 |
| MS-PCNN | 91.0 | 3.5 | 90.5 | 77.3 | 62.3 | 68.5 | 53.6 | 17.1 | 58.0 | 91.5 |
| TGNet | 91.4 | 10.6 | 91.0 | 76.9 | 68.3 | 66.3 | 54.1 | 8.2 | 58.3 | 91.6 |
| MS-TGNet | 90.9 | 18.8 | 92.2 | 80.6 | 69.4 | 71.2 | 51.1 | 13.6 | 61.0 | 91.7 |
| RandLA-Net | 96.6 | 66.7 | 96.2 | 89.3 | 85.9 | 81.0 | 78.8 | 29.5 | 78.0 | 96.6 |
| Point Transformer | 96.7 | 64.6 | 95.9 | 91.0 | 87.6 | 79.0 | 87.5 | 36.9 | 79.9 | 96.8 |
| ours | 98.1 | 75.7 | 98.5 | 96.4 | 90.5 | 86.7 | 96.5 | 69.0 | 88.9 | 98.4 |
| Methods | IoU | mIoU | OA | |||||
|---|---|---|---|---|---|---|---|---|
| Ground | Building | Car | Vegetation | Pole | Bridge | |||
| SnapNet | 42.8 | 43.9 | 6.0 | 10.8 | 0.0 | 0.0 | 17.3 | 54.8 |
| PointNet++ | 92.8 | 90.5 | 65.6 | 72.5 | 26.4 | 69.6 | 69.6 | 94.1 |
| 3D CNN | 78.2 | 90.5 | 1.3 | 5.4 | 0.5 | 0.2 | 19.2 | 58.4 |
| DeepNet | 79.9 | 35.3 | 8.7 | 8.6 | 0.3 | 0.0 | 22.2 | 61.2 |
| KPConv | 94.1 | 87.8 | 66.6 | 77.5 | 0.0 | 0.0 | 54.3 | 93.6 |
| RandLA-Net | 92.0 | 87.9 | 79.9 | 67.3 | 17.0 | 6.0 | 58.3 | 93.3 |
| Point Transformer | 93.0 | 92.8 | 74.9 | 93.8 | 22.1 | 49.8 | 71.0 | 95.4 |
| ours | 95.8 | 95.1 | 88.9 | 98.6 | 44.5 | 58.9 | 80.3 | 97.2 |
| Methods | IoU | mIoU | OA | |||||
|---|---|---|---|---|---|---|---|---|
| Ground | Building | Car | Vegetation | Pole | Bridge | |||
| SnapNet | 40.2 | 38.4 | 0.2 | 8.4 | 0.0 | - | 17.5 | 52.3 |
| PointNet++ | 89.8 | 87.2 | 25.1 | 34.5 | 22.8 | - | 51.9 | 91.2 |
| 3D CNN | 71.0 | 56.5 | 1.3 | 9.1 | 1.5 | - | 27.9 | 69.9 |
| DeepNet | 71.3 | 44.9 | 0.9 | 10.6 | 0.5 | - | 25.6 | 63.3 |
| KPConv | 87.5 | 88.7 | 63.2 | 54.8 | 0.5 | - | 58.8 | 92.4 |
| RandLA-Net | 90.2 | 90.3 | 54.5 | 48.0 | 34.4 | - | 63.5 | 93.4 |
| Point Transformer | 88.2 | 90.2 | 54.1 | 56.5 | 40.5 | - | 65.9 | 94.6 |
| ours | 93.7 | 94.6 | 69.6 | 68.6 | 46.5 | - | 74.6 | 96.2 |
| Method | mAcc | mIoU | Params (M) | Latency (s) |
|---|---|---|---|---|
| KPConv | 72.8 | 67.1 | 14.9 | 105.15 |
| PAConv | 73.0 | 66.6 | 90.1 | 28.13 |
| Point Transformer | 76.5 | 70.4 | 12.8 | 18.07 |
| Fast Point Transformer | 77.3 | 70.1 | 37.9 | 1.13 |
| Stratified Transformer | 78.1 | 72.0 | 92.0 | 43.02 |
| PointNeXt-XL | 83.0 | 74.9 | 41.6 | 38.16 |
| PSNet (ours) | 77.8 | 71.2 | 21.87 | 7.03 |
| ID | mIoU (%) | ||
|---|---|---|---|
| 1 | 128 | 200 | 63.5 |
| 2 | 128 | 400 | 72.2 |
| 3 | 128 | 800 | 85.9 |
| 4 | 256 | 200 | 76.7 |
| 5 | 256 | 400 | 88.9 |
| 6 | 256 | 800 | 87.5 |
| 7 | 512 | 200 | 86.3 |
| 8 | 512 | 400 | 88.7 |
| 9 | 512 | 800 | 87.8 |
| ID | IPG | SFE | PE | CPFA | mIoU (%) |
|---|---|---|---|---|---|
| 1 | - | - | - | - | 79.9 |
| 2 | √ | √ | - | - | 85.6 |
| 3 | √ | √ | √ | - | 86.8 |
| 4 | √ | √ | √ | √ | 88.9 |
Disclaimer/Publisher’s Note: The statements, opinions and data contained in all publications are solely those of the individual author(s) and contributor(s) and not of MDPI and/or the editor(s). MDPI and/or the editor(s) disclaim responsibility for any injury to people or property resulting from any ideas, methods, instructions or products referred to in the content. |
© 2025 by the authors. Licensee MDPI, Basel, Switzerland. This article is an open access article distributed under the terms and conditions of the Creative Commons Attribution (CC BY) license (https://creativecommons.org/licenses/by/4.0/).
Share and Cite
Yi, H.; Liu, Y.; Wang, M. PSNet: Patch-Based Self-Attention Network for 3D Point Cloud Semantic Segmentation. Remote Sens. 2025, 17, 2012. https://doi.org/10.3390/rs17122012
Yi H, Liu Y, Wang M. PSNet: Patch-Based Self-Attention Network for 3D Point Cloud Semantic Segmentation. Remote Sensing. 2025; 17(12):2012. https://doi.org/10.3390/rs17122012
Chicago/Turabian StyleYi, Hong, Yaru Liu, and Ming Wang. 2025. "PSNet: Patch-Based Self-Attention Network for 3D Point Cloud Semantic Segmentation" Remote Sensing 17, no. 12: 2012. https://doi.org/10.3390/rs17122012
APA StyleYi, H., Liu, Y., & Wang, M. (2025). PSNet: Patch-Based Self-Attention Network for 3D Point Cloud Semantic Segmentation. Remote Sensing, 17(12), 2012. https://doi.org/10.3390/rs17122012