Next Article in Journal
Cross-Year Rapeseed Yield Prediction for Harvesting Management Using UAV-Based Imagery
Previous Article in Journal
HyperSMamba: A Lightweight Mamba for Efficient Hyperspectral Image Classification
Previous Article in Special Issue
Assessment of Landslide Susceptibility Based on the Two-Layer Stacking Model—A Case Study of Jiacha County, China
 
 
Due to scheduled maintenance work on our database systems, there may be short service disruptions on this website between 10:00 and 11:00 CEST on June 14th.
Technical Note

Synergizing Multi-Temporal Remote Sensing and Systemic Resilience for Rainstorm–Flood Risk Zoning in the Northern Qinling Foothills: A Geospatial Modeling Approach

1
College of Civil and Architecture Engineering, Xi’an University of Science and Technology, Xi’an 710054, China
2
College of Art, Xi’an University of Science and Technology, Xi’an 710054, China
3
College of Geological Engineering and Geomatics, Chang’an University, Xi’an 710054, China
4
Institute of Geosafety, China University of Geosciences, Beijing 100083, China
5
School of Civil Engineering, Chang’an University, Xi’an 710054, China
6
Academy of Qinling Ecological Environment, Chang’an University, Xi’an 710054, China
7
Northwest Land and Resources Research Center, Shaanxi Normal University, Xi’an 710119, China
8
Institute of Transportation Geography, Shaanxi Normal University, Xi’an 710119, China
*
Author to whom correspondence should be addressed.
Remote Sens. 2025, 17(12), 2009; https://doi.org/10.3390/rs17122009
Submission received: 22 April 2025 / Revised: 27 May 2025 / Accepted: 29 May 2025 / Published: 11 June 2025

Abstract

:
The northern foothills of the Qinling Mountains, a critical ecological barrier and urban–rural transition zone in China, face intensifying rainstorm–flood disasters under climate extremes and rapid urbanization. This study pioneers a remote sensing-driven, dynamically coupled framework by integrating multi-source satellite data, system resilience theory, and spatial modeling to develop a novel “risk identification–resilience assessment–scenario simulation” chain. This framework quantitatively evaluates the nonlinear response mechanisms of town–village systems to flood disasters, emphasizing the synergistic effects of spatial scale, morphology, and functional organization. The proposed framework uniquely integrates three innovative modules: (1) a hybrid risk identification engine combining normalized difference vegetation index (NDVI) temporal anomaly detection and spatiotemporal hotspot analysis; (2) a morpho-functional resilience quantification model featuring a newly developed spatial morphological resilience index (SMRI) that synergizes landscape compactness, land-use diversity, and ecological connectivity through the entropy-weighted analytic hierarchy process (AHP); and (3) a dynamic scenario simulator embedding rainfall projections into a coupled hydrodynamic model. Key advancements over existing methods include the multi-temporal SMRI and the introduction of a nonlinear threshold response function to quantify “safe-fail” adaptation capacities. Scenario simulations reveal a reduction in flood losses under ecological priority strategies, outperforming conventional engineering-based solutions by resilience gain. The proposed zoning strategy prioritizing ecological restoration, infrastructure hardening, and community-based resilience units provides a scalable framework for disaster-adaptive spatial planning, underpinned by remote sensing-driven dynamic risk mapping. This work advances the application of satellite-aided geospatial analytics in balancing ecological security and socioeconomic resilience across complex terrains.

1. Introduction

Frequent extreme weather events have emerged as one of the most severe global challenges of the 21st century [1,2]. According to the Sixth Assessment Report by the Intergovernmental Panel on Climate Change, precipitation-related natural disasters (e.g., rainstorms, floods, and debris flows) accounted for over 40% of global natural hazards between 1980 and 2020, with monsoon-affected Asia experiencing the fastest growing impacts of such events [3]. As a monsoon-dominated nation, China has witnessed accelerated socioeconomic development and urbanization over the past two decades (2001–2020), leading to the expanded exposure of populations and assets. Consequently, direct economic losses from rainstorm–flood disasters have surged by 15% annually since 2000 [4,5,6,7]. The northern foothills of the Qinling Mountains, a climactic transition zone between northern and southern China and a tectonically active region [8], are characterized by a fragmented topography, ecological sensitivity, and dense human settlements. Data from the China Meteorological Data Service Center (2011–2024) reveal a statistically significant upward trend in extreme precipitation within this area, particularly during the summer months [9,10]. Catastrophic events, such as the August 2023 flash flood in Luanzhen Subdistrict (Chang’an District), which claimed 21 lives with 98% of casualties occurring in design-compliant levee zones, underscore the limitations of conventional engineering defenses against superstandard disasters. Similarly, the July 2024 collapse of the Daning Highway bridge in Zha Shui County exposed the vulnerability of linear infrastructure under extreme hydrological stress. Recurrent rainstorm–flood disasters not only inflict substantial socioeconomic losses but also highlight systemic deficiencies in traditional disaster management frameworks across the region.
Globally, rainstorm–flood governance has evolved through three paradigmatic shifts, predominantly within urban contexts [11,12,13,14,15,16]. The Engineered Defense paradigm prioritized structural interventions such as levees and reservoirs. Transitioning to the Risk Governance framework by the late 20th century, the emphasis shifted toward risk mapping and contingency planning [11]. Post-2015, the Sendai Framework catalyzed the Systemic Resilience paradigm, advocating spatial reconfiguration to enhance adaptive capacities. Its 2023 Midterm Review introduced “All-Hazard Resilience”, integrating rainstorm–flood management into urban renewal and rural revitalization strategies [13]. Regulatory exemplars include Australia’s Disaster Resilience Handbook, mandating climate-adaptive drainage systems aligned with the Sixth Assessment Report by the Intergovernmental Panel on Climate Change scenarios for 2050 [14]; the UK’s National Flood Resilience Strategy, which innovatively zones urban expansion areas as floodplains [15]; and Japan’s Climate Adaptation Act, legally requiring municipal-level “Rainstorm Resilience Maps” in land-use plans [16]. Building on these frameworks, Chinese scholars have developed localized models characterized by urban focus, practice-driven methodologies, and interdisciplinary fusion [17,18,19,20,21,22,23,24,25,26,27,28]. For instance, Chen et al. built spatially explicit hazard loss and vulnerability models validated through Juma River Basin flash flood simulations [25]; Zhang et al. established a triaxial social resilience framework (urban load-bearing capacity–resource endowment–resource allocation) for flood governance [26]; Li et al. developed a geographic information system–analytic hierarchy process (GIS-AHP) integrated resilience assessment model applied to Kunshan City, Jiangsu Province [27]; Yin et al. implemented the entropy-weighted technique for order preference by similarity to ideal solution (TOPSIS) within a pressure–state–response framework for Fuzhou City (2018–2022) [28]. Research on the application of remote sensing technology in flood disasters has been increasing [29,30,31,32,33,34]. Given the formidable challenges posed by mountainous geomorphic complexity, deficient monitoring infrastructure, and inadequate historical disaster records in rainstorm–flood mitigation, Shen et al. developed a multimodal flood disaster knowledge graph through the synergistic extraction of remote sensing imagery features and social media textual knowledge, effectively enhancing the situational awareness of flood-prone regions [32]. Tang et al. established a hydrologic engineering center hydrologic modeling system hydrodynamic simulation framework, which accurately reconstructs spatiotemporal flood propagation dynamics under rainfall scenarios across varied recurrence intervals in small watersheds of the Taihang Mountain region [33]. Conversely, research on town–village systems remains nascent, with the extant studies concentrating on rural vulnerability indices [35], resilience metrics [36,37,38], and risk mitigation protocols [39,40].
The existing research on rainstorm–flood hazards predominantly focuses on urban-scale disaster resilience, spanning pre-disaster preparedness, emergency response, and post-disaster recovery phases. Yet, it inadequately addresses the systematic vulnerability deconstruction of town–village systems, particularly the nonlinear rainstorm–flood mechanisms specific to mountainous rural settlements. The current methodologies disproportionately emphasize post-disaster rescue capacity evaluation and reconstruction efficiency metrics, while critical gaps persist in proactive spatial morphological interventions for pre-disaster prevention, especially under the rigid “Three Zones and Three Lines” regulatory framework of territorial spatial planning. To address these limitations, this study innovatively integrates morphological theory and complex system principles, transcending the conventional “hazard-space dichotomy” paradigm. By establishing a “risk identification–resilience assessment–prevention optimization” methodological chain, we propose technical pathways for rainstorm–flood governance in town–village territorial spatial planning, thereby propelling a paradigm shift from “empirical passive resistance” to “proactive risk-adapted spatial planning” for mountainous town–village systems exemplified by the northern foothills of the Qinling Mountains.
As shown in Figure 1, this article is composed of the following sections: Section 2 describes the basic mathematical models of rainstorm–flood disaster identification, the spatial morphological resilience index (SMRI), and multi-scenario simulation and validation. Section 3 covers the experimental arrangement and presents three development scenarios. Section 4 discusses five management control zones: high risk–high resilience (HR-HR), high risk–medium resilience (HR-MR), medium risk–medium resilience (MR-MR), low risk–medium resilience (LR-MR), and low risk–low resilience (LR-LR). Section 5 provides a summary and conclusions.

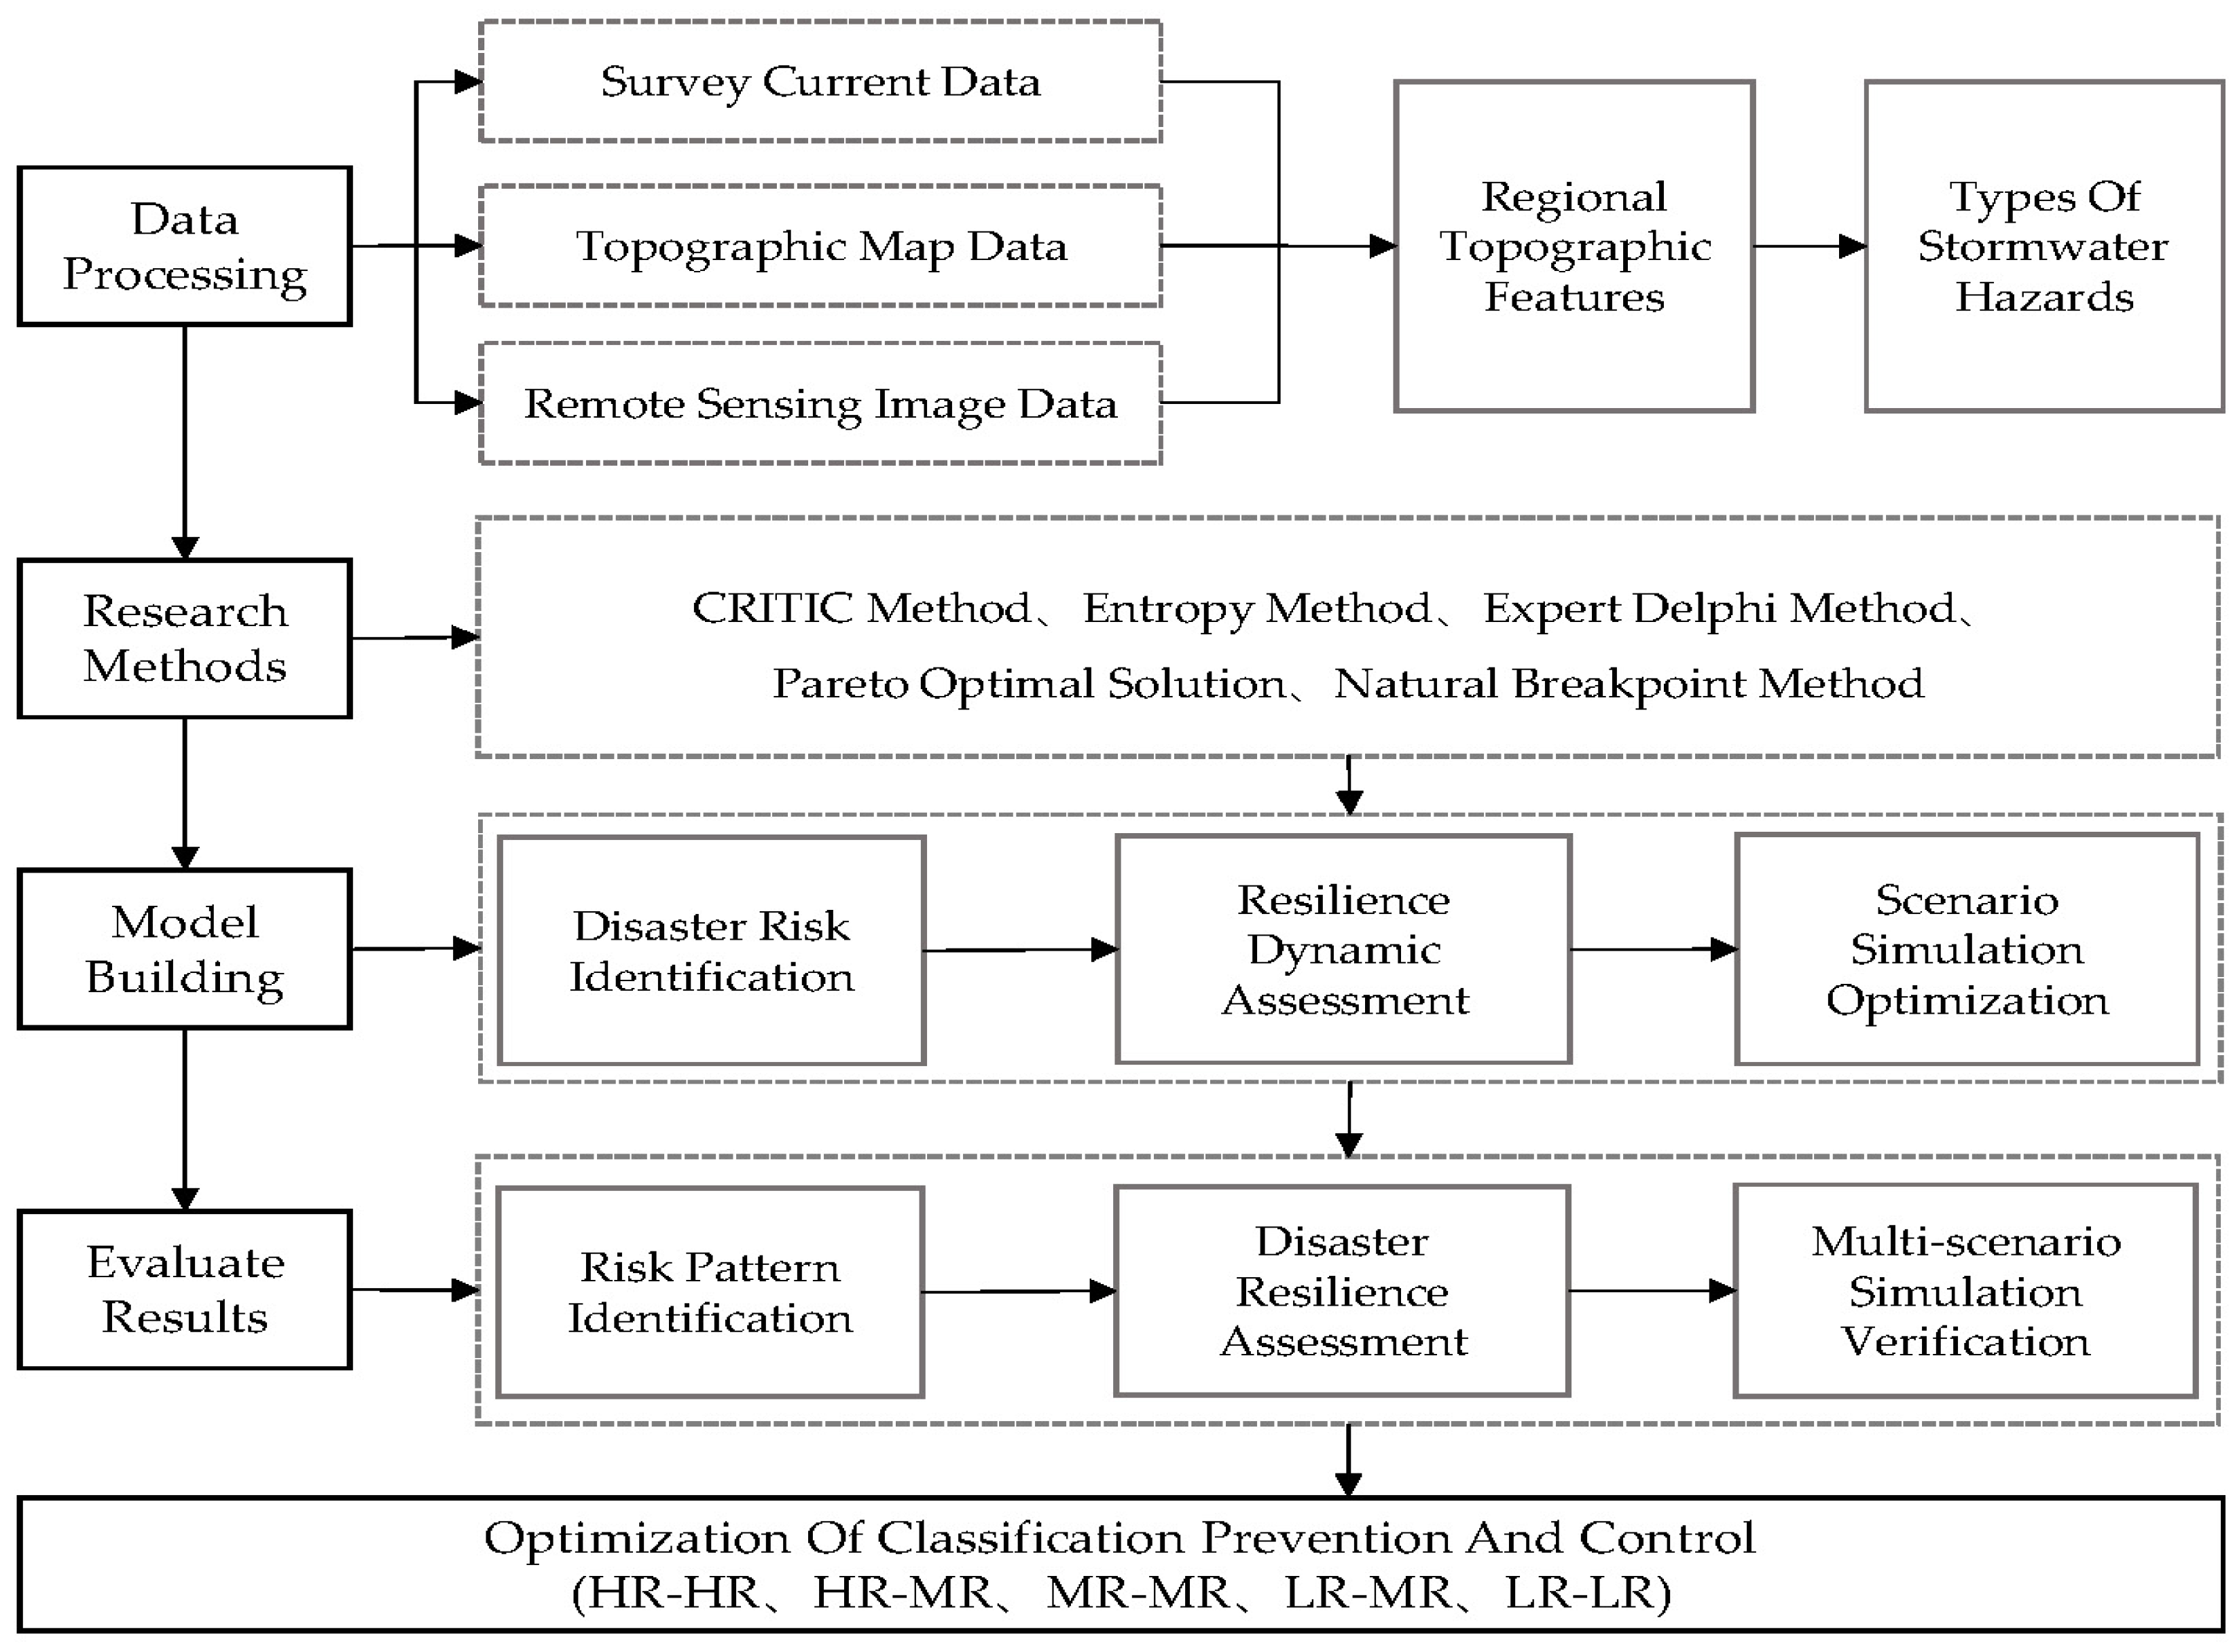
2. Materials and Methods

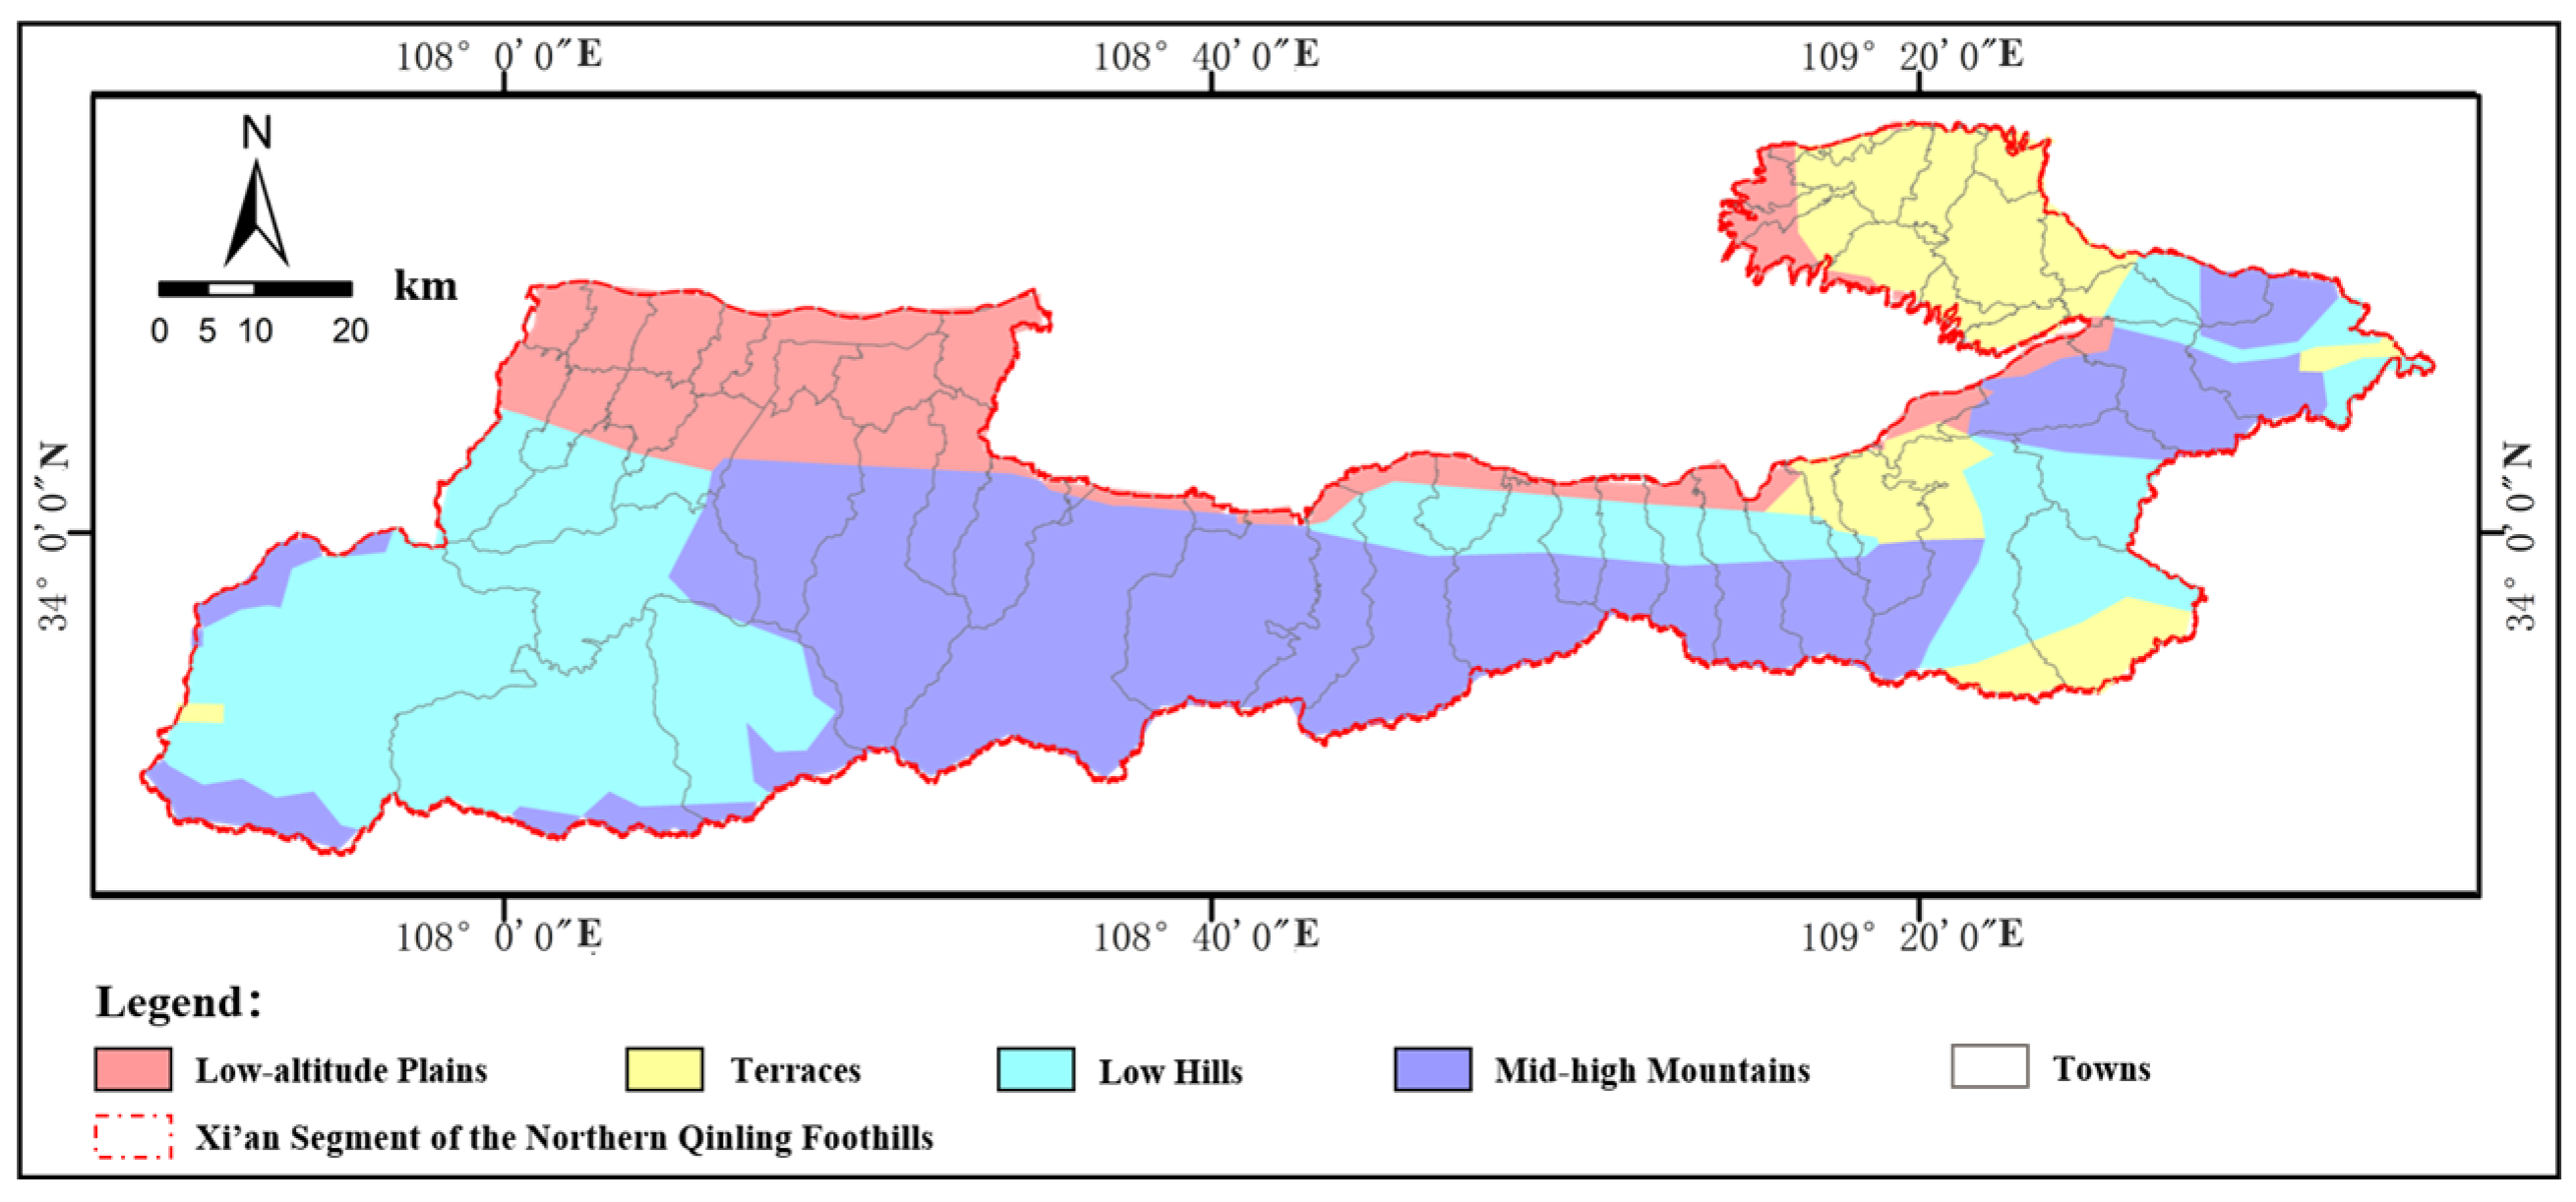
2.1. Geomorphological Settings

As a paradigmatic case study of rainstorm–flood risks, the northern Qinling foothills exhibit three unique disaster formation mechanisms:
(1)
Geographical Pattern
This region is situated at the convergence zone of the Qinling Orogenic Belt and Fen-Wei Graben System, characterized by a topographical elevation differential exceeding 2500 m, where slopes greater than 25° account for 63% of the total area, creating high susceptibility to cascading disasters triggered by intense rainfall events;
(2)
Climatic Characteristics
This region, subjected to the compounding effects of the East Asian Monsoon and topographic uplift forcing, exhibits significantly shortened recurrence intervals of localized intense rainfall events (≤50-year return period reduced to <10 years), driving amplified cascading hydrological risks [10];
(3)
Human Dimensions
The town–village spatial pattern in this region exhibits “linear expansion along gully valleys” [41], with over half of residential settlements located within historical erosional gullies. This spatial distribution inherently creates a “spatially coupled hazard settlement dilemma”, where anthropogenic development boundaries overlap with high-probability debris flow trajectories.
This study focuses on the Xi’an segment of the northern Qinling foothills (E107°40′–109°49′, N33°42′–34°45′; total area: 6466.93 km2), covering 66.67% of the Qinling northern piedmont and encompassing 57 towns and 642 villages across four districts (e.g., Baqiao, Chang’an, Huyi) and two counties. This area represents a quintessential geomorphic transition zone with intensive human activities.
Based on the Geomorphological Atlas of China (1:1,000,000) classification and 30 m resolution DEM analysis, the geomorphology of this region has been shaped by the dual influence of tectonic uplift and denudation processes, resulting in a stepped spatial configuration characterized by steep, high mountains, terraced transitional zones, and convergent alluvial plains (Figure 2). Four geomorphic units were delineated: low-altitude plains (<900 m), low-altitude terraces (900–1446 m), low hills (1447–2000 m), and mid-high mountains (>2000 m) [41,42,43]. Town densities decrease from 1.2 units per 100 km2 in low-altitude plains to 0.3 units per 100 km2 in mid-high mountains, while villages display a polarized “low-hill clustering and mid-mountain dispersion” distribution (Figure 3). These patterns underscore the deterministic role of geomorphology in settlement configuration (Table 1), with the elevation and slope gradient as primary constraints.

2.2. Classification of Rainstorm–Flood Hazards

Based on data from the China Statistical Yearbook of Natural Disasters and Shaanxi Provincial Disaster Bulletin, combined with multidimensional analyses of the topography, settlement patterns, and geological conditions in the Xi’an segment of the northern Qinling foothills, rainstorm–flood hazards in this region are classified into three typologies (Table 2): flash flood-dominated, urban inundation-dominated, and cascading composite hazards. These categories exhibit distinct formation mechanisms, spatial distributions, and socioeconomic impacts, with the damage severity strongly correlated to geoenvironmental and anthropogenic factors.
(1)
Flash Flood-Dominated Hazards
Triggered by short-duration, intense rainfall (≥50 mm/h) interacting with steep slopes (>15°), this natural dynamic system dominates in high-elevation valleys (800–1500 m). Characteristics include abrupt onset (40 min average rainfall-to-disaster lag) and destructive hydraulic forces (peak flow velocity: 6.2 m/s; maximum inundation depth: 5.8 m). Constrained by the topography, settlements cluster linearly along gullies, elevating exposure indices (>75th percentile). Coupled with inadequate early warning infrastructure (siren coverage < 40%), these factors amplify systemic vulnerability;
(2)
Urban Inundation-Dominated Hazards
Driven by hydrological cycle disruptions from urbanization, this anthropogenic system prevails within 2 km of urban expansion boundaries. Key contributing factors include low-lying terrain (average elevation drop < 5 m within 10 km2), impervious surface coverage > 75%, and aging drainage systems designed for ≤3-year return periods, versus observed extremes reaching 50-year intensities. Newly developed zones suffer disproportionately due to improper design elevations;
(3)
Cascading Composite Hazards
Exhibiting multi-phase “flash flood → landslide → river blockage → dammed lake → outburst flood” sequences, these hybrid systems concentrate in tectonically active zones (500–1200 m elevation). Trigger probabilities triple conventional flash floods due to the joint effects of high gravitational potential (slopes > 25°), fault zone fragility, and slope-cutting activities. Post-disaster assessments reveal per capita economic losses doubling, with recovery periods extending, due to cascading infrastructure failures.

2.3. Data Sources and Processing

This study constructs a spatiotemporal “Hazard-Spatial” database for towns and villages in the Xi’an segment of the northern Qinling foothills by integrating six data categories (Table 2): geospatial data, meteorological hydrological data, land-use data, socioeconomic data, disaster records, and planning documents. A multidimensional data cube was generated to unify natural, social, and spatial variables. Heterogeneous datasets underwent normalization processing via datum unification (WGS84/UTM Zone 49N), error control (RMSE < 0.5 pixels for co-registration), and dynamic fusion (STARFM algorithm for spatiotemporal gap filling), yielding an uncertainty baseline for risk modeling.

2.4. Rainstorm–Flood Risk Identification Model

Conventional pressure–state–response (PSR) models, constrained by linear causality assumptions, inadequately capture complex spatial interactions in mountainous town–village systems. They thus advance a spatially explicit hierarchical index system incorporating the following (Table 3):
Pressure Layer (Hazard Drivers): enhanced with climate variability sensitivity (maximum 1 h rainfall intensity), resolving elevation-dependent rainfall gradients (ANUSPLIN interpolation; 1 km2 grids);
State Layer (Preparing Environment): Geographically Weighted Regression (GWR) addresses spatial autocorrelation;
Response Layer (Vulnerability): adaptive dynamics metrics quantify human–environment feedback, including facility accessibility via two-step floating catchment area (2SFCA) analysis.
The CRITIC method emphasizes indicator contrast intensity and conflict analysis, while the entropy weight method quantifies data dispersion. An integrated CRITIC–entropy-weighting framework is employed to assign weights to nine indicators across three criterion layers:
(1)
CRITIC Method
Quantifies contrast intensity (standard deviation) and conflict (correlation coefficients):
C j = σ j × i = 1 m ( 1 r i j )
where C j denotes the comprehensive information content of indicator j, reflecting its independence and discriminative power. Larger C j values indicate higher significance (strong contrast intensity and low conflict).
σ j represents the standard deviation of indicator j.
r i j is the Pearson correlation coefficient between indicators i and j;
(2)
Entropy Weight Method
Computes information entropy to evaluate data dispersion:
e j = k i = 1 n p i j ln p i j ,   W j ( E ) = 1 e j k = 1 m ( 1 e j )
where e j is the entropy value of indicator j, inversely proportional to the data dispersion (lower entropy indicates higher information content).
k = 1 ln , where n is a normalization constant.
p i j is the standardized probability of sample i in indicator j.
W j ( E ) represents entropy-derived weights;
(3)
Composite Weighting
Integrates CRITIC and entropy weights via the following:
W j = 0.6 × C j C j + 0.4 × W j ( E )
where W j denotes the final composite weight for indicator j.
C j C j is the normalized CRITIC weight ensured.
C j is the total composite information content across all indicators.
α = 0.6 is the empirical coefficient calibrated via Monte Carlo simulations. Its validity has been demonstrated through statistical significance testing and high goodness of fit (Table 4).

2.5. Spatial Morphological Resilience Index (SMRI) Model

Rooted in the “Morphogenetic-Disaster Representation” coupling theory, the spatial morphological resilience index (SMRI) model conceptualizes spatial morphology as the cardinal regulator of disaster adaptability. We evaluate the rainstorm–flood resilience of town–village systems in the Xi’an segment through three dimensions: construction scale adaptability, land-use coordination, and functional organization elasticity:
(1)
Construction-Scale Adaptability Index ( S s c a l e )
This index quantifies the deviation between the actual built-up intensity and its optimal disaster-adapted threshold, serving as a regulatory lever for urban expansion limits. The index ranges between 0 and 1 (0 ≤ S s c a l e ≤ 1), where a value closer to 1 indicates that the actual built-up intensity aligns with the optimal disaster-resilient level, reflecting a stronger adaptive capacity:
S s c a l e = 1 A a c t u a l A o p t i m a l A o p t i m a l
A a c t u a l (actual built-up intensity, %): the proportion of built-up area relative to the total land area within the Xi’an segment of the northern Qinling foothills;
A o p t i m a l (optimal built-up intensity, %): determined as 27.5% through hazard loss curve analyses (with hazard risk minimized via nonlinear least-squares fitting, R2 = 0.89), reflecting the safety threshold where the disaster risk and development intensity reach an optimal equilibrium point;
(2)
Land-Use Coordination Index ( S f o r m )
This index evaluates the spatial rationality of land patches, integrating geomorphic stability and resource efficiency, and it spans a normalized range of 0 to 1 (0 ≤ S f o r m ≤ 1). Values approaching 1 denote superior land-use coordination, characterized by minimized fragmentation and optimal spatial configuration aligned with natural geomorphic processes:
S f o r m = 1 3 C + 1 D + C A
C (Compactness Index): quantifies the geometric cohesiveness of land patches using the ratio of the patch area to its minimum bounding circle area;
D (Fragmentation Index): measures the spatial disaggregation of land patches;
C A  (Form Index): synthesizes shape complexity and area regulation via the fractal dimension adjusted formula;
(3)
Functional Organization Elasticity Index ( S f u n c t i o n )
This index quantifies the stability of socioeconomic functions under rainstorm–flood risks in the Xi’an segment, balancing land-use functional diversity (adaptive capacity) and facility service accessibility (recovery capacity) to achieve synergy between resilience redundancy and service efficiency:
S f u n c t i o n = λ × M + ( 1 λ ) × A P O I
M (land-use mixedness, Shannon Diversity Index): measures the diversity of land-use functions (residential, commercial, industrial, etc.) using Shannon entropy;
A P O I (facility accessibility): evaluates the ease of accessing critical emergency services (e.g., hospitals, shelters, supply depots) via normalized two-step floating catchment area (2SFCA) analysis;
Λ (correlation weight, 0.55): calibrated through Pearson correlation analysis between historical disaster impacts and recovery speeds, emphasizing functional diversity as the dominant resilience driver (Table 5);
(4)
Comprehensive Spatial Resilience Model
Integrating the three indices, construction-scale adaptability (CSA), land-use coordination, and functional organization elasticity, a composite resilience capacity evaluation model is formulated to systematically assess the rainstorm–flood resilience of the Xi’an segment’s town–village systems. Hybrid weighting coefficients are derived through principal component analysis and Delphi expert surveys, establishing a quantifiable linkage between morphological parameters and disaster loss mitigation:
S M R I = 0.38 × S s c a l e + 0.29 × S f o r m + 0.33 × S f u n c t i o n
S s c a l e (0.38): reflects the direct impact of the land development intensity on disaster loss amplification;
S f o r m (0.29): captures morphology-mediated resilience via stormwater drainage efficiency and emergency mobility;
S f u n c t i o n (0.33): represents adaptive functional organization, including rapid post-disaster resource reallocation and land-use flexibility.

2.6. Multi-Scenario Simulation and Validation Model

The multi-scenario simulation framework employed a “predict intervene–validate” workflow to dynamically inform resilience planning for town–village systems in the Xi’an segment of the northern Qinling foothills. Building on the spatial morphological resilience index (SMRI) model, we integrated three drivers, climate change, spatial development patterns, and cascading rainstorm–flood risks, with adaptive inertia-optimized land transition rules to construct a coupled CLUE-S-FLUS (Conversion of Land Use and its Effects-Scenarios-Future Land Use Simulation) model. Three policy-oriented scenarios were simulated (Table 6): business as usual, ecological priority, and intensive development.
(1)
Land-Use Demand Projection (2035)
Land-use transitions under each scenario are projected via Markov chain analysis, targeting Production–Living–Ecological land allocations:
S k t + 1 = i = 1 n P i k × S i t
S k t + 1 : the predicted area of land-use type k in the target year (2035) (unit: km2), derived from coupled CLUE-S-FLUSs under scenario-specific transition rules;
S i t : actual area of land-use type i in the baseline year (2020) (unit: km2), extracted from Landsat-8 OLI land cover classification;
P i k : transition probability from type i to k, modeled via historical transition matrices and refined through adaptive inertia weights in the FLUS framework;
(2)
Spatial Allocation Rules (FLUS Module)
The FLUS module dynamically adjusts land-use transitions through a coupled interaction of neighborhood effects (Ω), development suitability (P), adaptive inertia coefficients, and policy constraints:
T P i , k = P i , k × Ω i , k t × I A k t
P i , k (development suitability probability, range [0,1]): predicted via Random Forest machine learning, integrating 12 natural and socioeconomic drivers (slope, distance to roads, GDP density, etc.) to quantify suitability for land-use type k;
Ω i , k t (neighborhood effect factor): the spatial transition likelihood of a grid cell to land-use type k is amplified by the facilitative effect of neighboring land-use patterns;
I A k t (adaptive inertia coefficient): dynamically tunes conversion rates to match the total projected demand;
R c o n (policy constraint factor): enforces absolute prohibitions on land-use transitions in zones of ecological or regulatory significance, such as China’s Ecological Conservation Redlines;
(3)
Calibration and Validation
The model’s predictive capacity was rigorously validated against observed land-use data from 2015 to 2020, achieving a Kappa coefficient of 0.83 and a simulation error rate for built-up areas below 7%. To optimize the trade-offs between disaster risk reduction and spatial resilience enhancement, a multi-objective genetic algorithm was implemented to derive Pareto-optimal solutions:
M i n i n m i z e L d i s a s t e r S M R I
L d i s a s t e r (predicted disaster loss, 104 CNY/km2): computed via risk exposure vulnerability value model;
SMRI (spatial morphological resilience index): the range is between 0 and 1.

3. Results

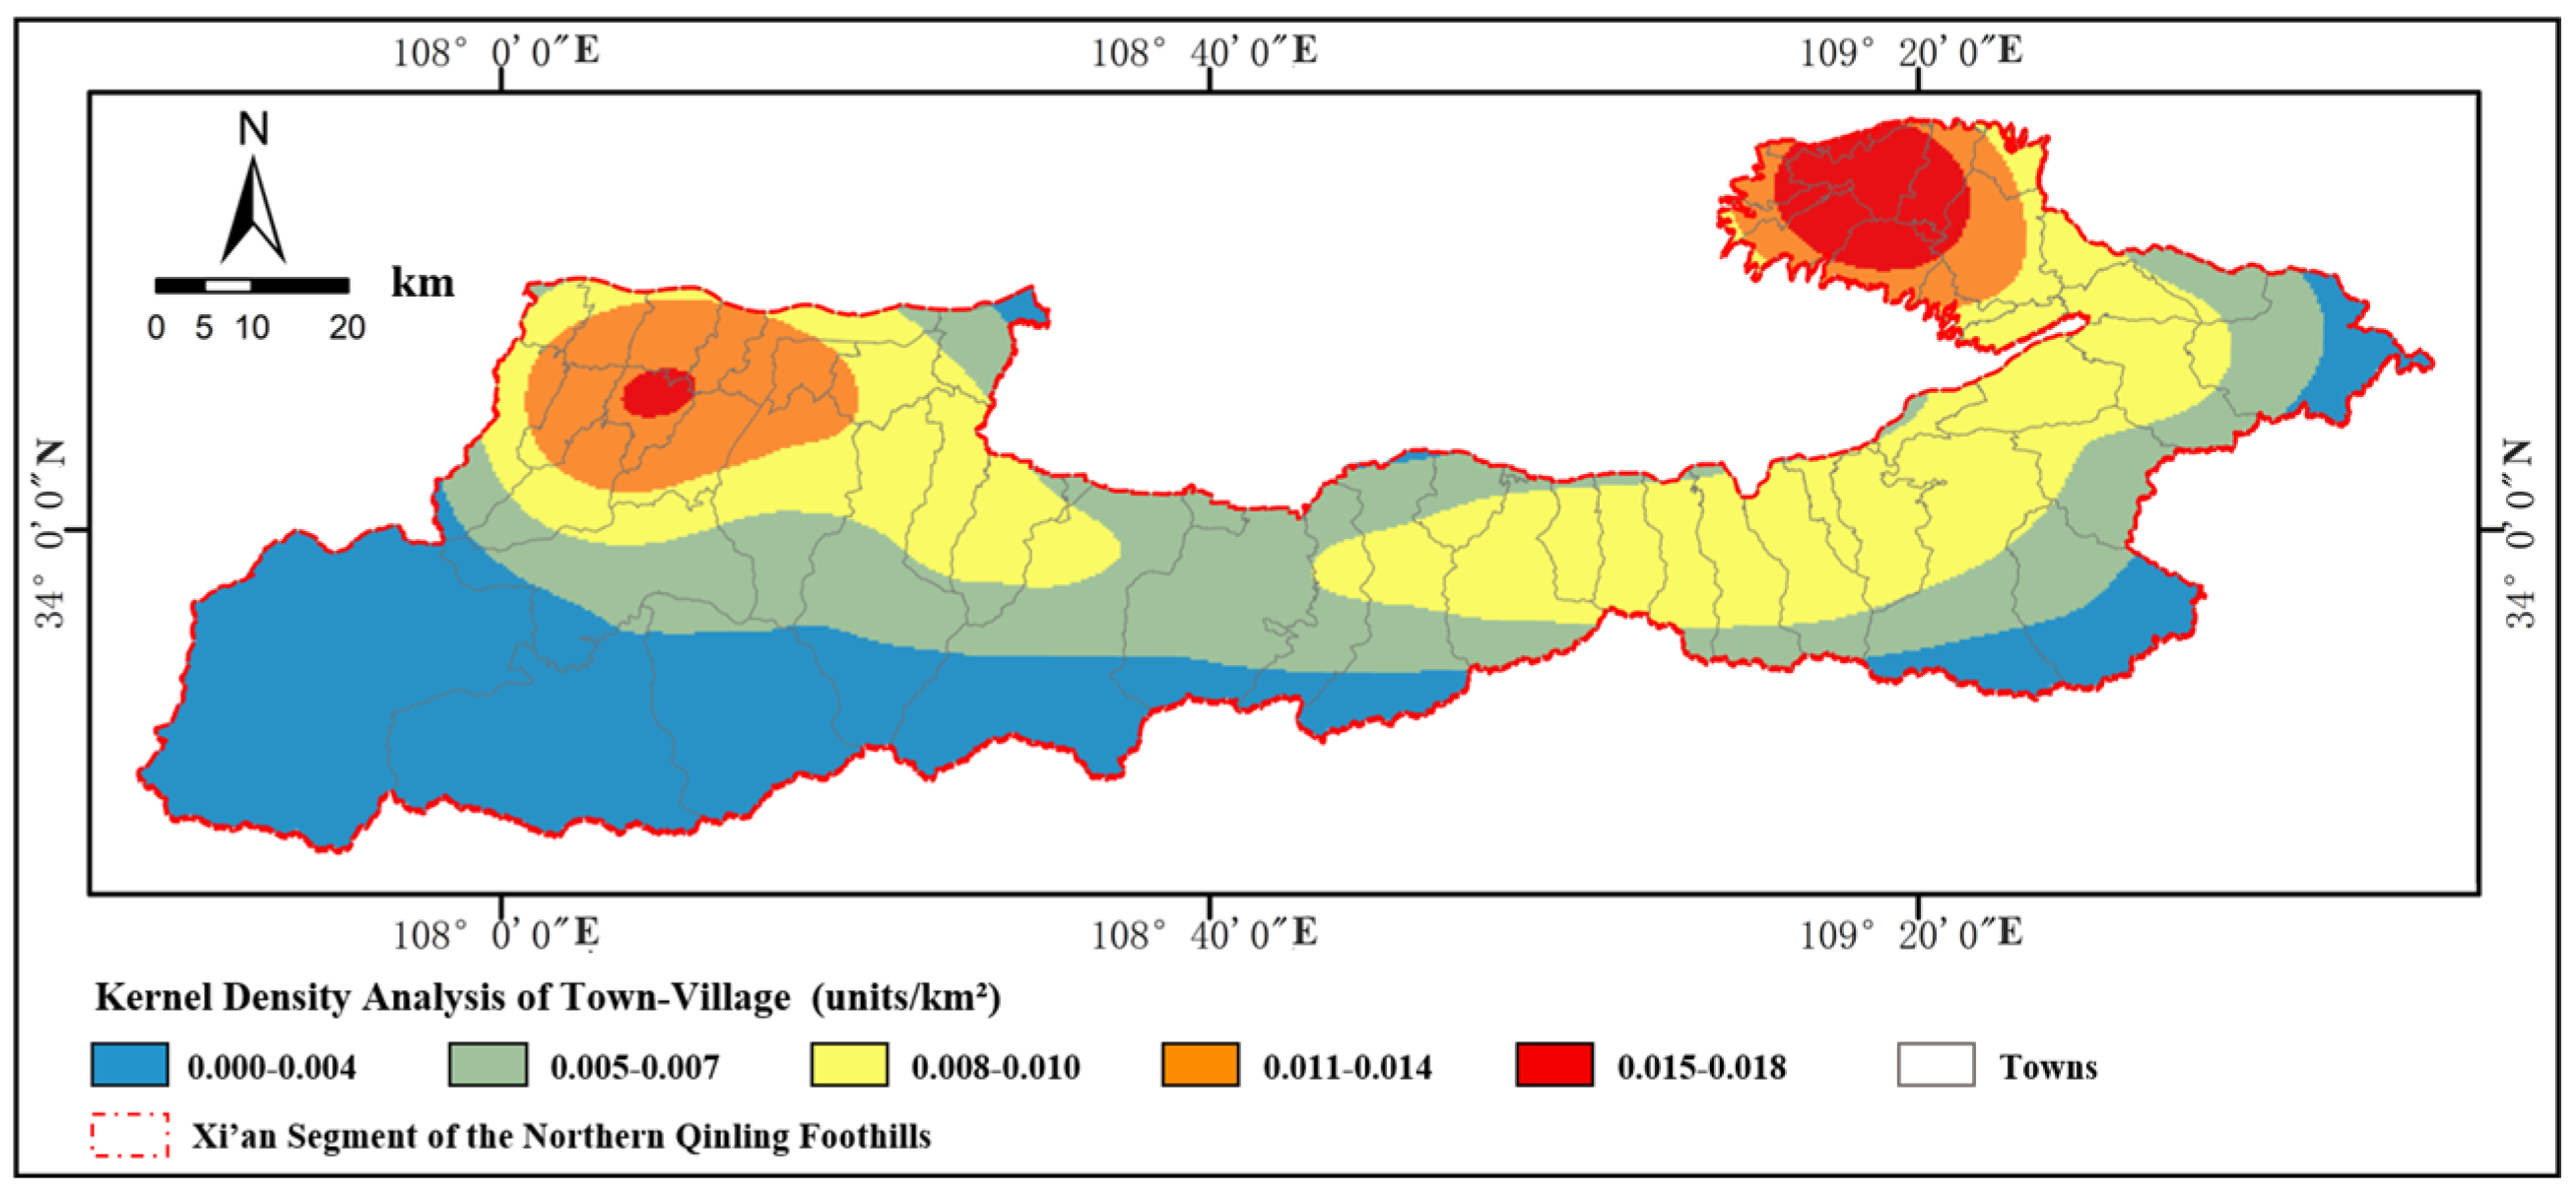
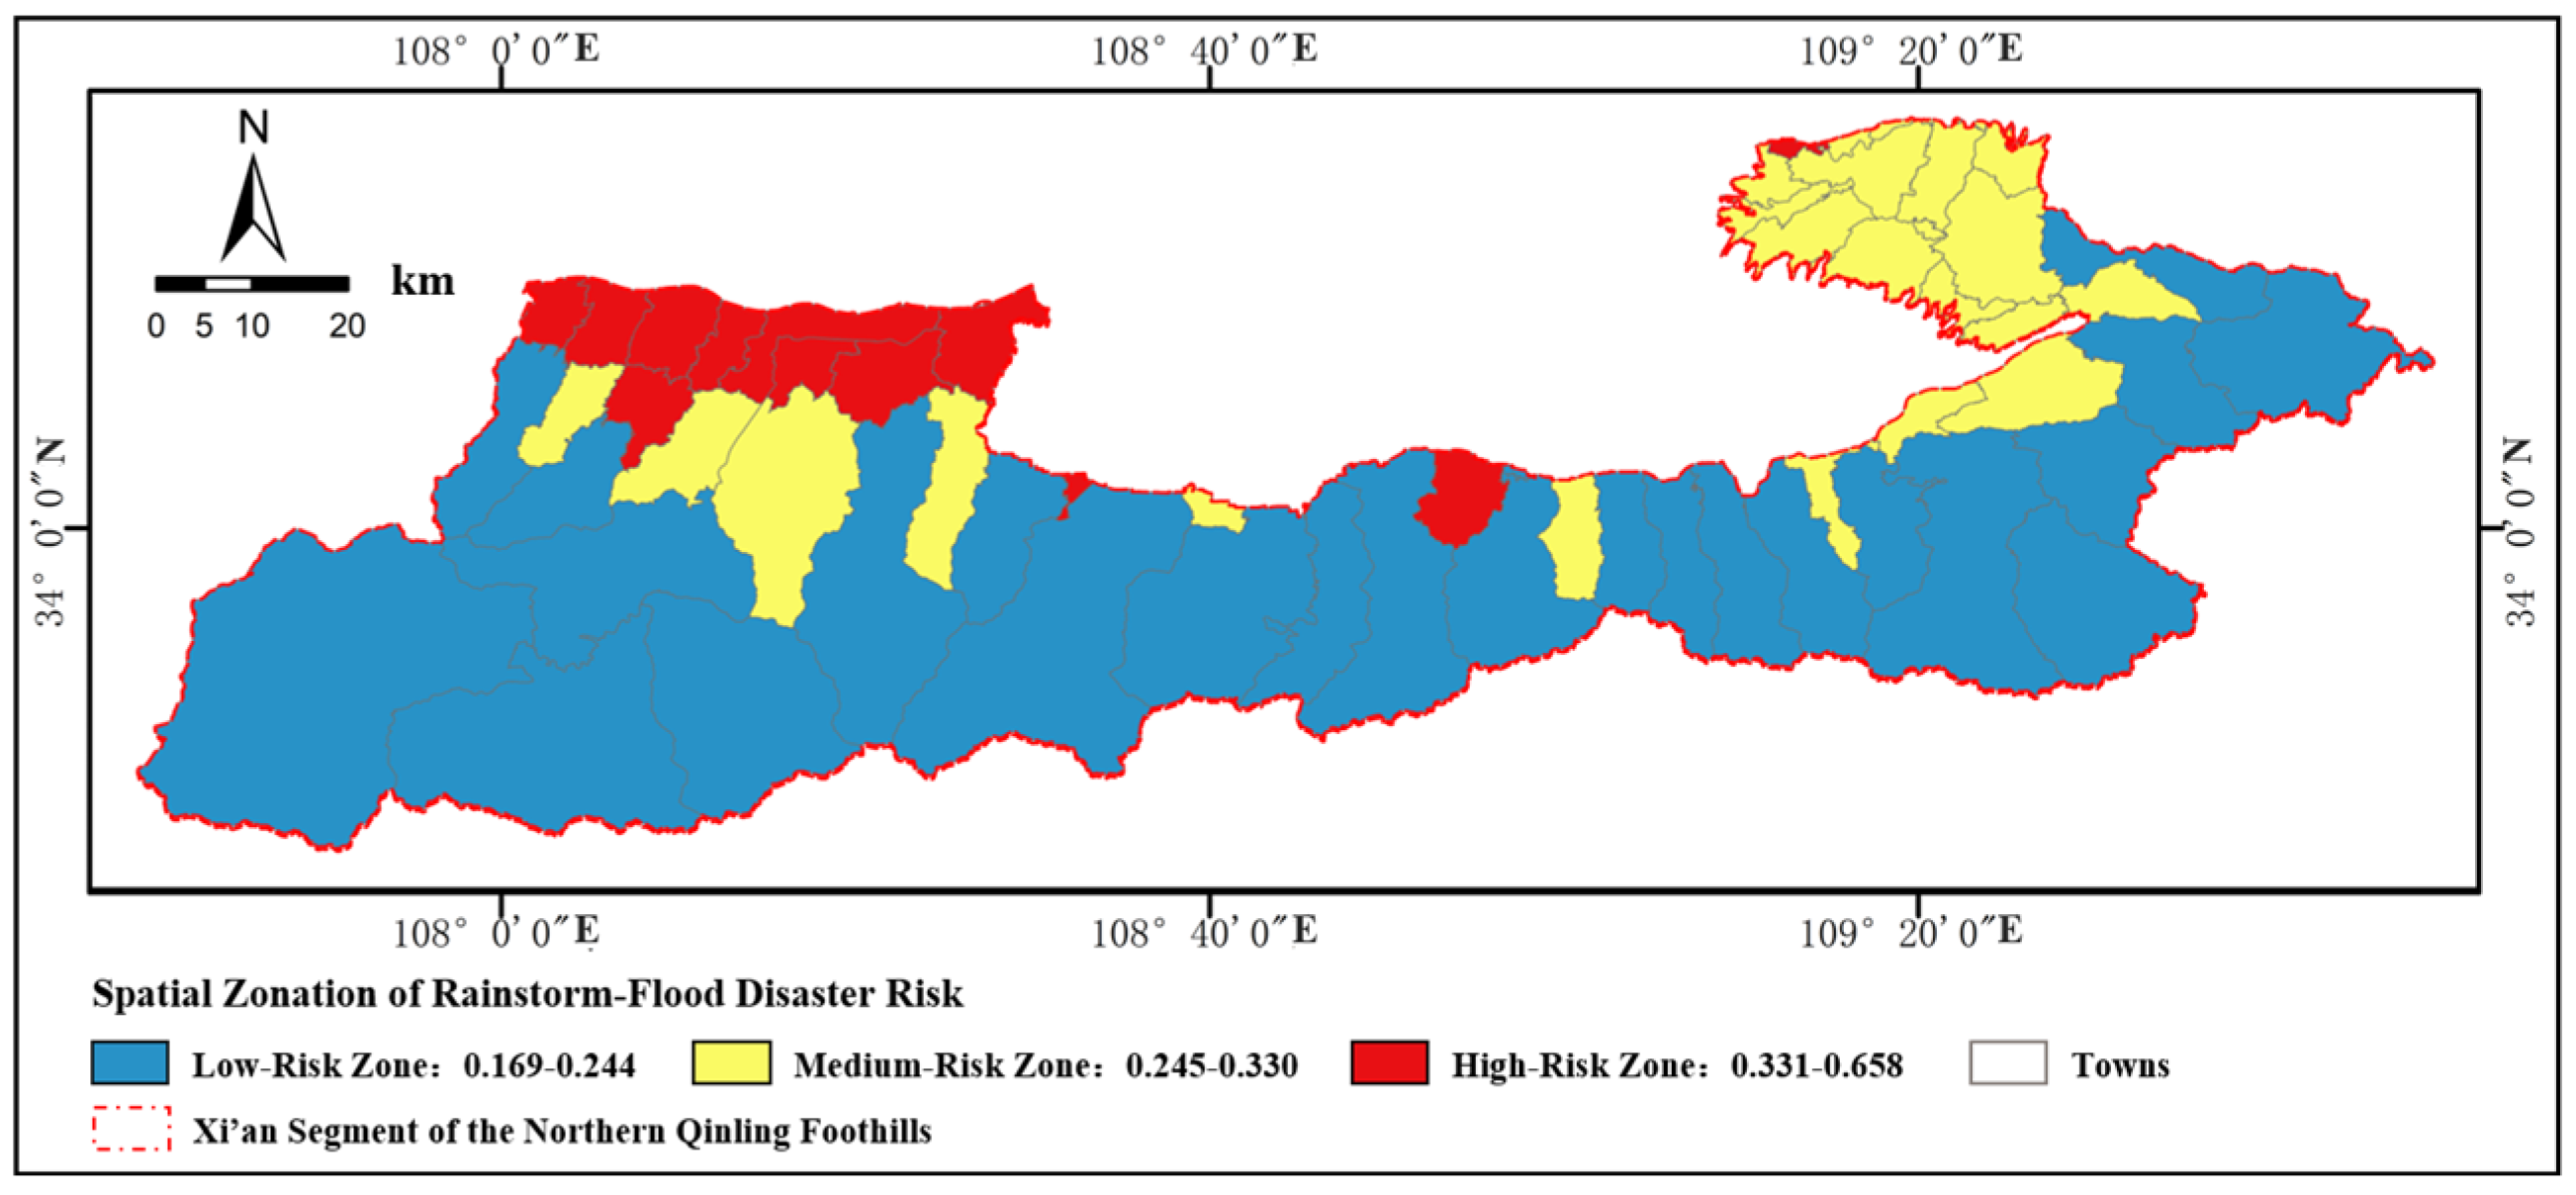
3.1. Risk Pattern Identification

(1)
Risk Assessment Outcomes
An enhanced PSR (pressure–state–response) model was developed to improve the precision of rainstorm–flood risk identification in town–village systems along the Xi’an segment of the northern Qinling foothills. By integrating spatial heterogeneity analysis with dynamic feedback mechanisms (system dynamics loop calibration), the model achieved a higher classification accuracy compared to conventional PSR frameworks. Risk indices were calculated through multi-source data fusion (30 m DEM, Landsat NDVI, population density, infrastructure distribution) and weighted via the CRITIC entropy objective weighting method. The study area was stratified into three risk tiers using Jenks Natural Breaks Optimization, yielding the “risk tier spatial pattern” correlation matrix (Table 7, Figure 4);
(2)
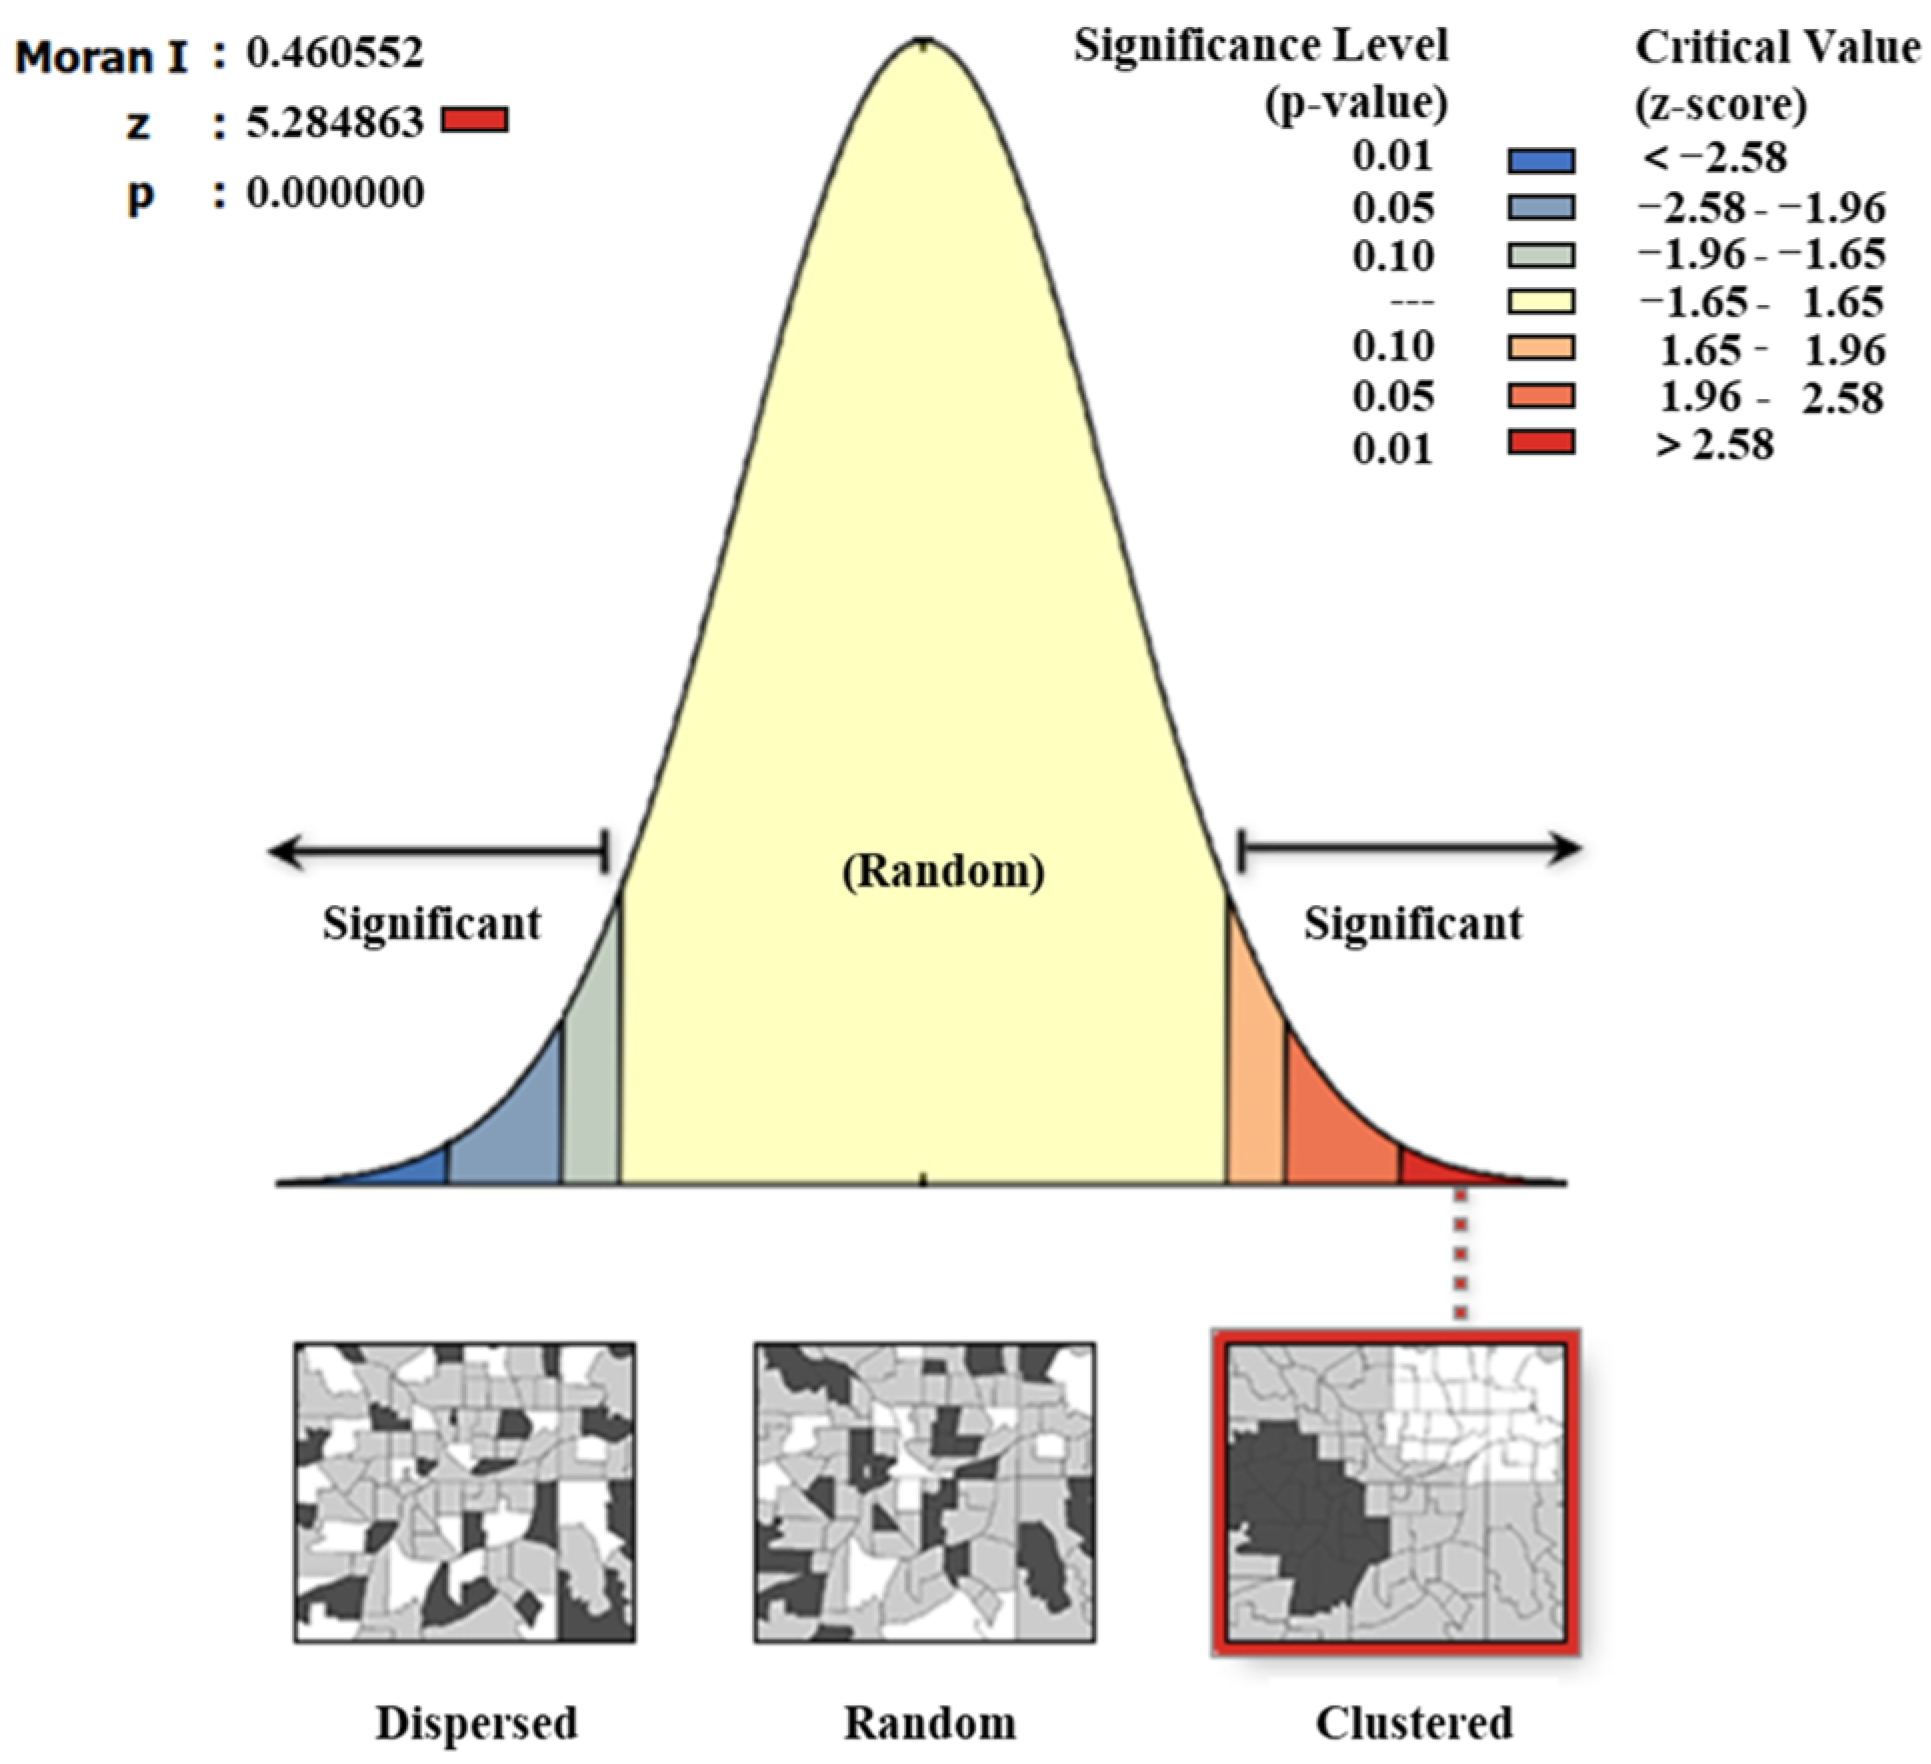
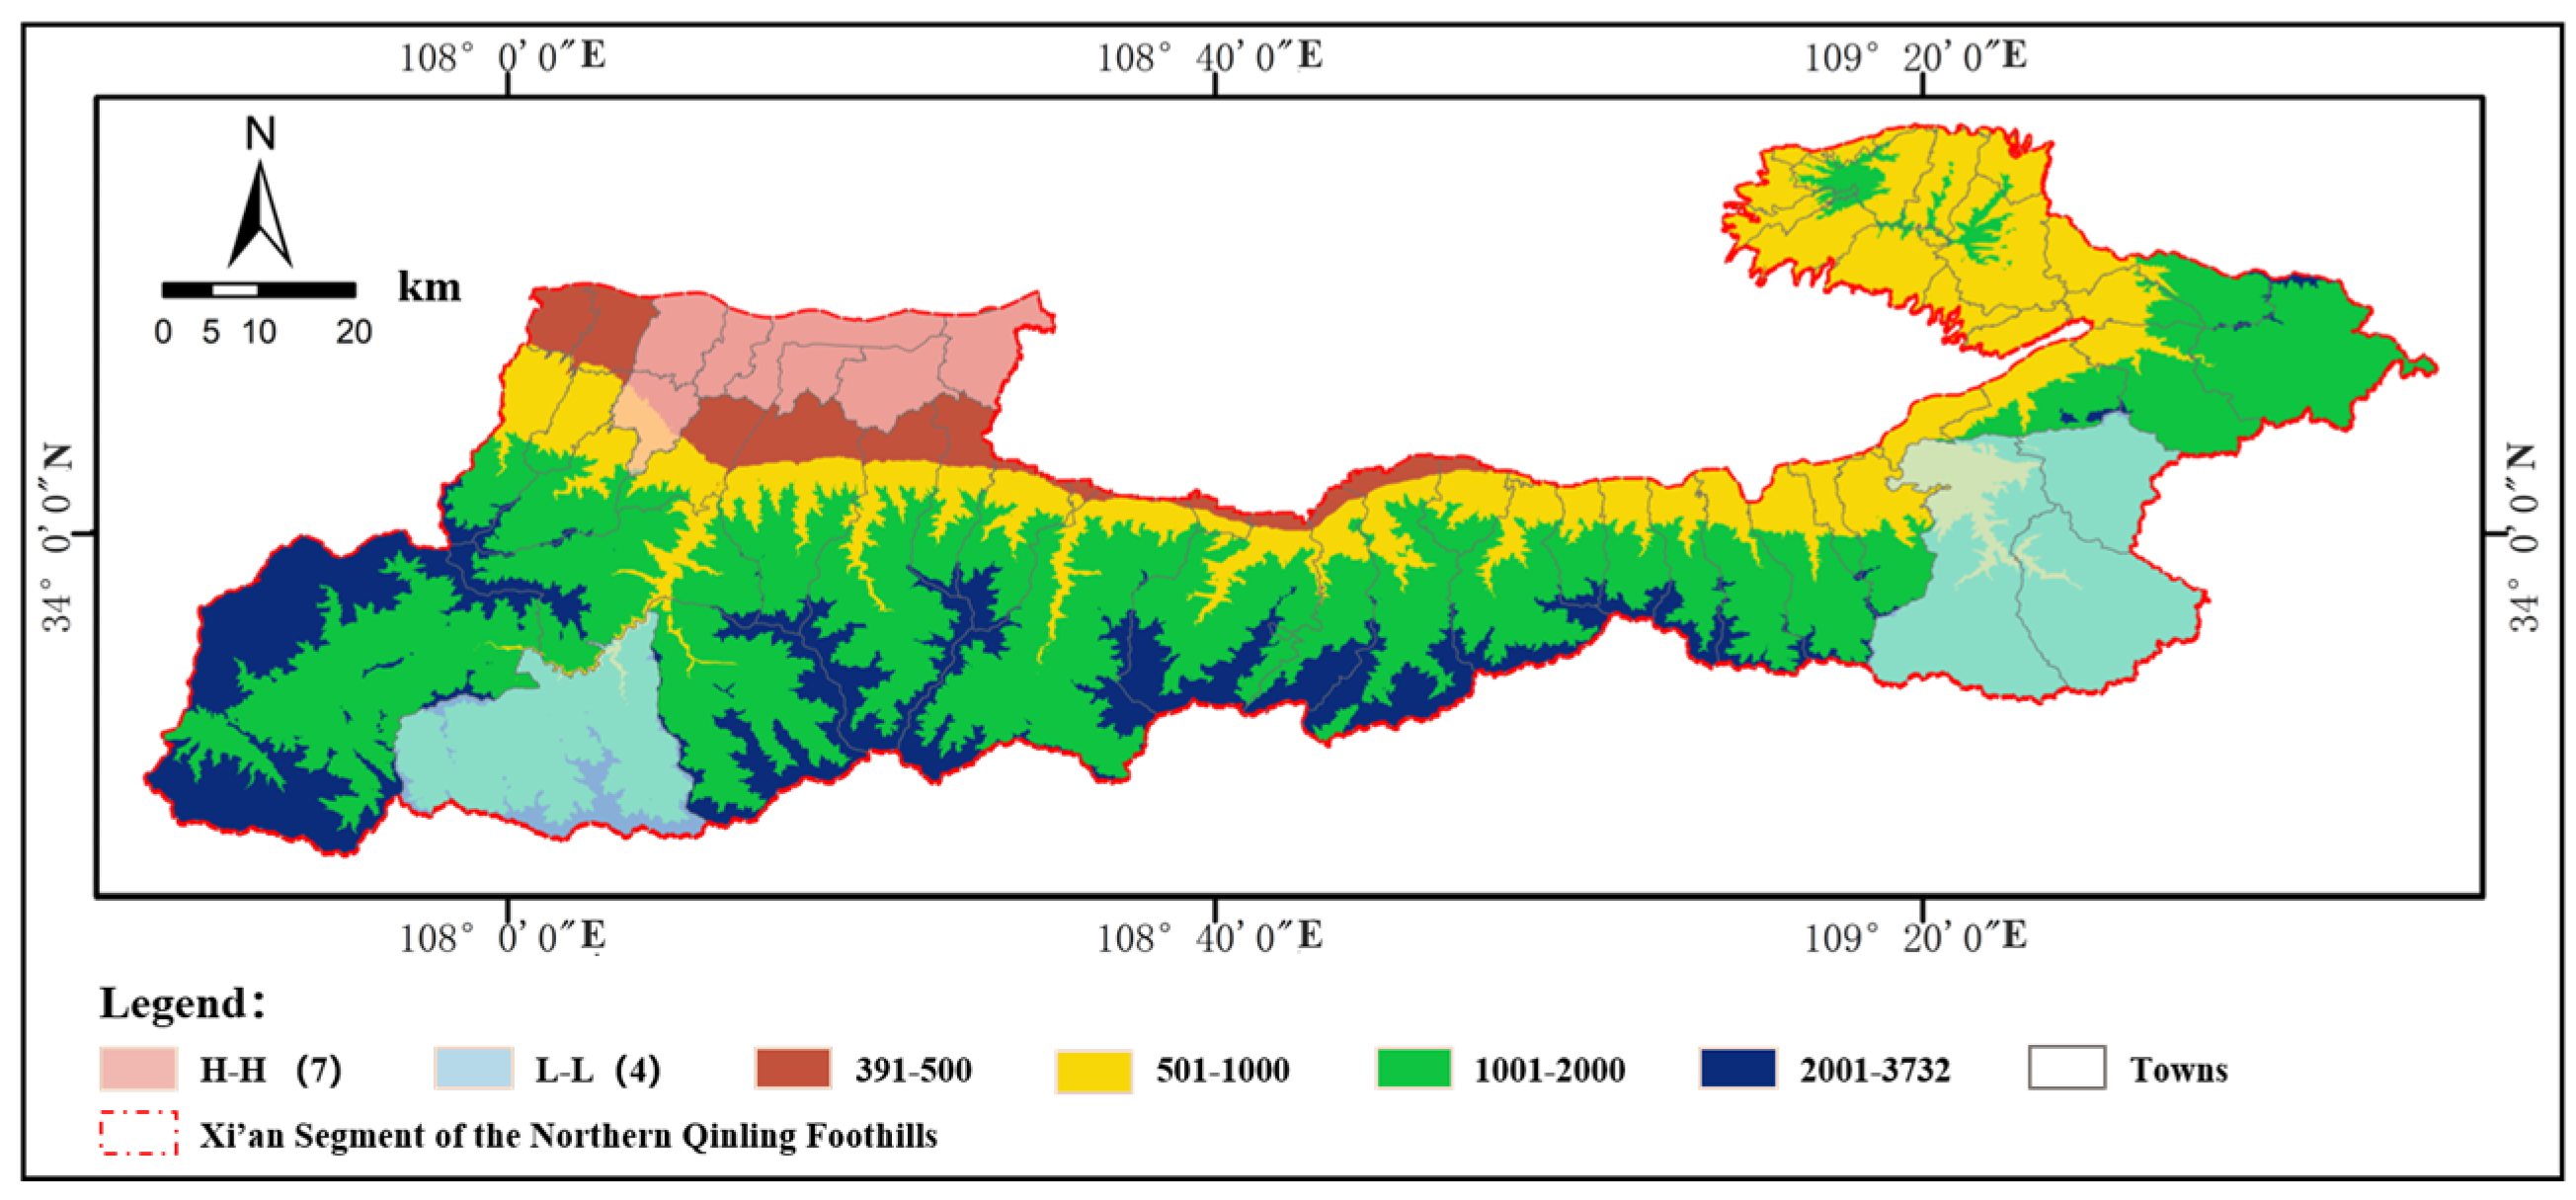
Spatial Aggregation Characteristics
Spatial clustering patterns of rainstorm–flood disaster typologies and risk zoning were validated using the Global Moran’s I index (I = 0.460, p < 0.001) (Figure 5), confirming the significant spatial autocorrelation of risks. Hotspot analysis further identified localized clusters of high and low values (“hot spots” and “cold spots”) (Figure 6).
High–High (H-H) clustering: Concentrated in low-altitude plains, low-elevation terraces, and valley corridor disaster chain zones (12.28% of spatial units), forming continuous belts within 3–5 km buffer zones along the Feng River, Hao River, and Chan River. Convergent zones of tributary junctions exhibited the highest density of compound disasters, while pluvial flooding dominated other areas.
Low-Low (L-L) clustering: located in low-mountain hills and mid-high mountain ecological security zones (7.02% of spatial units), particularly in the ecological barrier of the northern Li Mountain foothills and loess tableland of the Bailu Plateau, and dominated by flash flood risks.

3.2. Disaster Adaptation Resilience Assessment

(1)
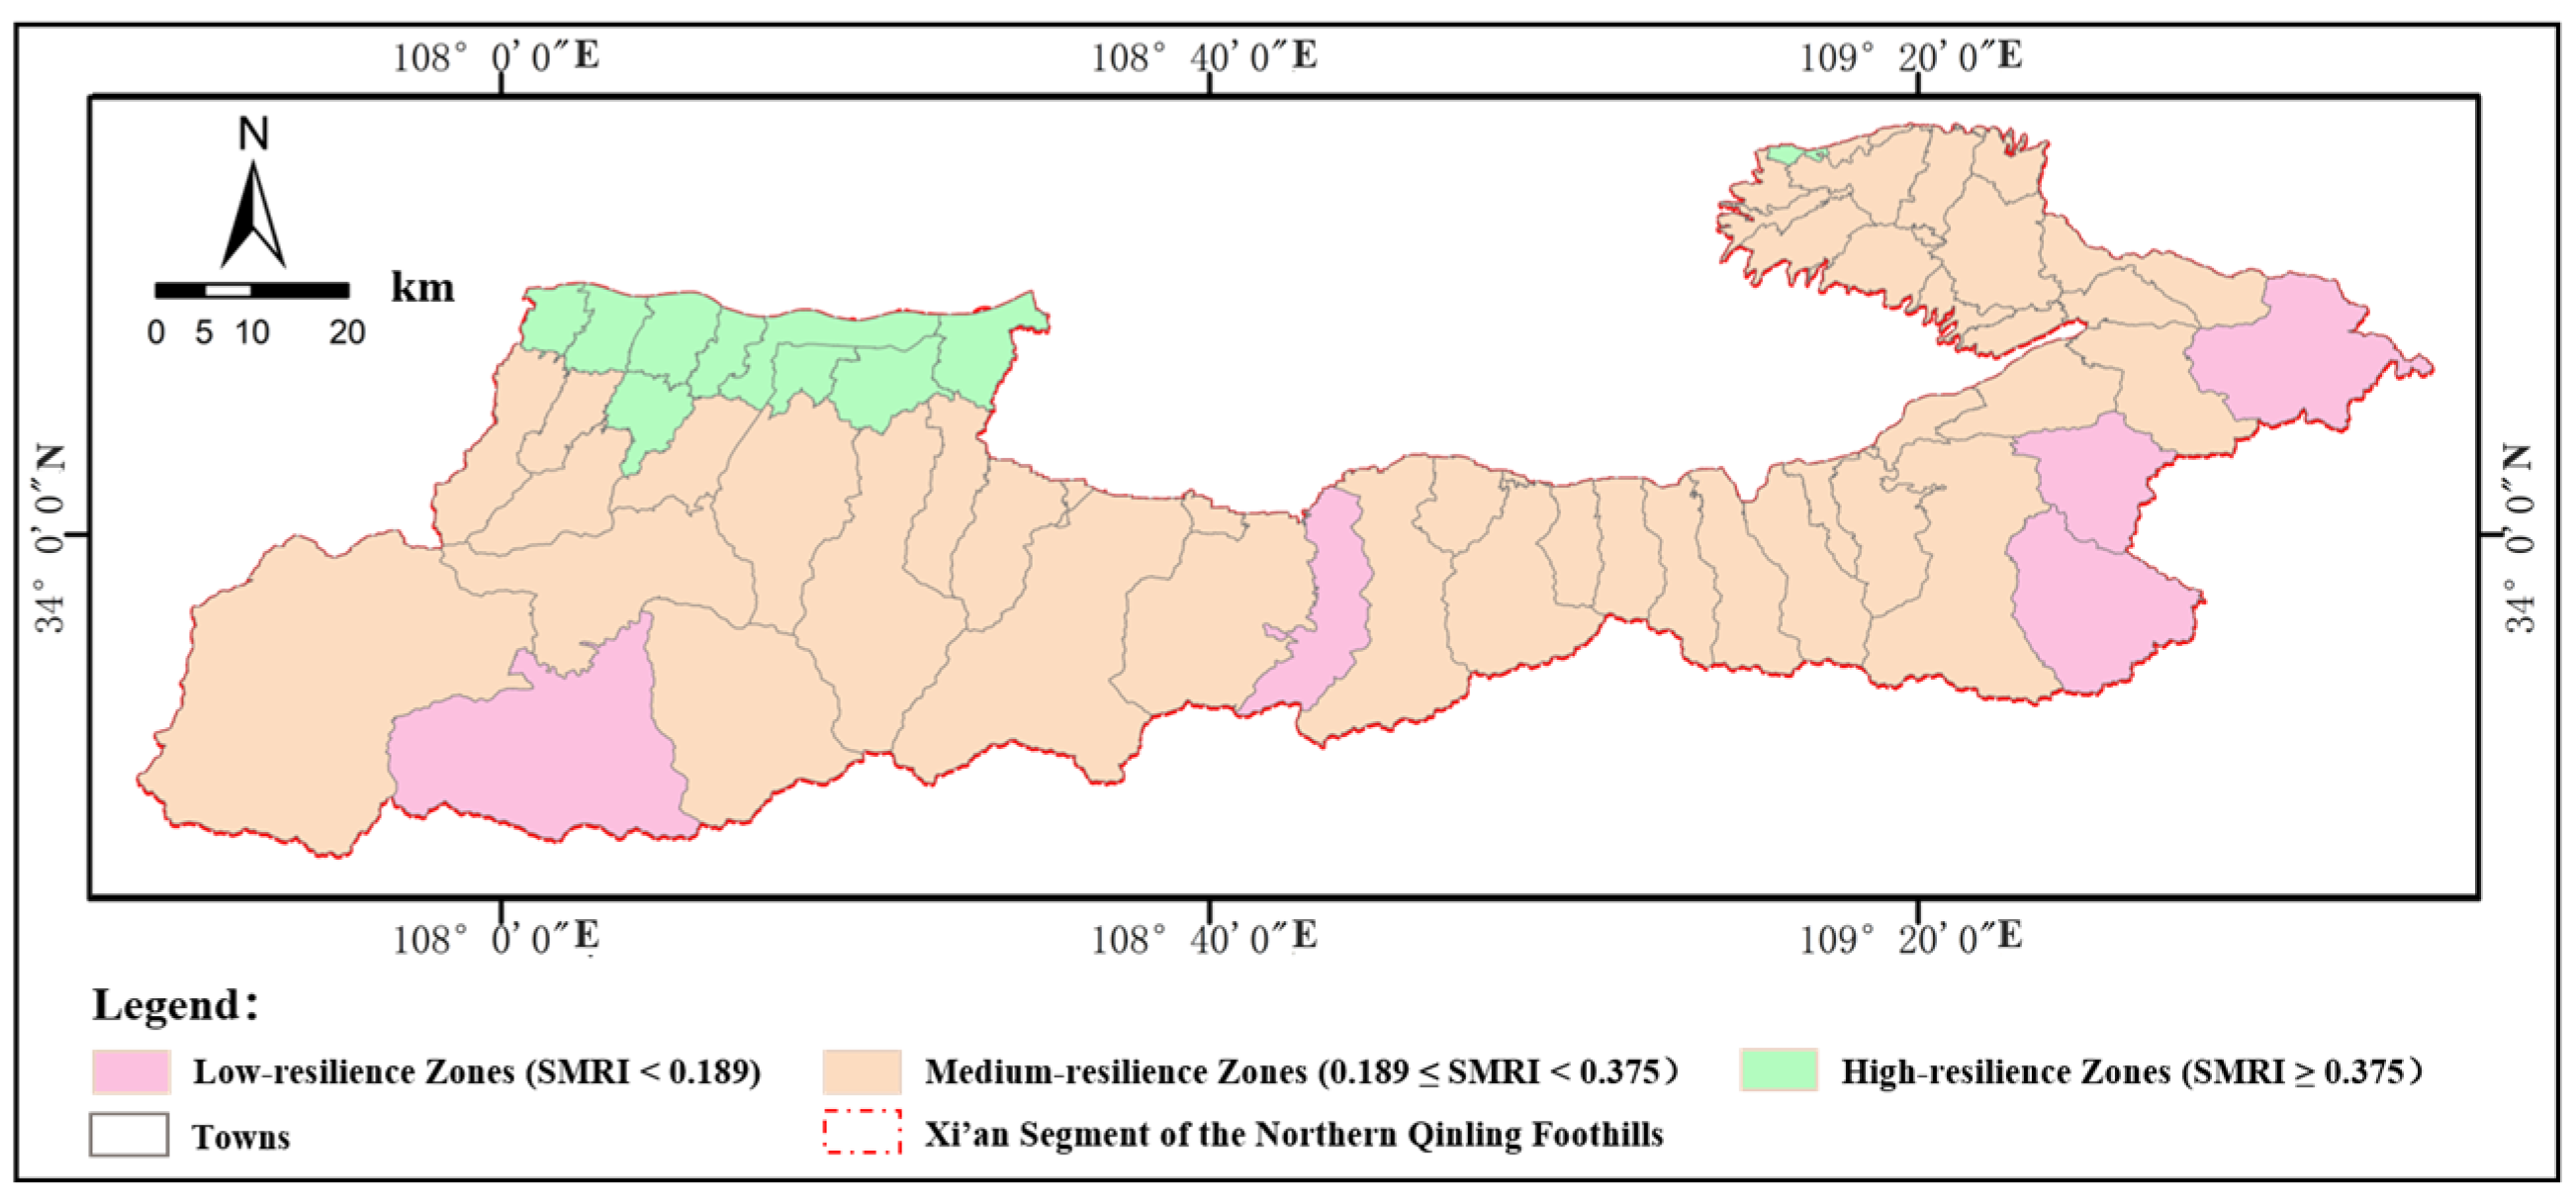
Spatial Heterogeneity of Resilience Indices
The calculation of the spatial morphological resilience index (SMRI) across the Xi’an segment of the northern Qinling foothills (Figure 7) reveals systemic vulnerabilities in rural–urban storm–flood adaptation, demonstrating a “higher resilience in towns, lower resilience in villages” and “weakening adaptive capacity near mountains compared to plains”.
High-resilience zones (SMRI ≥ 0.375): covering 10 towns–villages (17.54% of units), these areas exhibit moderate development intensity, medium compactness, and balanced functional hybridity, with sporadic distributions exemplified by Zhongnan Town, Guangji Town, and Qinghua Town.
Medium-resilience zones (0.189 ≤ SMRI < 0.375): comprising 42 towns–villages (73.68% of units), they feature low development intensity, high compactness, and notable functional hybridity, forming clustered patterns in Huaxu Town, Hongqing Subdistrict, and Louguan Town.
Low-resilience zones (SMRI < 0.189): limited to five towns–villages (8.77% of units), these areas are defined by low development intensity, low compactness, marginal functional hybridity, and significantly elevated landscape fragmentation, as observed in Gepai Town, Bayuan Town, and Lanqiao Town.
(2)
Threshold Effects of Morphological Parameters
Segmented regression and marginal benefit analyses identified disaster sensitivity thresholds for key morphological parameters in high-, medium-, and low-disaster-resilience zones within the Xi’an segment of the northern Qinling foothills:
Construction scale: when the built-up land ratio exceeds 35%, the damage elasticity coefficient shifts from negative to positive, indicating that spatial expansion exacerbates risks once development surpasses the ecological carrying capacity;
Land-use morphology: the compactness index (C) shows a significantly negative correlation with disaster losses; every 0.1 increase in the C reduces losses by 14.2%, but marginal benefits diminish when C > 0.8, with an optimal range of 0.6–0.75;
Functional organization: the functional mix index (M) correlates negatively with disaster impacts; each 0.1 increase shortens the emergency response time by >10 min, yet efficiency declines when M > 1.5 due to functional conflict complexity.

3.3. Multi-Scenario Simulation Validation

By coupling geographic process modeling with multi-objective decision analysis, we simulated the rainstorm–flood risk dynamics under three 2035 development scenarios for town–village systems in the Xi’an segment of the northern Qinling foothills (Table 8). Scenario-specific risk morphology relationships were quantified as follows:
Natural growth scenario: Extending the land-use change trends observed from 2010 to 2022, this scenario reflects a development pathway absent major policy interventions, driven primarily by population agglomeration and the GDP growth rate. Under this scenario, the built-up land area increases by 38%, ecological land decreases by 7.2%, and high-risk zones expand by 32%. Built-up land expansion is concentrated in areas along mountain ring highways and urban fringe agricultural conversion zones, while ecological land loss primarily occurs in low-mountain plateaus and low-mountain hills;
Ecological priority scenario: Aligned with China’s dual carbon goals and ecological protection redline policies, this scenario emphasizes natural restoration and low-impact development, driven by policy incentives and ecological compensation mechanisms. The built-up land area increases by 18%, ecological land expands by 5.6%, and high-risk zones grow by 18%. Built-up land expansion is limited to gentle/low-slope terrains, while ecological gains arise from abandoned homestead regreening in mid-high mountain areas and riparian corridor restoration;
Intensive development scenario: Designed to meet the demands of new-type urbanization and industrial upgrading, this scenario promotes moderate-intensity development and infrastructure efficiency improvements, guided by land finance and industrial upgrading pressures. The built-up land area surges by 55%, ecological land declines by 8.9%, and high-risk zones expand by 45%. Built-up land sprawl dominates low-altitude plains near settlements, while ecological losses stem from encroachment on farmland on plains and ruptured ecological corridors.

4. Discussion

To systematically unravel the spatial heterogeneity mechanisms of the coupled human land disaster system in the Xi’an segment of the northern Qinling foothills, we developed a risk resilience matrix integrated with spatially explicit governance tiers (Figure 8). Five flood management zones were demarcated through Jenks natural breaks and Bayesian thresholds. A multi-level resilience framework was constructed for town–village systems in the Xi’an’s Qinling foothills. This system implements four coordinated strategies: infrastructure retrofitting, real-time hydrological monitoring, climate-adaptive spatial planning, and community participatory governance [44,45,46,47,48,49,50].
(1)
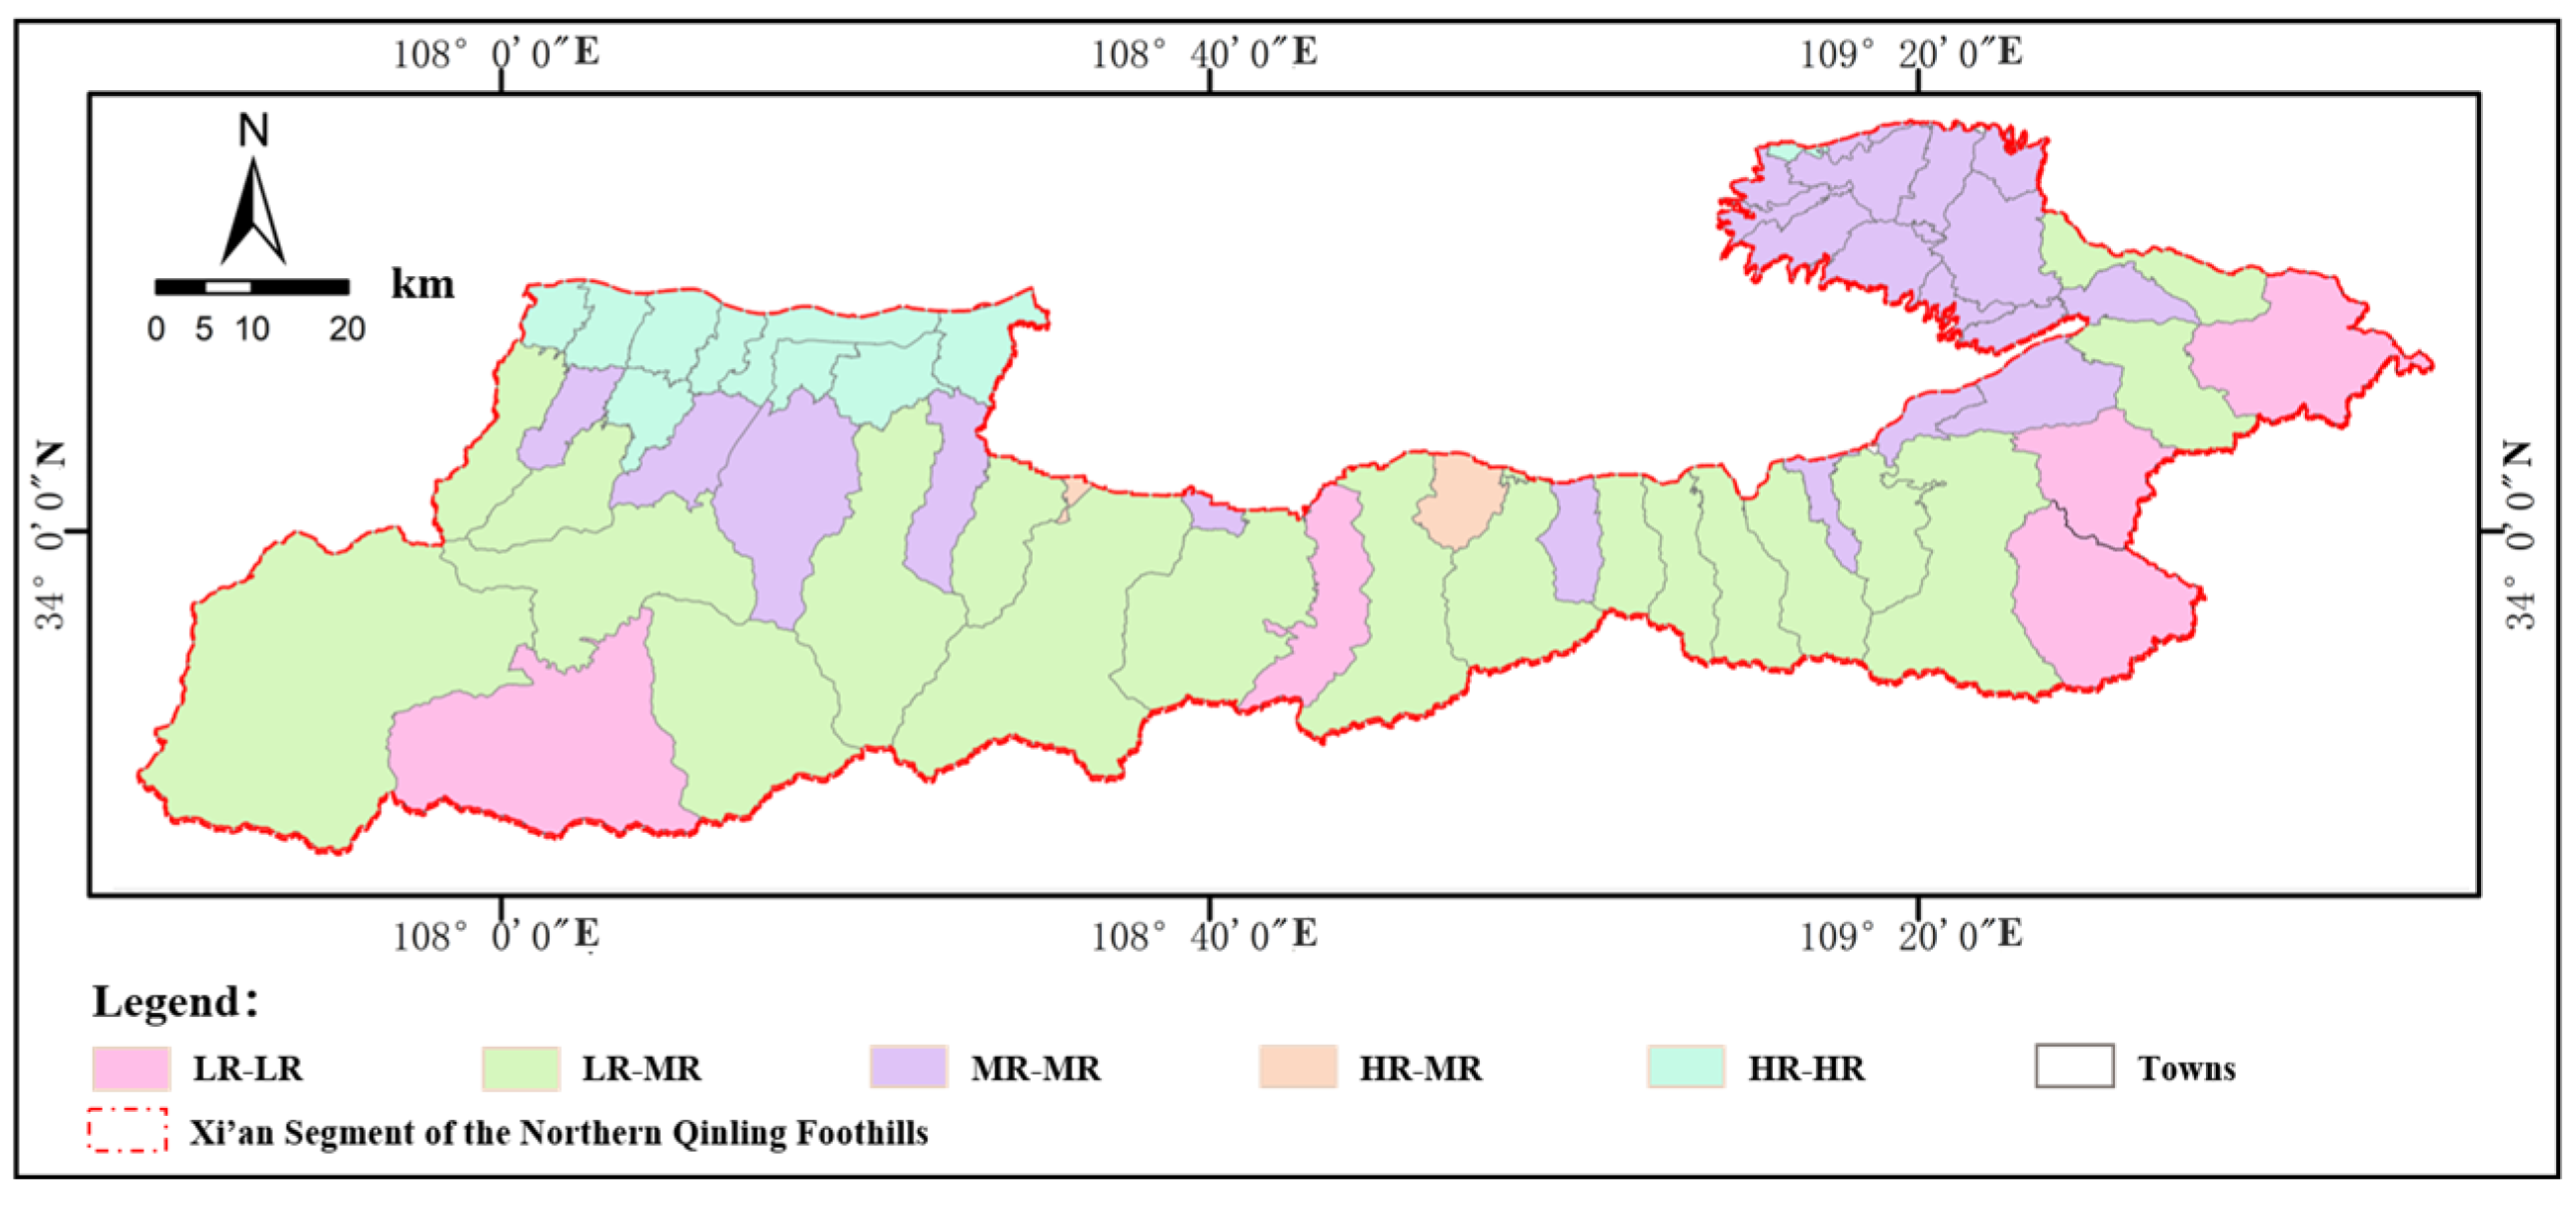
High-Risk–High-Resilience (HR-HR) Zones: Risk Prevention and Continuous Optimization
High-risk and high-resilience zones, while possessing strong disaster response capabilities, still face elevated disaster risks, with their core challenge being peak flood discharges exceeding design standards, involving 10 towns, including Qinghua Town, Yabo Town, and Situn Town.
For risk mitigation, extreme precipitation monitoring devices are deployed to supplement the existing “spatial sensing nerves” (GNSS-based geohazard monitoring network), enabling the real-time acquisition of precipitation intensity metrics, spatiotemporal rainfall distribution, and centimeter-level surface displacement. Targeted minor engineering interventions, such as slope reinforcement, drainage system upgrades, and river dredging, are implemented at critical hazard-prone sites to ensure unimpeded drainage during extreme rainfall.
To bolster resilience, emergency response plans are optimized based on rainstorm–flood risk assessments for towns and villages in the Xi’an segment of the northern Qinling foothills, improving the emergency response efficiency. Concurrently, intelligent early warning platforms integrate rainstorm–flood risk models with real-time monitoring data to deliver precise early warnings at hyperlocal scales;
(2)
High-Risk–Medium-Resilience (HR-MR) Zones: Prioritized Mitigation and Resilience Enhancement
High-risk and medium-resilience zones, characterized by elevated disaster risk yet insufficient adaptive capacities, constitute the priority focus for disaster prevention and mitigation in the Xi’an segment of the northern Qinling foothills. The critical challenge lies in mitigating rainstorm landslide debris flow cascading disasters, particularly in Yuchan Town and Ziwu Town. For risk mitigation, the slope stability is enhanced through the construction of retaining walls, slope protection structures, and diversion channels, reducing the cooccurrence probability of heavy rainfall-induced landslides and debris flows while improving the geohazard management capacity. Vegetation restoration, especially the cultivation of deep-rooted plants, bolsters the soil stability, curbs erosion, and enhances extreme precipitation retention. Concurrently, channel dredging, coupled with check dams and sediment basins, effectively mitigate debris flow risks. To enhance resilience, mountain roads are rehabilitated and reinforced to ensure post-disaster emergency access, communication networks are upgraded for real-time disaster information transmission, and backup water supply and energy systems are established to sustain basic post-disaster needs. Community engagement is intensified through regular disaster prevention training, emergency drills, and educational workshops simulating evacuation and rescue procedures, thereby raising residents’ disaster preparedness awareness;
(3)
Medium-Risk–Medium-Resilience (MR-MR) Zones: Dynamic Equilibrium and Synergistic Optimization
The medium-risk–medium-resilience zones exhibit transitional characteristics in both their rainstorm–flood risks and mitigation capacities, necessitating a balanced approach between risk suppression and resilience enhancement. The core challenge is addressing regional waterlogging and infrastructure paralysis across 21 towns, including Cuifeng Town, Taiyigong Town, and Louguan Town. For risk mitigation, proactive measures are implemented to reduce potential hazards, including densely constructed grassed swales and localized detention basins in areas with annual runoff increments and the installation of flexible protection chains along historically breach-prone river channels to disrupt cascading disaster propagation. Resilience enhancement focuses on fortifying multi-level emergency shelter networks, ensuring redundancy in critical infrastructure, and strengthening community collaboration and smart governance through resilience unit designation and mutual aid mechanisms, complemented by simulated evacuation drills, and advancing digital twin early warning platforms that integrate 15 min rainfall forecasts with real-time surface deformation monitoring for dynamic disaster scenario simulations;
(4)
Low-Risk–Medium-Resilience (LR-MR) Zones: Sustainable Development and Demonstration Leadership
Low-risk–medium-resilience zones, characterized by low disaster risk and relatively robust response capacities, serve as exemplary models for regional disaster prevention and mitigation. Their primary challenges involve ecological space compression and insufficient demonstration effects, spanning 19 towns, including Luoyu Town, Chenhe Town, and Wangmang Town. For risk management, green ecological development is prioritized through planting flood-tolerant vegetation, promoting eco-friendly land-use patterns, and implementing extreme precipitation adaptive designs such as Sponge Village initiatives, green roofs, and high-permeability pavements to enhance rainfall retention. To bolster socioeconomic resilience, diversified economic activities are fostered to improve the post-disaster recovery capacity. Additionally, these zones are designated as disaster resilience education hubs to disseminate advanced technologies and codify best practices, offering transferable models for analogous regions;
(5)
Low-Risk–Low-Resilience (LR-LR) Zones: Resilience Building and Risk Prevention
Low-risk–low-resilience zones, characterized by low disaster risk yet inadequate coping capacities, face the core challenge of infrastructural fragility and delayed recovery capabilities, encompassing five towns, including Banfangzi Town, Dongda Town, and Gepai Town. For risk prevention, climate extremes, particularly extreme precipitation events, are addressed through enhanced risk assessments and optimized disaster contingency plans. Concurrently, soil water conservation technologies such as terracing and vegetative buffer strips reduce potential soil erosion. To bolster resilience, infrastructure is upgraded by widening rural roads, improving the coverage of transportation, communication, and water supply systems, and implementing disaster insurance mechanisms to mitigate economic losses for residents.

5. Conclusions

The town–village systems in the northern Qinling foothills, as a quintessential mountain urban transition zone, exhibit pronounced spatial heterogeneity and systemic vulnerability in cascading rainstorm–flood disaster chains. By integrating complex adaptive systems theory and multi-source heterogeneous data modeling techniques, this study deciphers the nonlinear response mechanisms driven by the synergistic interplay of hazard exposure, spatial morphology, and systemic resilience.
(1)
Examining towns–villages as fundamental units of human settlement systems, their construction scale determines disaster exposure levels, land-use morphology influences stormwater runoff pathways, and functional organization constrains emergency response efficiency. These three factors constitute the core dimensions of the storm–flood resilience in the town–village spatial systems along the Xi’an segment of the northern Qinling foothills. The densely developed low-altitude alluvial plains further validate the systemic amplification of disasters through “human land system imbalance”;
(2)
Through the storm–flood hazard risk identification model, spatial morphology resilience index model (SMRI), and multi-scenario simulation validation framework, a “spatial morphology&disaster manifestation” coupling model was established. This corroborates the significant benefits of the “ecological priority pathway” for these towns–villages, as well as the hypothesis of a compounded disaster causation mechanism involving natural base constraints and spatial morphology mismatch. Compared to natural growth scenarios, high-risk zones decrease in area under ecological priority scenarios, while the SMRI improves the verification of the positive synergistic effect between ecological remediation and spatial morphology optimization;
(3)
Reconceptualizing storm–flood risks as outcomes of natural stressor effects and spatial morphology maladaptation, the optimal development mode for disaster loss reduction is identified as “medium-intensity development&moderately compact morphology&appropriate functional hybridity”;
(4)
For disaster-adaptive resilience enhancement, integrated strategies combining engineered intervention (e.g., green–gray infrastructure), monitoring early warning systems, and planning guidance mechanisms should be implemented through zonation-based multi-level optimization;
(5)
This study not only provides spatially differentiated optimization strategies for rainstorm–flood disaster prevention in the Xi’an segment of the northern Qinling foothills but also establishes a scalable framework applicable to disaster-resilient planning for mountainous towns globally. The proposed methodology bridges theoretical models and engineering practices, offering actionable insights for regions facing similar hydrogeomorphic challenges.
Future research will focus on multi-hazard coupling mechanisms and participatory governance frameworks. This aims to advance resilience planning from technocratic rationality toward socio-technical co-governance, fostering a paradigm shift from “disaster reaction” (post-event recovery) to “risk co-adaptation” (preemptive systemic adaptation).

Author Contributions

Conceptualization, D.L. (Dong Liu), X.W. and J.P.; methodology, D.L. (Dong Liu) and R.W.; investigation, D.L. (Denghui Li) and L.S.; data curation, J.Z.; writing—original draft preparation, D.L. (Dong Liu) and X.W.; writing—review and editing, D.L. (Dong Liu) and X.H.; visualization, J.Z. and Z.H.; funding acquisition, J.P. All authors have read and agreed to the published version of the manuscript.

Funding

This research was funded by the General Project of Shaanxi Key Research and Development Program (Grant No. 2025SF-YBXM-555), the National Science Foundation of China (Grant No. 42341101), the Integrated Protection and Restoration of Mountain-River-Forest-Farmland-Lake-Grassland-Desert Ecosystems in Northern Qinling Foothills, Xi’an (2203-610100-04-05-321562).

Data Availability Statement

The raw data supporting the conclusions of this article will be made available by the authors on request.

Conflicts of Interest

The authors declare no conflicts of interest.

References

  1. Khan, A.; Smith, J.T.; Rahman, M.M. Assessing future climate impacts on hydroclimatic extremes in coastal regions: A case study of the Eastern Shore of Virginia. Sci. Total Environ. 2021, 944, 144371. [Google Scholar]
  2. Chen, L.; Wang, H.; Zhang, Y. Climate-driven increases in compound flooding risks for coastal megacities under SSP-RCP scenarios. Sci. Rep. 2021, 14, 77002. [Google Scholar]
  3. Zhou, B.T.; Qian, J. Interpretation of IPCC AR6 report: Changes in extreme weather and climate events. Adv. Clim. Chang. Res. 2021, 17, 713–718. [Google Scholar]
  4. Li, Y.; Zhao, S. Research on flood disaster losses and hazard risks in China during 2001–2020. Adv. Clim. Chang. Res. 2022, 18, 154–165. [Google Scholar]
  5. National Committee for Disaster Prevention; Mitigation and Relief Office; Ministry of Emergency Management. Basic Status of National Natural Disasters in 2023; Ministry of Emergency Management: Washington, DC, USA, 2024.
  6. Ministry of Emergency Management; Academy of Disaster Reduction and Emergency Management; Ministry of Education. 2022 Global Natural Disaster Assessment Report; Ministry of Education: Washington, DC, USA, 2023.
  7. Ministry of Emergency Management; Academy of Disaster Reduction and Emergency Management; Ministry of Education. 2021 Global Natural Disaster Assessment Report; Ministry of Education: Washington, DC, USA, 2022.
  8. Peng, J.; Shen, Y.; Jin, Z.; Liu, T.; Li, Y.; Zhuang, J.; Wang, H.; Yu, S.; Cheng, Y.; Ma, P.; et al. Key considerations in studying the eco-geological environmental system of the Qinling Mountains. J. Ecol. 2023, 43, 4345–4358. [Google Scholar]
  9. Guo, Z.; Shi, Y.; Liu, T.; Zhang, Y.; Yan, Y. Spatiotemporal patterns and drivers of NPP in the northern Qinling foothills from 2001–2020. Ecol. Environ. Sci. 2025, 34, 401–410. [Google Scholar]
  10. Yang, L.; Huo, A.; Zhao, Z.; Zhong, F.; Wang, X.; Chen, J. Analysis of future extreme precipitation and flood risks in the northern Qinling foothills based on CMIP6. Yellow River 2024, 46, 55–60+66. [Google Scholar]
  11. Cui, Y. Implications of international climate disaster governance for China’s ecological civilization construction. Int. Forum 2021, 23, 161. [Google Scholar]
  12. Zhang, Y.; Hu, J.; Li, Z.; Lu, Y.; Zhai, G. Research progress and prospects of urban rainstorm-flood risk governance. J. Hum. Settl. West China 2022, 37, 1–8. [Google Scholar]
  13. UNDRR. Midterm Review of the Sendai Framework for Disaster Risk Reduction 2015–2030; United Nations Office for Disaster Risk Reduction: Geneva, Switzerland, 2023. [Google Scholar]
  14. Heath, L.C.; Alam, G.M.M. Participatory modeling for coastal resilience planning in Bangladesh. Clim. Risk Manag. 2022, 36, 100430. [Google Scholar]
  15. Yang, Y.; Hu, D.; Guo, Y.; Yan, S. Lessons from the UK’s flood risk governance system for China. J. Arid Land Resour. Environ. 2023, 37, 126–135. [Google Scholar]
  16. Wang, J.; Hu, X.; Zhu, S.; Yang, C. Application and implications of Japan’s localized disaster prevention concepts: A case study of Shibuya Station, Tokyo. J. Disaster Prev. Mitig. Eng. 2024, 44, 1245–1256. [Google Scholar]
  17. Huang, L.; Zhang, Y.; Wan, X.; Wang, W.; Song, Y. Adaptive assessment of multi-hazard compound disaster systems: A case study of the Guangdong-Hong Kong-Macao Greater Bay Area. J. Hohai Univ. (Nat. Sci.) 2025, 1–11. Available online: http://kns.cnki.net/kcms/detail/32.1117.TV.20250205.1544.032.html (accessed on 21 April 2025).
  18. Yu, K. China’s model of climate-resilient territorial and urban spatial planning. City Plan. Rev. 2025, 49, 4–15. [Google Scholar]
  19. Yang, X.; Lu, S.; Xu, X.; Hang, J.; Yu, X. Urban flood vulnerability, resilience assessment, and disaster adaptation strategies: A case study of Guangzhou. Planners 2024, 40, 41–49. [Google Scholar]
  20. Zhai, G. Urban flood disaster resilience from planning perspectives under climate change: Key concepts, framework, and pathways. Urban Plan. Forum 2024, 1, 29–37. [Google Scholar]
  21. Song, Q.; Zhang, B.; Ma, D.; Wang, W. Review of quantitative community flood resilience assessment methods. J. Catastrophol. 2024, 39, 212–219. [Google Scholar]
  22. Li, C.; Zhu, P.; Li, K.; Zhou, L. Empirical study on urban morphology and climate resilience: Evidence from flood events in Macau. Urban Plan. Int. 2023, 38, 48–57. [Google Scholar]
  23. Wang, S.; Yun, Y.; Li, D. Measurement of urban flood risks and disaster planning responses. Mod. Urban Res. 2019, 11, 125–131. [Google Scholar]
  24. Li, T. Spatial study of urban vulnerability based on “exposure-sensitivity-adaptation”: A case study of Lanzhou. Econ. Geogr. 2017, 37, 86–95. [Google Scholar]
  25. Chen, Y.; Wang, Y.; Liu, Q.; Chen, X.; Zhou, Y. Land-use-based assessment model for mountain torrent disaster losses. J. Nat. Disasters 2021, 30, 52–59. [Google Scholar]
  26. Zhang, Q. Research on Social Resilience in Urban Flood Disaster Governance. Ph.D. Thesis, Lanzhou University, Lanzhou, China, 2021. [Google Scholar]
  27. Li, Z.; Fu, D.; Wang, J.; Min, K.; Zhang, J. Urban resilience evaluation model for waterlogging disasters and its application. J. Tsinghua Univ. (Sci. Technol.) 2022, 62, 266–276. [Google Scholar]
  28. Yin, M.; Liu, M.; Zhu, W.; Zhen, J. Urban waterlogging resilience assessment and influencing factors: A case study of Fuzhou. J. Saf. Sci. Technol. 2024, 20, 61–66. [Google Scholar]
  29. Huo, H.; Liu, Y.; Li, Y. Tracking hotspots in remote sensing research on flood disasters over recent 22 years: A bibliometric analysis based on citespace. J. Earth Environ. 2024, 15, 612–623. [Google Scholar]
  30. Shi, Q.; Peng, H.H.; Xia, H.N.; Tang, Z.; Chen, H. Progress in remote sensing monitoring and assessment of flood disasters: A citespace-based review. Yangtze River 2024, 55, 28–36+44. [Google Scholar]
  31. Zheng, Y.; Gao, L.H.; Li, R.; Jiang, W. Analysis and recommendations for remote sensing satellite services in emergency disaster reduction in China. Spacecr. Eng. 2024, 33, 148–154. [Google Scholar]
  32. Shen, W.H.; Zhong, Y.F.; Wang, J.J.; Zheng, Z.; Ma, A. Construction and application of flood disaster knowledge graph based on multi-modal data. Geomat. Inf. Sci. Wuhan Univ. 2023, 48, 2009–2018. [Google Scholar]
  33. Tang, W.G.; Xue, F.C.; Wan, J.Q.; Zhang, C.; Han, Y. Research and application of rainstorm flash flood simulation in mountainous small watersheds. Sci. Surv. Mapp. 2022, 47, 146–156. [Google Scholar]
  34. Huang, H.B.; Wang, X.W.; Liu, L. Urban rainstorm and waterlogging: A review on characteristics, mechanisms, data, and methods. Prog. Geogr. 2021, 40, 1048–1059. [Google Scholar] [CrossRef]
  35. Li, Y.; Wang, S.; Huang, H. Rural disaster vulnerability evaluation and influencing factors: A case study of Xun County, Henan Province. Sci. Geogr. Sin. 2024, 44, 1818–1825. [Google Scholar]
  36. Bai, H.; Shi, M.; Cao, Q.; Ning, Z. Spatial distribution and disaster resilience evaluation of traditional villages in earthquake-prone areas. J. Nat. Disasters 2024, 33, 30–41. [Google Scholar]
  37. Wen, H.; Qian, L.; Li, Z.; Huang, J. Resilience assessment of flood-landslide disasters in mountainous towns. J. Disaster Prev. Mitig. Eng. 2024, 44, 751–761. [Google Scholar]
  38. Dai, J.; Chen, W.; Shen, S. Optimization of rural settlements in plateau mountainous areas based on integrated disaster risk assessment: A case study of Ledu District, Haidong City, Qinghai. J. Catastrophol. 2021, 36, 119–125+132. [Google Scholar]
  39. Liu, D.; Peng, J.; Ye, W.; Ju, P.; Zhang, T.; Liu, K. Framework for livable villages in the Qinling Mountains. J. Xi’an Univ. Sci. Technol. 2023, 43, 743–751. [Google Scholar]
  40. Zhang, H.; Kong, F. Rural flood risk prevention strategies in China. Water Resour. Hydropower Eng. 2022, 53, 13–24. [Google Scholar]
  41. Liu, D.; Cui, Y.; Peng, J.; Cao, X.; Shen, Y.; Shao, L.; Li, D. Interaction between small towns and ecosystems in the northern Qinling foothills. Earth Sci. 2025, 1–14. Available online: http://kns.cnki.net/kcms/detail/42.1874.P.20250226.0926.002.html (accessed on 21 April 2025).
  42. Cheng, W.; Zhou, C.; Li, B.; Shen, Y. Research on the theoretical basis and zoning scheme of Chinese physiographic regionalization. Acta Geogr. Sin. 2019, 74, 839–856. [Google Scholar]
  43. Shi, P.; Wang, J.; Zhang, G.; Kong, F.; Wang, J. Regional differentiation and zoning of natural disasters in China. Geogr. Res. 2017, 36, 1401–1414. [Google Scholar]
  44. Xia, C.; Ma, D.; Guo, X.; Wang, Z.; Wang, W. Disaster resilience mechanisms and planning responses in territorial spatial planning under adaptive cycles. Urban Dev. Stud. 2024, 31, 44–52. [Google Scholar]
  45. Zeng, J.; Tian, J.; Wang, Q.; Sun, K. Climate resilience and flood adaptation theories in territorial planning: A case study of the Fujian Delta. Sci. Sin. Technol. 2023, 53, 1713–1727. [Google Scholar]
  46. Wang, W.; Zhu, J.; Fei, Z.; Ma, D.; Du, X. Framework and pathways for resilient territorial spatial planning and construction. Strateg. Study CAE 2023, 25, 209–218. [Google Scholar] [CrossRef]
  47. Dai, S.; Liu, T.; Gao, X.; Wang, J.; Xie, Z. Compilation and implementation mechanisms of territorial spatial disaster prevention planning. Urban Plan. Forum 2023, 48–53. [Google Scholar]
  48. Lv, Y.; Xiang, M.; Wang, J.; Wu, C. From disaster prevention to resilience-building: Pathways for territorial spatial governance. J. Nat. Resource. 2021, 36, 2281–2293. [Google Scholar]
  49. Li, Y.; Wang, Y.; Cai, X. From “disaster subjects” to “spatial ontology”: Theoretical foundations and resilient urban development in China. Shanghai Urban Plan. Rev. 2024, 5, 108–115. [Google Scholar]
  50. Chen, X.; Wang, P.; Fu, Z. Optimization of emergency shelter layouts in mountainous cities based on disaster risk assessment: A case study of Dongchuan District. J. Nat. Disasters 2020, 29, 162–174. [Google Scholar]
Figure 1. Technical flowchart.
Remotesensing 17 02009 g001
Figure 2. Geomorphic classification of the Xi’an segment of the northern Qinling foothills.
Remotesensing 17 02009 g002
Figure 3. Kernel density analysis of town–village distribution in the Xi’an segment of the northern Qinling foothills (units/km2).
Remotesensing 17 02009 g003
Figure 4. Spatial zonation of rainstorm–flood disaster risk in town–village systems across the Xi’an segment of the northern Qinling foothills.
Remotesensing 17 02009 g004
Figure 5. Global Moran’s I index for rainstorm–flood risk zonation with spatial autocorrelation validation.
Remotesensing 17 02009 g005
Figure 6. Integrated spatial risk zonation of town–village systems in the Xi’an segment of the northern Qinling foothills.
Remotesensing 17 02009 g006
Figure 7. Spatial resilience zonation of town–village systems in the Xi’an segment of the northern Qinling foothills.
Remotesensing 17 02009 g007
Figure 8. Spatially differentiated resilience zonation for rainstorm–flood disaster prevention in town–village systems in the Xi’an segment of the northern Qinling foothills.
Remotesensing 17 02009 g008
Table 1. Spatial distribution of towns and villages in the Xi’an segment of the northern Qinling foothills.
Geomorphic UnitElevation (m)Slope (%)Towns/
Subdistricts (Count)
Proportion (%)Villages (Count)Proportion (%)Regional Characteristics
Low-Altitude Plains391–8990–8.92035.119330.0Urban–rural clusters dominated by anthropogenic activities
Low-Altitude Terraces900–14468.8–19.5712.28212.7Gentle-slope transitional zones (agriculture–ecosystem interface)
Low Hills1447–200019.5–28.91221.010215.8Hazard-prone areas under fold–fault tectonics
Mid-High Mountains2001–3732>29.01831.626541.5Intensely uplifted ecological barriers with active hazard sources
Total57100642100
Note: Administrative stratification is implemented between townships (subdistricts) and villages.
Table 2. “Hazard-Spatial” database for towns and villages in the Xi’an segment of the northern Qinling foothills.
No.Data CategoryData ContentSources and Accuracy
1Geospatial DataDEM (30 m), slope, aspect, hydrography, geologyNASA SRTM; 1:50,000 topographic maps
2Meteorological–HydrologicalHourly rainfall, flood extents,
runoff coefficients
CMA; Hydrological Yearbooks
3Land UseLand cover classification
(cropland, forest, etc.)
Institute of Geographic Sciences and Natural Resources Research, CAS (Kappa = 0.89)
4SocioeconomicPopulation density,
infrastructure distribution
National Bureau of Statistics; POI data
(10 m GPS accuracy)
5Disaster RecordsHazard locations, losses,
emergency responses
Ministry of Emergency Management
6Planning TextsSpatial plans, ecological redlinesDigitized municipal archives
Table 3. Data structure for rainstorm–flood risk identification model.
ModelCriterion LayerIndicator LayerSpecifications
PressureHazard
(Intensity)
Max 1 h rainfall (mm)ANUSPLIN-interpolated grids (1 km2), extreme event probability distributions
Storm return period (years)Gumbel distribution fitted to rainfall maxima
(e.g., 50-year event, Tr = 50)
Runoff coefficient (%)SCS-CN model calibrated with soil type and land use
StateEnvironmental (Sensitivity)Slope (°)30 m DEM-derived; slope > 25° as high risk
NDVILandsat 8 OLI-derived (30 m resolution)
Soil infiltration rate (mm/h)Measured via double-ring infiltrometer tests
ResponseSocioeconomic (Vulnerability)Population density (persons/km2)Administrative unit-based residential counts
Building density (%)Built-up area/total area per village
Facility accessibility (min)2SFCA-based 15 min emergency service coverage ratio
Table 4. Validation of weighting proportion based on entropy value combination for CRITIC.
Weight Ratio (CRITIC: Entropy Value)Fit of Historical DamageValue Significance
0.5:0.50.72<0.01
0.6:0.40.81<0.001
0.7:0.30.78<0.01
Table 5. Determining the optimal solution.
Candidate Values (Λ)Nash Efficiency Coefficient (NSE)Policy Achievement Rate (%)Composite Score
0.500.7889.20.824
0.550.8192.70.865
0.600.7785.40.792
Table 6. Configurations of town–village spatial development scenarios in the Xi’an segment.
ScenarioDriving FactorsKey Parameterization
Business as UsualHistorical land-use trendsAnnual built-up expansion: 2.8%; ecological land loss: 1.2%; sponge facilities: 15%
Ecological PriorityCarbon neutrality and hard conservation constraintsBuilt-up cap: 25%; ecological land ≥ 35%; green infrastructure investment ≥ 30%
Intensive DevelopmentAccelerated urbanization and infrastructure upgradesBuilt-up agglomeration index ≥ 0.7 (+50%); drainage standard: 30-year return period; detention capacity +2 × 10⁶ m3
Table 7. Rainstorm–flood risk zoning in town–village systems.
Risk TierArea Share (%)Risk Index RangeGeomorphic Characteristics
High-Risk Zone29.90.62–1.00Low-elevation plains, densely populated towns
(population density > 200 persons/km2)
Medium-Risk Zone34.10.46–0.61Low terraces, farmland–town transitional areas
Low-Risk Zone36.00.00–0.45Low-mountain hills to alpine zones, ecological reserves, and unpopulated areas
Table 8. Multi-scenario risk projections for town–village systems in the Xi’an segment of the northern Qinling foothills (2035).
ScenarioRisk Index
(95% CI)
Built-Up Land ChangeEcological Land ChangeHigh-Risk Zone ChangeDominant
Drivers
Business as Usual0.68 ± 0.09 [0.59,0.77]+38%−7.2%32%Population agglomeration,
GDP growth rate
Ecological Priority0.47 ± 0.13 [0.34,0.60]+18%+5.6%18%policy incentives,
Ecological compensation mechanisms
Intensive Development0.72 ± 0.11 [0.61,0.83]+55%−8.9%45%land finance,
Industrial upgrading pressures
Disclaimer/Publisher’s Note: The statements, opinions and data contained in all publications are solely those of the individual author(s) and contributor(s) and not of MDPI and/or the editor(s). MDPI and/or the editor(s) disclaim responsibility for any injury to people or property resulting from any ideas, methods, instructions or products referred to in the content.

