
Quantifying Thermal Spatiotemporal Signatures and Identifying Hidden Mining-Induced Fissures with Various Burial Depths via UAV Infrared Thermometry

Abstract
1. Introduction
2. Materials and Methods
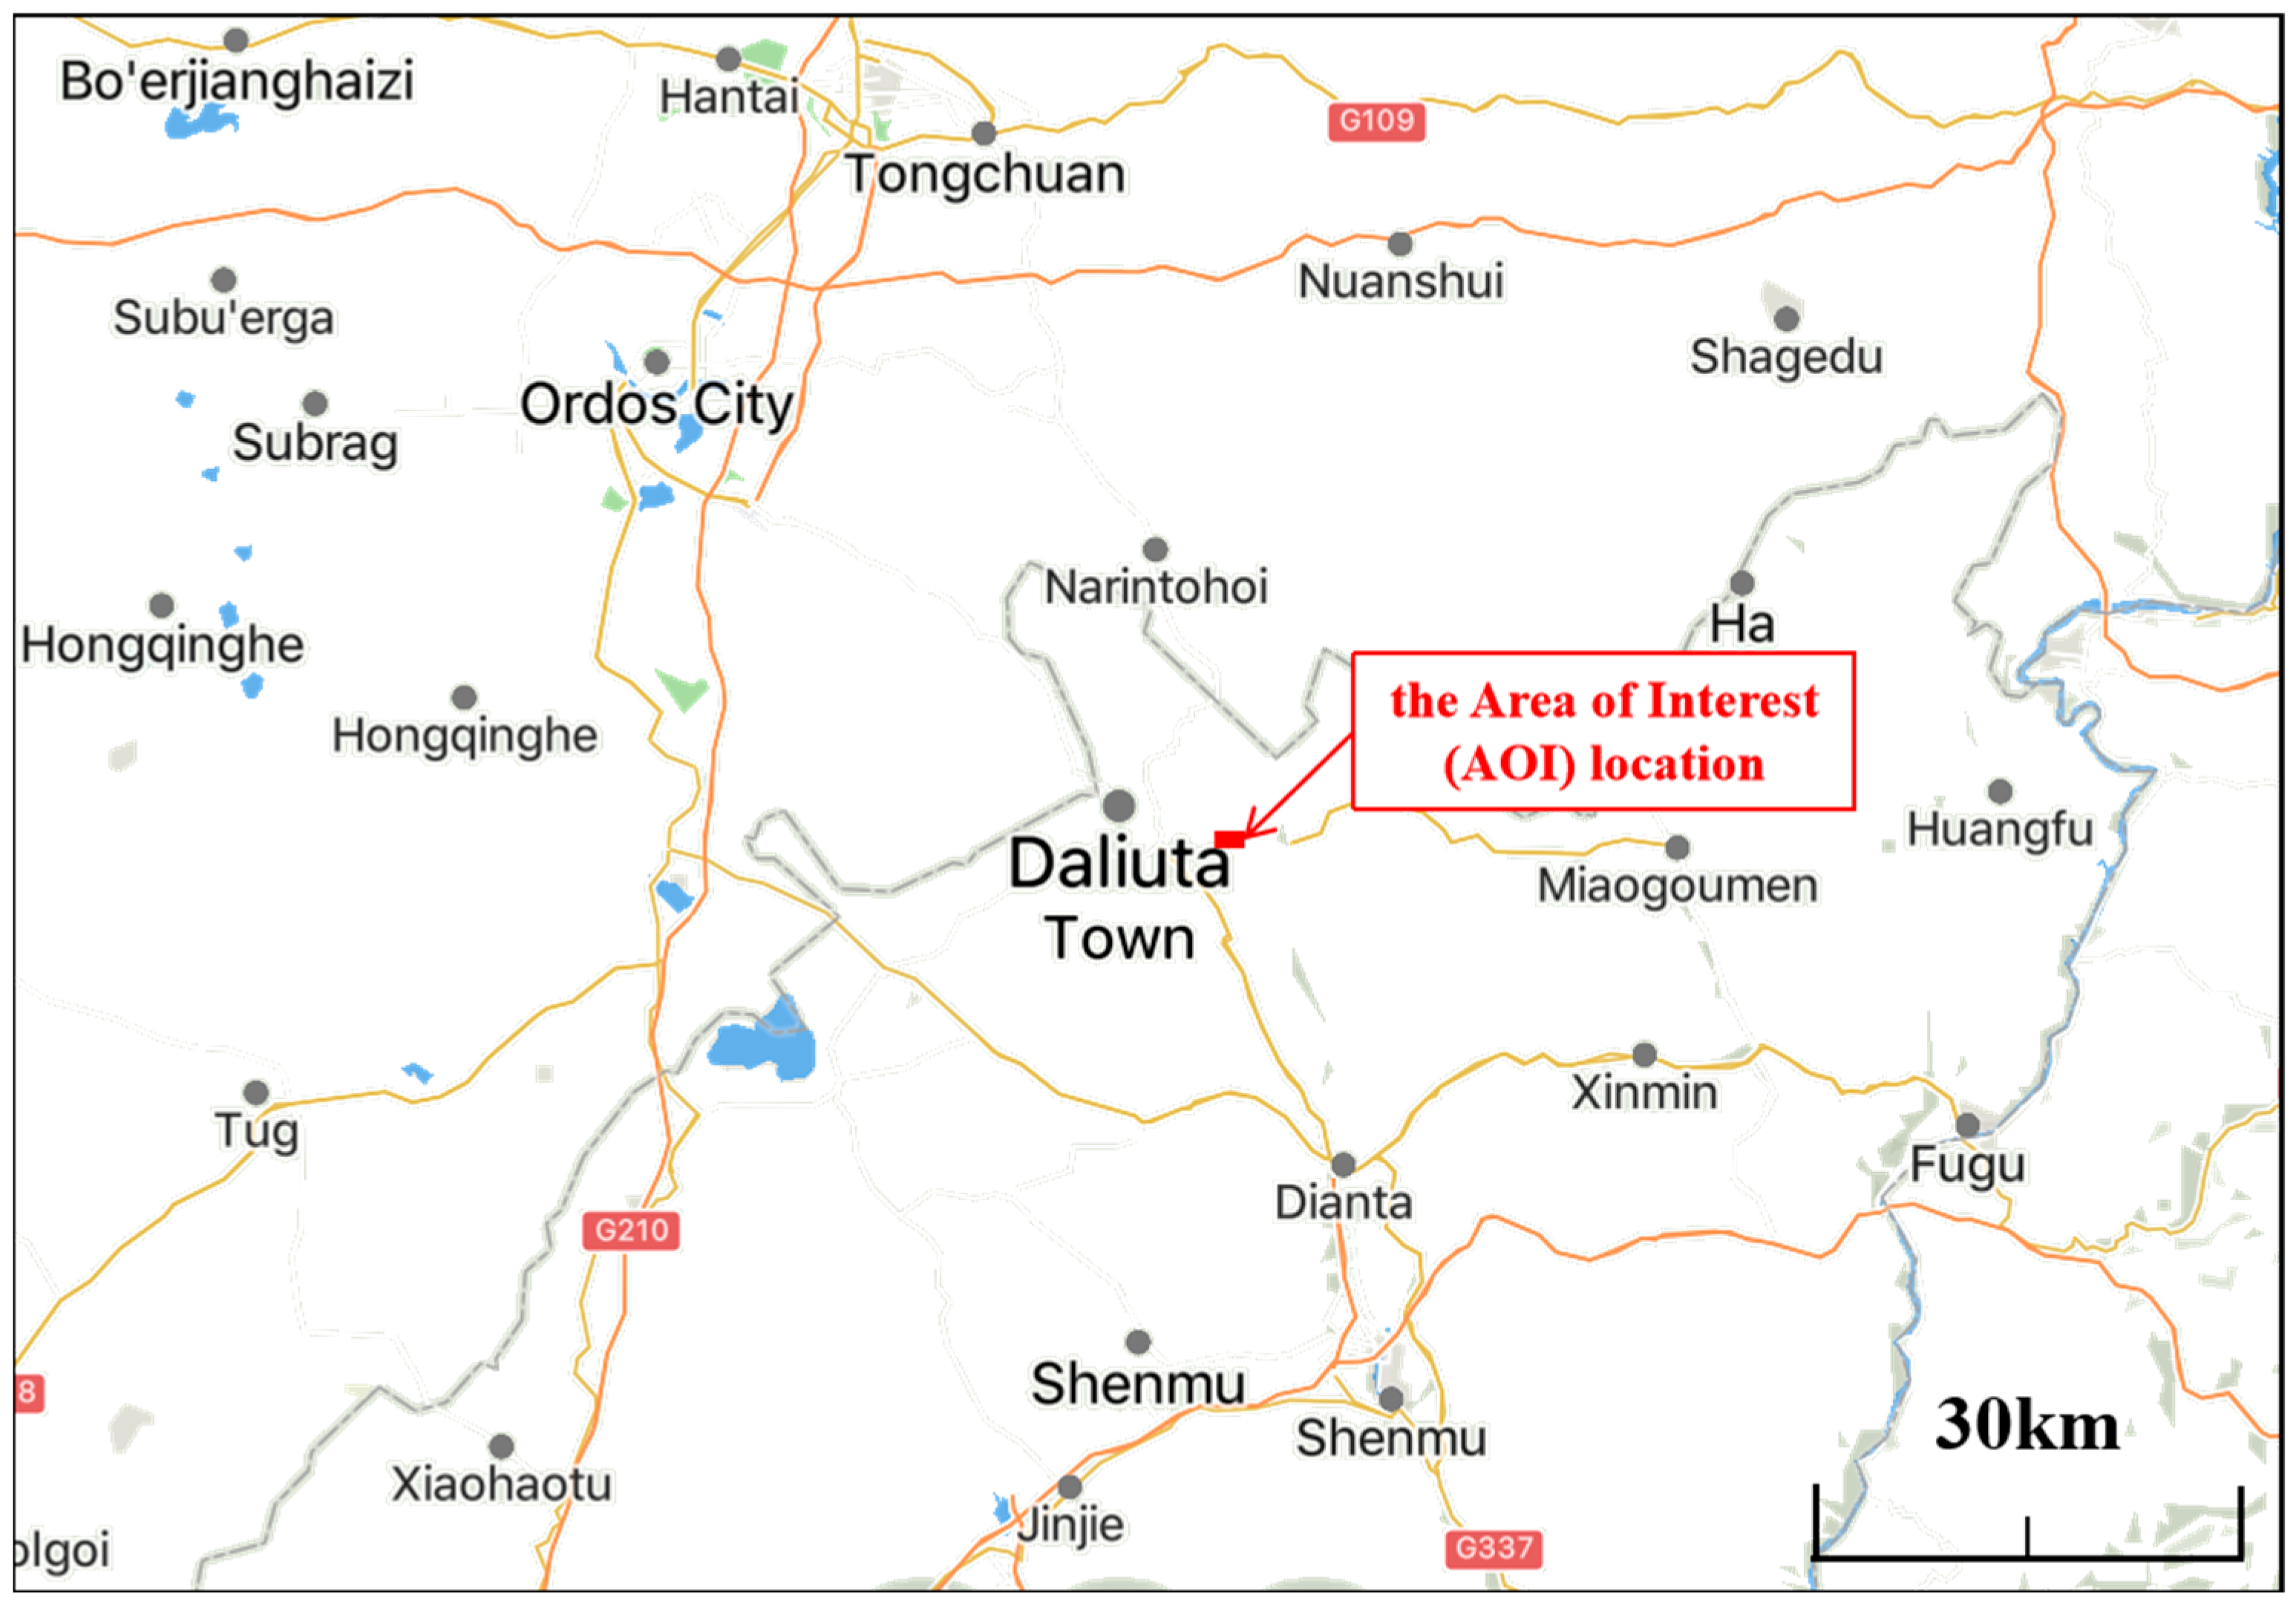
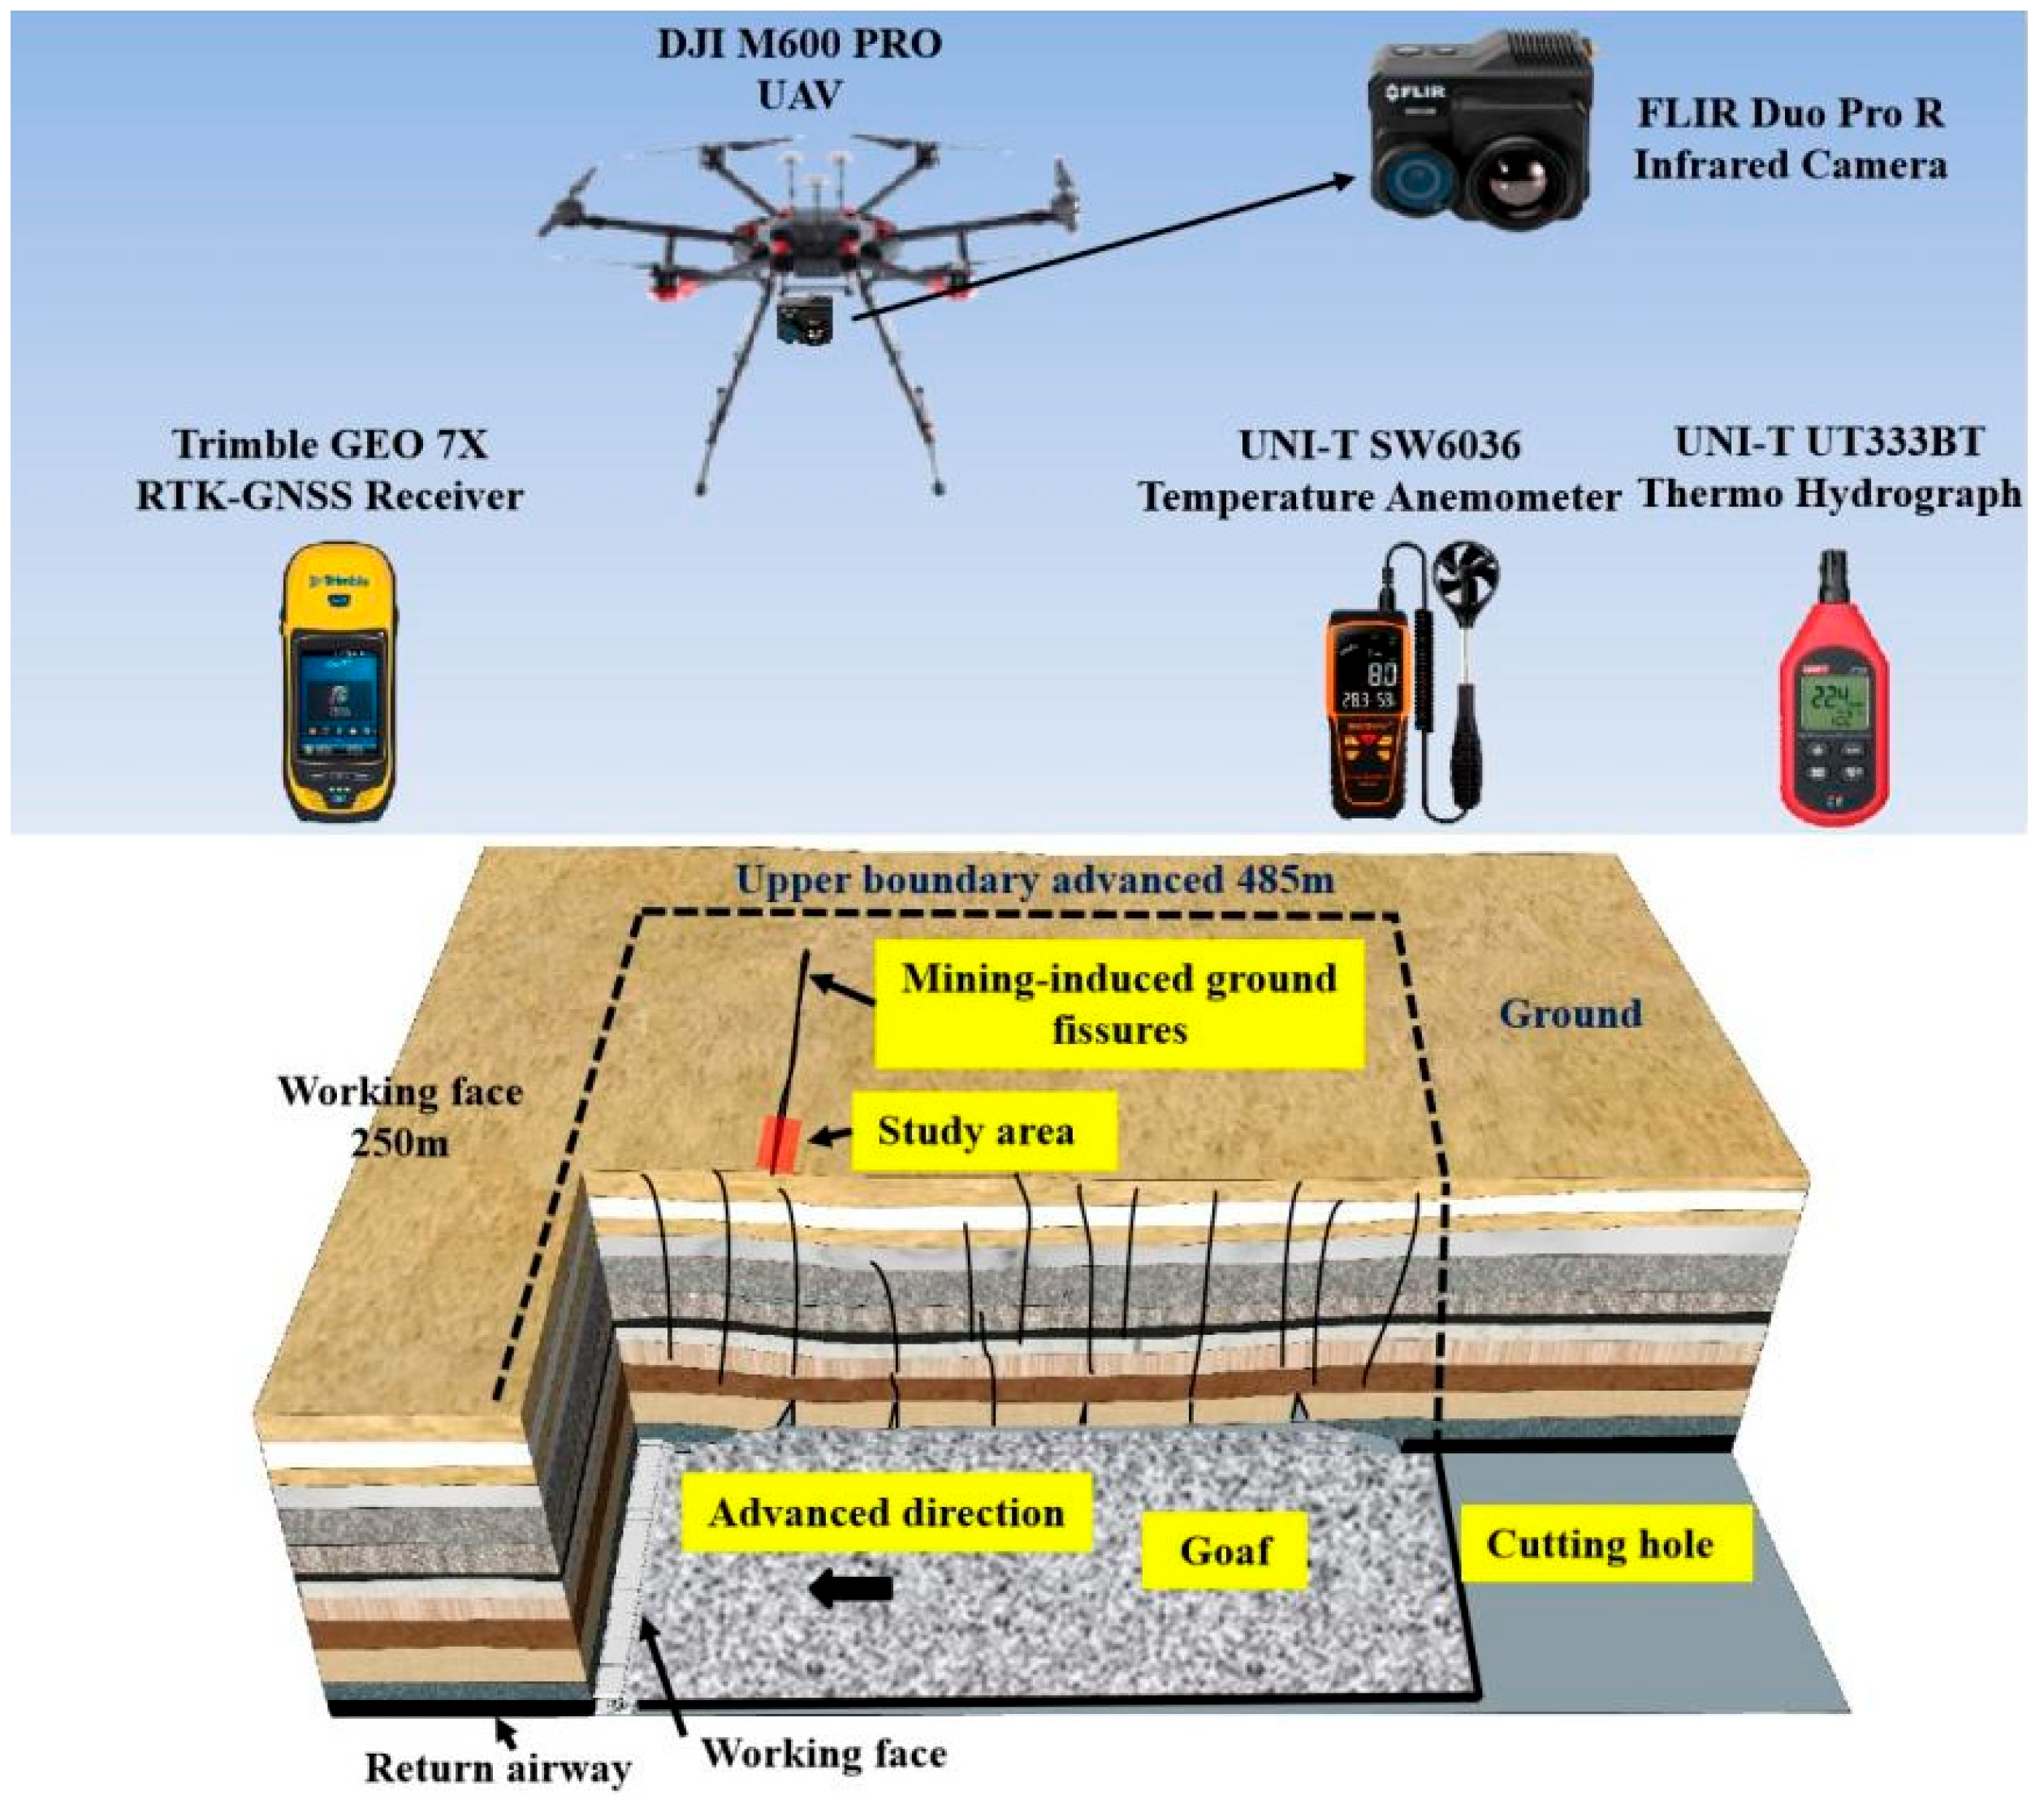
2.1. Engineering Investigation Background
2.2. Equipment Used for Identifying Hidden Mining-Induced Fissures
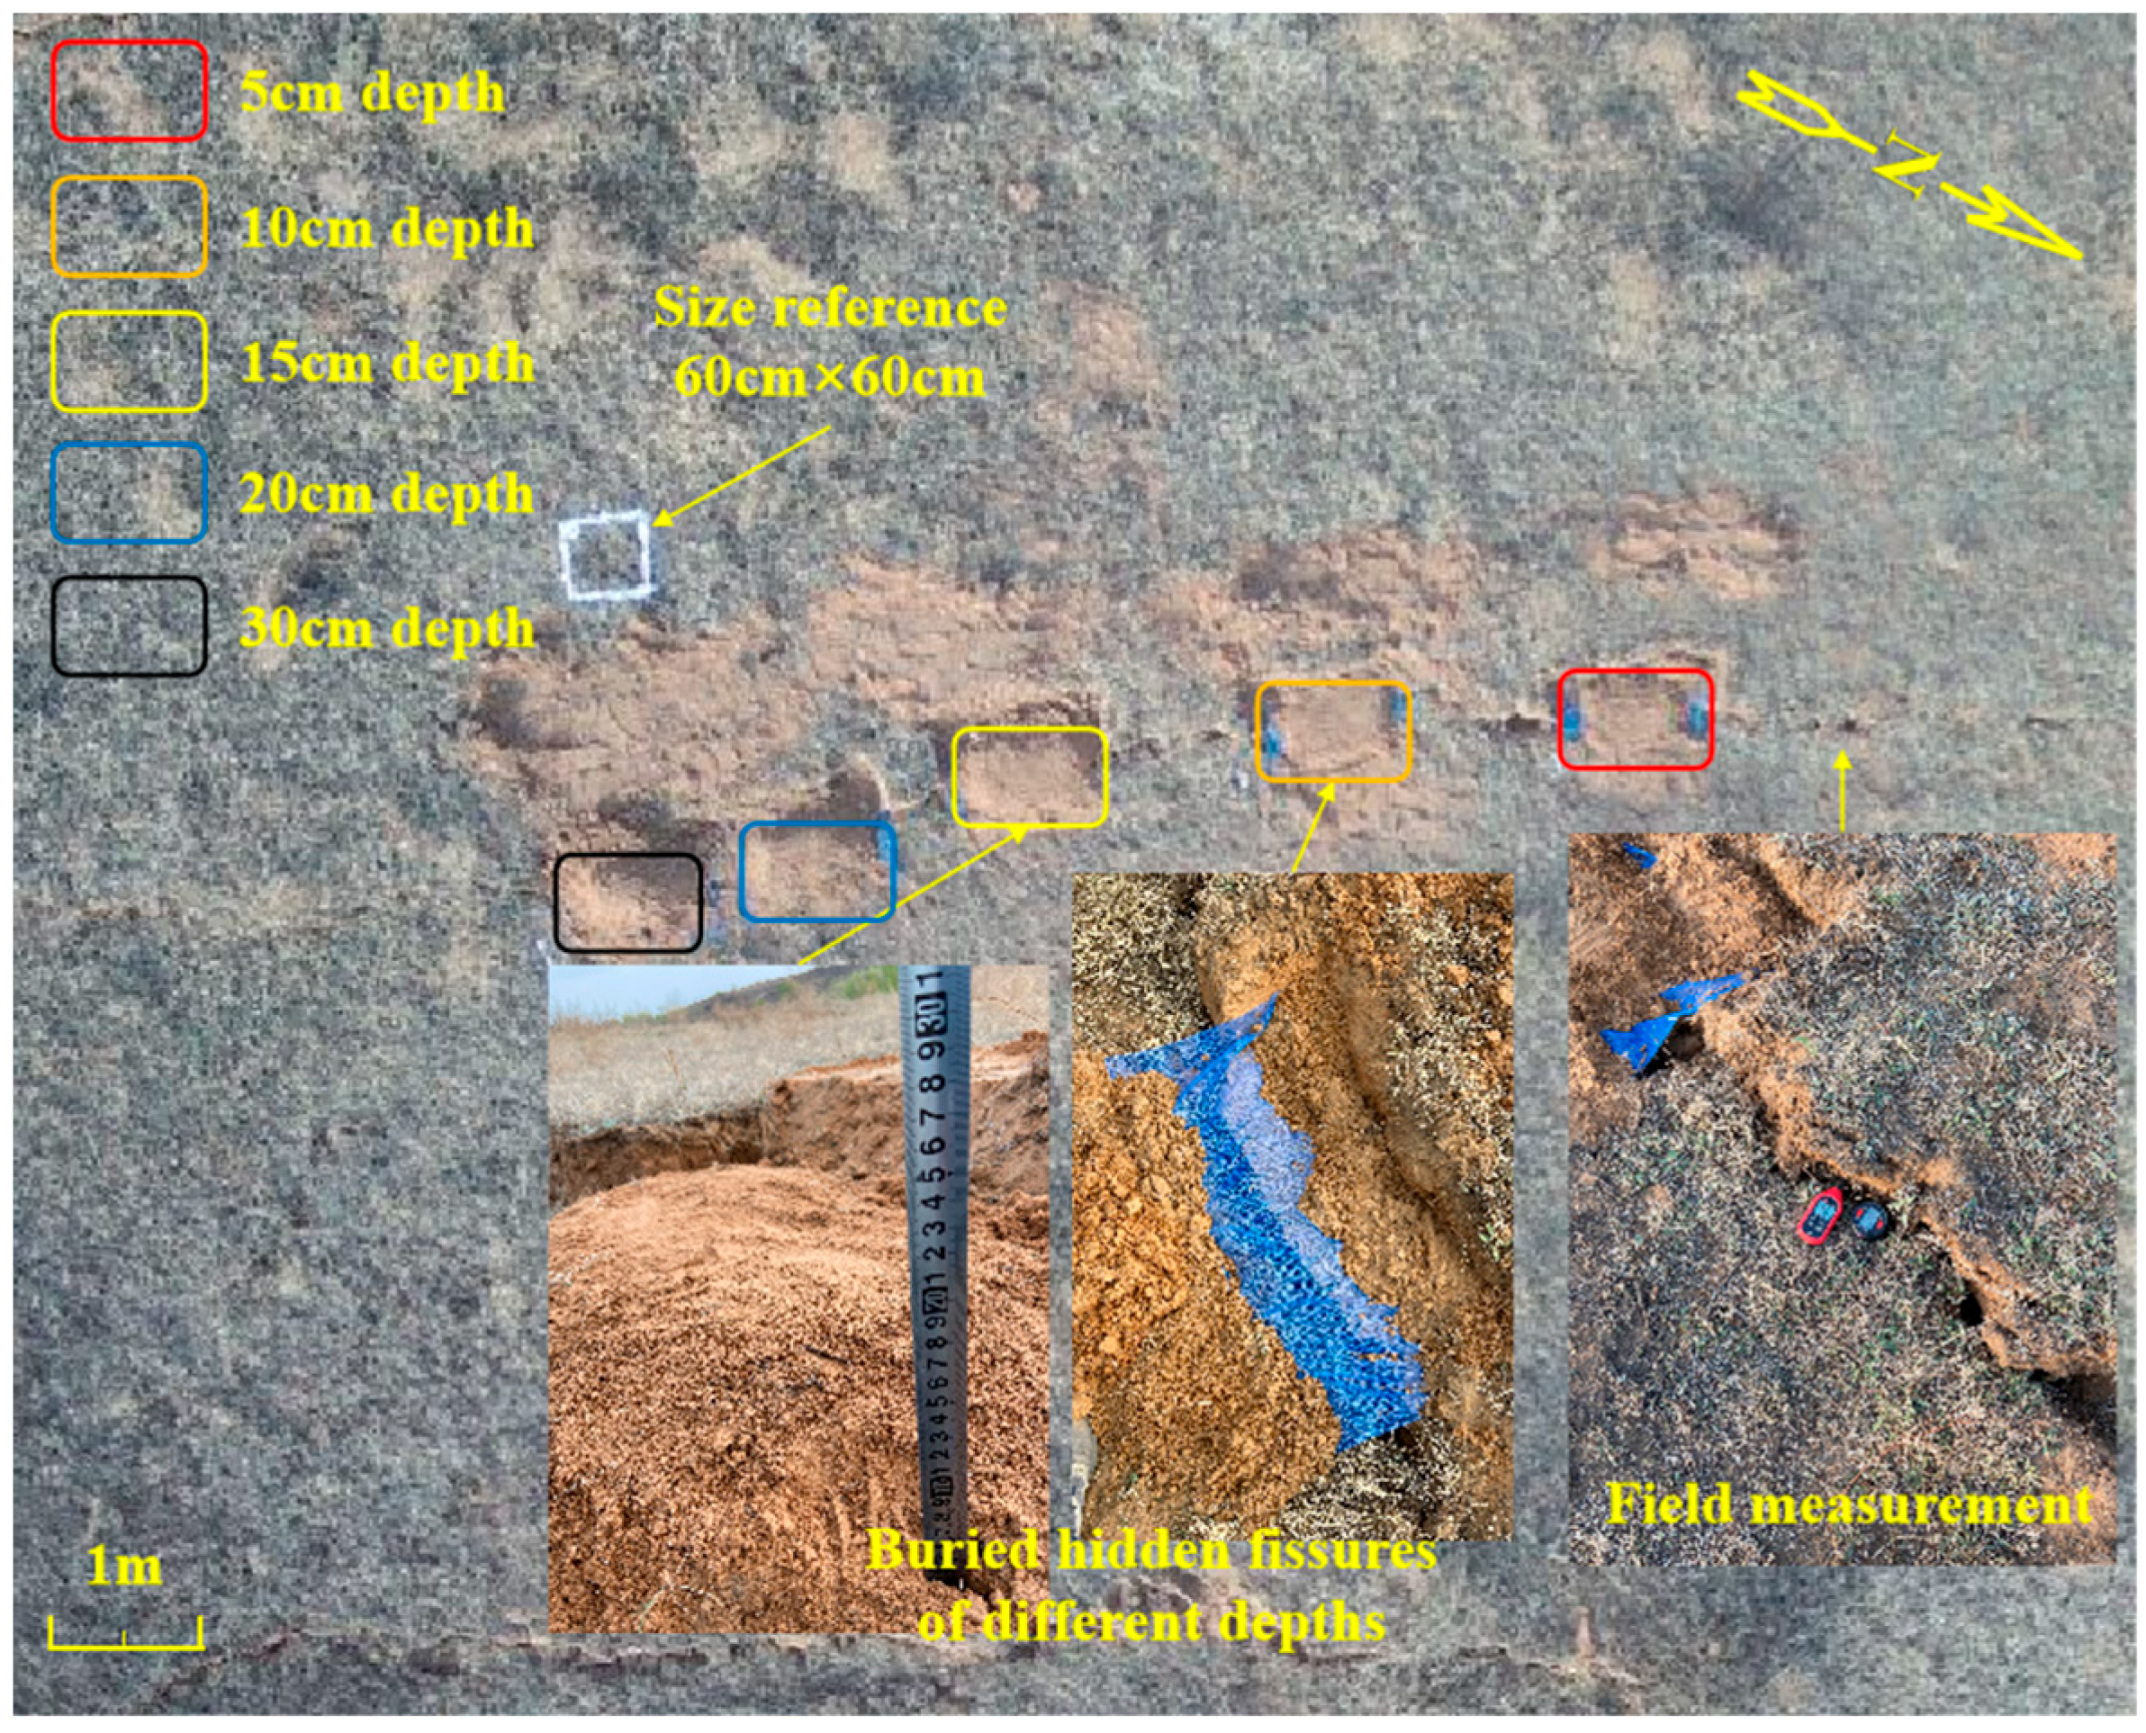
2.3. Infrared Monitoring Experiment of Hidden Mining-Induced Fissures at Different Burial Depths
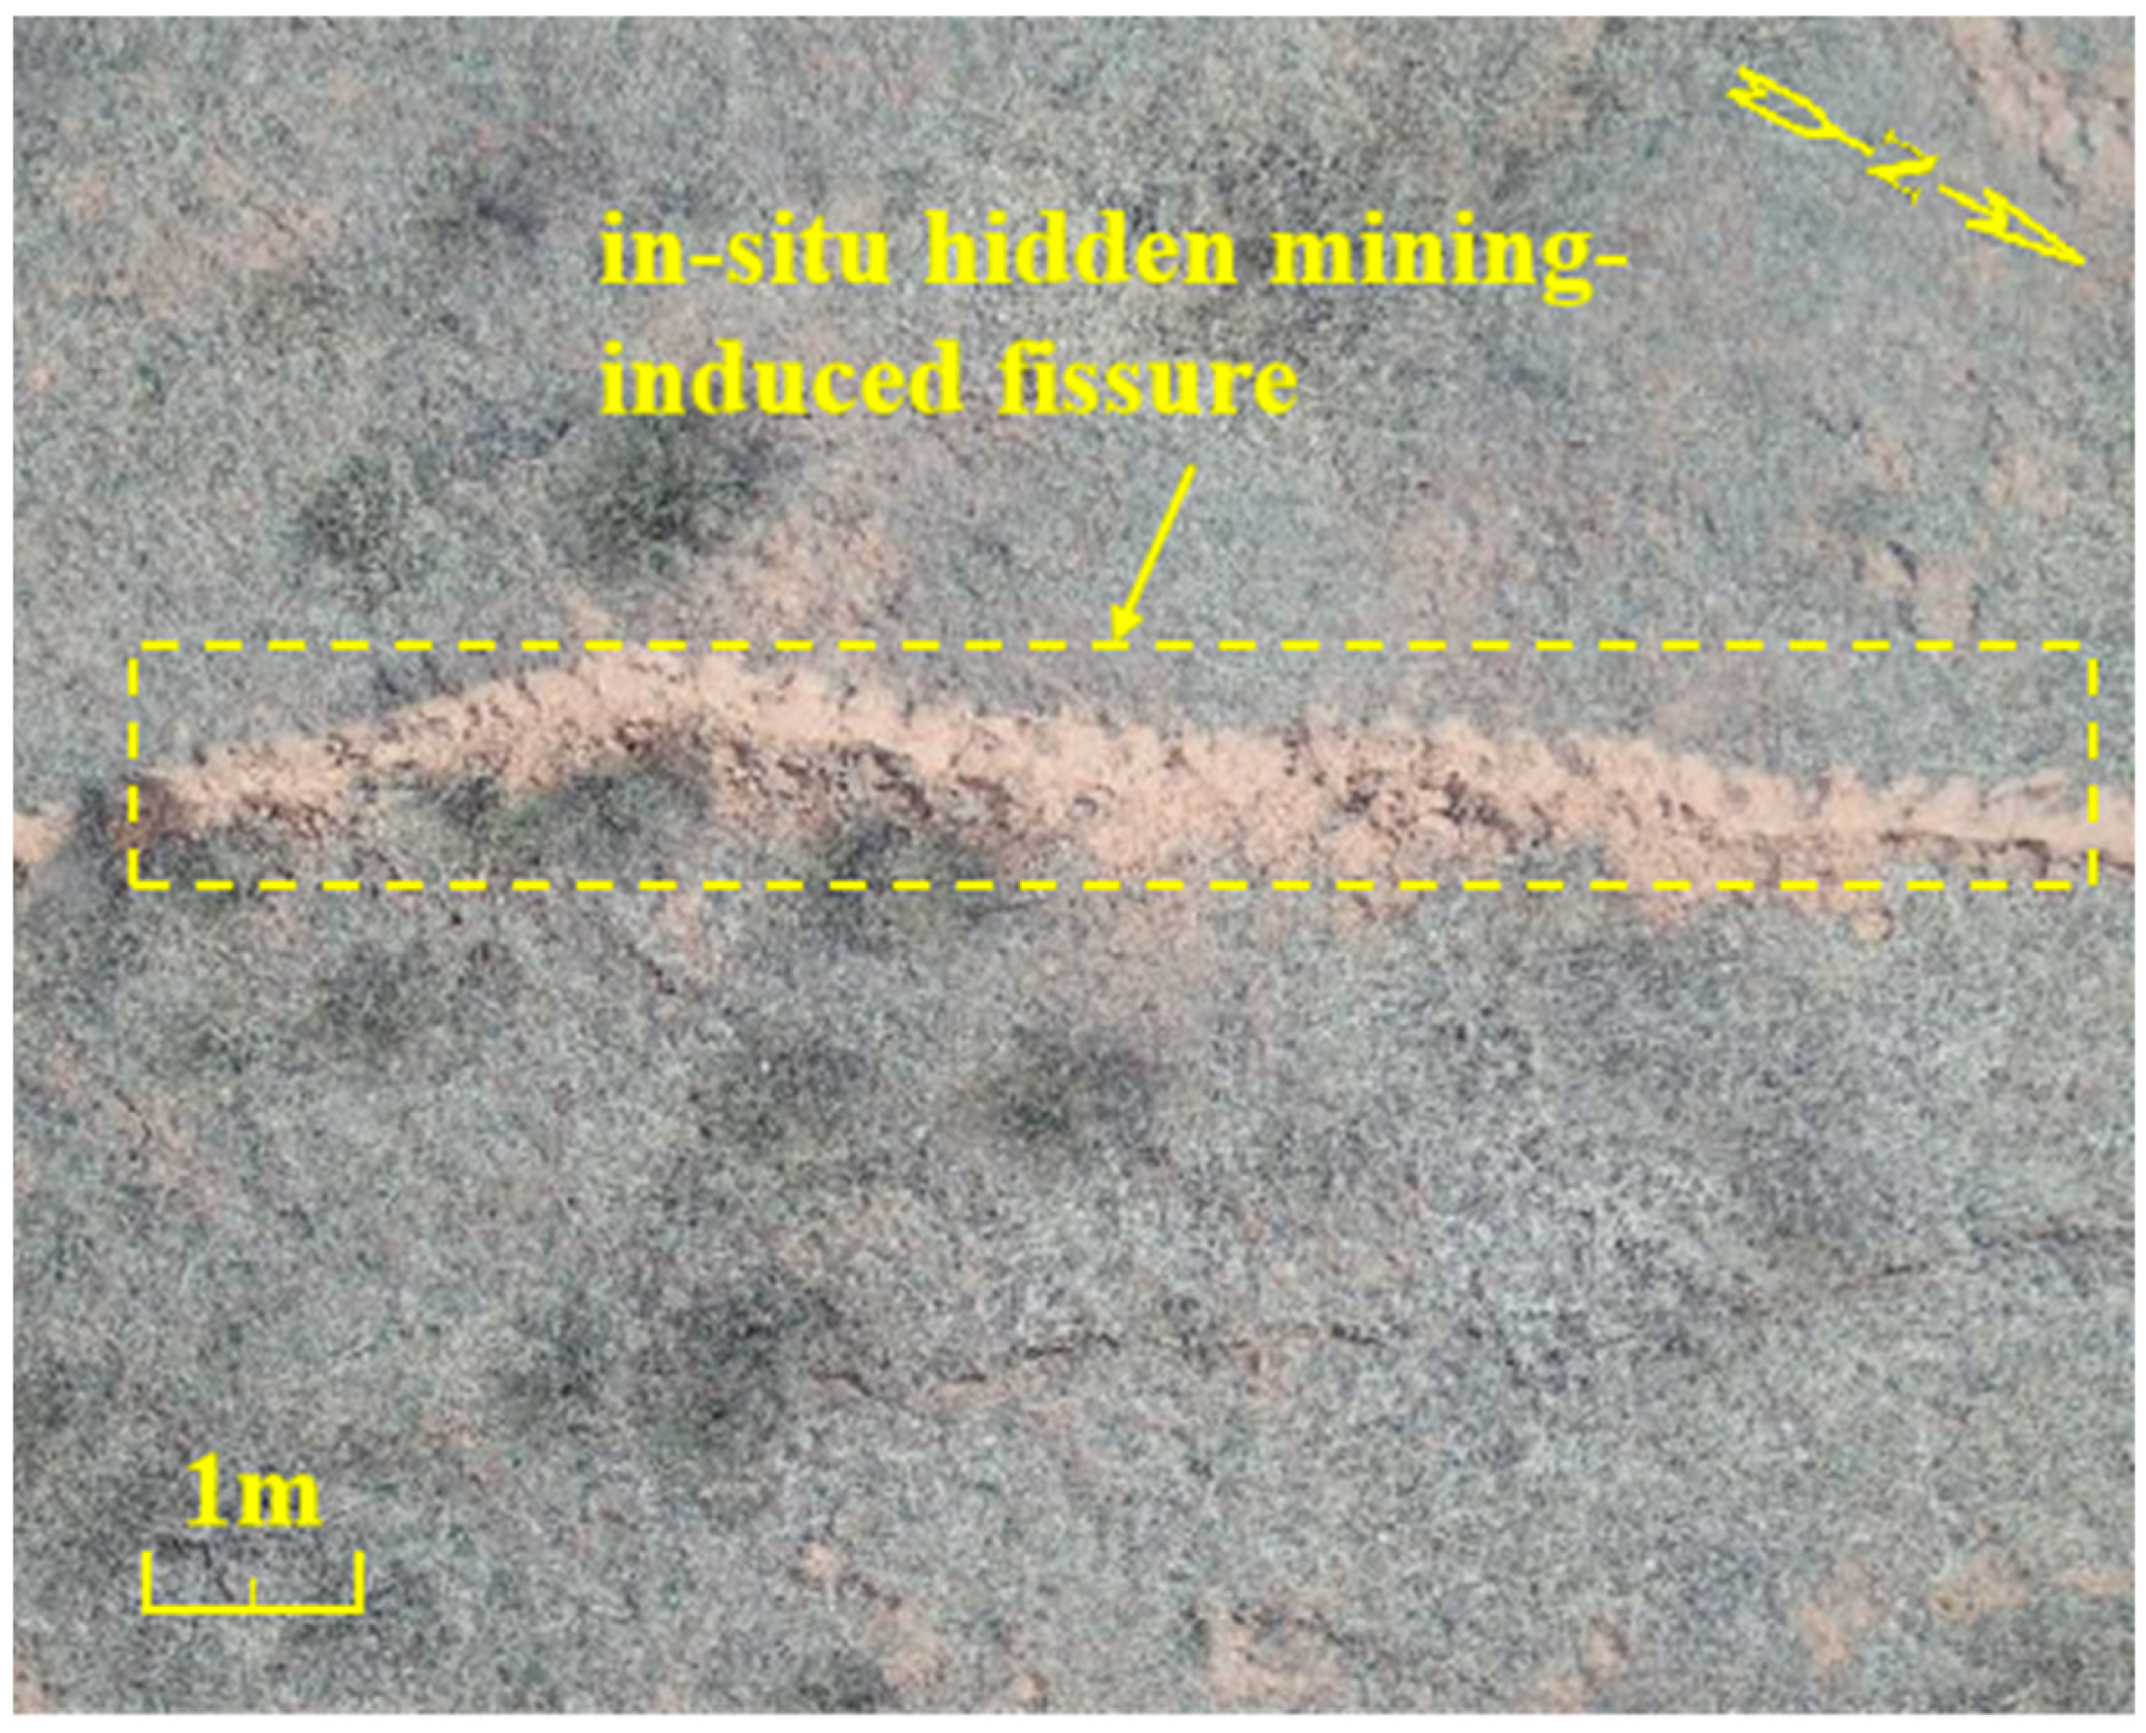
2.4. Identification Experiment of the In Situ Hidden Mining-Induced Fissure
2.5. Temperature Extracted from the Infrared Images
3. Results and Discussion
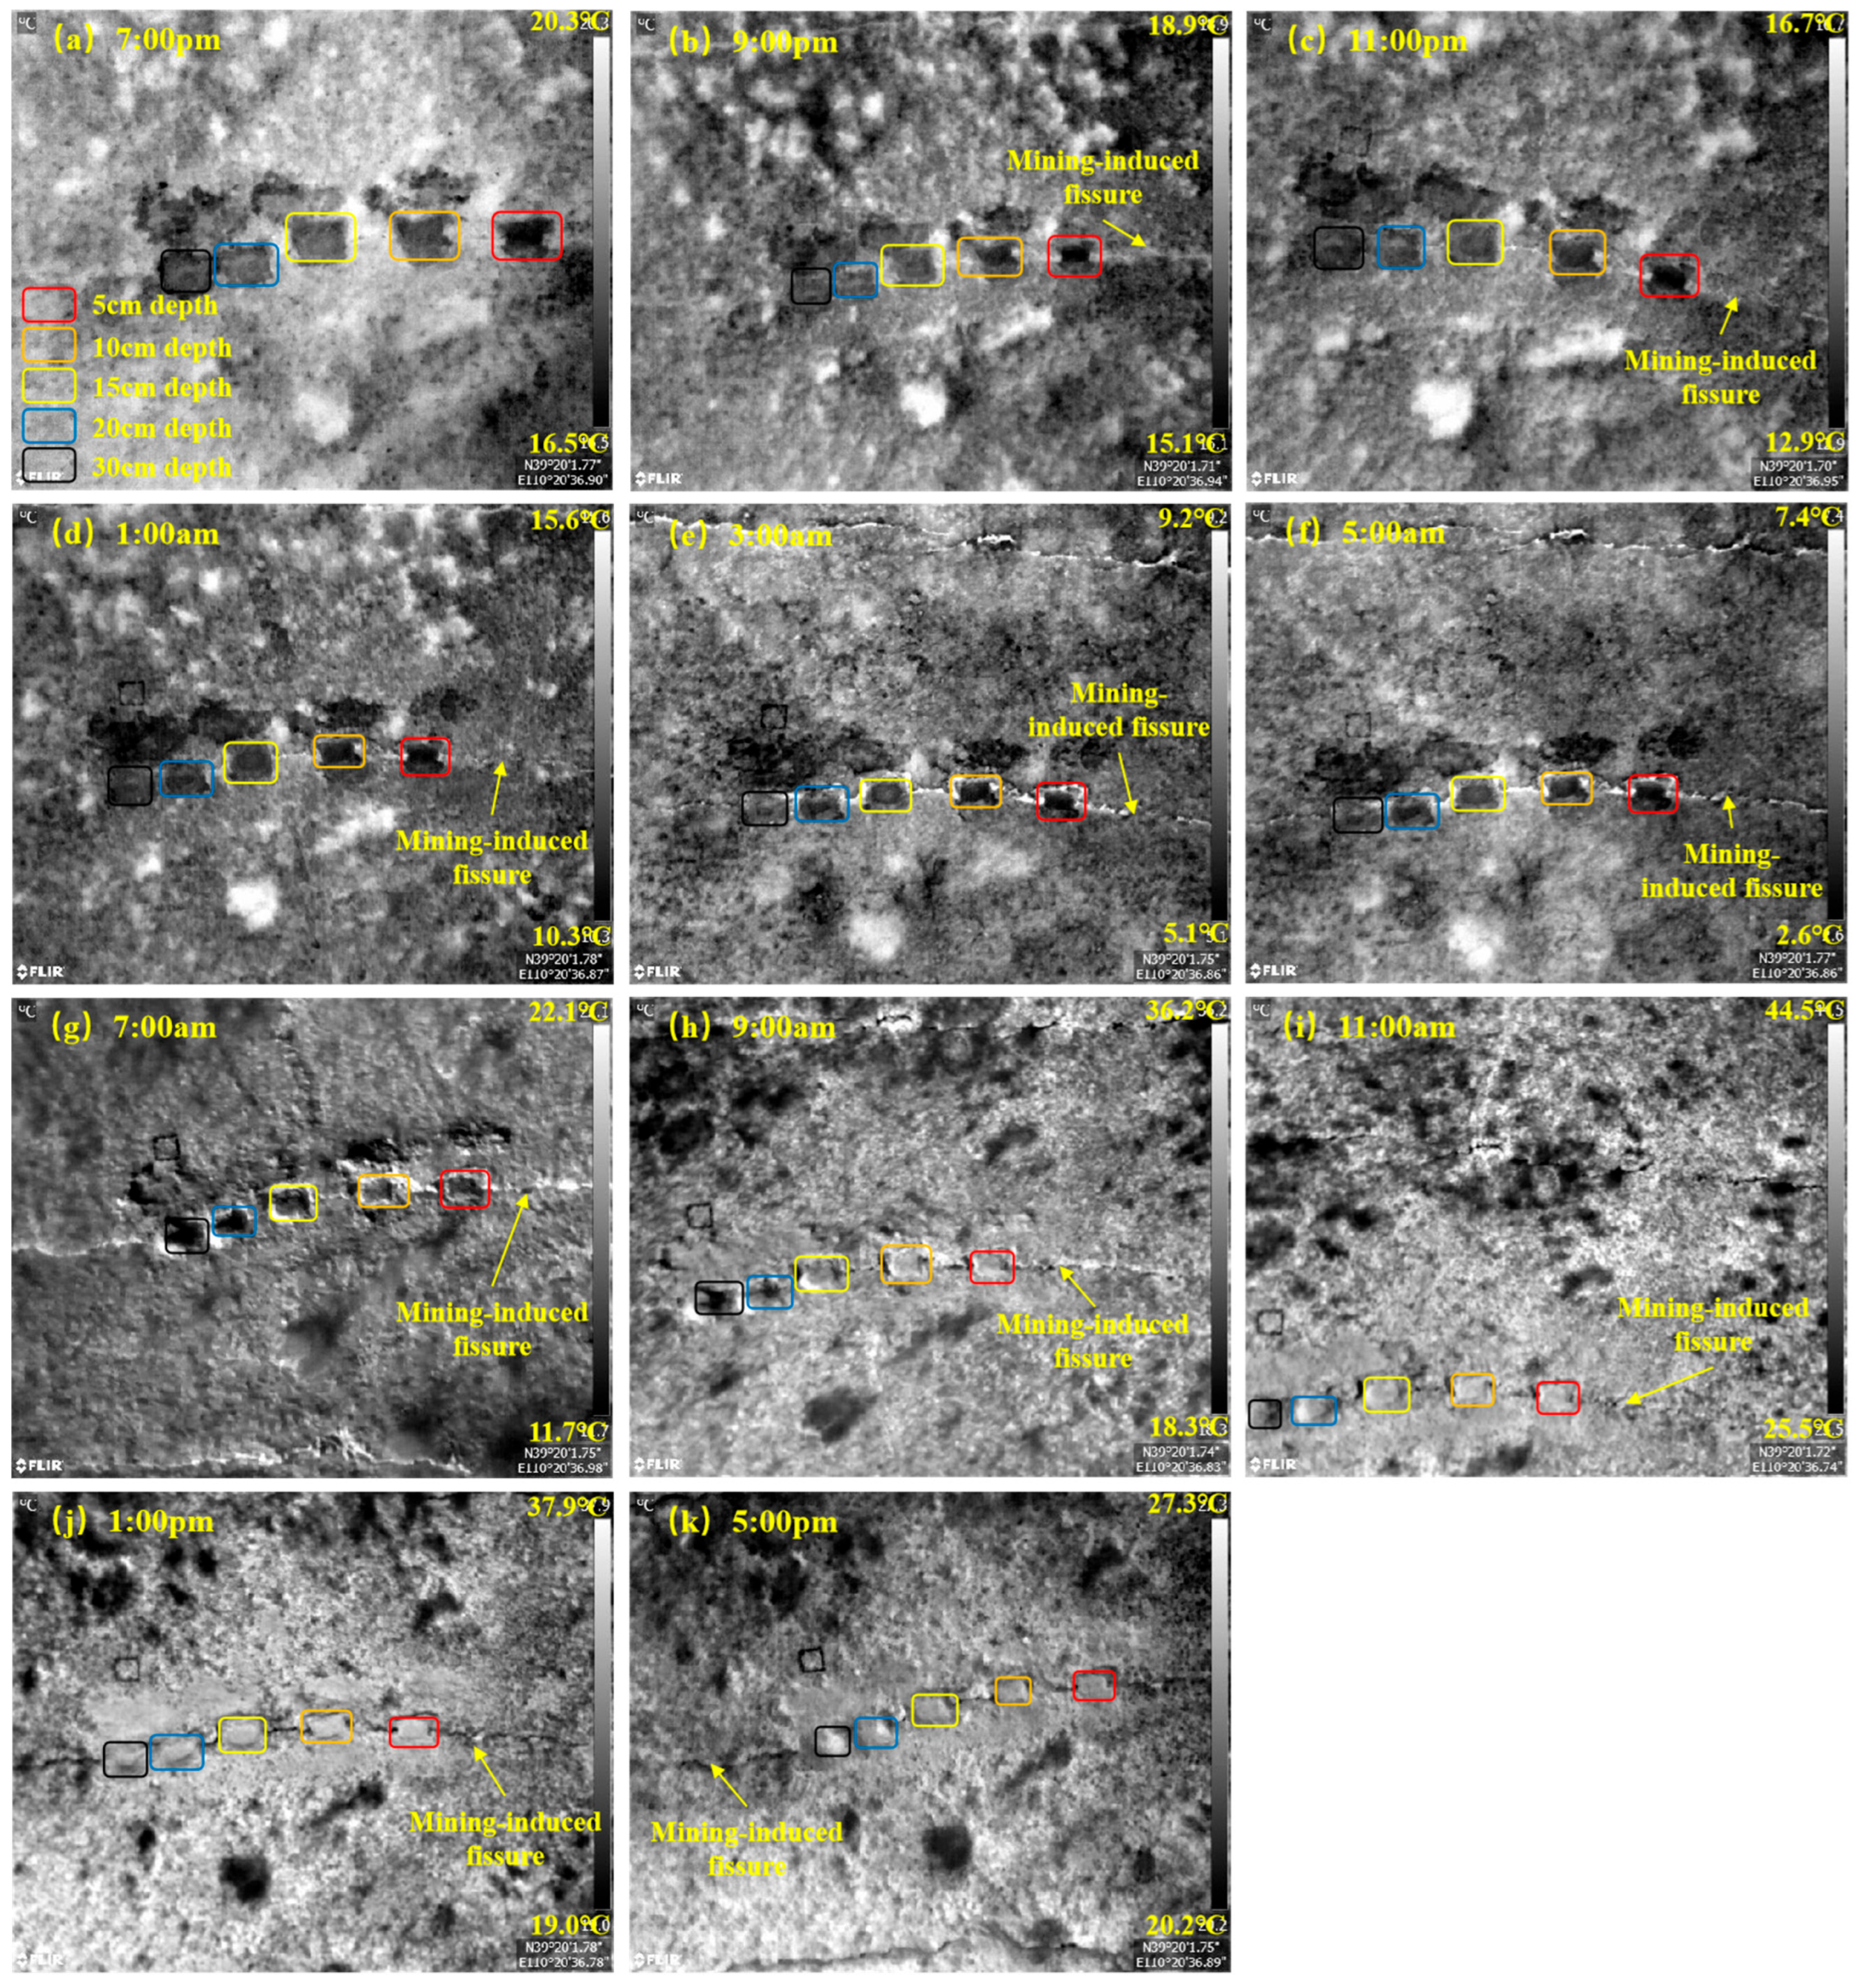
3.1. Infrared Images of the Test Area at Different Times
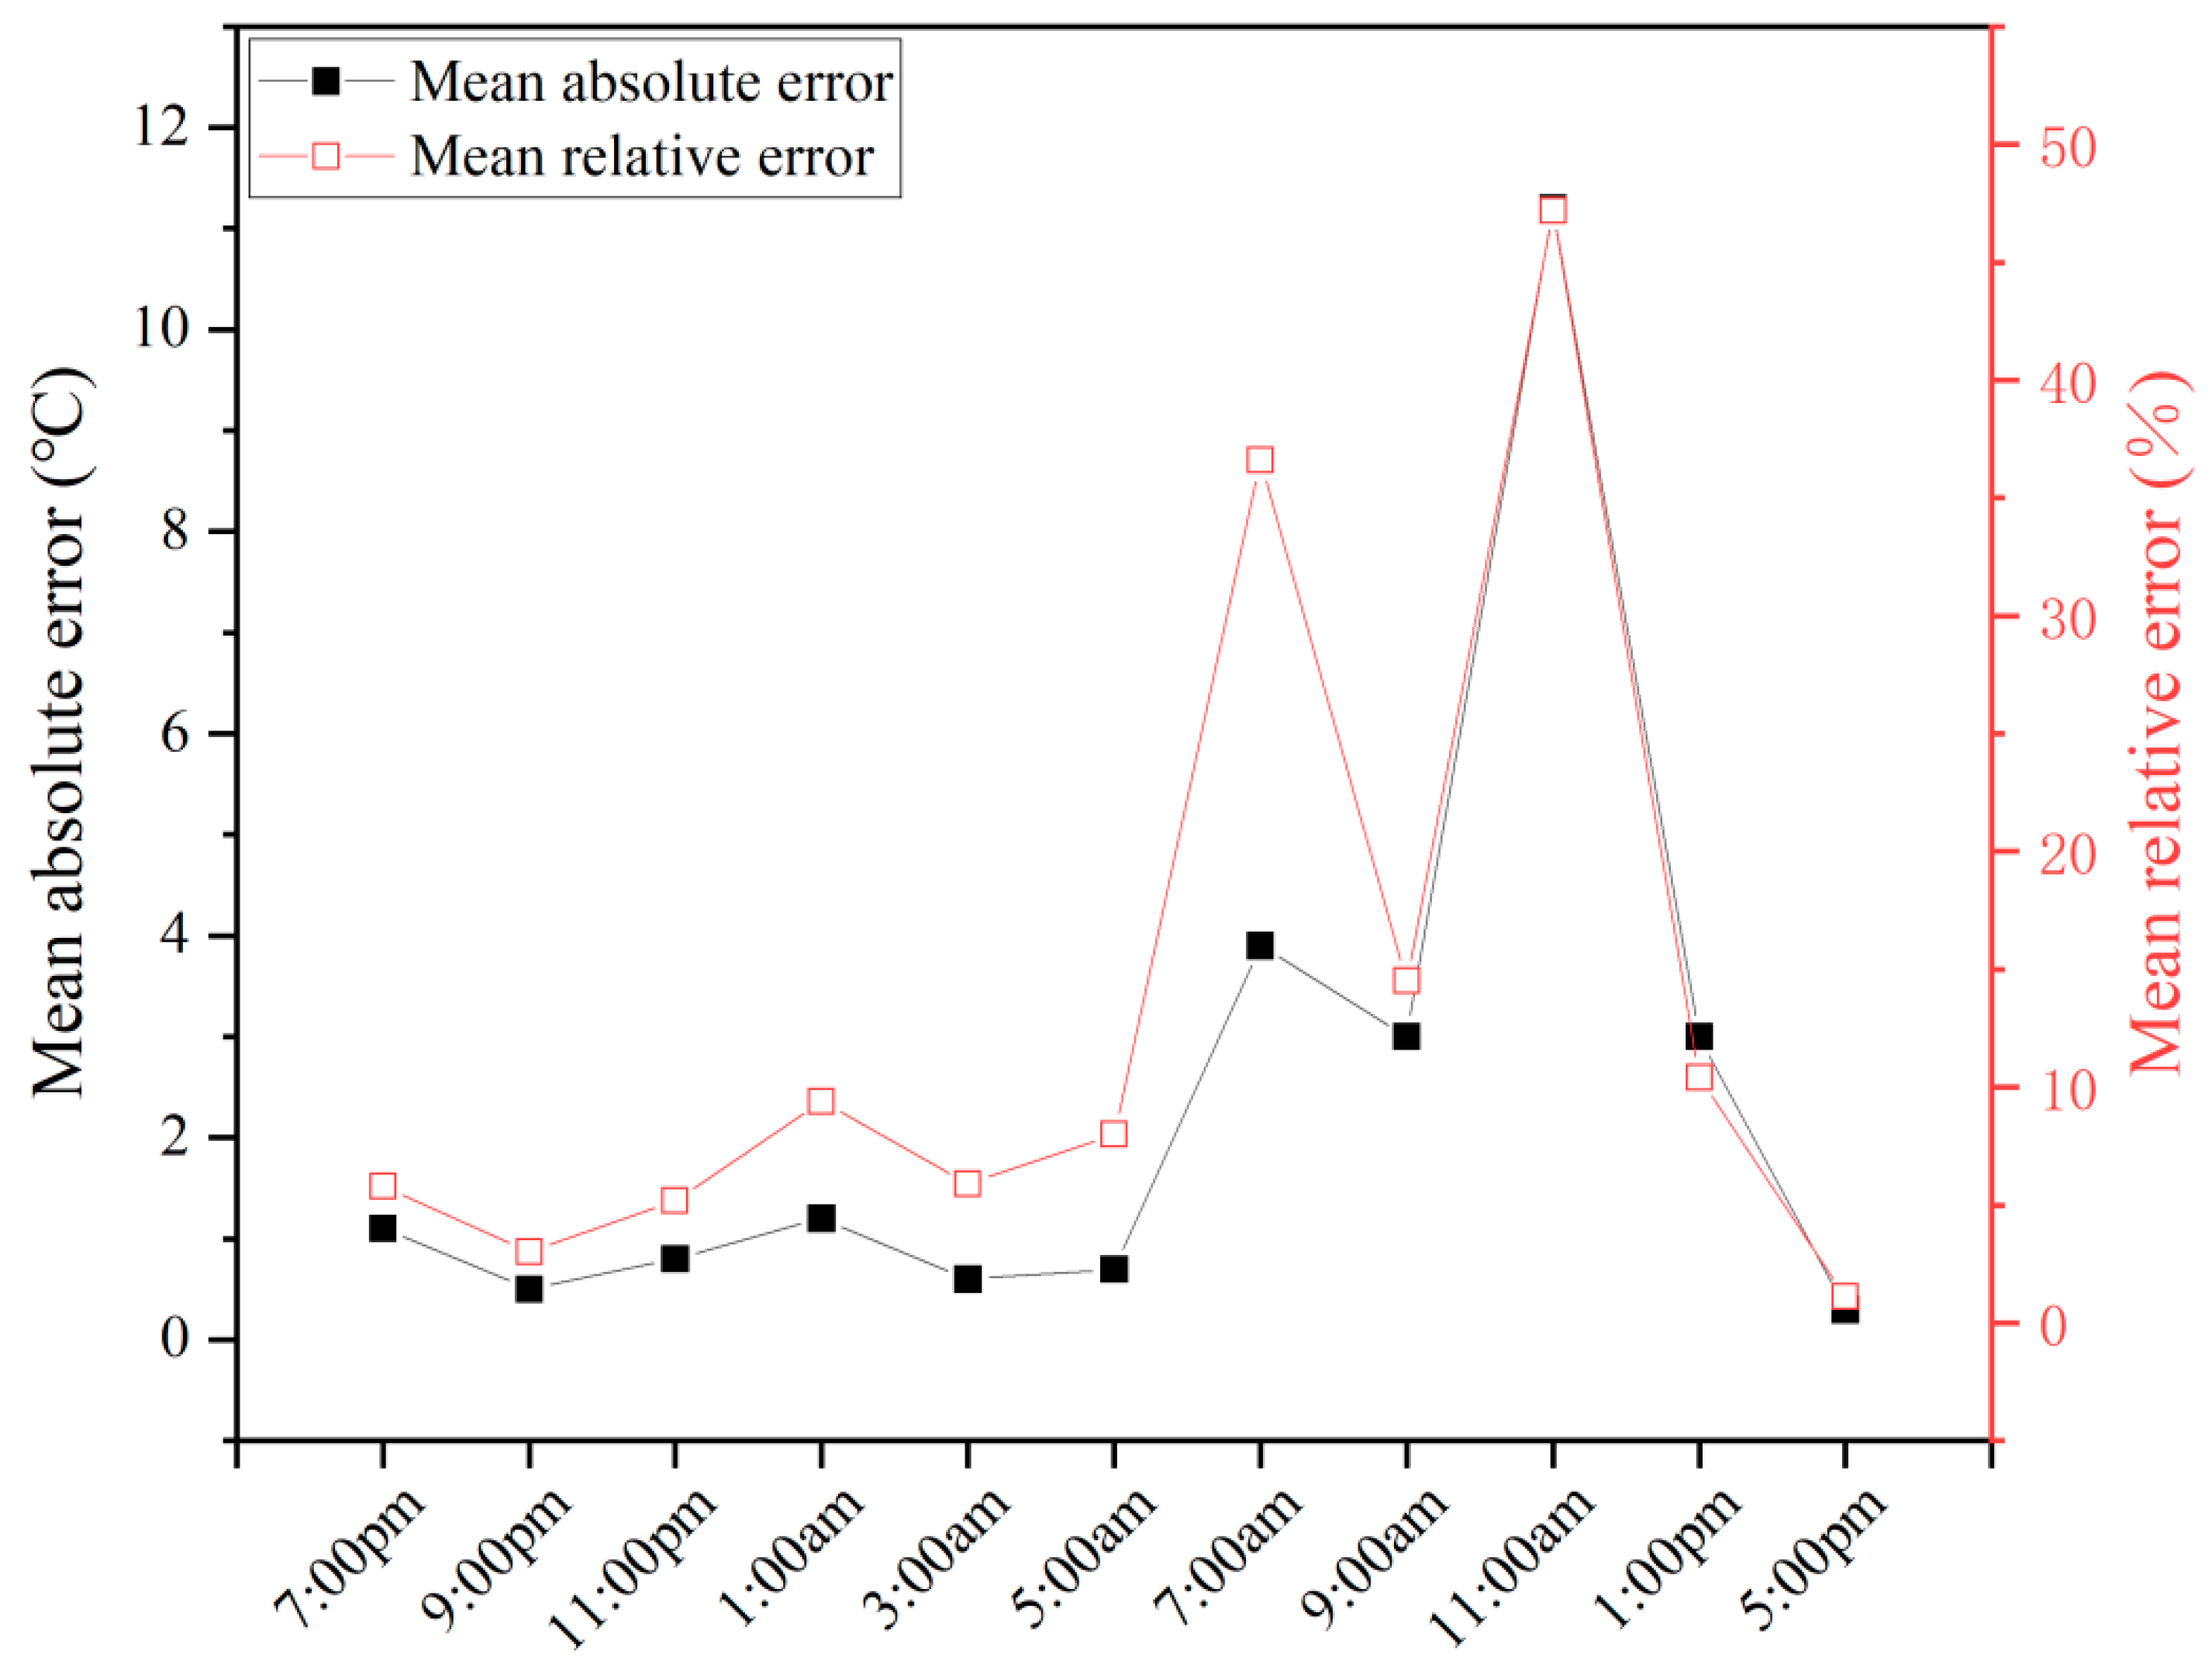
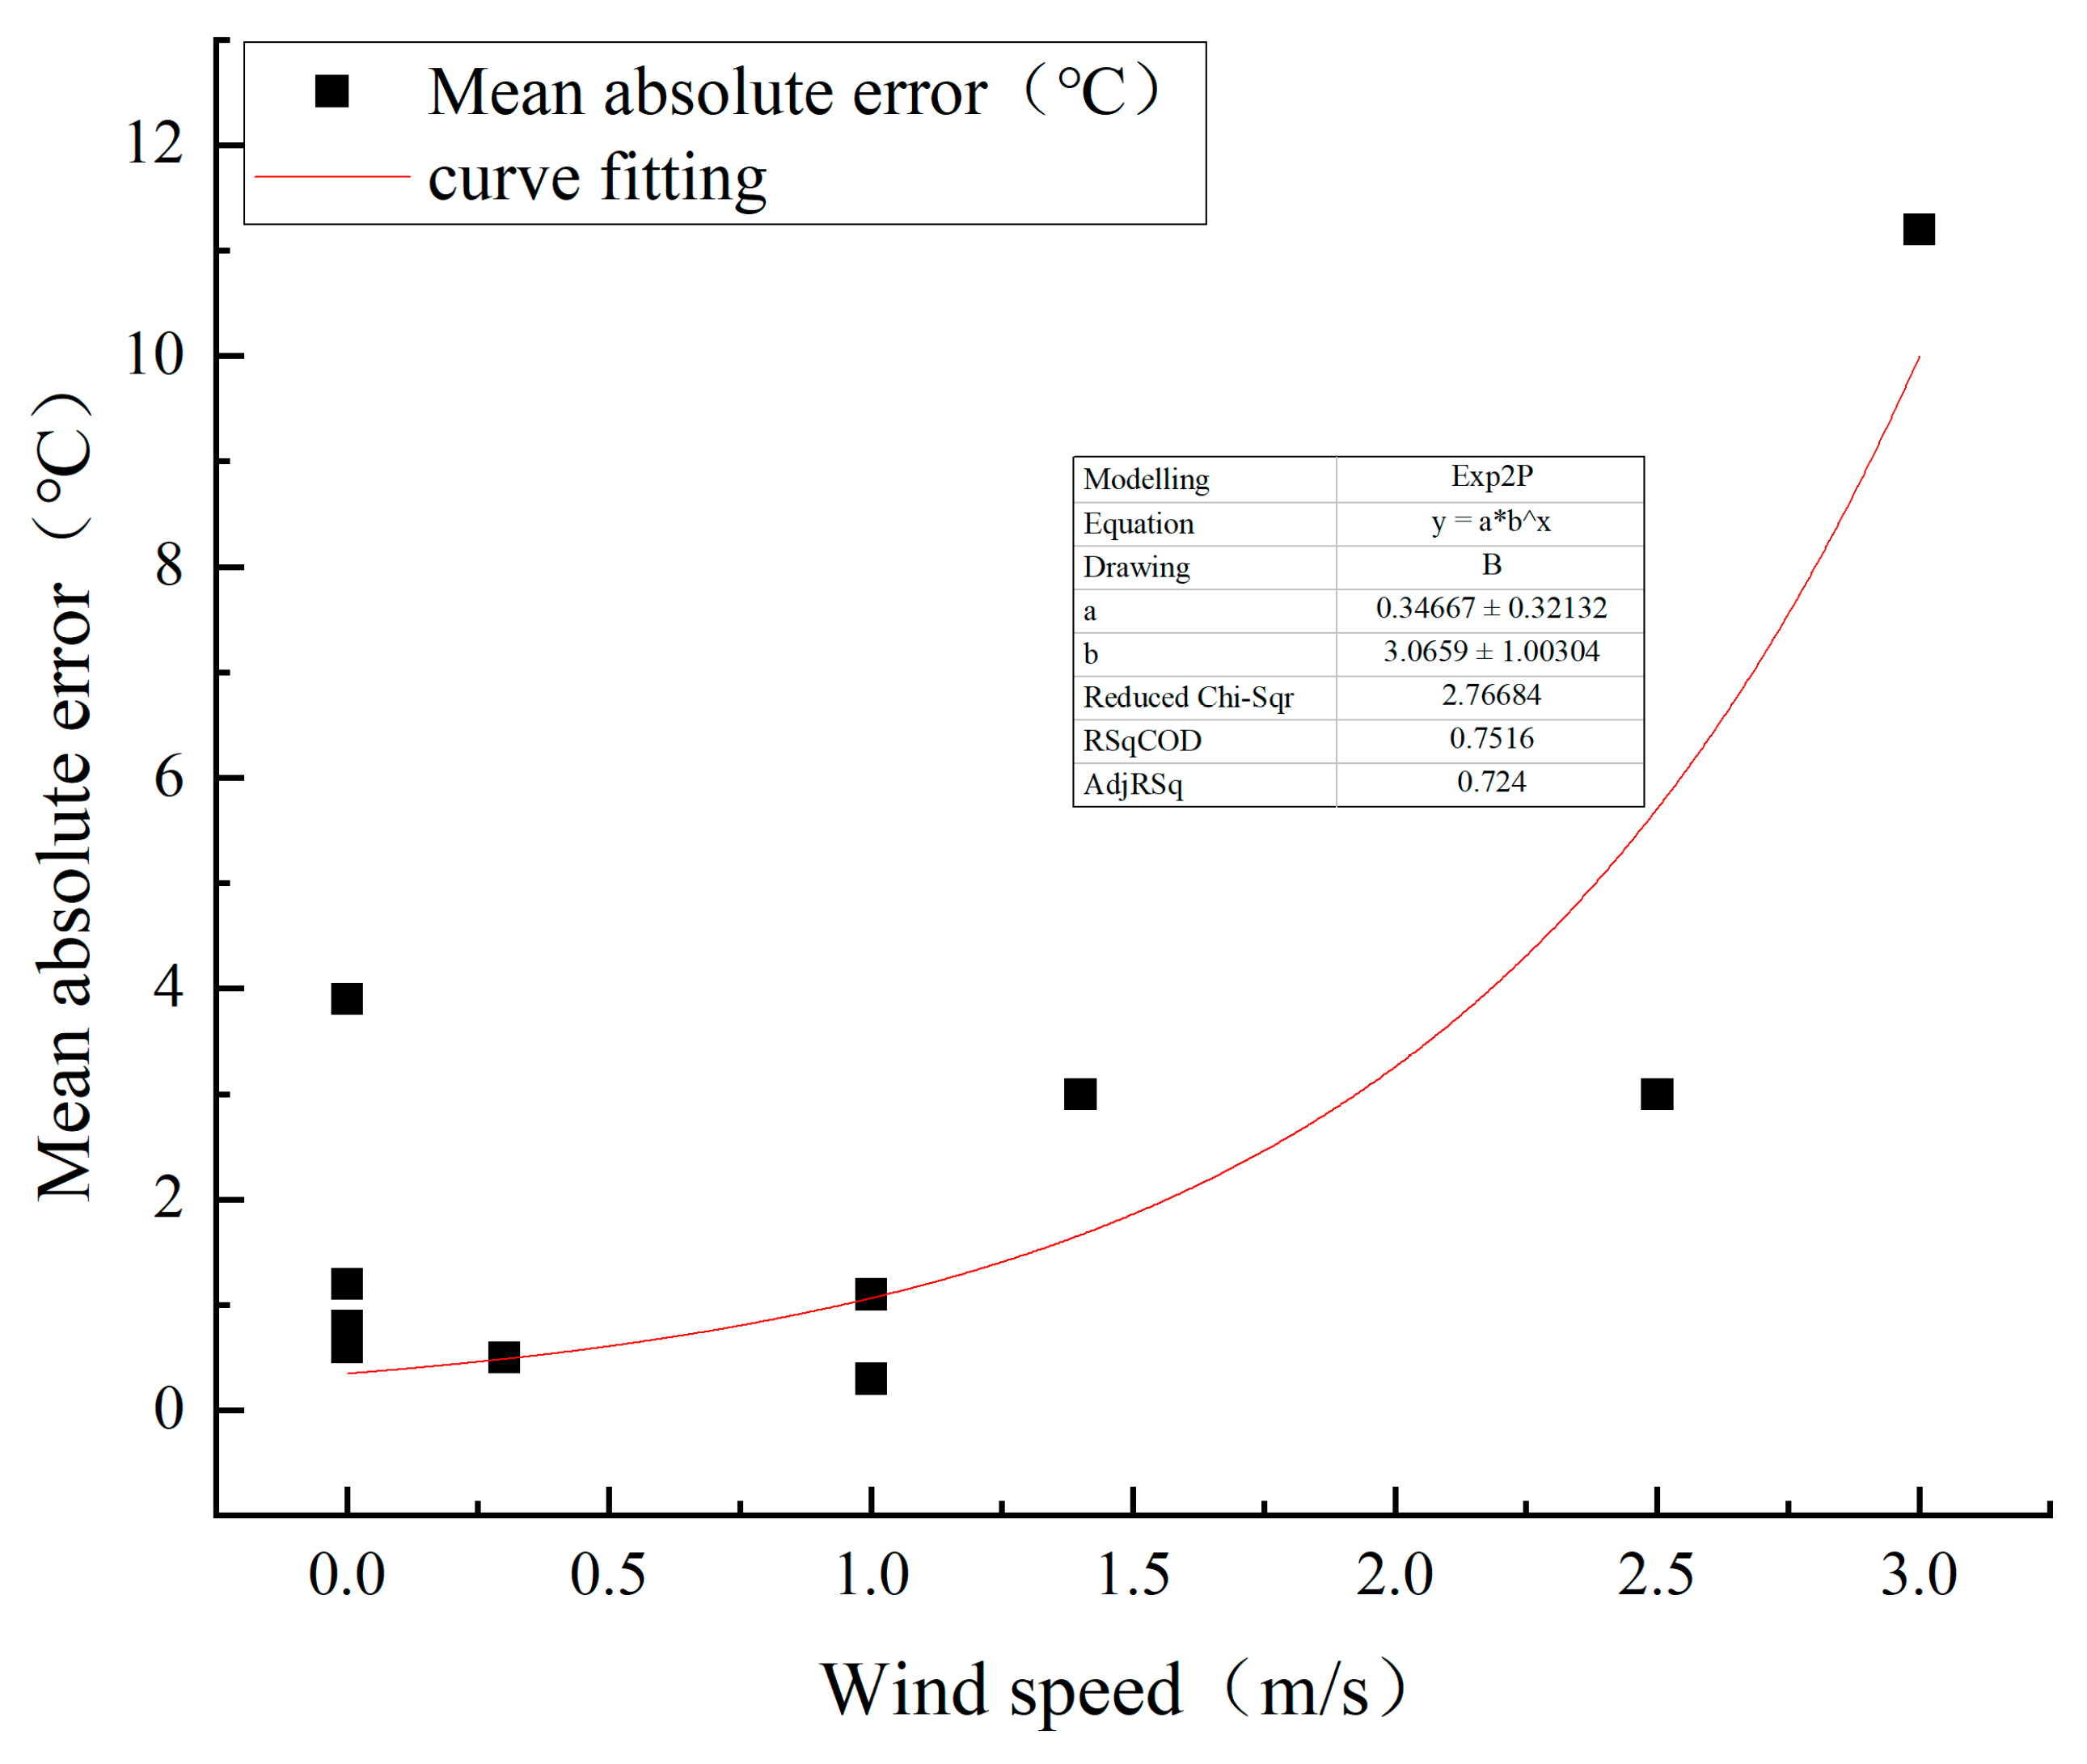
3.2. Temperature Accuracy Analysis of Ground Mining-Induced Fissures in Infrared Images
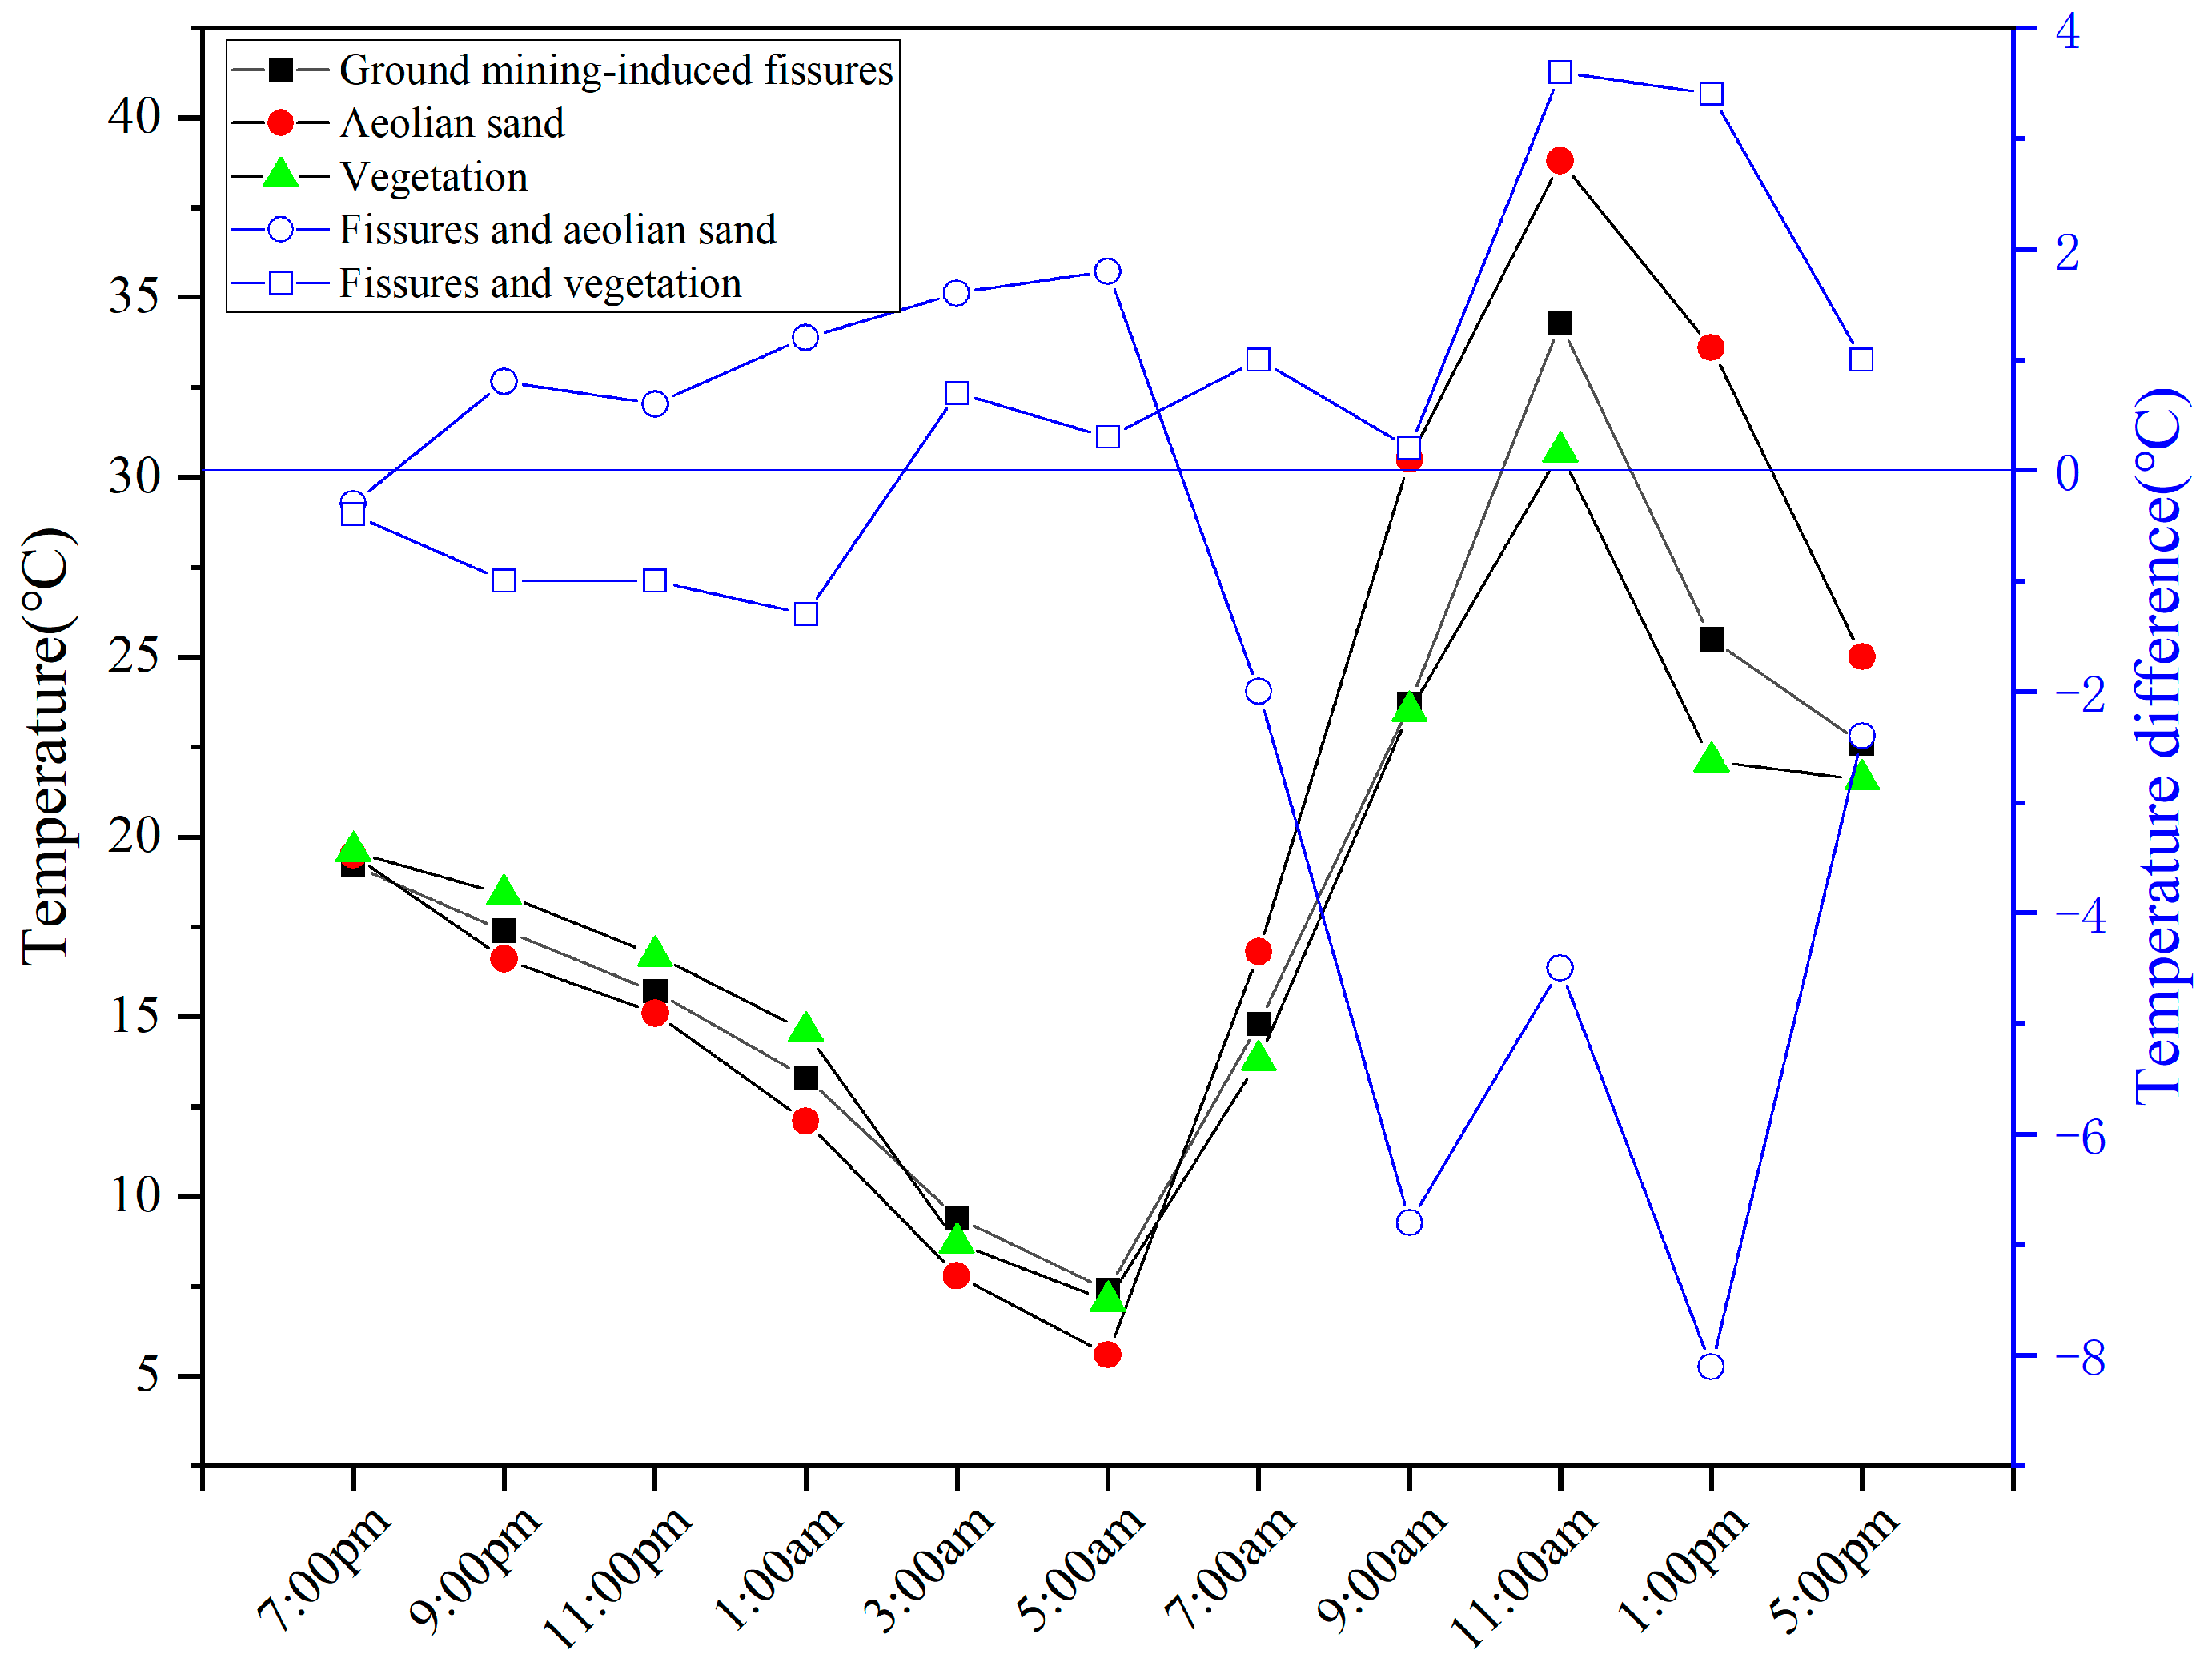
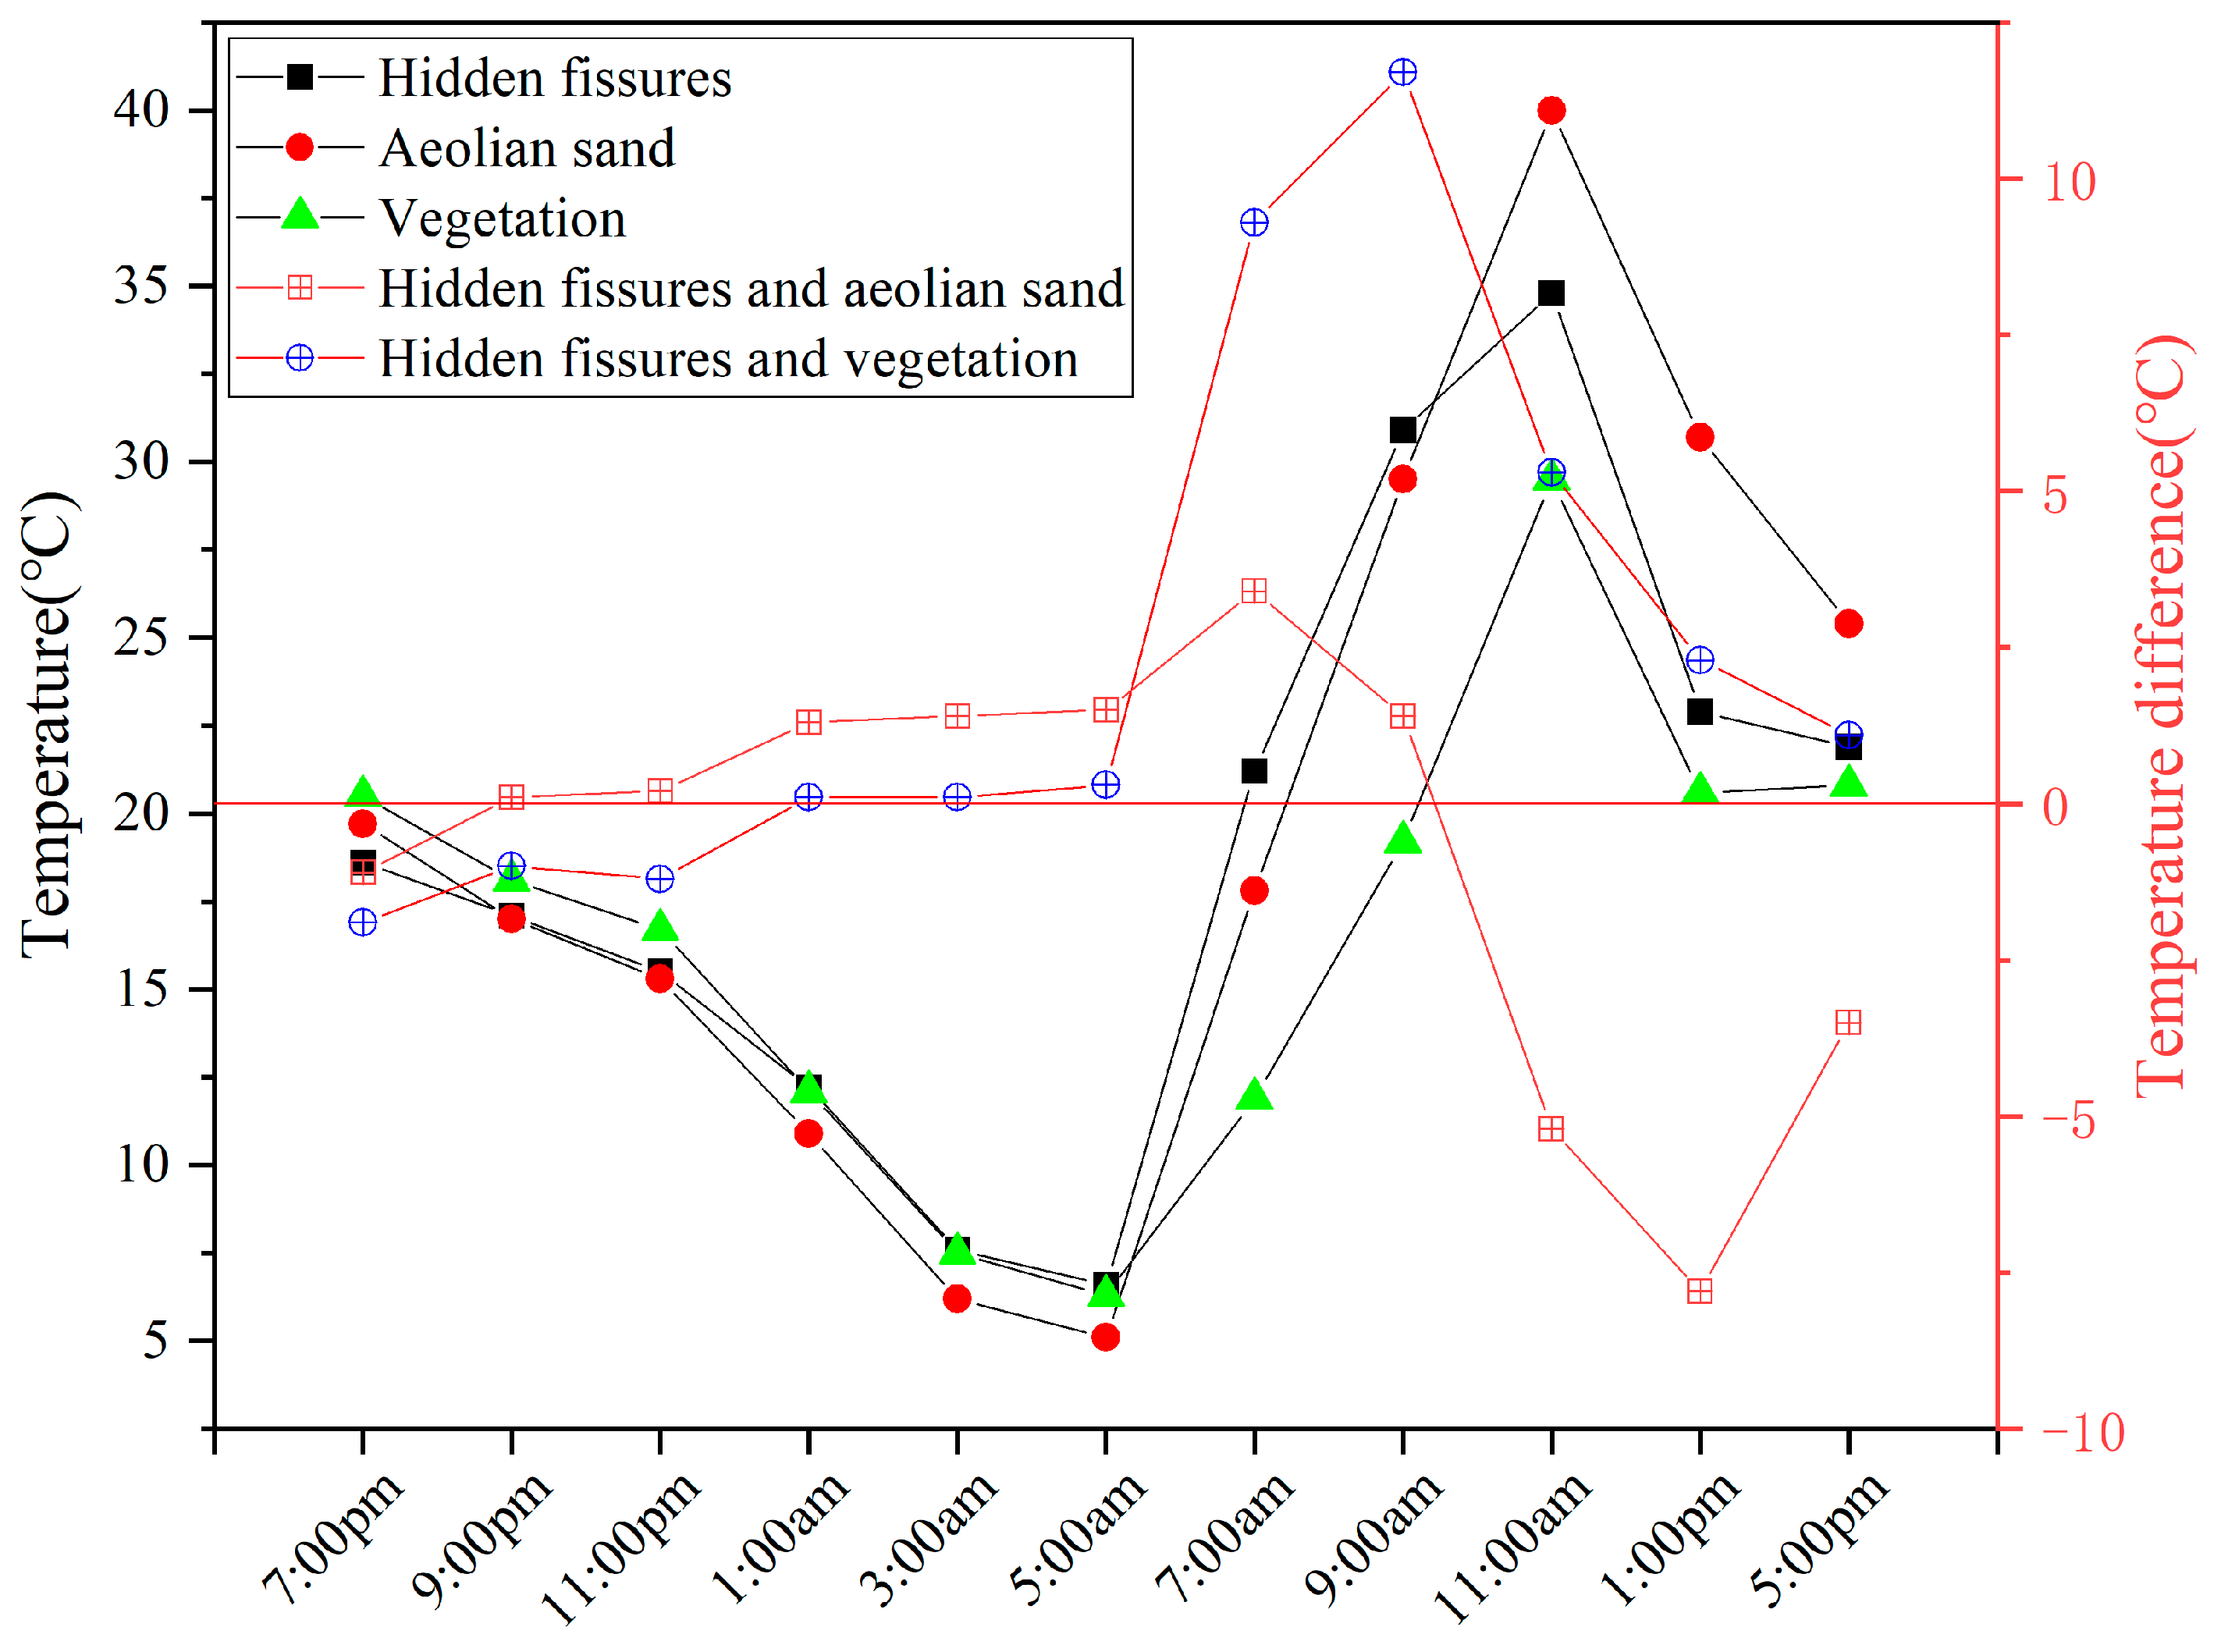
3.3. Temperature Characteristics of the Ground Mining-Induced Fissures, Aeolian Sand and Vegetation
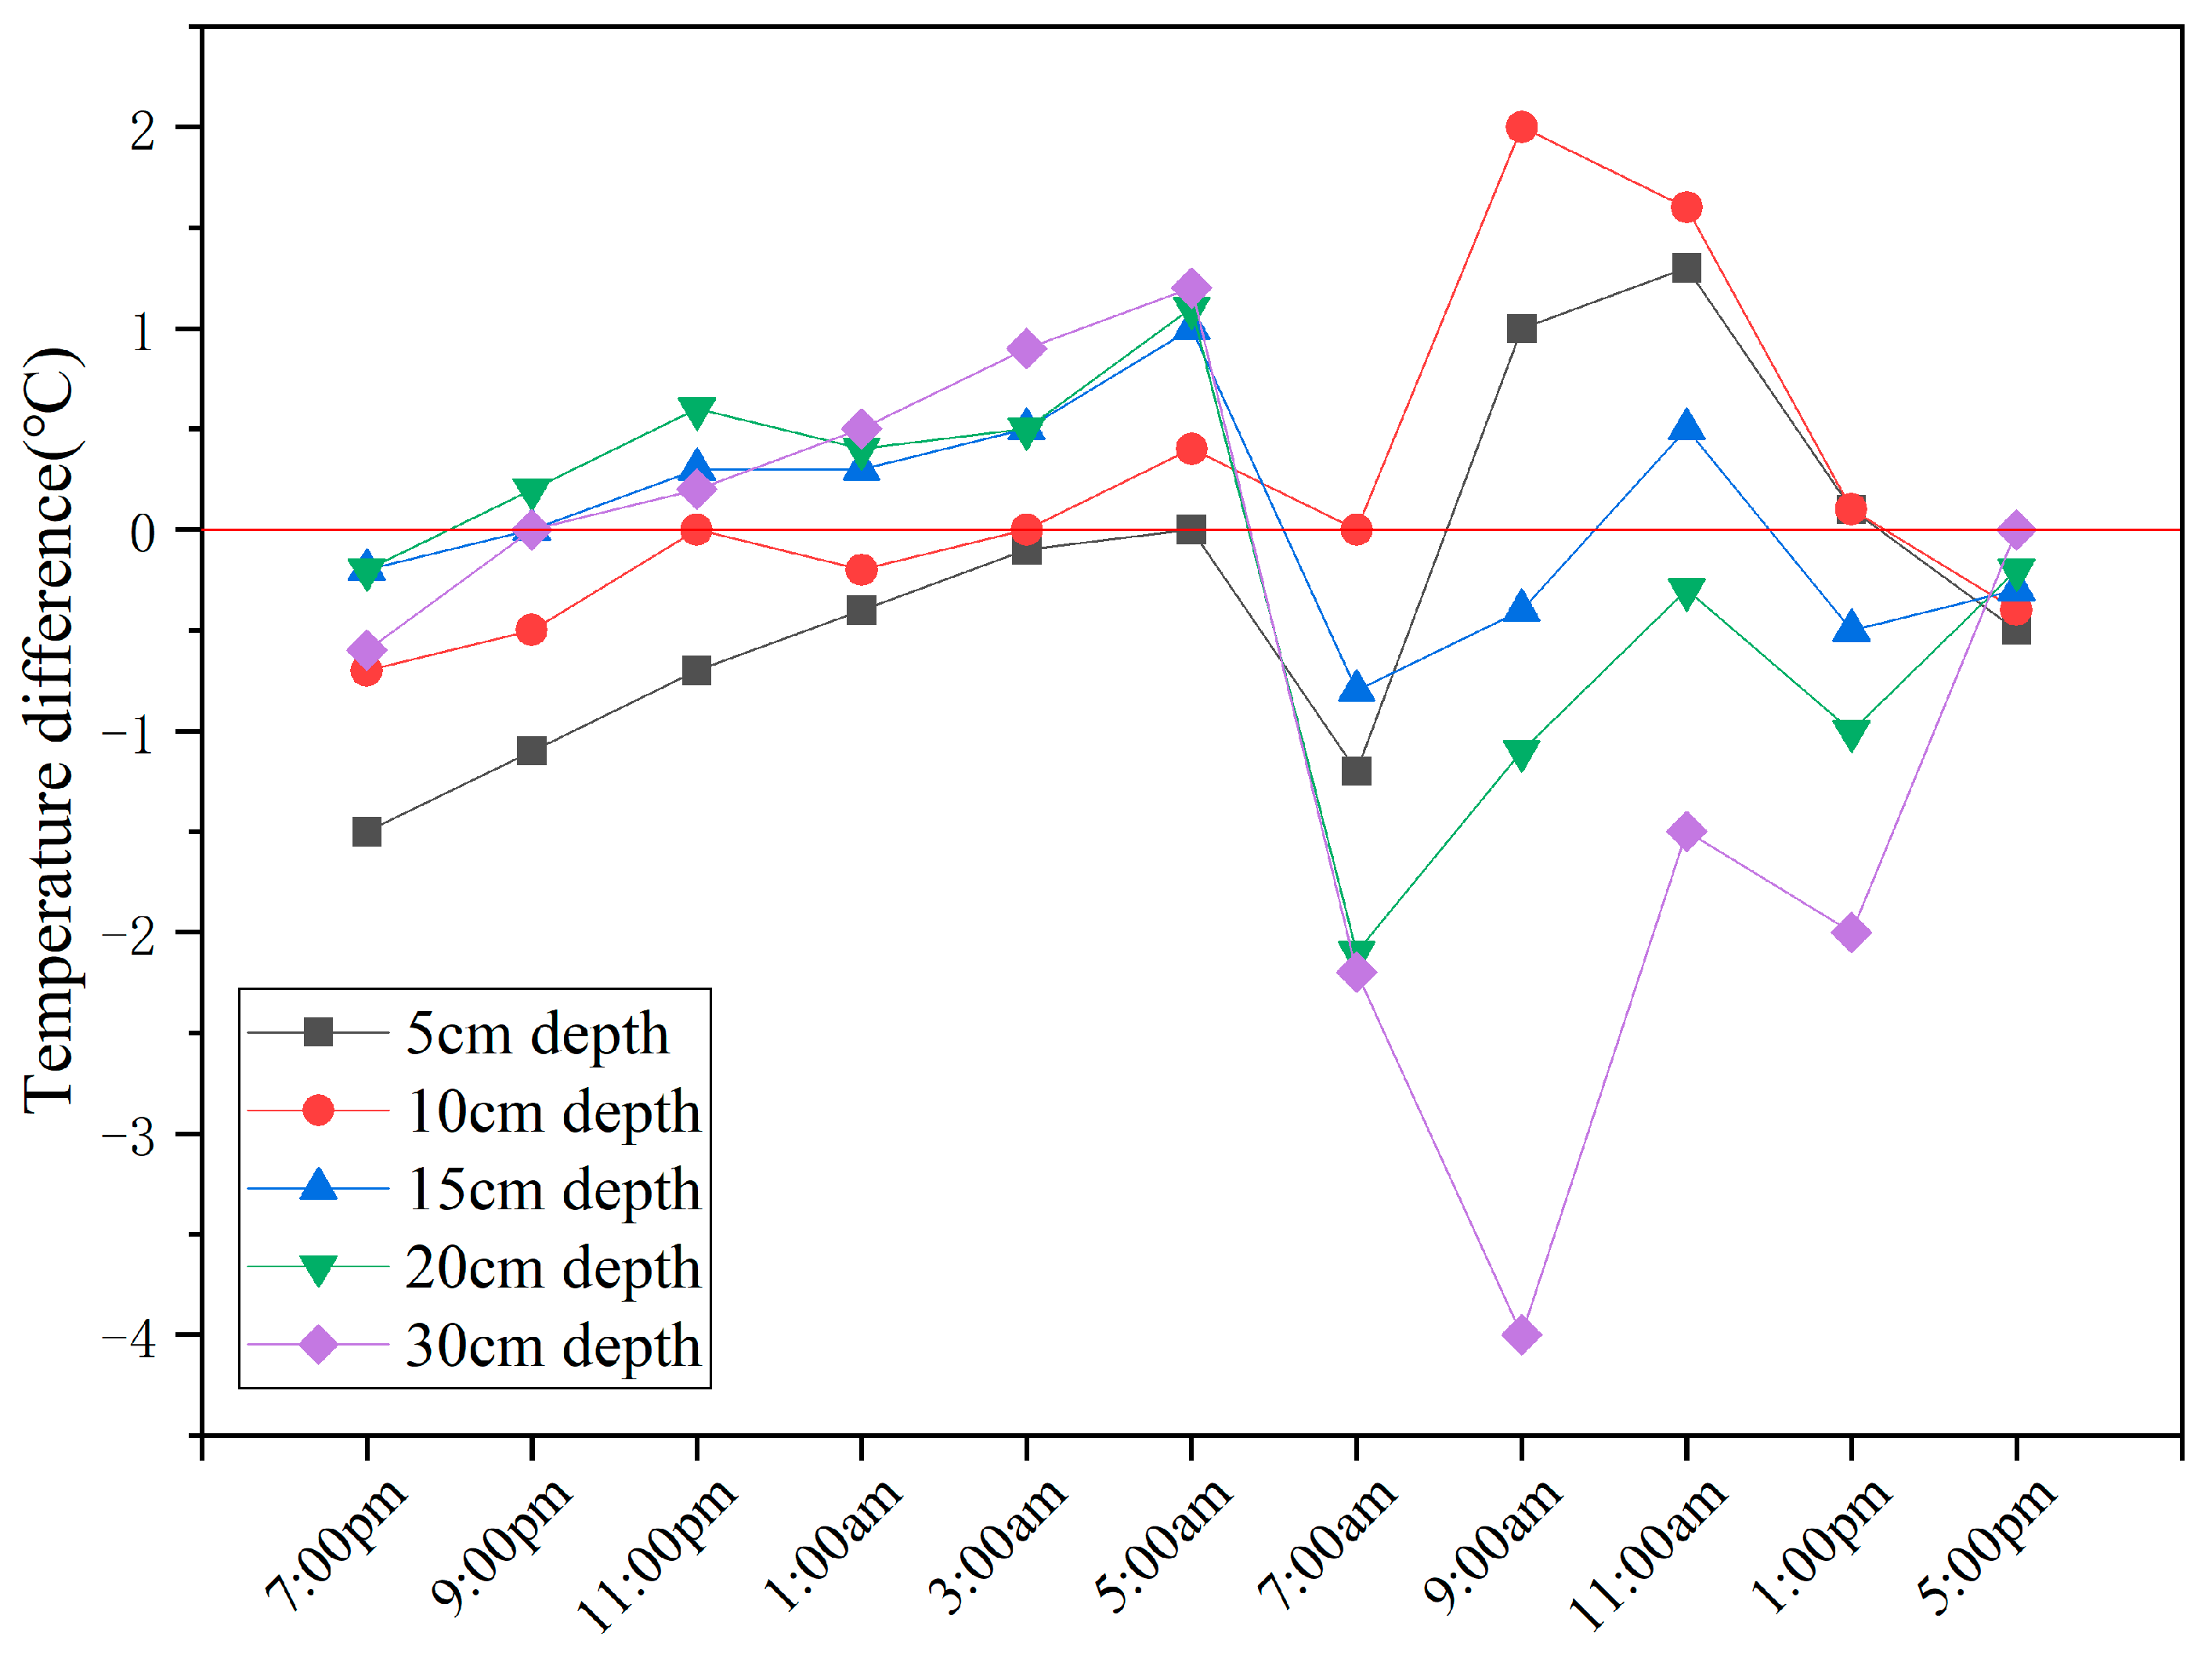
3.4. Temperature Characteristics and Analysis of Hidden Mining-Induced Fissures at Different Burial Depths
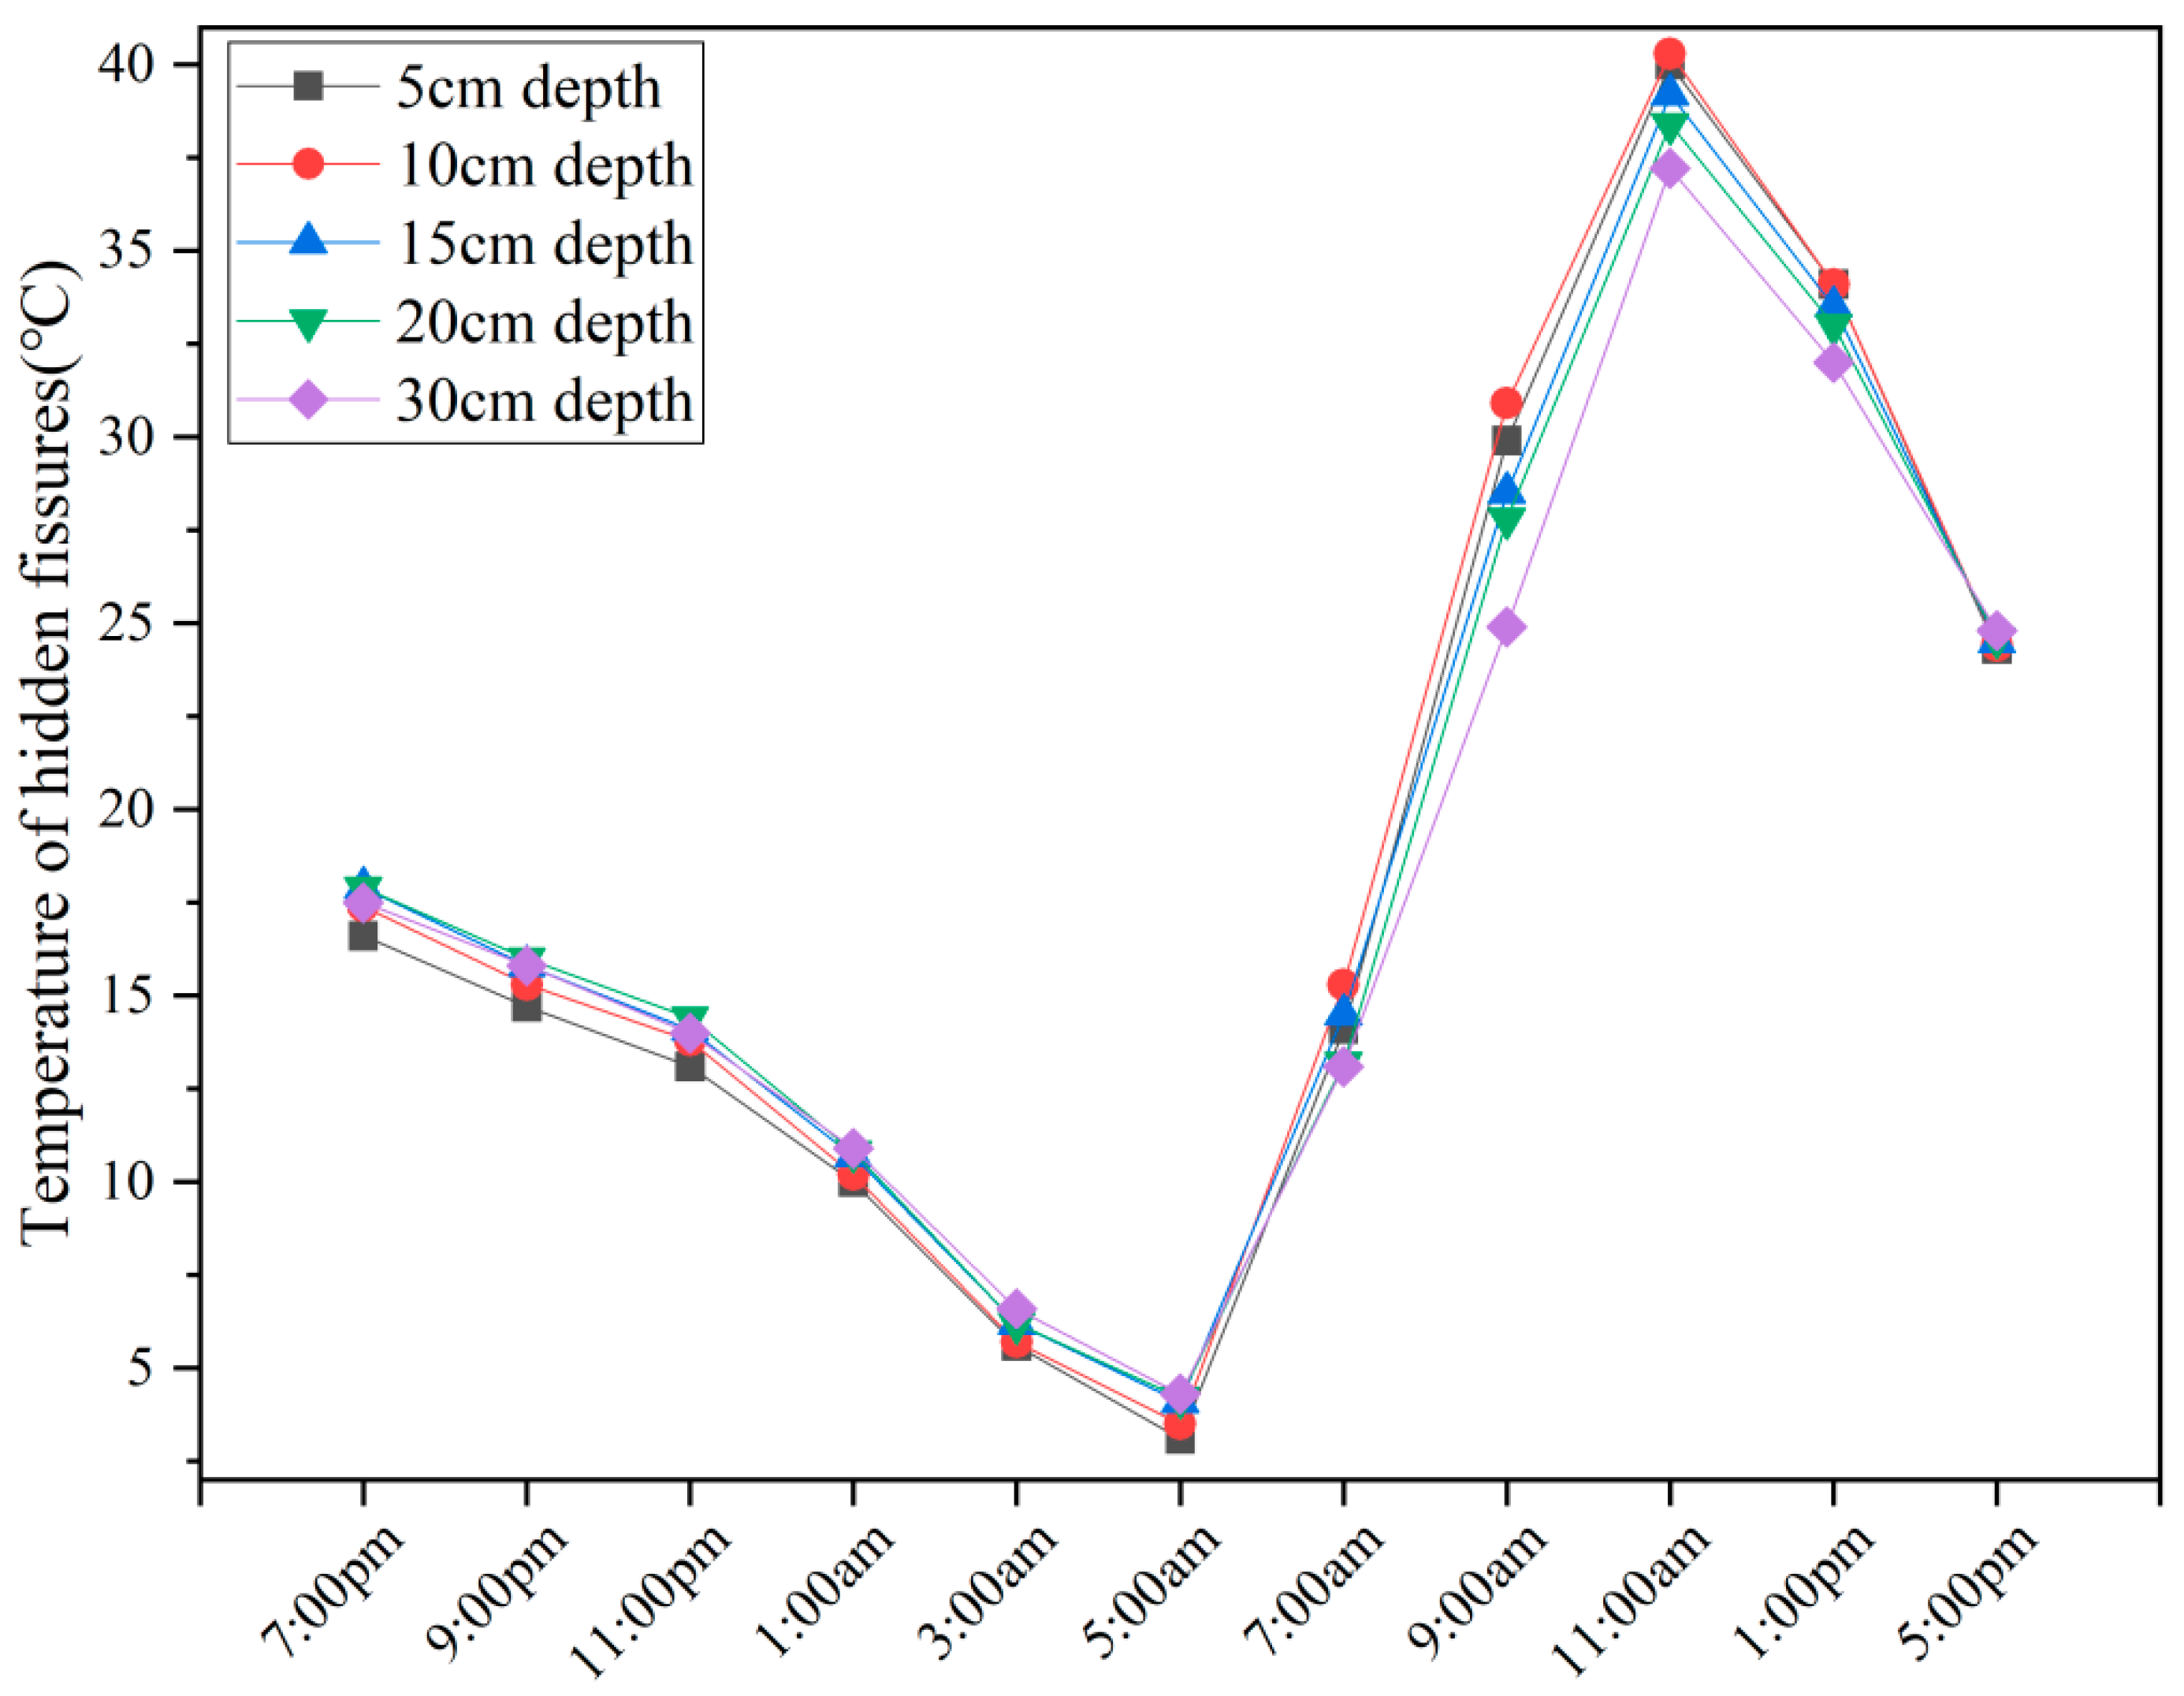
3.4.1. Temperatures of Hidden Mining-Induced Fissures at Different Burial Depths
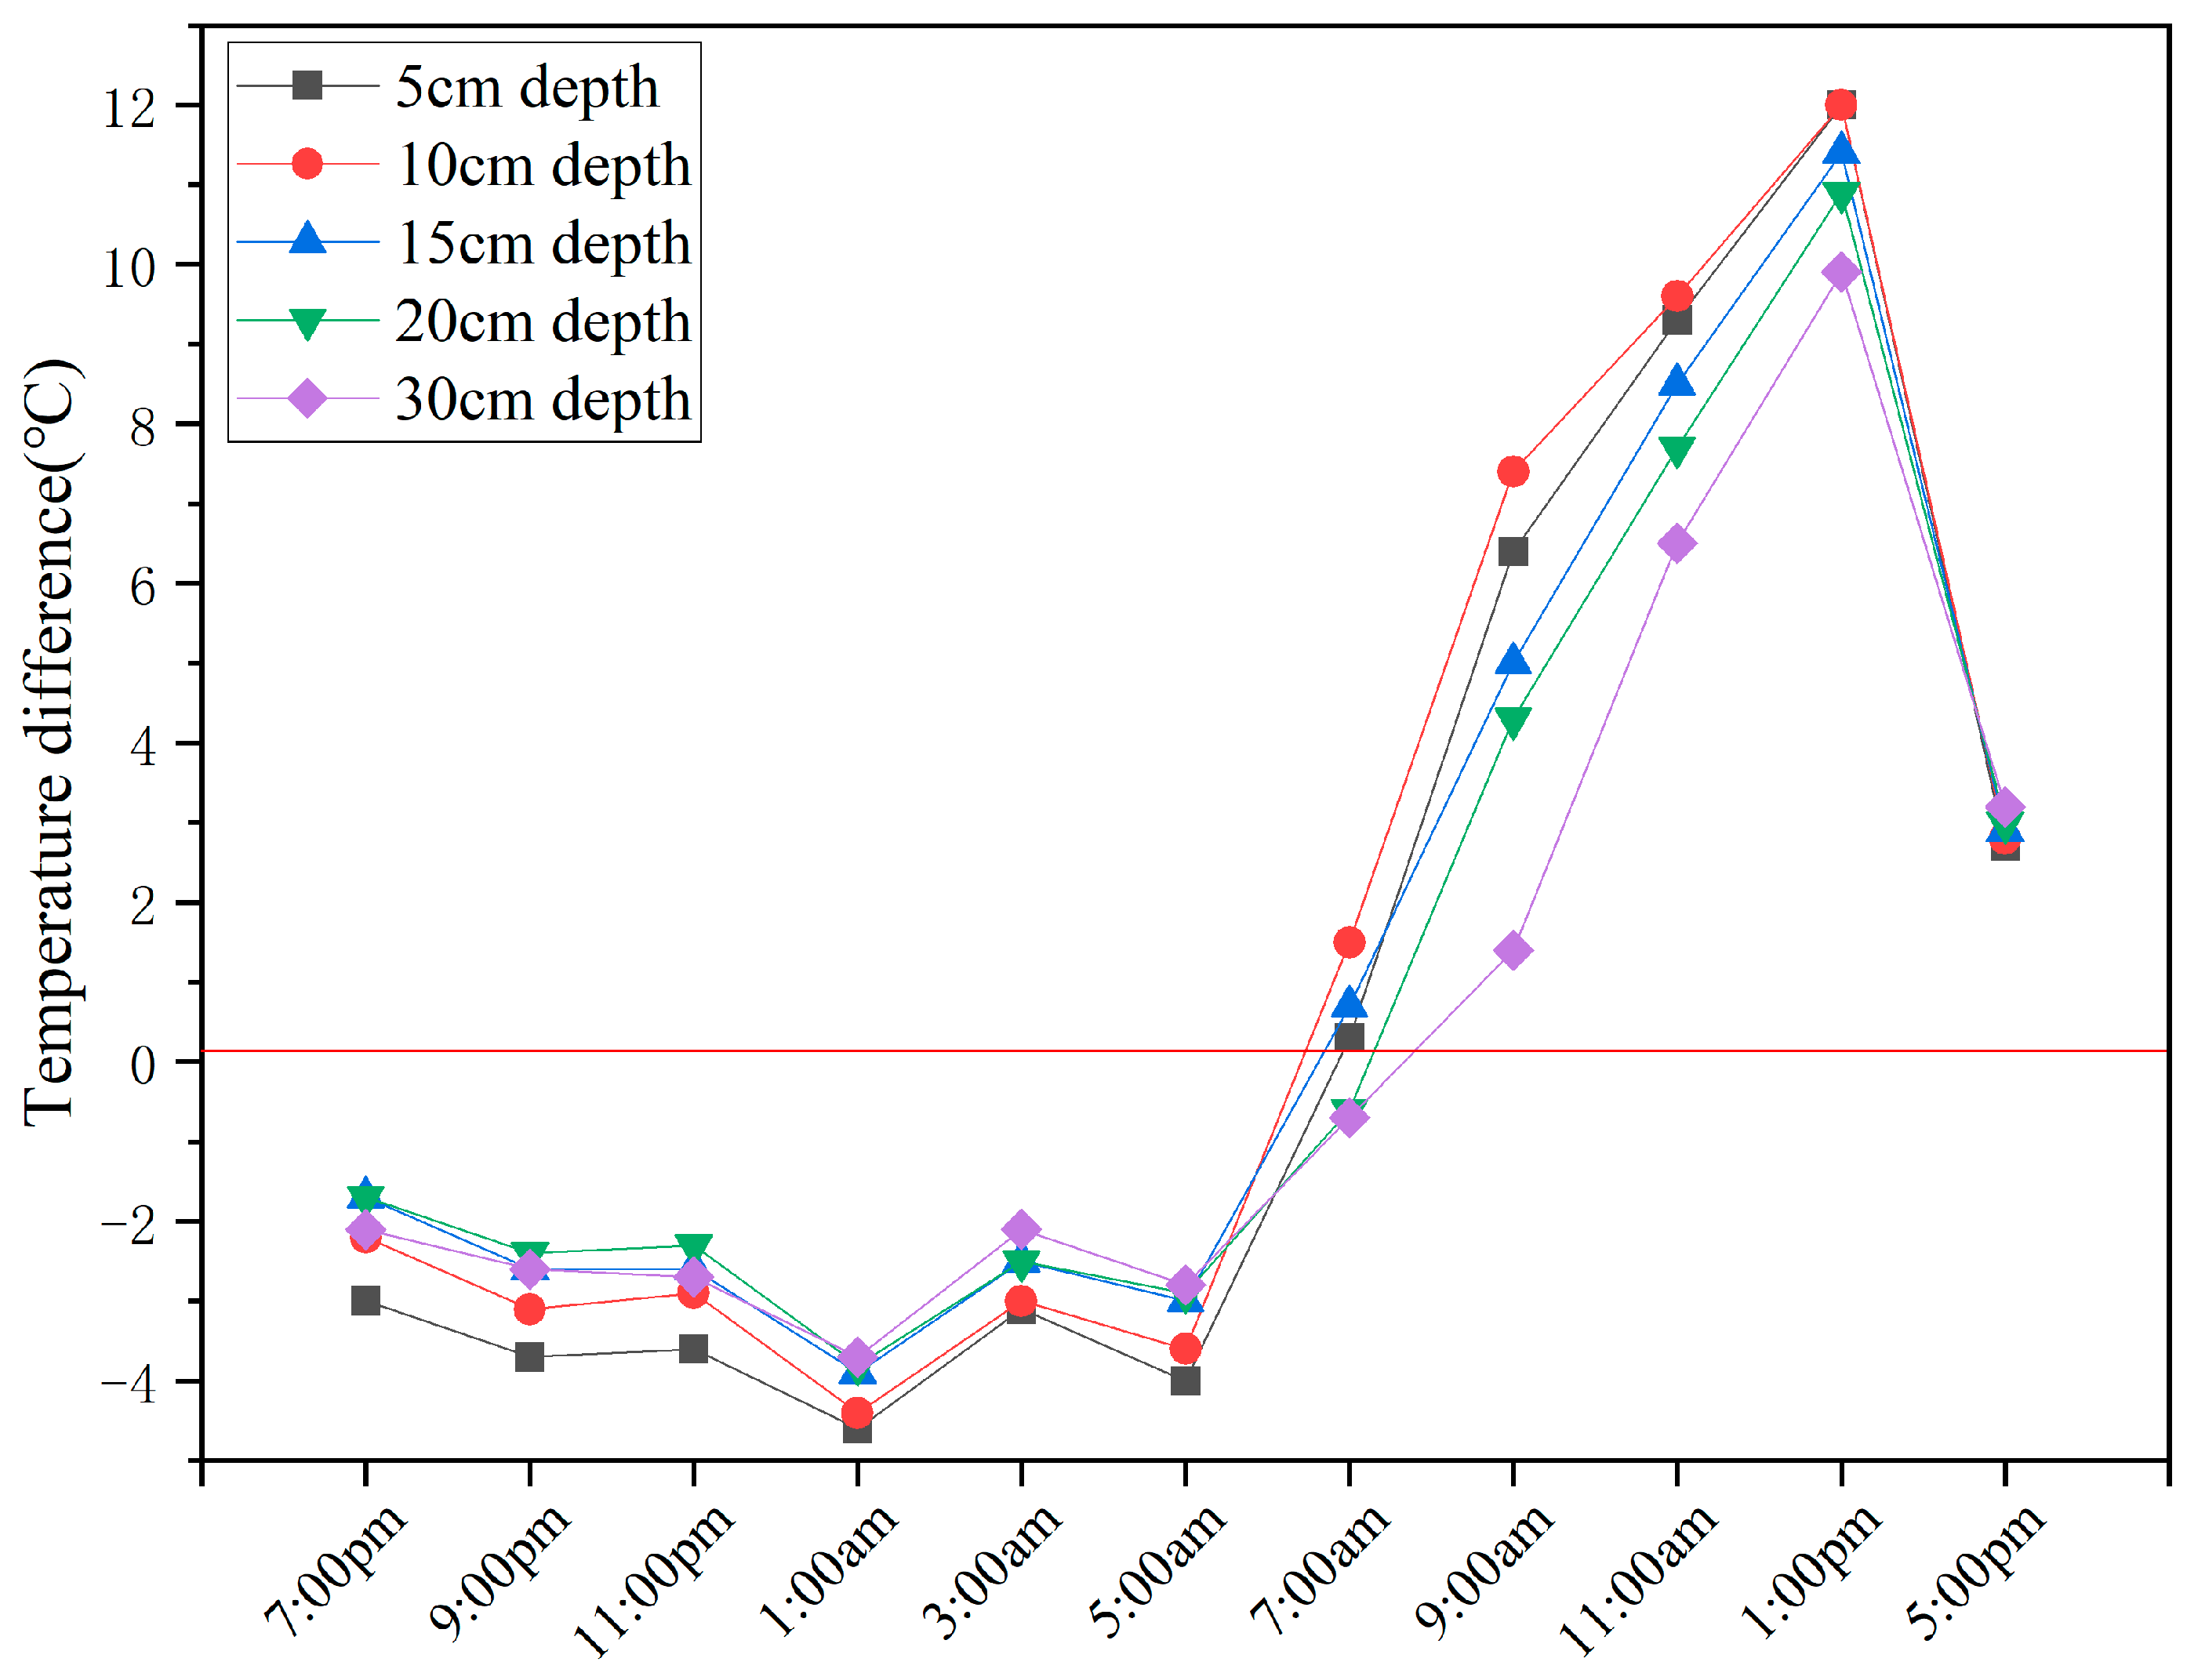
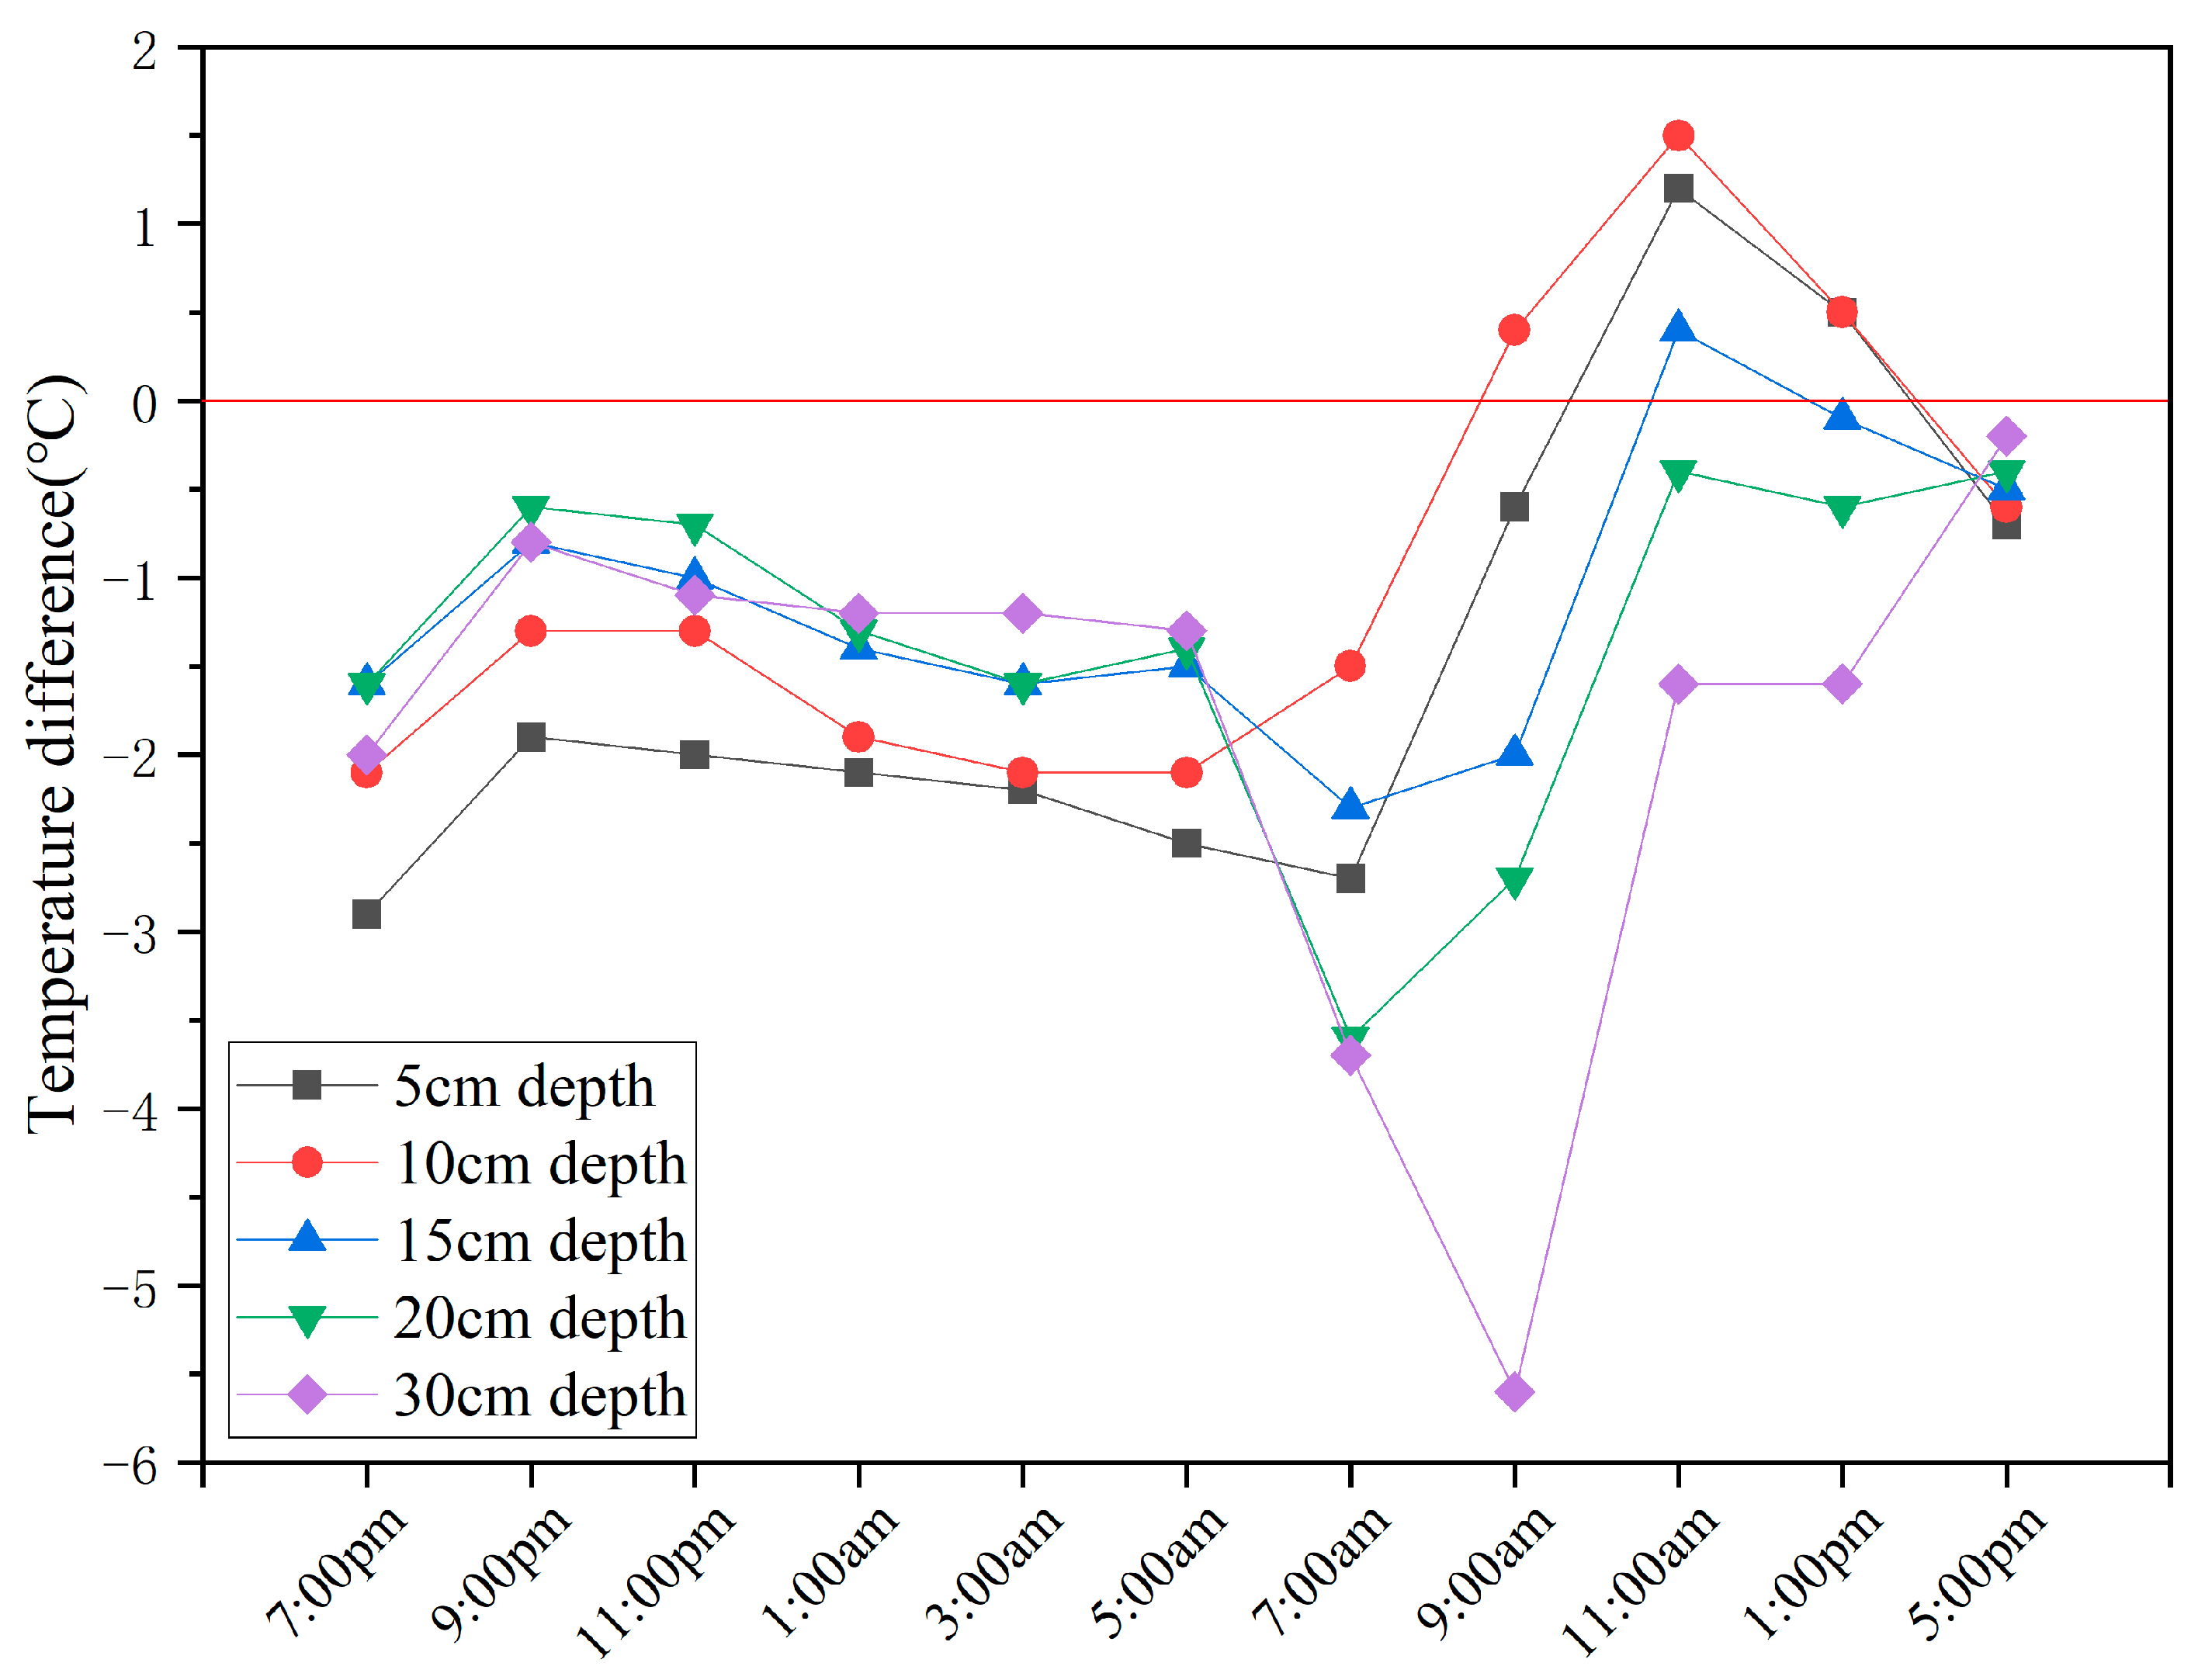
3.4.2. Temperature Differences Among the Different Ground Objects
- (1)
- Temperature differences between the hidden mining-induced fissures at different burial depths and ground mining-induced fissures
- (2)
- Temperature differences between the hidden mining-induced fissures at different burial depths and vegetation
- (3)
- Temperature differences between the hidden mining-induced fissures at different burial depths and aeolian sand
3.4.3. Temperature Differences Between Hidden Mining-Induced Fissures at Different Burial Depths and Overburden Sand
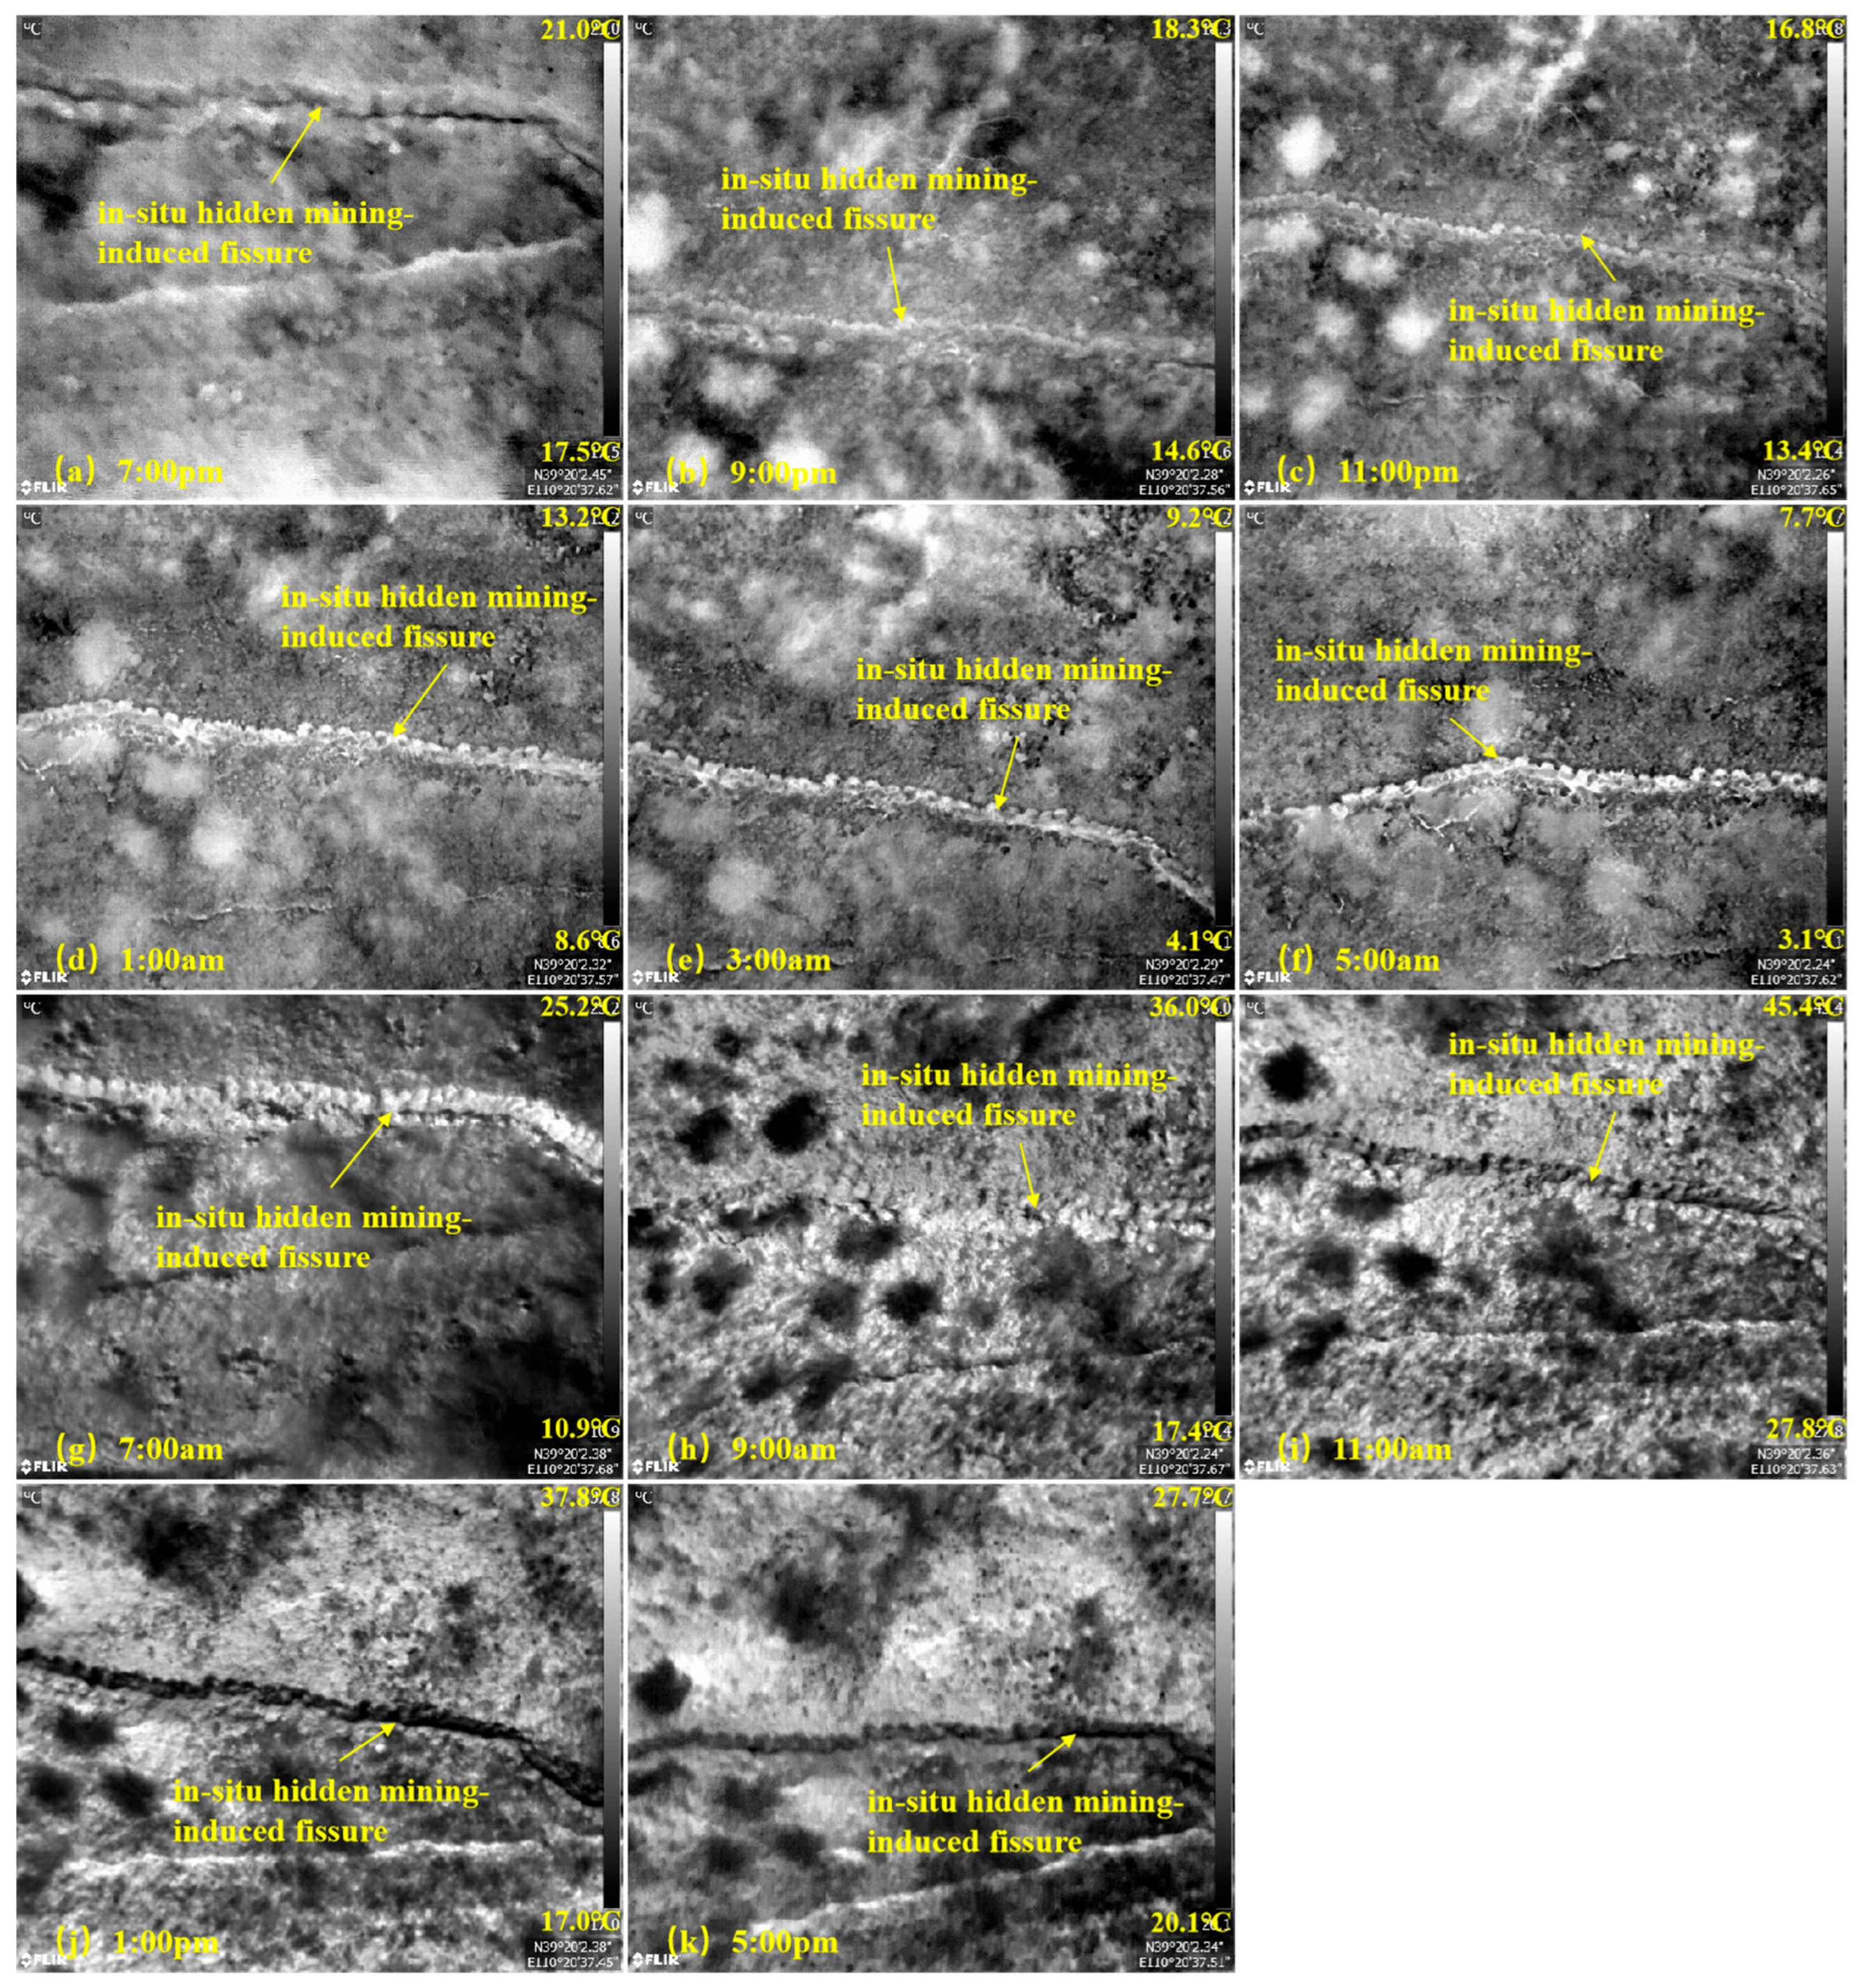
3.5. Identification Results of In Situ Hidden Mining-Induced Fissures
3.5.1. Infrared Images of the In Situ Hidden Mining-Induced Fissures
3.5.2. Temperature Characteristics and Analysis of In Situ Hidden Mining-Induced Fissures
4. Conclusions
- (1)
- A UAV equipped with an infrared camera was used to observe hidden mining-induced fissures around the clock. The results demonstrated that hidden mining-induced fissures could be effectively identified via infrared technology. The experimental results revealed that the temperature differences among the hidden mining-induced fissures, aeolian sand and vegetation greatly vary with burial depth at various times. Therefore, hidden mining-induced fissures at certain burial depths are difficult to identify. According to the identification of in situ hidden mining-induced fissures, in situ hidden mining-induced fissures can be easily identified from 1:00 to 5:00 a.m. and from 11:00 a.m. to 7:00 p.m.
- (2)
- The temperatures of the hidden mining-induced fissures, ground mining-induced fissures, aeolian sand and vegetation at different times of the day exhibited cosinusoidal curve characteristics and were positively correlated with atmospheric temperature changes. From 7:00 p.m. to 5:00 a.m., the temperatures of the four types of ground objects continuously decreased. At 5:00 a.m., the temperature reached its lowest value. From 7:00 to 11:00 a.m., the temperature continued to increase and reached a peak value. After 11:00 a.m., the temperature continuously decreased.
- (3)
- The temperature of hidden mining-induced fissures is highly correlated with burial depth. The temperature of hidden mining-induced fissures is affected by both the ambient temperature and heat conduction from mining-induced fissures. The temperature of hidden mining-induced fissures varies with burial depth. There is a certain temperature difference among the hidden mining-induced fissures, aeolian sand (sand) and vegetation. The temperature difference varied with monitoring time and burial depth. The trends of variation in the temperature difference at the different times matched those in the temperature of the hidden mining-induced fissures. The burial depth at the point at which the temperature difference trend changed varied with monitoring time.
- (4)
- Except at 7:00 and 9:00 a.m., the temperatures of the in situ hidden mining-induced fissures were positively correlated with those of the ground mining-induced fissures in this study. The rule of variation in the temperature difference between the in situ hidden mining-induced fissures and aeolian sand matched that in the temperature difference between the hidden mining-induced fissure at a burial depth of 20 cm and the sand in the experiment. As the boundary conditions of the hidden mining-induced fissures in this experiment should still be improved, the burial depth of the in situ hidden mining-induced fissures was unknown, and the temperature difference fluctuated.
Author Contributions
Funding
Data Availability Statement
Conflicts of Interest
References
- Bi, Y.; Zhang, J.; Song, Z.; Wang, Z.; Qiu, L.; Hu, J.; Gong, Y. Arbuscular Mycorrhizal Fungi Alleviate Root Damage Stress Induced by Simulated Coal Mining Subsidence Ground Fissures. Sci. Total Environ. 2019, 652, 398–405. [Google Scholar] [CrossRef] [PubMed]
- Liu, H.; Deng, K.; Zhu, X.; Jiang, C. Effects of Mining Speed on the Developmental Features of Mining-Induced Ground Fissures. Bull. Eng. Geol. Environ. 2019, 78, 6297–6309. [Google Scholar] [CrossRef]
- Zhang, C.; Zhao, Y.; He, X.; Guo, J.; Yan, Y. Space-Sky-Surface Integrated Monitoring System for Overburden Migration Regularity in Shallow-Buried High-Intensity Mining. Bull. Eng. Geol. Environ. 2021, 80, 1403–1417. [Google Scholar] [CrossRef]
- Xu, J.; Zhu, W.; Xu, J.; Wu, J.; Li, Y. High-Intensity Longwall Mining-Induced Ground Subsidence in Shendong Coalfield, China. Int. J. Rock Mech. Min. Sci. 2021, 141, 104730. [Google Scholar] [CrossRef]
- Bi, Y.; Xie, L.; Wang, J.; Zhang, Y.; Wang, K. Impact of Host Plants, Slope Position and Subsidence on Arbuscular Mycorrhizal Fungal Communities in the Coal Mining Area of North-Central China. J. Arid Environ. 2019, 163, 68–76. [Google Scholar] [CrossRef]
- Syed, T.H.; Riyas, M.J.; Kuenzer, C. Remote Sensing of Coal Fires in India: A Review. Earth-Sci. Rev. 2018, 187, 338–355. [Google Scholar] [CrossRef]
- Zhang, J.; Wagner, W.; Prakash, A.; Mehl, H.; Voigt, S. Detecting Coal Fires Using Remote Sensing Techniques. Int. J. Remote Sens. 2004, 25, 3193–3220. [Google Scholar] [CrossRef]
- Song, Z.; Kuenzer, C. Coal Fires in China over the Last Decade: A Comprehensive Review. Int. J. Coal Geol. 2014, 133, 72–99. [Google Scholar] [CrossRef]
- Zhou, D.; Wu, K.; Miao, X.; Li, L. Combined Prediction Model for Mining Subsidence in Coal Mining Areas Covered with Thick Alluvial Soil Layer. Bull. Eng. Geol. Environ. 2018, 77, 283–304. [Google Scholar] [CrossRef]
- Zhao, H.; Ma, F.; Zhang, Y.; Guo, J. Monitoring and Mechanisms of Ground Deformation and Ground Fissures Induced by Cut-and-Fill Mining in the Jinchuan Mine 2, China. Environ. Earth Sci. 2013, 68, 1903–1911. [Google Scholar] [CrossRef]
- Gao, J.; Hu, H. Advanced GNSS Technology of Mining Deformation Monitoring. Procedia Earth Planet. Sci. 2009, 1, 1081–1088. [Google Scholar] [CrossRef]
- BIAN, H.; ZHANG, S.; ZHANG, Q.; ZHENG, N. Monitoring Large-Area Mining Subsidence by GNSS Based on IGS Stations. Trans. Nonferrous Met. Soc. China 2014, 24, 514–519. [Google Scholar] [CrossRef]
- Abdikan, S.; Arıkan, M.; Sanli, F.B.; Cakir, Z. Monitoring of Coal Mining Subsidence in Peri-Urban Area of Zonguldak City (NW Turkey) with Persistent Scatterer Interferometry Using ALOS-PALSAR. Environ. Earth Sci. 2014, 71, 4081–4089. [Google Scholar] [CrossRef]
- Wang, L.; Deng, K.; Fan, H.; Zhou, F. Monitoring of Large-Scale Deformation in Mining Areas Using Sub-Band InSAR and the Probability Integral Fusion Method. J. Remote Sens. 2018, 40, 2602–2622. [Google Scholar] [CrossRef]
- Fan, H.D.; Cheng, D.; Deng, K.Z.; Chen, B.Q.; Zhu, C.G. Subsidence Monitoring Using D-InSAR and Probability Integral Prediction Modelling in Deep Mining Areas. Surv. Rev. 2015, 47, 438–445. [Google Scholar] [CrossRef]
- Zhou, D.; Wu, K.; Chen, R.; Li, L. GPS/Terrestrial 3D Laser Scanner Combined Monitoring Technology for Coal Mining Subsidence: A Case Study of a Coal Mining Area in Hebei, China. Nat. Hazards 2014, 70, 1197–1208. [Google Scholar] [CrossRef]
- Travelletti, J.; Malet, J.-P.; Delacourt, C. Image-Based Correlation of Laser Scanning Point Cloud Time Series for Landslide Monitoring. Int. J. Appl. Earth Obs. Geoinf. 2014, 32, 1–18. [Google Scholar] [CrossRef]
- Ge, Y.; Tang, H.; Gong, X.; Zhao, B.; Lu, Y.; Chen, Y.; Lin, Z.; Chen, H.; Qiu, Y. Deformation Monitoring of Earth Fissure Hazards Using Terrestrial Laser Scanning. Sensors 2019, 19, 1463. [Google Scholar] [CrossRef]
- Zhang, F.; Hu, Z.; Fu, Y.; Yang, K.; Wu, Q.; Feng, Z. A New Identification Method for Surface Cracks from UAV Images Based on Machine Learning in Coal Mining Areas. Remote Sens. 2020, 12, 1571. [Google Scholar] [CrossRef]
- Xu, D.; Zhao, Y.; Jiang, Y.; Zhang, C.; Sun, B.; He, X. Using Improved Edge Detection Method to Detect Mining-Induced Ground Fissures Identified by Unmanned Aerial Vehicle Remote Sensing. Remote Sens. 2021, 13, 3652. [Google Scholar] [CrossRef]
- Zhao, Y.; Zhang, K.; Sun, B.; Ling, C.; Guo, J. Heat Transfer and Temperature Evolution in Underground Mining-Induced Overburden Fracture and Ground Fissures: Optimal Time Window of UAV Infrared Monitoring. J. Min. Sci. Technol. 2024, 34, 31–50. [Google Scholar] [CrossRef]
- Wang, K.; Jiang, Q.; Yu, D.; Yang, Q.; Wang, L.; Han, T.; Xu, X. Detecting Daytime and Nighttime Land Surface Temperature Anomalies Using Thermal Infrared Remote Sensing in Dandong Geothermal Prospect. Int. J. Appl. Earth Obs. Geoinf. 2019, 80, 196–205. [Google Scholar] [CrossRef]
- Tavukcuoglu, A.; Akevren, S.; Grinzato, E. In Situ Examination of Structural Cracks at Historic Masonry Structures by Quantitative Infrared Thermography and Ultrasonic Testing. J. Mod. Opt. 2010, 57, 1779–1789. [Google Scholar] [CrossRef]
- Baroň, I.; Bečkovský, D.; Míča, L. Application of Infrared Thermography for Mapping Open Fractures in Deep-Seated Rockslides and Unstable Cliffs. Landslides 2014, 11, 15–27. [Google Scholar] [CrossRef]
- Afshani, A.; Kawakami, K.; Konishi, S.; Akagi, H. Study of Infrared Thermal Application for Detecting Defects within Tunnel Lining. Tunn. Undergr. Space Technol. 2019, 86, 186–197. [Google Scholar] [CrossRef]
- Zhao, Y.; Sun, B.; Liu, S.; Zhang, C.; He, X.; Xu, D.; Tang, W. Identification of Mining Induced Ground Fissures Using UAV and Infrared Thermal Imager: Temperature Variation and Fissure Evolution. ISPRS J. Photogramm. Remote Sens. 2021, 180, 45–64. [Google Scholar] [CrossRef]
- Antoine, R.; Fauchard, C.; Oehler, J.-F.; Joignant, P. Permeability and Voids Influence on the Thermal Signal, as Inferred by Multitemporal UAV-Based Infrared and Visible Images. J. Hydrol. 2020, 587, 124907. [Google Scholar] [CrossRef]
- Koganti, T.; Ghane, E.; Martinez, L.; Iversen, B.; Allred, B. Mapping of Agricultural Subsurface Drainage Systems Using Unmanned Aerial Vehicle Imagery and Ground Penetrating Radar. Sensors 2021, 21, 2800. [Google Scholar] [CrossRef]
- Lee, E.J.; Shin, S.Y.; Ko, B.C.; Chang, C. Early Sinkhole Detection Using a Drone-Based Thermal Camera and Image Processing. Infrared Phys. Technol. 2016, 78, 223–232. [Google Scholar] [CrossRef]
- Zhao, Y.; Ling, C.; Zhang, K.; Gao, Y.; Sun, B.; Wang, X. Detection of Hidden Mining-Induced Ground Fissures via Unmanned Aerial Vehicle Infrared System and Ground-Penetrating Radar. Int. J. Rock Mech. Min. Sci. 2022, 160, 105254. [Google Scholar] [CrossRef]
- Lu, Y.; Yu, W.; Hu, D.; Liu, W. Experimental Study on the Thermal Conductivity of Aeolian Sand from the Tibetan Plateau. Cold Reg. Sci. Technol. 2018, 146, 1–8. [Google Scholar] [CrossRef]
- Ling, J.; Zhang, S.-Q.; Pan, J.-L.; Lian, C.-C.; Yang, H. The Study of Transpiration Influence on Plant Infrared Radiation Character. Spectrosc. Spectr. Anal. 2012, 32, 1775–1779. [Google Scholar] [CrossRef]
- Luomala, E.-M.; Laitinen, K.; Sutinen, S.; Kellomäki, S.; Vapaavuori, E. Stomatal Density, Anatomy and Nutrient Concentrations of Scots Pine Needles Are Affected by Elevated CO2 and Temperature. Plant Cell Environ. 2005, 28, 733–749. [Google Scholar] [CrossRef]
- Reddy, K.R.; Robana, R.R.; Hodges, H.F.; Liu, X.J.; McKinion, J.M. Interactions of CO2 Enrichment and Temperature on Cotton Growth and Leaf Characteristics. Environ. Exp. Bot. 1998, 39, 117–129. [Google Scholar] [CrossRef]
- Raschke, K.; Hanebuth, W.F.; Farquhar, G.D. Relationship between Stomatal Conductance and Light Intensity in Leaves of Zea mays L. Derived from Experiments Using the Mesophyll as Shade. Planta 1978, 139, 73–77. [Google Scholar] [CrossRef] [PubMed]

| Equipment Name | Specification | Technical Parameters | |
|---|---|---|---|
| DJI UAV | M600 Pro | Weight | 9.5 kg with 6 TB47S 10 kg with 6 TB48S |
| Max takeoff weight | 15.5 kg | ||
| Hover precision | 0.5 m in the vertical direction 1.5 m in the horizontal direction | ||
| Maximum angular velocity of rotation | 300°/s around the pitching axis 150°/s around the course axis | ||
| Max pitching angle | 25° | ||
| Max speed | Ascent: 5 m/s Descent: 3 m/s | ||
| Max wind speed | 8 m/s | ||
| Maximum horizontal speed | 65 km/h (no wind) | ||
| Hover time with 6 TB47S | No load: 32 min 6 kg load: 16 min | ||
| Hover time with 6 TB48S | No load: 38 min 5.5 kg load:18 min | ||
| Max flight altitude | 2500 m | ||
| Infrared thermal imager | Duo Pro R 336 | Thermal imager | Uncooled vanadium oxide (VOx) microbolometer |
| Resolution | 640 × 512 | ||
| Frame frequency | 30 Hz | ||
| Wavelength | 7.5–13.5 μm | ||
| NETD | <50 mk@f/1.0 | ||
| Temperature measurement accuracy | +/−5 °C or +/−5% in the range of −25 °C to +135 °C | ||
| Size | 85 × 81.3 × 68.5 mm | ||
| Times | Wind Speed (m/s) | Flight Altitude (m) | Fissure Temperature (°C) | Error (°C) | Mean Absolute Error (°C) | Mean Relative Error (%) | |
|---|---|---|---|---|---|---|---|
| Extract | Measured | ||||||
| 7:00 p.m. | 1.0 | 15 | 19.7 | 19.0 | 0.7 | 1.1 | 5.8 |
| 20 | 20.7 | 1.7 | |||||
| 25 | 19.2 | 0.2 | |||||
| 30 | 17.3 | −1.7 | |||||
| 9:00 p.m. | 0.3 | 15 | 16.3 | 17.7 | −1.4 | 0.5 | 3.0 |
| 20 | 17.5 | −0.2 | |||||
| 25 | 17.4 | −0.3 | |||||
| 30 | 17.5 | −0.2 | |||||
| 11:00 p.m. | 0.0 | 15 | 16.4 | 15.3 | 1.1 | 0.8 | 5.2 |
| 20 | 17.0 | 1.7 | |||||
| 25 | 15.7 | 0.4 | |||||
| 30 | 15.4 | 0.1 | |||||
| 1:00 a.m. | 0.0 | 15 | 14.0 | 12.2 | 1.8 | 1.2 | 9.4 |
| 20 | 13.3 | 1.1 | |||||
| 25 | 13.3 | 1.1 | |||||
| 30 | 12.8 | 0.6 | |||||
| 3:00 a.m. | 0.0 | 15 | 10.3 | 9.7 | 0.6 | 0.6 | 5.9 |
| 20 | 9.3 | −0.4 | |||||
| 25 | 9.4 | −0.3 | |||||
| 30 | 8.7 | −1.0 | |||||
| 5:00 a.m. | 0.0 | 15 | 8.8 | 8.1 | 0.7 | 0.7 | 8.0 |
| 20 | 8.3 | 0.2 | |||||
| 25 | 7.4 | −0.7 | |||||
| 30 | 7.1 | −1.0 | |||||
| 7:00 a.m. | 0.0 | 15 | 13.1 | 10.6 | 2.5 | 3.9 | 36.6 |
| 20 | 14.8 | 4.2 | |||||
| 25 | 14.8 | 4.2 | |||||
| 30 | 15.2 | 4.6 | |||||
| 9:00 a.m. | 1.4 | 15 | 21.0 | 20.3 | 0.7 | 3.0 | 14.5 |
| 20 | 22.6 | 2.3 | |||||
| 25 | 23.7 | 3.4 | |||||
| 30 | 25.7 | 5.4 | |||||
| 11:00 a.m. | 3.0 | 15 | 35.2 | 23.7 | 11.5 | 11.2 | 47.2 |
| 20 | 35.2 | 11.5 | |||||
| 25 | 34.3 | 10.6 | |||||
| 30 | 34.8 | 11.1 | |||||
| 1:00 p.m. | 2.5 | 15 | 24.5 | 28.4 | −3.9 | 3.0 | 10.4 |
| 20 | 26.7 | −1.7 | |||||
| 25 | 25.5 | −2.9 | |||||
| 30 | 25.1 | −3.3 | |||||
| 5:00 p.m. | 1.0 | 15 | 22.8 | 22.4 | 0.4 | 0.3 | 1.1 |
| 20 | 22.3 | −0.1 | |||||
| 25 | 22.6 | 0.2 | |||||
| 30 | 22.7 | 0.3 | |||||
| Times | Ground Mining-Induced Fissures Temperature (°C) | Aeolian Sand Temperature (°C) | Vegetation Temperature (°C) | Temperature Difference (°C) | |
|---|---|---|---|---|---|
| Fissures and Aeolian Sand | Fissures and Vegetation | ||||
| 7:00 p.m. | 19.2 | 19.5 | 19.6 | −0.3 | −0.4 |
| 9:00 p.m. | 17.4 | 16.6 | 18.4 | 0.8 | −1.0 |
| 11:00 p.m. | 15.7 | 15.1 | 16.7 | 0.6 | −1.0 |
| 1:00 a.m. | 13.3 | 12.1 | 14.6 | 1.2 | −1.3 |
| 3:00 a.m. | 9.4 | 7.8 | 8.7 | 1.6 | 0.7 |
| 5:00 a.m. | 7.4 | 5.6 | 7.1 | 1.8 | 0.3 |
| 7:00 a.m. | 14.8 | 16.8 | 13.8 | −2.0 | 1.0 |
| 9:00 a.m. | 23.7 | 30.5 | 23.5 | −6.8 | 0.2 |
| 11:00 a.m. | 34.3 | 38.8 | 30.7 | −4.5 | 3.6 |
| 1:00 p.m. | 25.5 | 33.6 | 22.1 | −8.1 | 3.4 |
| 5:00 p.m. | 22.6 | 25.0 | 21.6 | −2.4 | 1.0 |
| Times | Temperatures of the Hidden Mining-Induced Fissures at the Different Depths (°C) | ||||
|---|---|---|---|---|---|
| 5 cm | 10 cm | 15 cm | 20 cm | 30 cm | |
| 7:00 p.m. | 16.6 | 17.4 | 17.9 | 17.9 | 17.5 |
| 9:00 p.m. | 14.7 | 15.3 | 15.8 | 16.0 | 15.8 |
| 11:00 p.m. | 13.1 | 13.8 | 14.1 | 14.4 | 14 |
| 1:00 a.m. | 10.0 | 10.2 | 10.7 | 10.8 | 10.9 |
| 3:00 a.m. | 5.6 | 5.7 | 6.2 | 6.2 | 6.6 |
| 5:00 a.m. | 3.1 | 3.5 | 4.1 | 4.2 | 4.3 |
| 7:00 a.m. | 14.1 | 15.3 | 14.5 | 13.2 | 13.1 |
| 9:00 a.m. | 29.9 | 30.9 | 28.5 | 27.8 | 24.9 |
| 11:00 a.m. | 40.0 | 40.3 | 39.2 | 38.4 | 37.2 |
| 1:00 p.m. | 34.1 | 34.1 | 33.5 | 33.0 | 32.0 |
| 3:00 p.m. | 24.3 | 24.4 | 24.5 | 24.6 | 24.8 |
| Times | Temperature Difference Between the Hidden Mining-Induced Fissures and Ground Mining-Induced Fissures (°C) | ||||
|---|---|---|---|---|---|
| 5 cm | 10 cm | 15 cm | 20 cm | 30 cm | |
| 7:00 p.m. | −2.6 | −1.8 | −1.3 | −1.3 | −1.7 |
| 9:00 p.m. | −2.7 | −2.1 | −1.6 | −1.4 | −1.6 |
| 11:00 p.m. | −2.6 | −1.9 | −1.6 | −1.3 | −1.7 |
| 1:00 a.m. | −3.3 | −3.1 | −2.6 | −2.5 | −2.4 |
| 3:00 a.m. | −3.8 | −3.7 | −3.2 | −3.2 | −2.8 |
| 5:00 a.m. | −4.3 | −3.9 | −3.3 | −3.2 | −3.1 |
| 7:00 a.m. | −0.7 | 0.5 | −0.3 | −1.6 | −1.7 |
| 9:00 a.m. | 6.2 | 7.2 | 4.8 | 4.1 | 1.2 |
| 11:00 a.m. | 5.7 | 6.0 | 4.9 | 4.1 | 2.9 |
| 1:00 p.m. | 8.6 | 8.6 | 8.0 | 7.5 | 6.5 |
| 5:00 p.m. | 1.7 | 1.8 | 1.9 | 2.0 | 2.2 |
| Times | Temperature Difference Between the Hidden Mining-Induced Fissures and Vegetation (°C) | ||||
|---|---|---|---|---|---|
| 5 cm | 10 cm | 15 cm | 20 cm | 30 cm | |
| 7:00 p.m. | −3.0 | −2.2 | −1.7 | −1.7 | −2.1 |
| 9:00 p.m. | −3.7 | −3.1 | −2.6 | −2.4 | −2.6 |
| 11:00 p.m. | −3.6 | −2.9 | −2.6 | −2.3 | −2.7 |
| 1:00 a.m. | −4.6 | −4.4 | −3.9 | −3.8 | −3.7 |
| 3:00 a.m. | −3.1 | −3.0 | −2.5 | −2.5 | −2.1 |
| 5:00 a.m. | −4.0 | −3.6 | −3.0 | −2.9 | −2.8 |
| 7:00 a.m. | 0.3 | 1.5 | 0.7 | −0.6 | −0.7 |
| 9:00 a.m. | 6.4 | 7.4 | 5.0 | 4.3 | 1.4 |
| 11:00 a.m. | 9.3 | 9.6 | 8.5 | 7.7 | 6.5 |
| 1:00 p.m. | 12.0 | 12.0 | 11.4 | 10.9 | 9.9 |
| 5:00 p.m. | 2.7 | 2.8 | 2.9 | 3.0 | 3.2 |
| Times | Temperature Difference Between the Hidden Mining-Induced Fissures and Aeolian Sand (°C) | ||||
|---|---|---|---|---|---|
| 5 cm | 10 cm | 15 cm | 20 cm | 30 cm | |
| 7:00 p.m. | −2.9 | −2.1 | −1.6 | −1.6 | −2.0 |
| 9:00 p.m. | −1.9 | −1.3 | −0.8 | −0.6 | −0.8 |
| 11:00 p.m. | −2.0 | −1.3 | −1.0 | −0.7 | −1.1 |
| 1:00 a.m. | −2.1 | −1.9 | −1.4 | −1.3 | −1.2 |
| 3:00 a.m. | −2.2 | −2.1 | −1.6 | −1.6 | −1.2 |
| 5:00 a.m. | −2.5 | −2.1 | −1.5 | −1.4 | −1.3 |
| 7:00 a.m. | −2.7 | −1.5 | −2.3 | −3.6 | −3.7 |
| 9:00 a.m. | −0.6 | 0.4 | −2.0 | −2.7 | −5.6 |
| 11:00 a.m. | 1.2 | 1.5 | 0.4 | −0.4 | −1.6 |
| 1:00 p.m. | 0.5 | 0.5 | −0.1 | −0.6 | −1.6 |
| 5:00 p.m. | −0.7 | −0.6 | −0.5 | −0.4 | −0.2 |
| Times | Temperature Difference Between Ground Mining-Induced Fissures and Sand (°C) | Temperature Difference Between the Hidden Mining-Induced Fissures and Sand (°C) | ||||
|---|---|---|---|---|---|---|
| 5 cm | 10 cm | 15 cm | 20 cm | 30 cm | ||
| 7:00 p.m. | 1.1 | −1.5 | −0.7 | −0.2 | −0.2 | −0.6 |
| 9:00 p.m. | 1.6 | −1.1 | −0.5 | 0.0 | 0.2 | 0.0 |
| 11:00 p.m. | 1.6 | −0.7 | 0.0 | 0.3 | 0.6 | 0.2 |
| 1:00 a.m. | 2.9 | −0.4 | −0.2 | 0.3 | 0.4 | 0.5 |
| 3:00 a.m. | 3.7 | −0.1 | 0.0 | 0.5 | 0.5 | 0.9 |
| 5:00 a.m. | 4.3 | 0.0 | 0.4 | 1.0 | 1.1 | 1.2 |
| 7:00 a.m. | −0.5 | −1.2 | 0.0 | −0.8 | −2.1 | −2.2 |
| 9:00 a.m. | −5.2 | 1.0 | 2.0 | −0.4 | −1.1 | −4.0 |
| 11:00 a.m. | −4.4 | 1.3 | 1.6 | 0.5 | −0.3 | −1.5 |
| 1:00 p.m. | −8.5 | 0.1 | 0.1 | −0.5 | −1.0 | −2.0 |
| 5:00 p.m. | −2.2 | −0.5 | −0.4 | −0.3 | −0.2 | 0.0 |
| Times | Hidden Fissures Temperature (°C) | Aeolian Sand Temperature (°C) | Vegetation Temperature (°C) | Temperature Difference (°C) | |
|---|---|---|---|---|---|
| Hidden Fissures and Aeolian Sand | Hidden Fissures and Vegetation | ||||
| 7:00 p.m. | 18.6 | 19.7 | 20.5 | −1.1 | −1.9 |
| 9:00 p.m. | 17.1 | 17.0 | 18.1 | 0.1 | −1.0 |
| 11:00 p.m. | 15.5 | 15.3 | 16.7 | 0.2 | −1.2 |
| 1:00 a.m. | 12.2 | 10.9 | 12.1 | 1.3 | 0.1 |
| 3:00 a.m. | 7.6 | 6.2 | 7.5 | 1.4 | 0.1 |
| 5:00 a.m. | 6.6 | 5.1 | 6.3 | 1.5 | 0.3 |
| 7:00 a.m. | 21.2 | 17.8 | 11.9 | 3.4 | 9.3 |
| 9:00 a.m. | 30.9 | 29.5 | 19.2 | 1.4 | 11.7 |
| 11:00 a.m. | 34.8 | 40.0 | 29.5 | −5.2 | 5.3 |
| 1:00 p.m. | 22.9 | 30.7 | 20.6 | −7.8 | 2.3 |
| 5:00 p.m. | 21.9 | 25.4 | 20.8 | −3.5 | 1.1 |
Disclaimer/Publisher’s Note: The statements, opinions and data contained in all publications are solely those of the individual author(s) and contributor(s) and not of MDPI and/or the editor(s). MDPI and/or the editor(s) disclaim responsibility for any injury to people or property resulting from any ideas, methods, instructions or products referred to in the content. |
© 2025 by the authors. Licensee MDPI, Basel, Switzerland. This article is an open access article distributed under the terms and conditions of the Creative Commons Attribution (CC BY) license (https://creativecommons.org/licenses/by/4.0/).
Share and Cite
Xu, D.; Zhao, Y.-X.; Zhang, K.-N.; Ling, C.-W.; Li, P. Quantifying Thermal Spatiotemporal Signatures and Identifying Hidden Mining-Induced Fissures with Various Burial Depths via UAV Infrared Thermometry. Remote Sens. 2025, 17, 1992. https://doi.org/10.3390/rs17121992
Xu D, Zhao Y-X, Zhang K-N, Ling C-W, Li P. Quantifying Thermal Spatiotemporal Signatures and Identifying Hidden Mining-Induced Fissures with Various Burial Depths via UAV Infrared Thermometry. Remote Sensing. 2025; 17(12):1992. https://doi.org/10.3390/rs17121992
Chicago/Turabian StyleXu, Duo, Yi-Xin Zhao, Kang-Ning Zhang, Chun-Wei Ling, and Peng Li. 2025. "Quantifying Thermal Spatiotemporal Signatures and Identifying Hidden Mining-Induced Fissures with Various Burial Depths via UAV Infrared Thermometry" Remote Sensing 17, no. 12: 1992. https://doi.org/10.3390/rs17121992
APA StyleXu, D., Zhao, Y.-X., Zhang, K.-N., Ling, C.-W., & Li, P. (2025). Quantifying Thermal Spatiotemporal Signatures and Identifying Hidden Mining-Induced Fissures with Various Burial Depths via UAV Infrared Thermometry. Remote Sensing, 17(12), 1992. https://doi.org/10.3390/rs17121992