
Adaptive Analysis of Ecosystem Stability in China to Soil Moisture Variations: A Perspective Based on Climate Zoning and Land Use Types


 ,
, 
Abstract
1. Introduction
2. Research Data and Research Methods
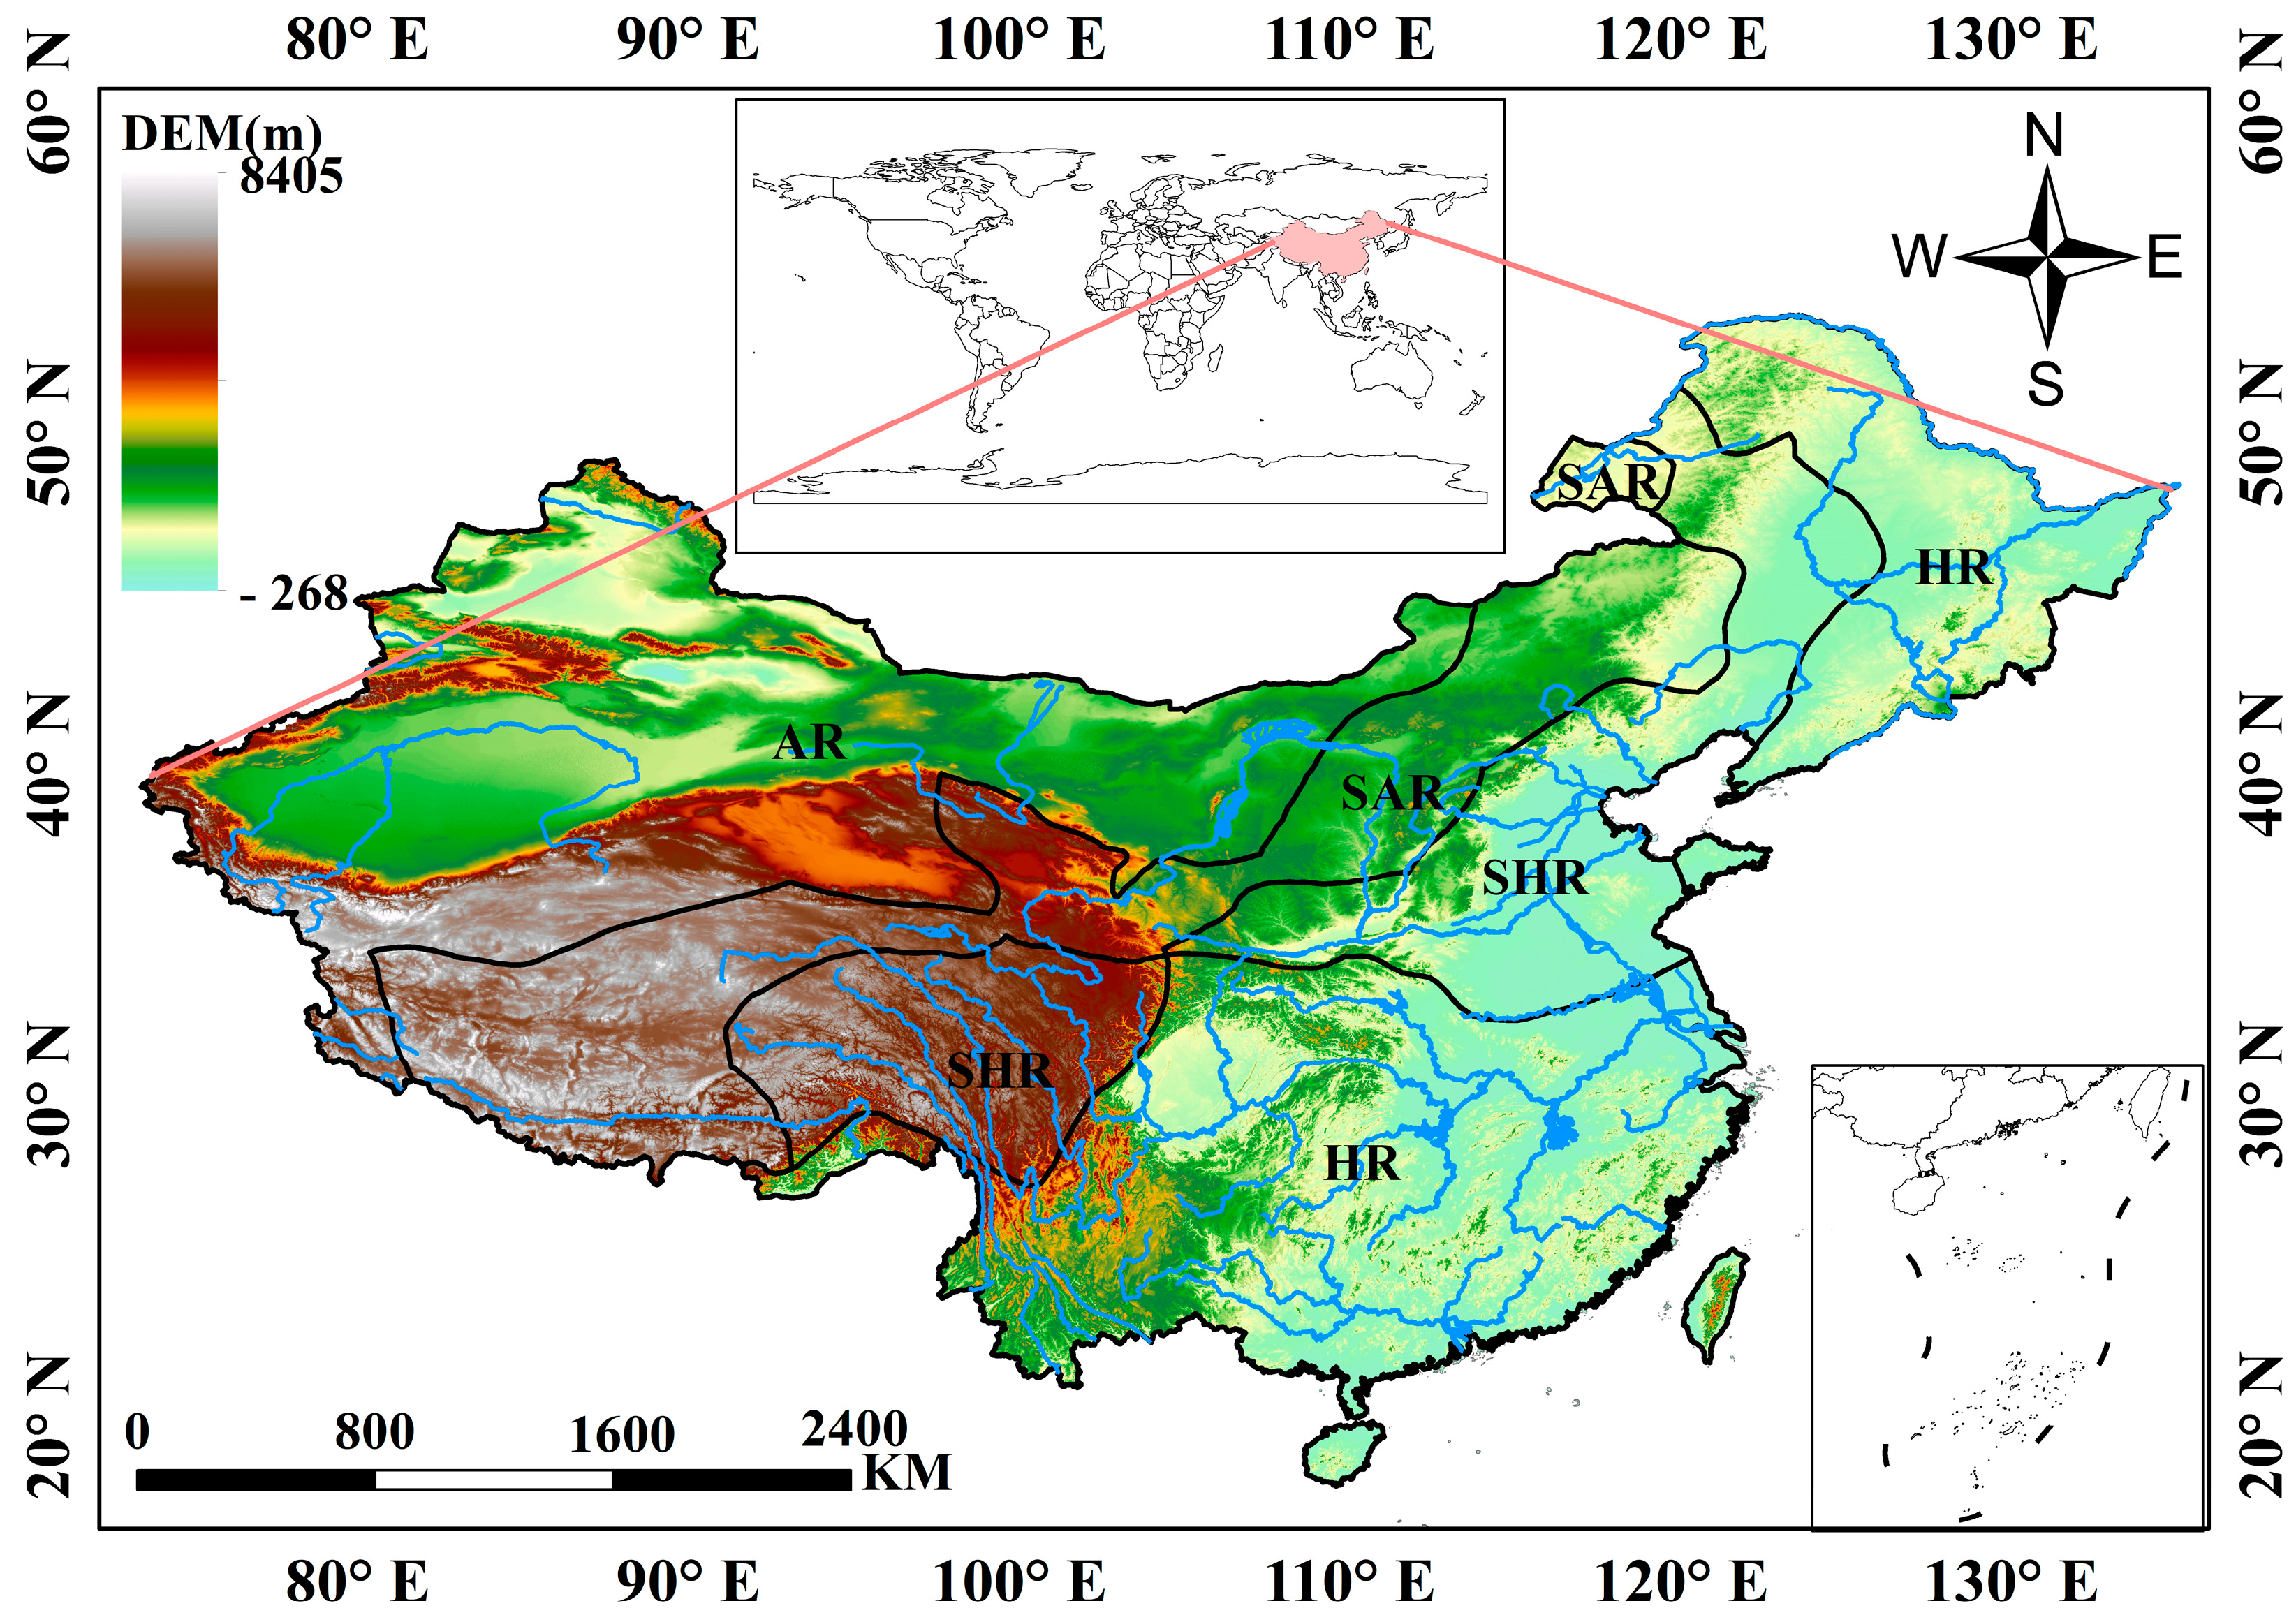
2.1. Overview of the Study Area
2.2. Research Data
2.2.1. EVI Data
2.2.2. GPP Data
2.2.3. Land Cover Data
2.2.4. Soil Moisture Data
2.3. Research Methods
2.3.1. Sen’s and Mann–Kendall Trend Test
2.3.2. Spatial Auto-Correlation Analysis Based on Moran’s I
2.3.3. Correlation Analysis
3. Results and Analysis
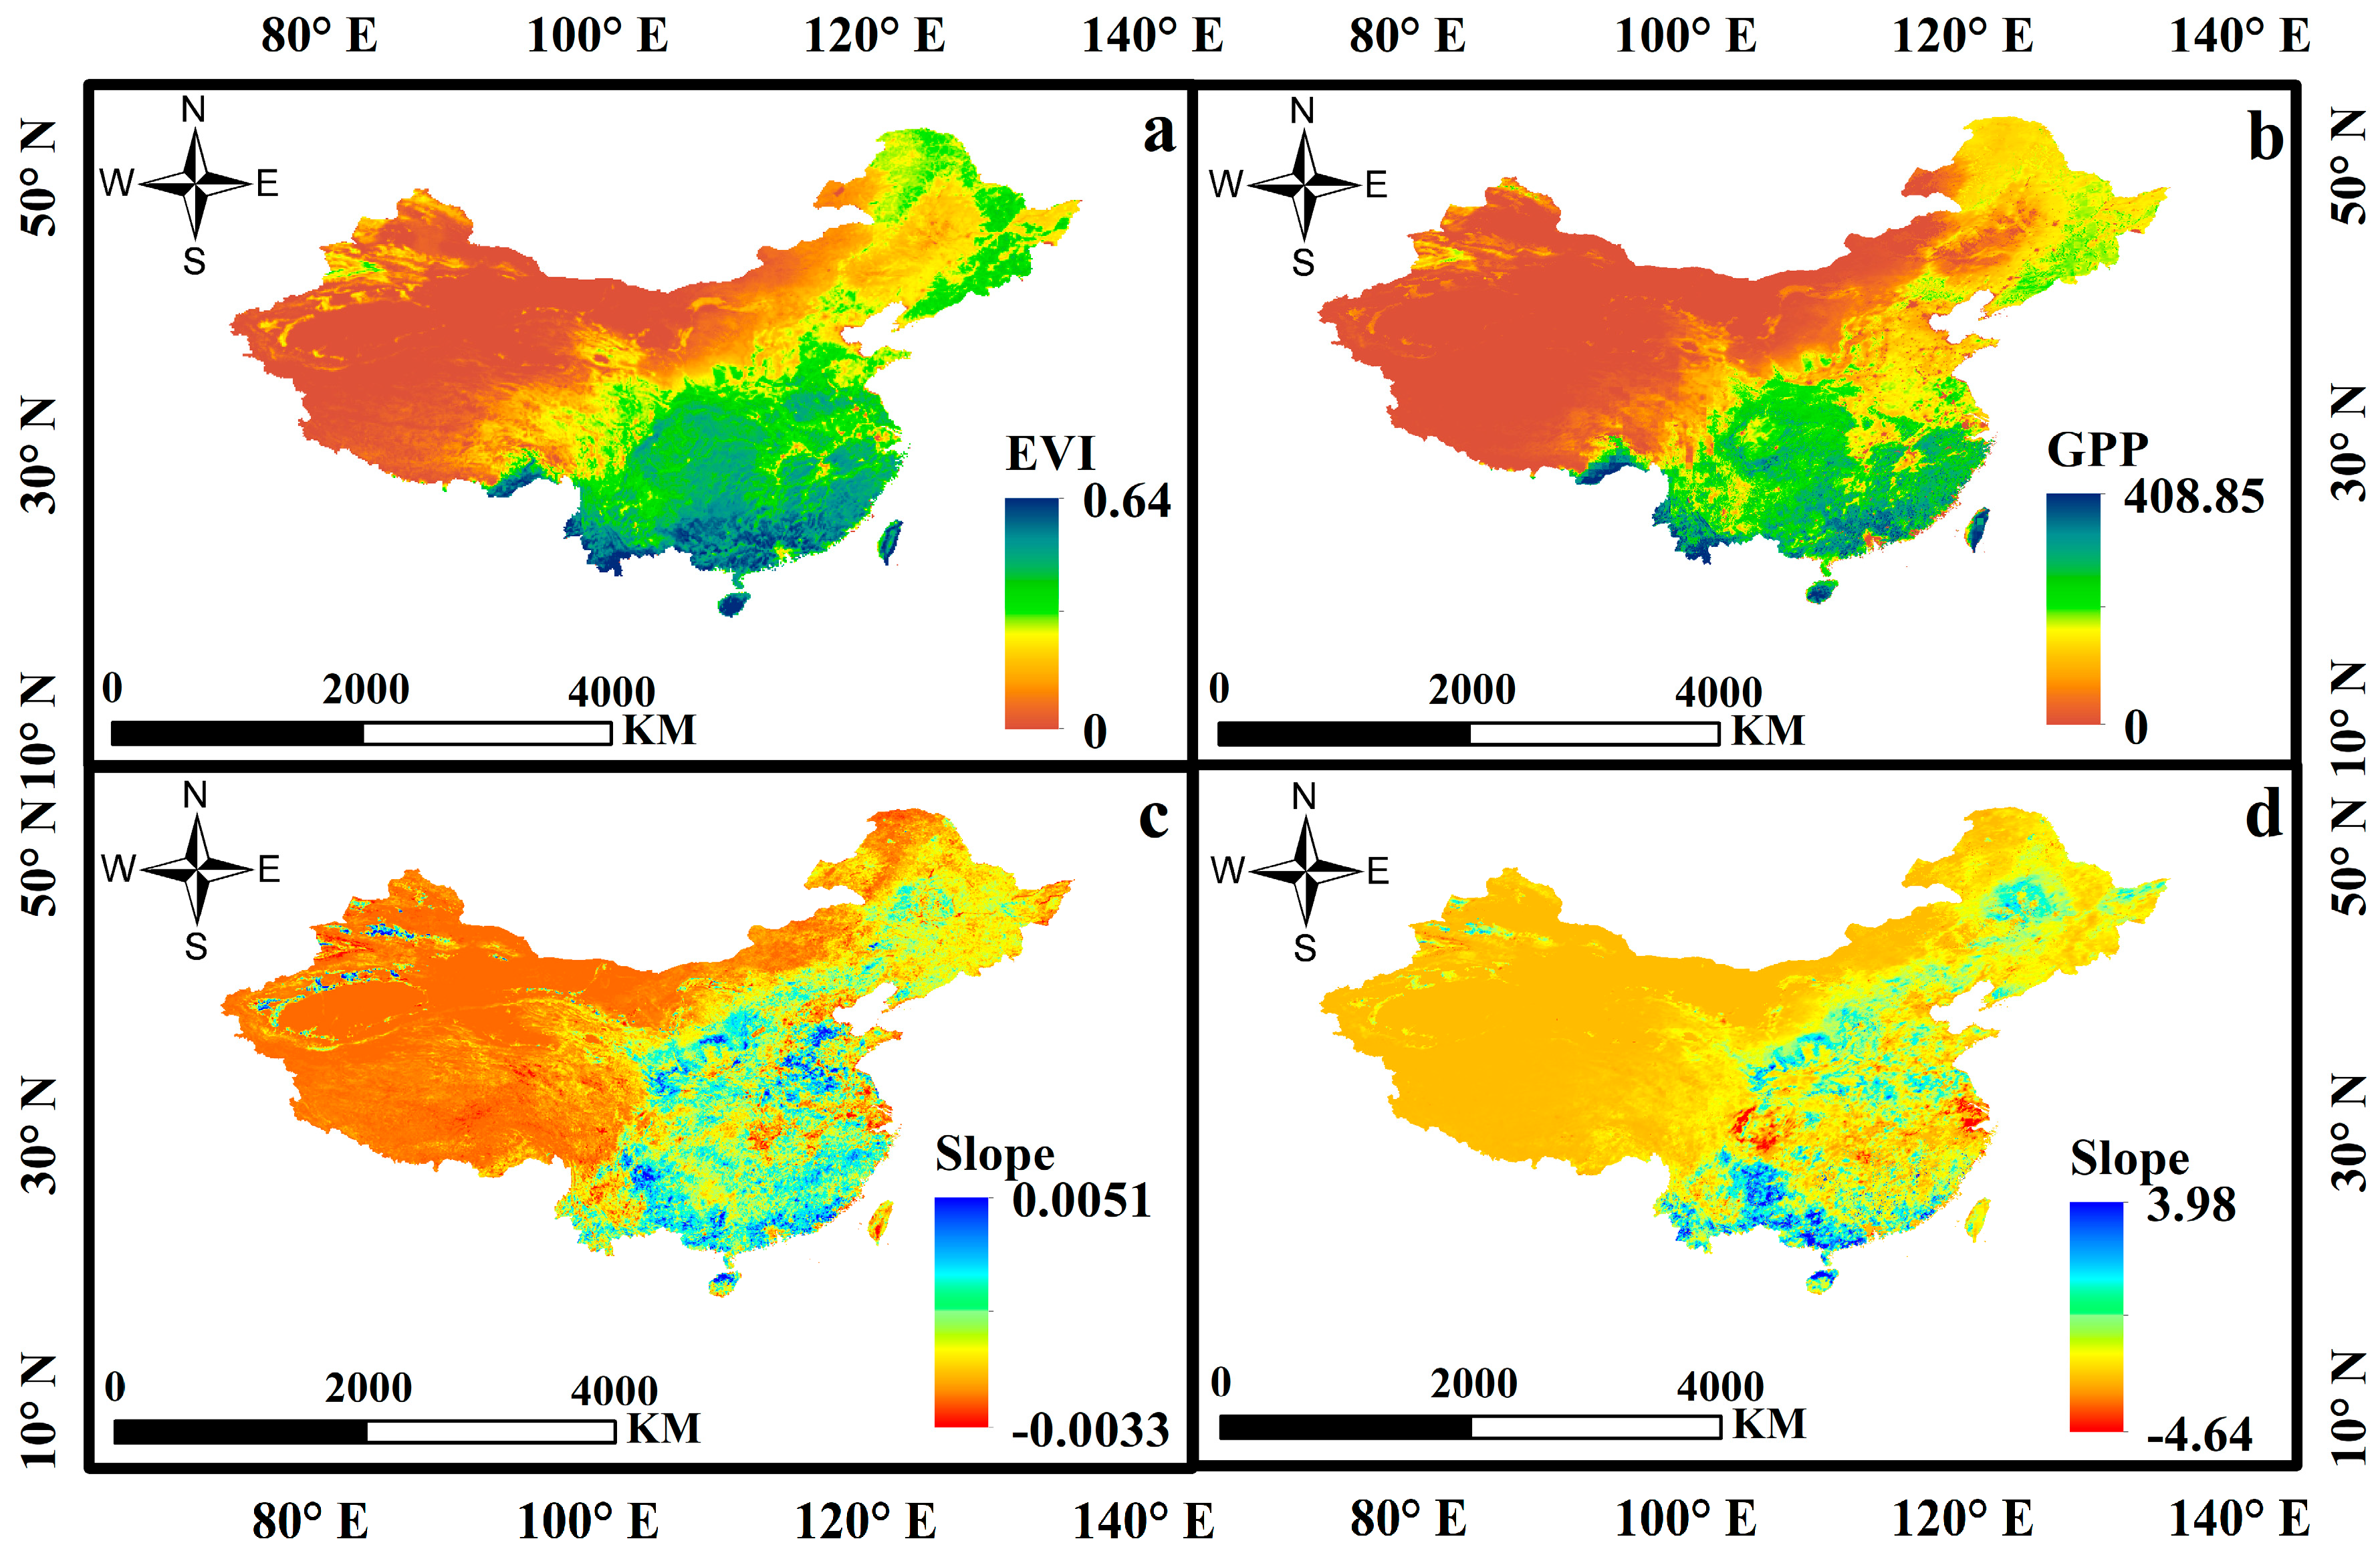
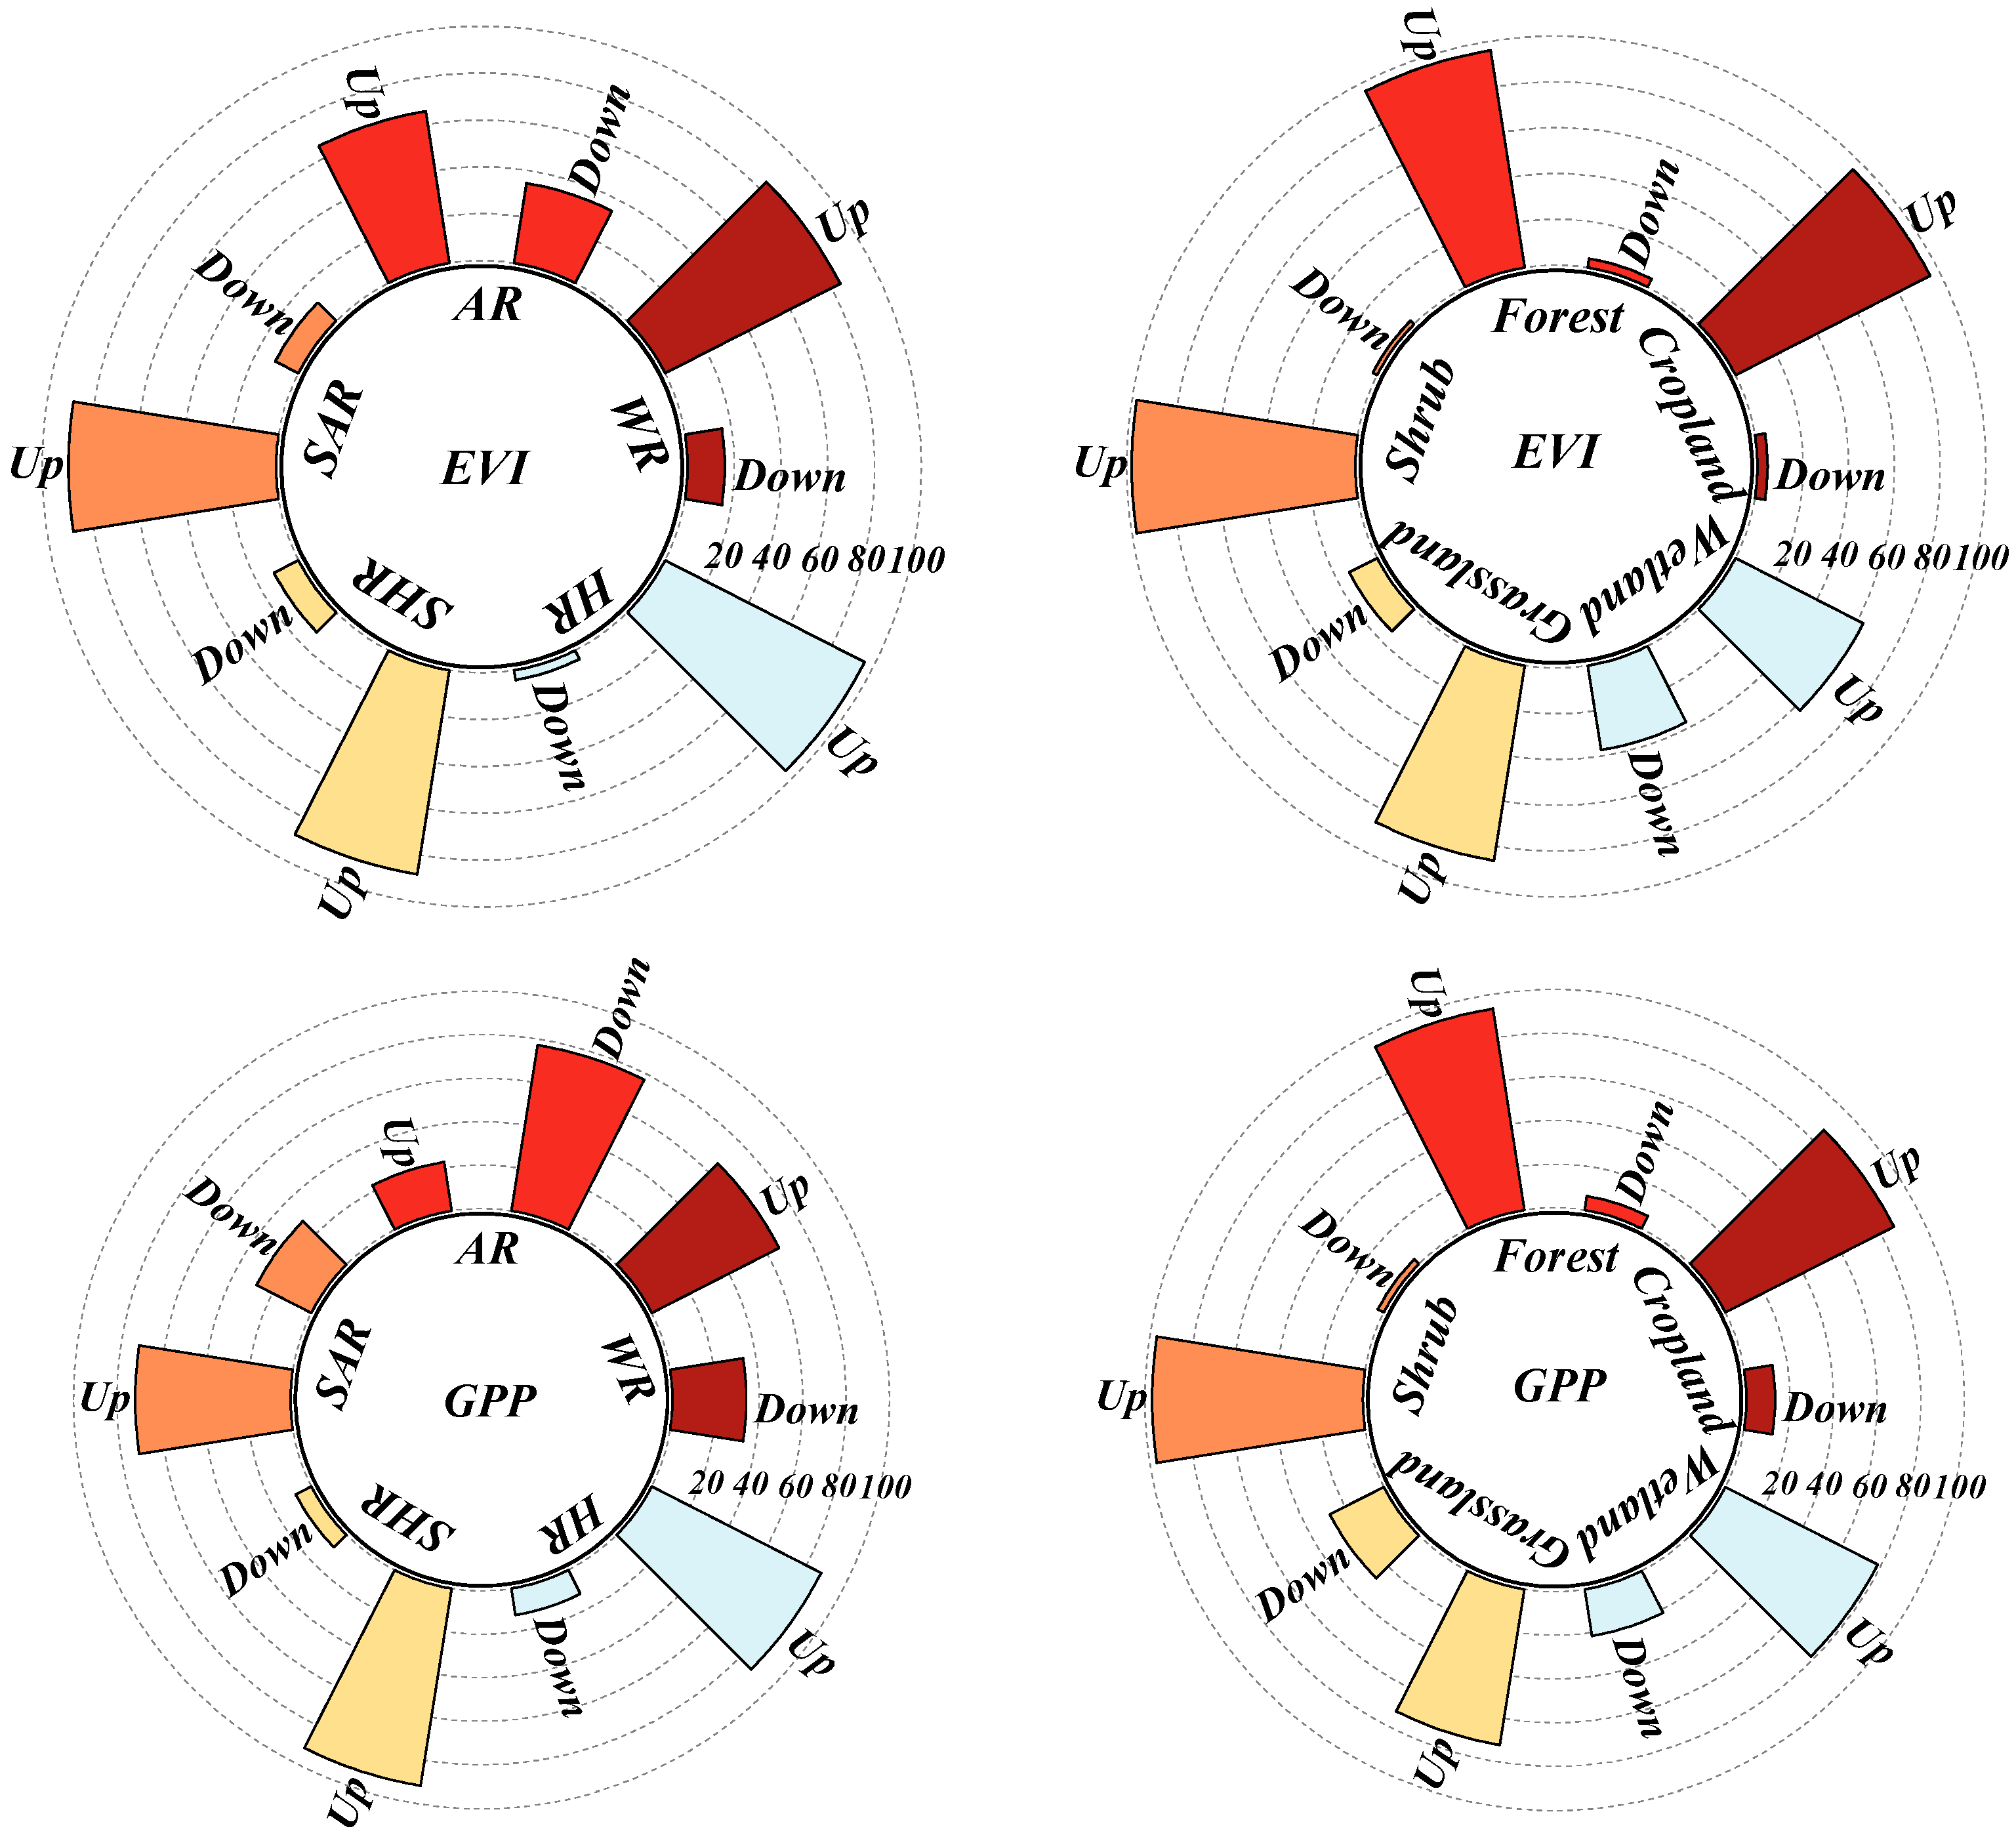
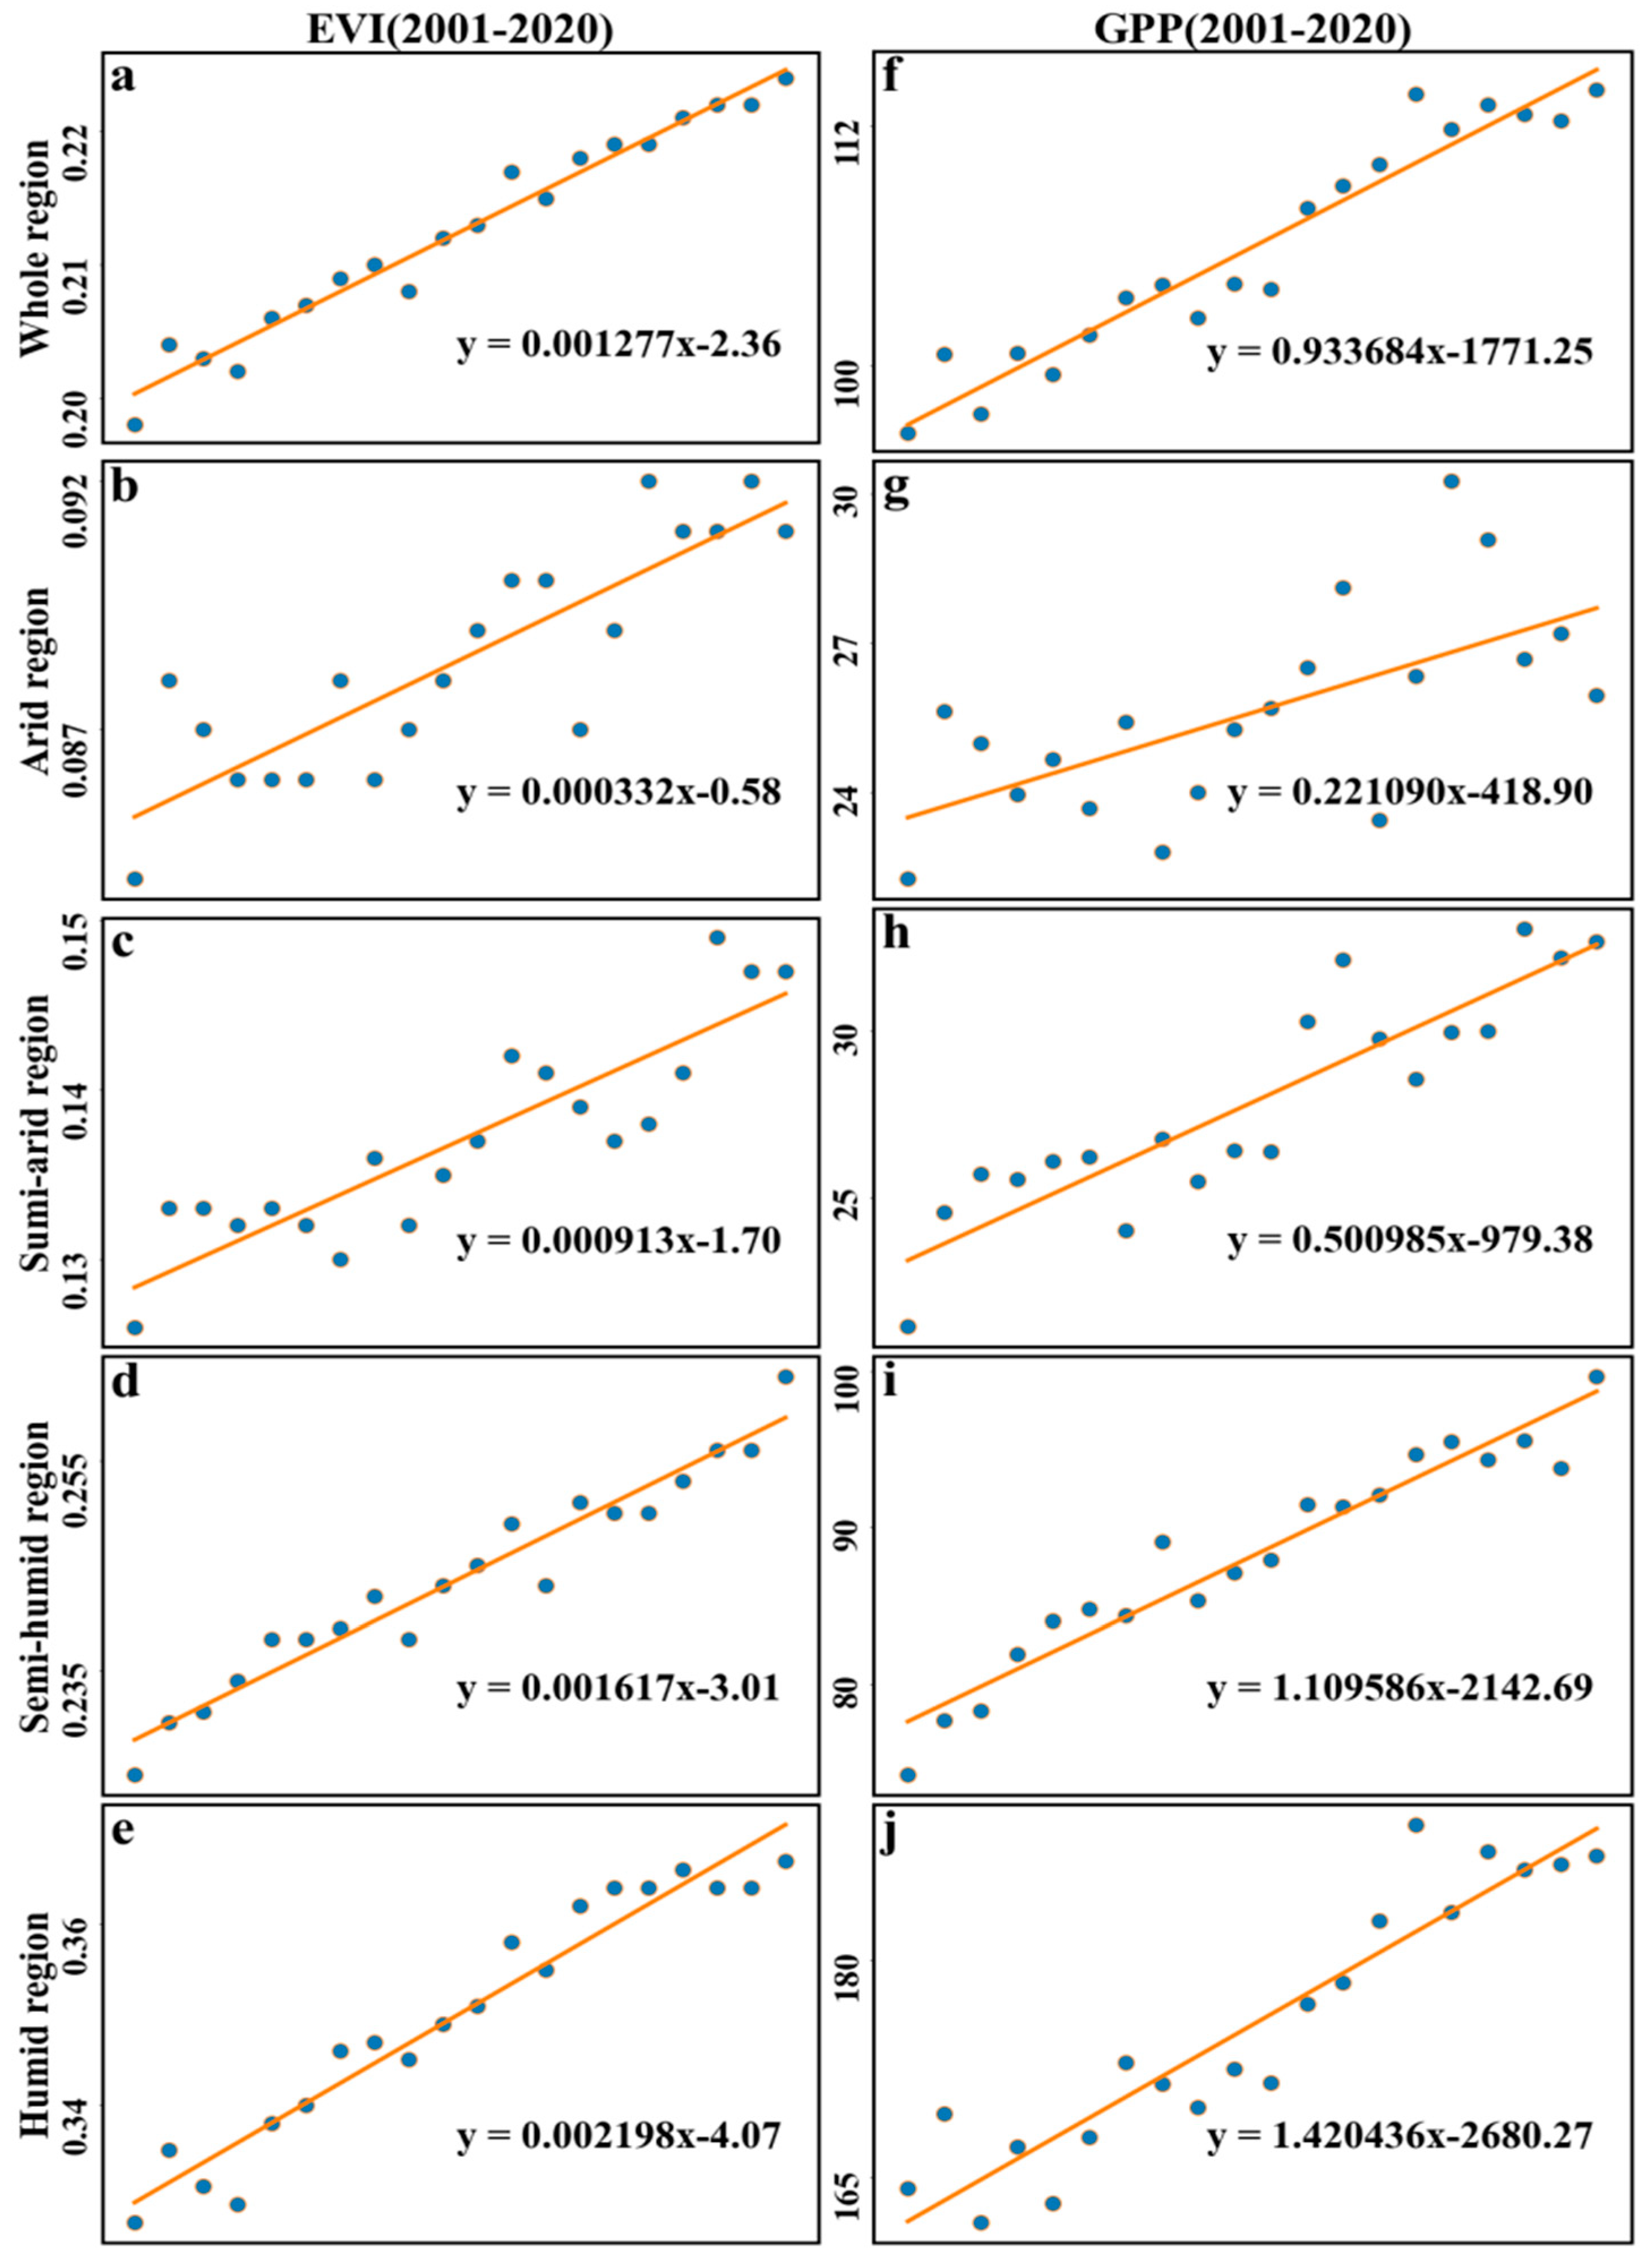
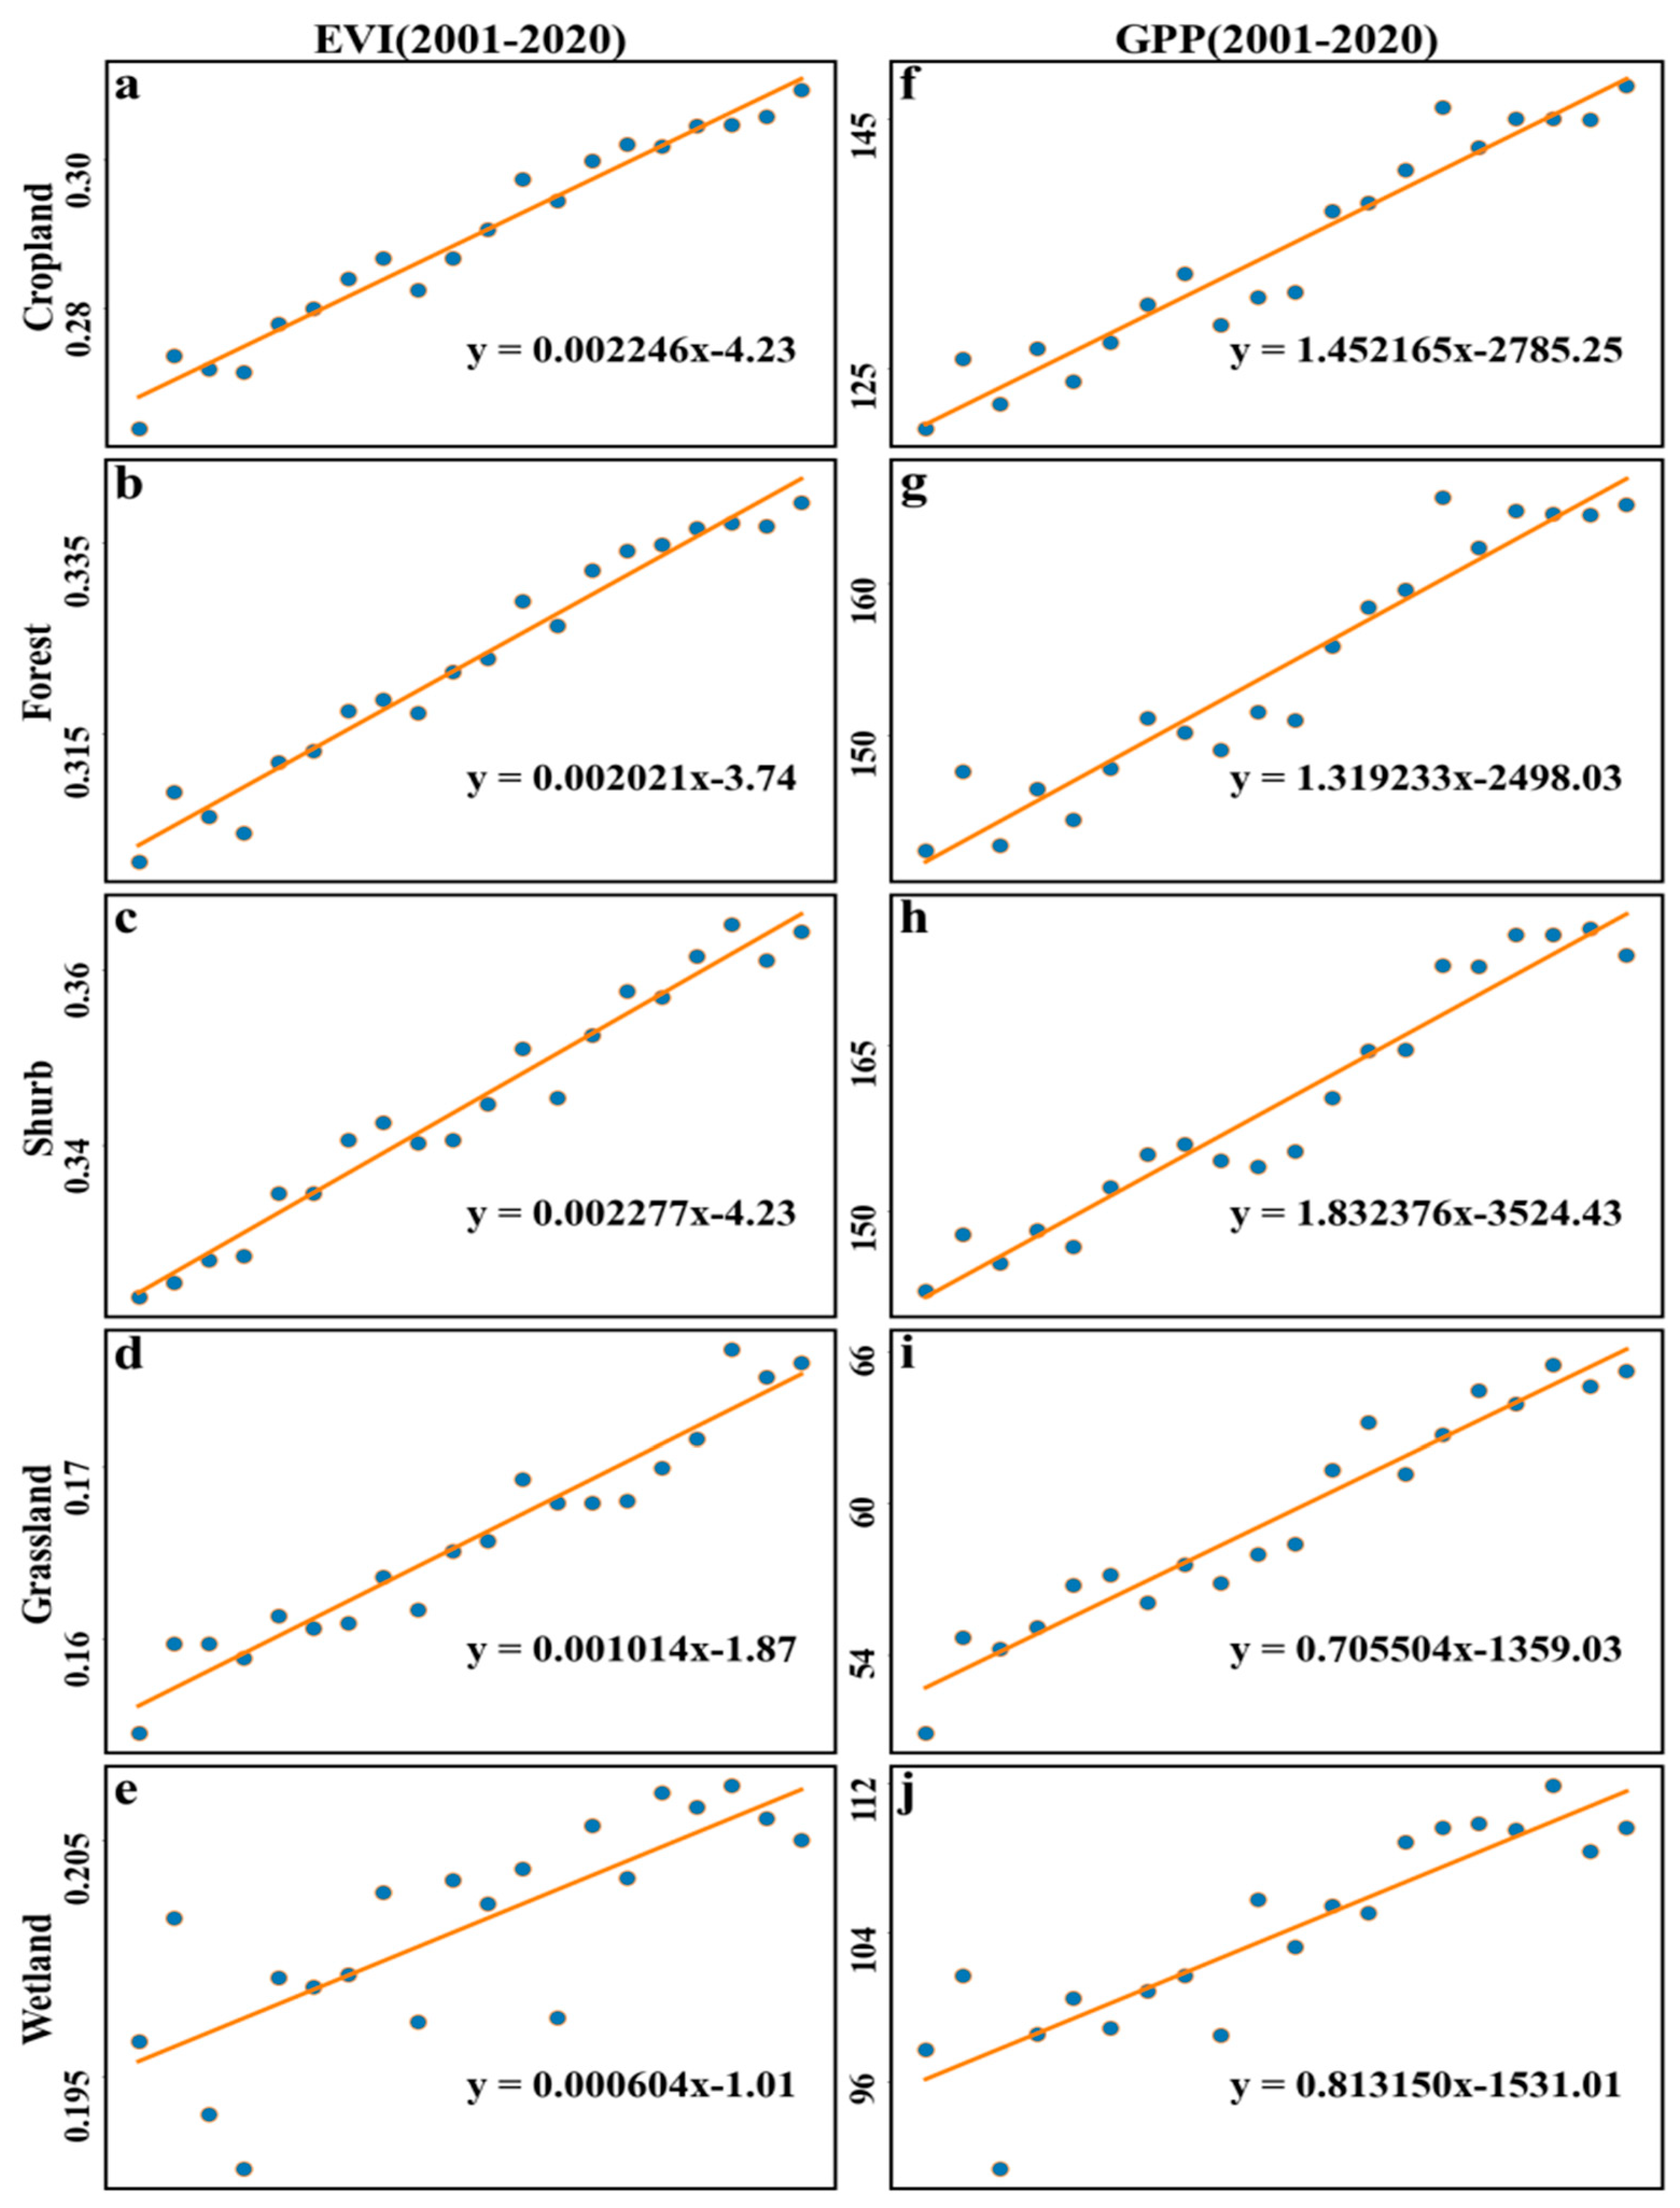
3.1. Spatial and Temporal Distribution Characteristics of EVI and GPP
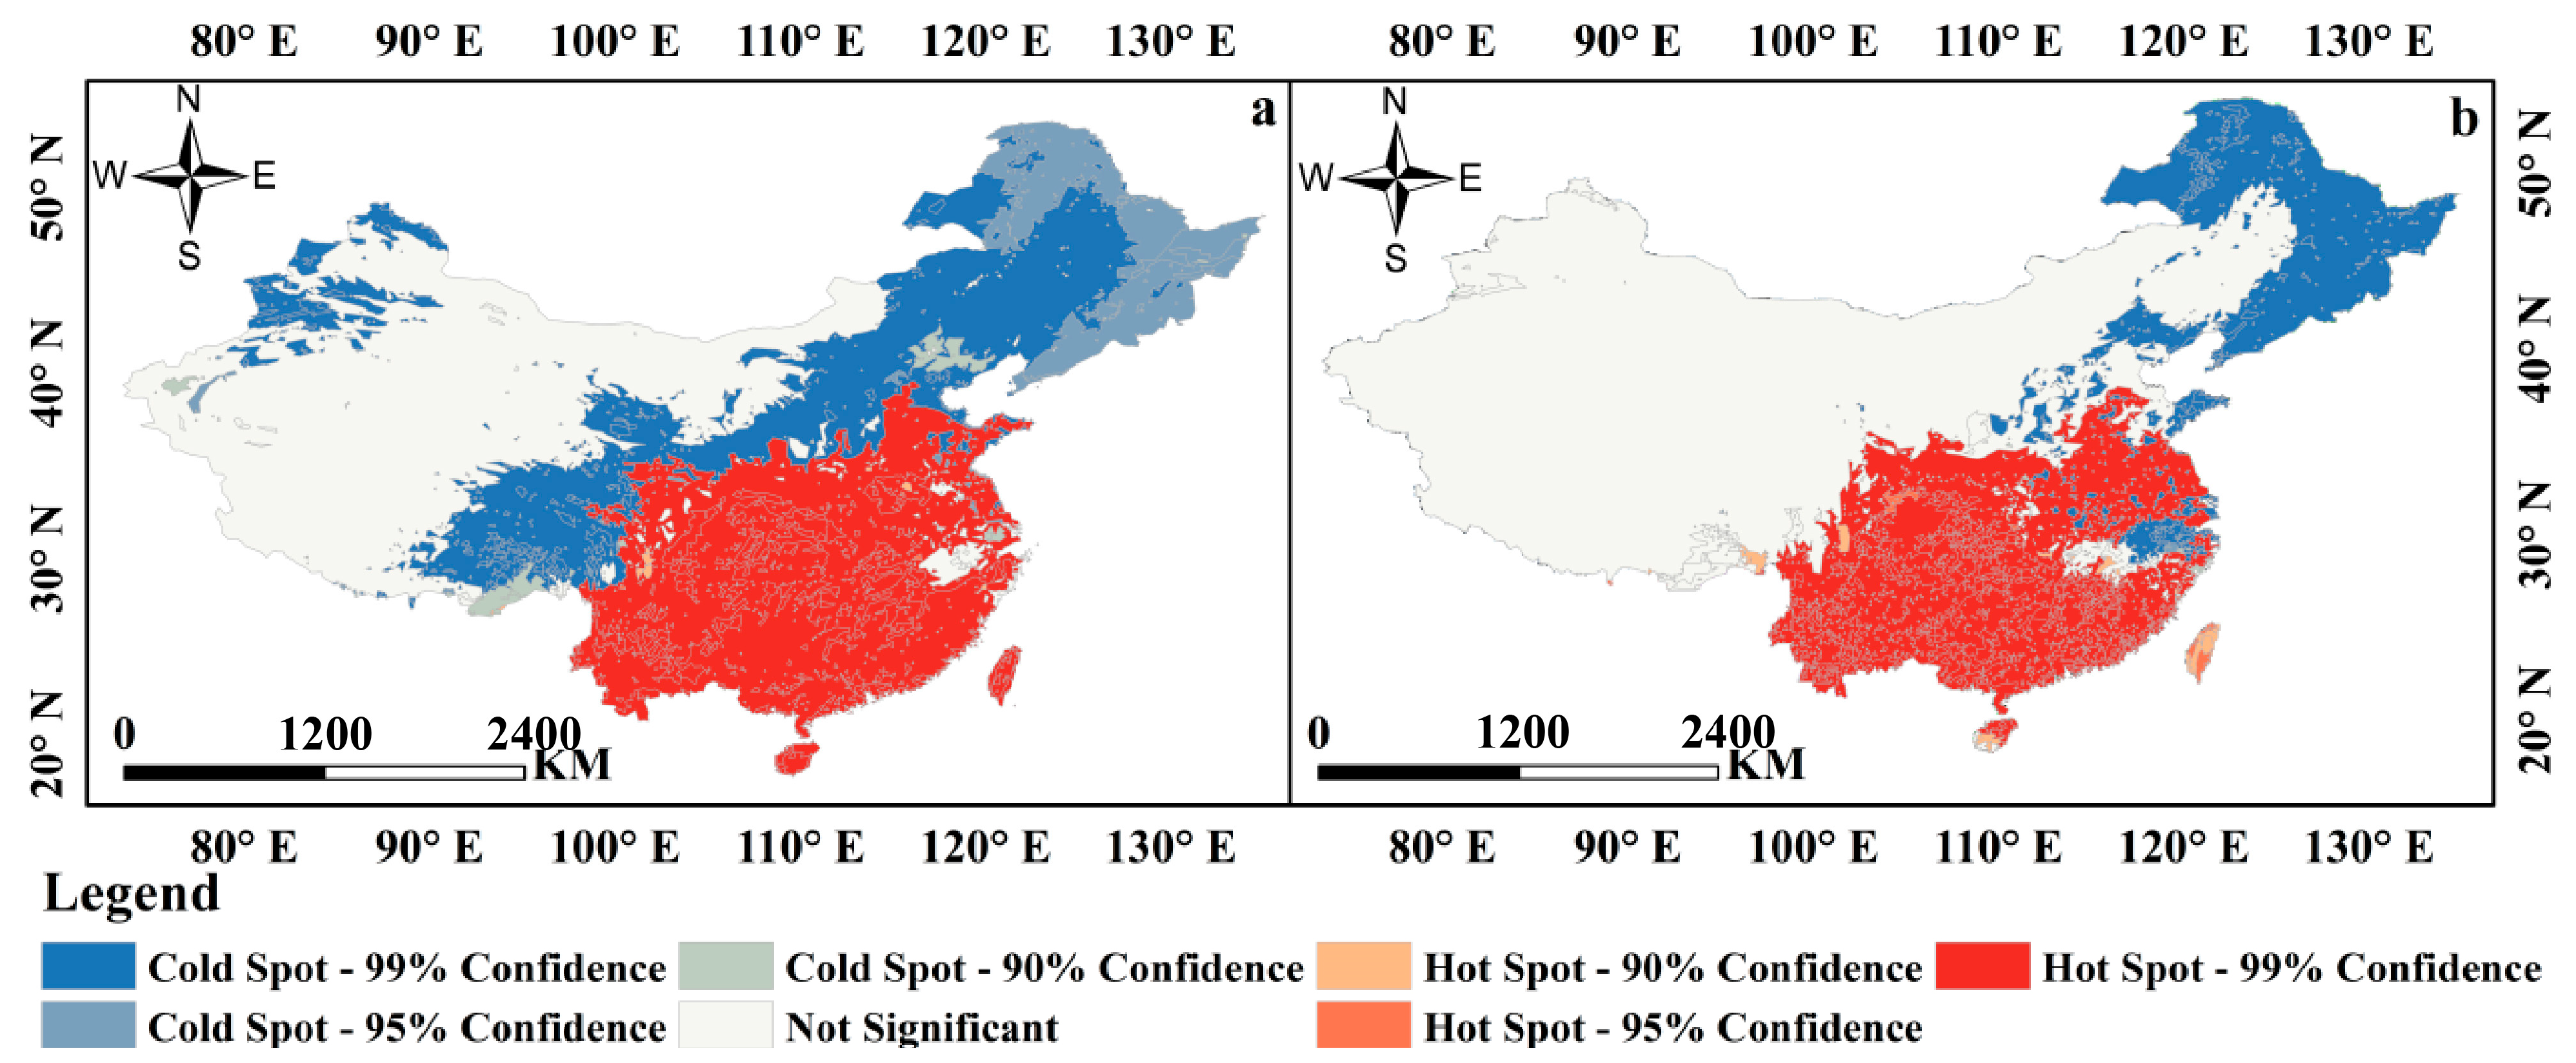
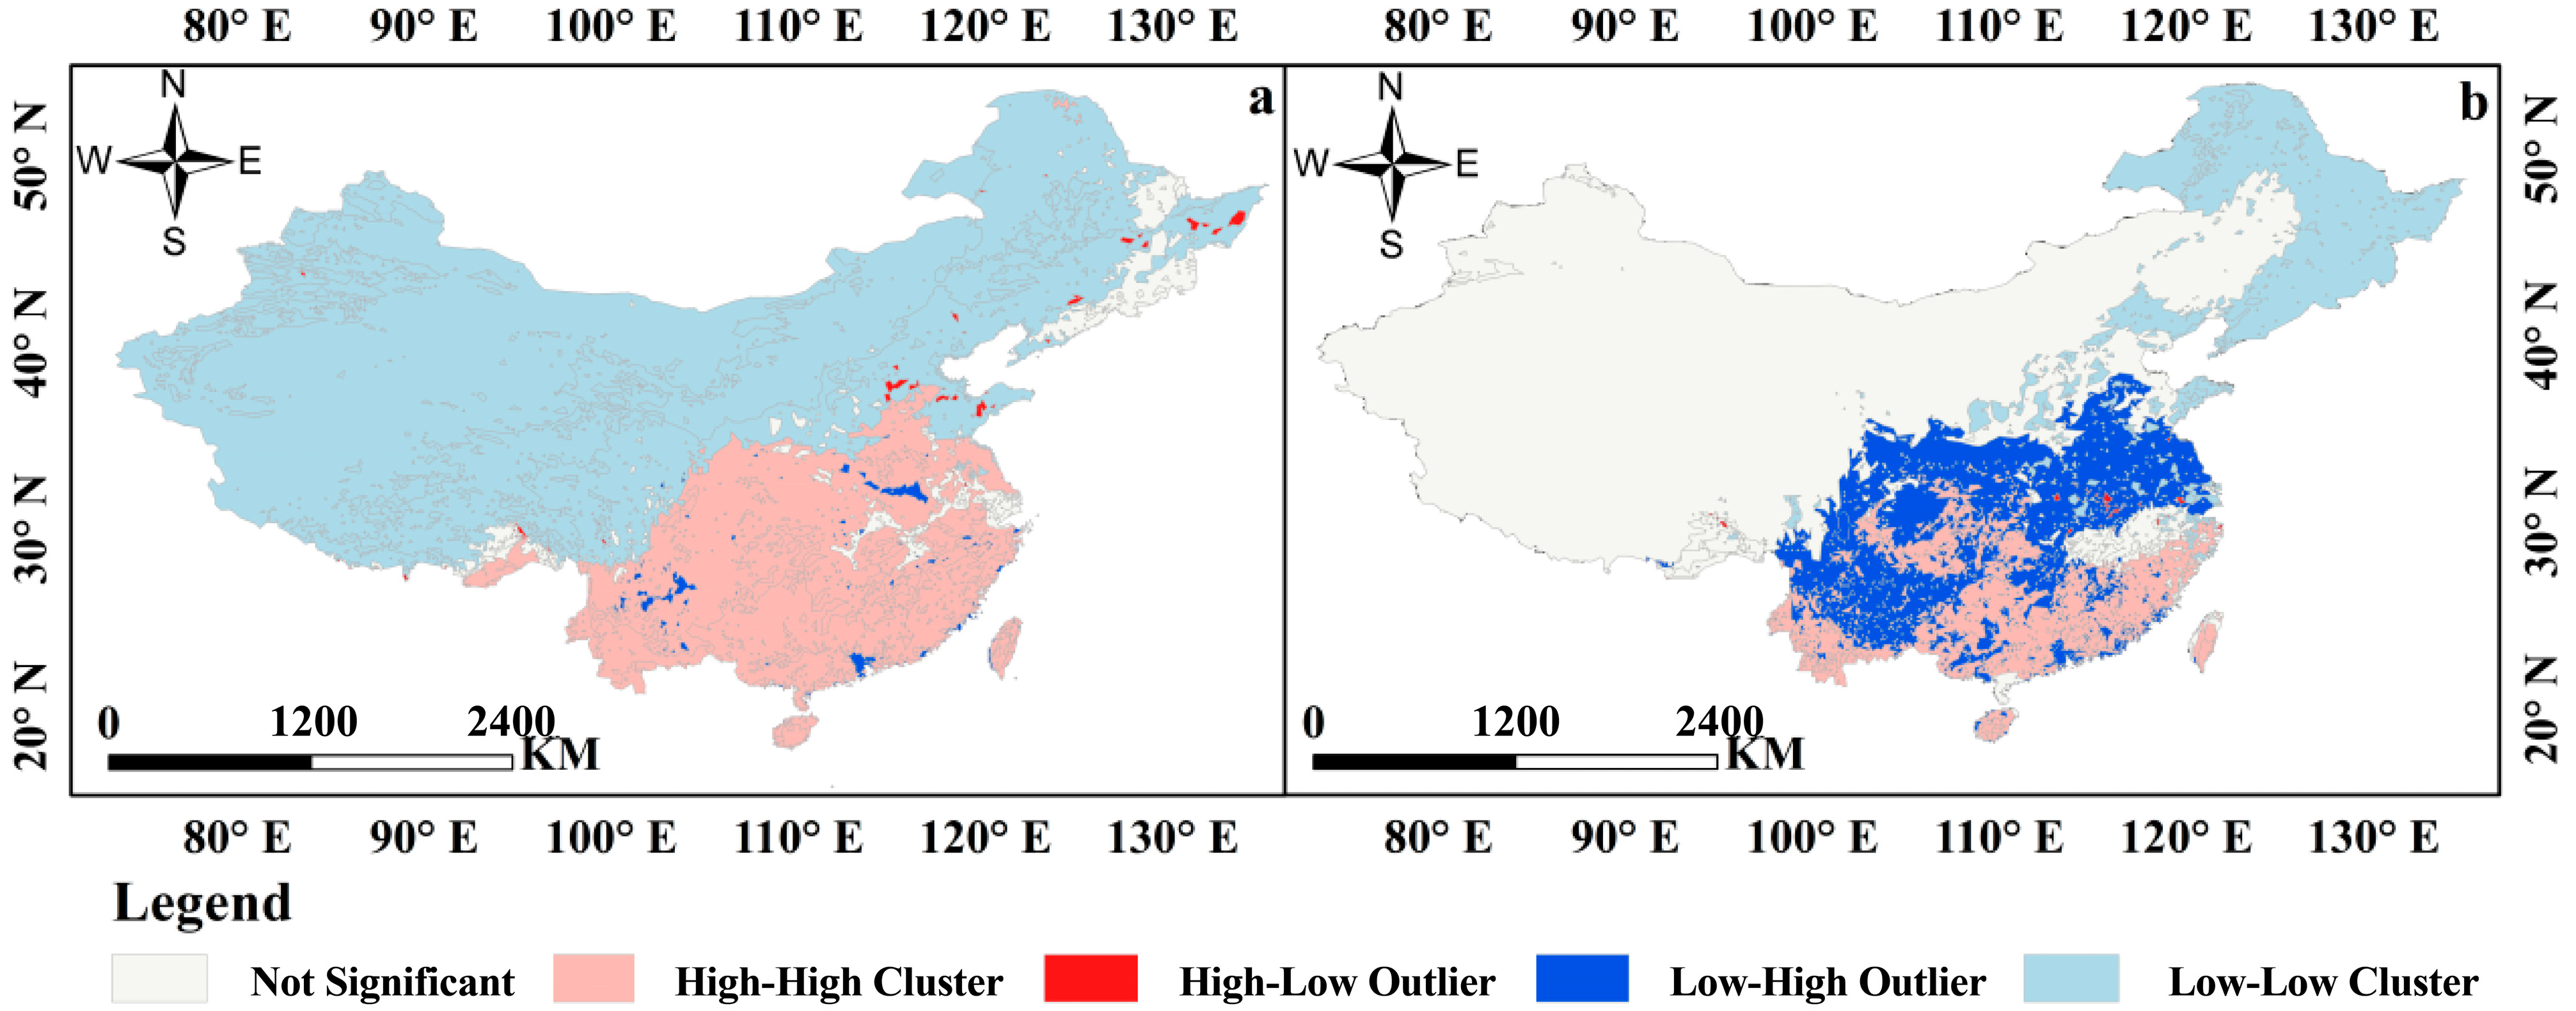
3.2. Spatial Auto-Correlation of EVI and GPP
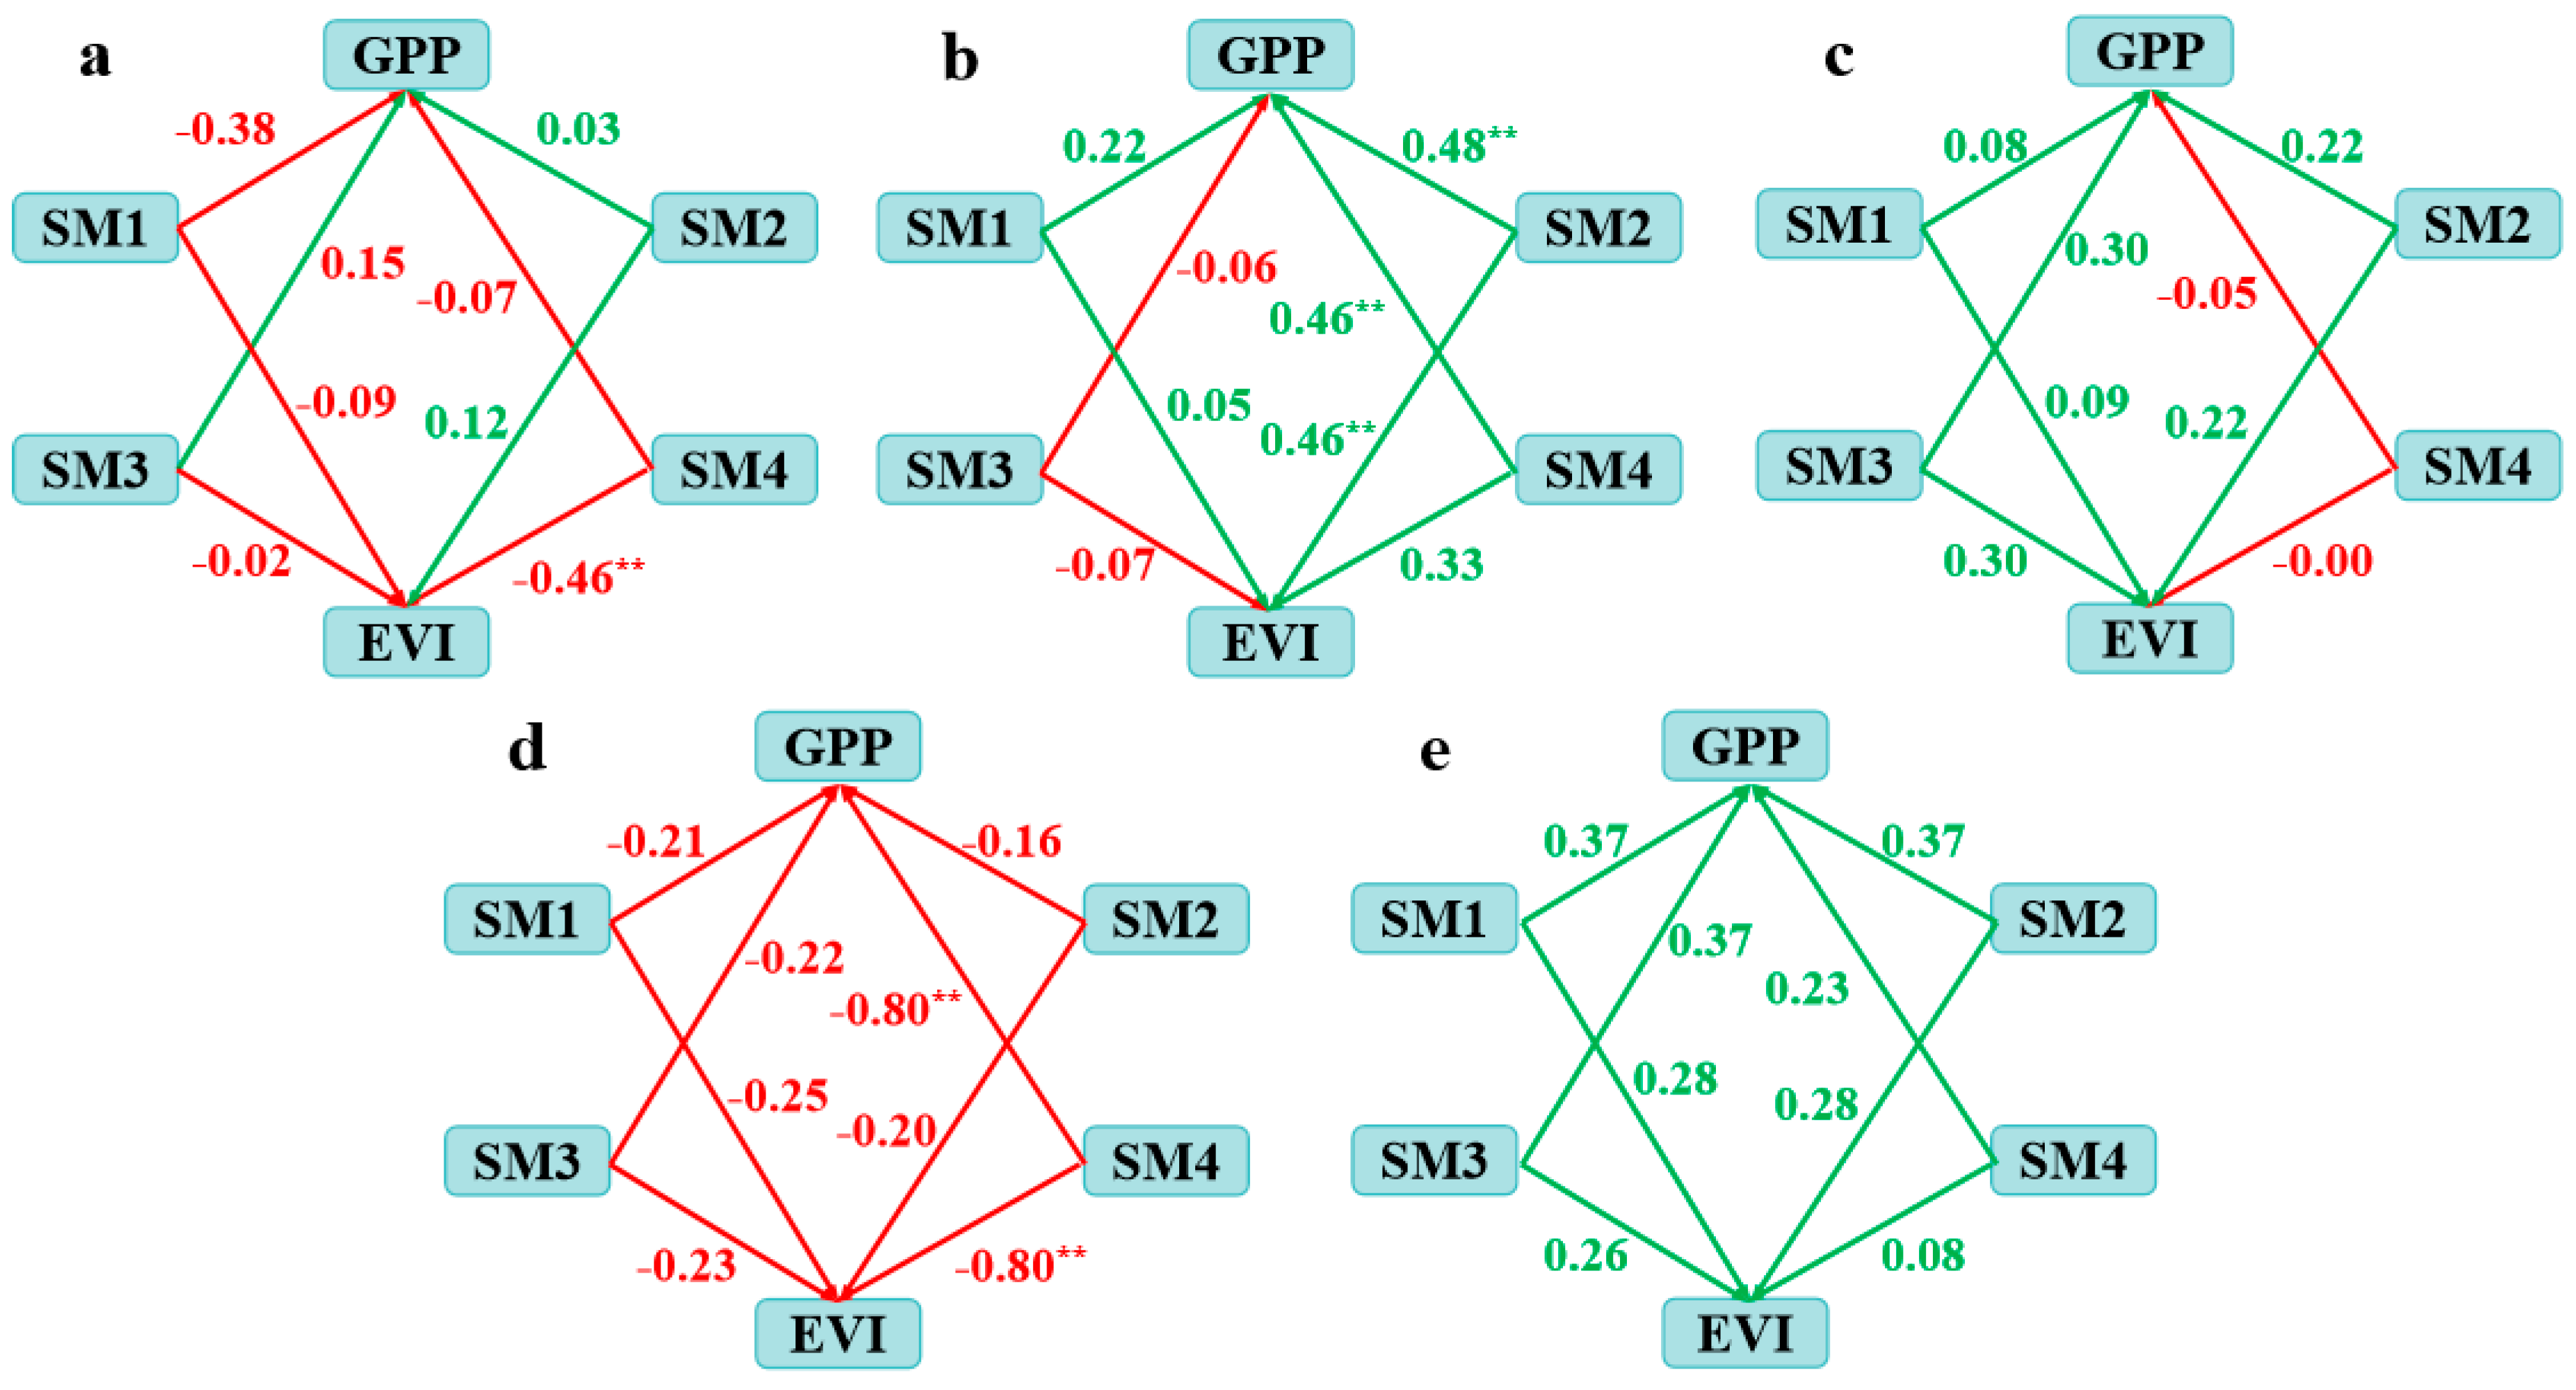
3.3. Correlation Analysis
4. Discussion
4.1. Spatial and Temporal Distribution Characteristics of EVI and GPP
4.2. Response of EVI and GPP to Soil Moisture
4.3. Limitations and Future Research
5. Conclusions
Author Contributions
Funding
Data Availability Statement
Conflicts of Interest
References
- He, Q.; Lu, H.; Yang, K.; Zhen, L.; Yue, S.; Li, Y.; Entekhabi, D. Global Patterns of Vegetation Response to Short-Term Surface Water Availability. IEEE J. Sel. Top. Appl. Earth Obs. Remote Sens. 2021, 14, 8273–8286. [Google Scholar] [CrossRef]
- Fu, Z.; Ciais, P.; Wigneron, J.P.; Gentine, P.; Feldman, A.F.; Makowski, D.; Viovy, N.; Kemanian, A.R.; Goll, D.S.; Stoy, P.C.; et al. Global critical soil moisture thresholds of plant water stress. Nat. Commun. 2024, 15, 4826. [Google Scholar] [CrossRef] [PubMed]
- Peng, J.; Tang, J.; Xie, S.; Wang, Y.; Liao, J.; Chen, C.; Sun, C.; Mao, J.; Zhou, Q.; Niu, S. Evidence for the acclimation of ecosystem photosynthesis to soil moisture. Nat. Commun. 2024, 15, 9795. [Google Scholar] [CrossRef] [PubMed]
- Li, Y.; Leng, P.; Kasim, A.A.; Li, Z.-L. Spatiotemporal variability and dominant driving factors of satellite observed global soil moisture from 2001 to 2020. J. Hydrol. 2025, 654, 132848. [Google Scholar] [CrossRef]
- Xu, X.; Yu, G. Theories of ecosystem vulnerability, adaptability and catastrophe based on the mechanisms of ecological succession. Chin. J. Appl. Ecol. 2022, 33, 623–628. [Google Scholar]
- Liu, X.; Zhou, H.; Li, P.; Peng, S. A conceptual analysis of ecosystem stability. Acta Ecol. Sin. 2004, 11, 2635–2640. [Google Scholar]
- Higgins, S.I.; Conradi, T.; Muhoko, E. Shifts in vegetation activity of terrestrial ecosystems attributable to climate trends. Nat. Geosci. 2023, 16, 147–153. [Google Scholar] [CrossRef]
- Liu, G.; Wang, Y.; Chen, Y.; Tong, X.; Wang, Y.; Xie, J.; Tang, X. Remotely Monitoring Vegetation Productivity in Two Contrasting Subtropical Forest Ecosystems Using Solar-Induced Chlorophyll Fluorescence. Remote Sens. 2022, 14, 1328. [Google Scholar] [CrossRef]
- Chen, X.; Li, Y.; Wang, Z. Soil Moisture Dynamics and Its Impact on Vegetation in the Loess Plateau of China. J. Hydrol. 2020, 584, 124703. [Google Scholar]
- Zhang, Y.; Wang, L.; Liu, H. Effects of Soil Moisture on the Stability of Grassland Ecosystems in Inner Mongolia. Ecol. Eng. 2019, 134, 143–150. [Google Scholar]
- Green, M.; White, J.; Black, S. Impact of Soil Moisture on Carbon Sequestration in Forest Ecosystems. For. Ecol. Manag. 2022, 513, 119567. [Google Scholar]
- Brown, R.; Smith, A.; Johnson, B. Effects of Soil Moisture on the Stability of Agricultural Ecosystems. Agric. Syst. 2021, 188, 103056. [Google Scholar]
- Zhang, L.; Li, H.; Wang, Y. Soil Moisture and Its Role in Maintaining Biodiversity in Wetland Ecosystems. Wetlands 2020, 40, 123–134. [Google Scholar]
- Zhang, X.; Friedl, M.A.; Schaaf, C.B.; Strahler, A.H.; Hodges, J.C.F.; Gao, F.; Reed, B.C.; Huete, A. Monitoring vegetation phenology using MODIS. Remote Sens. Environ. 2003, 84, 471–475. [Google Scholar] [CrossRef]
- Yao, R.; Zhang, Y.; Wang, L.; Li, J.; Yang, Q. Reconstructed NDVI and EVI datasets in China (ReVIChina) generated by a spatial-interannual reconstruction method. Int. J. Digit. Earth 2023, 16, 4749–4768. [Google Scholar] [CrossRef]
- Pandey, V.; Harde, S.; Rajasekaran, E.; Burman, P.K.D. Gross primary productivity of terrestrial ecosystems: A review of observations, remote sensing, and modelling studies over South Asia. Theor. Appl. Climatol. 2024, 155, 8461–8491. [Google Scholar] [CrossRef]
- Bi, W.; He, W.; Zhou, Y.; Ju, W.; Liu, Y.; Liu, Y.; Zhang, X.; Wei, X.; Cheng, N. A global 0.05° dataset for gross primary production of sunlit and shaded vegetation canopies from 1992 to 2020. Sci. Data 2022, 9, 213. [Google Scholar] [CrossRef]
- Frimpong, B.F.; Koranteng, A.; Molkenthin, F. Analysis of temperature variability utilising Mann-Kendall and Sen’s slope estimator tests in the Accra and Kumasi Metropolises in Ghana. Environ. Syst. Res. 2022, 11, 24. [Google Scholar] [CrossRef]
- Liu, J.; Wei, L.; Zheng, Z.; Du, J. Vegetation cover change and its response to climate extremes in the Yellow River Basin. Sci. Total Environ. 2023, 905, 167366. [Google Scholar] [CrossRef]
- Chen, Y. Spatial autocorrelation equation based on Moran’s index. Sci. Rep. 2023, 13, 19296. [Google Scholar] [CrossRef]
- Wang, Y.; Lv, W.; Wang, M.; Chen, X.; Li, Y. Application of improved Moran’s I in the evaluation of urban spatial development. Spat. Stat. 2023, 54, 100736. [Google Scholar] [CrossRef]
- Gago, T.; Sargisson, R.J.; Milfont, T.L. A meta-analysis on the relationship between climate anxiety and wellbeing. J. Environ. Psychol. 2024, 94, 102230. [Google Scholar] [CrossRef]
- Zhao, Q.Q.; Zhang, J.P.; Zhao, T.B.; Li, J. Vegetation Changes and Its Response to Climate Change in China Since 2000. Plateau Meteorol. 2021, 40, 292–301. [Google Scholar]
- Li, M.H.; Du, J.K.; Li, W.T.; Li, R.; Wu, S.; Wang, S. Global Vegetation Change and Its Relationship with Precipitation and Temperature Based on GLASS-LAI in 1982–2015. Sci. Geogr. Sin. 2020, 40, 823–832. [Google Scholar]
- Fang, Z.; Zhang, W.; Wang, L.; Schurgers, G.; Ciais, P.; Peñuelas, J.; Brandt, M.; Yang, H.; Huang, K.; Shen, Q.; et al. Global increase in the optimal temperature for the productivity of terrestrial ecosystems. Commun. Earth Environ. 2024, 5, 466. [Google Scholar] [CrossRef]
- Zhang, S.Z.; Zhu, X.F.; Liu, T.T.; Xu, K.; Guo, R. Response of gross primary production to drought under climate change in different vegetation regions of China. Acta Ecol. Sin. 2022, 42, 3429–3440. [Google Scholar]
- Chen, J.; Yang, H.; Jin, T.; Wu, K. Assessment of terrestrial ecosystem sensitivity to climate change in arid, semi-arid, sub-humid, and humid regions using EVI, LAI, and SIF products. Ecol. Indic. 2024, 158, 111511. [Google Scholar] [CrossRef]
- Zhang, J.G.; Xiao, J.F.; Wang, L.Y.; Tong, X.J.; Zhang, J.S.; Li, J.; Liu, P.R.; Yu, P.Y.; Meng, P. Comparing the performance of phenocam GCC, MODIS GCC, and MODIS EVI for retrieving vegetation phenology and estimating gross primary production. Ecol. Indic. 2024, 166, 112251. [Google Scholar] [CrossRef]
- Aryal, J.; Sitaula, C.; Frery, A.C. Land use and land cover (LULC) performance modeling using machine learning algorithms: A case study of the city of Melbourne, Australia. Sci. Rep. 2023, 13, 13510. [Google Scholar] [CrossRef]
- Shi, H.; Li, L.H.; Eamus, D.; Huete, A.; Cleverly, J.; Tian, X.; Yu, Q.; Wang, S.Q.; Montagnani, L.; VMagliulo, V.; et al. Assessing the ability of MODIS EVI to estimate terrestrial ecosystem gross primary production of multiple land cover types. Ecol. Indic. 2017, 72, 153–164. [Google Scholar] [CrossRef]
- Zhang, Y.; Xiao, X.; Wu, X.; Zhou, S.; Zhang, G.; Qin, Y.; Dong, J. A global moderate resolution dataset of gross primary production of vegetation for 2000–2016. Sci. Data 2017, 4, 170165. [Google Scholar] [CrossRef]
- Jing, Q.; He, J.; Li, Y.; Yang, X.; Peng, Y.; Wang, H.; Yu, F.; Wu, J.; Gong, S.; Che, H.; et al. Analysis of the spatiotemporal changes in global land cover from 2001 to 2020. Sci. Total Environ. 2024, 908, 168354. [Google Scholar] [CrossRef] [PubMed]
- Li, H.; Wu, X.; Ma, D.; Wei, C.; Peng, B.; Du, W. Spatiotemporal variation characteristics and influencing factors analysis of the GPP in the Tibetan Plateau. Remote Sens. Technol. Appl. 2024, 39, 727–740. [Google Scholar]
- Xu, N.; Luo, J.; Ma, R.; Jia, J.; Chen, Y.; Zhou, X. Dynamic change of land use/cover spatial pattern in Yangtze River Delta from 2000 to 2010. Quat. Sci. 2014, 34, 856–864. [Google Scholar]
- Dong, G.; Chen, S.; Liu, K.; Wang, W.; Hou, H.; Gao, L.; Zhang, F.; Su, H. Spatiotemporal variation in sensitivity of urban vegetation growth and greenness to vegetation water content: Evidence from Chinese megacities. Sci. Total Environ. 2023, 905, 167090. [Google Scholar] [CrossRef]
- Xu, Q.C. Spatiotemporal variation of water use efficiency and its influencing factors in arid and semi-arid areas of China. Geogr. Sci. Res. 2021, 10, 126–136. [Google Scholar]
- Xu, Z.; Zhou, G. Responses of photosynthetic capacity to soil moisture gradient in perennial rhizome grass and perennial bunchgrass. BMC Plant Biol. 2011, 11, 21. [Google Scholar] [CrossRef]
- Liu, L.B.; Gudmundsson, L.; Hauser, M.; Qin, D.; Li, S.; Seneviratne, S.I. Soil moisture dominates dryness stress on ecosystem production globally. Nat. Commun. 2020, 11, 4892. [Google Scholar] [CrossRef]
- Yang, M.; Gao, X.; Wang, S.; Zhao, X. Quantifying the importance of deep root water uptake for apple trees’ hydrological and physiological performance in drylands. J. Hydrol. 2022, 606, 127471. [Google Scholar] [CrossRef]
- Knipfer, T. Future in the past: Water uptake function of root systems. Plant Soil 2022, 481, 495–500. [Google Scholar] [CrossRef]

Disclaimer/Publisher’s Note: The statements, opinions and data contained in all publications are solely those of the individual author(s) and contributor(s) and not of MDPI and/or the editor(s). MDPI and/or the editor(s) disclaim responsibility for any injury to people or property resulting from any ideas, methods, instructions or products referred to in the content. |
© 2025 by the authors. Licensee MDPI, Basel, Switzerland. This article is an open access article distributed under the terms and conditions of the Creative Commons Attribution (CC BY) license (https://creativecommons.org/licenses/by/4.0/).
Share and Cite
Lu, Y.; Yu, Y.; Ding, X.; Sun, L.; Li, C.; He, J.; Guo, Z.; Malik, I.; Wistuba, M.; Yu, R. Adaptive Analysis of Ecosystem Stability in China to Soil Moisture Variations: A Perspective Based on Climate Zoning and Land Use Types. Remote Sens. 2025, 17, 1971. https://doi.org/10.3390/rs17121971
Lu Y, Yu Y, Ding X, Sun L, Li C, He J, Guo Z, Malik I, Wistuba M, Yu R. Adaptive Analysis of Ecosystem Stability in China to Soil Moisture Variations: A Perspective Based on Climate Zoning and Land Use Types. Remote Sensing. 2025; 17(12):1971. https://doi.org/10.3390/rs17121971
Chicago/Turabian StyleLu, Yuanbo, Yang Yu, Xiaoyun Ding, Lingxiao Sun, Chunlan Li, Jing He, Zengkun Guo, Ireneusz Malik, Malgorzata Wistuba, and Ruide Yu. 2025. "Adaptive Analysis of Ecosystem Stability in China to Soil Moisture Variations: A Perspective Based on Climate Zoning and Land Use Types" Remote Sensing 17, no. 12: 1971. https://doi.org/10.3390/rs17121971
APA StyleLu, Y., Yu, Y., Ding, X., Sun, L., Li, C., He, J., Guo, Z., Malik, I., Wistuba, M., & Yu, R. (2025). Adaptive Analysis of Ecosystem Stability in China to Soil Moisture Variations: A Perspective Based on Climate Zoning and Land Use Types. Remote Sensing, 17(12), 1971. https://doi.org/10.3390/rs17121971