Abstract
Lightning is one of the most severe natural disasters, characterized by its sudden onset, short duration, and significant damage. Existing quality control (QC) schemes for millisecond-level lightning observation data from a single source are primarily limited by the instrument and equipment, leading to inadequate monitoring, forecasting, and early warning accuracy in severe convective weather. This study proposes a comprehensive QC scheme for lightning location data from the China Meteorological Administration ground-based National Lightning Detection Network (CMA-LDN). The scheme integrates radar composite reflectivity (CREF) and FY-4A cloud-top brightness temperature (TBB), exploring the coupled relationship between lightning activity and severe weather processes. Through experimental analysis of convective processes over different time periods, QC thresholds are established based on the CREF, TBB, and area ratio. In this research, CREF ≥ 10 dBZ, TBB ≤ 270 K, and an 80% area ratio are tuned to filter false signals. Based on the regional threshold and area ratio results, gross error elimination and spatiotemporal clustering are combined to achieve an overall QC rate of 28.7%. The most effective quality control (QC) method is spatial-temporal clustering, achieving a QC efficiency of 20.9%. The processed lightning data are further merged with CREF and generated a 1 km and 6 min resolution lightning location dataset, which significantly improves the accuracy of ground-based lightning detection and supports operational forecasting of severe convective weather.
1. Introduction
Lightning is a physical phenomenon, involving acoustic, optical, and electrical effects, which occurs in the atmosphere during severe convective weather [1,2,3,4]. It has been recognized as one of the “Top Ten Most Severe Natural Disasters” by the United Nations Disaster Reduction Committee [5]. Statistic results indicate that, on average, lightning causes thousands of casualties in China each year, with property losses, such as equipment failures amounting to 7–10 billion yuan [6]. Therefore, it is crucial for safeguarding lives and property to explore lightning activity and further provide forecasting and early warning services based on high-quality monitoring data. On the other hand, it plays a vital role in ensuring the safe and stable operation of critical infrastructure, such as power, aerospace, and petrochemicals.
With the development of lightning detection technology, worldwide large-scale lightning location networks have been established over the past several years. In the early 1980s, Europe was the first to develop a lightning detection network, which covers Europe, South America, and Australia now. This network detects cloud-to-ground (CG) and intra-cloud (IC) flashes through the low-frequency magnetic fields emitted by lightning with a positioning accuracy of up to 150 m [7]. The National Lightning Detection Network (NLDN) in the United States, one of the earliest national lightning monitoring systems, was completed in the late 1980s. It is spanned approximately 3 million km² across North America and used a combination of time-of-arrival and magnetic direction-finding methods to locate return strokes, with a positioning accuracy of about 2 km and a CG flash detection efficiency of more than 90% [8,9]. The World-Wide Lightning Location Network (WWLLN) was jointly developed by the University of Washington in the United States in order to establish a global real-time lightning detection system. It utilizes the Time of Group Arrival method to capture very-low-frequency (VLF) electromagnetic signals (3–30 kHz) emitted during lightning events, and achieves a detection accuracy of approximately 10 km and a time resolution of 30 milliseconds [10]. China’s lightning detection technology has been developing since the late 1980s. Currently, two major regional lightning location networks are in operation: one managed by the Institute of Electrical Engineering of the Chinese Academy of Sciences (IEE/CAS) and the other by the China Meteorological Administration (CMA). The IEE/CAS Lightning Detection Network (LDN) consists of more than 400 short-baseline in very-low-frequency/low-frequency (VLF/LF) three-dimensional (3D) lightning detectors distributed across observation stations throughout China and neighboring Southeast Asian countries. Utilizing a 3D time-difference-of-arrival (TDOA) positioning algorithm, the system determines various physical parameters of lightning events, including occurrence time, type, geographic coordinates (latitude and longitude), altitude, and peak current intensity. It can distinguish between IC and CG lightning, with a horizontal positioning error of approximately 300 m and a vertical error of about 500 m, which tends to be high in monitoring, continuity, and positioning accuracy. The CMA-LDN also comprises over 400 detectors based on time-difference and magnetic finding methods to locate CG lightning in the frequency bandwidth from 1 kHz to 450 kHz, with Advanced Time of Arrival and Direction (ADTD) system lightning detection sensors [11]. The detection range of an ADTD lightning detection sensor is approximately 300 km, and the lightning flash detection efficiency of the CMA-LDN is around 90% with an average location accuracy of 300–500 m. The ADTD lightning monitoring network captures lightning signals by analyzing electromagnetic waveforms and calculates parameters such as occurrence time, geographic coordinates, intensity, and polarity through a multi-station integrated positioning system. However, its detection accuracy is influenced by factors such as the uneven distribution of observation stations, signal attenuation, and transmission noise.
With the advancement of lightning detection and location systems, the demand for high-quality lightning data is increasingly urgent. Quality control is a critical way to improve lightning data quality. However, due to the absence of a “true” value, quality assessment and control of lightning detection data are often conducted through cross-comparison among multiple detection systems. Many researchers have explored methods for lightning data quality control. For instance, Zhang et al. [12] used the spaceborne OTD/LIS system as a reference to compare lightning detection data from the U.S. NLDN system over a half-month period updated in 2013. Their findings indicated that the NLDN’s detection efficiency improved from 42.9% to 48.7%, along with identified contributing factors. Thompson et al. [13] analyzed detection data from the WWLLN, the Earth Networks Total Lightning Network (ENTLN), and the OTD/LIS covered the region of 39°S–39°N and 164°E–17°W. Differences in data consistency and detection efficiency are investigated across seasonal and annual scales for lightning return-stroke peaks occurring between 1 January 2010 and 30 June 2011, based on satellite ground data synchronization analysis.
Yu et al. [14] proposed a clustering method where ground-based lightning return strokes occurring within a spatiotemporal scale of 10 km and 500 ms can be clustered into flashes. China’s research on lightning data quality control techniques started relatively late. In 2019, Pang et al. [15] introduced a quality control method based on the lightning return-stroke, positioning and status data to check extreme values, limit values, and stuck values. This approach enhanced the accuracy of lightning location data but a format check was missed. Based on Bayesian probability theory, Zhang et al. [16] designed a typical false signal filtering algorithm for lightning data. The validation showed that the results was comparable between the WWLLN, FY-2E black body temperature data, and radar echoes during a typical thunderstorm on 8 August 2017. Focused on positioning methods, current intensity, and flash clustering, Yu et al. [14] conducted quality control research on ADTD two-dimensional lightning location data and VLF/LF three-dimensional lightning positioning data. Their results showed that the quality-controlled CG flash data aligned closely with the monthly lightning day distribution and regional lightning density characteristics in Hubei Province. The dataset was further applied to lightning strike risk assessment, lightning accident identification, regional real-time lightning monitoring, and early warning.
However, existing QC methods are not very useful for operational real-time lightning data. Additionally, the QC method is not fully based on a collaborative analysis and comprehensive integration with satellite and weather radar data. Therefore, this paper aims to develop a multi-source-data-based quality control scheme for lightning data comprehensively using satellites and weather radars observations. Key technical parameters will be tuned through an analysis of lightning activity characteristics.
2. Data
The data used in this study include two types of lightning data, along with Doppler weather radar composite reflectivity and FY-4A black body temperature data collected and stored by the meteorological big data cloud platform, managed by the National Meteorological Information Center. Detailed information is provided in Table 1.

Table 1.
List of data information collected in this study.
2.1. Lightning Location Data
Table 1 presents two types of lightning location data used in this study: CMA-LDN and IEE/CAS-LDN. The variables in both datasets are almost similar including lightning occurrence time, geographical information, current intensity, type, longitude, latitude, and height. Prior to 2021, the CMA-LDN primarily relied on the two-dimensional ADTD lightning detection system, which can only detect CG flash data. Since 1 January 2021, the CMA-LDN has been upgraded to a three-dimensional lightning detection system capable of detecting both CG flash and IC flash data. Given the current operational requirements, this paper takes CMA-LDN data as the primary source for analysis. Additionally, IEE/CAS-LDN data are used as the input source to test lightning location data after the quality control process to ensure the effectiveness and accuracy of the proposed QC scheme.
2.2. Radar Data
The CREF product is derived from the Weather Radar Mosaic System V3.0 in CMA [17] which utilizes full-elevation base data from the national 200 weather radars. After undergoing single-station quality control and networking quality control, a national weather radar composite reflectivity product is generated. Single-station quality control includes eliminating faulty or poor-quality images, removing single-polarization ground clutter and super-refraction, eliminating radial interference, noise/isolation points, clear-sky echoes, performing radial velocity de-aliasing, eliminating sea-wave echoes, and removing non-precipitation echoes using dual-polarization data. Networking quality control involves clear-sky echo elimination based on satellite data. The networking mosaic is created using the maximum value method, with a spatial resolution of 1 km and a temporal resolution of 6 min.
2.3. FY-4A Black Body Temperature Data
The observed value of the infrared channel of a meteorological satellite represents the radiation emitted into space by the cloud top and the Earth’s surface in cloud-free or less-cloudy areas. This is typically expressed as TBB. TBB data can provide insights into the presence of clouds and reveal significant characteristics during cloud evolution stages. By using geostationary satellite data with a high spatiotemporal resolution, particularly brightness temperature data, it is possible to observe not only the distribution of large-scale cloud systems but also the entire process of the formation, development, maturity, and dissipation of small- and medium-scale cloud systems [18]. To ensure that the spatiotemporal resolution of TBB data is as close as possible to that of weather radar, this paper uses L2-level full-disk nominal and Chinese region nominal 10.8 μm TBB data from FY-4A. The time resolutions of these datasets are 15 min for full-disk data and 4 min for Chinese region data, with a spatial resolution of 4 km. To match the required resolution, the 4 km TBB data are interpolated to 1 km using the bilinear interpolation method.
3. Comprehensive Quality Control Scheme
Currently, the quality control specifications for CG flashes proposed at the observation end account for only about 10% of the total number of lightning occurrences. In addition, due to various factors such as positioning methods, electromagnetic interference, topography, and data transmission, issues like relatively low lightning detection efficiency and data distortion still persist. Furthermore, lightning occurs instantaneously and suddenly, making traditional quality control schemes for millisecond-level lightning observation data—such as the extreme value, limit value, and stuck value control—inadequate. These methods do not fully account for the complementarity and differences between different lightning observation data. Moreover, millisecond-level lightning observation data show a significant gap in terms of actual application requirements and are primarily applicable to the instrument and equipment side, making it difficult to meet the comprehensive monitoring, forecasting, and early warning needs for severe convective and disastrous weather.
Addressing the urgent challenges of lightning data in current operations, this paper proposes a quality control technology based on regional threshold and area ratio comprehensive inspection, utilizing multi-source data such as satellites and weather radars. The approach involves removing gross errors and applying spatiotemporal clustering to lightning data, resulting in high-quality lightning fusion data products for the Chinese region. The overall technical approach is shown in Figure 1.
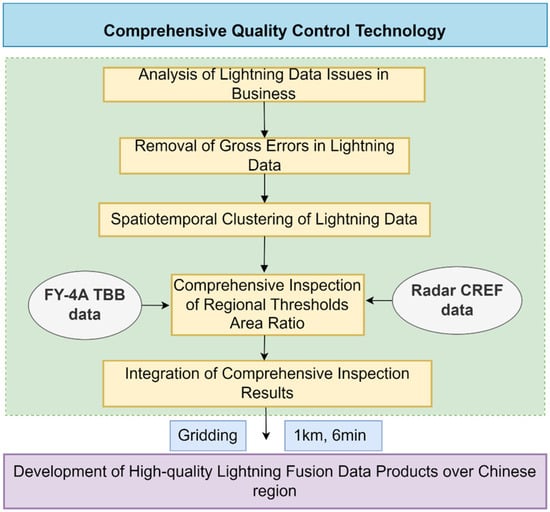
Figure 1.
The flowchart of the comprehensive quality control scheme for lightning location data.
3.1. Gross Error Removal
Traditional quality control schemes for lightning data primarily focus on the observation end, ensuring data quality through a series of detailed inspection processes [15]. The specific inspection steps are as follows:
Format Normativity Inspection: This step strictly reviews the overall structure of the lightning observation data to ensure that each data record meets established field requirements and length standards, thus preventing data parsing errors or information loss.
Limit Value Rationality Verification: For key parameters of lightning events, such as time (year, month, day, hour, minute, second), geographical location (longitude, latitude), and intensity (e.g., return-stroke peak intensity, maximum steepness), checks are made to ensure that these values fall within reasonable ranges. The goal is to eliminate abnormal data that clearly violates natural laws or exceeds instrument measurement capabilities.
Positioning Accuracy Assessment: This step calculates the baseline distance between lightning positioning data and the nearest lightning observation station to identify and flag potential positioning errors caused by long-distance transmission. Specifically, when the baseline distance exceeds 500 km, the data are directly flagged as erroneous. When the positioning error exceeds 200 m, the data are considered suspicious and require further verification or elimination.
However, due to potential errors in the precise position and peak intensity of the original lightning strike data, relying solely on the above quality control scheme is insufficient for high-precision analysis. Therefore, it is necessary to incorporate a more stringent gross error removal strategy while retaining the traditional quality control measures. Specifically, for lightning types with low detection efficiency and significant error increases, such as positive CG flashes with a peak current lower than 15 kA and extreme lightning with an absolute peak current exceeding 300 kA, the gross error removal method is employed to mitigate the adverse effects of such data on overall analysis results [19,20]. Therefore, this paper innovatively integrates gross error removal technology into the traditional quality control scheme, aiming to further enhance the quality control level of lightning data and provide more reliable data support for subsequent lightning research, early warning forecasting, and safety protection.
3.2. Spatiotemporal Clustering Technology of Lightning Data
In lightning monitoring and research, a complete lightning process is often not a single event but consists of multiple continuous or nearly continuous return strokes (i.e., repeated pulses of lightning discharge). To accurately understand and analyze the characteristics and behavior of lightning, it is crucial to perform scientific and effective spatiotemporal clustering on the return-stroke data collected by automatic lightning detection systems [21,22]. Building upon and optimizing previous flash merger methods, this paper proposes a more refined spatiotemporal clustering strategy to more accurately define and identify lightning processes.
There is currently no universally accepted standard about the spatiotemporal clustering of lightning [23,24,25]. Xia et al. [19] followed the attribution principles established by Cummins et al. [26], which specify that the distance between the first and subsequent return strokes should be less than 10 km, the time interval should be less than 1 s, and the interval between adjacent return strokes should be less than 500 ms. Wu et al. [23] classified all radiation sources detected within 1 s and 10 km as a single ground flash. Li et al. [21] further reduced the time threshold for defining a cloud-to-ground flash to 500 ms. Wang et al. [22] suggested that using criteria of less than 10 km in distance and less than 500 ms in time yields relatively reasonable proportions of ground flashes and positive ground flashes. Yu et al. [14] compared these various standards and concluded that the differences in the total number of ground flashes and the ratio of positive ground flashes under different attribution criteria were not significant. In this study, we adopt a relatively lenient criterion of 10 km/s for the spatiotemporal clustering of lightning, primarily due to the fact that the temporal resolution of the available data is limited to the second level—millisecond-level data cannot be obtained due to observational constraints. Moreover, this standard also demonstrates practical feasibility.
Specifically, this strategy first makes judgments based on the physical characteristics of the return strokes: If a return stroke occurs immediately after the first return stroke, both having the same polarity (i.e., both are positive or both are negative), and if the spatial distance between them is less than 10 km, indicating that they occur in similar lightning channels, and the time interval between them is less than 1 s, this ensures that the return strokes are closely connected in time. This condition eliminates the possibility of discharge events that are too scattered being misclassified as part of the same lightning process.
With the above dual criteria, all return strokes that meet the conditions are determined to belong to the same lightning process. This approach not only simplifies the data analysis complexity but also enhances the accuracy and consistency of lightning process identification. In subsequent statistical analysis, to maintain the consistency and representativeness of the data, the first return stroke is selected as the representative of the lightning process, and its key parameters (such as time, position, polarity, intensity, etc.) are recorded for further analysis of lightning activity characteristics, early-warning model construction, and lightning protection design.
Figure 2 illustrates the detailed process of the spatiotemporal clustering technology for lightning data, from the input of original return-stroke data, to screening and merging based on polarity and spatiotemporal intervals, and finally, to the output of clustered lightning process information. The core of this method involves calculating the time difference, distance difference, and polarity product. For the distance difference, we apply the Haversine function, and its calculation formula is as follows:
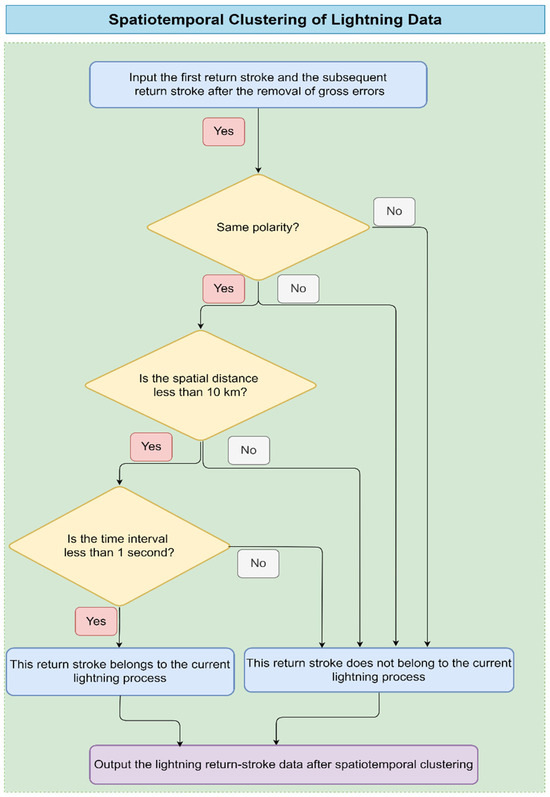
Figure 2.
Flowchart of the spatiotemporal clustering technology for lightning data.
Parameters include the following:
- and are the latitudes of point 1 and point 2 (in radians).
- and are the longitudes of point 1 and point 2 (in radians).
- means the difference in latitudes.
- means the difference in longitudes.
- R represents the Earth’s radius, with a commonly used value of 6371 km.
- d is the resulting distance between the two points.
3.3. Comprehensive Inspection Technology Based on Regional Thresholds and Area Ratio
Based on the correlation between the distribution characteristics of black body temperature in severe convective weather and accompanying lightning activities, as well as the relationship between radar echo intensity variation and lightning occurrence, this study follows the overall approach of “internal consistency inspection of associated meteorological data in the same spatiotemporal interval”. Combining the literature research and case analysis, consistency identification thresholds for multi-source data during severe convective weather processes are selected [27,28,29,30,31]. A fusion processing technology framework for comprehensive inspection based on regional thresholds and area ratios of multi-source data is then designed, as shown in Figure 3.
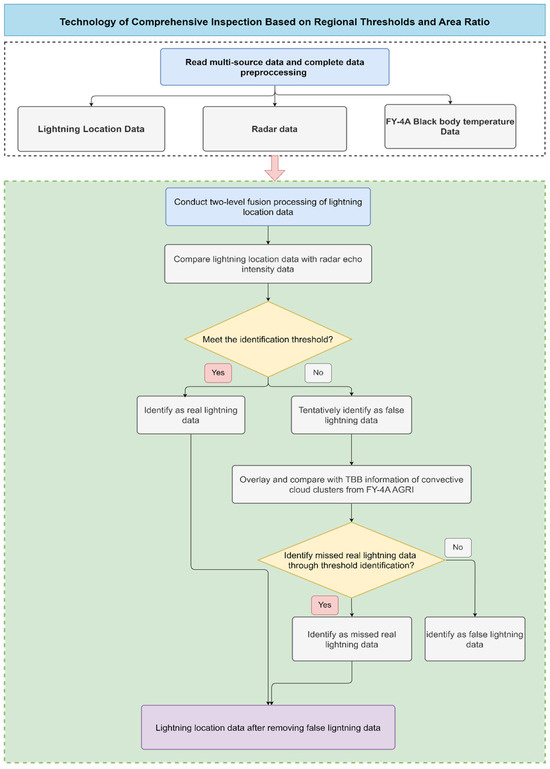
Figure 3.
Flowchart of the fusion processing technology for comprehensive inspection technology based on regional thresholds and area ratio.
First, the required multi-source data are sequentially read according to different storage paths: CMA-LDN data, CREF, and TBB data. Next, data preprocessing is completed. After these tasks are completed, a two-level fusion processing technology for lightning location data is applied. The first level compares the lightning location data with radar echo intensity data from the same weather event. If the identification threshold is met, the data are considered valid lightning data; if not, they are tentatively classified as false lightning data. The processed data are then overlaid and compared with the TBB information of convective cloud clusters provided by the FY-4A AGRI for the same period. Through threshold identification, any real lightning data missed in the earlier detection are identified.
3.4. Selection of Identification Thresholds for Multi-Source Data
Based on an analysis of six representative severe convective weather events in China, Zhu et al. [32] observed that over 90% of lightning activity occurred within regions exhibiting radar echo intensities of ≥35 dBZ. Accordingly, they adopted this threshold as a criterion for quality control (QC) to filter out false lightning signals. By integrating this radar threshold with a brightness temperature (TBB) threshold of 240 K and employing multi-source data verification, their multi-layered QC strategy successfully identified and eliminated approximately 18.67% of false alarm signals from the Lightning Mapping Imager (LMI) observations. The 35 dBZ threshold is generally recognized as the critical level for thunderstorm initiation. When reflectivity exceeds 35 dBZ, it can be identified as a thunderstorm cell, serving as an effective standard for distinguishing convective precipitation from stratiform precipitation [33,34]. Zhu et al. [35] also suggested that the continuous variation characteristics of a 35 dBz or 40 dBz echo on a cold cloud layer should be the focus of lightning proximity prediction. Zhong et al. [36] suggested that lightning is particularly concentrated in areas with radar echoes of 40 dBZ or higher. However, when the echo intensity is below 30 dBZ, the frequency of CG flashes decreases significantly, and it can almost be considered that there is little to no lightning occurrence in these regions. Regarding the TBB threshold for lightning occurrence, studies by Zhang et al. [16] found that over 90% of lightning occurs in regions with aTBB below 240 K, suggesting that areas warmer than 240 K likely contain a higher probability of false-positive lightning signals. Liu et al. [37] further noted that lightning occurrence generally requires a TBB below 253–263 K. Based on an analysis of four typical thunderstorms in China, Tao et al. [38] observed that CG flashes are most concentrated in regions with a TBB < 240 K, with flash frequency decreasing as TBB increases within the 233–263 K range. In summary, this study adopts dual thresholds of 35 dBZ for maximum radar reflectivity and 240 K for minimum TBB to investigate lightning activity characteristics in both weak-echo regions (0–35 dBZ) and relatively warm-cloud areas (240–290 K).
This study focuses on three typical severe convective weather events occurring in the southeastern coastal region of China (22–35°N, 117–130°E) on 31 July, 4 August, and 22 August 2022. For each case, we selected three representative time periods (02:00–05:00, 13:00–14:00, and 20:00–22:00 Beijing Time) to analyze the hourly cumulative probability characteristics of TBB and CREF. The selection of these three time periods is based on the characteristic diurnal variation of lightning activity: 02:00–05:00 represents the nocturnal weak convection phase dominated by radiative cooling, 13:00–14:00 corresponds to the peak period of daytime thermally driven convective development, and 20:00–22:00 captures the frequent occurrence of evening organized severe convection. This classification methodology systematically covers lightning activity peaks associated with different formative mechanisms [39,40].
As shown in Figure 4a, the results indicated that when radar reflectivity was below 10 dBZ, false alarms appeared in weak-echo or echo-free regions within the quality-controlled CG lightning data. Consequently, 10 dBZ was established as the minimum threshold for radar reflectivity. Following this, with the radar reflectivity threshold fixed at 10 dBZ, a second test was conducted to identify the optimal TBB threshold, as also illustrated in Figure 4b, by varying the TBB range from 240 K to 290 K. It was observed that when the TBB exceeded 270 K, false alarms occurred in warm-cloud regions within the quality-controlled data. Therefore, 270 K was established as the maximum threshold for TBB.
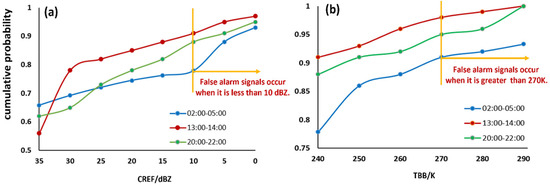
Figure 4.
The cumulative probability curves of hourly (a) radar echo values across different time periods (with TBB set to 240 K) and (b) TBB values across different time periods (with radar echo set to 10 dBZ).
In summary, based on the experimental results from different convective processes, the final quality control thresholds for eliminating false alarms in CG flashes were determined as a radar echo intensity of 10 dBZ and a TBB value of 270 K.
4. Quality Control Results and Verification
4.1. Overall Evaluation of Quality Control Effect
Since lightning detection networks lack absolute “ground truth” data, direct validation remains challenging [10]. Intercomparison between independent lightning detection networks is the primary validation approach, as no single system provides absolute truth [11]. Therefore, our quality evaluation relies on cross-comparisons between independent lightning datasets. As presented in the Introduction, China operates two mature nationwide lightning detection networks: the CMA-LDN and the IEE/CAS-LDN. Both systems consist of over 400 stations across China and are widely used in operational and research applications. While they differ technically, for instance, the IEE/CAS-LDN utilizes advanced waveform processing algorithms, whereas the CMA-LDN emphasizes operational stability, their high consistency in spatiotemporal patterns supports their mutual reliability. In this study, the IEE/CAS-LDN data serve as reference observations to evaluate the quality-controlled CMA-LDN data through comparative analysis.
Figure 5a shows the spatial distribution of CG flash density across the national region in the summer of 2022 (June–August). The figure reveals that the areas with the highest CG flash density are located in the southeast coastal region, including Zhejiang and Anhui. The maximum density reaches 10.8 flashes·km−2 in northern Zhejiang. Other regions with relatively high flash densities include Guangxi and Jiangxi, with an average of 7.6 flashes·km−2. The average density in provinces such as Shandong, Fujian, Hunan, Guangxi, and Hainan is 3.8 flashes·km−2, while most northern provinces show a density of less than 2 flashes·km−2.
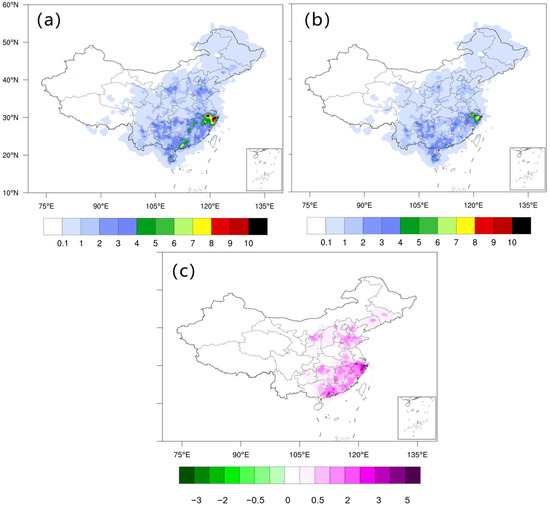
Figure 5.
The spatial distribution of CG flash density in China during the summer of 2022 (June–August) (Unit: flashes·km−2): (a) original observations; (b) after comprehensive quality control; (c) deviation between original observations and quality-controlled data.
Figure 5b presents the spatial distribution of CG flash density across the Chinese region after comprehensive quality control in the summer of 2022. The figure shows that high-density areas remain in the southeast coastal region, with the maximum density now at 10.4 flashes·km−2. Compared to the pre-quality control data, the overall CG flash density has decreased. Figure 5c illustrates the deviation in CG flash density before and after comprehensive quality control. It can be observed that the deviation in regions such as Zhejiang and Anhui, with high flash densities, is approximately 5 flashes·km−2, indicating that many false alarm signals were present before quality control and have been effectively addressed. Additionally, the deviation in areas like Shandong, Fujian, Hunan, Guangxi, and Hainan is around 0.5–2 flashes·km−2, demonstrating that false alarm signals in these regions have also been successfully mitigated.
Figure 6 illustrates the change in lightning occurrence frequency across China during the summer of 2022. It presents the total, positive, and negative CG flash frequencies under different quality control schemes (original observation, business quality control, gross error removal, spatiotemporal clustering, and regional threshold area ratio).
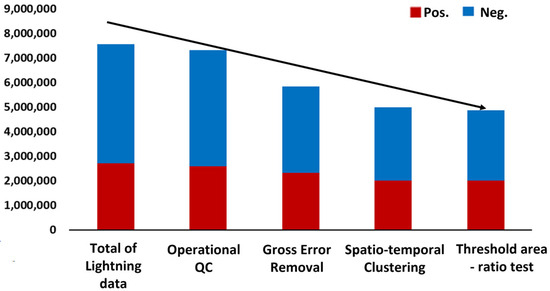
Figure 6.
Distribution of changes in lightning occurrence frequency over China in the summer of 2022 under different quality control schemes.
In the original observations, there were 7.62 million total CG flashes, including 2.73 million positive and 4.89 million negative flashes, with positive flashes accounting for 35.8%. After applying business quality control, the total number of flashes decreased to 7.40 million, with 2.62 million positive and 4.78 million negative flashes, and the proportion of positive flashes reduced slightly to 35.4%. The quality control ratios were 2.4% for total flashes, 4% for positive flashes, and 2.2% for negative flashes. After gross error removal, the total number of flashes was reduced to 5.90 million, including 2.34 million positive and 3.56 million negative flashes, with positive flashes now accounting for 40%. The quality control ratios were 19.6% for total flashes, 14.3% for positive flashes, and 27.2% for negative flashes. Following spatiotemporal clustering, the total number of flashes decreased further to 5.05 million, with 2.03 million positive and 3.02 million negative flashes. The proportion of positive flashes increased slightly to 40.2%, with quality control ratios of 11.2% for total flashes, 13.2% for positive flashes, and 15.2% for negative flashes.
Finally, after applying regional threshold area ratio quality control, the total number of flashes dropped to 4.92 million, with 2.02 million positive and 2.90 million negative flashes. The proportion of positive flashes reached 41%, and the quality control ratios were 1.6% for total flashes, 0.5% for positive flashes, and 4.0% for negative flashes.
In conclusion, traditional business quality control has limited effectiveness in managing the CG flash data at the original observation end, addressing only about 2.4% of invalid observation data. By applying methods such as gross error removal, spatiotemporal clustering, and the regional threshold area ratio, the quality control of CG flash observation data can be improved to varying degrees. Among these, gross error removal demonstrates the highest effectiveness, achieving a quality control ratio of approximately 20%, with the quality control ratio for negative CG flashes reaching about 40%. Spatiotemporal clustering offers a quality control ratio of around 10%, while the regional threshold area ratio provides a more modest improvement, quality controlling approximately 2% of invalid CG flash observation data.
4.2. Comparison with Similar Lightning Observation Data
This study integrates IEE/CAS-LDN data and compares the deviations between the CMA-LDN data before and after quality control with those from the Institute. The objective is to assess the effectiveness of the quality control scheme.
Figure 7a illustrates the spatial distribution of deviations in CG flash density between the original CMA-LDN observations and those from the IEE/CAS-LDN during the summer of 2022 (June–August) across China. The figure shows significant deviation in Zhejiang and southern Anhui, where the original CMA-LDN CGCG flash observations exceed those of the Institute by approximately 6 flashes·km−2. In Yunnan and Guangxi, there is also an excess of about 3.5–4 flashes·km−2. Conversely, in regions such as Fujian and Guangdong, the original CMA CG flash observations are lower than those of the Institute by approximately 1.5 flashes·km−2.
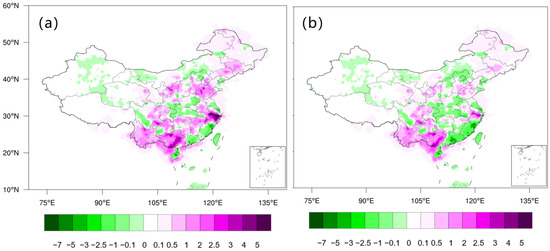
Figure 7.
Spatial distribution of the deviation in CG flash density (flashes·km−2) over China during the summer of 2022 (June–August) between (a) the original CMA-LDN and IEE/CAS-LDN data and (b) quality-controlled CMA-LDN and IEE/CAS-LDN data.
Figure 7b presents the spatial distribution of deviations in CGCG flash density between the quality-controlled CMA-LDN data and those from the Institute during the same period. When analyzed alongside Figure 5, it is evident that in areas with large initial deviations, such as Zhejiang and southern Anhui, the deviation decreases to 1.8 flashes·km−2 after quality control. However, the quality-controlled CMA-LDN CG flash density remains about 2 flashes·km−2 higher than that of the Institute in Zhejiang, southern Anhui, and other regions. Similarly, in Yunnan and Guangxi, the quality-controlled CMA data exceed those of the Institute by approximately 1.5–2 flashes·km−2. In Fujian and Guangdong, the quality-controlled CMA CG flash density decreases by around 1.5 flashes·km−2.
Figure 8 illustrates the distribution of changes in lightning occurrence frequency across China during the summer of 2022 (June–August). As shown in the figure, the IEE/CAS-LDN data recorded 4.07 million CG flashes during this period. Before quality control, the CMA-LDN data recorded 7.62 million CG flashes, which was approximately 3.50 million more than the observations from the Institute of Electrical Engineering. This difference included about 1.90 million more negative CG flashes and approximately 1.60 million more positive CG flashes. Both systems exhibit a dominant proportion of negative cloud-to-ground flashes (−CG) and a relatively lower proportion of positive cloud-to-ground flashes (+CG), which aligns with the typical statistical characteristics of global lightning activity [41].
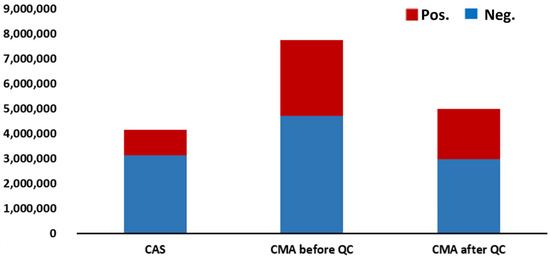
Figure 8.
The variation distribution of the summer lightning occurrence frequencies across the country in 2022 (from June to August) before and after quality control of the IEE/CAS-LDN and CMA-LDN data. Red represents positive lightning and blue represents negative lightning.
After applying the comprehensive quality control scheme based on multi-source data, the deviation in the total number of CG flashes between CMA-LDN and IEE/CAS-LDN data was significantly reduced. Following quality control, the total number of CG flashes recorded by the CMA-LDN decreased to 4.92 million, which was approximately 800,000 more than the observations from IEE/CAS-LDN data. Among them, the number of negative CG flashes was reduced by approximately 150,000, while the number of positive CG flashes increased by about 1 million. For negative cloud-to-ground flashes (-CG), the data volumes from the two systems converge (difference < 5%), indicating that quality control effectively eliminates random discrepancies between the systems. For positive cloud-to-ground flashes (+CG), the CMA-LDN still records significantly more events than the IEE/CAS-LDN (approximately 1.8 times higher). Zhang et al. [42] indicated that this discrepancy primarily stems from the higher sensitivity of the upgraded CMA-LDN system, which enables the detection of weaker lightning signals. Notably, the detection efficiency for +CG flashes has improved substantially compared to the pre-upgrade performance, and the overall detection efficiency for cloud-to-ground flashes can reach up to 100%. Therefore, we conclude that the higher +CG count in the post-quality-control CMA-LDN data compared to IEE/CAS-LDN data is reasonable and that the processed CMA-LDN data more accurately reflect the true distribution of cloud-to-ground lightning.
In summary, compared with the data from the IEE/CAS-LDN, the comprehensive quality control technology effectively removes false alarms in regions with a high CG flash density. Additionally, in areas with a low CG flash density, this quality control method does not result in excessive data filtering.
4.3. Inspection of Local Severe Convective Processes
This study examines a large-scale heavy rainfall event that occurred in northern and southeastern Guangxi on 1 July 2022, influenced by Typhoon Chaba, to analyze the associated local severe convective processes.
Figure 9 depicts the spatial distribution of CREF at 18:00 on 1 July 2022, along with FY-4A TBB and original CG flash observations from the preceding six minutes. The figure shows that most CG flashes are concentrated in areas of strong radar echoes and cold clouds. Statistical analysis indicates that the total number of CG flashes in this region within six minutes reached 115. However, some CG flashes were detected in non-echo and warm-cloud areas, which are considered false alarms and require removal through quality control.
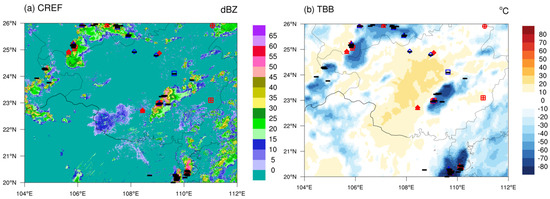
Figure 9.
Spatial distribution of (a) CREF and (b) TBB with CG lightning observations within the preceding six minutes at 18:00 Beijing Time on 1 July 2022. The “+” and “−” symbols denote positive and negative CG flashes, respectively. “○” represents CG flashes selected by conventional operational quality control, “□” indicates CG flashes screened by gross error removal quality control, “△” marks CG flashes identified through spatiotemporal clustering, and “◇” shows CG flashes filtered by regional threshold area ratio quality control. The black markers denote authentic lightning signals that passed comprehensive quality control, while the red and blue markers represent false lightning signals identified through comprehensive QC, specifically positive CG (red) and negative CG (blue) flashes, respectively.
In Figure 9, the “○” symbols represent CG flashes selected by conventional operational QC. The spatial distribution of CG flashes shows minimal changes before and after this QC process, with only one flash being identified in the upper right corner. Statistical analysis indicates that the total number of CG flashes in this region reached 114 within the six-minute period, yielding a quality control ratio of approximately 0.87%. However, false alarm data persist in non-echo and warm-cloud areas, demonstrating the relatively limited effectiveness of conventional quality control methods. The “□” symbols represent CG flashes screened by gross error removal QC. Statistical analysis shows that the total number of CG flashes in this region was 110 within the six-minute period, corresponding to a quality control ratio of 2.7%. The “△” symbols represent CG flashes identified through spatiotemporal clustering. Statistical analysis indicates that the total number of CG flashes in this region decreased to 87 within the six-minute period, achieving a quality control ratio of 20.9%. The “◇” symbols represent CG flashes filtered by the regional threshold area ratio quality control. These flashes are predominantly concentrated in non-echo or warm-cloud areas, with a majority being negative CG flashes. Statistical analysis indicates that the total number of CG flashes in this area within six minutes was reduced to 82, with a quality control ratio of 5.7%. This suggests that for CG flash observations in weak-echo, non-echo, and warm-cloud areas, traditional quality control methods—including gross error removal and spatiotemporal clustering—have limited effectiveness. However, the quality control approach that combines threshold identification with CREF and TBB proves to be effective.
In summary, the conventional operational QC, gross error removal, and spatiotemporal clustering methods prove effective for processing CG lightning observation data in severe convective and cold-cloud areas. However, their effectiveness in eliminating false alarm data from non-echo and warm-cloud regions remains relatively limited. Further research demonstrates that the integrated application of conventional operational QC, gross error removal, spatiotemporal clustering, and regional threshold area ratio QC methods significantly improves lightning location data quality. The overall QC ratio reaches approximately 28.7% (with spatiotemporal clustering alone contributing more than 20%). Notably, the regional threshold area ratio method proves effective in removing false signals in weak-echo and non-echo areas.
5. Discussion
This study is based on lightning data from the CMA-LDN. By integrating radar echo intensity and TBB data from the FY-4A satellite, a comprehensive quality control methodology for ground-based lightning detection utilizing multi-source data is proposed. Through the analysis of typical cases, distinct identification thresholds for multi-source data are established. By comparing and validating the results against lightning data from the Chinese Academy of Sciences, the identification thresholds are iteratively refined, and the algorithm is continuously optimized until convergence, thereby preventing “excessive quality control”. However, given the substantial variability across different cases, the established quality control thresholds are applicable only to the sample data in this study. To enhance the flexibility and scientific rigor of the algorithm, the program parameters can be modified to allow the independent adjustment of quality control thresholds based on the characteristics of different weather events, with verification conducted accordingly.
5.1. Uncertainties in Spatiotemporal Clustering Criteria Selection
The study employs specific spatiotemporal clustering criteria to group lightning events, but the selection of these standards introduces inherent uncertainties. For example, the spatial radius (e.g., 10 km) and temporal window (e.g., 1 s) used to define “clusters” are empirically determined based on conventional meteorological observation scales. However, such fixed thresholds may not fully account for regional variations in lightning activity patterns—for instance, intense convective systems in tropical regions may exhibit more concentrated spatial distributions, while mid-latitude thunderstorms could produce scattered discharges over broader areas. Additionally, the temporal clustering window might miss short-duration but high-intensity lightning bursts (e.g., intra-cloud lightning flashes occurring within milliseconds) or incorrectly merge unrelated events separated by brief intervals. These uncertainties could lead to biases in cluster characterization, such as overestimating or underestimating the frequency of multi-stroke events. Future research should explore adaptive clustering algorithms that incorporate real-time radar or satellite-derived convective parameters (e.g., updraft velocity, cloud top height) to dynamically adjust spatiotemporal thresholds.
5.2. Uncertainties in Threshold-Based Filtering
The multi-source data thresholding approach (e.g., radar reflectivity ≥ 10 dBZ, TBB ≤ 270 K) used for quality control and event classification introduces another layer of uncertainty. For example, While our methodology effectively filters out noise by excluding lightning signals in regions with radar echoes below 10 dBZ, we acknowledge a potential limitation regarding bolt-from-the-blue (BFB) lightning events. These rare but physically significant discharges can occur 10–30 km away from parent convective clouds [43] and may consequently be excluded by our echo-intensity threshold. Statistical analyses suggest that BFB events represent only 0.5–1% of total cloud-to-ground flashes in midlatitude regions [44], implying minimal impact on our overall results. Similarly, the TBB threshold for distinguishing lightning-prone clouds may fail in regions with unique microphysical properties, such as high-altitude ice clouds in the Tibetan Plateau that exhibit warmer TBB values but still support intense lightning [22]. These limitations highlight the trade-off between threshold simplicity and meteorological complexity. Sensitivity analyses (e.g., varying thresholds by ±5–10% and evaluating impacts on results) should be conducted in future studies to quantify uncertainty ranges and improve threshold robustness.
5.3. Limitations of the 2022 Summer (June–August) Study Period
The focus on lightning data from June to August 2022 introduces temporal and climatic constraints. This period represents the peak of the East Asian summer monsoon, characterized by concentrated convective activity in southern and eastern China. While this allows for a robust analysis of typical summer thunderstorms, it excludes seasonal variations in lightning behavior—such as springtime frontal storms in central China or winter lightning in southern coastal regions. For instance, winter lightning events often occur under distinct thermodynamic conditions (e.g., stronger vertical wind shear, lower freezing levels) that may violate the assumptions of the current quality control framework. Additionally, the single-year dataset limits the ability to assess interannual variability, such as the influence of El Niño/La Niña cycles on lightning frequency and morphology. To address these limitations, future research should expand the dataset to include multi-year observations and extend analyses to cover all seasons, enabling a more comprehensive evaluation of the methodology’s performance across climatic contexts.
5.4. Integrated Application of Space-Based and Ground-Based Multi-Source Lightning Observation Technologies
Furthermore, in addition to ground-based observations, space-based observations provide an alternative means of monitoring lightning activity. The Lightning Mapping Imager (LMI) onboard the FY-4A satellite is China’s first space-borne lightning optical observation payload, representing a globally advanced capability. It primarily detects lightning using optical filtering and image fusion techniques, enabling long-term continuous monitoring of lightning activity across China and its surrounding regions [45,46,47]. The LMI provides total lightning data with high temporal resolution and broad spatial coverage [48]. Since the LMI captures lightning from cloud tops and is not influenced by terrain constraints, it offers comprehensive lightning observations for oceanic regions that lack ground-based detection systems and mountainous areas where terrain-induced detection gaps exist [49].
In light of this, future quality control processes for multi-source ground-based lightning observation data should incorporate high-quality space-based lightning data from the FY-4A LMI as a key validation source [50,51]. This integration would not only mitigate the limitations of single-source data but also leverage the advantages of diverse observational platforms, thereby enhancing the effectiveness of lightning data in supporting early warning systems and forecasting services for severe weather events.
6. Conclusions
The study presented a comprehensive quality control framework for lightning location data from the CMA-LDN, aiming to enhance data reliability by leveraging the relationship between lightning activity and severe weather phenomena. The main conclusions are summarized as follows:
- Traditional business-quality control methods exhibit limited efficacy in handling CG flash data at the initial observation stage, addressing only approximately 2.4% of invalid data. By integrating radar composite reflectivity (CREF) and FY-4A cloud-top brightness temperature (TBB), specific quality control thresholds were established: a CREF of 10 dBZ, a TBB threshold of 270 K, and an area ratio threshold of 80%. The proposed quality control framework, which incorporates gross error elimination, spatiotemporal clustering, and the regional threshold area ratio method, effectively filters out false signals, achieving an overall quality control rate of approximately 28.7%. Among these methods, spatiotemporal clustering proved to be the most effective, with a success rate of 20.9%, while the regional threshold area ratio method demonstrated significant effectiveness in eliminating false signals in regions with weak or no radar echoes.
- By integrating lightning data from the IEE/CAS-LDN and comparing deviations in CMA-LDN data before and after quality control, the study successfully evaluated the proposed quality control scheme. Spatial distribution analysis of CG flash density deviations between the original CMA-LDN data and the IEE/CAS-LDN data for the summer of 2022 (June–August) revealed notable disparities in regions such as Zhejiang, Anhui, Yunnan, Guangxi, Fujian, and Guangdong. Following quality control, these deviations were significantly reduced. The overall deviation in the total number of CG flashes between CMA-LDN and IEE/CAS-LDN data was markedly minimized. Notably, the number of negative flashes decreased, while the number of positive flashes increased. This indicates that the comprehensive quality control methodology effectively eliminates false alarms in high-density regions and avoids excessive filtering in low-density areas, thereby improving the reliability of the CMA-LDN data.
- For CG flash observation data in regions with weak echoes, no echoes, or warm clouds, traditional operational quality control methods, combined with gross error elimination and spatiotemporal clustering, showed limited effectiveness. However, quality control through threshold identification, which integrates radar composite reflectivity and satellite TBB for screening and elimination, effectively removed false signals from lightning location data. Specifically, the regional threshold area ratio quality control method proved to be highly effective in eliminating false signals in weak or non-echo regions, significantly improving the reliability of lightning location data in complex meteorological conditions.
After the quality control process, the lightning location data were aggregated and clustered to generate a high-resolution (1 km, 6 min) lightning location dataset for China. This refined dataset significantly enhances the accuracy and reliability of ground-based lightning detection, providing a valuable foundation for severe convective weather forecasting, early warning systems, and disaster management. Future research should focus on further improving lightning data assimilation and integrating it with numerical weather prediction models to enhance forecasting capabilities. Additionally, expanding the quality control framework to incorporate machine learning techniques may further improve the efficiency and accuracy of false signal identification and removal.
Author Contributions
Conceptualization, Y.S. and Y.X.; methodology, Y.X.; formal analysis, Y.X. and Y.S.; resources, Y.S.; data curation, Y.X.; writing—original draft preparation, Y.X.; writing—review and editing, Y.S., X.J., F.T., L.C. and N.W.; funding acquisition, Y.X., Y.S., and X.J. All authors have read and agreed to the published version of the manuscript.
Funding
This research was funded by the China Meteorological Administration Innovation and Development Special Project (CXFZ2025Q005), the National Key Research and Development Program of China (2024YFB3910000), and the National Meteorological Information Centre Youth Innovation Team for 3D Atmospheric Visualization Services and Applications (NMIC-2024-QN01).
Data Availability Statement
No new data were created or analyzed in this study. Data sharing is not applicable to this article.
Acknowledgments
We acknowledge any support given which is not covered by the author contribution or funding sections. This may include administrative and technical support, or donations in kind (e.g., materials used for experiments).
Conflicts of Interest
The authors declare no conflicts of interest.
Abbreviations
The following abbreviations are used in this manuscript:
| QC | Quality Control |
| CMA-LDN | China Meteorological Administration Lightning Detection Network |
| IEE/CAS-LDN | Institute of Electrical Engineering of the Chinese Academy of Sciences Lightning Detection Network |
| WWLLN | World-Wide Lightning Location Network |
| ADTD | Advanced Direction Finding on Time Difference |
| 3D | Three-Dimensional |
| IC | Intra Cloud |
| CG | Cloud to Ground |
| TDOA | Time Difference of Arrival |
| CREF | Composite Reflectivity |
| TBB | Black Body Temperature |
| VLF/LF | Very Low Frequency/ Low Frequency |
| BFB | Bolt-from-the-Blue |
References
- Christian, H.J.; Goodman, S.J. Optical Observations of Lightning from a High-Altitude Airplane. J. Atmos. Ocean. Technol. 1987, 4, 701–711. [Google Scholar] [CrossRef]
- Mach, D.M.; Christian, H.J.; Blakeslee, R.J.; Boccippio, D.J.; Goodman, S.J.; Boeck, W.L. Performance assessment of the Optical Transient Detector and Lightning Imaging Sensor. J. Geophys. Res. Atmos. 2007, 112, D09210. [Google Scholar] [CrossRef]
- Williams, E.R. The global electrical circuit: A review. Atmos. Res. 2009, 91, 140–152. [Google Scholar] [CrossRef]
- Zhang, P.; Liu, W.; Zhang, C.; Ming, S.; Dong, L. Observation Characteristics of FY-4A Lightning Mapping Imager During a Severe Rainfall. Meteorol. Mon. 2021, 47, 1391–1401. [Google Scholar] [CrossRef]
- Yang, S.; Zhao, G.; Pan, S.; Zhao, C.; Zhu, Y.; Hu, J.; Wang, C.; Gao, X.; Zhang, W. Spatio-temporal Distribution Characteristics and Early Warning of Lightning Disasters in China. J. Nat. Disasters 2010, 19, 153–159. [Google Scholar]
- Zhang, W.; Meng, Q.; Ma, M.; Zhang, Y. Lightning casualties and damages in China from 1997 to 2009. Nat. Hazards 2011, 57, 465–476. [Google Scholar] [CrossRef]
- Betz, H.D.; Schmidt, K.; Laroche, P.; Blanchet, P.; Oettinger, W.P.; Defer, E.; Dziewit, Z.; Konarski, J. LINET—An international lightning detection network in Europe. Atmos. Res. 2009, 91, 564–573. [Google Scholar] [CrossRef]
- Cummins, K.L.; Murphy, M.J. An Overview of Lightning Locating Systems: History, Techniques, and Data Uses, With an In-Depth Look at the U.S. NLDN. IEEE Trans. Electromagn. Compat. 2009, 51, 499–518. [Google Scholar] [CrossRef]
- Biagi, C.J.; Cummins, K.L.; Kehoe, K.E.; Krider, E.P. National Lightning Detection Network (NLDN) performance in southern Arizona, Texas, and Oklahoma in 2003–2004. J. Geophys. Res. Atmos. 2007, 112, D05208. [Google Scholar] [CrossRef]
- Thomas, R.J.; Krehbiel, P.R.; Rison, W.; Hunyady, S.J.; Winn, W.P.; Hamlin, T.; Harlin, J. Accuracy of the Lightning Mapping Array. J. Geophys. Res. Atmos. 2004, 109, D14207. [Google Scholar] [CrossRef]
- Zhang, Y.; Zhang, Y.; Zou, M.; Wang, J.; Li, Y.; Tan, Y.; Feng, Y.; Zhang, H.; Zhu, S. Advances in Lightning Monitoring and Location Technology Research in China. Remote Sens. 2022, 14, 1293. [Google Scholar] [CrossRef]
- Zhang, D.; Cummins, K.; Nag, A.; Murphy, M.; Bitzer, P. Evaluation of the National Lightning Detection Network Upgrade Using the Lightning Imaging Sensor. In Proceedings of the 24th International Lightning Detection Conference & 6th International Lightning Meteorology Conference, San Diego, CA, USA, 18–21 April 2016. [Google Scholar]
- Thompson, K.B.; Bateman, M.G.; Carey, L.D. A Comparison of Two Ground-Based Lightning Detection Networks against the Satellite-Based Lightning Imaging Sensor (LIS). J. Atmos. Ocean. Technol. 2014, 31, 2191–2205. [Google Scholar] [CrossRef]
- Yu, R.; Du, M.; Yan, Z.; Mei, C. Comparative analysis of cloud-ground flash data of two lightning location networks in Hubei Province. Torrential Rain Disasters 2021, 40, 646–654. [Google Scholar] [CrossRef]
- Pang, W. A Quality Control Method and System for Lightning Data. CN201910780343.7, 30 May 2025. [Google Scholar]
- Zhang, X.; Zhang, Q.; Zhang, X.; Chen, Y.; Lian, C.; Wang, L. Filtering of False Signals in Fengyun-4A Lightning Mapping Imager Based on Bayesian Inference. Sci. Technol. Eng. 2019, 19, 23–32. [Google Scholar]
- Liang, H. Weather Radar Puzzle System; Meteorological Observation Center of China Meteorological Administration: Beijing, China, 29 August 2022.
- Fu, B.; Yue, Y.; Li, G. TBB Data Processing and Application. Meteorol. Mon. 2006, 32, 40–45. (In Chinese) [Google Scholar]
- Xia, R.; Zhang, D.-L.; Wang, B. A 6-yr Cloud-to-Ground Lightning Climatology and Its Relationship to Rainfall over Central and Eastern China. J. Appl. Meteorol. Climatol. 2015, 54, 2443–2460. [Google Scholar] [CrossRef]
- Yang, X.; Sun, J.; Li, W. An Analysis of Cloud-to-Ground Lightning in China during 2010–13. Weather Forecast 2015, 30, 1537–1550. [Google Scholar] [CrossRef]
- Jingxiao, L.I.; Fengxia, G.U.O.; Haibo, H.U.; Rujian, L.I.; Muhui, Q.; Wenan, X. Comparative Analysis of SAFIR and ADTD Lightning Location Data over Beijing and Its Circumjacent Regions. Plateau Meteorol. 2017, 36, 1115–1126. [Google Scholar]
- Wang, D.; Qie, X.; Yuan, S.; Sun, Z.; Chen, Z.; Li, J.; Zhang, H.; Liu, M.; Srivastava, A.; Liu, D. Spatial and Temporal Distribution of Lightning Activity and Contribution of Thunderstorms with Different Lightning-Producing Capabilities in Beijing Metropolitan Region. Chin. J. Atmos. Sci. 2020, 44, 225–238. [Google Scholar] [CrossRef]
- Wu, F.; Cui, X.; Zhang, D.L.; Liu, D.; Zheng, D. SAFIR-3000 Lightning Statistics over the Beijing Metropolitan Region during 2005–07. J. Appl. Meteorol. Clim. 2016, 55, 21. [Google Scholar] [CrossRef]
- Dongxia, L.I.U.; Xiushu, Q.I.E.; Yajun, X.; Guili, F. Evolution of the Total Lightning Activity in a Leading-Line and Trailing Stratiform Mesoscale Convective System over Beijing. Adv. Atmos. Sci. 2011, 28, 866–878. [Google Scholar] [CrossRef]
- Srivastava, A.; Tian, Y.; Qie, X.; Wang, D.; Sun, Z.; Yuan, S.; Wang, Y.; Chen, Z.; Xu, W.; Zhang, H.; et al. Performance assessment of Beijing Lightning Network (BLNET) and comparison with other lightning location networks across Beijing. Atmos. Res. 2017, 197, 76–83. [Google Scholar] [CrossRef]
- Cummins, K.L.; Murphy, M.J.; Bardo, E.A.; Hiscox, W.L.; Pyle, R.B.; Pifer, A.E. A Combined TOA/MDF Technology Upgrade of the U.S. National Lightning Detection Network. J. Geophys. Res. Atmos. 1998, 103, 9035–9044. [Google Scholar] [CrossRef]
- Yi, X.; Sun, X.; Zhang, Y.; Guo, L.; Wang, Y. Evolution of radar parameters and lightning activity during thunderstorm cells merging. Acta Meteorol. Sin. 2017, 75, 981–995. [Google Scholar] [CrossRef]
- Sun, M.; Qie, X.; Sun, L.; Liu, D.; Wang, D.; Yuan, S.; Chen, Z.; Xu, W.; Sun, C.; Su, D. Lightning Activity of a Severe Thunderstorm with Several Hail-Fall Stages in Beijing Metropolitan Region. Chin. J. Atmos. Sci. 2020, 44, 601–610. [Google Scholar] [CrossRef]
- Zhou, J.; Wang, Z.; Feng, M.; Shen, G.; Cheng, L.; Zhang, Y. Application of Atmospheric Electric Field Data on Lightning Prediction Around Nanjing. Plateau Meteorol. 2013, 32, 1470–1477. [Google Scholar]
- Liu, P.; Yang, Y.; Xin, Y.; Wang, C. Impact of Lightning Data Assimilation on Forecasts of a Leeward Slope Precipitation Event in the Western Margin of the Junggar Basin. Remote Sens. 2021, 13, 3584. [Google Scholar] [CrossRef]
- Ma, R.; Zheng, D.; Zhang, Y.; Yao, W.; Zhang, W.; Zhu, B. Thunderstorms with Extreme Lightning Activity in China: Climatology, Synoptic Patterns, and Convective Parameters. Remote Sens. 2024, 16, 4673. [Google Scholar] [CrossRef]
- Zhu, J.; Chen, P.; Tang, S.; Wang, B. Research on quality control technology of Chinese satellite-based lightning data based on multi-source data. Sci. Technol. Eng. 2022, 22, 11783–11791. (In Chinese) [Google Scholar]
- Steiner, M.; Houze, R.A.; Yuter, S.E. Climatological Characterization of Three-Dimensional Storm Structure from Operational Radar and Rain Gauge Data. J. Appl. Meteorol. Climatol. 1995, 34, 1978–2007. [Google Scholar] [CrossRef]
- Karunarathna, N.; Marshall, T.C.; Karunarathne, S.; Stolzenburg, M. Initiation locations of lightning flashes relative to radar reflectivity in four small Florida thunderstorms. J. Geophys. Res. Atmos. 2017, 122, 6565–6591. [Google Scholar] [CrossRef]
- Zhu, J.; Xie, L.-Y.; Gao, Z.-N.; Zhang, J.; Xu, B.-L. Analysis of new generation weather radar echo and lightning approach warning of thunderstorm cloud. J. Yunnan Univ. Nat. Sci. Ed. 2020, 42, 916–925. [Google Scholar] [CrossRef]
- Ying, Y.; Feng, M.; Jiao, X.; Miao, F. Lightning and Echo Characteristics of Two Thunderstorm Processes. Meteorol. Sci. Technol. 2012, 40, 620–626. [Google Scholar]
- Liu, X.; Kang, N.; Zhang, Q.; Liu, C. Analysis of Activity Characteristics of Satellite-to-Ground Lightning Detection in A Mesoscale Convective System. Meteorol. Sci. Technol. 2023, 51, 14–21. [Google Scholar]
- Tao, X. Research on the Characteristics of the Strong Convective System in the Yunnan Plateau and Its Relationship with Lightning Activities. Master’s Thesis, Nanjing University of Information Science and Technology, Nanjing, China, 2020. [Google Scholar] [CrossRef]
- Qie, X.; Toumi, R.; Yuan, T. Lightning activities on the Tibetan Plateau as observed by the lightning imaging sensor. J. Geophys. Res. Atmos. 2003, 108, 4551. [Google Scholar] [CrossRef]
- Hidayat, S.; Ishii, M. Diurnal variation of lightning characteristics around Java Island. J. Geophys. Res. Atmos. 1999, 104, 24449–24454. [Google Scholar] [CrossRef]
- Rakov, V.A.; Uman, M.A. Lightning: Physics and Effects; Cambridge University Press: Cambridge, UK, 2003. [Google Scholar]
- Zhang, D.; Wang, M.; Shen, Z.; Wang, D. Data quality analysis and evaluation of DDW1 lightning locator. Meteorol. Hydrol. Mar. Instrum. 2024, 41, 13–16. [Google Scholar]
- Uman, M.A.; Rakov, V.A. The interaction of lightning with airborne vehicles. Prog. Aerosp. Sci. 2003, 39, 61–81. [Google Scholar] [CrossRef]
- Li, M.; Cheng, S.; Wang, J.; Cai, L.; Fan, Y.; Cao, J.; Zhou, M. Thunderstorm total lightning activity behavior associated with transmission line trip events of power system. NPJ Clim. Atmos. Sci. 2024, 7, 148. [Google Scholar] [CrossRef]
- Yang, J.; Zhang, Z.; Wei, C.; Lu, F.; Guo, Q. Introducing the New Generation of Chinese Geostationary Weather Satellites, Fengyun-4. Bull. Am. Meteorol. Soc. 2017, 98, 1637–1658. [Google Scholar] [CrossRef]
- Cao, D.; Lu, F.; Zhang, X.; Yang, J. Lightning Activity Observed by the FengYun-4A Lightning Mapping Imager. Remote Sens. 2021, 13, 3013. [Google Scholar] [CrossRef]
- Hui, W.; Zhang, W.; Lyu, W.; Li, P. Preliminary Observations from the China Fengyun-4A Lightning Mapping Imager and Its Optical Radiation Characteristics. Remote Sens. 2020, 12, 2622. [Google Scholar] [CrossRef]
- Chen, Z.; Qie, X.; Sun, J.; Xiao, X.; Zhang, Y.; Cao, D.; Yang, J. Evaluation of Fengyun-4A Lightning Mapping Imager (LMI) Performance during Multiple Convective Episodes over Beijing. Remote Sens. 2021, 13, 1746. [Google Scholar] [CrossRef]
- Li, P.; Zhai, G.; Pang, W.; Hui, W.; Zhang, W.; Chen, J.; Zhang, L. Preliminary Research on a Comparison and Evaluation of FY-4A LMI and ADTD Data through a Moving Amplification Matching Algorithm. Remote Sens. 2021, 13, 11. [Google Scholar] [CrossRef]
- Zou, M.; Zhang, Y.; Fan, Y.; Wang, J.; Zhang, H. Performance Evaluation of LMI Based on Low-Frequency Three-Dimensional Total Lightning Flash Location Data. Remote Sens. 2024, 16, 244. [Google Scholar] [CrossRef]
- Ni, X.; Hui, W.; Zhang, Q.; Huang, F.; Liu, C. Comparison of Lightning Detection Between the FY-4A Lightning Mapping Imager and the ISS Lightning Imaging Sensor. Earth Space Sci. 2021, 8, e2020EA001099. [Google Scholar] [CrossRef]
Disclaimer/Publisher’s Note: The statements, opinions and data contained in all publications are solely those of the individual author(s) and contributor(s) and not of MDPI and/or the editor(s). MDPI and/or the editor(s) disclaim responsibility for any injury to people or property resulting from any ideas, methods, instructions or products referred to in the content. |
© 2025 by the authors. Licensee MDPI, Basel, Switzerland. This article is an open access article distributed under the terms and conditions of the Creative Commons Attribution (CC BY) license (https://creativecommons.org/licenses/by/4.0/).