Abstract
Forest cover dynamics are studied on a routine basis, but how changes in forest cover impact forest fragmentation has rarely been studied over a long time period resolution. This is, however, important because forest fragmentation critically impacts ecosystem services, such as biodiversity and cooling effects. Here, we apply a long time series of Landsat images from 1986–2018 and study how forest fragmentation has changed along with forest cover dynamics in southern China. Furthermore, we attribute drivers and study the impact on local air temperature changes. The region is particularly relevant as it was largely deforested three decades ago, and most of the current forests are the result of protection and forestation measures. We found a reduction in the forest fragmentation index FFI (−34.4%) from 1986 to 2018. In 81.2% of the area, forest cover increased and fragmentation decreased, while 18.5% of the area showed increases in both forest cover and fragmentation. The contribution of human activities to forest fragmentation increased by 9%, with a distinct spatial correlation between areas of increasing forest fragmentation and high levels of human disturbance. Furthermore, we found that the average level of cooling effects in areas with increased forest cover of less than 40% is heavily dominated by forest fragmentation, whereas the cooling effects are primarily controlled by changes in forest cover. These findings underscore the role of human disturbance in driving forest fragmentation, which in turn affects the functioning of forest ecosystems. The results emphasize the need for integrated land management strategies that balance forest restoration with the mitigation of human-induced fragmentation to sustain ecosystem services in the face of ongoing environmental change.
1. Introduction
Forests play a vital role in maintaining biodiversity, regulating climate and water cycles, and providing abundant ecological services to human society [1,2,3]. Over recent decades, significant efforts in afforestation, reforestation, and natural regeneration have contributed to forest increases in various regions [4,5]. However, with global population growth and increasing economic activities, some forests have undergone considerable deforestation. Afforestation and deforestation both affect the spatial distribution of forests and can lead to forest fragmentation, that is, the formation of isolated and discontinuous forest patches [6,7,8]. Those forest patches often exhibit a low biomass carbon [9,10], may contribute to biophysical warming [11,12], have limited value habitat value for wildlife [13,14,15], and are low in biodiversity [6,16,17]. Therefore, studying forest cover changes and related fragmentation dynamics is essential for understanding the interactions between human activities and the natural environment and for formulating forest management policies.
Importantly, forests with similar coverage may differ significantly in fragmentation severity, depending on how patches are spatially arranged—some forming large, contiguous cores, and others consisting of scattered, isolated fragments. Understanding the spatial configuration of forest patches is thus essential for evaluating the ecological restoration outcomes. Morphological classification approaches, such as morphological spatial pattern analysis, can identify these spatial structures, enabling a deeper insight of structural fragmentation complexity and patch aggregation [18,19]. While MSPA and related techniques have been widely applied to prioritize conservation areas, optimize the spatial layout of protected zones, and improve urban ecological networks [18,19,20,21], their application to evaluate the structural outcomes of forestation efforts remains limited.
Southern China has seen a considerable increase in forest coverage in recent years, mainly due to the large number of ecological restoration projects since the 1990s [22,23,24] and enhanced management practices [25]. However, with human management driving forest increases in this region, the forest landscape patterns have also undergone complex changes. Although existing studies indicate an increase in forest area [26] and a global study at a 5 km resolution has found a decline in fragmentation in this region after 2000 [27], regional studies at a finer spatial resolution studying dynamics in forest fragmentation over a longer time period are rare. Moreover, driving mechanisms of changes in forest fragmentation are rarely studied, particularly under varying intensities of human activities and natural environmental conditions. Finally, the role of newly planted forests, how they contribute to fragmentation and regulate the local climate, remains under explored.
In this study, we analyze forest cover changes and how this impacts forest fragmentation dynamics by integrating Landsat images from 1986 to 2018 and forest landscape metrics. By using a forest fragmentation index (FFI), we quantified changes in forest metrics such as edge density, patch density, and mean patch area. Additionally, we integrated multidimensional environmental data related to climate, soil, topography, and human activities to reveal the main drivers of forest fragmentation and their spatiotemporal evolution patterns. Specifically, this study aims to: (1) quantify changes in forest cover and forest fragmentation over three decades, (2) study relative contributions and trends of climate, soil, topography, and human activities to forest fragmentation, and (3) evaluate the cooling effects associated with forest cover and fragmentation changes.
2. Materials and Methods
This study aims at revealing forest dynamics over three decades at a 3 × 3 km resolution for southern China using the Landsat data archive. We analyzed forest cover changes though annual forest cover maps from 1986 to 2018 and evaluated forest fragmentation dynamics by quantifying changes in forest edge density, patch density, and mean patch area. We then trained Random Forest models to evaluate the relative importance of different environmental and human factors on the spatial distribution of forest fragmentation for 2002 and 2018. The influence of forest dynamics on local temperature changes measured by the difference in mean annual air temperature between 1986 and 2018 was investigated.
2.1. Study Area
This study was conducted in Southern China, including Sichuan, Chongqing, Yunnan, Guizhou, Guangxi, Guangdong, Hunan, and Hubei provinces (97°21′−117°19′E, 20°513′−34°19′N) (Figure 1). The study area covers a total area of 1.96 million km2, with a population of 509 million people recorded in 2023. Southern China is characterized by a subtropical climate with warm, monsoon-influenced, and humid conditions. The annual temperature varies between −14 °C and 25 °C, and rainfall ranges from 518 mm to 2235 mm. The topography of southern China is diverse, including hills, mountains, basins, and plains, with elevations ranging from −146 m to 7439 m above sea level. After two decades of restoration efforts, forest cover in Southern China has strongly increased considerably [26].
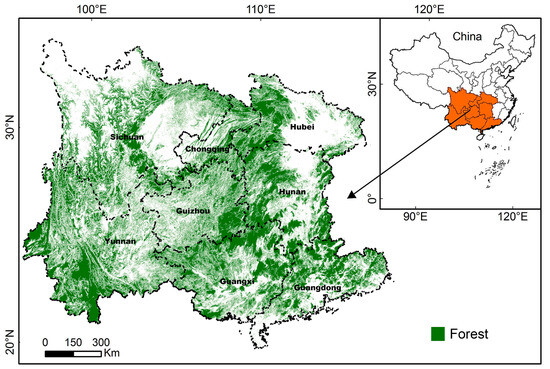
Figure 1.
Location of the study area. Forest map in southern China from Tong et al. (2023) [26].
2.2. Data and Methodology
2.2.1. Metrics for Forest Cover and Forest Fragmentation
We utilized annual binary forest cover maps available at a resolution of 30 × 30 m for 1986–2018 from Tong et al. [26] to detect forest cover changes. These maps were developed using a Random Forest regression model based on Landsat satellite images and validated with field plots and sub-meter Gaofen satellite data. For this study, we aggregated forest cover at a 3 × 3 km grid level for each year and categorized forest cover into four classes: low (≤20%), moderate (20–40%), high (40–60%), and very high (>60%). Forest cover changes were assessed by calculating the per-grid differences over different periods. Using morphological spatial pattern analysis (MSPA), we classified the pixels of each image from 1986 to 2018 into core, edge, bridge, branch, core-opening, islet, loop, perforation, and border-opening [28,29]. The MSPA results enabled us to determine whether forest increase primarily occurred as expansions of core areas, edge growth, or the emergence of isolated patches.
We selected 1986, 2002, and 2018 as representative years for assessing long-term forest fragmentation dynamics. These years were chosen based on the availability of high-quality, cloud-free Landsat imagery and their correspondence with key ecological policy phases in China. However, some components of the analysis, such as the assessment of human disturbance impacts using Random Forest models, were conducted using only data from 2000 onward. This was due to limited availability or temporal coverage of key ancillary datasets (e.g., road networks, land use, socioeconomic variables) before 2000. We thus adopted a tiered approach to data integration, balancing long-term trend analysis with data-driven model reliability.
We used the forest fragmentation index (FFI) based on three forest pattern metrics: edge density (ED), patch density (PD), and mean patch area (MPA), following the methodology of Ma et al. [27]. The metrics were calculated as shown in Equations (1)–(3).
where eik is the total forest edge length (m) and ni is the number of forest patches within a grid. “A” is the total size of a grid (m2), and AREA [patchij] is the size of each patch (ha). We then normalized the three metrics and derived the forest fragmentation index (FFI) with an equal weight for each metric, following Equation (4).
To ensure temporal consistency across the time series, we applied a fixed normalization framework based on the combined inter-quartile range (IQR) and value distribution of 1986, 2002 and 2018. The first (Q1) and third (Q3) quadrilles and the corresponding IQR thresholds were computed from the pooled datasets of each metric (ED, PD, MPA). These thresholds were then used to define upper and lower limits for normalization. This approach prevents bias from inter-annual variability and ensures comparability across the time series.
where k is the year, and EDnor, PDnor and MPAnor are the normalized metrics. FFIk is the index for year k ranging from 0 to 1. We further quantified dynamics in forest fragmentation by calculating the per-grid difference in FFI (ΔFFI) between 1986 and 2018. We defined distinct changes larger than 0.01 as a forest fragmentation increase and less than −0.01 as a forest fragmentation decrease, while a change ranging between −0.01 and 0.01 was defined as no distinct change. Our analysis focuses on 3 × 3 km grids with forest coverage greater than 3% in 1986, 2002, and 2018 (n = 77,301), excluding grids with less forests from further evaluation.
2.2.2. Random Forest
We systematically evaluated the drivers of forest fragmentation using a Random Forest regression model with 10-fold cross-validation to ensure model robustness. The analysis assessed the relative importance of multiple explanatory variables—including human activities, topographic features, climatic conditions, and soil properties—on the forest fragmentation index (FFI) in our study area. Prior to model implementation, we conducted variance inflation factor (VIF) analysis to eliminate variables with VIF values exceeding 10, thereby minimizing multidisciplinary among predictors and improving model interpret ability (Table S1). The number of decision trees in the forest was set to 400 to enhance model stability through collective decision-making, while the maximum depth of individual trees was limited to 20 levels to strike a balance between expressive power and overfitting risk.
Furthermore, partial dependence plots were generated to examine the marginal effects of individual predictors on forest fragmentation patterns while controlling for other variables. This comprehensive analytical framework enabled us to: (1) identify the key drivers of forest fragmentation, (2) assess their relative contributions, and (3) characterize the response relationships between predictive factors and fragmentation intensity.
2.2.3. Environmental Data
We integrated a set of environmental data to identify the drivers of forest fragmentation, including climatic, soil and topographic variables (Table 1). Original climate data with a 1 km resolution were resampled to a 3 × 3 km spatial resolution using the bilinear interpolation method. Soil properties and topographic variables (e.g., slope and aspect) derived from a digital elevation model were aggregated at the 3 × 3 km grid level by calculating mean values. Human footprint index (HFI) data with a 1 km spatial resolution were used as an indicator of human pressures on the environment. These data generated by using eight variables (e.g., built environment, population density, nighttime lights, cropland, pasture, roads, railways, and navigable waterways) were used to reflect different levels of human disturbance [30]. In particular, we classified human disturbances as very low (≤1), low (1–4), moderate (4–8), high (8–15), and very high (>15) [31,32].

Table 1.
List of datasets used for driving factors analysis.
3. Results
3.1. Forest Changes During 1986–2018
The forested area in Southern China has increased from 169,374 km2 in 1986 to 725,028 km2 in 2018 (18,269.7 km2 yr−1, p < 0.001) (Figure 2a). This expansion corresponds to an increase in forest cover from 7.71% to 33.02%. At the 3 × 3 km grid level, we observed a substantial shift from low forest cover dominance (FC ≤ 20%, 64%) in 1986 to high cover dominance in 2018 (Figure 2b). These numbers highlight a strong increase in both forest area and overall forest cover over the study period.
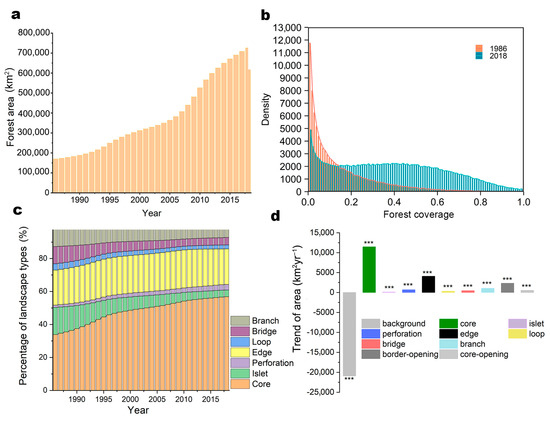
Figure 2.
Forest dynamics in Southern China 1986−2018. (a) Area changes of forest during 1986−2018. (b) Frequency plot of forest cover in 1986 and 2018. (c) Area changes of different forest types during 1986−2018. (d) Area changes of different forest types. Asterisks indicate that the trend is statistically significant with p < 0.001 (***).
We classified forest patches according to their connectivity (Table S2) (Figure 2c), and found all forest types showed significant increases during 1986–2018. Core forests had the strongest increase, expanding at a rate of 11,459 km2 yr−1 (Figure 2d), reflecting the transformation of various forest types into core forest areas as the forested areas increased (Table S3).
3.2. Spatiotemporal Dynamics of Forest Fragmentation
We then studied forest fragmentation dynamics, reflected by the forest fragmentation index FFI and its changes (ΔFFI), at a 3 × 3 km grid level for 1986, 2002, and 2018. Our data show an increasing trend in both mean edge density (+12.9 m ha−1) and mean patch size (+13 ha), but a decline in patch density (−4.9 number ha−1) (Figure 3a). The FFI values showed an overall reduction by 34.4%, with average FFI values decreasing from 0.64 ± 0.13 (mean ± standard deviation) in 1986 to 0.42 ± 0.19 in 2018 (Figure 3b). A pronounced reduction of 41% was observed in the proportions of grids with relatively high forest fragmentation (FFI > 0.6), accompanied by an increase in the number of grids having a relatively low forest fragmentation (FFI < 0.4, +34%) (Figure 3b). Overall, our results suggest a trend toward less fragmented and more contiguous forest landscapes in southern China in the last three decades.
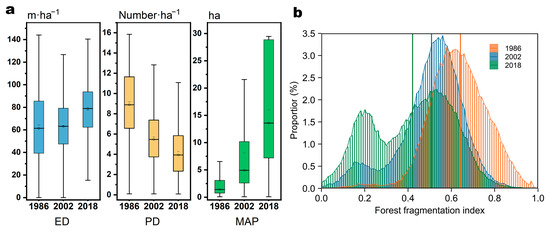
Figure 3.
Changes in forest fragmentation index. (a) The bar plots with error bars represent the mean and 95% confidence interval for edge density (ED), patch density (PD), and mean patch area (MAP). (b) Frequency plot of forest fragmentation index in 1986, 2002, and 2018; the vertical lines denote the mean forest fragmentation index values.
Large spatial variations in forest fragmentation were observed across the study area (Figure 4a–c). We then studied forest fragmentation dynamics based on changes in FFI between 1986 and 2018. Our results show that regions (represented by 3 × 3 km grids) with a decreased FFI (approximately 557,262 km2) accounted for 80.1%. Areas with an increased FFI represented 16.9% (approximately 117,574 km2), while areas of no distinct change covered 3.0% of the study area (Figure 4e). Notably, increased forest fragmentation was primarily concentrated in western Guizhou, east Yunnan, and southeastern Sichuan (Figure 4d). We further explored transitions in forest fragmentation during the study period by grouping FFI according to the level of fragmentation (high >0.8, moderately high 0.6–0.8, moderate 0.4–0.6, low 0.2–0.4, very low <0.2). Based on the proportion in transitions of forest fragmentation during 1986 and 2018, we found about 64.5% of the areas with high forest fragmentation and 43.1% of the areas with moderately high forest fragmentation areas have changed to low forest fragmentation levels during 1986–2018 (Figure 4f, Table S4). In contrast, more than 95.8% of the areas with very low forest fragmentation remained unchanged. The strongest transitions were observed in areas with moderate forest fragmentation, where 29.7% have changed to low or very low forest fragmentation and 23.4% to moderately high or high forest fragmentation (Figure 4f, Table S4).
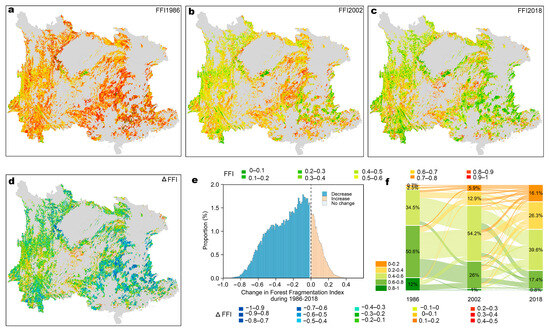
Figure 4.
Spatial patterns of forest fragmentation shown by FFI values across the study area. (a) 1986, (b) 2002, (c) 2018 and (d) FFI changes between 1986 and 2018. (e) Frequency plot of increase and decrease in forest fragmentation during 1986–2018; the vertical dashed line represents no change in FFI. (f) Transitions of forest fragmentation (grouped into intervals of 0.2 of FFI value) from 1986 to 2018 at 3 × 3 grids level.
Moreover, we overlaid maps of changes in forest cover and forest fragmentation between 1986 and 2018 to further explore forest dynamics. Our data show that 81.2% of the 3 × 3 km grids exhibited both increased forest cover and decreased forest fragmentation (Figure 5a,b). This pattern indicates that newly planted forests often reduce forest fragmentation by connecting existing forests. However, we also found that for 18.5% of the grids both forest cover and forest fragmentation increased, primarily distributed in regions where forest is mixed with other land use types, such as agriculture and settlements. This may be related to newly established forests forming small, isolated patches, with limited connectivity leading to a more fragmented forest landscape. At the provincial level, we further compared the proportion of forest areas that experienced FFI decline and forest cover increase both within and outside ecological restoration zones. Notably, provinces such as Hubei, Guangxi, Chongqing, and Guangdong showed higher proportions within restoration areas compared to those outside, suggesting spatial variation in restoration effectiveness (Table S5).
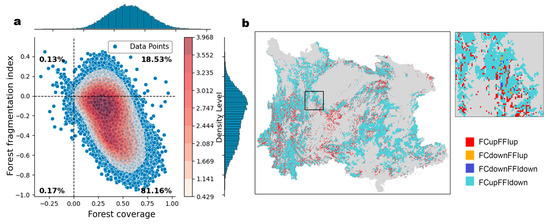
Figure 5.
Forest dynamics defined by the changes in forest fragmentation index (FFI) and forest coverage (FC). (a) This two-dimensional kernel density distribution plot depicts the relationship between forest coverage (horizontal axis) and forest fragmentation index (vertical axis). The dots in the plot represent the observed samples, and the intensity of the color indicates the density of the samples, with darker red signifying a higher sample density. The blue histograms correspond to the frequency distribution graphs for each axis. The percentage figures in the plot indicate the proportion of samples within each quadrant of the overall dataset. The first, second, third, and fourth quadrants in the plot represent areas with FCupFFIup, FCdownFFIup, FCdownFFIdown, and FCupFFIdown. The marks of “up” and “down” after FFI or FC represent an increase and decrease during 1986–2018. (b) Spatial distribution of four forest dynamic patterns. The detail enlargement at the upper right represents the region indicated by the black frame in the main diagram.
3.3. Driving Factors of Changes in Forest Fragmentation
We then studied how different environmental factors, including geographic variations in climate, soil properties, topographic conditions and human activities impact the spatial variability of forest fragmentation in 2002 and 2018 by training Random Forest (RF) models. The RF model explains on average 53% of the spatial variability in forest fragmentation (Figure 6a). In general, human activities (e.g., human pressures and tree planting), soil properties (e.g., soil thickness), and topographic conditions (e.g., slope) have a stronger explanatory power for the observed forest fragmentation in both years, surpassing the influence of climatic factors. Importantly, we found that the primary drivers of forest fragmentation have shifted from natural environmental conditions in 2002 to a greater dominance of human activities in 2018. Specifically, the contribution of human activities increased (+9%), while the influence of soil properties and topographic conditions exhibited minimal changes.
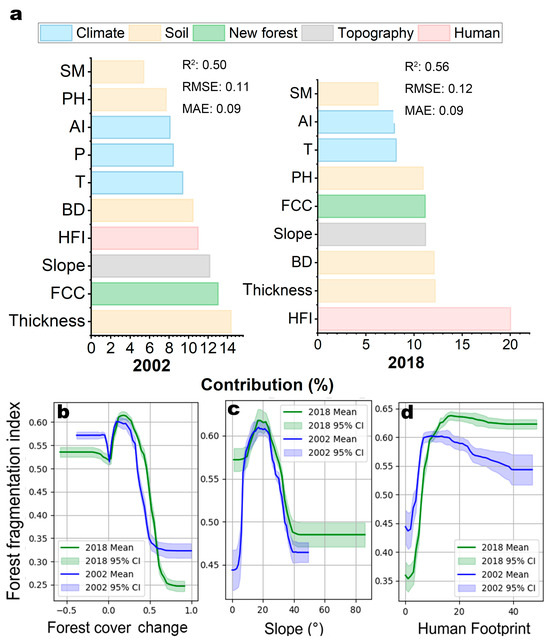
Figure 6.
(a) The relative importance of predictor variables (Table 1) controlling the spatial variability of forest fragmentation in 2002 (left) and 2018 (right). (b–d) Partial dependency plots of three variables explaining variability in forest fragmentation for 2002 and 2018. The blue and green lines are smoothed representations of the responses, with fitted values (model predictions based on the original data), and the shaded areas represent 95% confidence intervals (CI).
To further elucidate the individual effects of each variable independent of others, we quantified their specific contributions to forest fragmentation patterns in 2002 and 2018. We demonstrate the impacts of three key factors—forest cover change, slope, and human footprint—in Figure 6b–d. Forest cover change was associated with reduced fragmentation when newly established forests exceeded 20% of the landscape, highlighting the effectiveness of substantial afforestation (Figure 6b). Slope had a positive effect on fragmentation below 20° in 2002, shifting to a 10° threshold by 2018, likely due to plantation and farmland expansion on steeper terrain (Figure 6c). Human footprint showed a saturating positive effect. In 2002, the impact plateaued beyond a value of 9; by 2018, this shifted to 19, indicating growing tolerance of fragmentation to human pressure (Figure 6d).
We then analyzed the relationship between the human footprint index (HFI) and forest fragmentation dynamics. Our results indicate that areas with increasing forest fragmentation are primarily concentrated in regions with high (8–12) and very high (>15) levels of human disturbance, accounting for 54.88% and 19.41%, respectively (Figure 7a,b). In contrast, areas with decreasing forest fragmentation are mainly distributed in regions with moderate (4–8) and high (8–12) levels of human disturbance, accounting for 42.73% and 42.32%, respectively (Figure 7c,d). Additionally, regions with HFI ≤ 4 account for 4.19% and 8.37% of areas with increasing and decreasing forest fragmentation, respectively, indicating that these low human disturbance areas have a minimal impact on forest fragmentation.
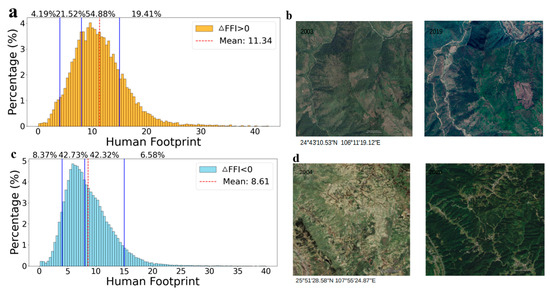
Figure 7.
(a) Frequency plot of human footprint index in areas with an increasing forest fragmentation, illustrated in (b). (c) Frequency plot of human footprint index in areas with a decreasing forest fragmentation, illustrated in (d).
3.4. Local Climate Cooling Effects Associated with Forest Fragmentation Changes
To investigate how forest dynamics affect the local climate, we used the difference in mean annual air temperature between 1986 and 2018 as a measure of local temperature change. Overall, areas with increased forest cover showed the lowest air temperature increase (0.54 ± 0.40 °C, n = 181,471), compared to areas with no forest change (0.75 ± 0.25 °C, n = 14,633) and areas with decreased forest cover (0.72 ± 0.45 °C, n = 968) (Figure 8a), supporting that increases in forest cover reduce the rate of air temperature warming. However, forest fragmentation may also influence the cooling potential related to changes in forest cover. We analyzed the absolute changes in annual air temperature over 33 years in areas (3 × 3 km grids) where the forest fragmentation index (FFI) increased, decreased, or showed no changes under similar levels of forest cover changes. Our results show that for the areas characterized by small increases in forest cover (<20%), the air temperature increase is lower in areas with increased forest fragmentation than in areas where forest fragmentation decreased (Figure 8b). The same pattern was observed in areas with moderate increases in forest cover (20–40%) (Figure 8c). In contrast, for areas with strong increases in forest cover (>40%), regions with decreased fragmentation show a slightly higher cooling effect on local air temperature (Figure 8d). Our results suggest that the average level of cooling effects in areas with increased forest cover less than 40% is heavily dominated by forest fragmentation, whereas the cooling effects are primarily controlled by changes in forest cover.
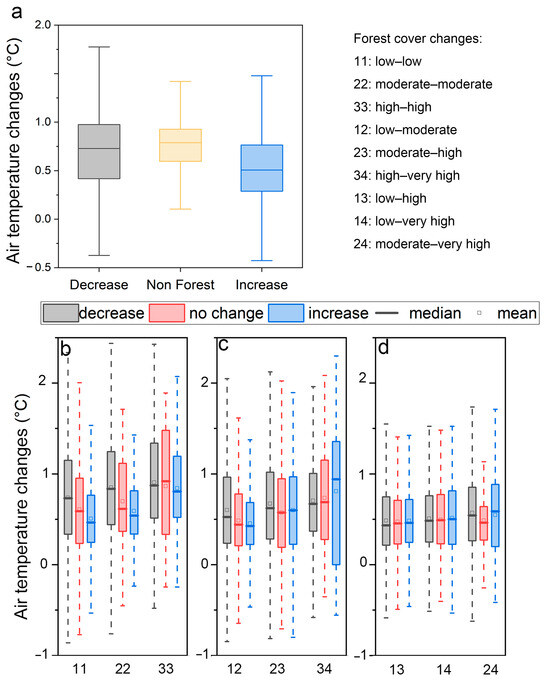
Figure 8.
(a) Temperature variations across non-forest regions and areas experiencing forest cover changes. Gray: forest cover decrease, blue: forest cover increase, yellow: non-forest areas. (b–d) Comparison of air temperature changes under different levels of forest cover increase and forest fragmentation dynamics. We aggregated forest cover at a 3 × 3 km grid level for each year and categorized forest cover into four classes: low (≤20%), moderate (20–40%), high (40–60%), and very high (>60%). Grey, red, and blue represent a decrease, no change, and an increase in the forest fragmentation index (FFI).
4. Discussion
In this study, we examined long-term changes in forest fragmentation across southern China over the past three decades. Compared to previous studies [27], our analysis provides a more spatially detailed perspective (3 × 3 km resolution) using long-term Landsat imagery (30 m), better capturing fragmentation patterns in this highly heterogeneous region. Our results reveal a widespread trend of declining forest fragmentation across southern China, largely driven by forest cover expansion under extensive afforestation programs. These landscape-scale changes suggest that newly planted forests have not only increased forest area but also contributed to decrease the proportion of isolated patches. Morphological spatial pattern analysis (MSPA) further supported this interpretation, showing transitions from fragmented edges to aggregated core areas in many locations—indicative of more ecologically meaningful structural recovery. Nonetheless, not all forest cover increases led to reduced fragmentation. Regions with increased forest fragmentation are mostly located in landscapes where afforestation occurs alongside agriculture, settlement expansion, or other human related land uses. In such settings, newly established forests are often scattered and spatially constrained, forming small patches rather than large contiguous forest. This suggests that forest expansion alone may not be sufficient for achieving restoration goals. Planning efforts must also account for the spatial configuration of forest patches to avoid creating small, disconnected fragments with limited ecological value [38]. In addition, structural indicators such as fragmentation level and patch connectivity should be incorporated into restoration monitoring frameworks to better evaluate ecological outcomes beyond simple forest area gains.
While forest gain has contributed to reduced fragmentation overall, we observed strong spatial heterogeneity in the outcomes of afforestation. In provinces such as Hubei, Guangdong, and Guangxi, the restoration zones showed relatively higher proportions of grids with increased forest cover and reduced fragmentation (Table S5). In contrast, areas with intense agricultural expansion or urbanization—notably western Guizhou, eastern Yunnan, and southeastern Sichuan—continued to exhibit high or increasing fragmentation [39]. These contrasting patterns likely reflect the combined influence of initial fragmentation levels and concurrent human disturbance. Regions with high baseline fragmentation may exhibit greater structural recovery potential, since baseline forest fragmentation patterns are often shaped by local topography and stable vegetation structure [40], whereas ongoing human pressure can undermine restoration gains. The spatial mismatch between these two drivers may explain why restoration outcomes vary across space despite similar afforestation efforts.
Previous studies have highlighted the cooling benefits of forest expansion, often relying on land surface temperature and space-for-time substitution methods without capturing long-term fragmentation dynamics [41,42]. Here, we extend these insights by analyzing decades air temperature changes alongside forest cover and fragmentation trajectories. Consistent with prior findings [43,44,45], areas with increased forest cover generally experienced lower warming rates. However, the degree of cooling was also shaped by fragmentation dynamics and land context. In high forest cover areas, reduced fragmentation was associated with greater cooling, likely due to the enhanced evapotranspiration from contiguous forest blocks. In contrast, in low forest cover environments such as urban and agricultural areas, stronger cooling was observed in grids with increased fragmentation. This may reflect the high thermal contrast in these settings, where scattered forests can produce disproportionate microclimate benefits. This may reflect the high thermal contrast in these settings, where scattered forests can produce disproportionate microclimate benefits. These results underscore the need to consider both forest amount and configuration when designing restoration strategies to optimize climate mitigation. We also note that our analysis focused on long-term temperature change at a coarse scale, which may smooth fine-scale microclimate responses.
Finally, while our analysis integrated high-resolution remote sensing and Random Forest models to identify key drivers of fragmentation, several limitations remain. Firstly, our forest fragmentation index (FFI) was constructed using equal weights for three normalized metrics. Although this ensured consistency across years, it may oversimplify ecological variation among indicators. Future research could explore data-driven weighting methods such as PCA [46,47] to refine index construction. Integrating additional metrics such as landscape connectivity could further enhance the ecological relevance of the assessment and better capture forest functional landscape structure during afforestation. Secondly, we examined human impacts on forest fragmentation, however, the specific mechanisms linking different types of disturbance to fragmentation require further study across forest types. Moreover, we found a pattern that the increased forest fragmentation shows a higher cooling effect on local air temperature, but the magnitude and mechanism of the cooling effects remains unknown and should be explored in future studies.
5. Conclusions
This study revealed the spatiotemporal evolution and driving mechanisms of forest fragmentation in southern China by integrating multi-source data and Random Forest models at a 3 × 3 km grid level. The results indicate that human disturbance is the primary driver of forest fragmentation, particularly in areas with strong human activities. Although overall forest cover has increased, fragmentation remains severe in some regions, or even increased. Our study provides the opportunity to localize these areas, and is a proof of concept that forest fragmentation can be monitored from space even for regions with high heterogeneity.
Supplementary Materials
The following supporting information can be downloaded at: https://www.mdpi.com/article/10.3390/rs17111922/s1, Table S1. Variance inflation factor (VIF). Table S2. The output types of MSPA. Areas correspond. 30 m × 30 m squares. Table S3. The annual increments of MSPA types from 1986 to 2018. Table S4. Changes in forest fragmentation classification percentages (1986–2018). Table S5. The comparison of proportion of forest area with both increased forest cover and decreased forest fragmentation (FFI) inside and outside ecological restoration zones across eight provinces. Figure S1. The restoration project boundary in study area for different. The above figure shows the vector boundary map of eight rocky desertification control zones (Karst fault basin, Karst gorge, Karst hill depression, Karst plateau, Karst trough valley, Middle-high mountain, Peak cluster depression, Peak forest plain).
Author Contributions
Conceptualization, X.T.; Methodology, C.M.; Software, C.M.; Investigation, C.M.; Resource, C.M., X.T., and J.L.; Data curation, C.M.; Writing—original draft, X.T. and C.M.; Writing—review & editing, X.T., M.B., W.Z., C.M., K.H., Y.Y., and K.W.; Visualization, C.M. and K.H.; Project administration, X.T.; Funding acquisition, X.T. All authors have read and agreed to the published version of the manuscript.
Funding
This work was supported by the National Key Research and Development Program of China for Young Scientists (2023YFF1305700), the National Natural Science Foundation of China (42371129), the National Natural Science Fund for Excellent Young Scientists (Overseas), the Science and Technology Innovation Program of Hunan Province (2024RC1067), the International Partnership Program of the Chinese Academy of Sciences (CAS) (092GJHZ2022029GC), and the CAS Interdisciplinary Team (JCTD-2021-16).
Data Availability Statement
The human footprint data are from “https://doi.org/10.6084/m9.figshare.16571064 (accessed on 5 October 2024)”. All the climate, soil and topography data were taken from open-source datasets. These include potential evapotranspiration and global aridity Index from “https://doi.org/10.6084/m9.figshare.7504448.v5 (accessed on 5 October 2024)”, soil organic carbon density, soil nitrogen density, soil phosphorus density, silt content, soil thickness, soil bulk density, and coarse fragment content from “https://data.tpdc.ac.cn/zh-hans/data/e1ccd22c-348f-41a2-ab46-dd1a8ac0c955 (accessed on 5 October 2023)”, soil type from “https://www.resdc.cn/ (accessed on 5 October 2024)”, soil moisture, annual mean temperature (TEM), and annual accumulated precipitation from “https://data.tpdc.ac.cn (accessed on 5 October 2023)”, and slope and aspect from “https://search.earthdata.nasa.gov/ (accessed on5 October 2024)”.
Acknowledgments
The climate and soil composite dataset is provided by the National Tibetan Plateau Data Center “http://data.tpdc.ac.cn (accessed 5 October 2024)”. The soil classification dataset originates from the Resource and Environmental Science Data Platform “https://www.resdc.cn/ (accessed 5 October 2024)”.
Conflicts of Interest
The authors declare that they have no known competing financial interests or personal relationships that could have appeared to influence the work reported in this paper.
Abbreviations
The following abbreviations are used in this manuscript:
| FFI | forest fragmentation index |
| ED | edge density |
| PD | patch density |
| MPA | mean patch area |
| FC | forest coverage |
| RF | Random Forest |
| SM | soil moisture |
| T | annual mean temperature |
| AI | global aridity index |
| CF | coarse fragment content |
| ET0 | potential evapotranspiration |
| BTSLT | silt content |
| TND | soil nitrogen density |
| BD | soil bulk density |
| P | annual accumulated precipitation |
| TPD | soil phosphorus density |
| FCC | forest cover change |
| HFI | human footprint index |
References
- Bastin, J.-F.; Finegold, Y.; Garcia, C.; Mollicone, D.; Rezende, M.; Routh, D.; Zohner, C.M.; Crowther, T.W. The global tree restoration potential. Science 2019, 365, 76–79. [Google Scholar] [CrossRef] [PubMed]
- Intergovernmental Panel on Environmental Change. Climate Change and Land: IPCC Special Report on Climate Change, Desertification, Land Degradation, Sustainable Land Management, Food Security, and Greenhouse Gas Fluxes in Terrestrial Ecosystems; Cambridge University Press: Cambridge, UK, 2022. [Google Scholar]
- Watson, J.E.M.; Evans, T.; Venter, O.; Williams, B.; Tulloch, A.; Stewart, C.; Thompson, I.; Ray, J.C.; Murray, K.; Salazar, A.; et al. The exceptional value of intact forest ecosystems. Nat. Ecol. Evol. 2018, 2, 599–610. [Google Scholar] [CrossRef] [PubMed]
- Crouzeilles, R.; Maurenza, D.; Prieto, P.V.; Barros, F.S.M.; Jakovac, C.; Ferreira, M.S.; Chazdon, R.L.; Lindenmayer, D.B.; Brancalion, P.H.S.; Ceccon, E.; et al. Associations between socio-environmental factors and landscape-scale biodiversity recovery in naturally regenerating tropical and subtropical forests. Conserv. Lett. 2020, 14, e12768. [Google Scholar] [CrossRef]
- Hua, F.; Bruijnzeel, L.A.; Meli, P.; Martin, P.A.; Zhang, J.; Nakagawa, S.; Miao, X.; Wang, W.; McEvoy, C.; Peña-Arancibia, J.L.; et al. The biodiversity and ecosystem service contributions and trade-offs of forest restoration approaches. Science 2022, 376, 839–844. [Google Scholar] [CrossRef]
- Liu, J.; Coomes, D.A.; Gibson, L.; Hu, G.; Liu, J.; Luo, Y.; Wu, C.; Yu, M. Forest fragmentation in China and its effect on biodiversity. Biol. Rev. 2019, 94, 1636–1657. [Google Scholar] [CrossRef]
- Shao, L.; Liu, Z.; Li, H.; Zhang, Y.; Dong, M.; Guo, X.; Zhang, H.; Huang, B.; Ni, R.; Li, G.; et al. The impact of global dimming on crop yields is determined by the source–sink imbalance of carbon during grain filling. Glob. Change Biol. 2021, 27, 689–708. [Google Scholar] [CrossRef]
- Taubert, F.; Fischer, R.; Groeneveld, J.; Lehmann, S.; Muller, M.S.; Rodig, E.; Wiegand, T.; Huth, A. Global patterns of tropical forest fragmentation. Nature 2018, 554, 519–522. [Google Scholar] [CrossRef]
- Ellison, D.; Morris, C.E.; Locatelli, B.; Sheil, D.; Cohen, J.; Murdiyarso, D.; Gutierrez, V.; Noordwijk, M.v.; Creed, I.F.; Pokorny, J.; et al. Trees, forests and water: Cool insights for a hot world. Glob. Environ. Change 2017, 43, 51–61. [Google Scholar] [CrossRef]
- Zhao, Z.; Li, W.; Ciais, P.; Santoro, M.; Cartus, O.; Peng, S.; Yin, Y.; Yue, C.; Yang, H.; Yu, L.; et al. Fire enhances forest degradation within forest edge zones in Africa. Nat. Geosci. 2021, 14, 479–483. [Google Scholar] [CrossRef]
- Duveiller, G.; Hooker, J.; Cescatti, A. The mark of vegetation change on Earth’s surface energy balance. Nat. Commun. 2018, 9, 679. [Google Scholar] [CrossRef]
- Zhu, L.; Li, W.; Ciais, P.; He, J.; Cescatti, A.; Santoro, M.; Tanaka, K.; Cartus, O.; Zhao, Z.; Xu, Y.; et al. Comparable biophysical and biogeochemical feedbacks on warming from tropical moist forest degradation. Nat. Geosci. 2023, 16, 244–249. [Google Scholar] [CrossRef]
- Atikah, S.N.; Yahya, M.S.; Ong, K.W.; Sanusi, R.; Norhisham, A.R.; Azhar, B. Continuous forests and non-IBA forest patches provide a safe haven for the tropical bird community in highly fragmented urban landscapes. Biodivers. Conserv. 2025, 34, 971–986. [Google Scholar] [CrossRef]
- Maseko, M.S.T.; Zungu, M.M.; Ehlers Smith, D.A.; Ehlers Smith, Y.C.; Downs, C.T. Effects of habitat-patch size and patch isolation on the diversity of forest birds in the urban-forest mosaic of Durban, South Africa. Urban Ecosyst. 2020, 23, 533–542. [Google Scholar] [CrossRef]
- Zhang, Y.; Luo, Y.; Han, L.; Chen, K.; Wang, Z.; Yang, Q. Importance of Patches in Maintaining Forest Landscape Connectivity: A Case Study of Barluk, Xinjiang, China. Forests 2025, 16, 74. [Google Scholar] [CrossRef]
- Weiskopf, S.R.; Isbell, F.; Arce-Plata, M.I.; Di Marco, M.; Harfoot, M.; Johnson, J.; Lerman, S.B.; Miller, B.W.; Morelli, T.L.; Mori, A.S.; et al. Biodiversity loss reduces global terrestrial carbon storage. Nat. Commun. 2024, 15, 4354. [Google Scholar] [CrossRef]
- Teo, H.C.; Lamba, A.; Ng, S.J.W.; Nguyen, A.T.; Dwiputra, A.; Lim, A.J.Y.; Nguyen, M.N.; Tor-ngern, P.; Zeng, Y.; Dewi, S.; et al. Reduction of deforestation by agroforestry in high carbon stock forests of Southeast Asia. Nat. Sustain. 2025, 8, 358–362. [Google Scholar] [CrossRef]
- Soille, P.; Vogt, P. Morphological segmentation of binary patterns. Pattern Recognit. Lett. 2009, 30, 456–459. [Google Scholar] [CrossRef]
- Li, X.; Tao, H.; Wang, J.; Zhang, B.; Liu, Z.; Liu, Z.; Li, J. Integrated Evaluation of the Ecological Security Pattern in Central Beijing Using InVEST, MSPA, and Multifactor Indices. Land 2025, 14, 205. [Google Scholar] [CrossRef]
- Piquer-Rodríguez, M.; Torella, S.; Gavier-Pizarro, G.; Volante, J.; Somma, D.; Ginzburg, R.; Kuemmerle, T. Effects of past and future land conversions on forest connectivity in the Argentine Chaco. Landsc. Ecol. 2015, 30, 817–833. [Google Scholar] [CrossRef]
- Lin, J.; Huang, C.; Wen, Y.; Liu, X. An assessment framework for improving protected areas based on morphological spatial pattern analysis and graph-based indicators. Ecol. Indic. 2021, 130, 108138. [Google Scholar] [CrossRef]
- Brandt, M.; Yue, Y.; Wigneron, J.-P.; Tong, X.; Tian, F.; Jepsen, M.; Xiao, X.; Verger, A.; Mialon, A.; Al-Yaari, A.; et al. Satellite-Observed Major Greening and Biomass Increase in South China Karst During Recent Decade. Earth Future 2018, 6, 1017–1028. [Google Scholar] [CrossRef]
- Tong, X.; Brandt, M.; Yue, Y.; Horion, S.; Wang, K.; Keersmaecker, W.D.; Tian, F.; Schurgers, G.; Xiao, X.; Luo, Y.; et al. Increased vegetation growth and carbon stock in China karst via ecological engineering. Nat. Sustain. 2018, 1, 44–50. [Google Scholar] [CrossRef]
- Tong, X.; Brandt, M.; Yue, Y.; Ciais, P.; Rudbeck Jepsen, M.; Penuelas, J.; Wigneron, J.P.; Xiao, X.; Song, X.P.; Horion, S.; et al. Forest management in southern China generates short term extensive carbon sequestration. Nat. Commun. 2020, 11, 129. [Google Scholar] [CrossRef] [PubMed]
- Yue, C.; Xu, M.; Ciais, P.; Tao, S.; Shen, H.; Chang, J.; Li, W.; Deng, L.; He, J.; Leng, Y.; et al. Contributions of ecological restoration policies to China’s land carbon balance. Nat. Commun. 2024, 15, 9708. [Google Scholar] [CrossRef]
- Tong, X.; Brandt, M.; Yue, Y.; Zhang, X.; Fensholt, R.; Ciais, P.; Wang, K.; Liu, S.; Zhang, W.; Mao, C.; et al. Reforestation policies around 2000 in southern China led to forest densification and expansion in the 2010s. Commun. Earth Environ. 2023, 4, 260. [Google Scholar] [CrossRef]
- Ma, J.; Li, J.; Wu, W.; Liu, J. Global forest fragmentation change from 2000 to 2020. Nat. Commun. 2023, 14, 3752. [Google Scholar] [CrossRef]
- Chen, M.; Sun, Y.; Yang, B.; Jiang, J. MSPA-based green space morphological pattern and its spatiotemporal influence on land surface temperature. Heliyon 2024, 10, e31363. [Google Scholar] [CrossRef]
- Wang, Y.; Brandt, M.; Zhao, M.; Xing, K.; Wang, L.; Tong, X.; Xue, F.; Kang, M.; Jiang, Y.; Fensholt, R. Do Afforestation Projects Increase Core Forests? Evidence from the Chinese Loess Plateau. Ecol. Indic. 2020, 117, 106558. [Google Scholar] [CrossRef]
- Mu, H.; Li, X.; Wen, Y.; Huang, J.; Du, P.; Su, W.; Miao, S.; Geng, M. A global record of annual terrestrial Human Footprint dataset from 2000 to 2018. Sci. Data 2022, 9, 176. [Google Scholar] [CrossRef]
- Williams, B.A.; Venter, O.; Allan, J.R.; Atkinson, S.C.; Rehbein, J.A.; Ward, M.; Di Marco, M.; Grantham, H.S.; Ervin, J.; Goetz, S.J.; et al. Change in Terrestrial Human Footprint Drives Continued Loss of Intact Ecosystems. One Earth 2020, 3, 371–382. [Google Scholar] [CrossRef]
- Yang, R.; Dong, X.; Xu, S.; Wang, K.; Li, X.; Xiao, W.; Ye, Y. Fragmentation of Key Biodiversity Areas Highlights Attention to Human Disturbance Patterns. Biol. Conserv. 2024, 290, 110428. [Google Scholar] [CrossRef]
- Shouzhang, P. 1-km Monthly Precipitation Dataset for China (1901–2023); National Tibetan Plateau/Third Pole Environment Data Center: Beijing, China, 2024. [Google Scholar] [CrossRef]
- Shouzhang, P. 1-km Monthly Mean Temperature Dataset for China (1901–2023); National Tibetan Plateau/Third Pole Environment Data Center: Beijing, China, 2024. [Google Scholar] [CrossRef]
- Zomer, R.J.; Xu, J.; Trabucco, A. Version 3 of the Global Aridity Index and Potential Evapotranspiration Database. Sci. Data 2022, 9, 409. [Google Scholar] [CrossRef]
- Liu, F.; Zhang, G. Basic Soil Property Dataset of High-Resolution China Soil Information Grids (2010–2018); National Tibetan Plateau/Third Pole Environment Data Center: Beijing, China, 2021. [Google Scholar] [CrossRef]
- Li, Q.; Shi, G.; Shangguan, W.; Nourani, V.; Li, J.; Li, L.; Huang, F.; Zhang, Y.; Wang, C.; Wang, D.; et al. A 1 km daily soil moisture dataset over China based on in-situ measurement (2000–2022). Earth Syst. Sci. Data 2024, 14, 5267–5286. [Google Scholar] [CrossRef]
- Bryan, B.A.; Gao, L.; Ye, Y.; Sun, X.; Connor, J.D.; Crossman, N.D.; Stafford-Smith, M.; Wu, J.; He, C.; Yu, D.; et al. China’s response to a national land-system sustainability emergency. Nature 2018, 559, 193–204. [Google Scholar] [CrossRef] [PubMed]
- Chen, C.; Park, T.; Wang, X.; Piao, S.; Xu, B.; Chaturvedi, R.K.; Fuchs, R.; Brovkin, V.; Ciais, P.; Fensholt, R.; et al. China and India lead in greening of the world through land-use management. Nat. Sustain. 2019, 2, 122–129. [Google Scholar] [CrossRef]
- Hermosilla, T.; Wulder, M.A.; White, J.C.; Coops, N.C.; Pickell, P.D.; Bolton, D.K. Impact of time on interpretations of forest fragmentation: Three-decades of fragmentation dynamics over Canada. Remote Sens. Environ. 2019, 222, 65–77. [Google Scholar] [CrossRef]
- Novick, K.A.; Katul, G.G. The Duality of Reforestation Impacts on Surface and Air Temperature. J. Geophys. Res. Biogeosciences 2020, 125, e2019JG005543. [Google Scholar] [CrossRef]
- Zhou, W.; Cao, F.; Wang, G. Effects of Spatial Pattern of Forest Vegetation on Urban Cooling in a Compact Megacity. Forests 2019, 10, 282. [Google Scholar] [CrossRef]
- Alibakhshi, S.; Cook-Patton, S.C.; Davin, E.; Maeda, E.E.; Araújo, M.B.; Heinlein, D.; Heiskanen, J.; Pellikka, P.; Crowther, T.W. Natural forest regeneration is projected to reduce local temperatures. Commun. Earth Environ. 2024, 5, 577. [Google Scholar] [CrossRef]
- Li, Y.; Li, Z.-L.; Wu, H.; Liu, X.; Lian, X.; Si, M.; Li, J.; Zhou, C.; Tang, R.; Duan, S.; et al. Observed different impacts of potential tree restoration on local surface and air temperature. Nat. Commun. 2025, 16, 2335. [Google Scholar] [CrossRef]
- Yin, Y.; Li, S.; Xing, X.; Zhou, X.; Kang, Y.; Hu, Q.; Li, Y. Cooling Benefits of Urban Tree Canopy: A Systematic Review. Sustainability 2024, 16, 4955. [Google Scholar] [CrossRef]
- Lin, Y.; Jin, Y.; Ge, Y.; Hu, X.; Weng, A.; Wen, L.; Zhou, Y.; Li, B. Insights into forest vegetation changes and landscape fragmentation in Southeastern China: From a perspective of spatial coupling and machine learning. Ecol. Indic. 2024, 166, 112479. [Google Scholar] [CrossRef]
- Zhen, S.; Zhao, Q.; Liu, S.; Wu, Z.; Lin, S.; Li, J.; Hu, X. Detecting Spatiotemporal Dynamics and Driving Patterns in Forest Fragmentation with a Forest Fragmentation Comprehensive Index (FFCI): Taking an Area with Active Forest Cover Change as a Case Study. Forests 2023, 14, 1135. [Google Scholar] [CrossRef]
Disclaimer/Publisher’s Note: The statements, opinions and data contained in all publications are solely those of the individual author(s) and contributor(s) and not of MDPI and/or the editor(s). MDPI and/or the editor(s) disclaim responsibility for any injury to people or property resulting from any ideas, methods, instructions or products referred to in the content. |
© 2025 by the authors. Licensee MDPI, Basel, Switzerland. This article is an open access article distributed under the terms and conditions of the Creative Commons Attribution (CC BY) license (https://creativecommons.org/licenses/by/4.0/).