
Ground Penetrating Radar for the Exploration of Complex Mining Contexts

 ,
,  ,
,  ,
,  ,
, 
Abstract
1. Introduction
Review of Ground Penetrating Radar Applications
2. Materials and Methods
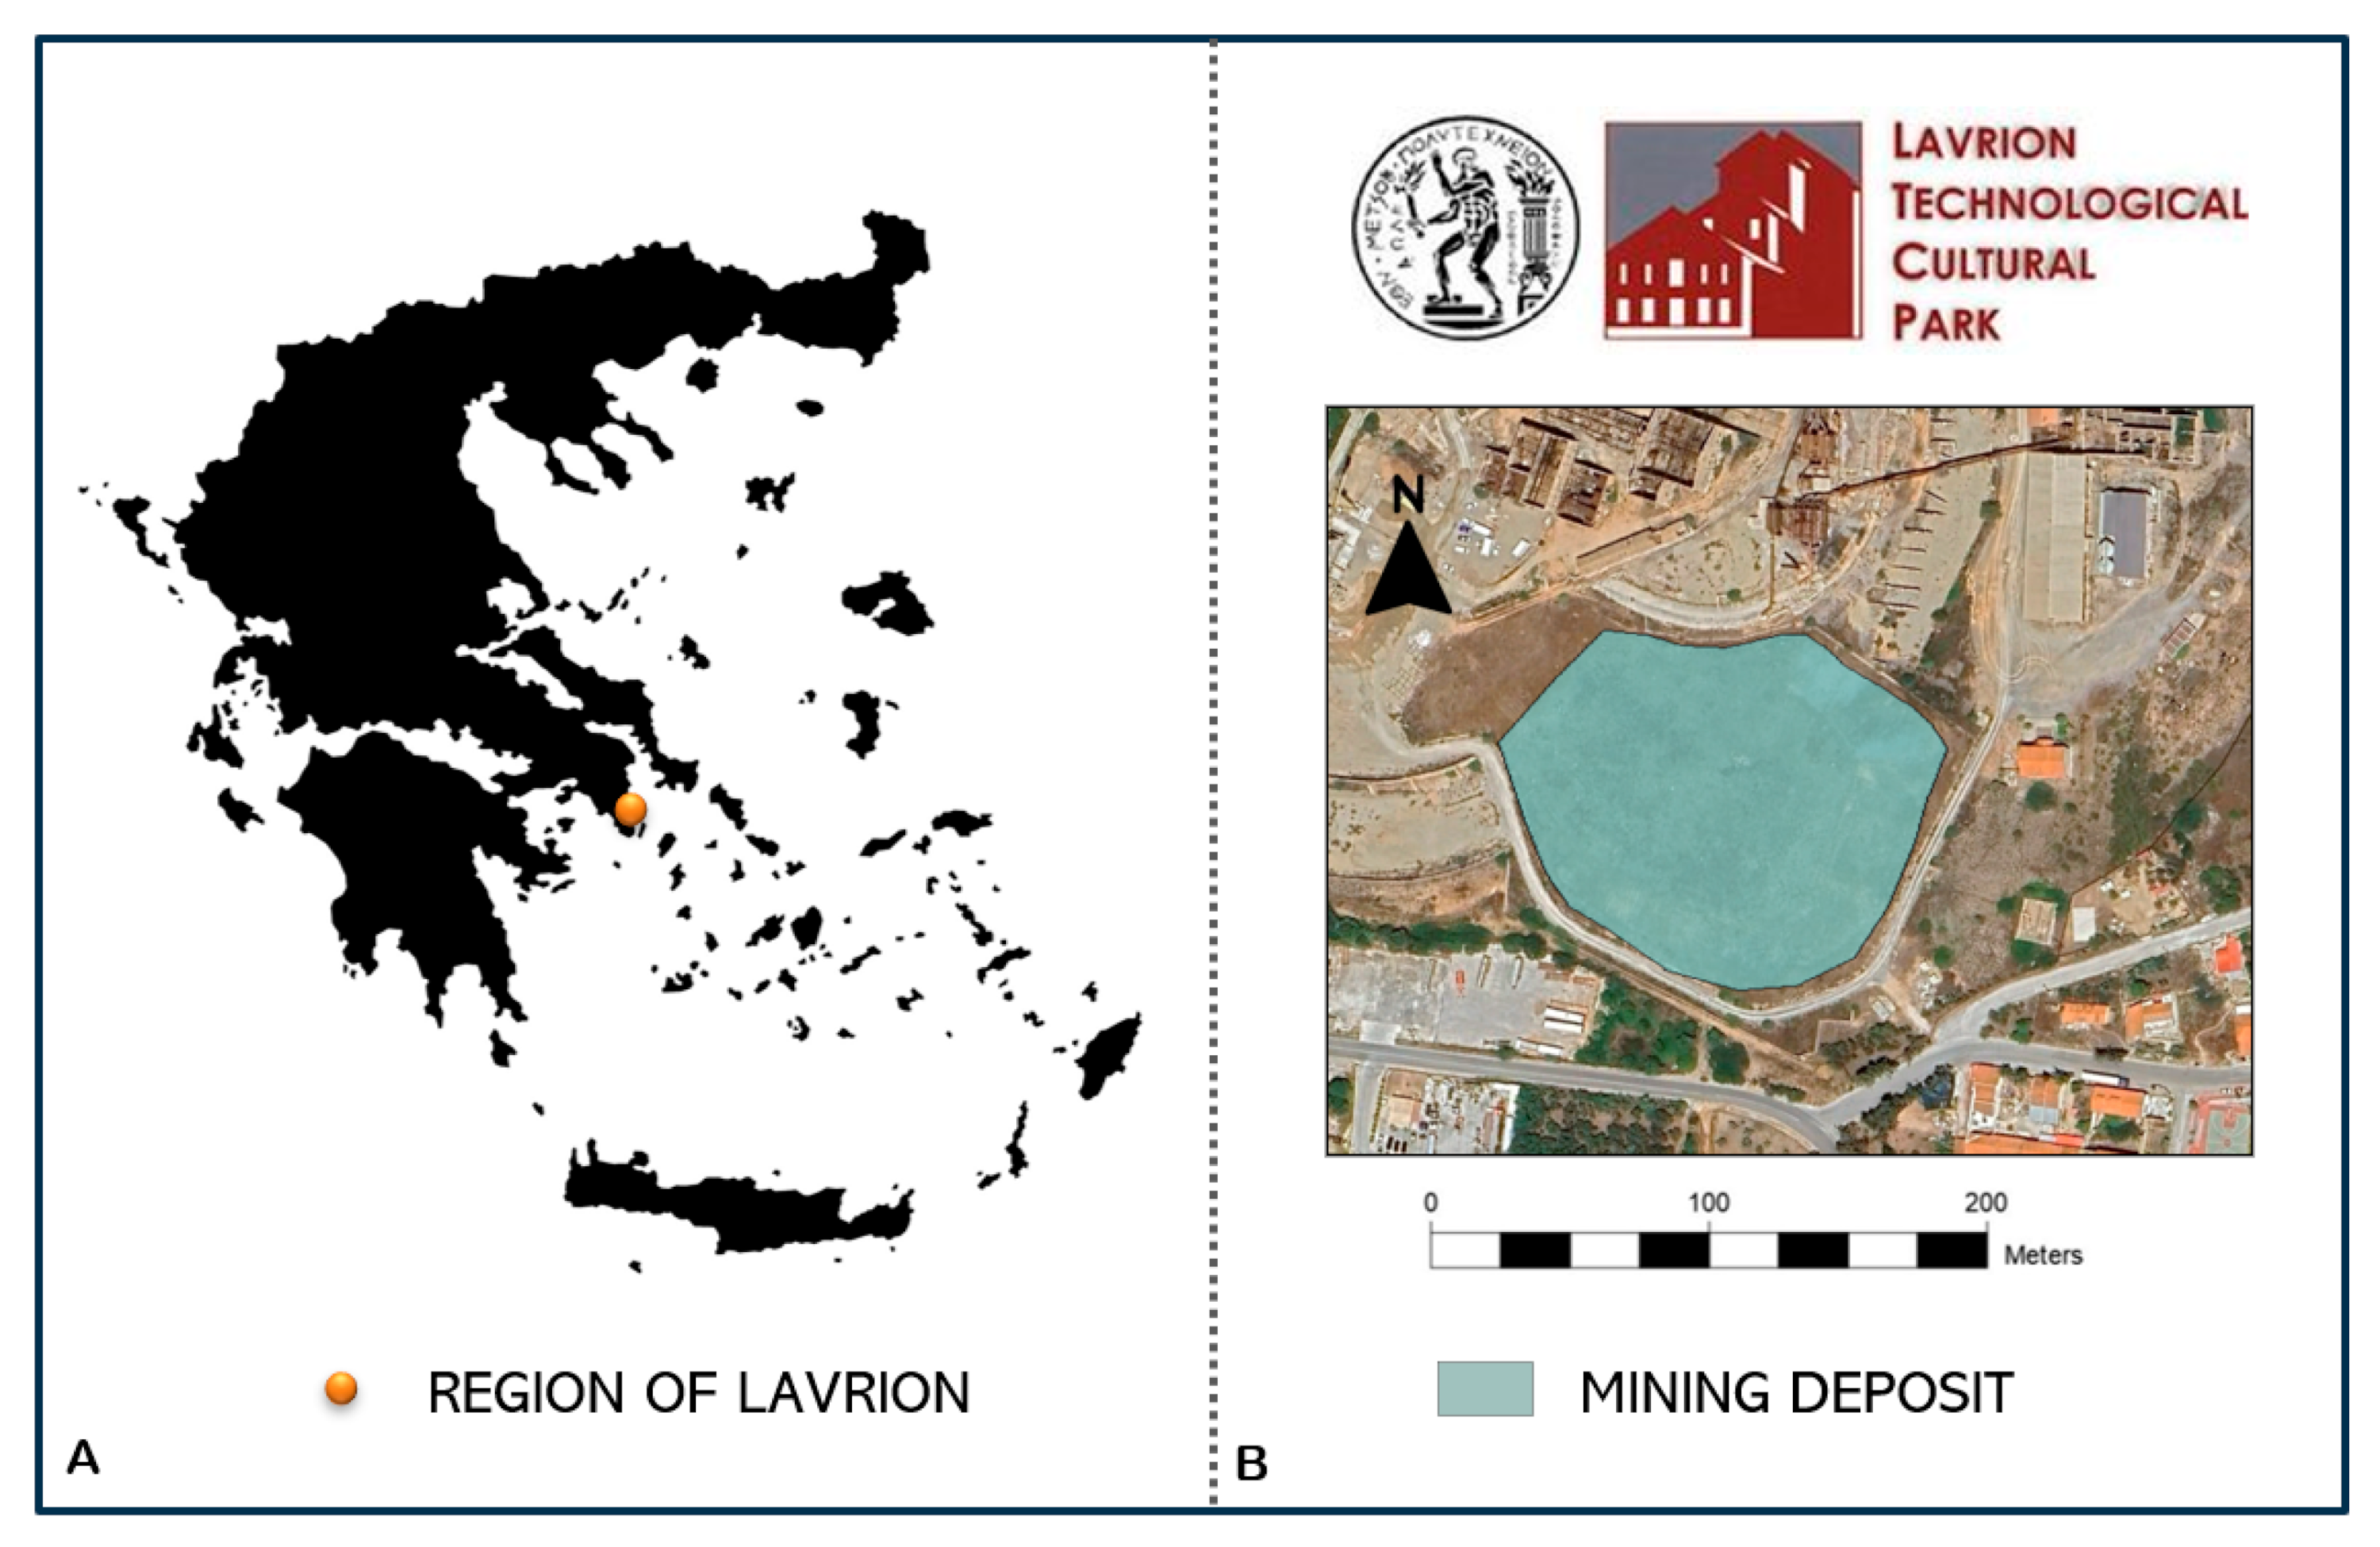
2.1. Mining Context Under Study
2.2. Work Methodology
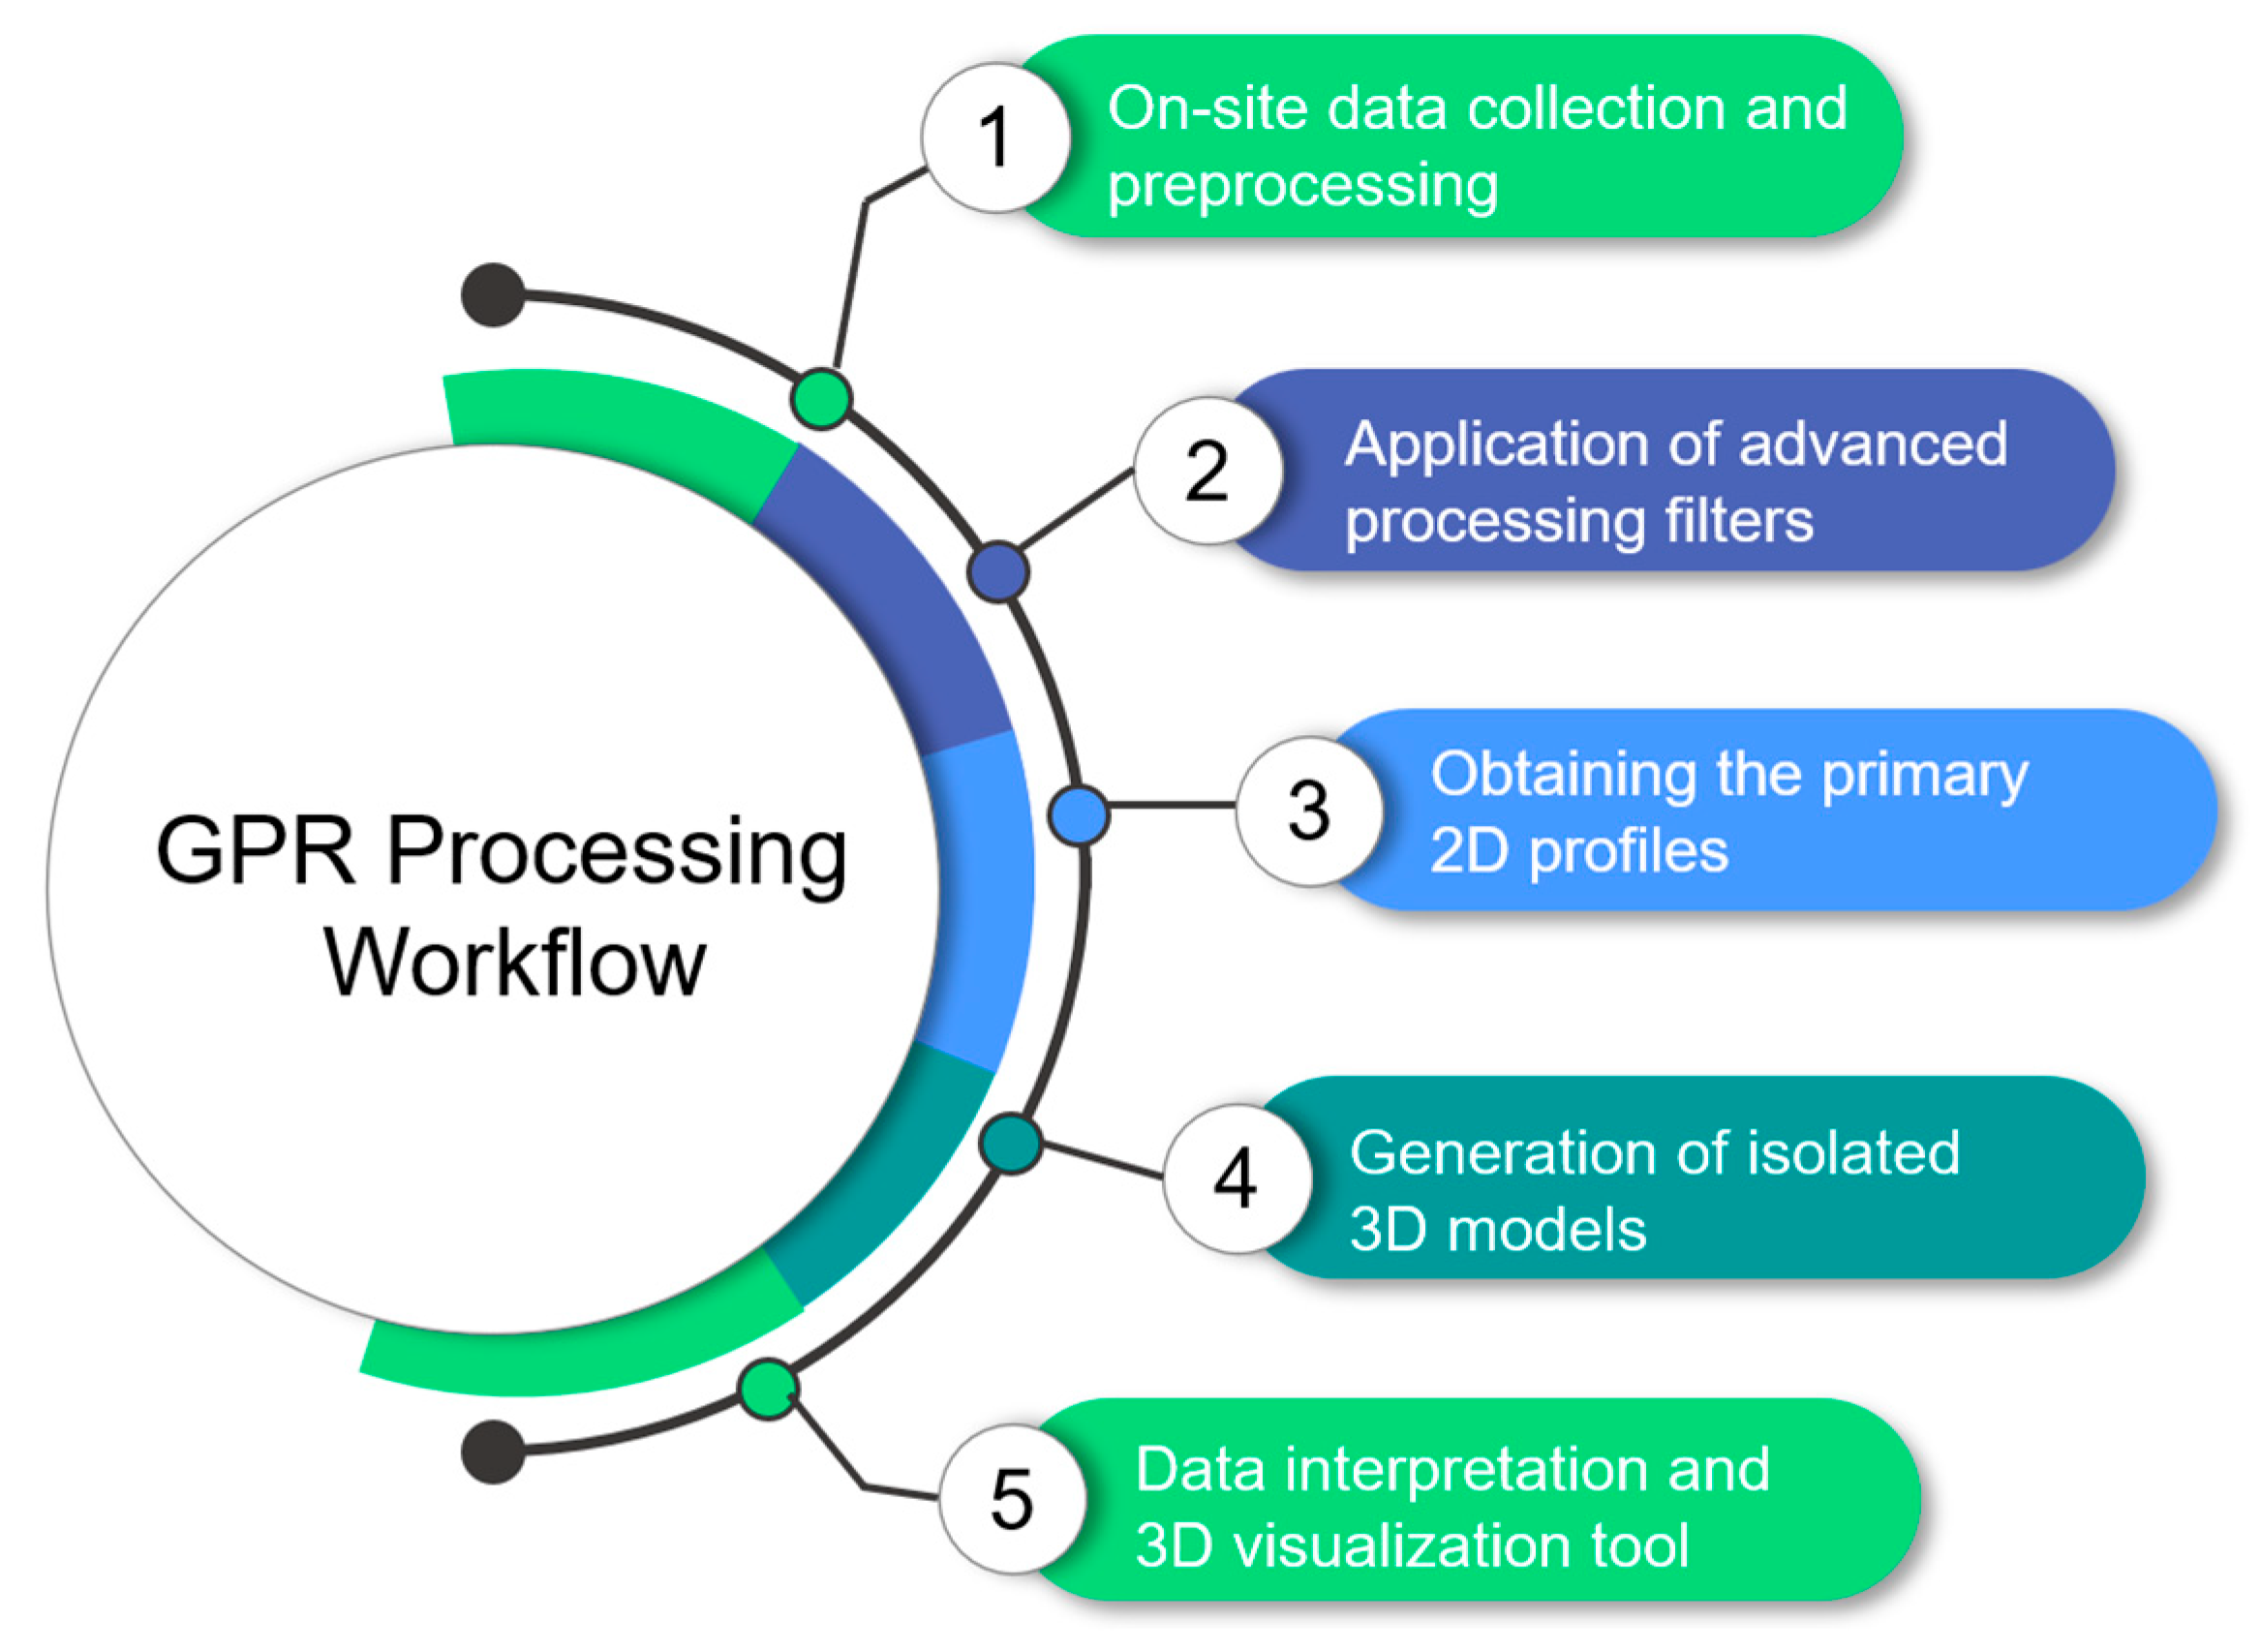
Data Processing
3. Results
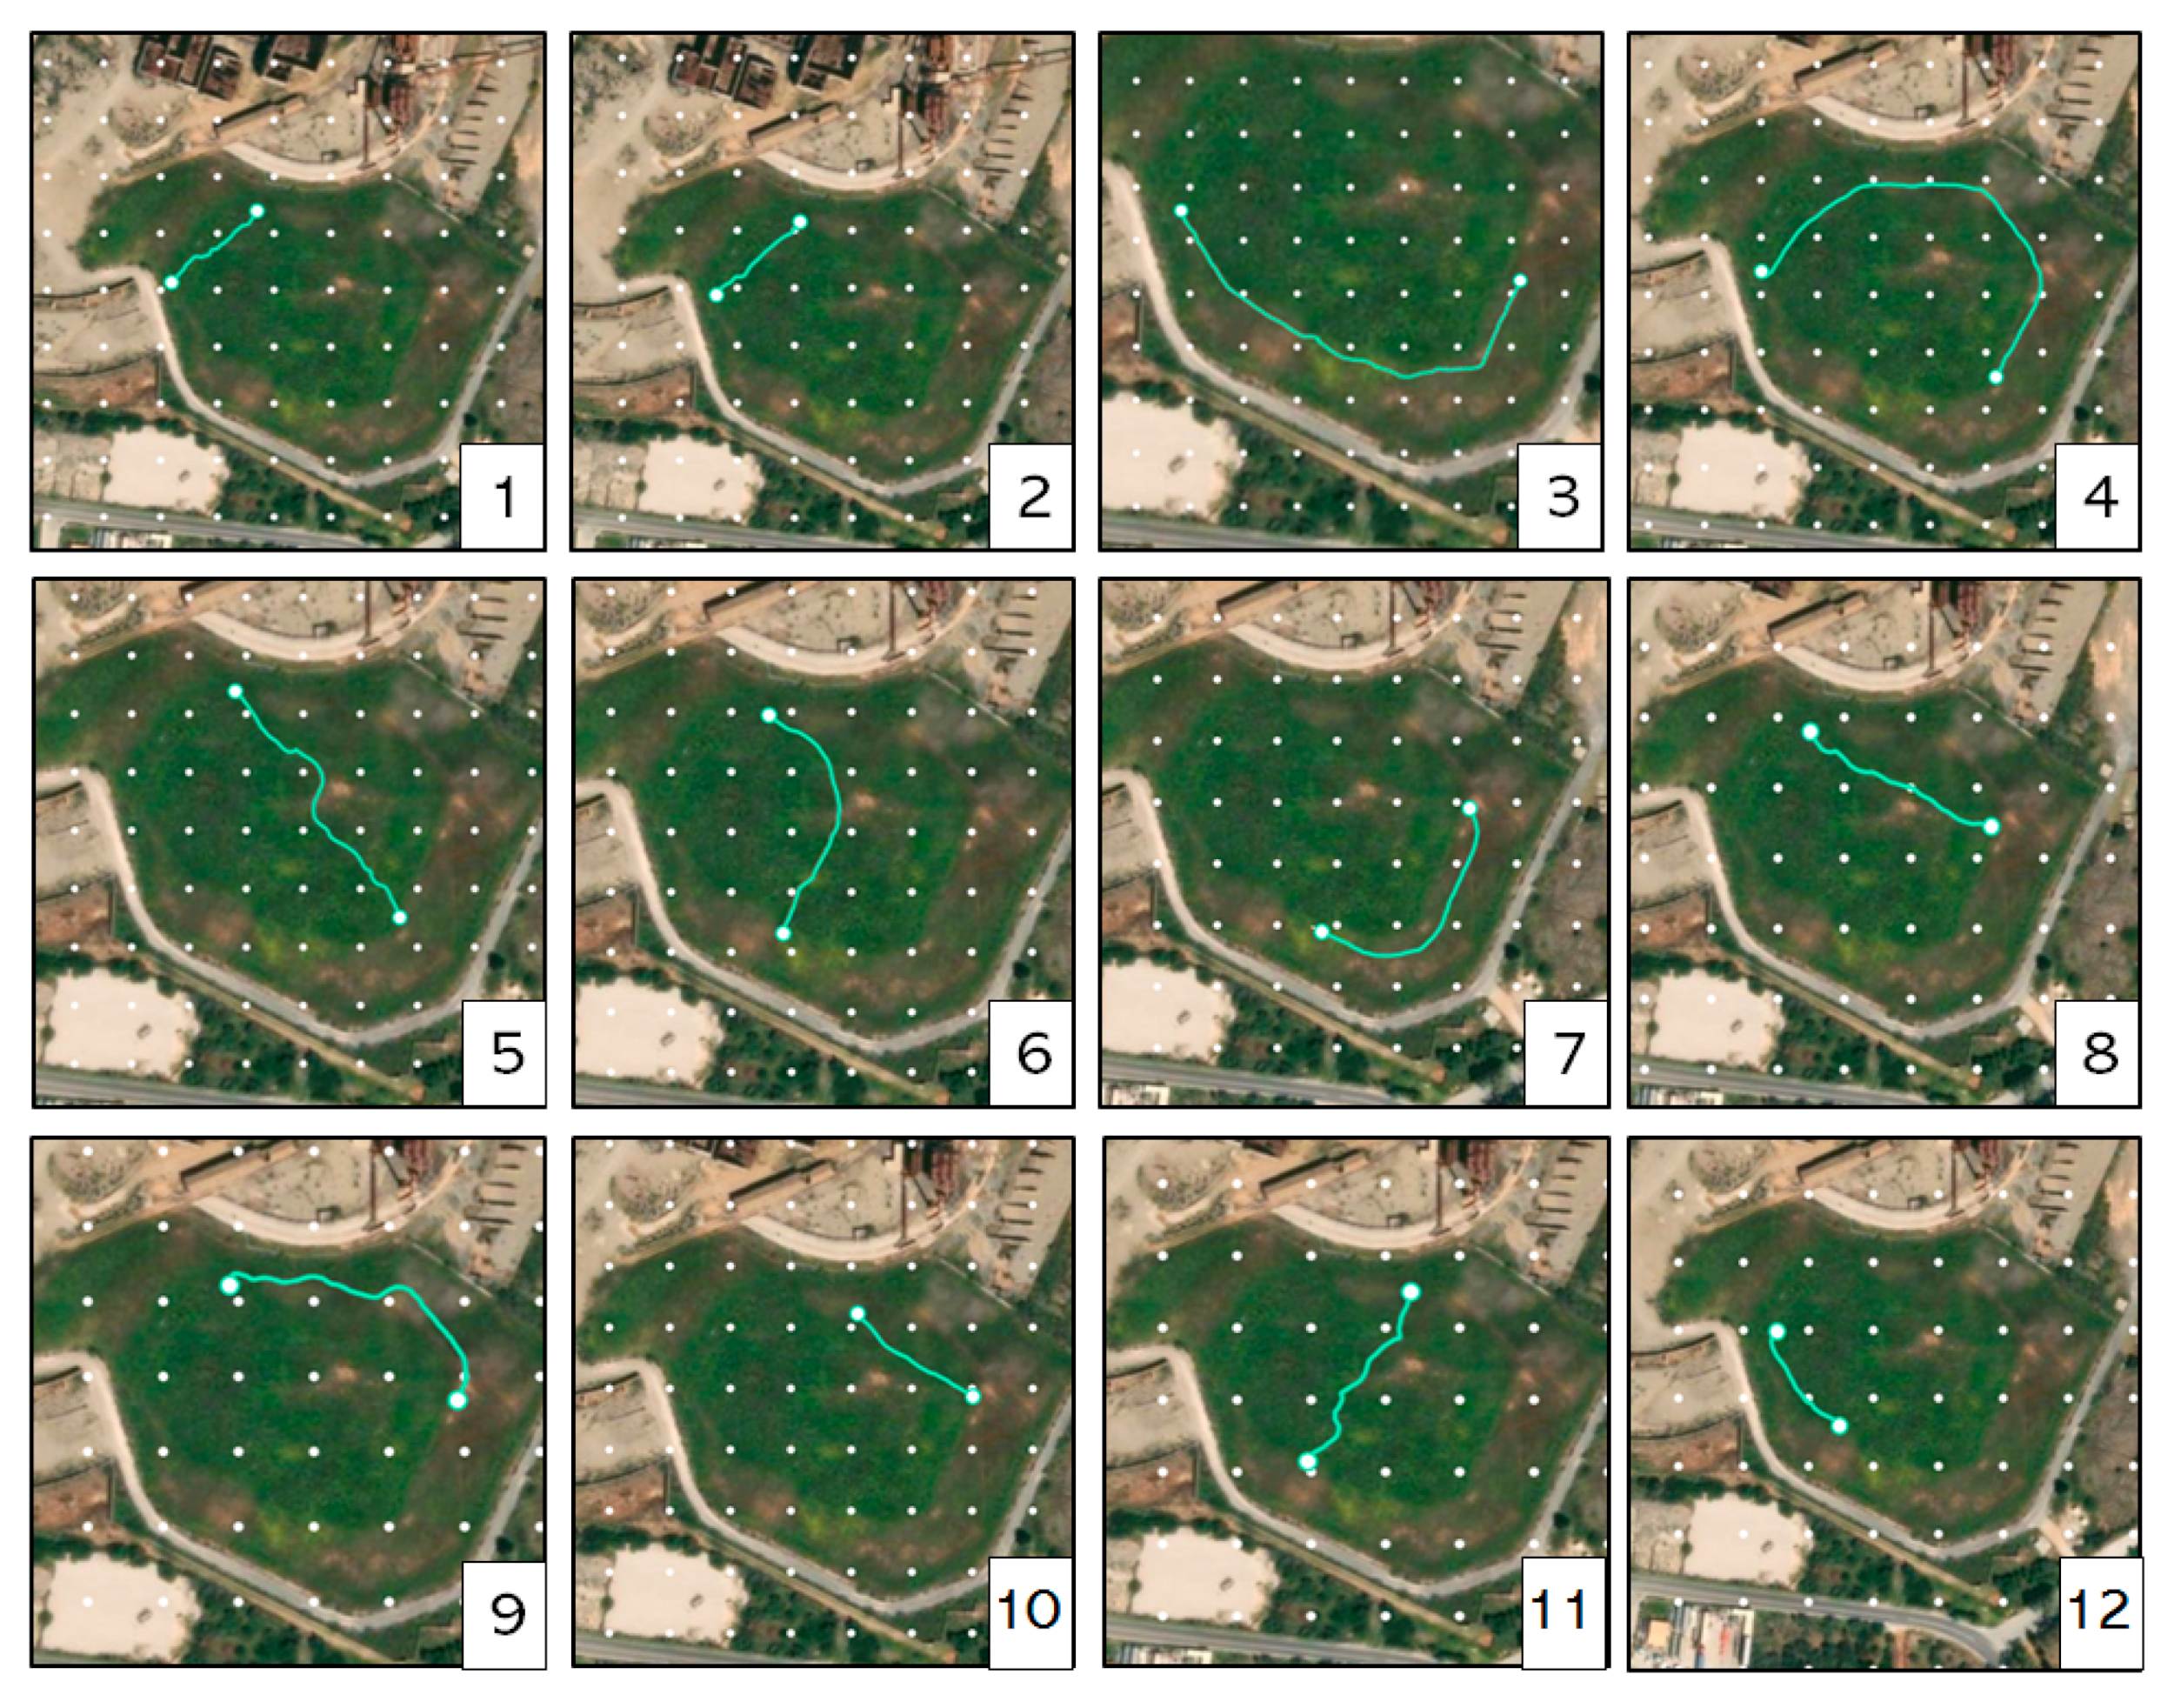
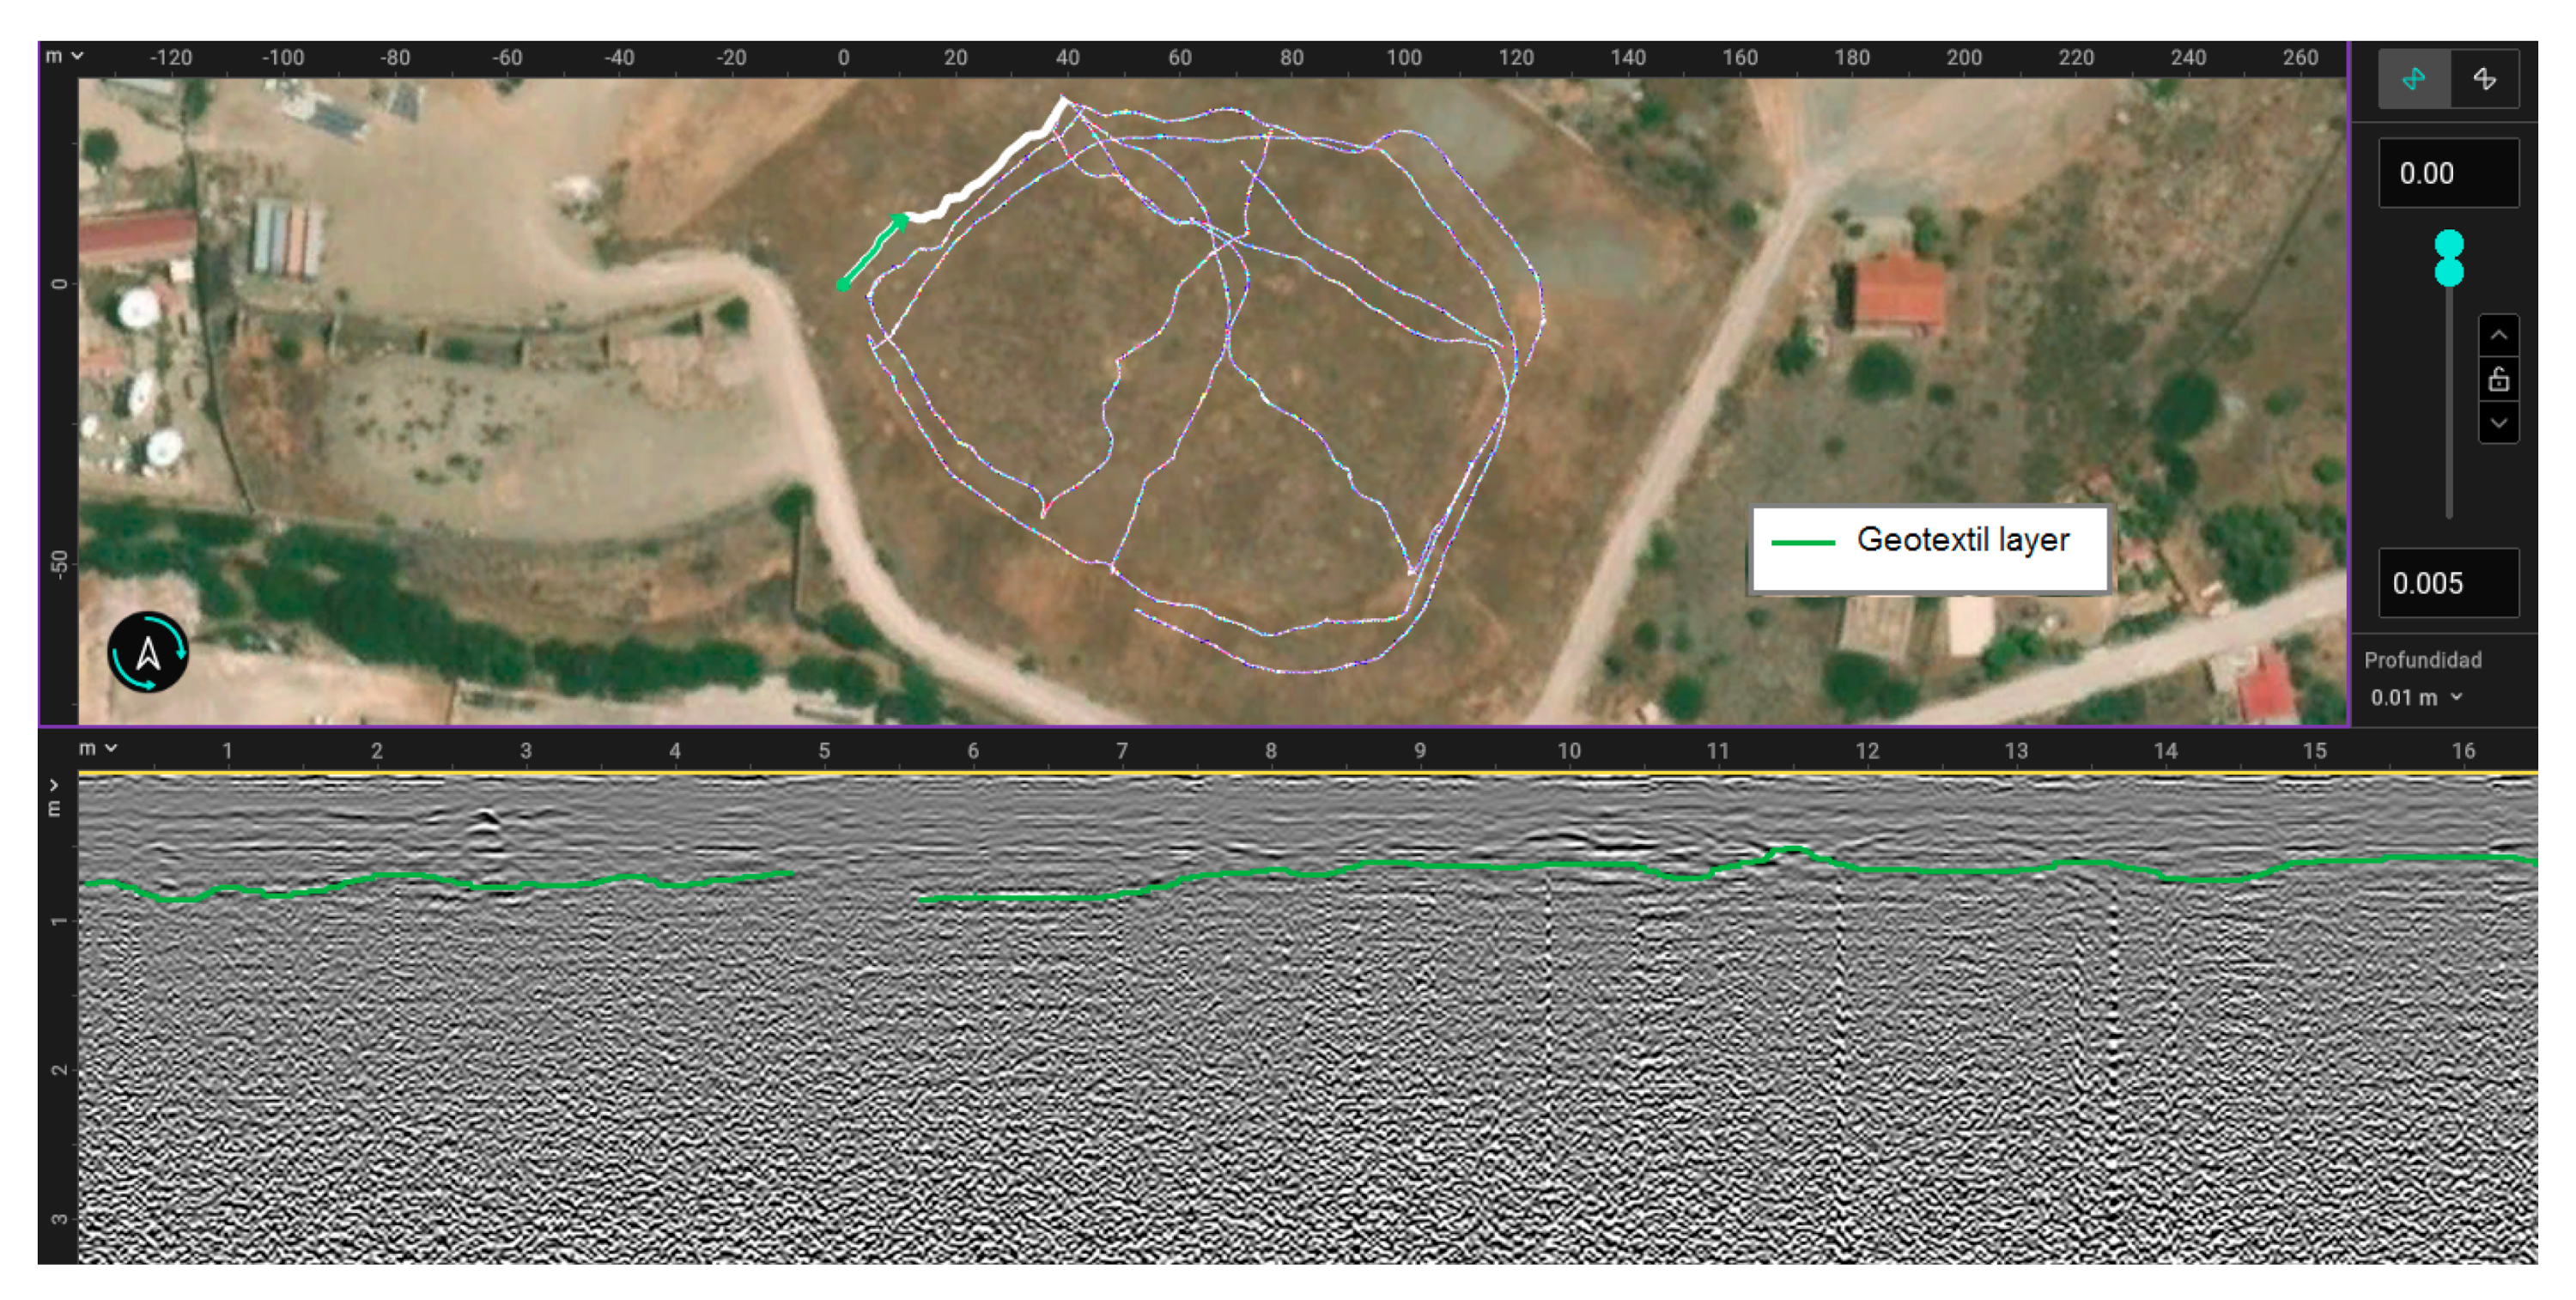
3.1. 2D Profiles
- Registers 1 and 2
- Register 3
- Register 4
- Registers 5 and 6
- Register 7
- Register 8
- Register 9
- Register 10 and 11
- Register 12
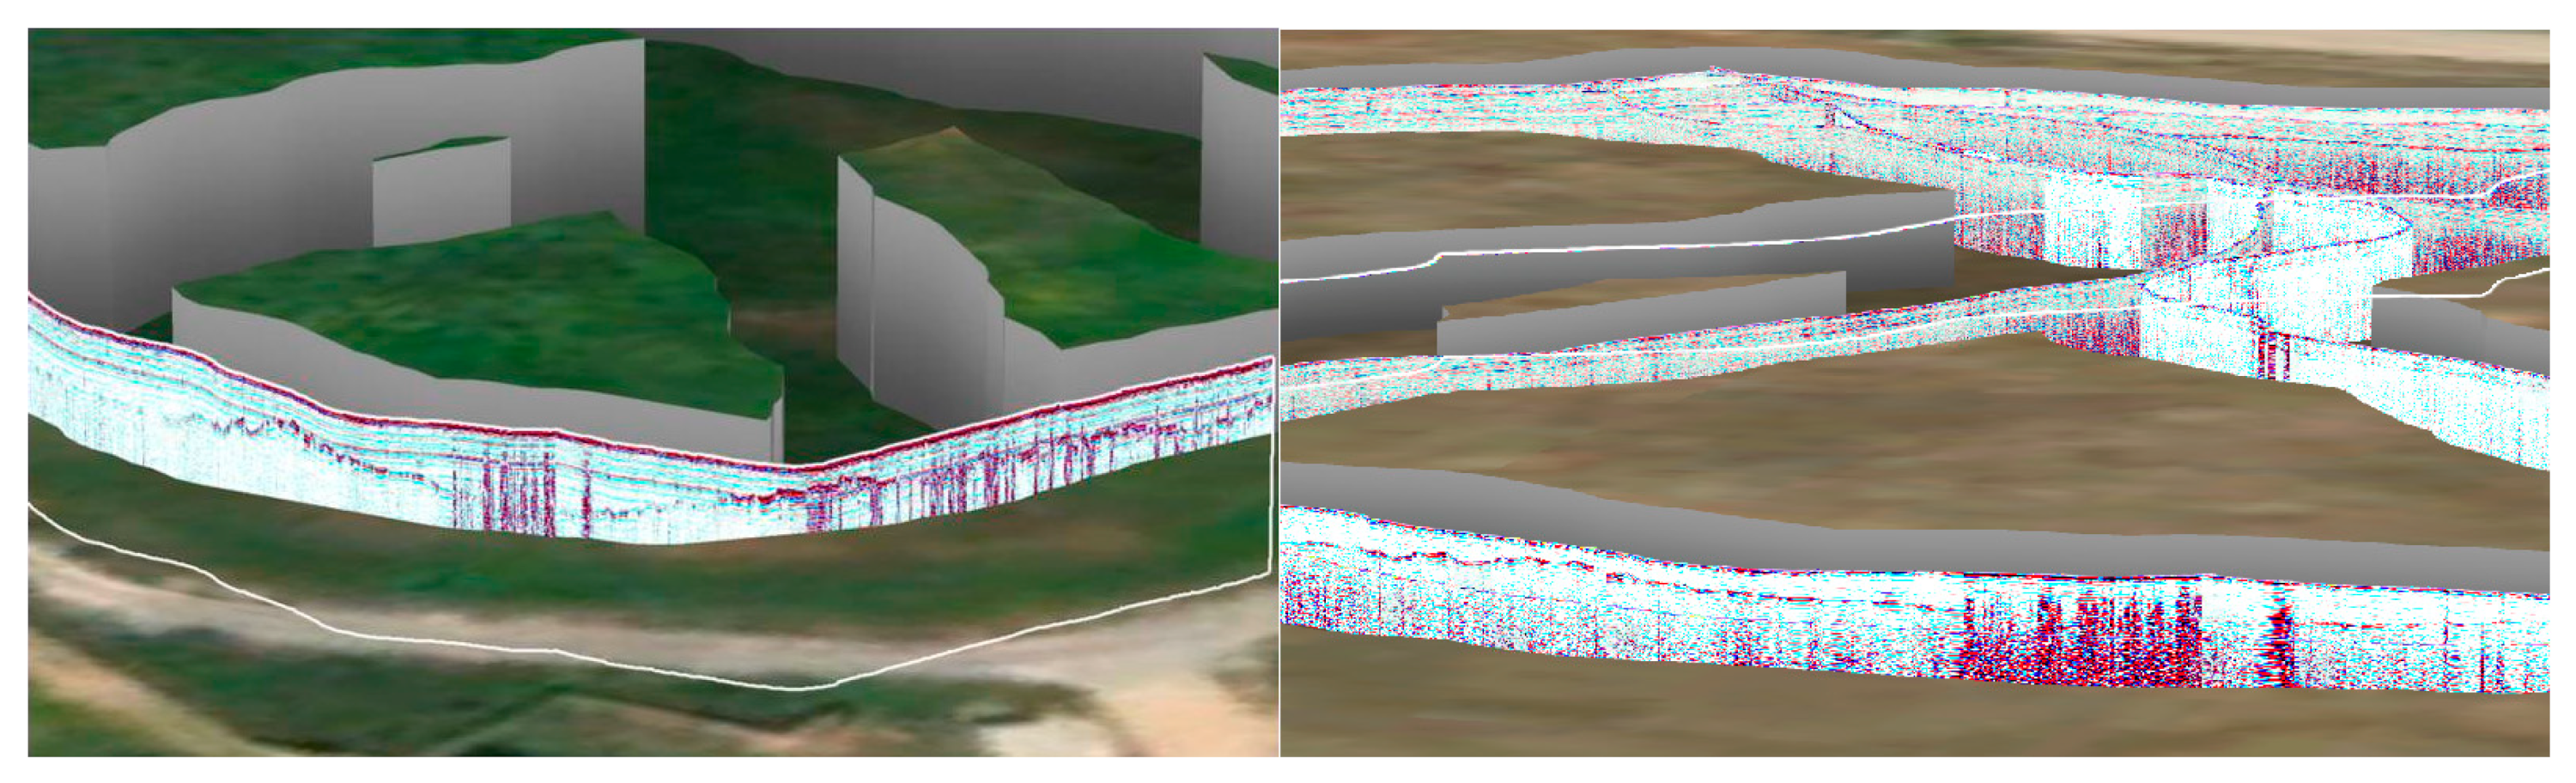
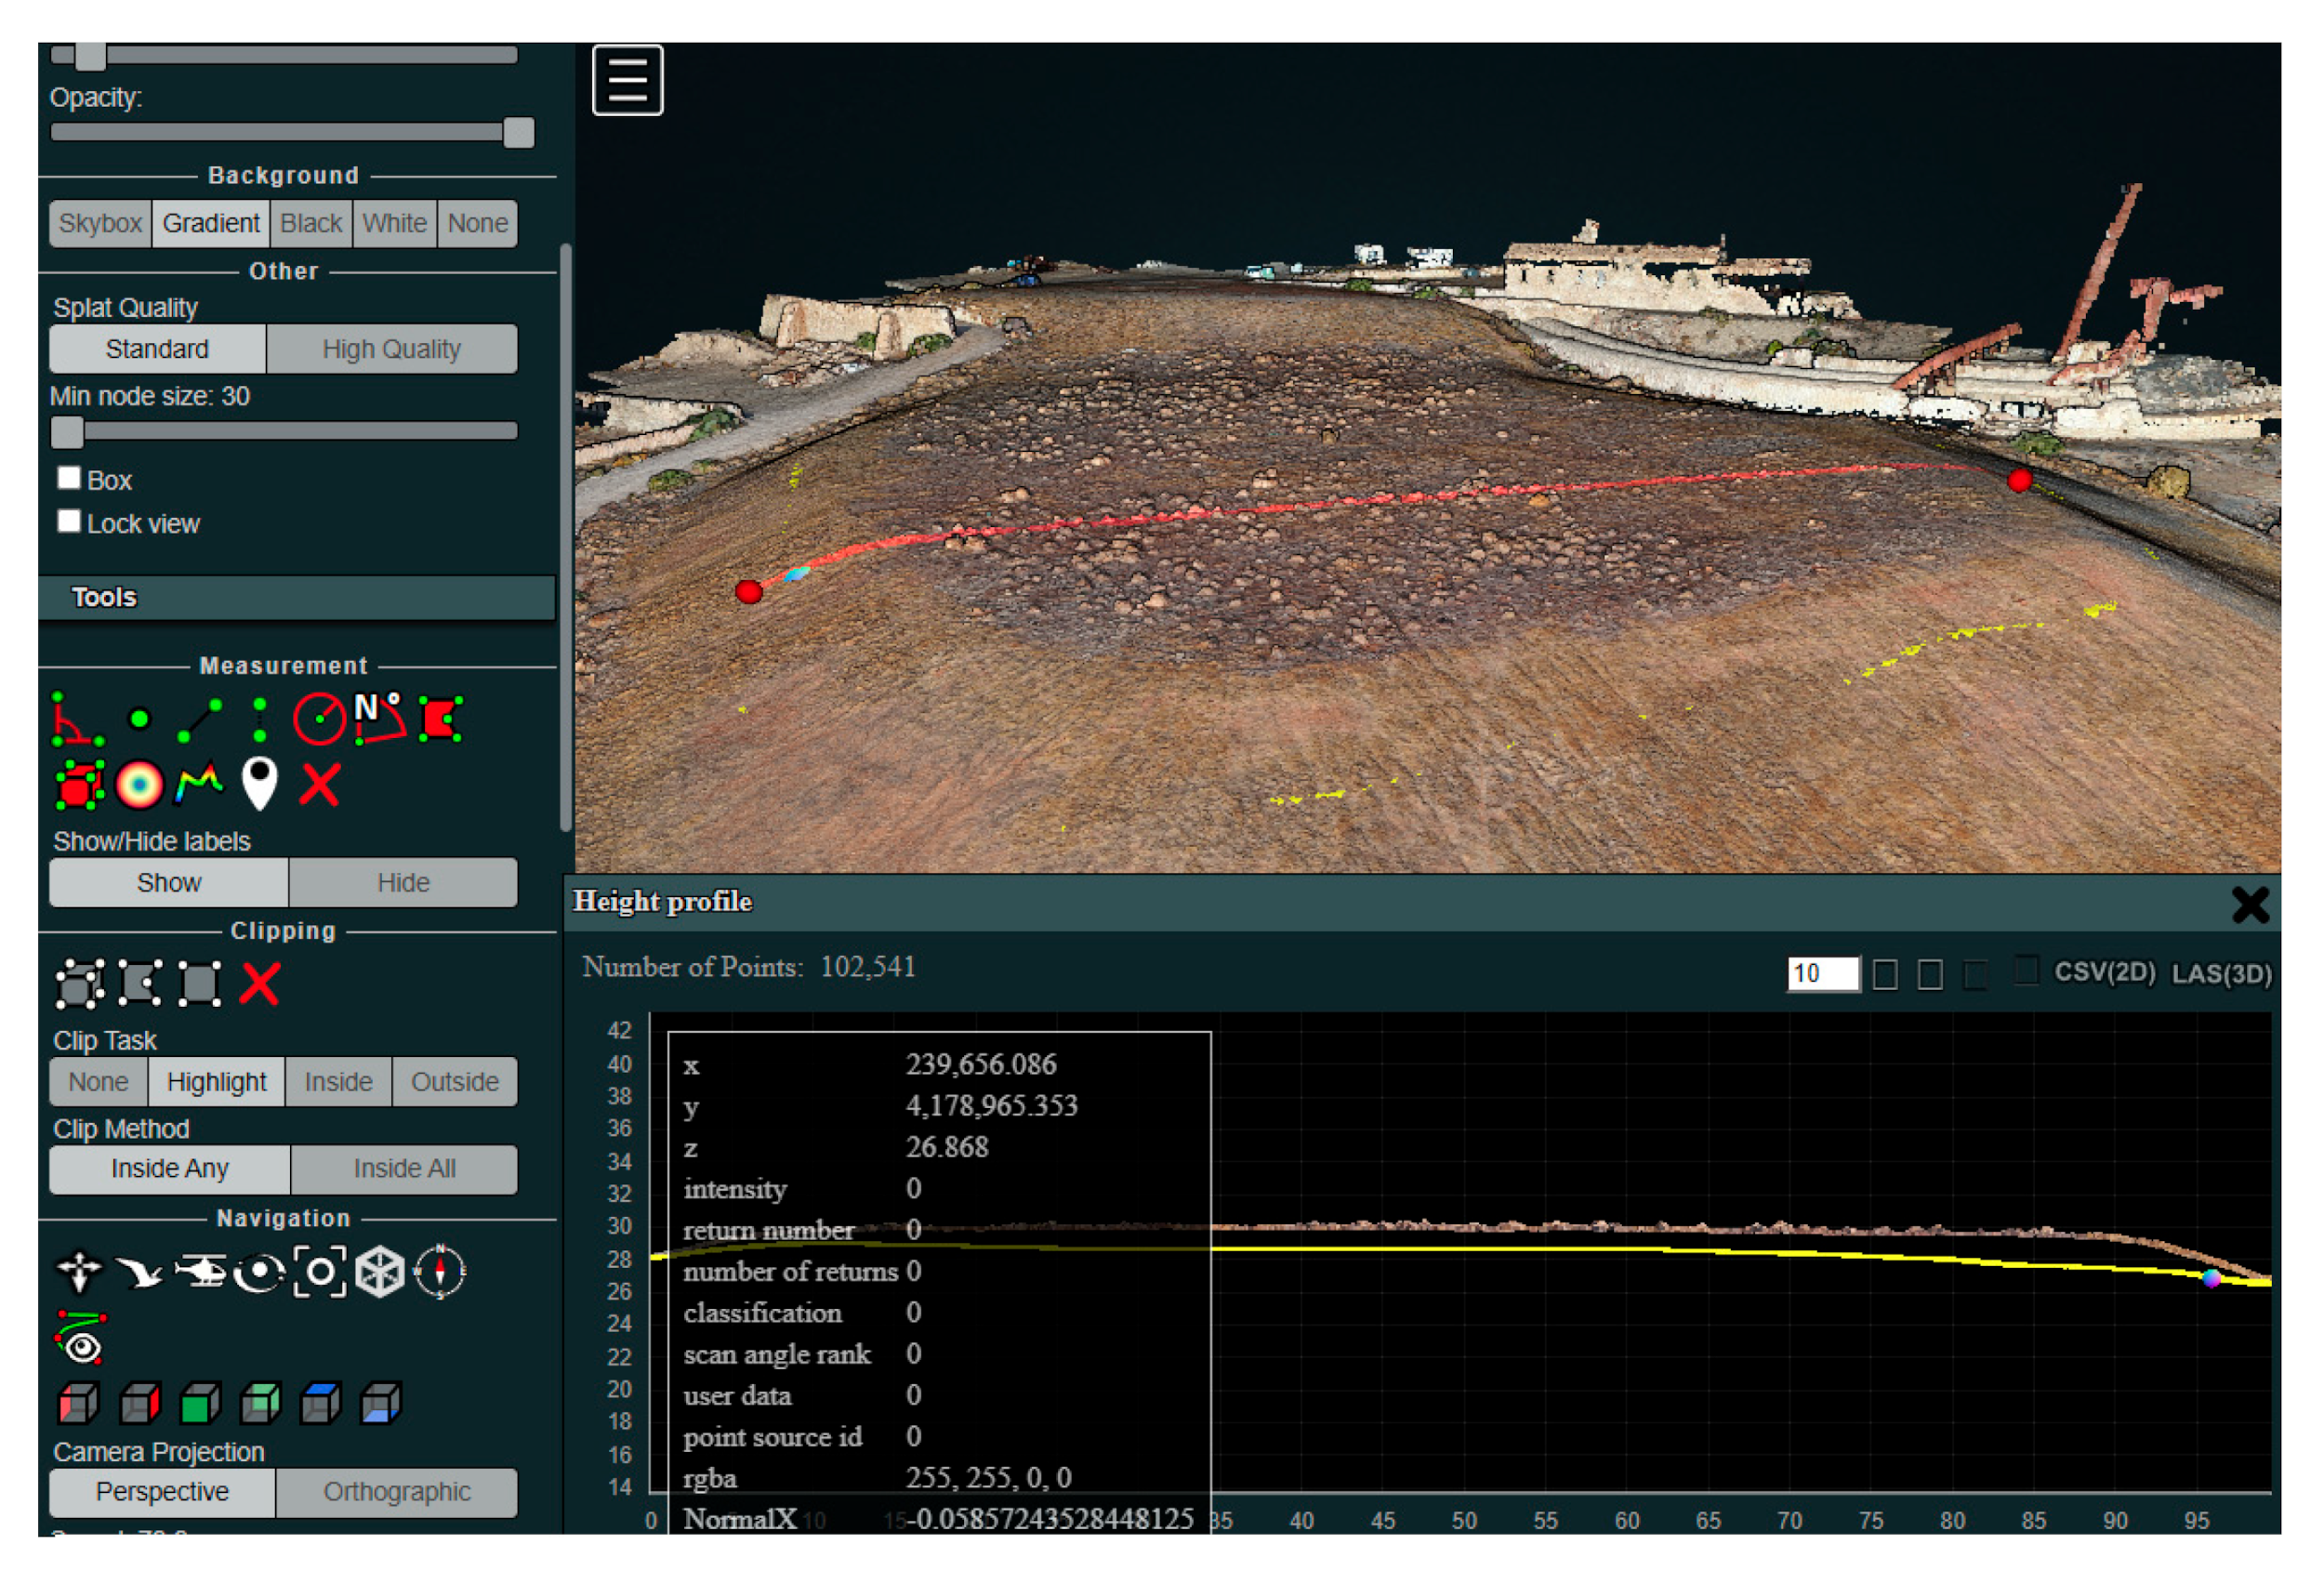
3.2. 3D Modelling
4. Discussion
4.1. Status of Containment and Isolation Layers
4.2. Possible Water Filtration Phenomena
4.3. Research Contribution and Correlation with Previous Geophysical Campaigns
5. Conclusions
Author Contributions
Funding
Data Availability Statement
Acknowledgments
Conflicts of Interest
References
- Adamo, N.; Al-Ansari, N.; Sissakian, V.; Laue, J.; Knutsson, S. Geophysical methods and their applications in dam safety monitoring. J. Earth Sci. Geotech. Eng. 2021, 11, 291–345. [Google Scholar] [CrossRef] [PubMed]
- Burger, H.R.; Sheehan, A.F.; Jones, C.H. Introduction to Applied Geophysics: Exploring the Shallow Subsurface; Cambridge University Press: Cambridge, UK, 2023. [Google Scholar]
- Luo, G.; Cao, Y.; Xu, H.; Yang, G.; Wang, S.; Huang, Y.; Bai, Z. Research on typical soil physical properties in a mining area: Feasibility of three-dimensional ground penetrating radar detection. Environ. Earth Sci. 2021, 80, 92. [Google Scholar] [CrossRef]
- Liu, C.; Du, Y.; Yue, G.; Li, Y.; Wu, D.; Li, F. Advances in automatic identification of road subsurface distress using ground penetrating radar: State of the art and future trends. Autom. Constr. 2024, 158, 105185. [Google Scholar] [CrossRef]
- Khan, Z.; Sharma, T.; Khan, N.; Magray, A.A. Soil exploration using ground penetrating radar. In IOP Conference Series: Earth and Environmental Science; IOP Publishing: Philadelphia, PA, USA, 2021; Volume 889, p. 012009. [Google Scholar]
- Worlanyo, A.S.; Li, J. Evaluating the environmental and economic impact of mining for post-mined land restoration and land-use: A review. J. Environ. Manag. 2021, 279, 111623. [Google Scholar] [CrossRef]
- Rebello, S.; Anoopkumar, A.N.; Aneesh, E.M.; Sindhu, R.; Binod, P.; Kim, S.H.; Pandey, A. Hazardous minerals mining: Challenges and solutions. J. Hazard. Mater. 2021, 402, 123474. [Google Scholar] [CrossRef]
- Fedorova, L.; Lejzerowicz, A.; Kulyandin, G.; Savvin, D.; Fedorov, M. Ground penetrating radar investigations of the geological structure of loose sediments at solid mineral deposits. E3S Web Conf. 2020, 192, 04005. [Google Scholar] [CrossRef]
- Francke, J. Advancements in Ground Penetrating Radar Technology for Mineral Exploration; GeoConvention: Calgary, AB, Canada, 2022; pp. 20–22. [Google Scholar]
- Bai, Z.K.; Zhou, W.; Wang, J.M. Re-discussion on restoration and reconstruction of mining ecosystem. China Land Sci. 2018, 32, 1–9. [Google Scholar]
- Cui, F.; Ni, J.; Du, Y.; Zhao, Y.; Zhou, Y. Soil water content estimation using ground penetrating radar data via group intelligence optimization algorithms: An application in the Northern Shaanxi Coal Mining Area. Energy Explor. Exploit. 2021, 39, 318–335. [Google Scholar] [CrossRef]
- Rey, J.; Mendoza, R.; Martínez, J.; Hidalgo, M.C.; Rodríguez, C.F. Combining geophysical methods (DC, IP, TDEM and GPR) to characterise mining waste in the Linares-La Carolina district (southern Spain). J. Environ. Manag. 2022, 322, 116166. [Google Scholar] [CrossRef]
- Sengani, F.; Zvarivadza, T. Review of pre-conditioning practice in mechanized deep to ultra-deep level gold mining. In Proceedings of the 26th International Symposium on Mine Planning and Equipment Selection (MPES2017), Luleå, Sweden, 29–31 August 2017. [Google Scholar]
- Daniels, J.J. Ground Penetrating Radar Fundamentals; Prepared as an Appendix to a Report to the US EPA, Region V; EPA: Washington, DC, USA, 2000; pp. 1–21. [Google Scholar]
- Zajícová, K.; Chuman, T. Application of ground penetrating radar methods in soil studies: A review. Geoderma 2019, 343, 116–129. [Google Scholar] [CrossRef]
- Sloan, S. A current look at geophysical detection of illicit tunnels. Lead. Edge 2015, 34, 154–158. [Google Scholar] [CrossRef]
- Capizzi, P.; Martorana, R.; Canzoneri, A.; Carollo, A.; Majani, M.V. 3D GPR Model in the Military District of San Giacomo Degli Spagnoli (Palermo). Heritage 2023, 6, 2601–2613. [Google Scholar] [CrossRef]
- Benedetto, A.; Pajewski, L. (Eds.) Civil Engineering Applications of Ground Penetrating Radar; Springer: Berlin/Heidelberg, Germany, 2015. [Google Scholar]
- Šarlah, N.; Podobnikar, T.; Ambrožič, T.; Mušič, B. Application of Kinematic GPR-TPS model with high 3D georeference accuracy for underground utility infrastructure mapping: A case study from urban sites in Celje, Slovenia. Remote Sens. 2020, 12, 1228. [Google Scholar] [CrossRef]
- Solla, M.; Fernández, N. GPR analysis to detect subsidence: A case study on a loaded reinforced concrete pavement. Int. J. Pavement Eng. 2023, 24, 2027420. [Google Scholar] [CrossRef]
- Bornik, A.; Neubauer, W. 3D Visualization Techniques for Analysis and Archaeological Interpretation of GPR Data. Remote Sens. 2022, 14, 1709. [Google Scholar] [CrossRef]
- Solla, M.; Maté-González, M.Á.; Blázquez, C.S.; Lagüela-López, S.; Nieto, I.M. Analysis of structural integrity through the combination of non-destructive testing techniques in heritage inspections: The study case of San Segundo’s hermitage (Ávila, Spain). J. Build. Eng. 2024, 89, 109295. [Google Scholar] [CrossRef]
- Diamanti, N.; Annan, A.P.; Giannakis, I. Predicting GPR performance for buried victim search & rescue. In Proceedings of the 2016 16th International Conference on Ground Penetrating Radar (GPR), Hong Kong, China, 13–16 June 2016; IEEE: Piscataway, NJ, USA, 2016; pp. 1–6. [Google Scholar]
- Ferrara, V. Technical survey about available technologies for detecting buried people under rubble or avalanches. WIT Trans. Built Environ. 2015, 150, 91–101. [Google Scholar]
- Bano, M.; Marquis, G.; Niviere, B.; Maurin, J.C.; Cushing, M. Investigating alluvial and tectonic features with ground-penetrating radar and analyzing diffractions patterns. J. Appl. Geophys. 2000, 43, 33–41. [Google Scholar] [CrossRef]
- Xie, P.; Wen, H.; Xiao, P.; Zhang, Y. Evaluation of ground-penetrating radar (GPR) and geology survey for slope stability study in mantled karst region. Environ. Earth Sci. 2018, 77, 122. [Google Scholar] [CrossRef]
- Lu, G.; Zhao, W.; Forte, E.; Tian, G.; Li, Y.; Pipan, M. Multi-frequency and multi-attribute GPR data fusion based on 2-D wavelet transform. Measurement 2020, 166, 108243. [Google Scholar] [CrossRef]
- Lombardi, F.; Lualdi, M. Multi-azimuth ground penetrating radar surveys to improve the imaging of complex fractures. Geosciences 2018, 8, 425. [Google Scholar] [CrossRef]
- Doetsch, J.; Krietsch, H.; Schmelzbach, C.; Jalali, M.; Gischig, V.; Villiger, L.; Maurer, H. Characterizing a decametre-scale granitic reservoir using ground-penetrating radar and seismic methods. Solid Earth 2020, 11, 1441–1455. [Google Scholar] [CrossRef]
- Chen, C.S.; Jeng, Y. GPR investigation of the near-surface geology in a geothermal river valley using contemporary data decomposition techniques with forward simulation modeling. Geothermics 2016, 64, 439–454. [Google Scholar] [CrossRef]
- Solla, M.; Blázquez, C.S.; Nieto, I.M.; Rodríguez, J.L.; Maté-González, M.Á. GPR application on geothermal studies: The case study of the thermal baths of San Xusto (Pontevedra, Spain). Remote Sens. 2022, 14, 2667. [Google Scholar] [CrossRef]
- Morin, D.; Rosenthal, P.; Photiades, A.; Delpech, S.; Jacquemot, D. Aegean mining technologies in Antiquity: A traceological approach: The Laurion mines (Greece). In Mines, Metals, and Money: Ancient World Studies in Science, Archaeology and History; Macquarie University: Macquarie Park, NSW, Australia; The Royal Numismatic Society: London, UK, 2020; Volume 6. [Google Scholar]
- Voudouris, P.; Melfos, V.; Mavrogonatos, C.; Photiades, A.; Moraiti, E.; Rieck, B.; Kolitsch, U.; Tarantola, A.; Scheffer, C.; Morin, D.; et al. The Lavrion mines: A unique site of geological and mineralogical heritage. Minerals 2021, 11, 76. [Google Scholar] [CrossRef]
- Skarpelis, N. The Lavrion deposit (SE Attica, Greece): Geology, mineralogy and minor elements chemistry. Neues Jahrb. Mineral.-Abh. 2006, 183, 227–250. [Google Scholar] [CrossRef]
- Vasileiou, E.; Kallioras, A. Interaction of mining activities and aquatic environment: A review from Greek mine sites. In EGU General Assembly Conference Abstracts; EGU: Vienna, Austria, 2016; p. EPSC2016-16606. [Google Scholar]
- Moser, F.; Conti, A.; Vanneschi, C.; Di Curzio, D.; Ippolito, A. Geophysical monitoring of tailings dams using ground penetrating radar: A pilot study. J. Appl. Geophys. 2020, 180, 104090. [Google Scholar]
- Novo, A.; Kaufmann, M. A Novel Web-Based Software for Automated Cloud Processing, AI-Assisted Analysis and 3D Visualization of GPR Data. In Proceedings of the 2023 12th International Workshop on Advanced Ground Penetrating Radar (IWAGPR), Lisbon, Portugal, 5–7 July 2023; IEEE: Piscataway, NJ, USA, 2023; pp. 1–4. [Google Scholar]
- Xiao, Y.; Gu, X.; Yin, S.; Shao, J.; Cui, Y.; Zhang, Q.; Niu, Y. Geostatistical interpolation model selection based on ArcGIS and spatio-temporal variability analysis of groundwater level in piedmont plains, northwest China. SpringerPlus 2016, 5, 425. [Google Scholar] [CrossRef]
- Panday, D.; Maharjan, B.; Chalise, D.; Shrestha, R.K.; Twanabasu, B. Digital soil mapping in the Bara district of Nepal using kriging tool in ArcGIS. PLoS ONE 2018, 13, e0206350. [Google Scholar] [CrossRef]
- Blázquez, C.S.; Maté-González, M.Á.; Nieto, I.M.; Martín, A.F.; Gonzalez-Aguilera, D. Assessment of the geothermal potential in the region of Ávila (Spain): An integrated and interactive thermal approach. Geothermics 2022, 98, 102294. [Google Scholar] [CrossRef]
- Bornmann, L. Skewed distributions of scientists’ productivity: A research program for the empirical analysis. Scientometrics 2024, 129, 2455–2468. [Google Scholar] [CrossRef]
- Maté-González, M.Á.; Rodríguez-Hernández, J.; Sáez Blázquez, C.; Troitiño Torralba, L.; Sánchez-Aparicio, L.J.; Fernández Hernández, J.; Herrero Tejedor, T.R.; Fabián García, J.F.; Piras, M.; Díaz-Sánchez, C.; et al. Challenges and possibilities of archaeological sites virtual tours: The Ulaca Oppidum (Central Spain) as a case study. Remote Sens. 2022, 14, 524. [Google Scholar] [CrossRef]
- Perikleous, D.; Margariti, K.; Velanas, P.; Blazquez, C.S.; Garcia, P.C.; Gonzalez-Aguilera, D. Application of Magnetometer-Equipped Drone for Mineral Exploration in Mining Operations. Drones 2024, 9, 24. [Google Scholar] [CrossRef]


| Element | Average Concentration | Maximum Concentration |
|---|---|---|
| Pb | 32,430 | 67,700 |
| As | 4517 | 10,800 |
| Cd | 160 | 600 |
| Cr | 4 | 10 |
| Ni | 150 | 300 |
| Zn | 47,843 | 97,900 |
| Mn | 9002 | 16,600 |
| Fe | 154,800 | 275,200 |
| Cu | 2548 | 6300 |
| GS8000 Technical Specifications | |
|---|---|
| Radar technology | Reduced Frequency Continuous Wave |
| Modulated frequency range | 40–3440 MHz |
| Effective bandwidth | 3200 MHz |
| Minimum detectable target size | 1 cm |
| Maximum depth of penetration | 10 m |
| Scan speed | 500 Hz |
| Spatial interval | Up to 100 scans/m |
| Acquisition speed | Up to 80 km/h |
| GNSS receiver | Multiband GPS + Glonass + Galileo + Beidou |
| Area | GPR Anomalies | Magnetic Susceptibility | Interpretation |
|---|---|---|---|
| Central Sector | Minimal GPR anomalies | Moderate to high | Intact geotextile layer, lack of correlation with ferromagnetic minerals |
| Southeastern Sector | High attenuation, disrupted geotextile | High | Correlation suggests possible chemical interaction or mechanical stress from ferromagnetic accumulation |
| Northern Sector | Moderate anomalies and infiltration signatures | Moderate to low | Localized structural degradation not necessarily associated with ferromagnetic mineral accumulations |
| Peripheral Zones | Localized discontinuities | Mixed values | Further investigation is required, possibly related to geomorphological variability |
Disclaimer/Publisher’s Note: The statements, opinions and data contained in all publications are solely those of the individual author(s) and contributor(s) and not of MDPI and/or the editor(s). MDPI and/or the editor(s) disclaim responsibility for any injury to people or property resulting from any ideas, methods, instructions or products referred to in the content. |
© 2025 by the authors. Licensee MDPI, Basel, Switzerland. This article is an open access article distributed under the terms and conditions of the Creative Commons Attribution (CC BY) license (https://creativecommons.org/licenses/by/4.0/).
Share and Cite
Sáez Blázquez, C.; Maté-González, M.Á.; Camargo Vargas, S.A.; Martín Nieto, I.; Protonotarios, V.; González-Aguilera, D. Ground Penetrating Radar for the Exploration of Complex Mining Contexts. Remote Sens. 2025, 17, 1911. https://doi.org/10.3390/rs17111911
Sáez Blázquez C, Maté-González MÁ, Camargo Vargas SA, Martín Nieto I, Protonotarios V, González-Aguilera D. Ground Penetrating Radar for the Exploration of Complex Mining Contexts. Remote Sensing. 2025; 17(11):1911. https://doi.org/10.3390/rs17111911
Chicago/Turabian StyleSáez Blázquez, Cristina, Miguel Ángel Maté-González, Sergio Alejandro Camargo Vargas, Ignacio Martín Nieto, Vasileios Protonotarios, and Diego González-Aguilera. 2025. "Ground Penetrating Radar for the Exploration of Complex Mining Contexts" Remote Sensing 17, no. 11: 1911. https://doi.org/10.3390/rs17111911
APA StyleSáez Blázquez, C., Maté-González, M. Á., Camargo Vargas, S. A., Martín Nieto, I., Protonotarios, V., & González-Aguilera, D. (2025). Ground Penetrating Radar for the Exploration of Complex Mining Contexts. Remote Sensing, 17(11), 1911. https://doi.org/10.3390/rs17111911