1. Introduction
Regarding the positioning challenges in indoor shielding environments, existing technical systems can be categorized into those that rely on external positioning anchors and those that utilize internal sensors [
1]. Solutions that depend on external anchors favor technologies such as ultra-wideband (UWB) positioning [
2], pseudolite positioning [
3], cellular network positioning [
4], long-range (LoRa) positioning [
5], and wireless local area network (WLAN) positioning [
6] due to their independence and high precision. Each of these technologies offers unique advantages, addressing the positioning needs in various indoor shielding scenarios. Notably, pseudolite positioning technology is recognized for its compatibility with both indoor and outdoor environments as well as its high precision, reliability, and flexible deployment [
7], making it widely applicable in indoor and underground shielding environments. However, in practical applications, the performance of pseudolite-based positioning technology is often affected by several factors, including the geometric layout of anchors, non-line-of-sight (NLOS) propagation, multi-path effects, and near-far effects. In particular, the geometric arrangement of anchors directly influences signal propagation links and measurement accuracy, which are critical factors in determining the precision of position calculations. In addition, artificial intelligence (AI) methods have demonstrated significant advantages in improving indoor positioning accuracy. Techniques such as machine learning and computational intelligence algorithms have been widely applied in areas including signal processing [
8], path prediction, and environmental modeling. These approaches can effectively enhance the robustness and accuracy of positioning in complex environments. Reference [
9] proposed a deep learning-based pseudo-satellite fingerprint localization method. By thoroughly analyzing signal characteristics under specific base station layouts and geometric configurations and integrating efficient signal feature extraction techniques with a deep learning model, this approach achieves high-precision fingerprint matching and localization performance.
In the field of indoor pseudolite anchor layout, researchers have conducted extensive investigations. Reference [
10] proposed a K-means-enhanced generalized central-guide firefly algorithm (KGFA) to optimize the pseudolite constellation layout within railway stations, where GNSS signals are limited, with the goal of achieving seamless train positioning. However, this method does not take into account practical factors such as multi-path effects and non-line-of-sight (NLOS) reception in pseudolite signal propagation, nor has it been validated through actual deployment. Reference [
11] introduced a ground-based pseudolite positioning system anchor layout method based on the NSGA-II algorithm, which innovatively optimizes both signal coverage and positioning accuracy simultaneously. By employing a multi-objective optimization model combined with visual field analysis and dilution of precision (DOP) design, this approach significantly enhances overall system performance. Nevertheless, it does not consider complex factors such as electromagnetic interference and the challenges of anchor installation in real-world environments, highlighting the need for further improvements to enhance its practical applicability. Reference [
12] introduced a geometric layout method for synchronized pseudolite positioning systems that utilizes weighted horizontal dilution of precision (WHDOP). By innovatively simplifying the closed-form equation for calculating WHDOP, the method reduces computational load and incorporates simulated annealing algorithms to optimize pseudolite layouts, making significant contributions to the field. However, the application of this method may be constrained by multi-path effects in complex indoor environments, and it does not sufficiently address layout optimization in dynamic scenarios. This indicates potential avenues for future research to enhance its applicability. Reference [
13] proposed a deployment algorithm for ground-based pseudolite systems that utilizes the multi-objective particle swarm optimization (MOPSO) algorithm. This innovative approach incorporates digital elevation model (DEM) data to enhance both the signal coverage range and the average horizontal dilution of precision (HDOP) of the pseudolite system. Through visibility analysis and geometric configuration optimization, the algorithm demonstrates superior performance compared to traditional particle swarm optimization (PSO) and convex polyhedron volume optimization (CPVO) algorithms in terms of coverage and positioning accuracy. However, this study relied solely on simulation experiments and did not account for practical factors, such as the ranging capabilities of pseudolites in real-world deployments, which could impact the algorithm’s effectiveness in practical applications. Reference [
14] introduced a GDOP geometry-based layout method for space pseudolite systems that significantly enhances positioning accuracy and robustness by optimizing the mean and root mean square GDOP values for users within the target area. Its innovation lies in the rapid generation of pseudolite deployment schemes, starting from the minimum GDOP value in the central region. Compared to empirical methods and the NSGA-II algorithm, this approach demonstrates lower average GDOP values and improved positioning accuracy. However, the study lacked validation of the actual system and did not investigate optimization strategies for coordinating multiple UAVs to cover larger areas, indicating potential directions for future research.
It is evident from the aforementioned research that most current studies on the optimization of indoor pseudolites anchor layouts primarily focus on dilution of precision (DOP) as the objective function for optimization. However, DOP was originally developed for outdoor large-scale unobstructed satellite navigation, with its evaluation perspective largely based on the geometric distribution between satellites and receivers. Its primary aim is to assess how satellite layout affects positioning accuracy. In indoor environments, however, the limited spatial scale and the prevalence of numerous obstructions lead to significantly more severe multi-path effects and NLOS propagation issues compared to outdoor settings. Consequently, while DOP provides some reference values regarding the geometric influence on positioning accuracy, its limitations in indoor positioning scenarios hinder its effectiveness as a definitive evaluation criterion for optimizing pseudolites anchor layouts. Thus, developing a reasonable and comprehensive method to evaluate the performance of anchor layouts has become a critical challenge that needs to be addressed.
In this paper, we conduct a comprehensive systematic study on the requirements for optimizing the layout of pseudolites anchors in indoor masked environments, with the goals of enhancing system availability and positioning accuracy. The primary innovative contributions include the following:
Evaluation System Innovation: To address the limitations of traditional single-indicator evaluation methods, we propose a multi-dimensional evaluation system. This system establishes a framework that comprehensively assesses system availability and positioning accuracy through an in-depth analysis of the data characteristics of number of visible pseudolites (NVPS) and horizontal dilution of precision (HDOP). This approach provides a robust scientific foundation for optimizing layout;
Algorithm Model Innovation: This paper introduces a scene initialization method based on the minimum GDOP configuration. The theory of geometric accuracy is skillfully integrated into the initial solution generation process. A detailed analysis of indoor spatial features is conducted to establish an optimal initial solution distribution model, significantly enhancing both the quality of the algorithm’s starting point and its optimization efficiency;
Innovation in Optimization Mechanisms: A segmented adaptive linear decreasing strategy is developed, allowing for the dynamic adjustment of the inertia weights’ decreasing rate. This approach addresses the limitations of fixed modes that cannot flexibly respond to changes in the optimal configuration. By integrating stability analysis using the Lyapunov function, this method ensures the progressive stability of the search process, significantly enhancing the overall performance and efficiency of the optimization algorithm;
Algorithm Framework Innovation: The MG-MOPSO algorithm framework is designed and implemented to successfully integrate geometric configuration theory with intelligent optimization technology. This framework offers a comprehensive set of solutions for optimizing indoor pseudolites layouts. It effectively tackles the challenges of local optimization traps and slow convergence speeds in complex environments, significantly enhancing both the global search capability and convergence efficiency of the solutions.
The chapters of this paper are organized as follows:
Section 2 presents related work pertinent to the optimization of indoor pseudolite base station layouts;
Section 3 introduces the materials and methods, including the design and implementation of the MG-MOPSO algorithm as well as the performance evaluation metrics;
Section 4 provides the experimental results along with comparative analyses.
Section 5 discusses the findings, and
Section 6 concludes the paper and outlines directions for future research.
These innovative works offer new theoretical methods and technical approaches for optimizing pseudolites layouts in complex indoor environments. They hold significant theoretical value and practical importance for enhancing the performance of indoor positioning systems.
3. Materials and Methods
3.1. Multi-Objective Particle Swarm Optimization
The optimization of indoor pseudolite anchor layout is influenced by multiple factors and is therefore considered a combinatorial optimization problem under multi-constraint conditions. In the early stages of research on multi-objective optimization problems (MOPs), traditional approaches such as the weighted sum method, goal programming, and distance function method were primarily used to transform complex MOPs into single-objective problems for solution. However, these methods are heavily reliant on prior knowledge and often require multiple runs to approximate the optimal solution. When dealing with high-dimensional, complex, dynamic, or constrained multi-objective problems, such approaches frequently fail to yield a well-distributed set of optimal solutions [
20].
In recent years, the Pareto-based method has become the dominant approach due to its ability to overcome the limitations of traditional techniques. This method generates a set of Pareto-optimal solutions to represent the trade-offs among conflicting objectives effectively. To ensure robustness and reliability in optimization results, many contemporary studies have adopted metaheuristic algorithms, including population-based [
21,
22,
23], evolutionary-based [
24], and physics-inspired methods [
25].
Among them, particle swarm optimization (PSO), an evolutionary algorithm inspired by the foraging behavior of bird flocks, was first proposed by Kennedy and Eberhart in 1995 [
26]. PSO retains the global search strategy characteristic of population-based methods and integrates the advantages of evolutionary computation and swarm intelligence. It is particularly favored for its simplicity of implementation and ease of model manipulation.
In 2002, Coello and Lechuga [
27] introduced the MOPSO algorithm. By incorporating the Pareto dominance concept to guide particle movements, establishing a global archive to store non-dominated solutions, and maintaining population diversity via a hypercube-based spatial division strategy, they successfully extended PSO from single-objective to multi-objective optimization. Today, MOPSO has been widely applied in fields such as production scheduling [
28], intelligent control [
29], and product design [
30].
In MOPSO, the quality of the initial solutions significantly affects both the convergence speed and the performance of the final solutions. Standard MOPSO often employs random initialization of particle positions. However, in complex scenarios, this may lead to uneven distribution of initial particles and their positions being far from the Pareto front, which increases the number of iterations required for convergence and reduces both efficiency and optimization accuracy. This challenge is particularly evident in the optimization of pseudolite anchor deployment in obstructed indoor environments, where the layout must satisfy specific geometric constraints. Under such conditions, random initialization may fail to fully exploit prior knowledge and environmental characteristics.
3.2. Indoor Pseudolite Anchor Layout Optimization Algorithm Based on MG-MOPSO
3.2.1. MG-MOPSO Population Initialization
In light of the multi-objective pseudolite anchor layout optimization problem under indoor obstructed environments, this study proposes an improved initialization strategy for MOPSO, termed the scenario-based initialization MOPSO. The MG-MOPSO algorithm introduces the minimum GDOP two-dimensional single-point positioning configuration as the initial solution. By fully leveraging the geometric characteristics of the indoor environment, the method generates high-quality and uniformly distributed initial solutions. This configuration-based initialization approach not only effectively satisfies the geometric constraints of anchor deployment but also significantly enhances both the convergence speed and the performance of the final solutions.
Standard MOPSO methods often rely on random initialization, which can lead to an uneven distribution of the initial population. If the initial solutions are far from the Pareto front, the number of iterations required to converge increases, thereby reducing the efficiency and accuracy of the optimization. To address this issue, this study incorporates the geometric characteristics of the environment and utilizes the optimal configuration from the minimum GDOP-based two-dimensional single-point positioning to refine the initialization process of MOPSO. This enhancement improves the quality, diversity, and convergence speed of the initial population, ensuring that the algorithm approaches the optimal solution region at an early stage and improves the overall optimization performance.
In the context of minimum GDOP two-dimensional single-point positioning, different numbers of pseudolite anchors correspond to different optimal geometric configurations (e.g., equilateral triangle, square, or regular hexagon) [
31]. During population initialization in MOPSO, the initial positions of particles are set at the vertices of these optimal configurations. Taking the center of the target area as the origin, the coordinates of the optimal configuration vertices for pseudolite anchors are formulated in this study as follows:
where
represents the radius of the optimal configuration, which is dynamically adjusted based on the size of the target area;
denotes the initial rotation angle, which is set to 0° by default but can be randomly perturbed to enhance diversity.
indicates the number of pseudolite anchors.
To enhance population diversity and avoid premature convergence to local optima, this study adopts a hybrid initialization strategy that balances the quality and diversity of the initial population. A portion of the particles in the initial population is directly positioned at the vertex coordinates of the minimum GDOP configuration, with their locations precisely computed using Equation (27). The remaining particles are randomly distributed within the feasible solution space. This “optimal configuration guidance + random sampling” hybrid strategy leverages prior knowledge to accelerate convergence while maintaining global search capability through stochastic exploration, thereby significantly improving the optimization efficiency and robustness of the algorithm.
In this work, a “hybrid initialization strategy based on optimal configuration guidance and random sampling” is adopted, wherein 50% of the particles are precisely initialized using analytical solutions, while the remaining 50% are randomly distributed within the feasible domain. This design ensures a balance between convergence speed and global exploration ability.
3.2.2. Velocity and Position Update
The particle swarm optimization (PSO) algorithm is a population-based intelligent optimization algorithm inspired by the foraging behavior of bird flocks. Its core concept lies in achieving efficient search through group cooperation and information sharing. By simulating social group behavior, PSO establishes an intelligent optimization framework based on population collaboration.
In PSO, each particle represents a potential solution in the search space. The state of motion of each particle is updated according to the following equations [
26]:
3.2.3. Piecewise Adaptive Linear Decreasing Strategy for Inertia Weight Update
The MG-MOPSO algorithm, as an extension of the MOPSO algorithm in the field of multi-objective optimization, inherits the core mechanisms of MOPSO. The standard MOPSO algorithm uses a fixed inertia weight, which, due to its static parameter setting, often leads the algorithm to fall into local optima. Research has shown that among all the parameters in the MOPSO algorithm, the adjustment of the inertia weight has the most significant impact on the algorithm’s performance.
Currently, the mainstream inertia weight-adjustment strategy adopts a linear decreasing method [
27]:
Although this method is simple to implement, it has three main drawbacks:
It does not utilize the prior knowledge provided by the optimal configuration initialization, and the fixed decreasing pattern fails to respond to the dynamic changes in configuration stability;
The linear decreasing strategy does not synchronize with the degradation process of the optimal configuration;
It cannot automatically adjust the decreasing rate based on the actual search status.
To address the limitations of the linear decreasing inertia weight-adjustment strategy, we propose a piecewise adaptive linear decreasing strategy, defined as follows:
In Equations (30) and (31), denotes the maximum inertia weight; denotes the minimum inertia weight; represents the initial slope; represents the later-stage slope; is the inflection point; and is the maximum number of iterations.
According to the stability analysis based on the Lyapunov function, when the iteration process reaches 30% of the total duration, the system state variables satisfy [
32]
where
denotes the mathematical model for anchor layout optimization, and
represents the number of iterations.
At this point, switching the search strategy can ensure the asymptotic stability of the convergence process. Therefore, is adopted in this study as the inflection point between the exploration and exploitation phases.
Figure 2 presents a comparison of inertia weights under two decreasing strategies. For the piecewise adaptive linear decreasing strategy, the inertia factor exhibits a piecewise linear relationship with time, with the inflection point set at
t = 30. As shown in
Figure 2, the proposed strategy adopts a relatively steep slope during the early iteration phase (
), enabling a rapid decline that facilitates quick localization of potential optimal regions. In the later iteration phase (
), the slope becomes gentler, allowing for a more gradual descent that ensures convergence precision while reducing the risk of being trapped in local optima.
In contrast, the conventional linear decreasing strategy maintains a constant rate of change throughout the entire iteration process. Although it is simple to implement, it lacks the ability to adaptively adjust according to different stages of the optimization process. Through this comparison, it is evident that the piecewise adaptive strategy achieves a better balance between global exploration and local exploitation by dynamically adjusting the decreasing rate.
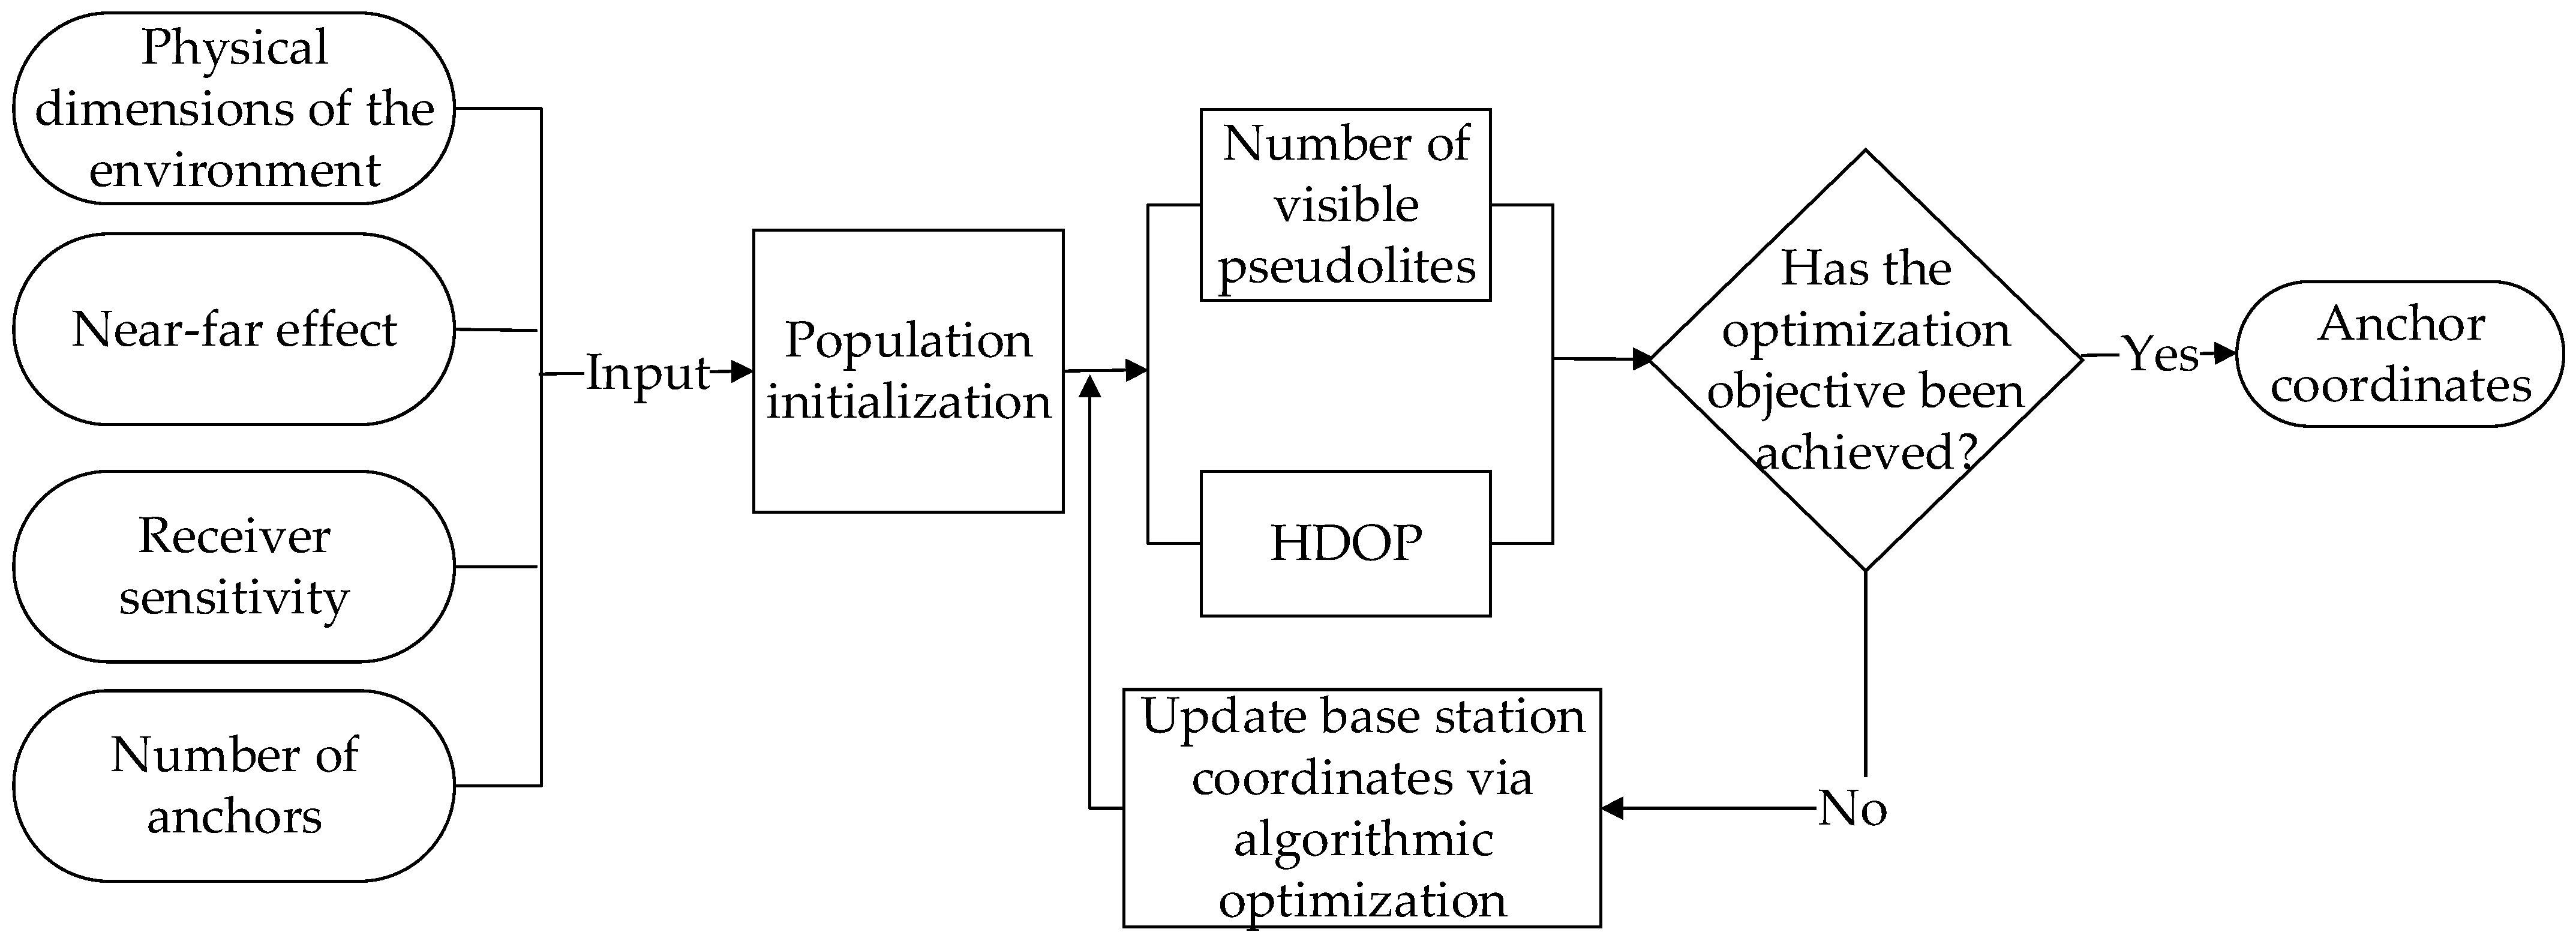
3.3. Basic Process of MG-MOPSO Algorithm
The steps of the MG-MOPSO algorithm are as follows:
Step 1: Initialization
In the initialization phase, the constrained and trusted deployment areas for pseudolites anchors in indoor obstructed environments are first identified, and the number of anchors is determined. The algorithm is then initialized by setting the population size. Based on the minimization of the GDOP, the population is initialized to improve optimization efficiency. Key parameters such as learning factors, inertia weights, particle velocities, and external archive size are also initialized.
Step 2: Objective Function Evaluation and Initial Archive Construction
At each ground sampling point, NVPS and HDOP data are collected. Multi-objective function values are calculated using minimization and normalization processing methods. Non-dominated solutions are filtered according to the Pareto dominance relationship and stored in the external archive to construct the initial archive. Simultaneously, the personal best position (pBest) of each particle and the global best position (gBest) of the swarm are determined.
Step 3: Velocity and Position Update
The particle velocities and positions are updated using a piecewise adaptive linear decreasing strategy to dynamically adjust the inertia weight. This strategy flexibly adapts the inertia weight based on the actual search process, effectively avoiding the issue of premature convergence caused by fixed inertia weights in conventional algorithms. This mechanism enhances the global exploration capability of the algorithm and increases the likelihood of obtaining better solutions.
Step 4: Update of Personal and Global Best Positions and Archive
In each iteration, the multi-objective function values of all particles are recalculated. Based on the evaluation results, each particle’s personal best and the global best of the swarm are updated. The external archive is also updated according to the current non-dominated solutions, ensuring that it always maintains the most optimal non-dominated set. This step is critical for maintaining both diversity and convergence of the algorithm.
Step 5: Termination Condition Check
The algorithm checks whether the predefined termination condition has been met. If not, the iteration count is incremented by one, and the process returns to Step 3. Once the termination condition is satisfied, the algorithm proceeds to the final step. This mechanism ensures that the optimization process terminates at an appropriate time, preventing unnecessary consumption of computational resources.
Step 6: Output of Results
Upon meeting the termination condition, the final non-dominated solution set is output, marking the end of the algorithm. These solutions represent the optimized pseudolites anchor layout under indoor obstructed conditions, balancing system availability and positioning accuracy and providing a scientifically grounded reference for practical deployment.
The basic process of the MG-MOPSO algorithm is illustrated in
Figure 3.
3.4. Simulation and Performance Evaluation of the MG-MOPSO Algorithm
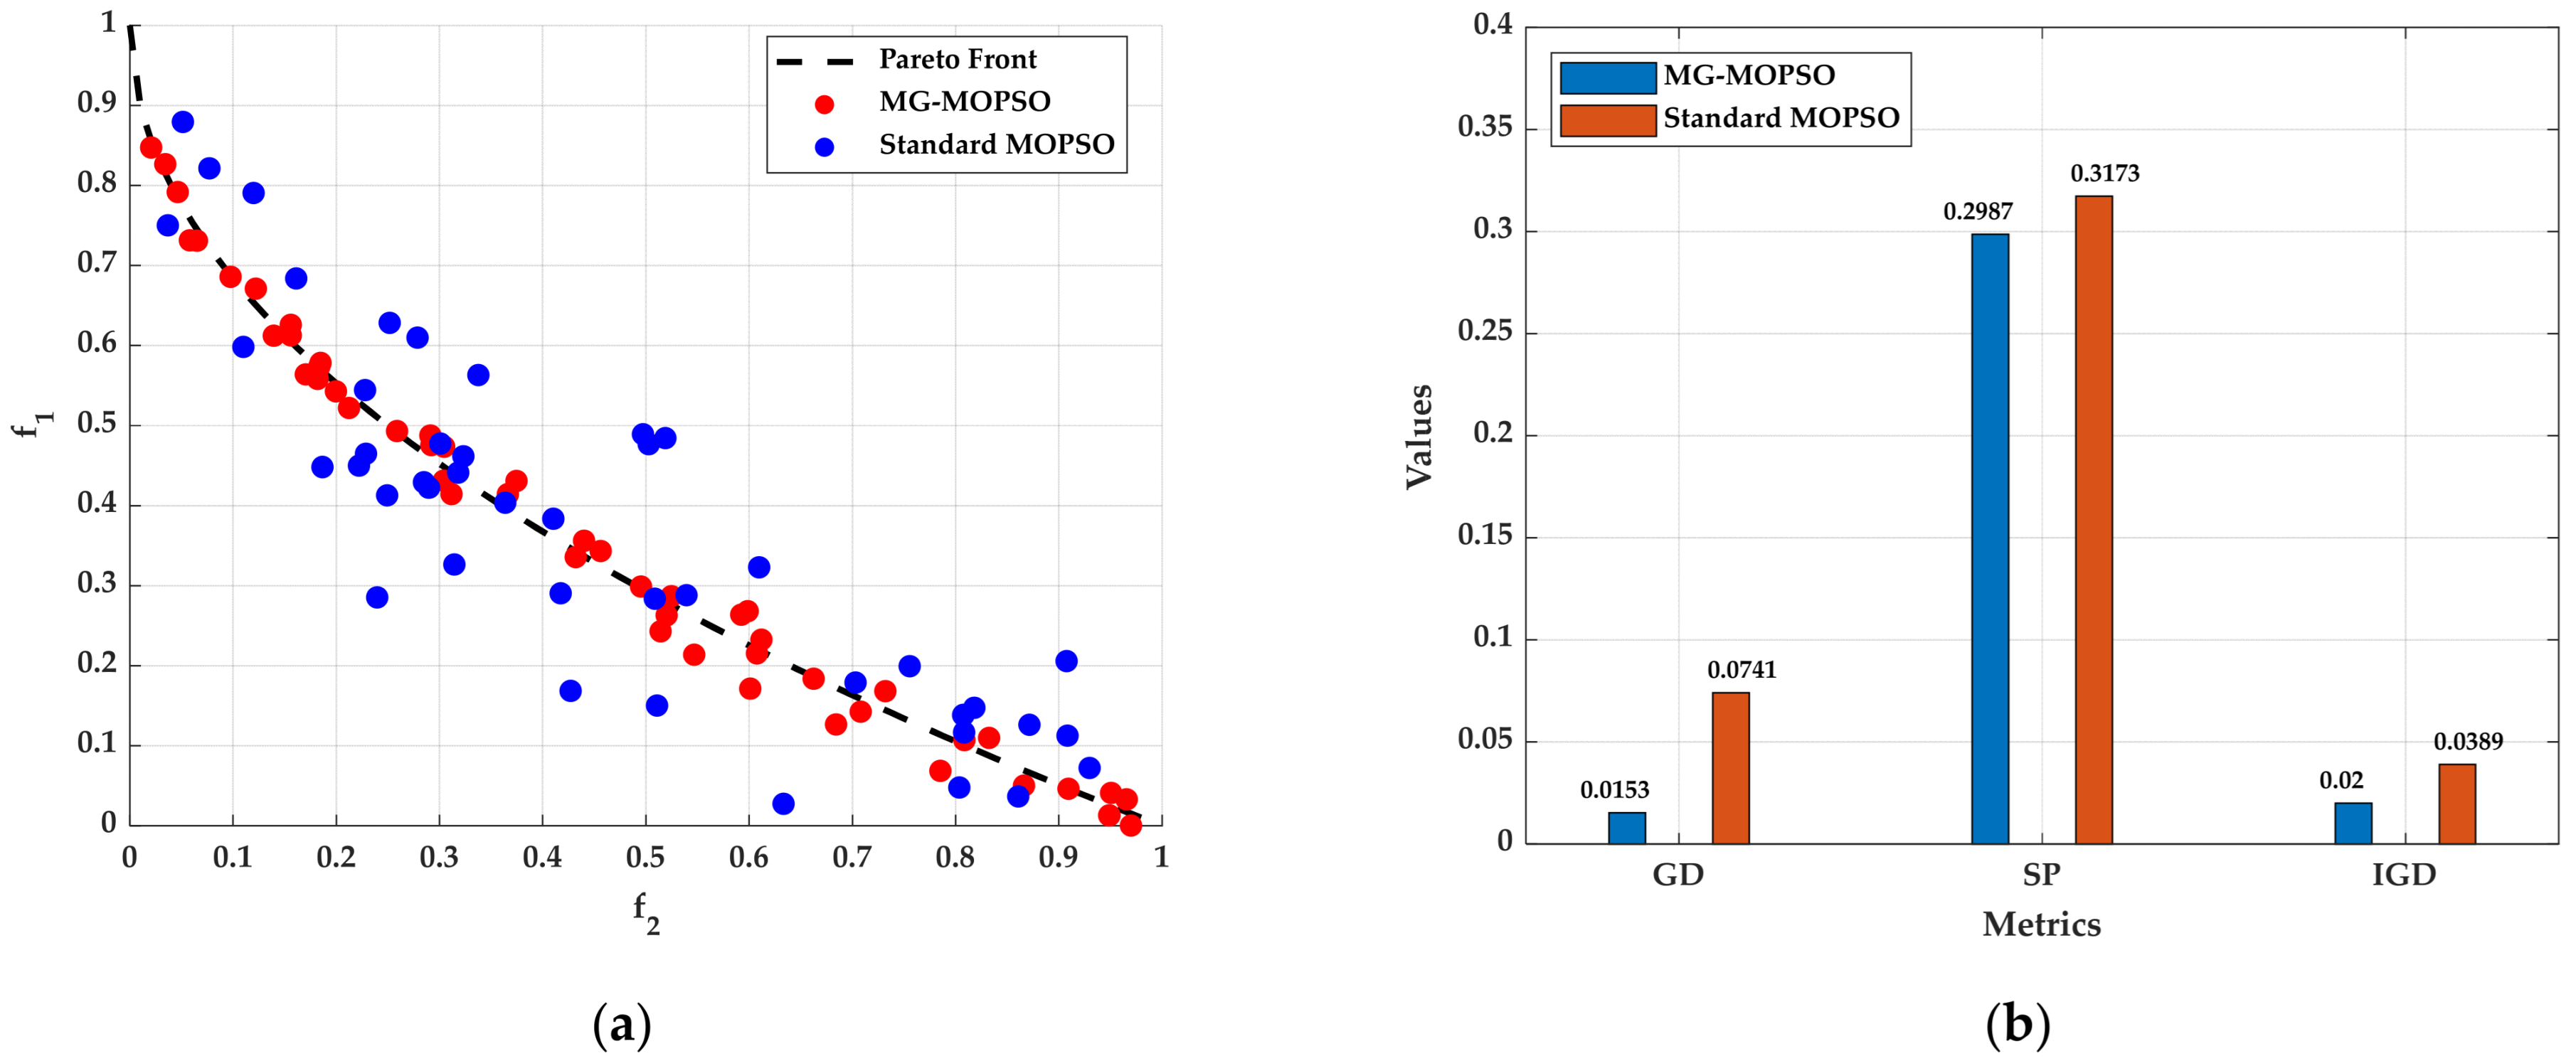
To evaluate the performance of the MG-MOPSO algorithm, we conducted a comparative analysis against the standard MOPSO [
26] algorithm under identical conditions. Experiments were performed using three benchmark test functions: ZDT1, ZDT2, and ZDT3. The performance of both algorithms was assessed using three widely adopted performance metrics: spread (SP), generational distance (GD), and inverted generational distance (IGD), where lower values indicate better optimization performance [
33].
The specific parameter settings for the MG-MOPSO algorithm are as follows: the population size was set to 100, the maximum number of iterations was 100, and the external archive size was also set to 100. The learning factors were both set to 2, while the maximum and minimum values of the inertia weight were set to 0.9 and 0.4, respectively. All simulations were conducted on a hardware platform with the following specifications: CPU—Intel(R) Core (TM) i7-12700H @ 2.3 GHz; RAM—40.0 GB; Operating system—Windows 11 Home Edition; Software environment—MATLAB R2021a.
To comprehensively assess the performance of MG-MOPSO compared to the standard MOPSO in solving multi-objective optimization problems, extensive experiments were conducted using consistent parameter configurations for both algorithms. The results were analyzed using both visual and quantitative methods.
Figure 4a illustrates the Pareto fronts generated by MG-MOPSO and standard MOPSO, in comparison with the true Pareto front.
Figure 4b presents the quantitative analysis results based on the SP, GD, and IGD performance metrics.
In
Figure 4a, the experimental results demonstrate that, on the ZDT1 test function, MG-MOPSO exhibits superior convergence capabilities, achieving solutions that are closer to the true Pareto front. Furthermore, it delivers excellent performance in terms of the uniformity of solution distribution, providing a more comprehensive and diverse set of solutions.
In
Figure 4b, the experimental results demonstrate that across all three key performance indicators—generational distance (GD), spread (SP), and inverted generational distance (IGD)—MG-MOPSO significantly outperforms standard MOPSO.
In summary, the MG-MOPSO algorithm enhances solution quality for multi-objective optimization problems by incorporating a scenario initialization strategy based on the minimum GDOP configuration. Compared to the standard MOPSO, MG-MOPSO demonstrates significant advantages in both convergence and distribution uniformity, resulting in more accurate and widely distributed Pareto-optimal solutions. These findings affirm its superior performance and practical applicability in tackling complex multi-objective optimization challenges.
4. Results and Discussion
4.1. Experimental Environment
To evaluate the practical performance of the proposed anchor deployment optimization method, field tests were conducted on the first floor of the Artificial Intelligence Navigation Test Field at the State Key Laboratory of Satellite Navigation System and Equipment Technology. The test area measures approximately 22 m in length, 12 m in width, and 13 m in height. Within the test zone, four reinforced concrete columns act as fixed obstacles, influencing signal transmission.
Figure 5a presents the actual testing environment. As illustrated in
Figure 5b, red squares represent reinforced concrete columns that may obstruct signal propagation, purple star markers (labeled 1# to 5#) indicate test points used for evaluating the positioning performance, and green rectangular regions labeled R1 and R2 denote restricted zones where signal transmission or anchor deployment is prohibited.
Due to environmental constraints, pseudolite anchors were only allowed to be deployed on the ceiling of the test area. Additionally, the left and right edges of the ceiling were defined as restricted regions. The center of the ground area was chosen as the origin of the coordinate system. The test area was defined with the following bounds: , , and meters.
Based on structural limitations, anchors could not be installed in the left and right sides of the ceiling. According to Equation (11), the restricted area on the left is defined as , , and , while the right restricted area is defined as , , and .
For the -th anchor, its coordinate must satisfy the constraint derived from Equation (13); i.e., it must lie within the permissible deployment region .
This experiment focuses on the 2D positioning deployment optimization of four pseudolite anchors in an indoor environment. According to Equation (19), the number of anchors satisfies .
The ground positioning area was divided into a grid with 1 m intervals in both the length and width directions. Each sampling point was located at the center of a grid cell. Based on the calculation from Equation (24), a total of 299 sampling points were generated within the entire test region.
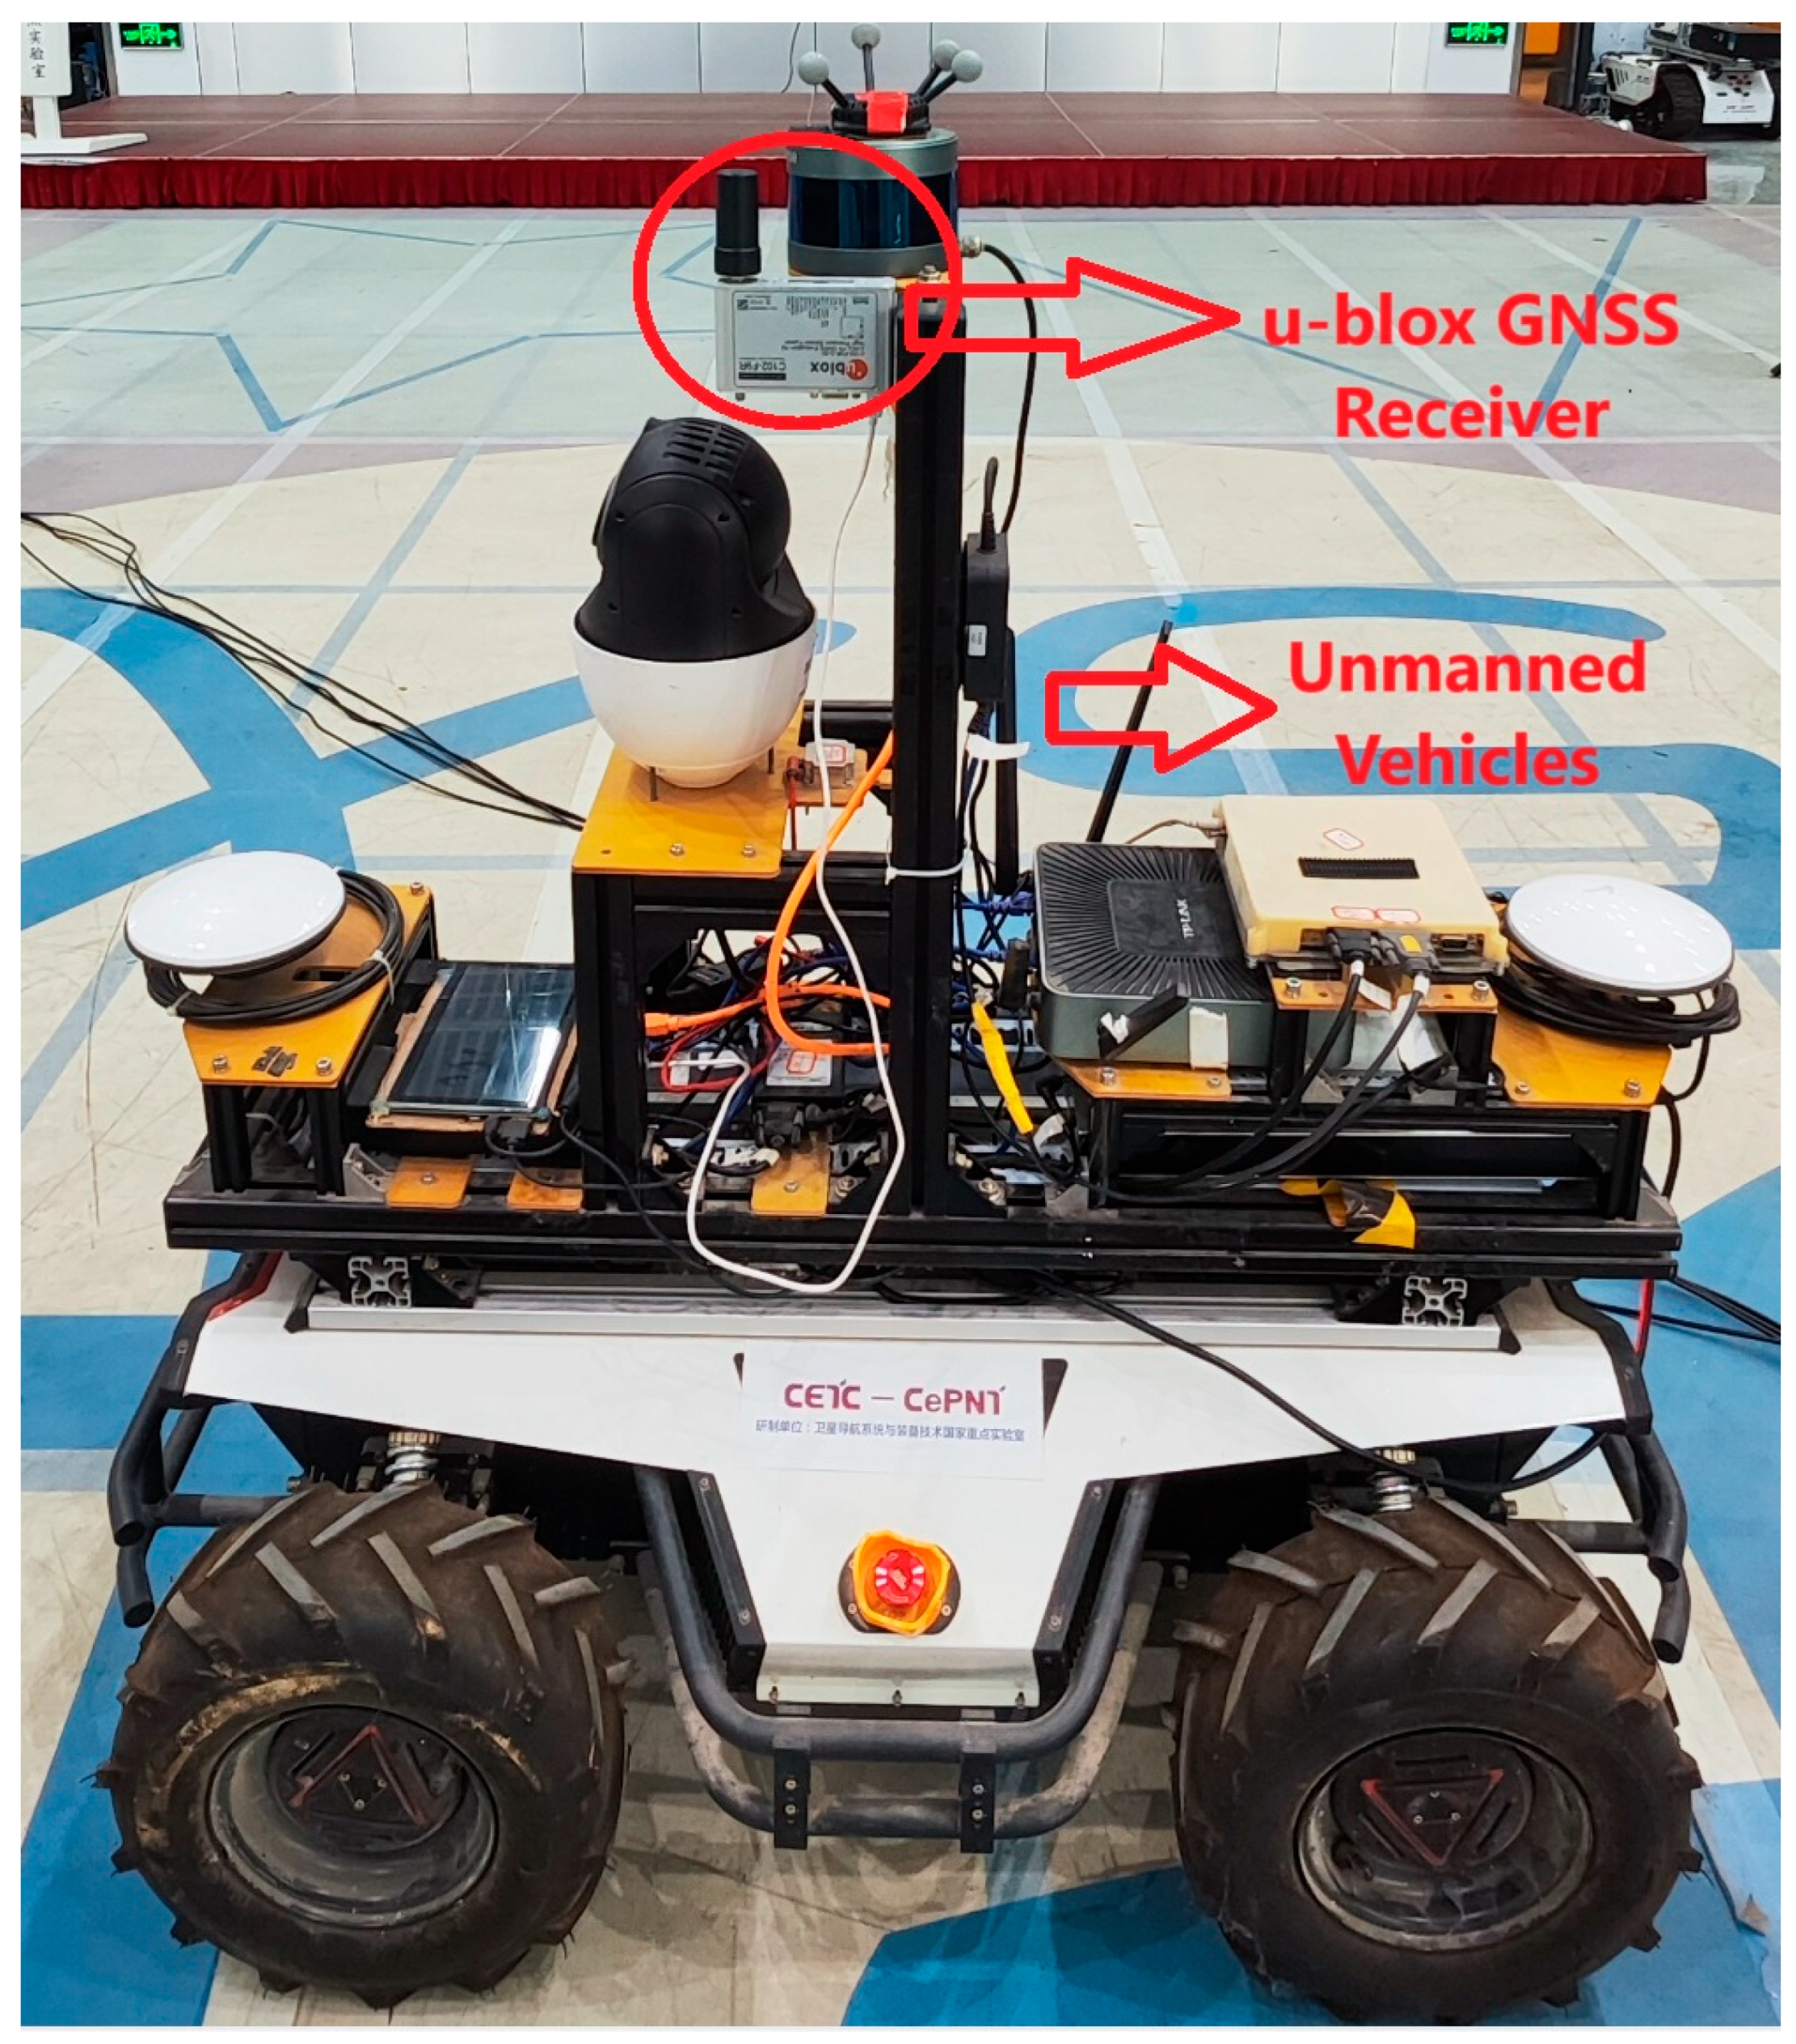
An autonomous ground vehicle data collection platform was used in the experiment. The platform was equipped with a U-blox receiver integrated with a high-gain external antenna (as shown in
Figure 6). The receiver continuously received indoor pseudolite signals, and raw observational data were extracted after preprocessing. For each sampling point, the NVPS was calculated and recorded.
Additionally, five ground test points were randomly placed within the region to evaluate positioning accuracy under different anchor deployment strategies. Among them, points #1, #2, #4, and #5 were located near obstacles with significant multi-path interference, while point #3 was in an open area with minimal interference.
Figure 5b illustrates the grid of ground sampling points, test points, and the ground projections of restricted anchor deployment regions.
4.2. Experimental Analysis
4.2.1. Comparative Analysis of the Optimization Processes
To ensure fairness and consistency in the comparison of algorithms, MG-MOPSO, standard MOPSO [
13], and NSGA-II [
11] were implemented under identical experimental conditions, utilizing the same objective functions and search space. The parameter settings for MG-MOPSO and standard MOPSO are as follows: a population size of 100, a maximum number of iterations set to 100, an external archive size of 100, learning factors set to 2, and an inertia weight that decreases linearly from 0.9 to 0.4. To ensure a fair comparison with state-of-the-art methods, the NSGA-II algorithm was reproduced following the configuration outlined by Li et al. [
11]. The parameters were set as follows: a population size of 80, a maximum of 100 iterations, a crossover probability of 0.8, and a mutation probability of 0.01. Tournament selection, multipoint crossover, and multipoint mutation techniques were employed. Both non-dominated sorting and crowding distance calculations were implemented using standard methods.
To mitigate the effects of randomness, each algorithm was executed independently 10 times, and the results were averaged for comparative analysis.
Figure 7 illustrates the convergence trajectories of the three algorithms concerning the two objective functions:
(the NVPS objective function) and
(the HDOP objective function).
Detailed numerical comparisons are summarized in
Table 1, which highlights the performance differences in convergence and final objective values among all three algorithms.
Table 1 provides a comparative analysis of the convergence speed and optimization accuracy of MG-MOPSO, standard MOPSO, and NSGA-II. In terms of convergence iterations, MG-MOPSO achieved convergence in 44 and 46 iterations for the two objective functions, respectively. These results indicate improvements of 21.43% and 25.81% compared to standard MOPSO and 33.33% and 36.99% relative to NSGA-II.
With respect to the final objective values, MG-MOPSO attained the lowest values for both optimization objectives, specifically 0.18 and 0.24. These findings represent relative enhancements of 29.41% and 36.84% over standard MOPSO and 10.00% and 29.41% over NSGA-II, respectively.
Overall, these results provide compelling evidence that MG-MOPSO not only exhibits superior convergence speed but also yields enhanced solutions in terms of optimization accuracy.
4.2.2. Comparative Evaluation of Pareto Fronts
To comprehensively evaluate the performance of the Pareto solution sets obtained from the three algorithms, this study employed the hypervolume (HV) metric for quantitative analysis, using a reference point set at (0, 0). The experimental results indicate that MG-MOPSO achieves an HV value of 0.0666, representing improvements of 16.8% and 14.7% over standard MOPSO (0.0570) and NSGA-II (0.0581), respectively. These findings demonstrate that MG-MOPSO exhibits superior performance in terms of both Pareto front convergence and solution set diversity. Its enhanced multi-objective optimization capability significantly improves the quality of the resulting Pareto sets.
As illustrated in
Figure 8, the diversity of the Pareto solution distribution is further evaluated using the area coverage metric. This metric is defined as the area of the bounding rectangle that encloses the Pareto front in the objective space—a larger area indicates better distribution diversity.
- (1)
In the case of MG-MOPSO (illustrated in
Figure 8a), the Pareto solutions, denoted by black squares, are uniformly distributed over the intervals
and
, resulting in an area coverage of 0.252;
- (2)
For the standard MOPSO (shown in
Figure 8b), the Pareto solutions, represented by black triangles, are concentrated within a narrower range of
and
. This results in an area coverage of 0.129, which is 48.8% lower than that of MG-MOPSO;
- (3)
Regarding NSGA-II (depicted in
Figure 8c), while the Pareto solutions (indicated by black dots) demonstrate continuity, they are primarily distributed within the ranges of
and
. This corresponds to an area coverage of 0.195, which is 22.6% lower than that of MG-MOPSO.
The findings indicate that MG-MOPSO exhibits a significant advantage in distribution diversity when compared to both standard MOPSO and NSGA-II. This underscores the effectiveness of its segmented adaptive weighting strategy in improving global exploration and reducing the risk of premature convergence to local optima.
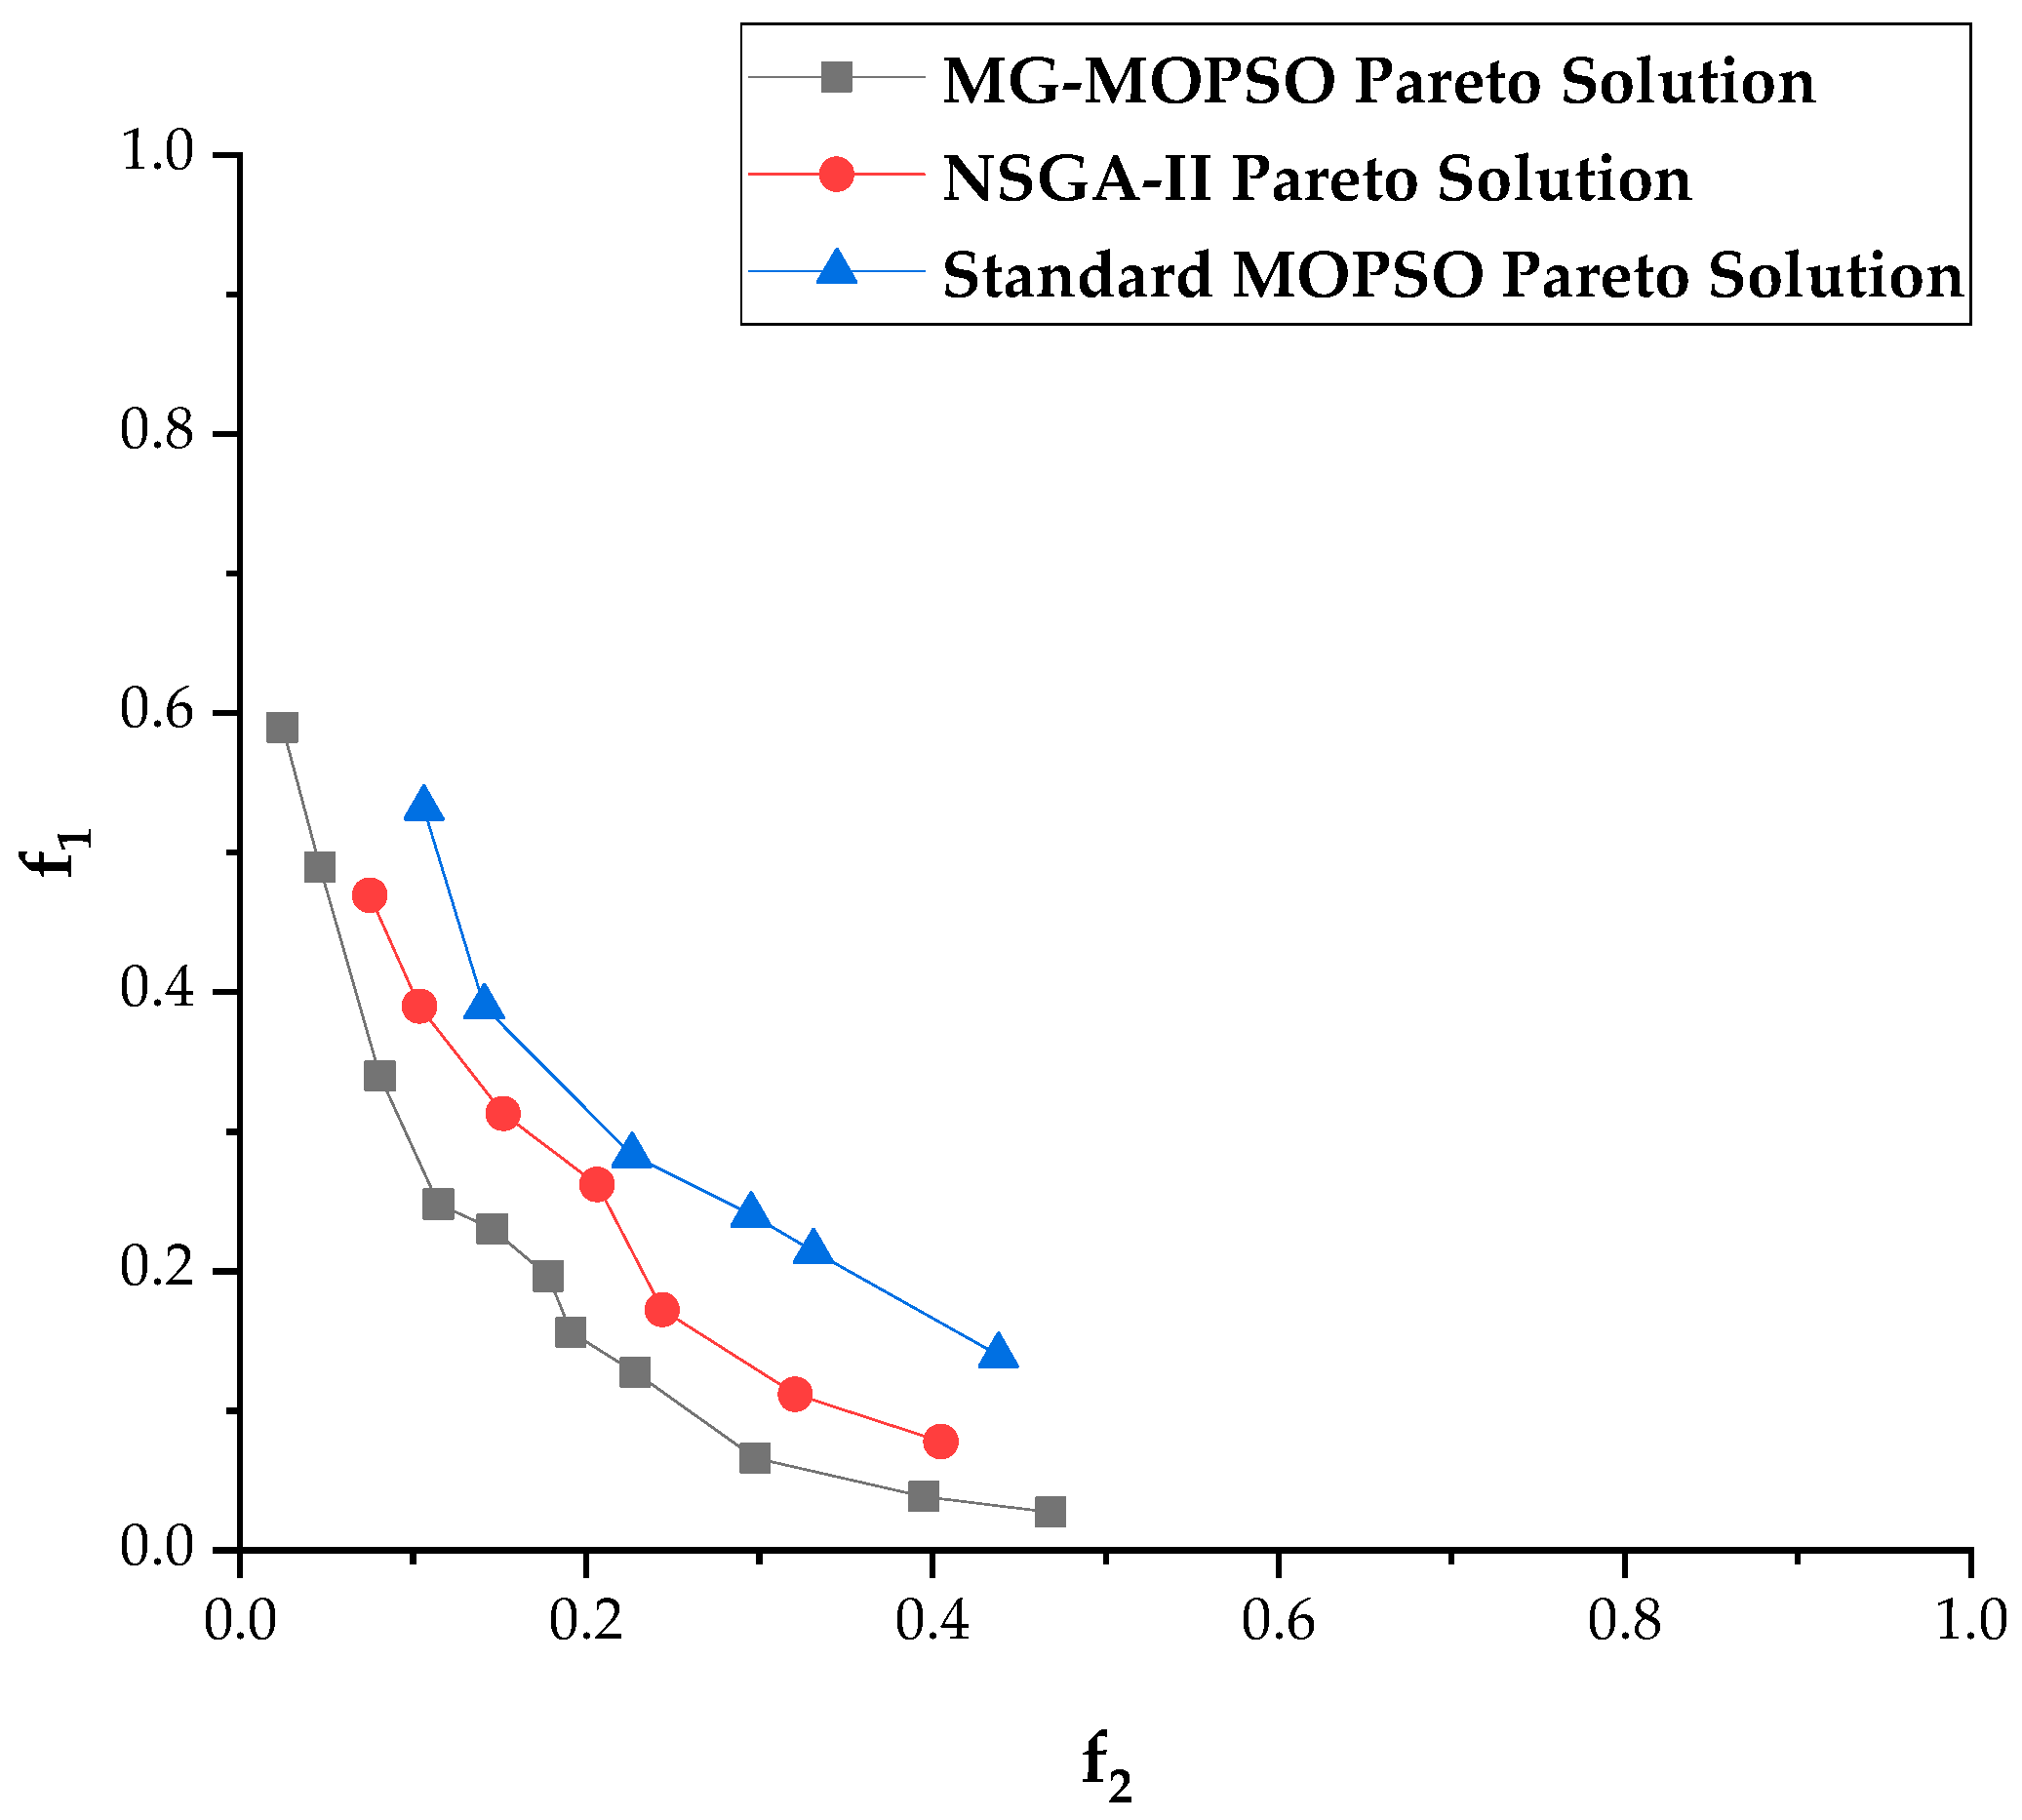
Furthermore, as shown in
Figure 9, the convergence analysis of the Pareto front is conducted using the front deviation metric, which is defined as the minimum Euclidean distance from the obtained Pareto front to the theoretical optimal point [0, 0]. A smaller value indicates better convergence.
- (1)
MG-MOPSO (represented by the gray curve) exhibits a front deviation of 0.25, with the curve demonstrating a smooth slope variation, indicative of stable convergence behavior;
- (2)
The standard MOPSO (depicted by the blue curve) exhibits a front deviation of 0.36, which is 44% higher than that of MG-MOPSO, indicating significantly inferior convergence performance;
- (3)
NSGA-II (illustrated by the red curve) exhibits a front deviation of 0.30, which is 20% higher than that of MG-MOPSO. This positions its convergence performance between that of MG-MOPSO and standard MOPSO.
These findings confirm that MG-MOPSO demonstrates the best convergence characteristics among the algorithms compared. This superior performance can be attributed to the minimum GDOP-based initialization strategy, which optimizes the geometric distribution of the initial population, thereby enhancing the overall convergence efficiency of the algorithm.
4.2.3. Assessment of Positioning Accuracy
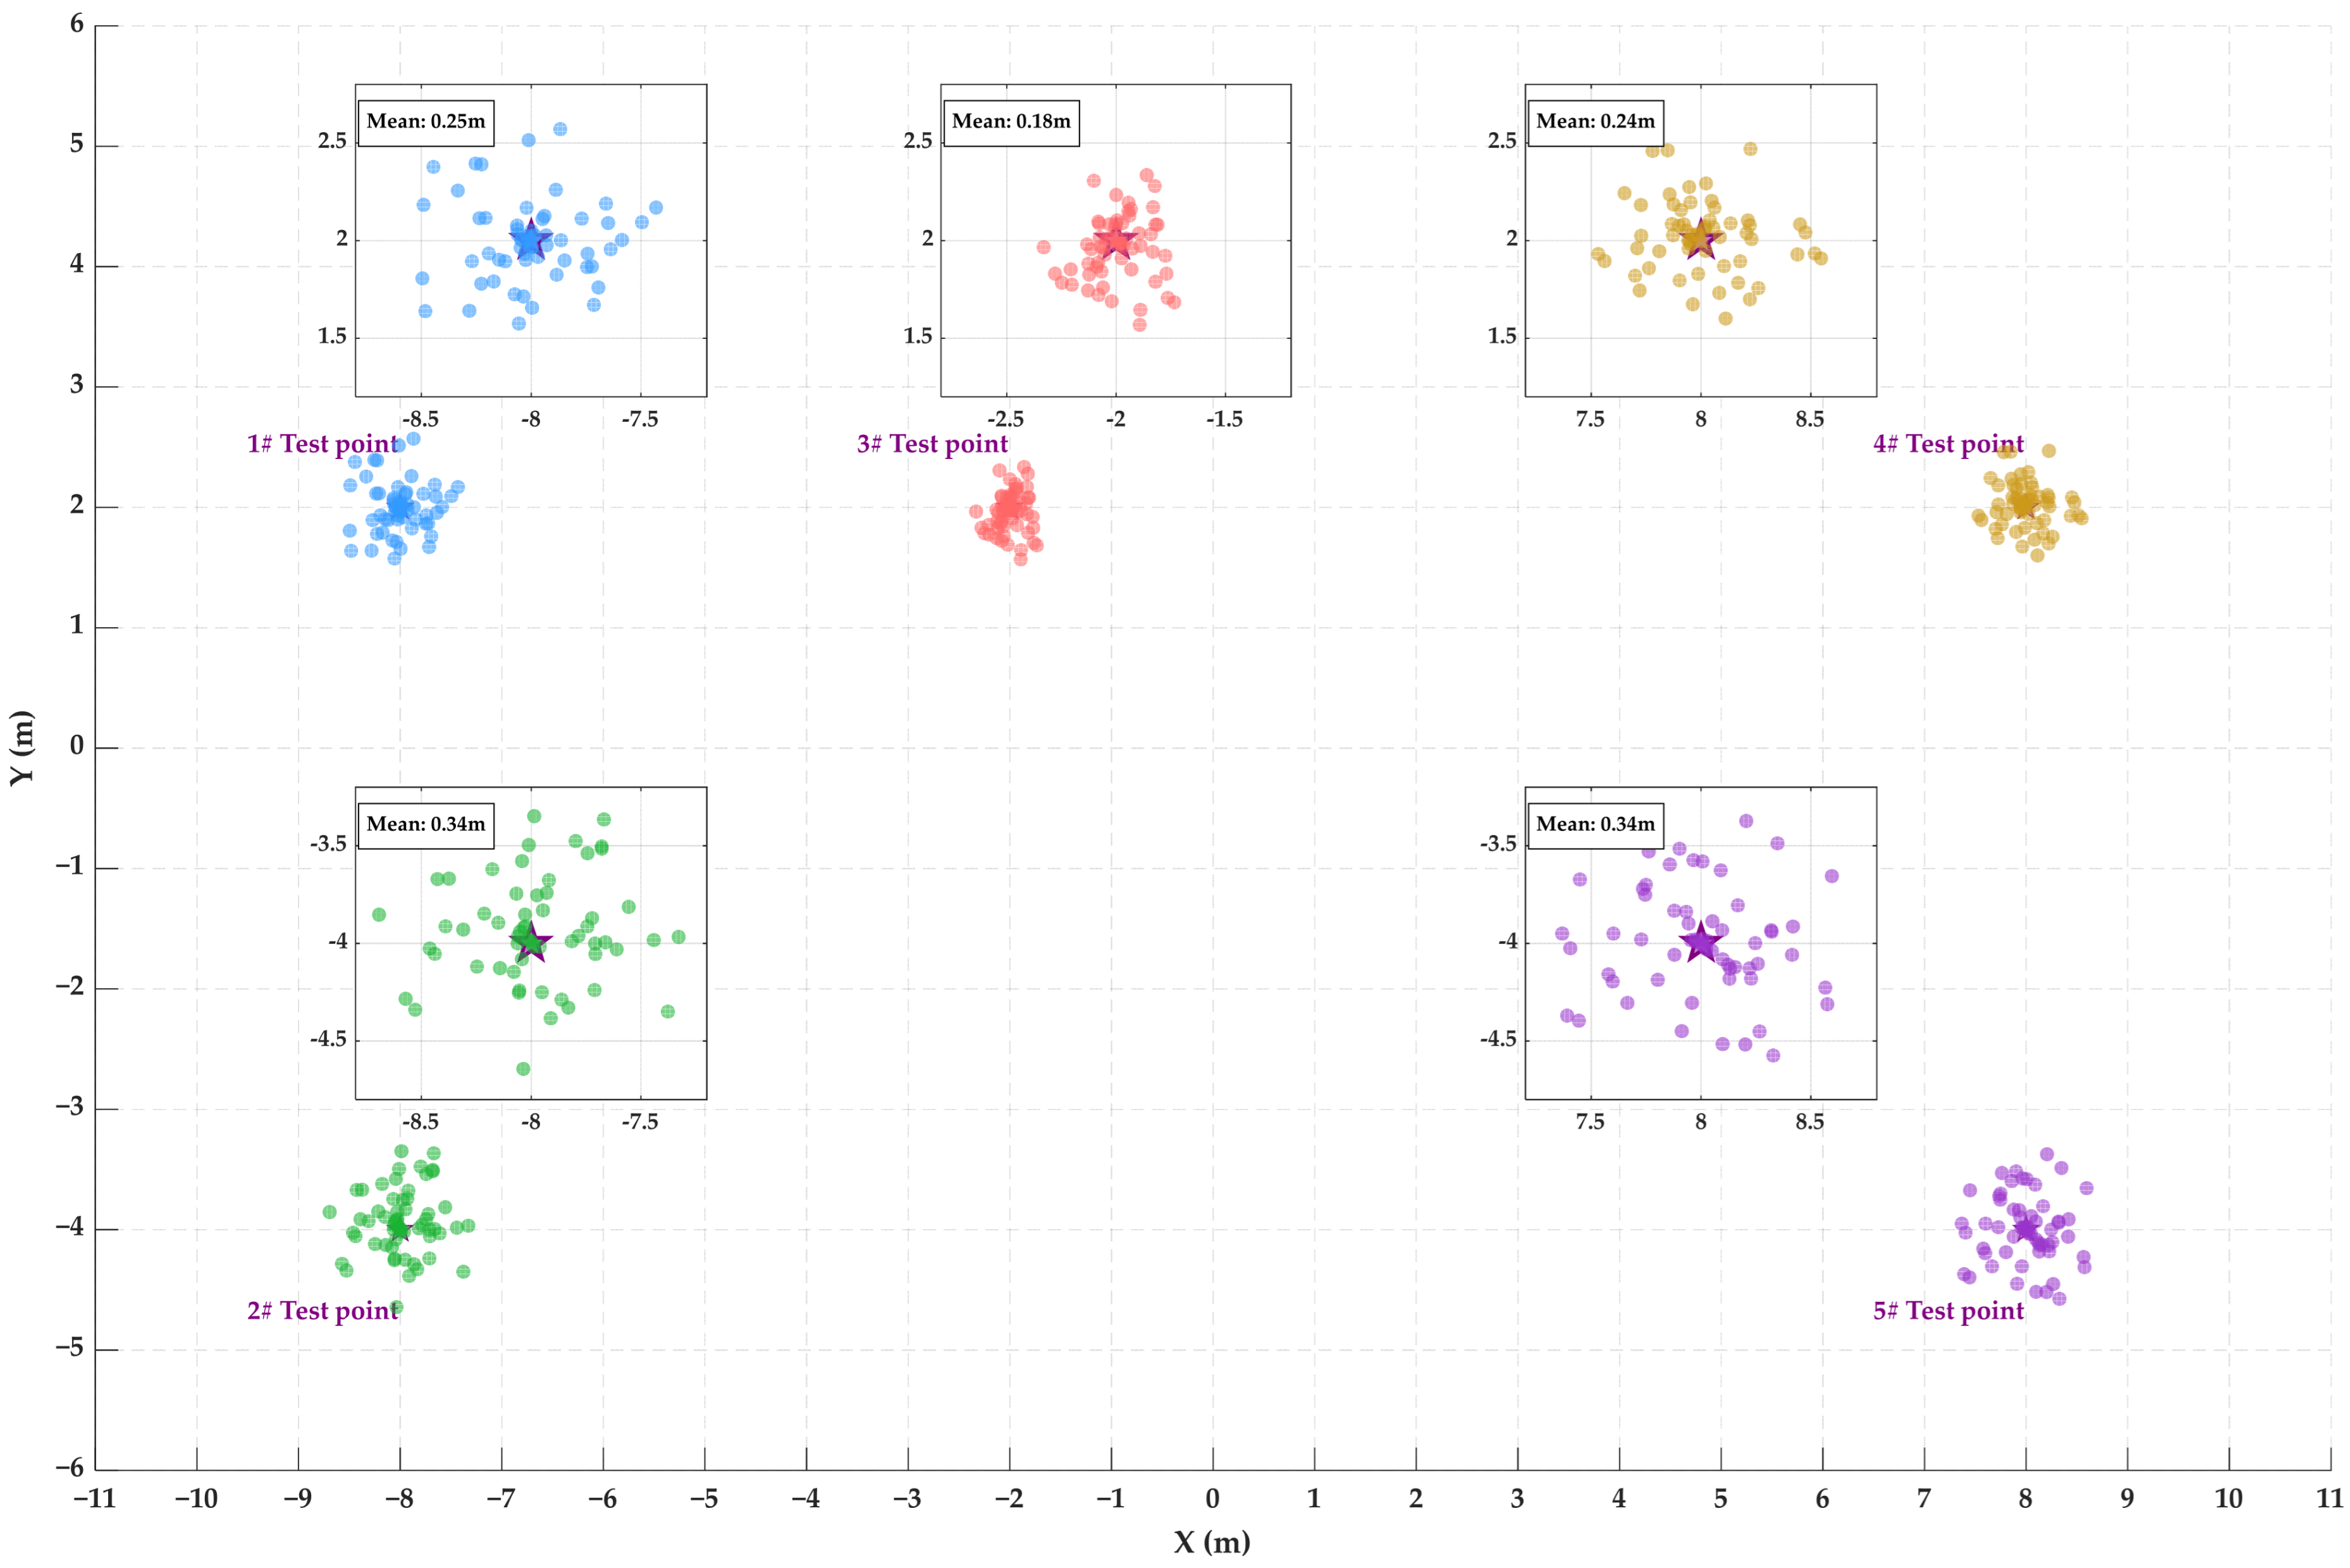
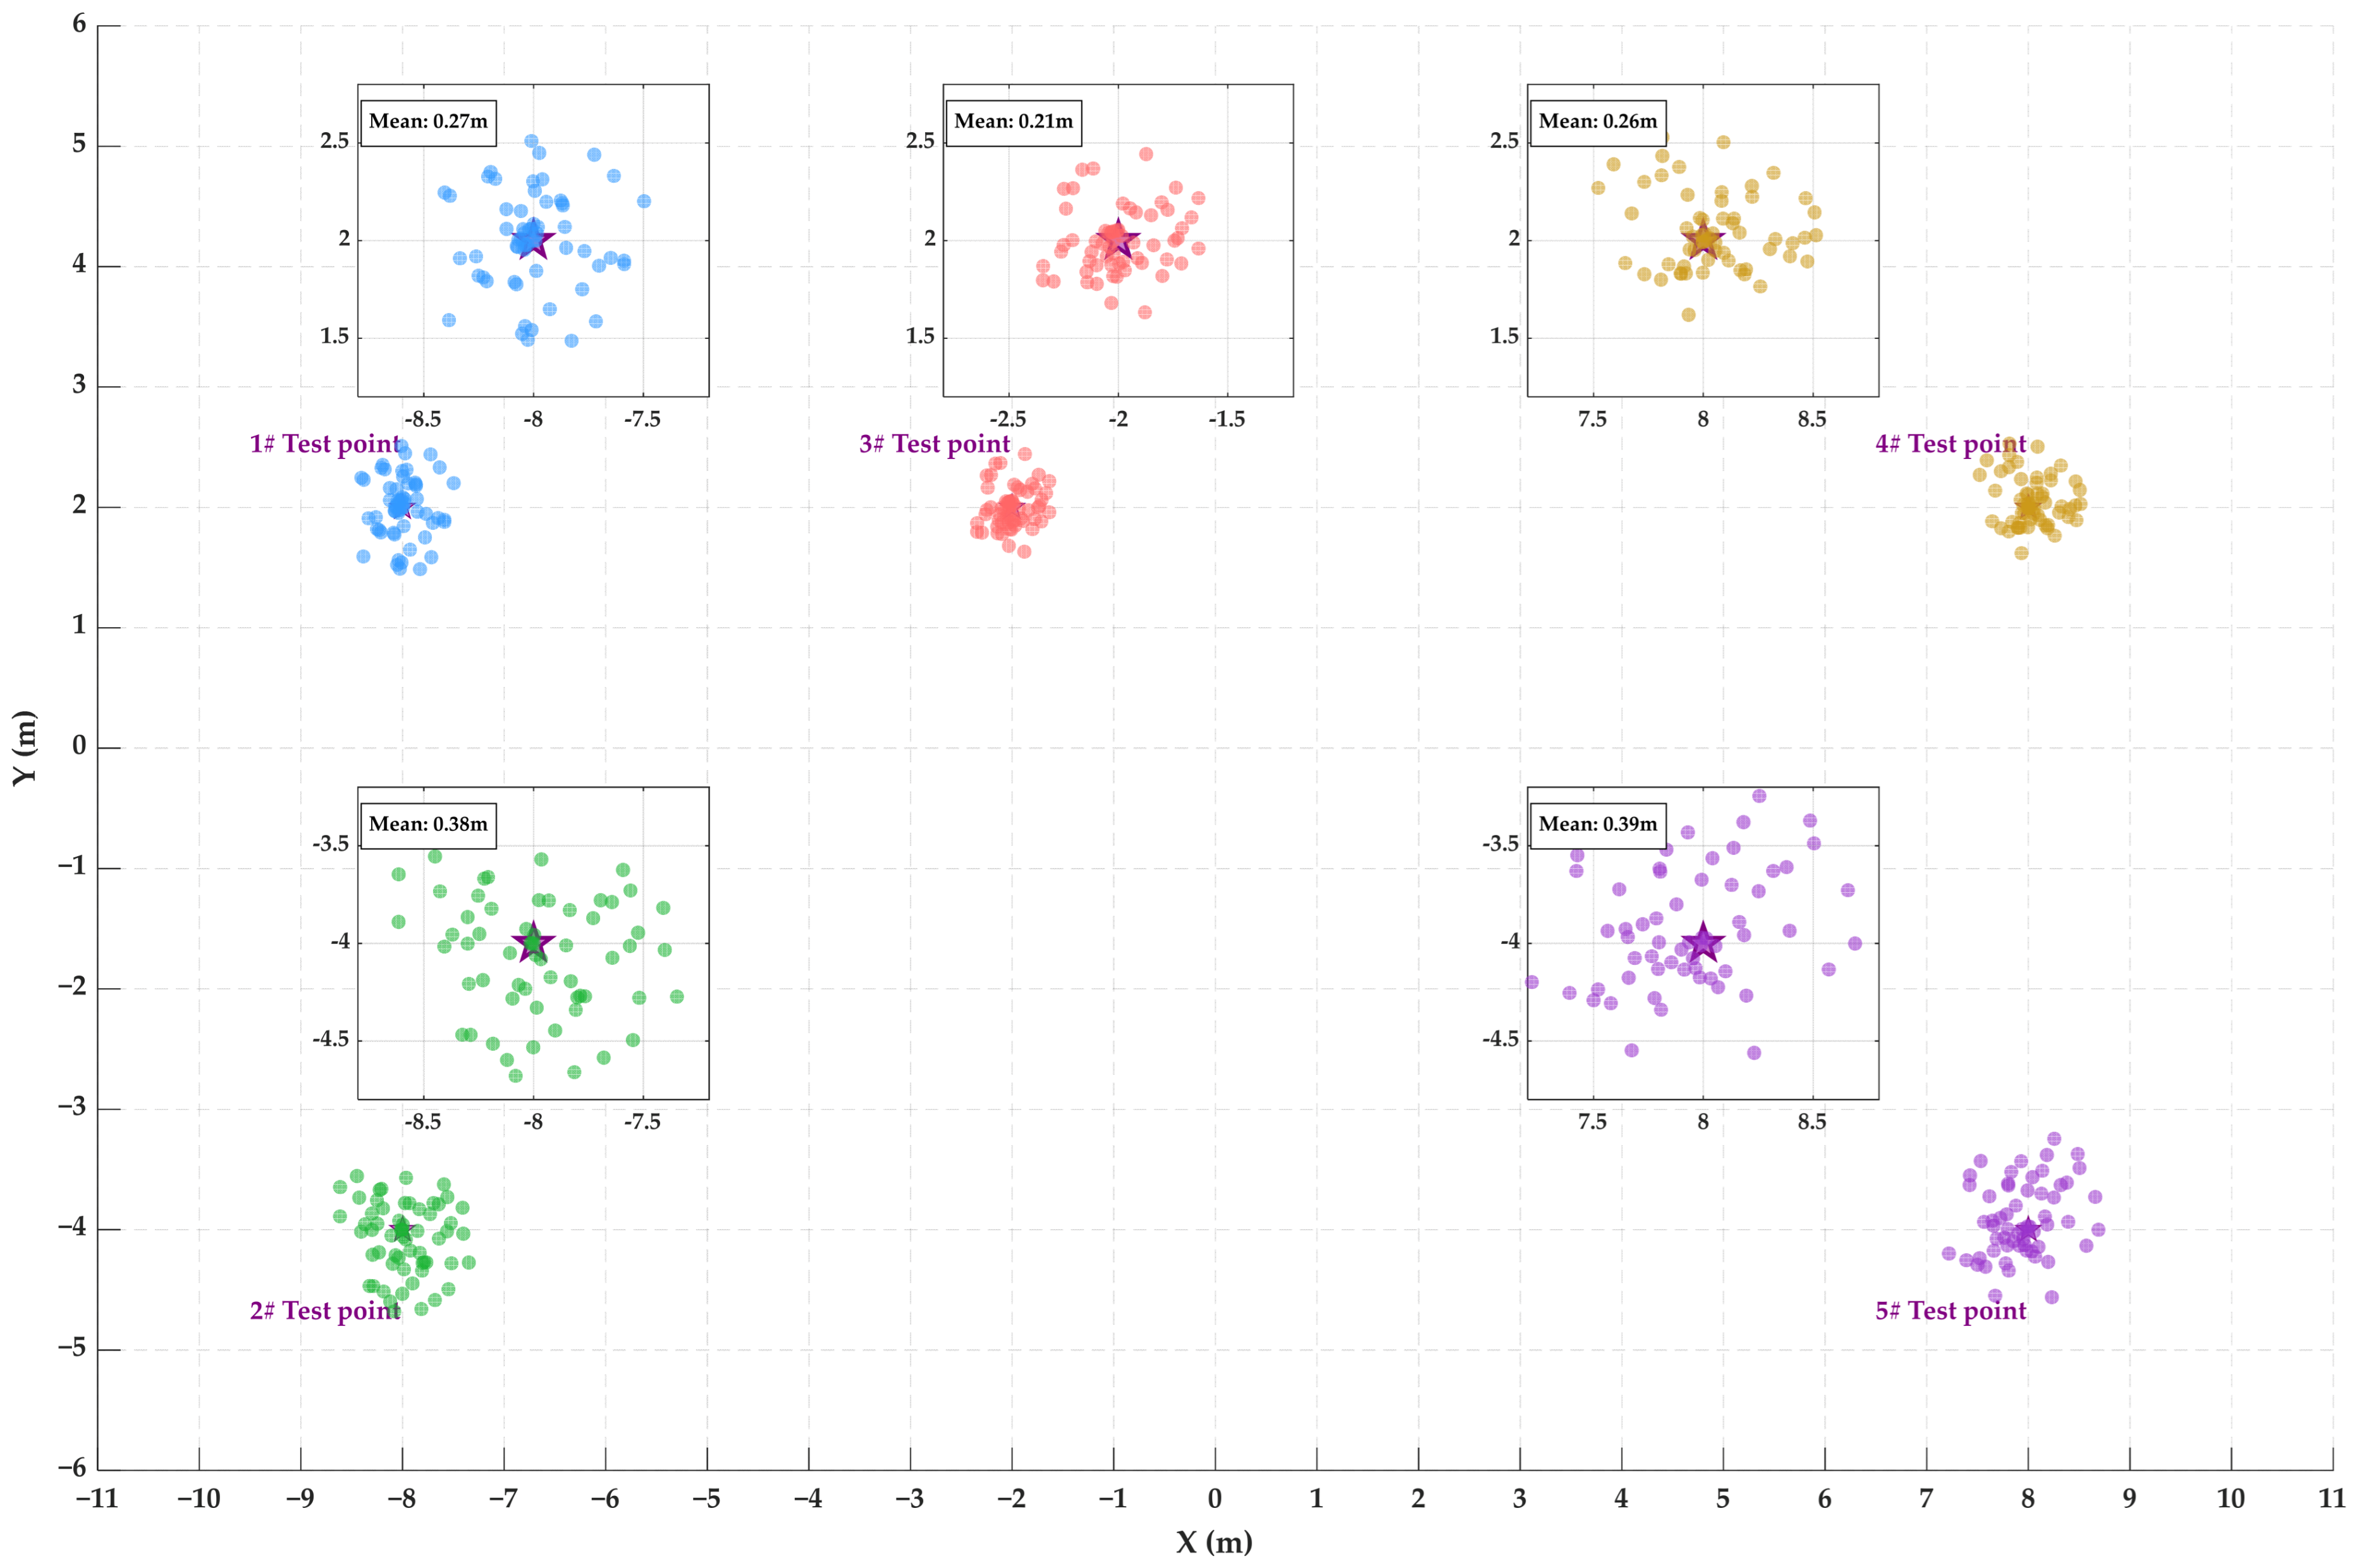
To compare the performance of different optimization results, a representative pseudolites anchor layout was selected from the Pareto solution sets obtained by the MG-MOPSO, standard MOPSO, and NSGA-II schemes, respectively. Specifically, the coordinates of the four pseudolites anchors under the MG-MOPSO scheme are (−1.28, 1.53), (−1.53, −1.28), (1.28, −1.53), and (1.53, 1.28). The coordinates of the four pseudolites anchors under the standard MOPSO scheme are (−1.05, 1.41), (−1.32, −1.21), (0.99, −1.15), and (1.77, 1.69). The coordinates of the four pseudolites anchors under the NSGA-II scheme are (−0.91, 1.22), (−1.15, −1.06), (1.33, −1.42), and (1.52, 1.41). Based on these layouts, five representative test points were established within the experimental area. At each test point, 60 positioning tests were conducted, and the receiver coordinates were calculated using the high-precision positioning algorithm proposed in [
16]. The performance comparison results for the two layout schemes were thus obtained.
Figure 10 illustrates the real-time positioning results and the corresponding average positioning errors under the anchor layout derived from the MG-MOPSO solution set,
Figure 11 presents the real-time positioning performance and average errors obtained under the layout derived from the standard MOPSO solution set, and
Figure 12 displays the real-time positioning performance and average error obtained under the layout derived from the NSGA-II solution set.
Figure 10,
Figure 11 and
Figure 12 demonstrate that the MG-MOPSO algorithm consistently achieves higher positioning accuracy than the standard MOPSO and NSGA-II algorithms across all test points. To further illustrate its performance advantages,
Table 2,
Table 3 and
Table 4 present a detailed comparison of the mean positioning error, maximum error, and standard deviation for the three algorithms at each test point. Additionally, the performance improvement ratios of MG-MOPSO over standard MOPSO and NSGA-II are also provided.
Table 2 delineates the mean positioning errors recorded for five test points utilizing the MG-MOPSO, standard MOPSO, and NSGA-II algorithms. The results indicate that MG-MOPSO consistently yields lower average errors across all test points, with enhancements over standard MOPSO ranging from approximately 12.82% to 31.43% and improvements over NSGA-II varying between 7.41% and 14.29%.
Particularly noteworthy is test point #4, which displayed the most pronounced decrease in mean error, suggesting that MG-MOPSO effectively optimizes anchor placement to improve localization accuracy in complex indoor environments. The consistent performance improvements across all test points underscore the algorithm’s robustness in minimizing cumulative positioning errors.
Table 3 delineates the maximum positioning errors observed at five designated test points for the three algorithms under comparison. The MG-MOPSO algorithm consistently exhibits the lowest maximum error across all test locations, with reductions ranging from 8.86% to 22.81% when compared to the standard MOPSO and from 2.70% to 12.35% in relation to NSGA-II.
Notably, at test point #3, MG-MOPSO achieved the most substantial enhancement, decreasing the maximum error by 22.81% relative to the standard MOPSO. For test points #1, #4, and #5, the reduction in maximum error surpassed 14%, while test point #2 reflected a more modest improvement. When compared to NSGA-II, the performance advantage remained consistent, albeit with smaller relative margins, suggesting both stability and competitiveness of the MG-MOPSO algorithm.
These findings provide objective evidence of the efficacy of MG-MOPSO in mitigating worst-case positioning errors. The algorithm demonstrates a discernible trend towards minimizing extreme deviations, which is particularly critical for ensuring system reliability in complex indoor environments.
Table 4 presents a summary of the standard deviations of positioning errors for five test points evaluated using the MG-MOPSO, standard MOPSO, and NSGA-II algorithms. The MG-MOPSO algorithm consistently demonstrated the lowest standard deviation across all test points, exhibiting a relative improvement ranging from 4.76% to 31.25% in comparison to standard MOPSO, and from 4.55% to 11.76% relative to NSGA-II.
Notably, at test point #3, the standard deviation was recorded at 0.11 m, representing a reduction of 31.25% compared to standard MOPSO and 8.33% compared to NSGA-II. Furthermore, in more complex scenarios, specifically at test points #1, #4, and #5, the reduction in standard deviation remained substantial, suggesting that MG-MOPSO is capable of delivering consistent performance across varying indoor propagation conditions.
These findings provide objective evidence that MG-MOPSO enhances localization stability in diverse environmental contexts, characterized by reduced variability in localization outcomes across repeated simulations.
5. Discussion
This section provides an in-depth discussion of the optimization results obtained by the MG-MOPSO algorithm in comparison with standard MOPSO and NSGA-II. The analysis is structured into three aspects: (1) optimization process, (2) Pareto front characteristics, and (3) positioning accuracy performance.
5.1. Optimization Process Evaluation
The enhanced optimization capabilities of MG-MOPSO can be attributed to two principal innovations: the integration of geometric awareness during the initialization phase and the implementation of adaptive parameter control throughout the iterative process. By initializing the population based on the minimum GDOP, the algorithm strategically positions particles in areas with advantageous geometric characteristics, thereby mitigating the risk of suboptimal initial configurations and promoting early convergence.
Concurrently, the algorithm employs a dynamic adjustment of inertia weight and learning coefficients to sustain a robust balance between exploration and exploitation. This approach facilitates extensive exploration during the initial stages and a more focused local search in subsequent phases, thereby decreasing the probability of premature convergence.
These mechanisms operate synergistically with an adaptive objective prioritization strategy, enabling MG-MOPSO to effectively respond to environmental feedback and evade local optima. In contrast to the static non-dominated sorting employed by NSGA-II or the fixed-particle updates characteristic of standard MOPSO, MG-MOPSO continuously modifies its search dynamics in accordance with the complexity of the landscape, resulting in both accelerated convergence and improved solution quality.
This advantage is particularly pronounced in intricate indoor environments marked by signal occlusion and non-convex solution surfaces, where traditional methods frequently encounter difficulties. The experimental findings presented in
Section 4.1 (
Table 1) substantiate this efficiency, demonstrating that MG-MOPSO achieves superior convergence rates and more optimal final outcomes across all evaluated scenarios.
5.2. Pareto Front Characteristics
The performance superiority of MG-MOPSO on the Pareto front is evidenced not only through metrics such as hypervolume and front deviation but is also fundamentally linked to its algorithmic architecture. The segmented adaptive weighting strategy employed by MG-MOPSO facilitates a dynamic equilibrium between convergence and diversity, thereby enabling the algorithm to explore the objective space more efficiently without compromising optimality.
In contrast to static-weight or crowding-based approaches, this adaptive mechanism fosters a uniform distribution of solutions across the Pareto front while simultaneously exerting convergence pressure. Consequently, MG-MOPSO circumvents the prevalent issues of premature convergence typically associated with standard MOPSO as well as the excessive dispersion of fronts characteristic of NSGA-II.
Additionally, the minimum-GDOP-based initialization significantly bolsters performance by establishing a geometrically optimized initial population. This strategic initialization allows the algorithm to commence its search from regions with inherently advantageous layout characteristics, thereby minimizing search time and enhancing the quality of the final solutions—an aspect that is particularly critical in indoor environments where anchor geometry has a direct impact on positioning accuracy.
In summary, these mechanisms operate in concert to yield Pareto fronts that are more compact, diverse, and stable, rendering MG-MOPSO especially effective for layout optimization tasks that involve multiple conflicting objectives.
5.3. Positioning Accuracy Performance
The enhanced positioning accuracy exhibited by MG-MOPSO across various test scenarios underscores the efficacy of its geometry-aware and adaptively guided optimization mechanism. In contrast to traditional algorithms, MG-MOPSO integrates geometric dilution of precision (GDOP) within its multi-objective framework, leading to anchor configurations that inherently mitigate localization uncertainty in complex environmental contexts.
The observed reductions in average positioning error underscore MG-MOPSO’s capability to systematically devise anchor layouts that minimize the mean deviation between estimated and actual positions. This enhancement is attributable to the algorithm’s global exploration capabilities and its propensity to circumvent suboptimal geometries induced by multi-path effects or signal occlusion—challenges commonly encountered in indoor positioning environments.
Regarding maximum positioning error, which serves as an indicator of worst-case performance and operational risk, MG-MOPSO demonstrated significantly lower peak deviations. This robustness can be ascribed to its ability to establish anchor redundancy and spatial diversity, thereby providing a buffer against severely compromised signal conditions or unfavorable anchor-user geometries. The capacity to manage these edge-case scenarios is crucial for applications such as emergency localization or autonomous navigation, where infrequent large errors could result in failure or safety concerns.
Moreover, the consistently lower standard deviation observed across trials indicates that MG-MOPSO offers improved stability and repeatability. This diminished variability is particularly vital in dynamic or noise-sensitive environments, as it ensures the system delivers reliable performance irrespective of environmental fluctuations. The incorporation of adaptive parameter control and geometric feedback contributes to a more balanced search trajectory, thereby reducing optimization jitter and preventing premature convergence.
In summary, these attributes illustrate that MG-MOPSO not only enhances positioning accuracy under average conditions but also sustains robust and stable performance across a range of diverse and unpredictable indoor environments. Its comprehensive advantages render it particularly well suited for implementation in real-world, high-precision indoor positioning systems.
6. Conclusions
Addressing the critical challenge of optimizing pseudolite anchor deployment in complex indoor environments, this study innovatively proposes a novel particle swarm optimization method based on the minimum GDOP configuration, termed MG-MOPSO. The core contributions of this work are as follows:
(1) Development of a Bi-Objective Optimization Model
This research marks the inaugural application of minimum GDOP configuration theory to the optimization of indoor pseudolite layouts, resulting in the establishment of a bi-objective optimization model that emphasizes the NVPS and HDOP. The objective functions and spatial constraints were meticulously formulated through Equations (25) and (26), offering a comprehensive mathematical framework for layout optimization.
(2) Proposal of the MG-MOPSO Algorithm
An innovative novel initialization strategy predicated on the minimum GDOP configuration was devised, which includes a segmented adaptive weight-adjustment mechanism. This approach guarantees high-quality initial solutions through geometric configuration optimization while dynamically balancing convergence speed with search diversity. As a result, it significantly enhances the algorithm’s adaptability and efficiency in complex indoor environments.
(3) Comprehensive Experimental Validation
A series of validation experiments carried out in intricate indoor environments revealed that the MG-MOPSO algorithm consistently surpassed benchmark methods regarding convergence efficiency, solution diversity, and positioning accuracy. Its exceptional performance in both multi-path-dominated and low-interference conditions highlights the algorithm’s robustness and adaptability. These results affirm the practical applicability of MG-MOPSO in real-world indoor positioning systems, particularly in situations characterized by significant signal degradation.
The proposed MG-MOPSO algorithm presents significant advantages for optimizing the layout of anchors in indoor pseudolite positioning systems, particularly within complex occlusion environments:
(1) Rapid Convergence: The initialization strategy that employs the minimum GDOP configuration markedly decreases the initial search duration, facilitating a quicker transition into the efficient optimization phase of the algorithm;
(2) Enhanced Optimization Accuracy: By incorporating a segmented adaptive weight mechanism, MG-MOPSO effectively balances global exploration and local fine-tuning at various stages of the search process. This approach yields a superior quality of the Pareto front solution set and improves overall optimization accuracy;
(3) Improved Solution Diversity: In comparison to conventional standard MOPSO algorithms and the NSGA-II, the MG-MOPSO exhibits enhanced distribution uniformity and diversity along the Pareto front. This characteristic allows for a more flexible selection of multiple solutions in practical deployment contexts;
(4) Robust Environmental Adaptability: MG-MOPSO maintains consistent performance across a diverse array of indoor environments. It excels not only in high-interference, complex settings but also in optimal low-interference conditions, making it suitable for a variety of indoor positioning applications.
However, despite its numerous advantages, the MG-MOPSO algorithm is not without limitations that require further exploration:
(1) Sensitivity to Initial Particle Distribution: The current implementation is highly dependent on the quality of the initial population. An unsuitable initial configuration may adversely impact search efficiency and convergence performance;
(2) Computational Efficiency in Large-Scale Scenarios: As the deployment area expands or the number of anchors increases, the computational demands escalate considerably, which may restrict its real-time applicability in extensive environments;
(3) Limited Dynamic Adaptability under Fixed Weight Strategy: Although a segmented adaptive weight mechanism was incorporated, the algorithm still demonstrates limitations in its capacity to dynamically adjust to rapidly changing environmental conditions.
In order to address the aforementioned limitations, the following research avenues are proposed:
(1) Development of an Adaptive Particle Ratio Adjustment Mechanism Based on Population Entropy: This mechanism aims to dynamically evaluate the diversity within a population and modify the balance between exploration and exploitation. The objective is to improve both the speed of convergence and the quality of the solutions obtained;
(2) Creation of an Intelligent Sampling Framework that Integrates Spatial Correlation and Information Entropy: This framework will investigate the combination of intelligent sampling techniques with adaptive grid compression methods. The goal is to reduce computational complexity while maintaining a high level of positioning accuracy;
(3) Implementation of an Environmental Feature-Driven Dynamic Weight Allocation Strategy: This strategy will incorporate a mechanism for dynamic weight adjustment that is responsive to environmental characteristics. It will leverage deep reinforcement learning to facilitate real-time multi-objective weights, thereby enhancing adaptability to fluctuating environmental conditions.
In summary, the MG-MOPSO algorithm proposed in this study offers a high-precision and reliable solution for optimizing anchor layouts in indoor pseudolite systems, demonstrating significant engineering application value. Through rigorous mathematical modeling and systematic experimental validation, the effectiveness of this method in complex indoor environments has been confirmed. Future work will concentrate on addressing efficiency bottlenecks in large-scale deployments, with the goal of enhancing the application of high-precision indoor positioning systems in expansive public venues, including airports and subway stations.


