
An Improved Method for Estimating Sea Surface Temperature Based on GF-5A Satellite Data in Bohai Bay
Abstract
1. Introduction
2. Study Area and Data
2.1. Study Area
2.2. Data
2.2.1. Measured Data
2.2.2. MODIS
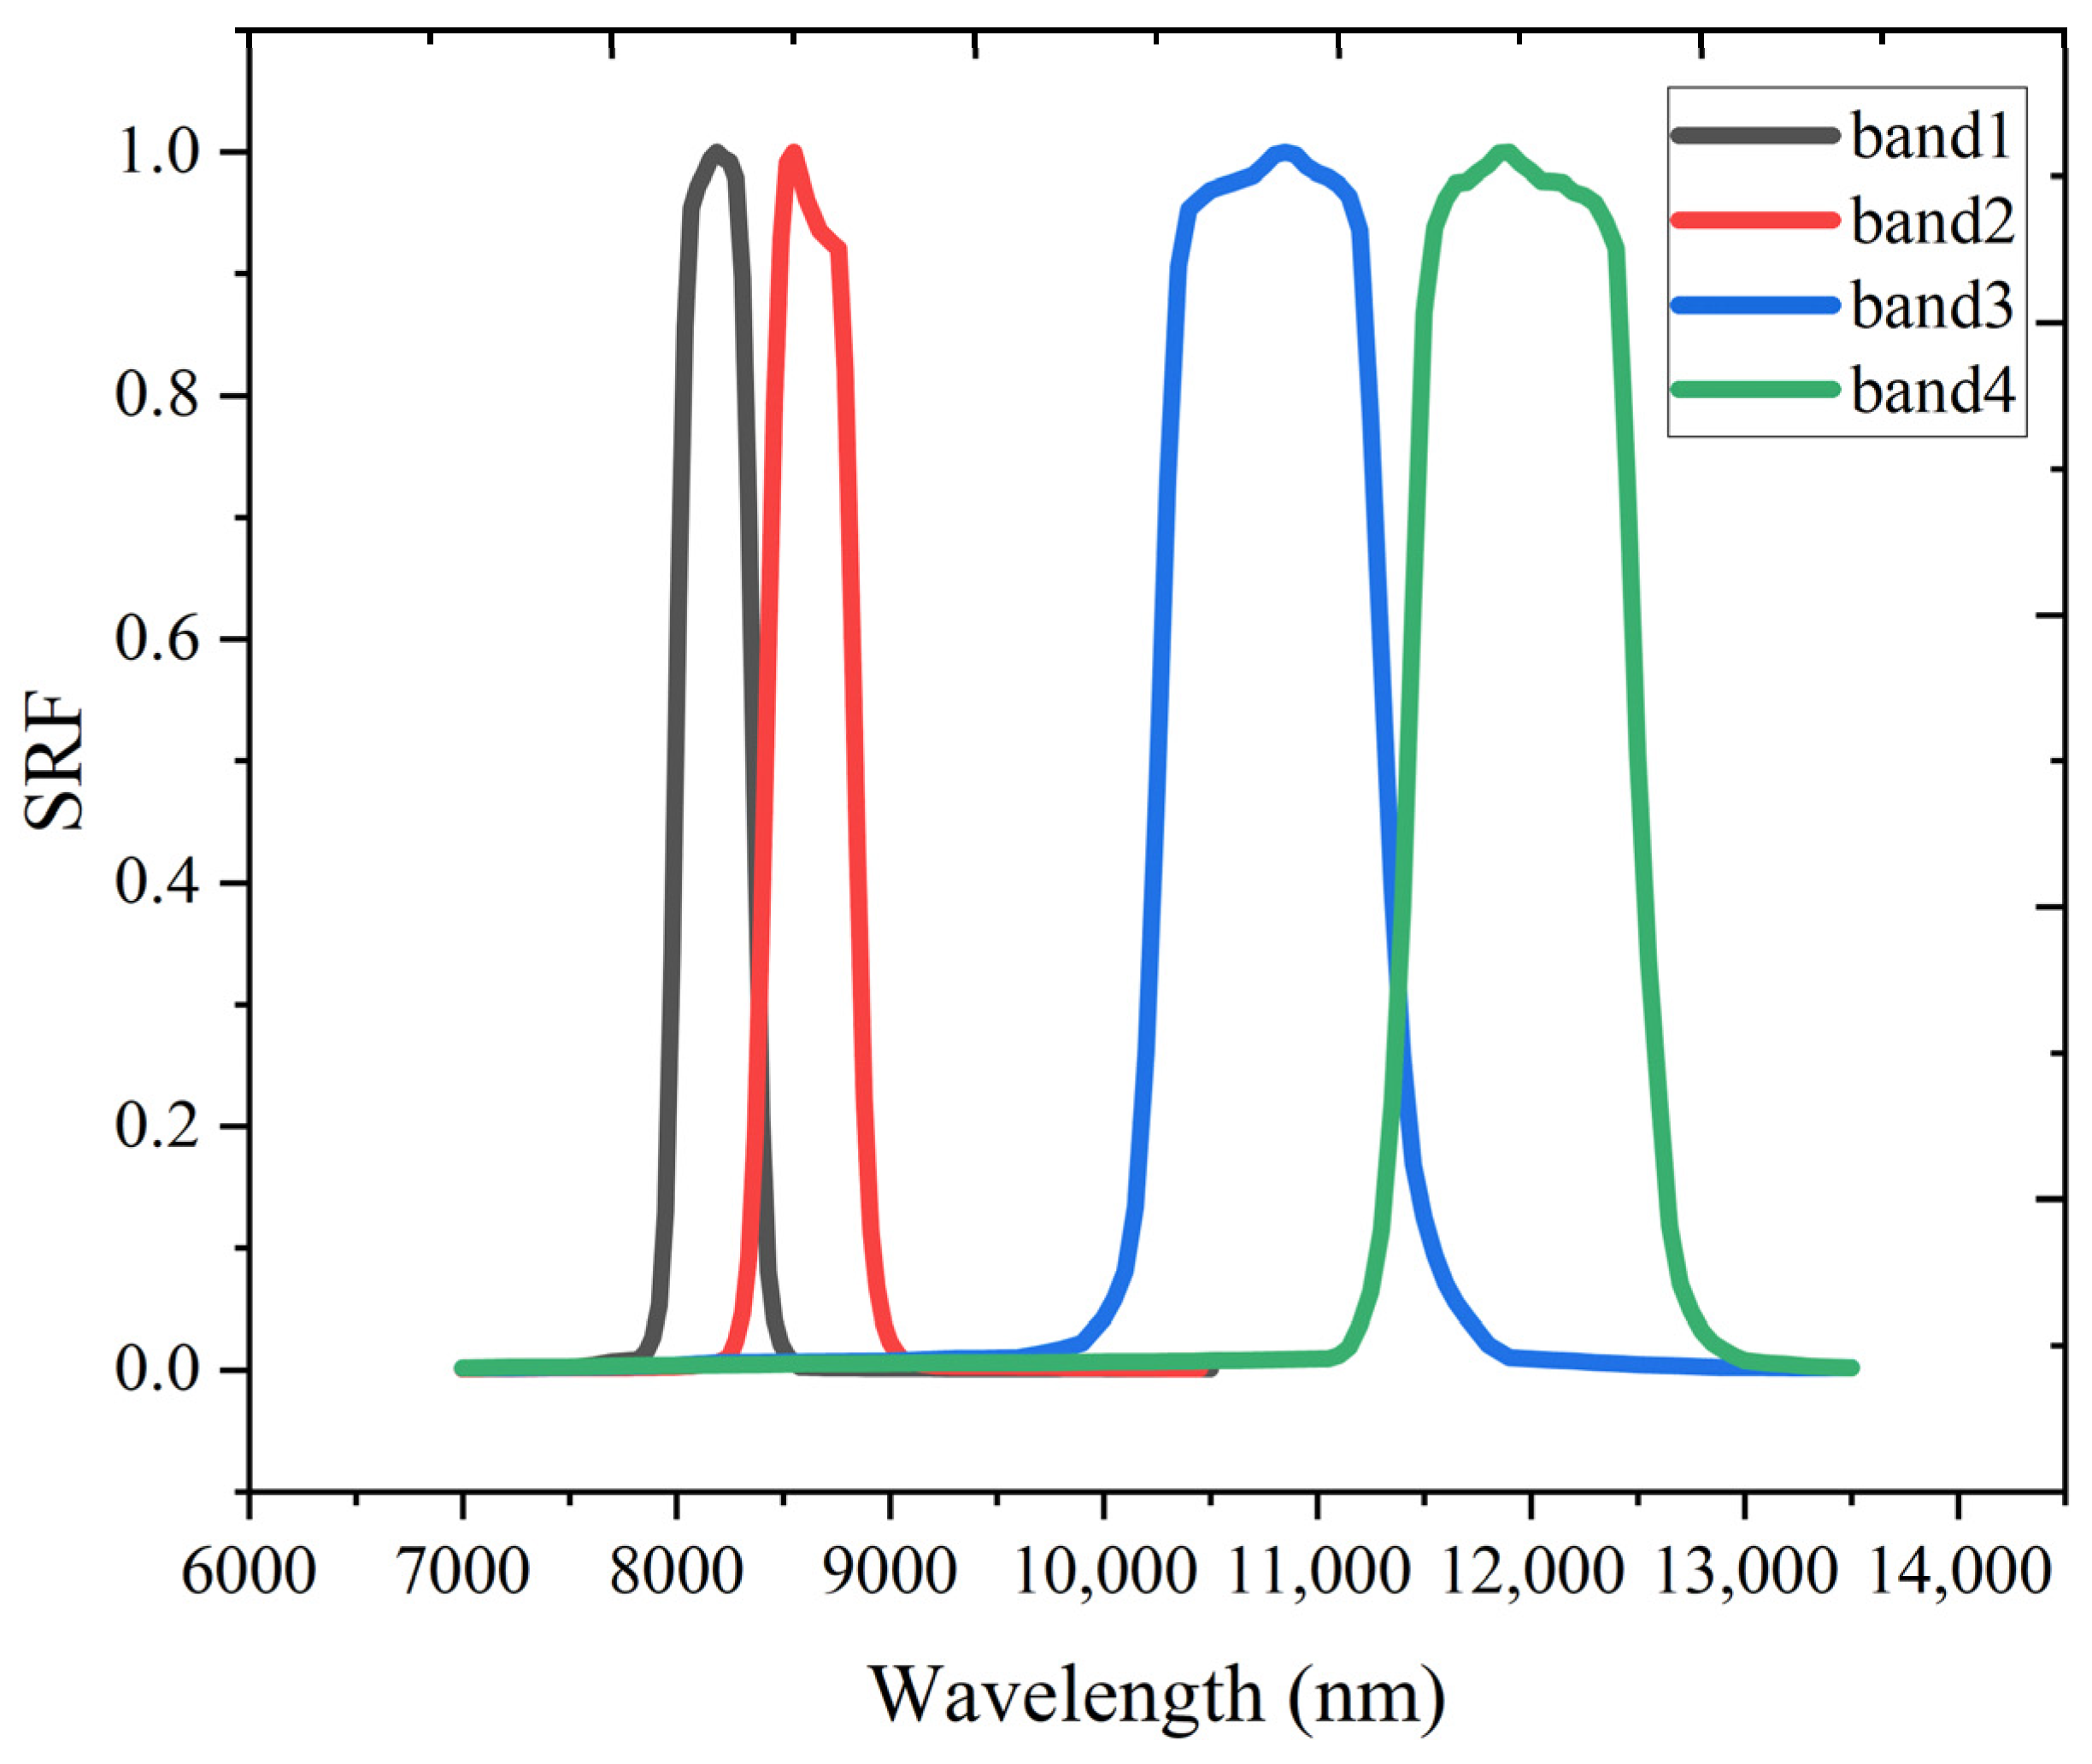
2.2.3. GF-5A
2.2.4. Landsat 8-9 C2L2
3. Methods
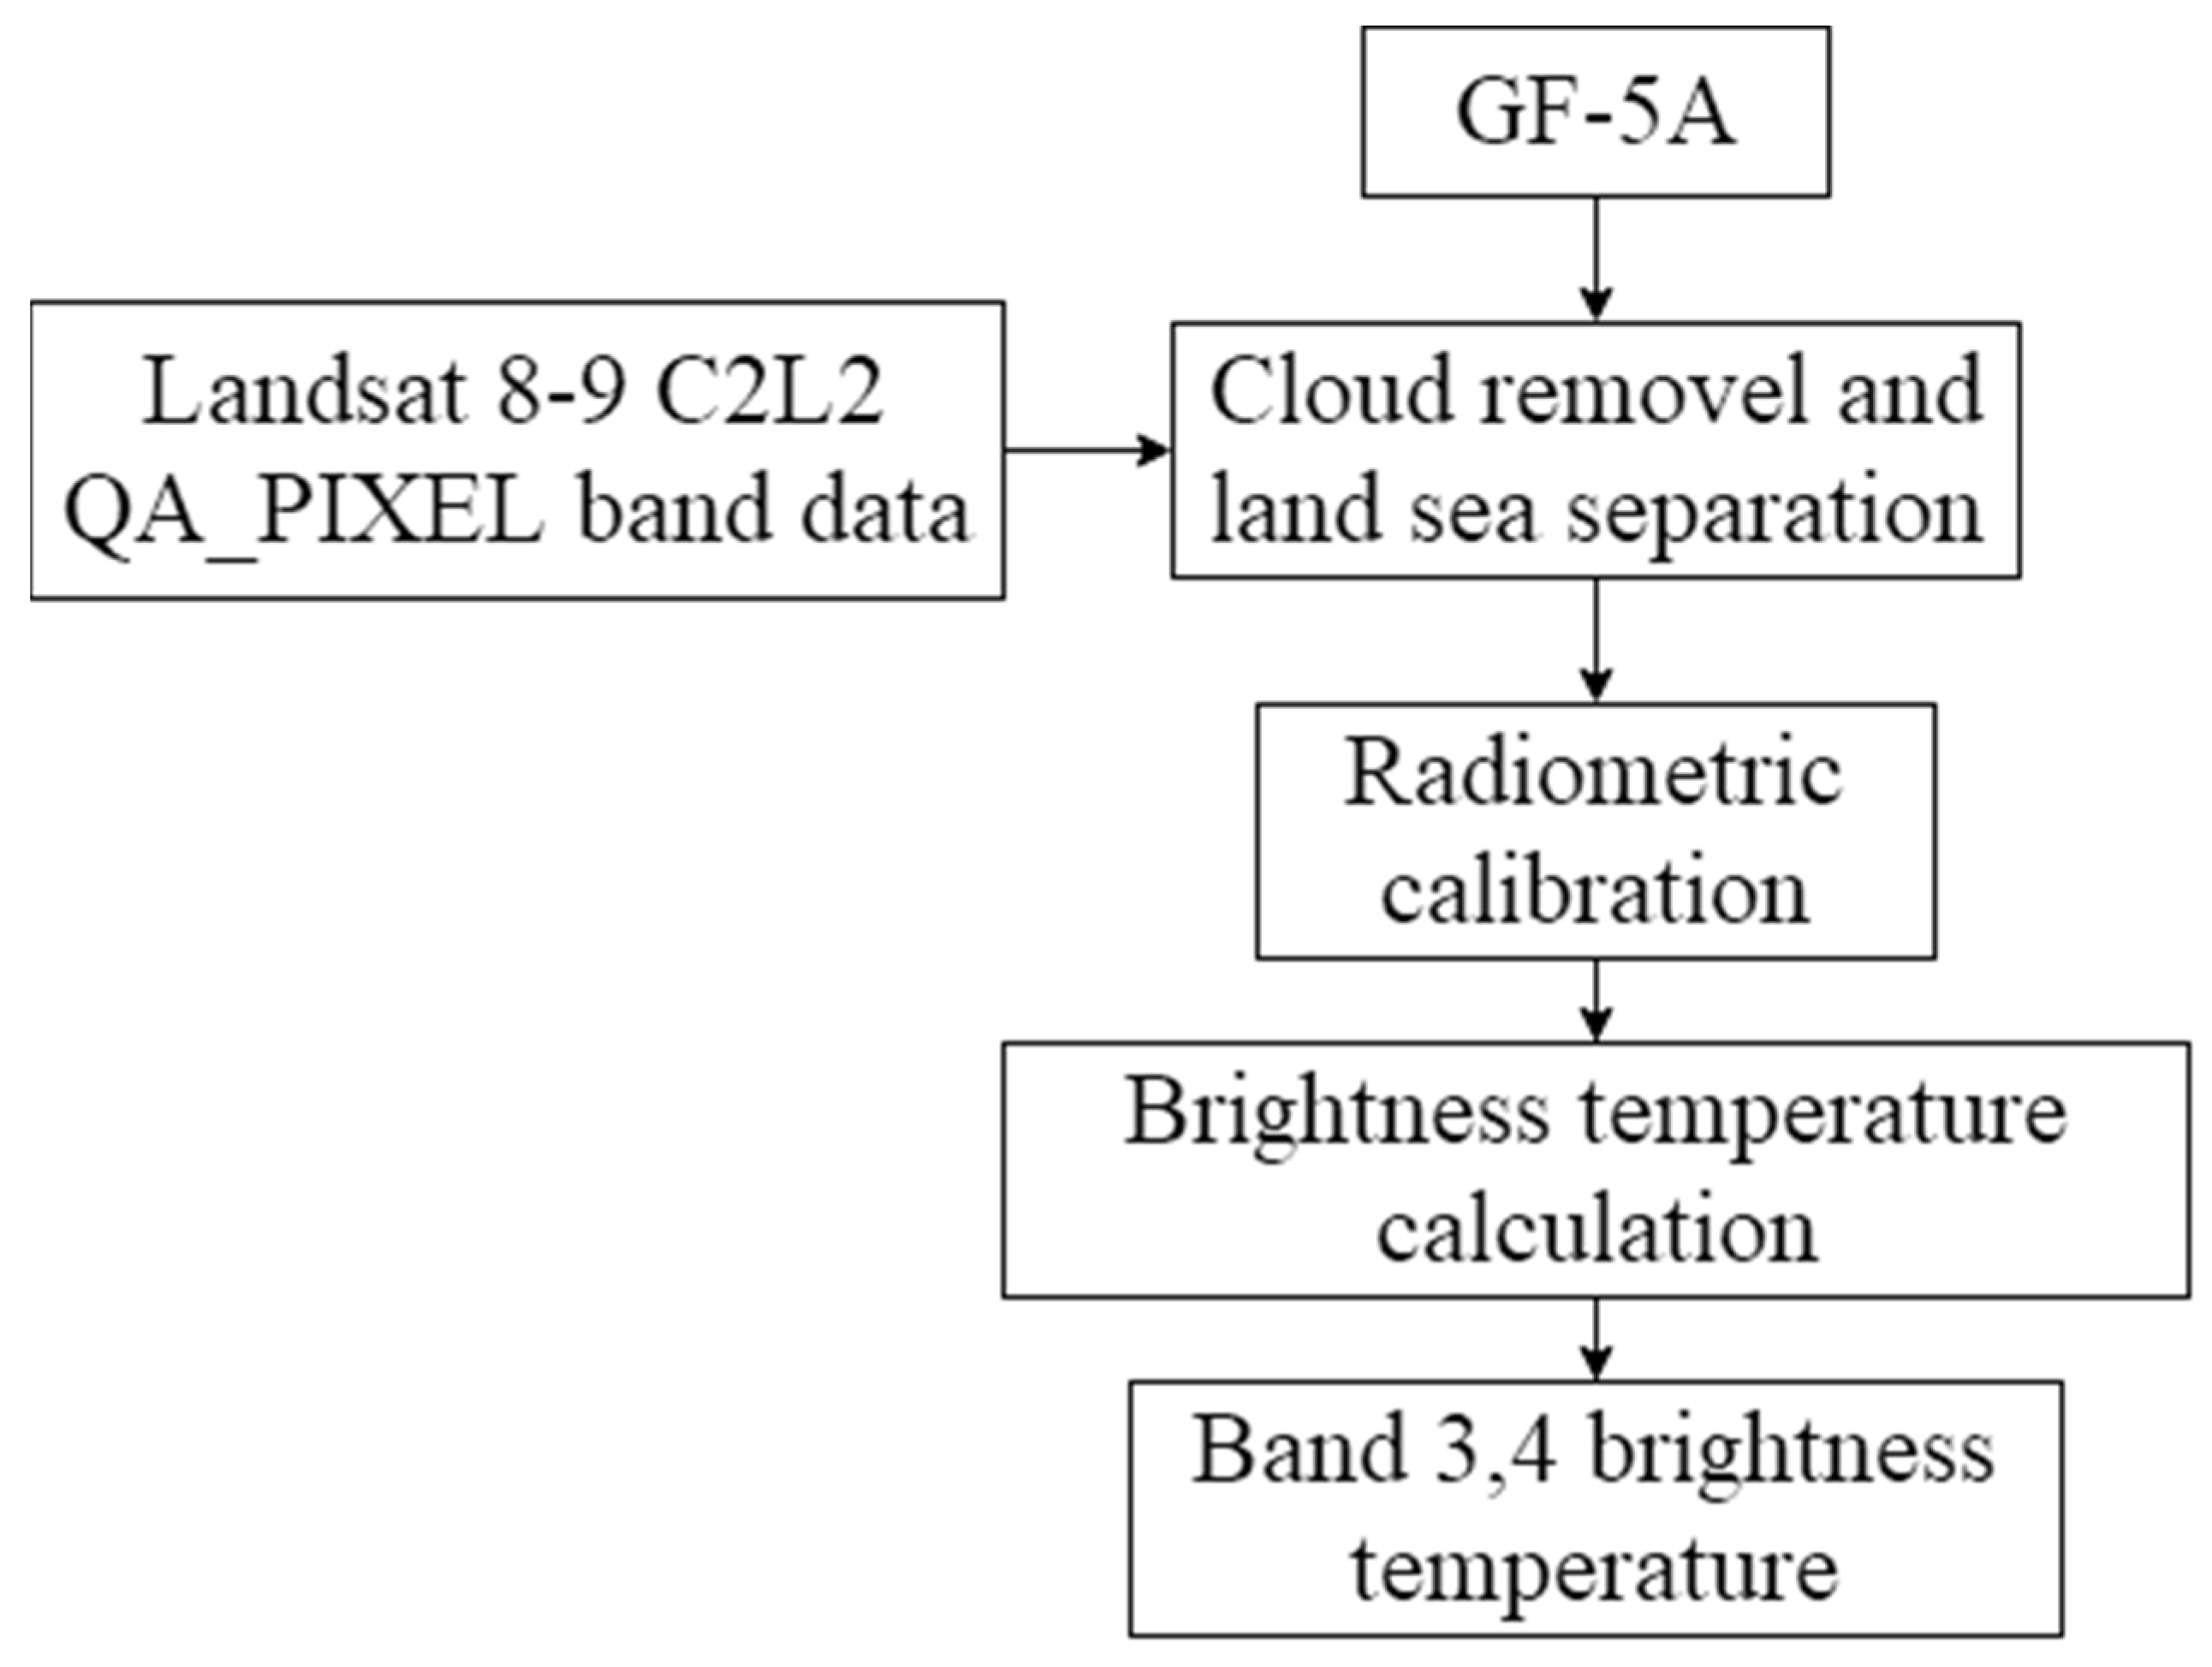
3.1. GF-5A Data Preprocessing
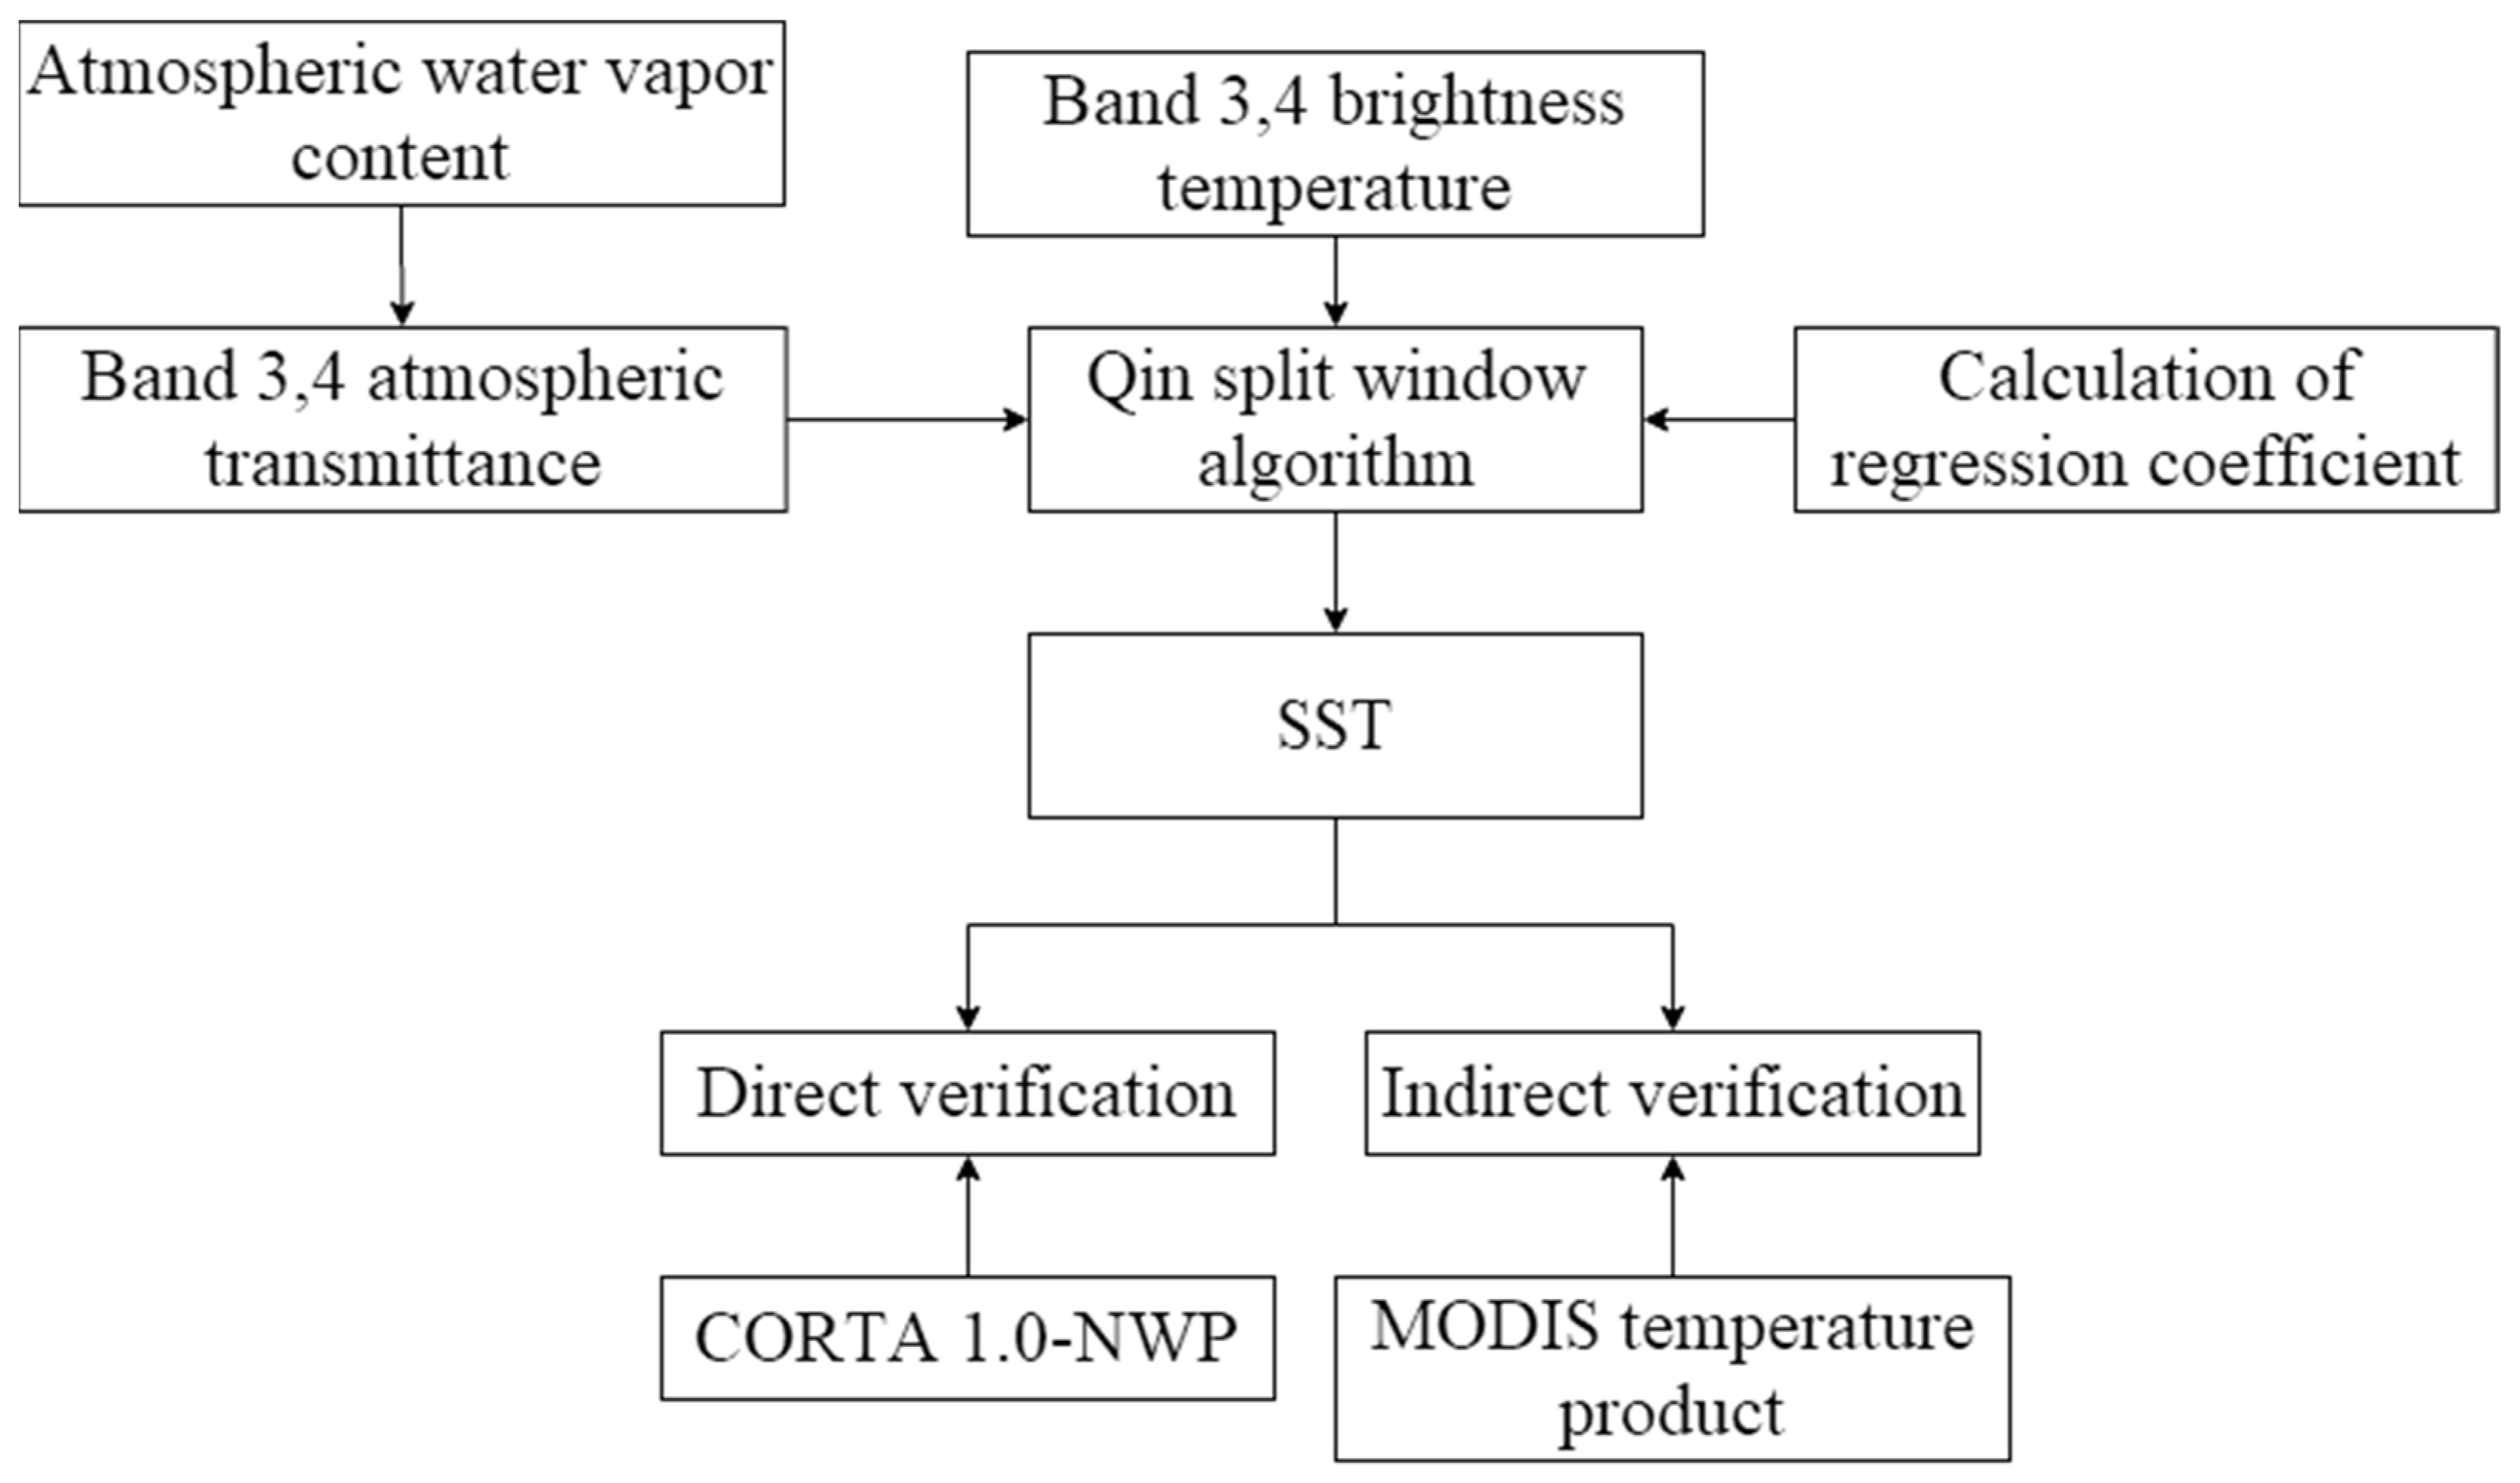
3.2. Qin Split Window Algorithm for GF-5A Satellite Data
3.2.1. Adjustment of Atmospheric Transmittance
3.2.2. Adjustment of Regression Coefficients
3.2.3. SST Data Retrieval
3.3. Accuracy Verification Index Value
4. Results
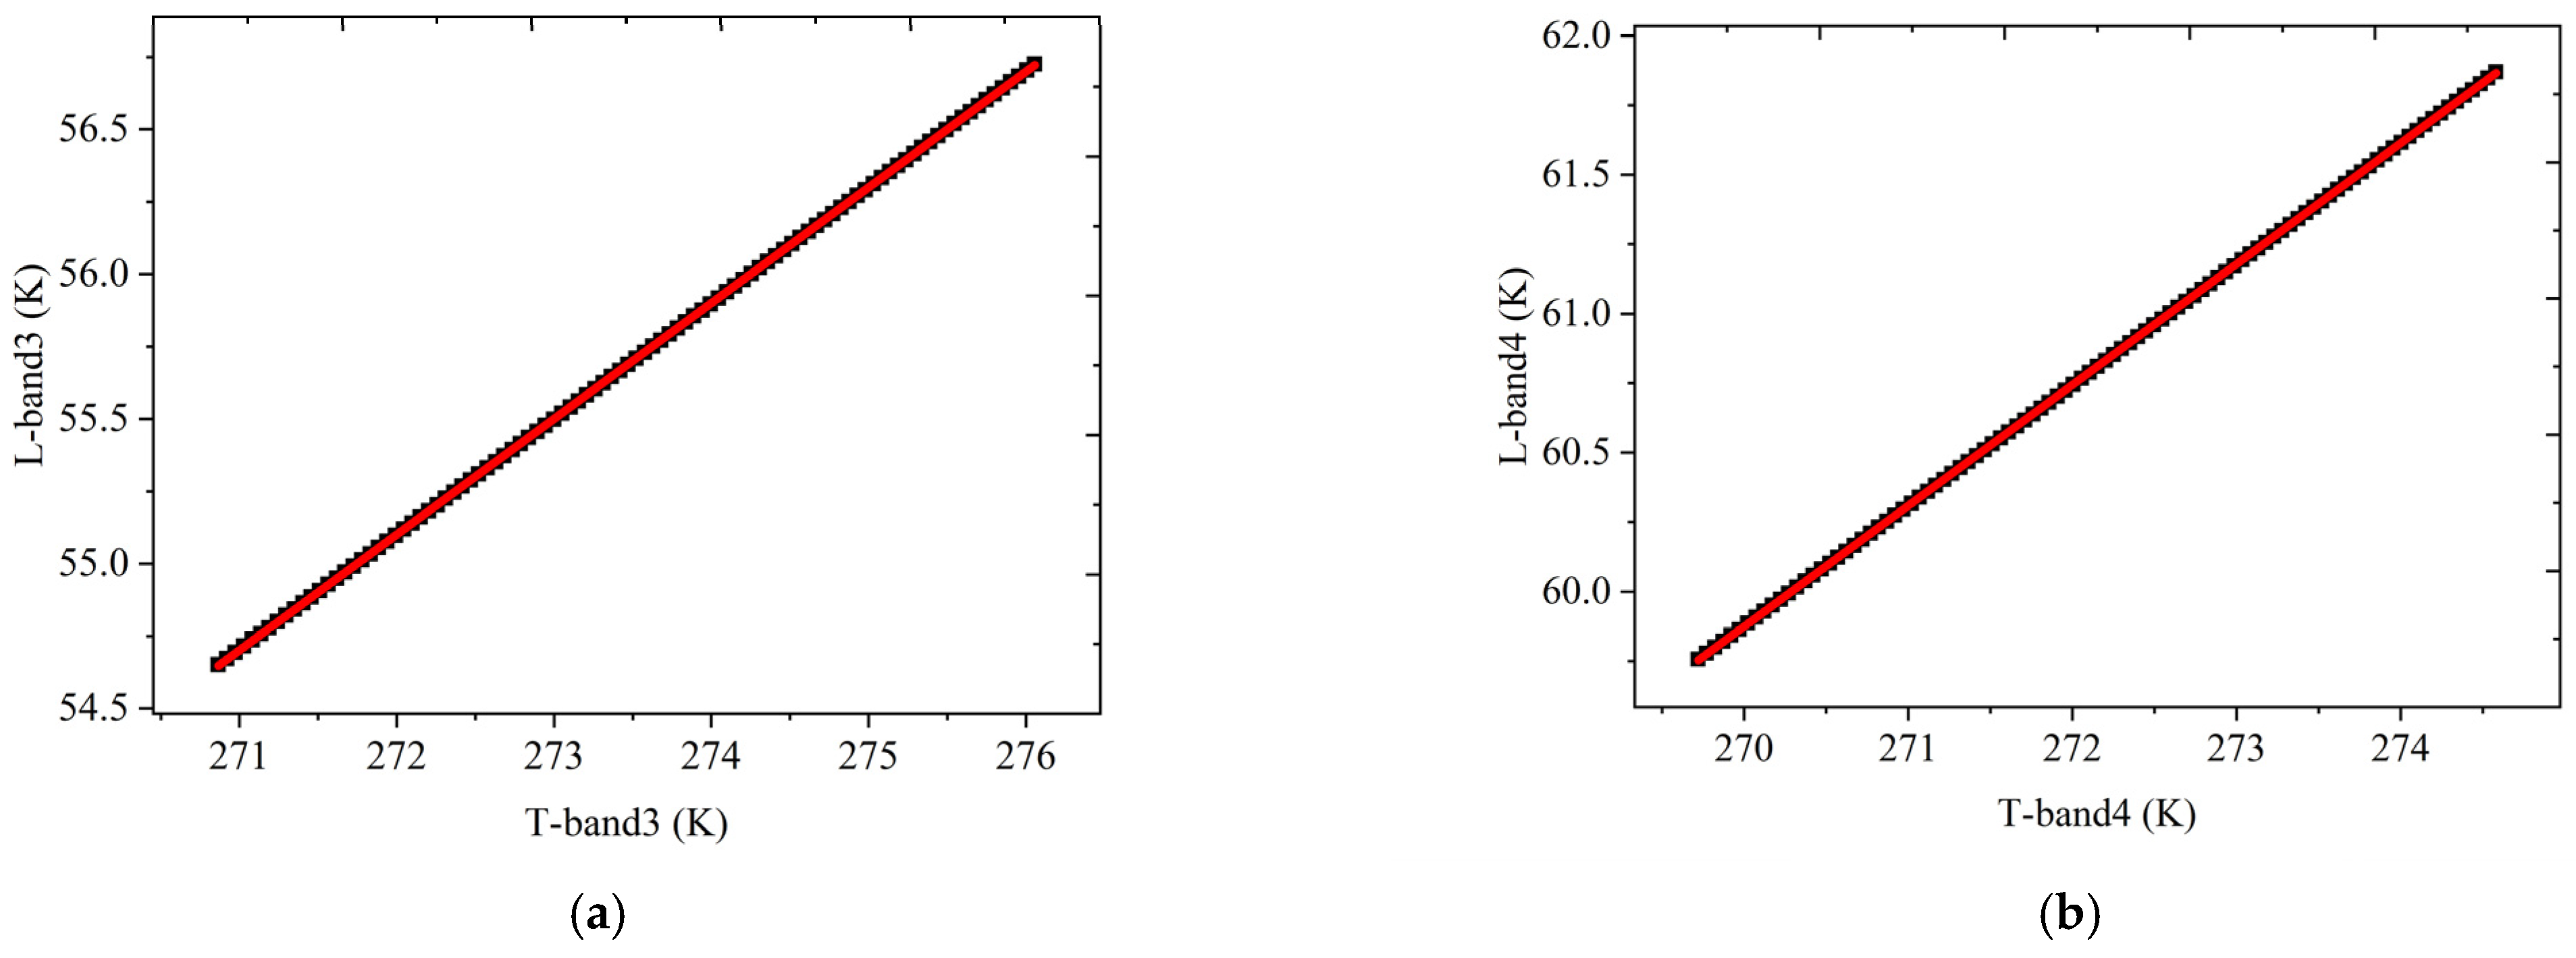
4.1. Determination of Atmospheric Transmittance
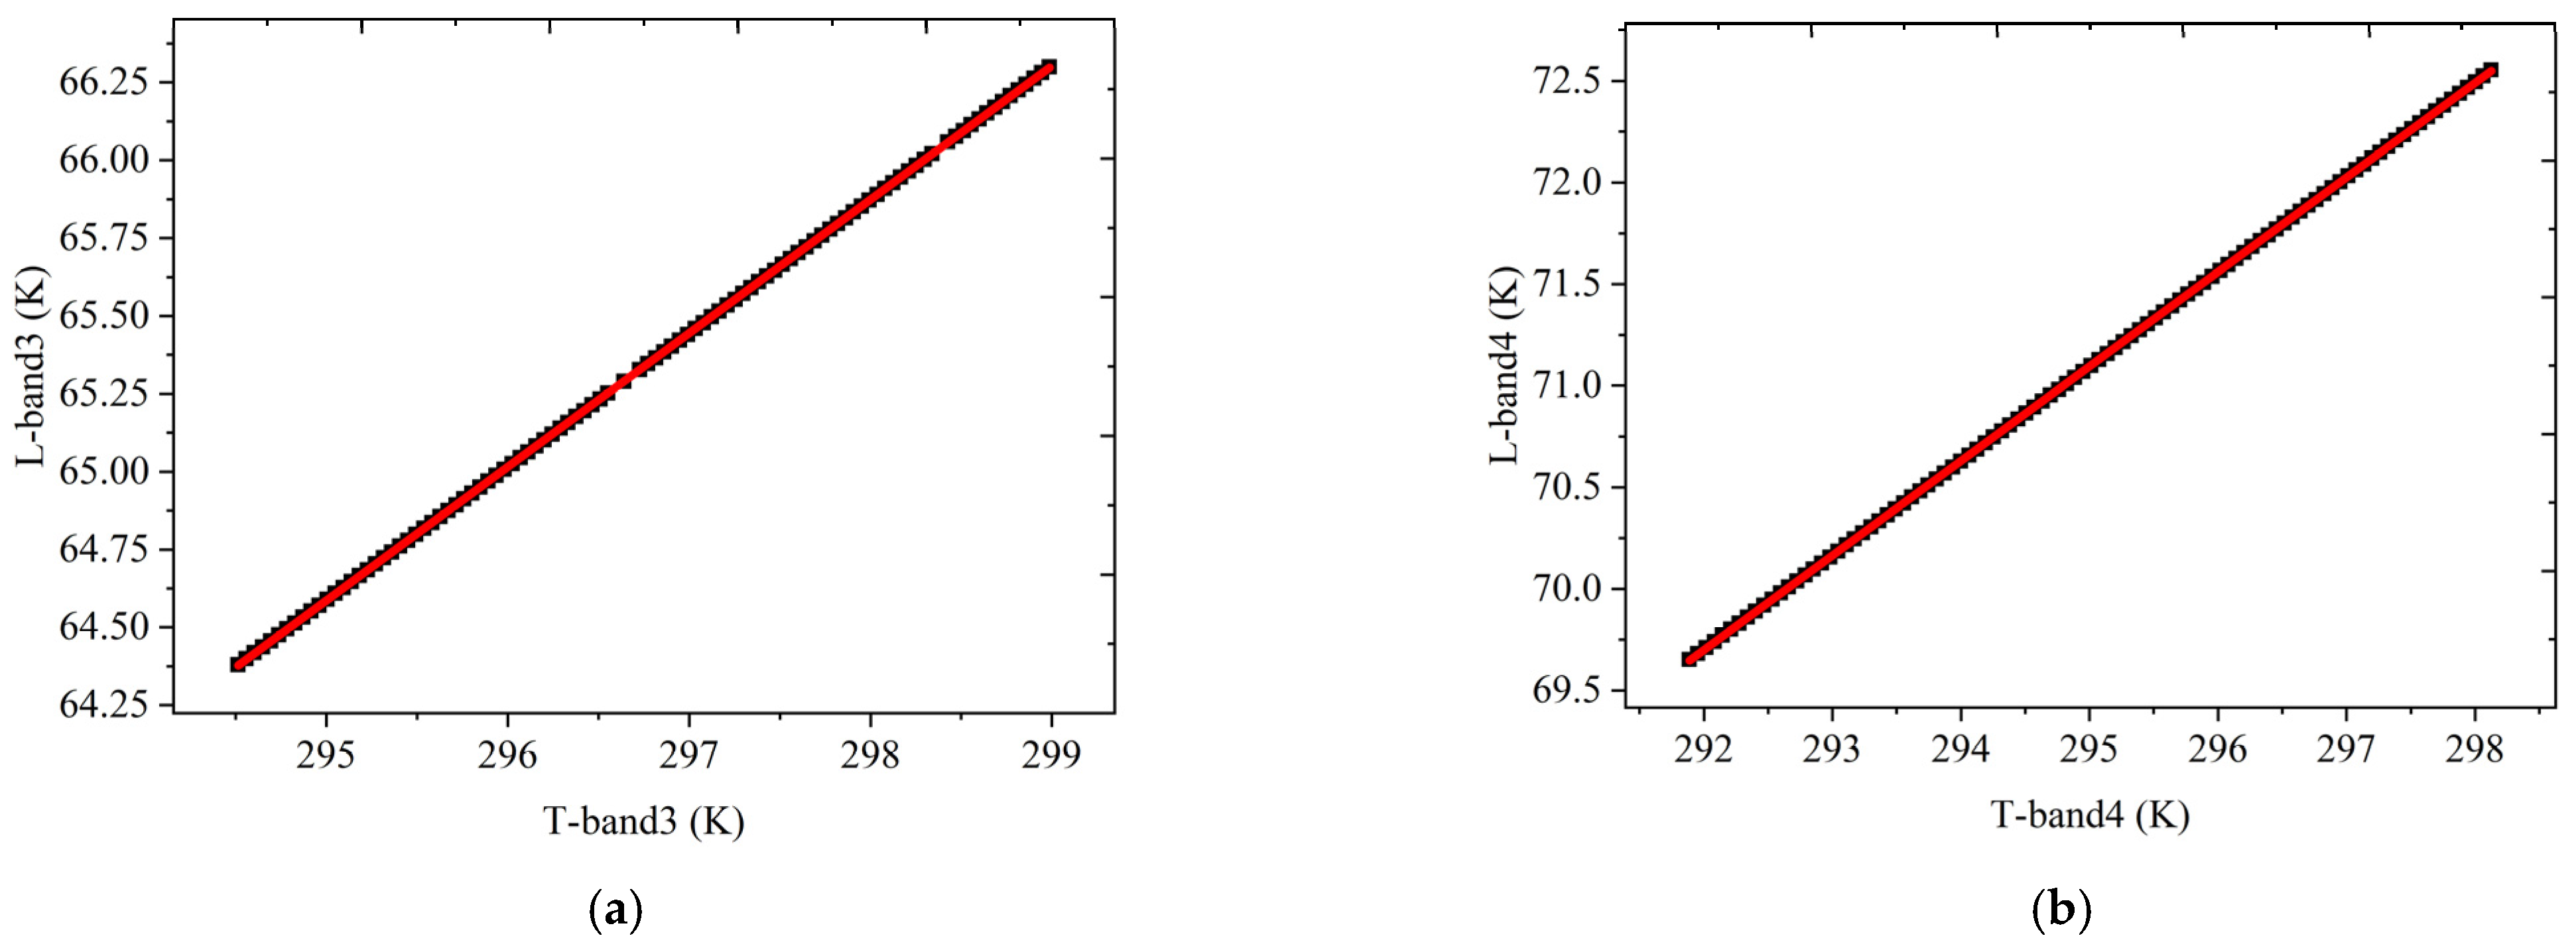
4.2. Determination of Regression Coefficients
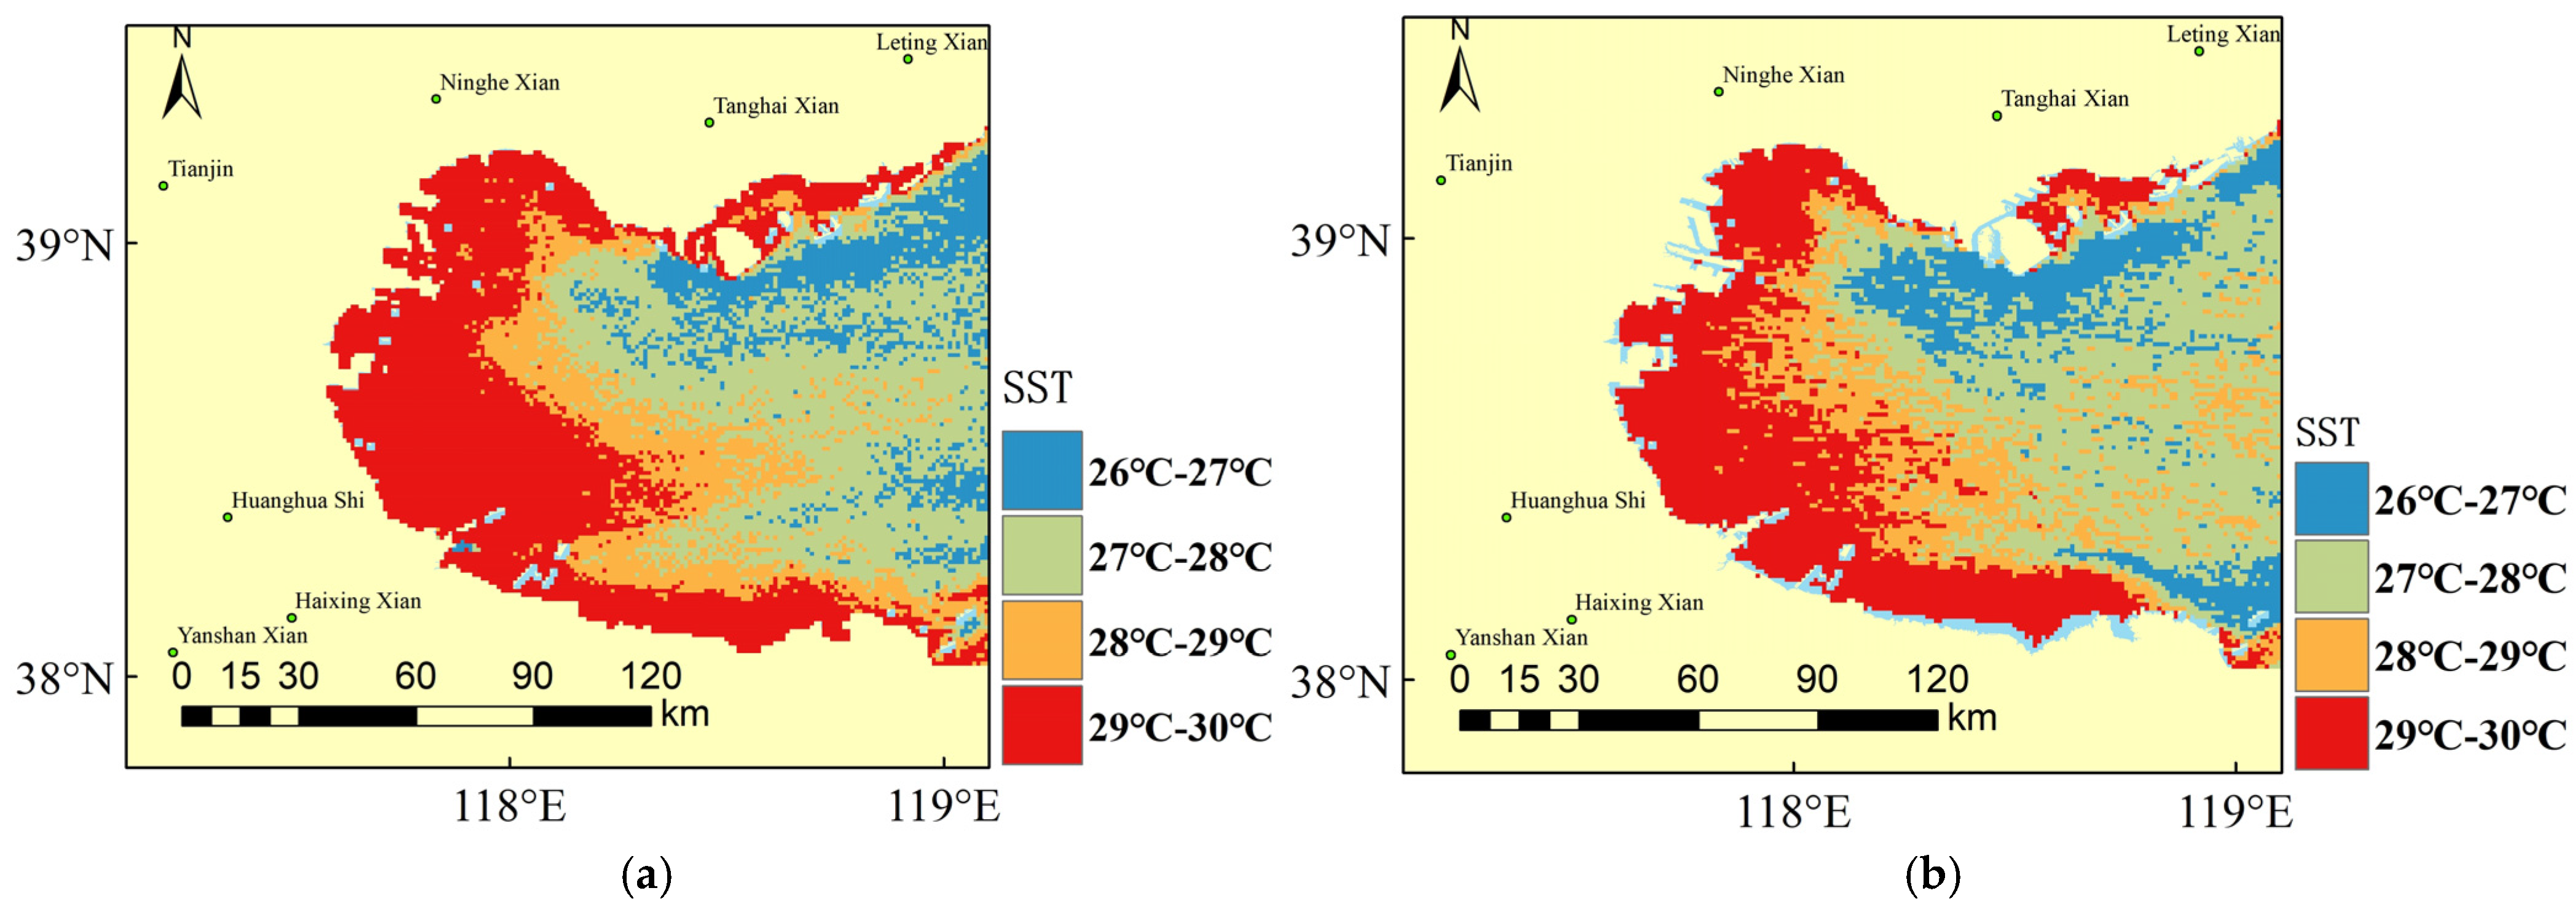
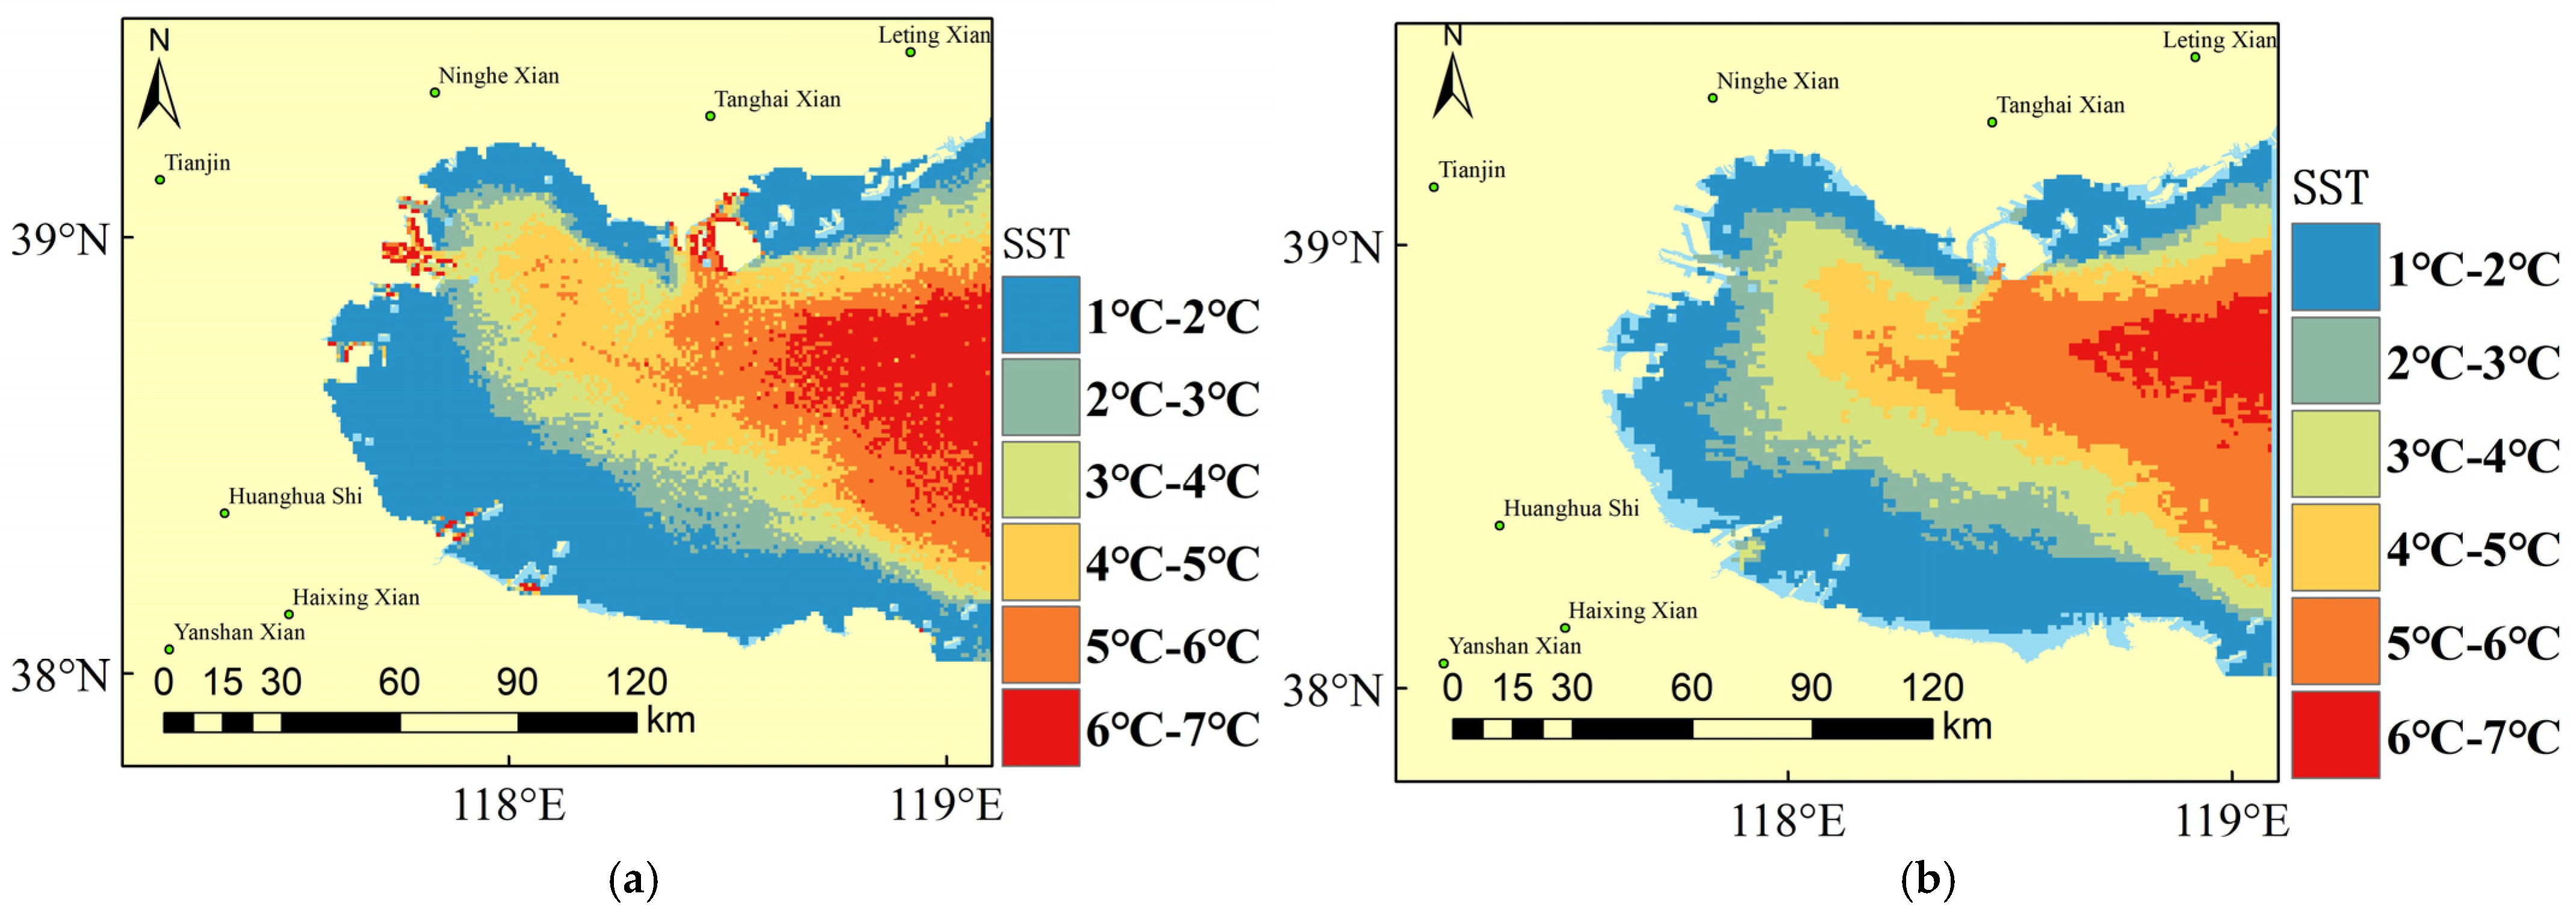
4.3. SST Retrieval Results
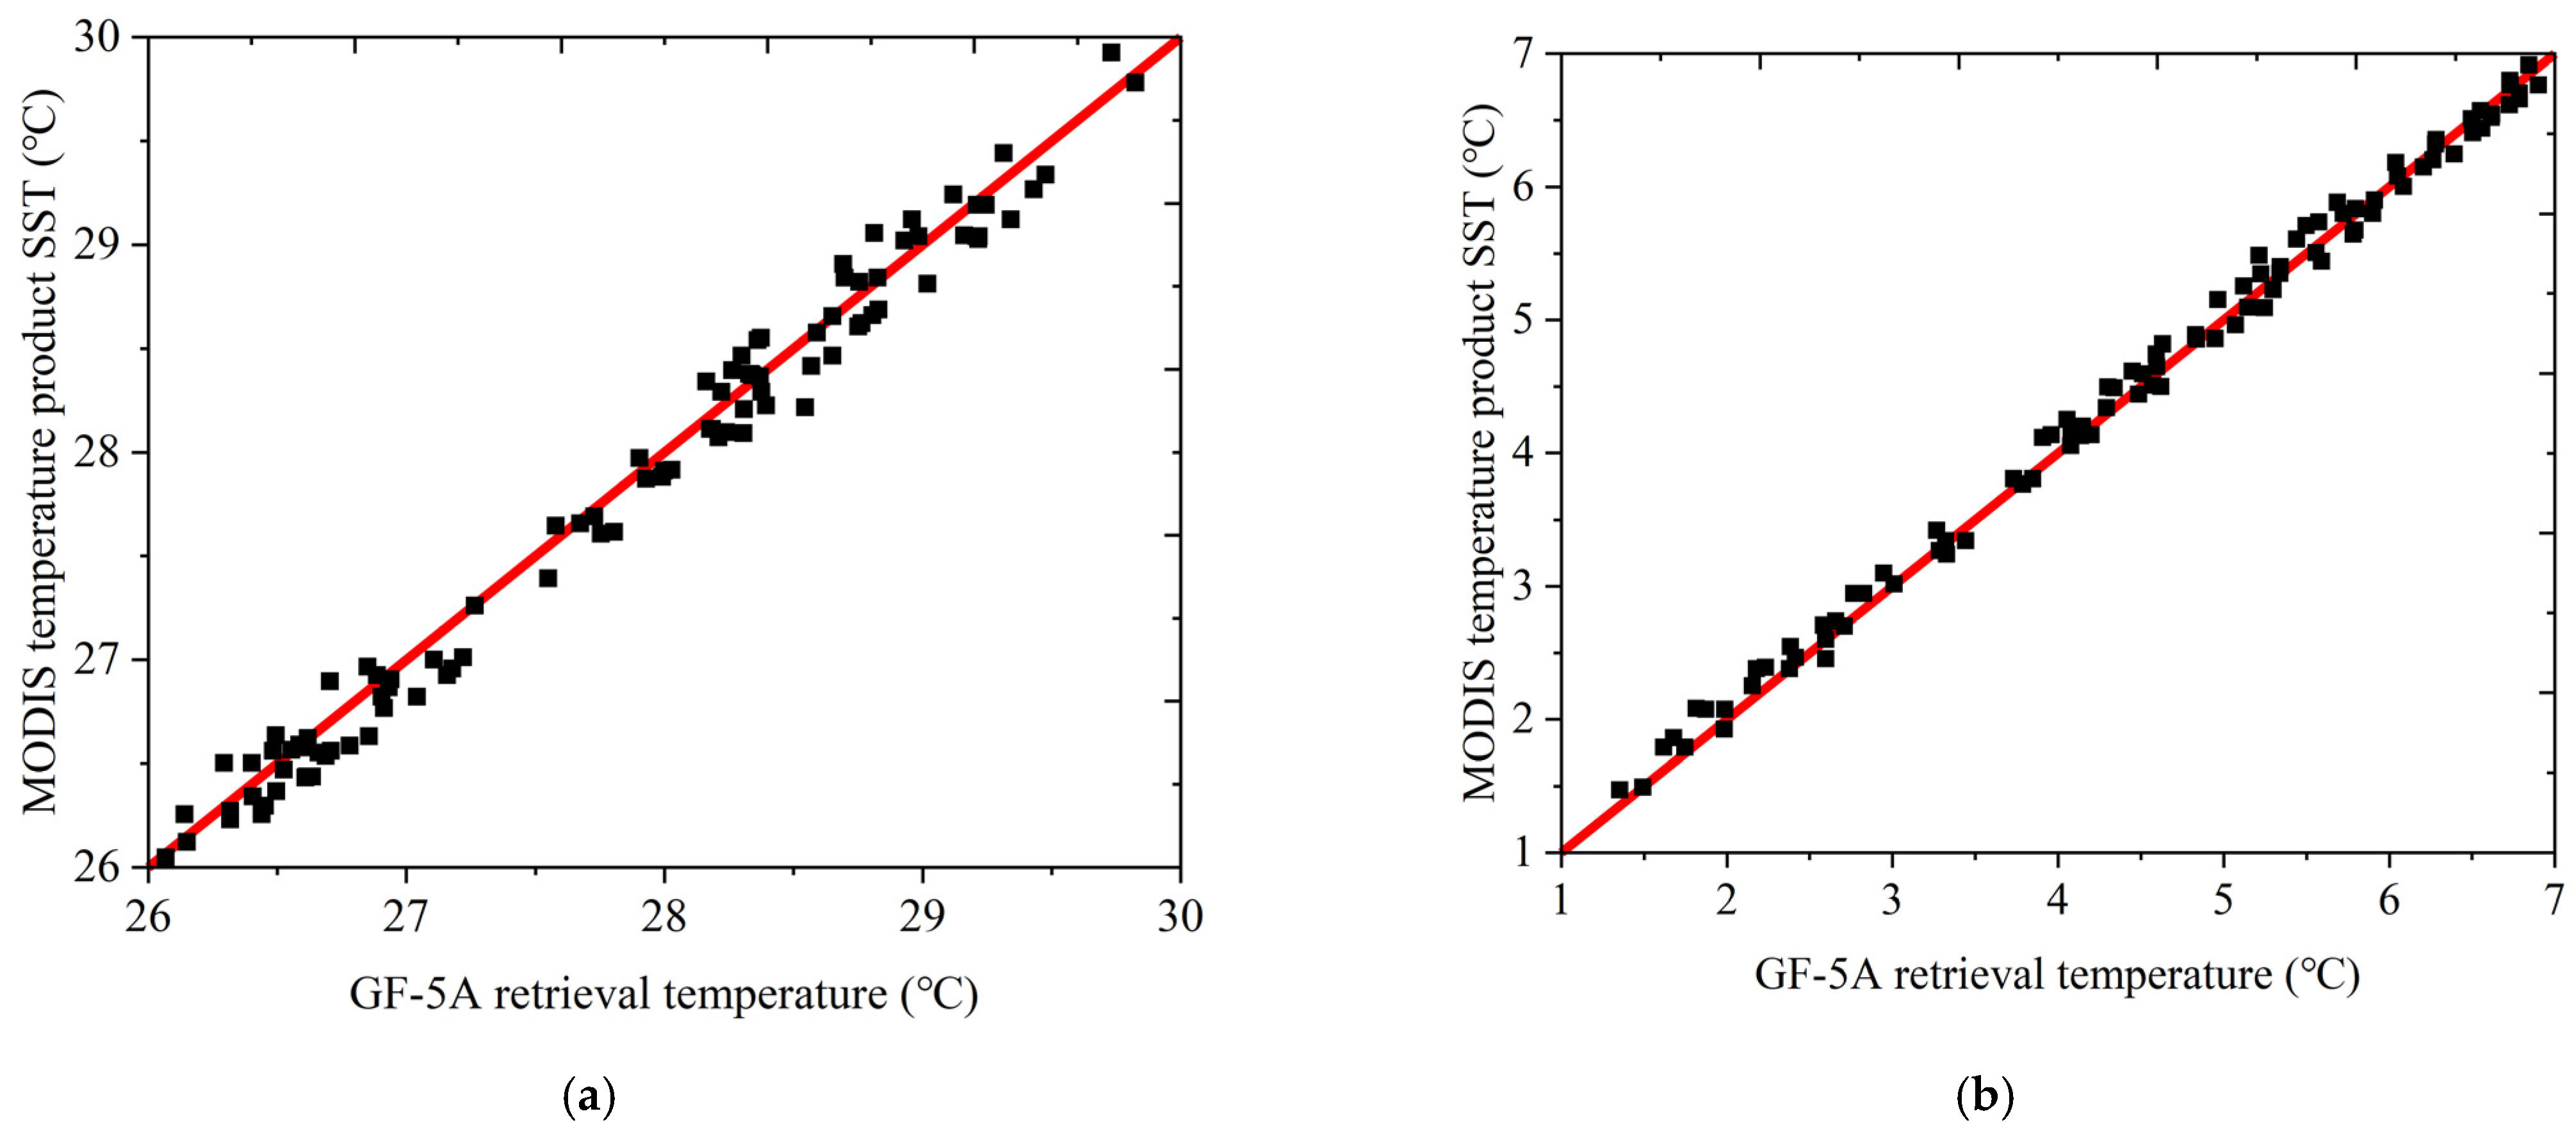
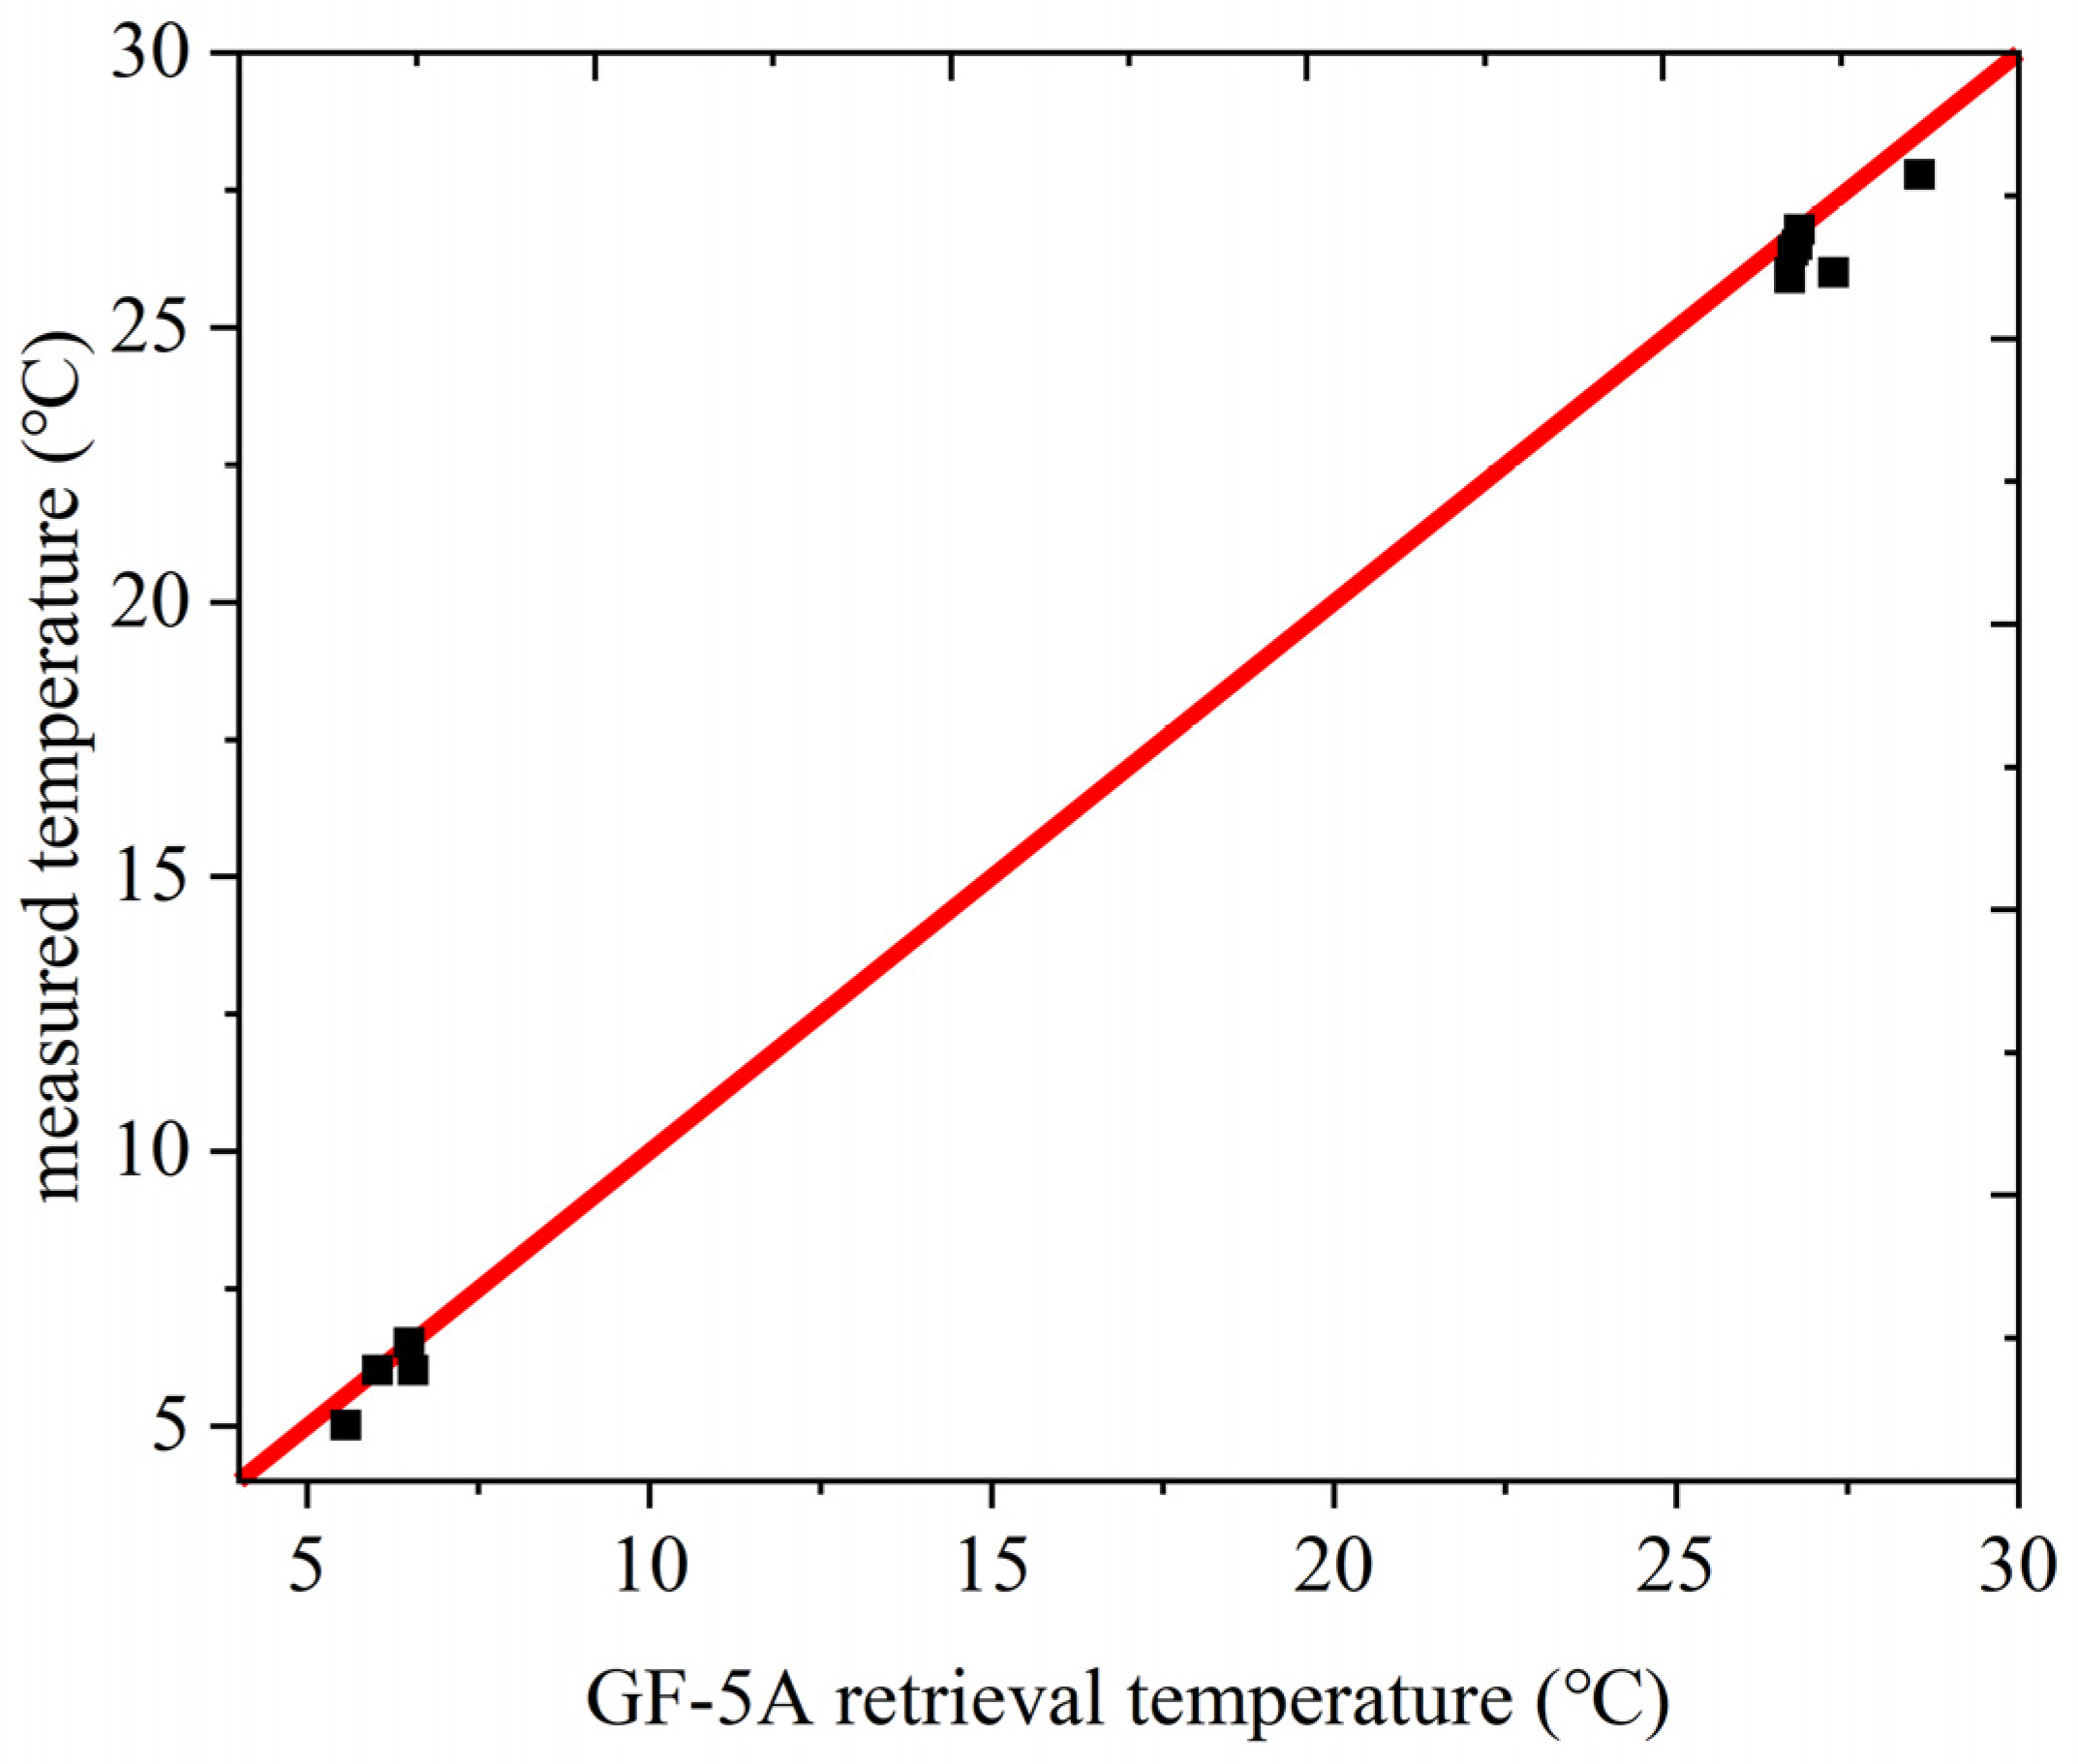
4.4. Validation of Retrieved SST Results
5. Discussion
- (1)
- The sea surface emissivity was 0.995, however, the actual specific sea surface emissivity value is affected by sediment content, wave conditions, and observation geometric conditions.
- (2)
- The atmospheric transmittance correction in this study was calculated using the effective wavelength, however, atmospheric transmittance correction using real-time atmospheric profile data is more accurate.
- (3)
- There is a difference between the depth of the SST of the measured data used in this study and that of the SST retrieved by the GF-5A satellite. The SST retrieved by the GF-5A satellite is the average temperature in a few microns-thick layer of the sea surface, whereas the SST of the measured data is the temperature in the 0.1 m to 1 m deep layer of the sea surface. This difference leads to errors in the direct verification of SST retrieval accuracy.
- (4)
- Wind, cloud, and other weather conditions also reduce SST retrieval accuracy. Cloud removal cannot completely eliminate the impact of clouds on SST retrieval accuracy. Therefore, to improve the accuracy of SST measurement in the Bohai Bay region further, it is necessary to collect and analyze data on the weather in this region.
6. Conclusions
- (1)
- An SST retrieval method based on the GF-5A satellite’s Qin split window algorithm and parameter adjustment is proposed. This method utilizes GF-5A satellite data with a resolution of 100 m to obtain the effective wavelengths of various thermal infrared bands through spectral response functions. Then, two important parameters, atmospheric transmittance and regression coefficient, in the Qin split window algorithm are corrected to facilitate SST data retrieval in the Bohai Bay area, demonstrating the feasibility of this method.
- (2)
- Through image comparison, it has been proven that the spatial distribution of SST results retrieved from the Bohai Bay area using this method is similar to the MODIS temperature product SST data. In summer, SST gradually decreases from land to sea, while in winter, SST gradually increases from land to sea. Therefore, this method can be used to obtain large-scale real-time SST data, providing basic SST data for related research, such as studies of animal and plant resources.
- (3)
- Indirect verification using MODIS temperature product and direct verification using measured data have proven that the SST retrieval method has good accuracy in the Bohai Bay area, with better R2 and RMSE values compared with the split window algorithm for SST retrieval of Landsat–8 satellite data at a resolution of 100 m. Therefore, this method can be used to obtain high-precision SST data that can be used for intelligent forecasting of ocean temperature and conducting other research studies.
Author Contributions
Funding
Data Availability Statement
Acknowledgments
Conflicts of Interest
References
- Durán-Campos, E.; Coria-Monter, E. Early Signals of El Niño 2023 in the Gulf of California? Lat. Am. J. Aquat. Res. 2024, 52, 2024. [Google Scholar] [CrossRef]
- Zhang, C.; Zhou, S.; Zhu, L. Three Algorithms of Sea Surface Temperature Inversion of Daya Bay Based on Environmental Star HJ_1B Data. J. East China Univ. Technol. (Nat. Sci.) 2013, 36, 88–92. [Google Scholar]
- Zhang, C.; Zhang, X.; Zeng, Y.; Pan, W.; Hua, L. Retrieval and Validation of Sea Surface Temperature in the Taiwan Strait Using MODIS Data. Acta Oceanol. Sin. 2008, 30, 153–160. [Google Scholar]
- Price, J.C. Estimating Surface Temperatures from Satellite Thermal Infrared Data—A Simple Formulation for the Atmospheric Effect. Remote Sens. Environ. 1983, 13, 353–361. [Google Scholar] [CrossRef]
- Qin, Z.; Karnieli, A.; Berliner, P. A Mono-Window Algorithm for Retrieving Land Surface Temperature from Landsat TM Data and Its Application to the Israel-Egypt Border Region. Int. J. Remote Sens. 2010, 22, 3719–3746. [Google Scholar] [CrossRef]
- Qin, Z.-H.; Zhang, M.-H.; Karnieli, A.; Berliner, P. Mono-Window Algorithm for Retrieving Land Surface Temperature from Landsat TM6 Data. Acta Geogr. Sin. 2001, 56, 456–466. [Google Scholar]
- Qin, Z.; Li, W.; Zhang, M.; Karnieli, A.; Berliner, P. Estimating of the Essential Atmospheric Parameters of Mono-Window Algorithm for Land Surface Temperature Retrieval from Landsat TM6. Remote Sens. Land Resour. 2003, 15, 37–43. [Google Scholar]
- Jiménez-Muñoz, J.C.; Sobrino, J.A. A Generalized Single-Channel Method for Retrieving Land Surface Temperature from Remote Sensing Data. J. Geophys. Res. Atmos. 2003, 108, D22. [Google Scholar] [CrossRef]
- Jimenez, J.-C.; Cristóbal Rosselló, J.; Sobrino, J.; Sòria Barres, G.; Ninyerola, M.; Pons, X. Revision of the Single-Channel Algorithm for Land Surface Temperature Retrieval from Landsat Thermal-Infrared Data. Geosci. Remote Sens. IEEE Trans. 2009, 47, 339–349. [Google Scholar] [CrossRef]
- Jimenez, J.-C.; Sobrino, J.; Skokovic, D.; Mattar, C.; Cristóbal Rosselló, J. Land Surface Temperature Retrieval Methods from Landsat-8 Thermal Infrared Sensor Data. Geosci. Remote Sens. Lett. IEEE 2014, 11, 1840–1843. [Google Scholar] [CrossRef]
- Gan, F.; Chen, W.; Zhang, X.; Yan, B.; Liu, S.; Yang, S. The Progress in the Study of Thermal Infrared Remote Sensing for Retrieving Land Surface Temperature. Remote Sens. Land Resour. 2006, 18, 6–11. [Google Scholar]
- Ding, F.; Xu, H. Comparison of Three Algorithms for Retrieving Land Surface Temperature from Landsat TM Thermal Infrared Band. J. Fujian Norm. Univ. Nat. Sci. Ed. 2008, 24, 91–96. [Google Scholar]
- Li, H.; Zeng, Y.; Fu, P.; Huang, J.; Yang, K.; Zou, J. Study on Retrieval Urban Land Surface Temperature with Multi-source Remote Sensing Data. Natl. Remote Sens. Bull. 2007, 11, 891–898. [Google Scholar]
- McMillin; Larry, M. Estimation of Sea Surface Temperatures from Two Infrared Window Measurements with Different Absorption. J. Geophys. Res. 1975, 80, 5113–5117. [Google Scholar] [CrossRef]
- Zhu, L.; Gu, X.; Chen, L.; Yu, T.; Wang, Z.-F. Comparison of LST Retrieval Precision between Single-Channel and Split-Windows for High-Resolution Infrared Camera. J. Infrared Millim. Waves 2008, 27, 346–353. [Google Scholar]
- Qin, Z.; Karnieli, A. Progress in the Remote Sensing of Land Surface Temperature and Ground Emissivity Using NOAA-AVHRR Data. Int. J. Remote Sens. 1999, 20, 2367–2393. [Google Scholar] [CrossRef]
- Zhang, L.; Mei, G.; Liu, M.; Li, Y.; Shi, K.; Zhu, M.; Li, H.; Guo, Y.; Wang, J. Comparison of Lake Surface Water Temperature Retrieval Algorithms: A Case Study of Lake Qiandaohu. Natl. Remote Sens. Bull. 2024, 28, 2113–2130. [Google Scholar] [CrossRef]
- Qin, Z.; Zhang, M.; Karnieli, A. Split Window Algorithms for Retrieving Land Surface Temperature from Noaa-Avhrr Data. Remote Sens. Land Resour. 2001, 13, 33–42. [Google Scholar]
- Sun, T.; Yang, K.; Wang, X.; Zhang, W.; Cheng, L. Study on the Suitability of Split-Window and Mono-Window Algorithms on Analying the Urban Heat Island Effect of Tai’an City. Geomat. Spat. Inf. Technol. 2017, 40, 60–63. [Google Scholar]
- Wang, Y.; Song, X.; Tang, B.; Li, Z.; Leng, P. Validation of FY-2C Derived Land Surface Temperature over the Source Region of the Yellow River: A Case Study of Maqu County. Remote Sens. Land Resour. 2015, 27, 68–72. [Google Scholar]
- Pandya, M.; Shah, D.; Trivedi, H.; Panigrahy, S.; Parihar, J.; Kirankumar, A. Evaluation of Split-Window Algorithms for Retrieving Land Surface Temperature from the INSAT-3D Imager Observations. In Vayumandal; Indian Meteorological Society: New Delhi, India, 2011; pp. 35–41. [Google Scholar]
- Jiang, G.-M.; Li, Z.-L. Split-Window Algorithm for Land Surface Temperature Estimation from MSG1-SEVIRI Data. Int. J. Remote Sens. 2008, 29, 6067–6074. [Google Scholar] [CrossRef]
- Gao, C.; Tang, B.; Wu, H.; Jiang, X.; Li, Z.-L. A Generalized Split-Window Algorithm for Land Surface Temperature Estimation from MSG-2/SEVIRI Data. Int. J. Remote Sens. 2013, 34, 4182–4199. [Google Scholar] [CrossRef]
- Liu, C.; Li, H.; Du, Y.; Cao, B.; Liu, Q.; Meng, X.; Hu, Y. Practical Split-Window Algorithm for Retrieving Land Surface Temperature from Himawari 8 AHI Data. Natl. Remote Sens. Bull. 2021, 21, 702–714. [Google Scholar] [CrossRef]
- Jiang, G.-M.; Zhou, W.; Liu, R. Development of Split-Window Algorithm for Land Surface Temperature Estimation from the VIRR/FY-3A Measurements. IEEE Geosci. Remote Sens. Lett. 2013, 10, 952–956. [Google Scholar] [CrossRef]
- Yang, J.; Huang, C.; Mo, W.; Wu, Y.; Shen, J.; He, L.; Chen, S. Comparison and Application for Different Split Window Algorithm of Retrieving Land Surface Temperature. J. Guangxi Univ. (Nat. Sci. Ed.) 2004, 29, 80–85. [Google Scholar]
- Ding, L.; Qin, Z.; Mao, K. A Research of Split Window Algorithm Based on MODIS Image Data and Parameter Determination. Remote Sens. Technol. Appl. 2005, 20, 284–289. [Google Scholar]
- KANG, T.; GUO, M.; Cao, B.; Ren, H.; Fan, W. Component Temperature Inversion Algorithm Based on Sentinel-3 SLSTR Data. Yaogan Xuebao/J. Remote Sens. 2021, 25, 1671–1682. [Google Scholar] [CrossRef]
- Bai, Q.; Meng, D.; Xing, J. Study on Land Surface Temperature Retrieval in Beijing Based on Tiangong-2 Data. Manned Spacefl. 2019, 25, 809–816. [Google Scholar]
- Cheng, Y.; Wu, H.; Li, Z.; Qian, Y. Retrieval and Validation of the Land Surface Temperature from FY-3D MERSI-II. Natl. Remote Sens. Bull. 2021, 25, 1792–1807. [Google Scholar] [CrossRef]
- Fang, C.; Liang, X.; Liu, R. Comparative Analysis of Marine Economic Difference Based on Geospatial Gulfs: A Case Study of Liaodong Bay, Bohai Bay, Laizhou Bay. China Popul. Resour. Environ. 2012, 22, 170–174. [Google Scholar]
- Yang, L.; Liu, J.; Zhang, J.; Wang, X.; Xu, Y.; Li, X.; He, L. Zooplankton Community Variation and Its Relationship with Environmental Variables in Bohai Bay. J. Mar. Sci. 2018, 36, 93–101. [Google Scholar]
- Zheng, X.; Li, G. Distribution Characteristics of Chlorophyll Concentration and the Effects of Environmental Elements of Bohai Bay in Spring. Ocean Technol. 2014, 33, 1–7. [Google Scholar]
- Zhang, Y.; Gu, D.; Xu, H.; Xue, W.; Yu, X. Environmental Adaptability of Fish Eggs in Bohai Bay Assessed Using Habitat Suitability Index Method. J. Fish. Sci. China 2021, 28, 1568–1575. [Google Scholar] [CrossRef]
- Bao, X. Simulation of Seasonal Variation of Thermo-Structure and Circulation in the Bohai and Yellow Seas. Period. Ocean. Univ. China 2004, 34, 513–522. [Google Scholar]
- Tian, M.; Tian, Z.; Feng, Q.; Fan, Y.; Dong, N.; Shao, Y.; Wang, Z. Monthly Average Variation Pattern of Key Ecological and Environmental Parameters in Bohai Bay over the Past Two Decades. Adv. Geosci. 2024, 14, 1247–1255. [Google Scholar] [CrossRef]
- Mao, K.; Qin, Z.; Wang, J.; Wu, S. Lowtran Retrieval of Atmospheric Water Content and Transmittance Computation of MODIS Bands 31 and 32. Remote Sens. Land Resour. 2005, 17, 26–29. [Google Scholar]
- Wang, T.; Song, M.; Hou, Q. Research on Surface Temperature Inversion and Its Application in Chongqing Based on Split Window Algorithm. Mod. Inf. Technol. 2024, 8, 93–98. [Google Scholar]
- Mao, K.; Tang, H.; Zhou, Q.; Chen, Z.; Chen, Y.; Qin, Z. Retrieving land surface temperature from MODIS data by using radiance transfer equation. J. Lanzhou Univ. (Nat. Sci.) 2007, 43, 12–17. [Google Scholar]
- Gao, M.; Qin, Z.; Xu, B. Estimation of the Basic Parameters for Deriving Surface Temperature from MODIS Data. Arid Zone Res. 2007, 24, 113–119. [Google Scholar]
- Hang, Y.; Zhang, P. Retrieval of Lake Surface Temperature in Plateau Based on Landsat-8 Images. J. Appl. Sci. 2024, 42, 977–987. [Google Scholar]
- Zhai, S.; Huang, D.; Wang, W.; Liu, J.; Wang, H.; Lu, Z. Land Surface Temperature Retrieval Using Improved Splitting Window Algorithm Based on Landsat 8 Data. J. China Hydrol. 2019, 39, 8–13. [Google Scholar]
- He, G.; Hu, Y.; Xiao, Z. Land Surface Temperature Retrieval Based on TM8 Thermal Infrared Data and Its Application. Guangdong Agric. Sci. 2015, 42, 146–153. [Google Scholar]


| Station | Time | Longitude | Latitude |
|---|---|---|---|
| ZCPC7MW | 27 December 2024 07:00 | 118.6°E | 38.8°N |
| KUL7SEK | 29 December 2024 03:00 | 118.7°E | 38.8°N |
| CQNL | 28 December 2024 12:00 | 118.8°E | 38.8°N |
| SJGS5AE | 5 January 2025 18:00 | 119.1°E | 38.7°N |
| KKEKFPK | 23 July 2024 17:00 | 118.3°E | 38.9°N |
| KKEKFPK | 23 July 2024 18:00 | 118.2°E | 38.9°N |
| KKEKFPK | 23 July 2024 19:00 | 118.1°E | 38.9°N |
| KKEKFPK | 25 July 2024 05:00 | 118.0°E | 38.9°N |
| KKEKFPK | 25 July 2024 06:00 | 118.2°E | 38.9°N |
| KKEKFPK | 25 July 2024 09:00 | 118.9°E | 38.8°N |
| KKEKFPK | 25 July 2024 10:00 | 119.1°E | 38.7°N |
| Name | Information | Purpose |
|---|---|---|
| MOD03 | MODIS geolocation data file, which contains the longitude and latitude of each 1 km Earth view center | Geometric correction for remote sensing image |
| MOD021KM | MODIS1B data product with a resolution of 1km; include reflectance and emissivity datasets | The reflectivity of band 2 and band 19 are used to calculate the atmospheric water vapor content |
| MODIS temperature product | MODIS temperature product with a resolution of 1 km | Used for indirect verification of SST retrieval results |
| Parameter | Parameter Value |
|---|---|
| Spectral segment | B1: 8.01–8.39 μm |
| B2: 8.42–8.83 μm | |
| B3: 10.3–11.3 μm | |
| B4: 11.5–12.5 μm | |
| Sub-satellite ground pixel resolution | ≤100 m |
| Width | ≥1500 km |
| Bit | Flag Description | Value |
|---|---|---|
| 0 | Fill | 0 image data 1 fill data |
| 1 | Dilated Cloud | 0 cloud is not dilated or no cloud 1 cloud dilation |
| 2 | Cirrus | 0 cirrus confidence: no confidence level set for low confidence 1 high confidence |
| 3 | Cloud | 0 cloud confidence is not high 1 high confidence |
| 4 | Cloud Shadow | 0 cloud shadow confidence is not high 1 high confidence |
| 5 | Snow | 0 snow/ice confidence is not high 1 high confidence |
| 6 | Clear | 0 cloud or dilated cloud bits are set 1 cloud and dilated cloud bits are not set |
| 7 | Water | 0 land or cloud 1 water |
| 8–9 | Cloud Confidence | 00 no confidence level set 01 low confidence 10 medium confidence 11 high confidence |
| 10–11 | Cloud Shadow Confidence | 00 no confidence level set 01 low confidence 10 reserved 11 high confidence |
| 12–13 | Snow/Ice Confidence | 00 no confidence level set 01 low confidence 10 reserved 11 high confidence |
| 14–15 | Cirrus Confidence | 00 no confidence level set 01 low confidence 10 reserved 11 high confidence |
| Name | Calculation Formula | Band 3 Results | Band 4 Results |
|---|---|---|---|
| a | 0.0009λe3 − 0.01638λe2 + 0.04745λe + 0.27436 | 0.01 | 0.0384 |
| b | 0.00032λe3 − 0.06148λe2 + 1.2021λe − 6.2051 | 0.0097 | −0.0742 |
| c | 0.00986λe3 − 0.23672λe2 + 1.7133λe − 3.2199 | 0.0933 | 0.2775 |
| d | −0.15431λe3 + 5.2757λe2 − 60.117λe + 229.3139 | 1.0224 | 0.9696 |
| Regression Coefficient a | Regression Coefficient b | ||
|---|---|---|---|
| 18 July 2024 | Band 3 | −62.00847 | 0.42913 |
| Band 4 | −66.10467 | 0.46508 | |
| 31 December 2024 | Band 3 | −53.5938 | 0.39961 |
| Band 4 | −57.53953 | 0.43487 | |
| Indirect Verification | Direct Verification | ||
|---|---|---|---|
| 18 July 2024 | 31 December 2024 | ||
| R2 | 0.985 | 0.996 | 0.999 |
| RMSE | 0.139 K | 0.116 K | 0.613 K |
Disclaimer/Publisher’s Note: The statements, opinions and data contained in all publications are solely those of the individual author(s) and contributor(s) and not of MDPI and/or the editor(s). MDPI and/or the editor(s) disclaim responsibility for any injury to people or property resulting from any ideas, methods, instructions or products referred to in the content. |
© 2025 by the authors. Licensee MDPI, Basel, Switzerland. This article is an open access article distributed under the terms and conditions of the Creative Commons Attribution (CC BY) license (https://creativecommons.org/licenses/by/4.0/).
Share and Cite
Sun, J.; Wei, D.; Zhang, D.; Sun, Z. An Improved Method for Estimating Sea Surface Temperature Based on GF-5A Satellite Data in Bohai Bay. Remote Sens. 2025, 17, 1879. https://doi.org/10.3390/rs17111879
Sun J, Wei D, Zhang D, Sun Z. An Improved Method for Estimating Sea Surface Temperature Based on GF-5A Satellite Data in Bohai Bay. Remote Sensing. 2025; 17(11):1879. https://doi.org/10.3390/rs17111879
Chicago/Turabian StyleSun, Jiren, Daoming Wei, Dianjun Zhang, and Zhiwei Sun. 2025. "An Improved Method for Estimating Sea Surface Temperature Based on GF-5A Satellite Data in Bohai Bay" Remote Sensing 17, no. 11: 1879. https://doi.org/10.3390/rs17111879
APA StyleSun, J., Wei, D., Zhang, D., & Sun, Z. (2025). An Improved Method for Estimating Sea Surface Temperature Based on GF-5A Satellite Data in Bohai Bay. Remote Sensing, 17(11), 1879. https://doi.org/10.3390/rs17111879