1. Introduction
Smart construction represents a paradigm shift in the construction industry, leveraging cutting-edge technologies such as artificial intelligence (AI), the Internet of Things (IoT), unmanned aerial vehicles (UAVs), and building information modeling (BIM) to advance automation, enhance quality quantification, and significantly improve productivity. These technologies are being actively researched and implemented globally, transforming traditional construction practices across various domains, particularly in earthwork processes critical to infrastructure development [
1]. Unlike conventional approaches that often view earthwork as repetitive manual tasks, smart construction emphasizes real-time quality monitoring and process optimization to ensure superior outcomes. In road construction, for instance, achieving high-quality surface smoothness and ground compaction during the early stages is paramount, as these factors directly influence the structural integrity, safety, and longevity of the infrastructure [
2,
3]. By integrating advanced tools, smart construction addresses longstanding challenges and sets new standards for efficiency and precision.
The smoothness of a road surface is a critical determinant of vehicle safety and ride comfort, serving as a primary indicator of construction quality. A smooth surface ensures stable vehicle handling and a comfortable driving experience, while poor smoothness can lead to a cascade of negative consequences, including reduced compaction efficiency, inconsistent ground stiffness, compromised structural stability of the pavement layer, accelerated road deterioration, and significantly higher maintenance costs over time [
2,
4]. Traditionally, achieving surface smoothness has relied heavily on the skill and experience of heavy equipment operators, such as those operating bulldozers and graders. However, this dependence on human expertise introduces variability, as quantitative standards for smoothness are often lacking, making it challenging to ensure consistent quality across large-scale projects [
5]. The absence of precise standardized metrics underscores the need for innovative technologies to revolutionize smoothness assurance in road construction.
To address these limitations, noncontact and nondestructive surface-elevation measurement technologies have gained significant attention, with UAV-based 3D surface modeling emerging as a game changer [
6,
7]. UAVs, equipped with high-resolution cameras and accurate geolocation systems, enable the creation of precise digital elevation models (DEMs) or digital surface models (DSMs) through advanced techniques like structure from motion (SfM) and multi-view stereo (MVS) [
8]. These models provide detailed high-accuracy representations of the terrain, allowing for comprehensive smoothness evaluation over expansive areas in a fraction of the time required by traditional surveying methods. The advantages of UAV-based approaches include superior accuracy, rapid data acquisition, and excellent real-time applicability, making them highly suitable for modern construction environments [
9]. In South Korea, pioneering research by Kim et al. [
10] has demonstrated the potential of UAV-based terrain elevation analysis to assess road surface smoothness immediately after paving, offering a scalable solution for real-time quality control.
Parallel to smoothness challenges, ground compaction quality management remains a critical concern in road construction. Conventional methods, such as the plate load test (PLT) and field density test, are static and localized, assessing compaction at specific points rather than across an entire road section. These approaches struggle to capture quality variations and are often influenced by the tester’s skill, leading to inconsistent and unreliable results [
11,
12]. Such limitations highlight the need for more comprehensive real-time methods to ensure uniform compaction quality, which is essential for the structural stability and durability of roads.
In response to these challenges, continuous compaction control (CCC) technology has been developed, utilizing intelligent compaction (IC) rollers equipped with global navigation satellite systems (GNSSs) and acceleration sensors [
13,
14]. CCC enables real-time measurement and storage of critical physical data, including ground stiffness, compaction frequency, amplitude, and roller speed, during the compaction process. By continuously collecting and analyzing these data, CCC provides a quantitative assessment of compaction quality across an entire section, facilitating early detection and correction of construction errors. This technology enhances quality control by offering a holistic view of compaction performance, significantly improving reliability compared with traditional point-based testing methods.
Building on CCC, the smart embankment compaction management system (SECMS) represents a significant evolution in compaction quality management. SECMS has been successfully demonstrated in countries such as the United States (Federal Highway Administration), Germany (BVB), and Japan (Ministry of Land, Infrastructure, Transport and Tourism), with increasing adoption in domestic research institutions and construction sites [
1]. Research by Lee et al. [
1] has showcased SECMS’s ability to monitor compaction quality in real-time, accelerate construction processes, and deliver high precision and reliability in quality deviation analysis compared with conventional methods. By providing continuous data-driven insights, SECMS is becoming a cornerstone of smart construction practices worldwide.
Importantly, to ensure uniform compaction, it is essential that the compaction process be initiated on a surface where sufficient flatness has already been secured. Surface irregularities at the start of compaction can result in uneven energy transfer from rollers, leading to local over- or under-compaction. Therefore, UAV-based smoothness evaluation plays a critical role as a pre-compaction quality assurance step, helping identify surface anomalies and supporting optimal compaction planning.
The integration of UAV-based surface elevation measurements and CCC-based compaction quality management offers a transformative framework for smart process management in road construction. UAVs provide precise real-time data on surface smoothness immediately after paving, while CCC and SECMS ensure comprehensive monitoring of compaction quality throughout the construction process. By linking these technologies, construction teams can quantify and monitor quality metrics across entire road sections, enabling proactive identification and resolution of issues. This integrated approach facilitates a data-driven construction process, enhancing accuracy, efficiency, and reliability. This study aims to demonstrate the feasibility and field applicability of these smart construction technologies, focusing on UAV-based quantitative smoothness evaluation and its linkage with SECMS to achieve a fully automated high-quality road construction process.
2. Material and Methods
2.1. Research Flow Diagram
Typical compaction work involves spreading materials, such as soil or aggregates, evenly at a certain thickness at a site. Graders or dozers are then used for leveling work to evenly prepare the surface. This is an important process to maintain the surface at a consistent flatness to enhance the efficiency of subsequent compaction work. Thereafter, compaction work is performed using compaction rollers, particularly vibratory rollers, to increase the density of the leveled surface and secure the ground stiffness.
After compaction work is completed, field density tests, PLTs, and other methods are mainly employed to evaluate the quality and confirm whether the compaction meets the design criteria.
However, existing flatness assurance work has limitations in securing quantitative and objective measures as it relies on the experience and judgment of the operators (of dozers or graders). In this study, to overcome these limitations, instead of relying on the subjective judgment of operators of conventional dozers, or grader-based flatness evaluation methods, the validity and field applicability of using UAVs (Agisoft Metashape (2.2.0)) to precisely analyze surface flatness and applying intelligent quality management systems (intelligent compaction and CCC-based systems) instead of conventional field density tests or PLTs were tested and verified.
2.2. Research Methods
2.2.1. Flatness Analysis Using UAV
To observe the surface changes based on the compaction process, remote images were collected using DJI’s Phantom 4 Multispectral model(manufactured by DJI, Shenzhen, China) drone equipped with multispectral sensors to collect optical images and spectral data. The drone altitude was fixed at 20 m, and data were collected with a front overlap ratio of 80% and a side overlap ratio of 70%. The positional resolution of the collected images using a real-time kinematic (RTK) network was 1.0 cm ± 1 ppm horizontally and 1.5 cm ± 1 ppm vertically. Moreover, when stitching surface images, matching was performed using position and elevation information acquired through virtual reference service (VRS) surveying to select ground control points (GCPs) based on the GRS80 TM coordinate system.
When establishing a digital map of the surface and elevation for each grid from the remote images, the 2D flatness of the surface can be calculated using the profile index (PrI) calculation formula from KS F 2373:2010 [
15]. The flatness index measures the roughness using the distance between the profile meter and the surface, draws upper and lower connecting lines of ±5 mm length, and expresses the sum of the rough waveforms that exceed the upper and lower connecting lines relative to the measured length, as expressed in Equation (1). Generally, the flatness distance is based on 0.15 km.
where PrI is the flatness index (cm/km), ∑h, h
1 + h
2 + … + h
n−1 + h
n is the sum of the surface roughness waveforms (cm) that exceed the upper and lower connecting lines for a distance of 0.15 km, and L is the measurement length (0.15 km).
Surface characteristics are classified into terrain elements, such as elevation, aspect, slope, curvature, upslope contributing area, and wetness index [
16], which are used for creating landslide risk maps and simulating surface water convergence and divergence [
17,
18]. Although it is difficult to visually identify relief on surfaces that have been flattened to within a few millimeters, applying digitized terrain indices can quantitatively express the terrain roughness and flatness.
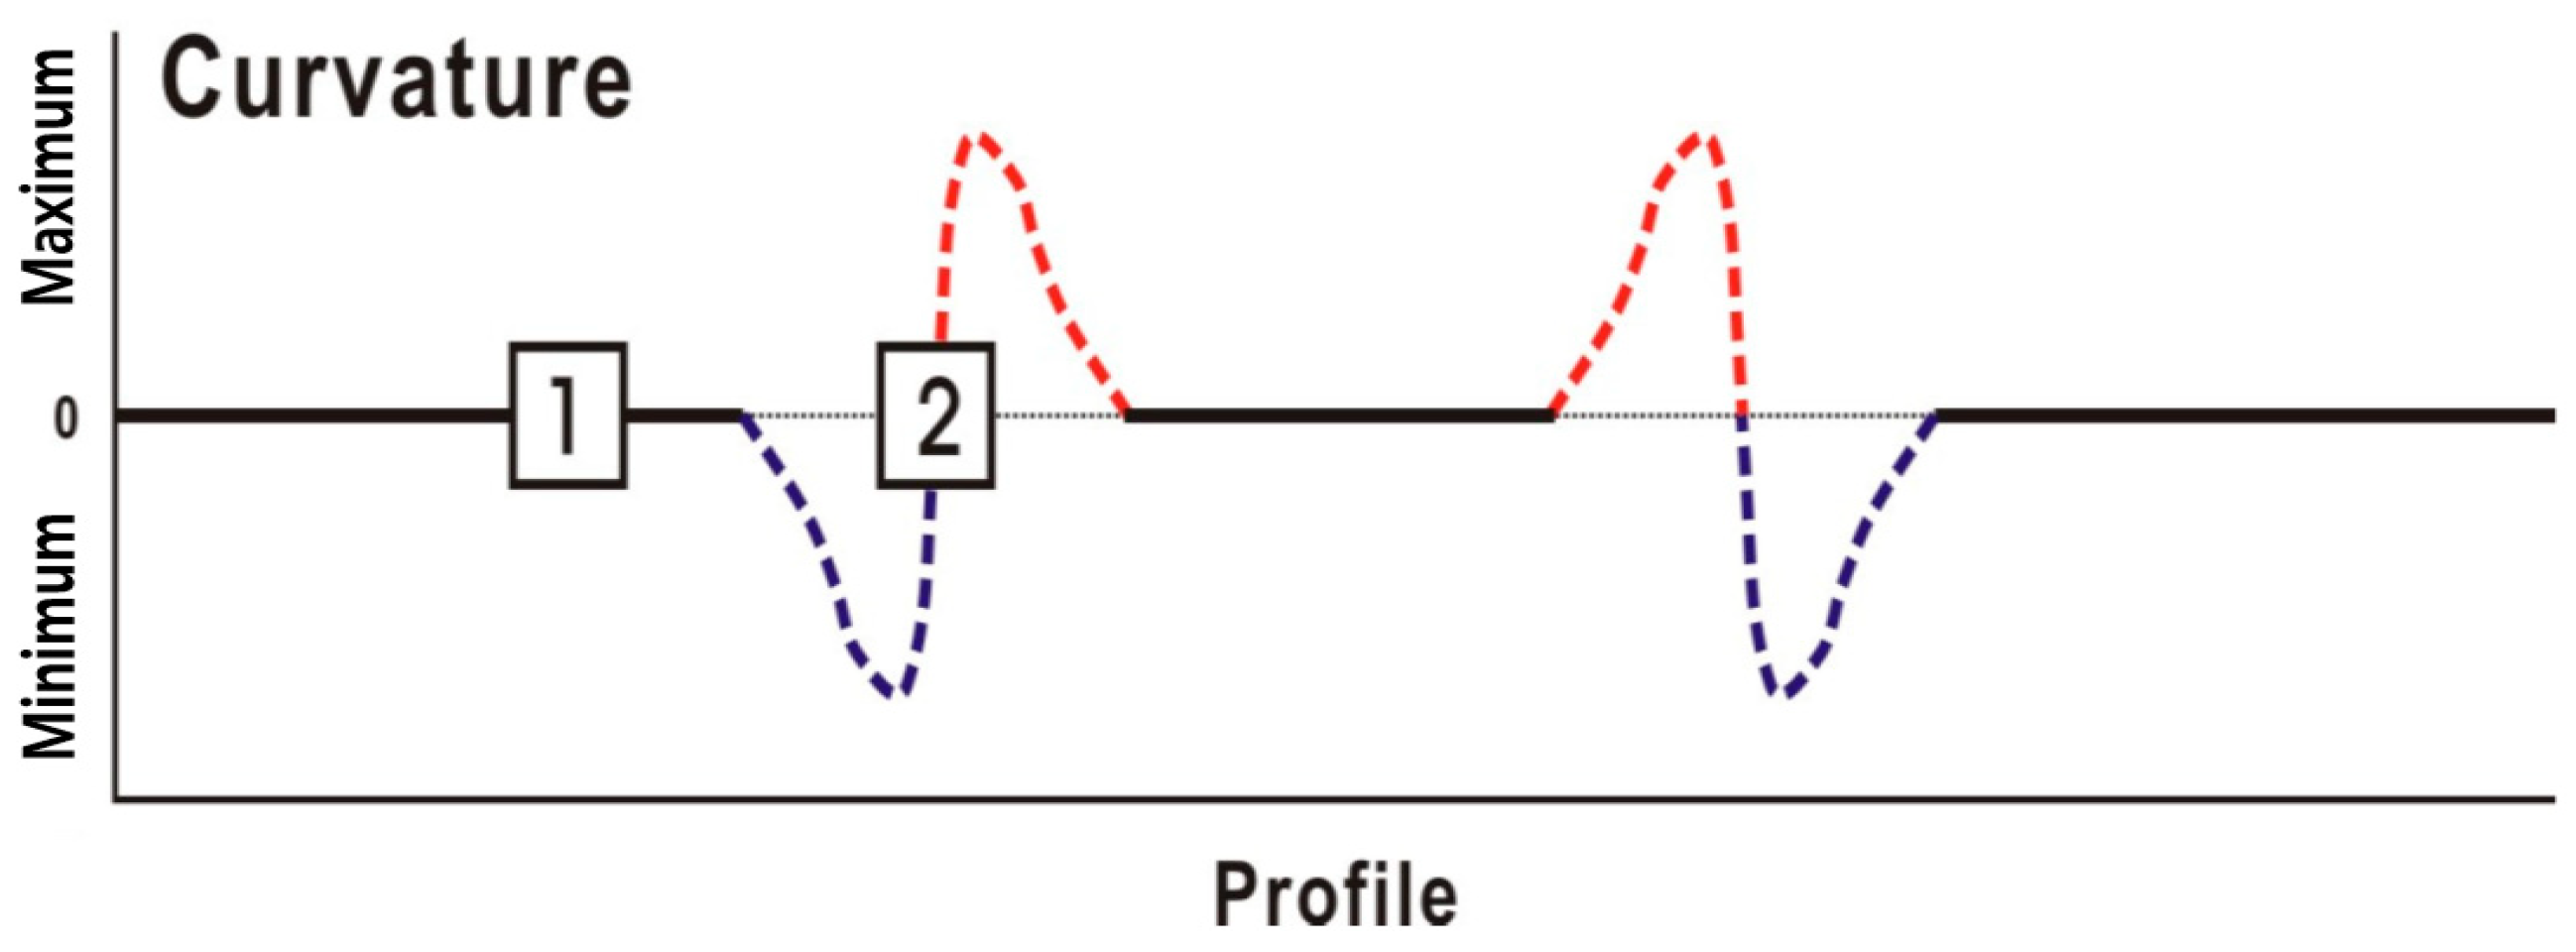
When a surface is flattened, the slope and curvature become uniform, and as they approach horizontal, they converge to a value of 0 (
Figure 1). Theoretically, when the terrain curvature becomes 0 (① in
Figure 1), it can be interpreted as a homogeneous ground condition, and, in cases where there is surface relief, the curvature has either positive or negative values (② in
Figure 1), indicating an inhomogeneous surface with the roughness. By integrating high-resolution digital elevation models from drone remote information with a curvature analysis, this can be applied to evaluate the homogeneity of compacted ground [
4].
Terrain elements are calculated based on grid models, and they effectively express the point source occurrence of the flow due to rainfall and the 2D moisture flow path in the direction of the lower slope; they have been used as input variables in distributed hydrological models. Lee et al. [
19] and Choi et al. [
18,
20] have explained the calculation methods for terrain elements in detail; therefore, they are not included in this paper. Among terrain elements, the curvature, expressed as the inverse of the radius of curvature, can be divided into plan and profile curvatures based on its form. Among these, the plan curvature is the rate of change in the surface following the contour line, expressed as K
c (Equation (2)), and the profile curvature is the rate of change in the slope gradient in the flow line direction, expressed as K
p (Equation (3)). The plan curvature distinguishes between convergent and divergent surface shapes, while the profile curvature has a negative value if the slope increases downhill and a positive value if it decreases. The tangential curvature is expressed as K
t (Equation (4)) and can represent minute curvature by correcting for changes due to small slopes by multiplying the sine value of the slope with the plan curvature [
21].
where Z
xx, Z
yy, Z
xy, and Z
yy are second-order partial derivatives, and p = Z
2x + Z
2y, while q = p + 1. When the slope is constant or the surface is horizontal, the curvature becomes 0; otherwise, curvature indicates the presence of terrain undulation. Based on this concept of flatness, curvature variation in the terrain reflects the heterogeneity of the compacted ground layer.
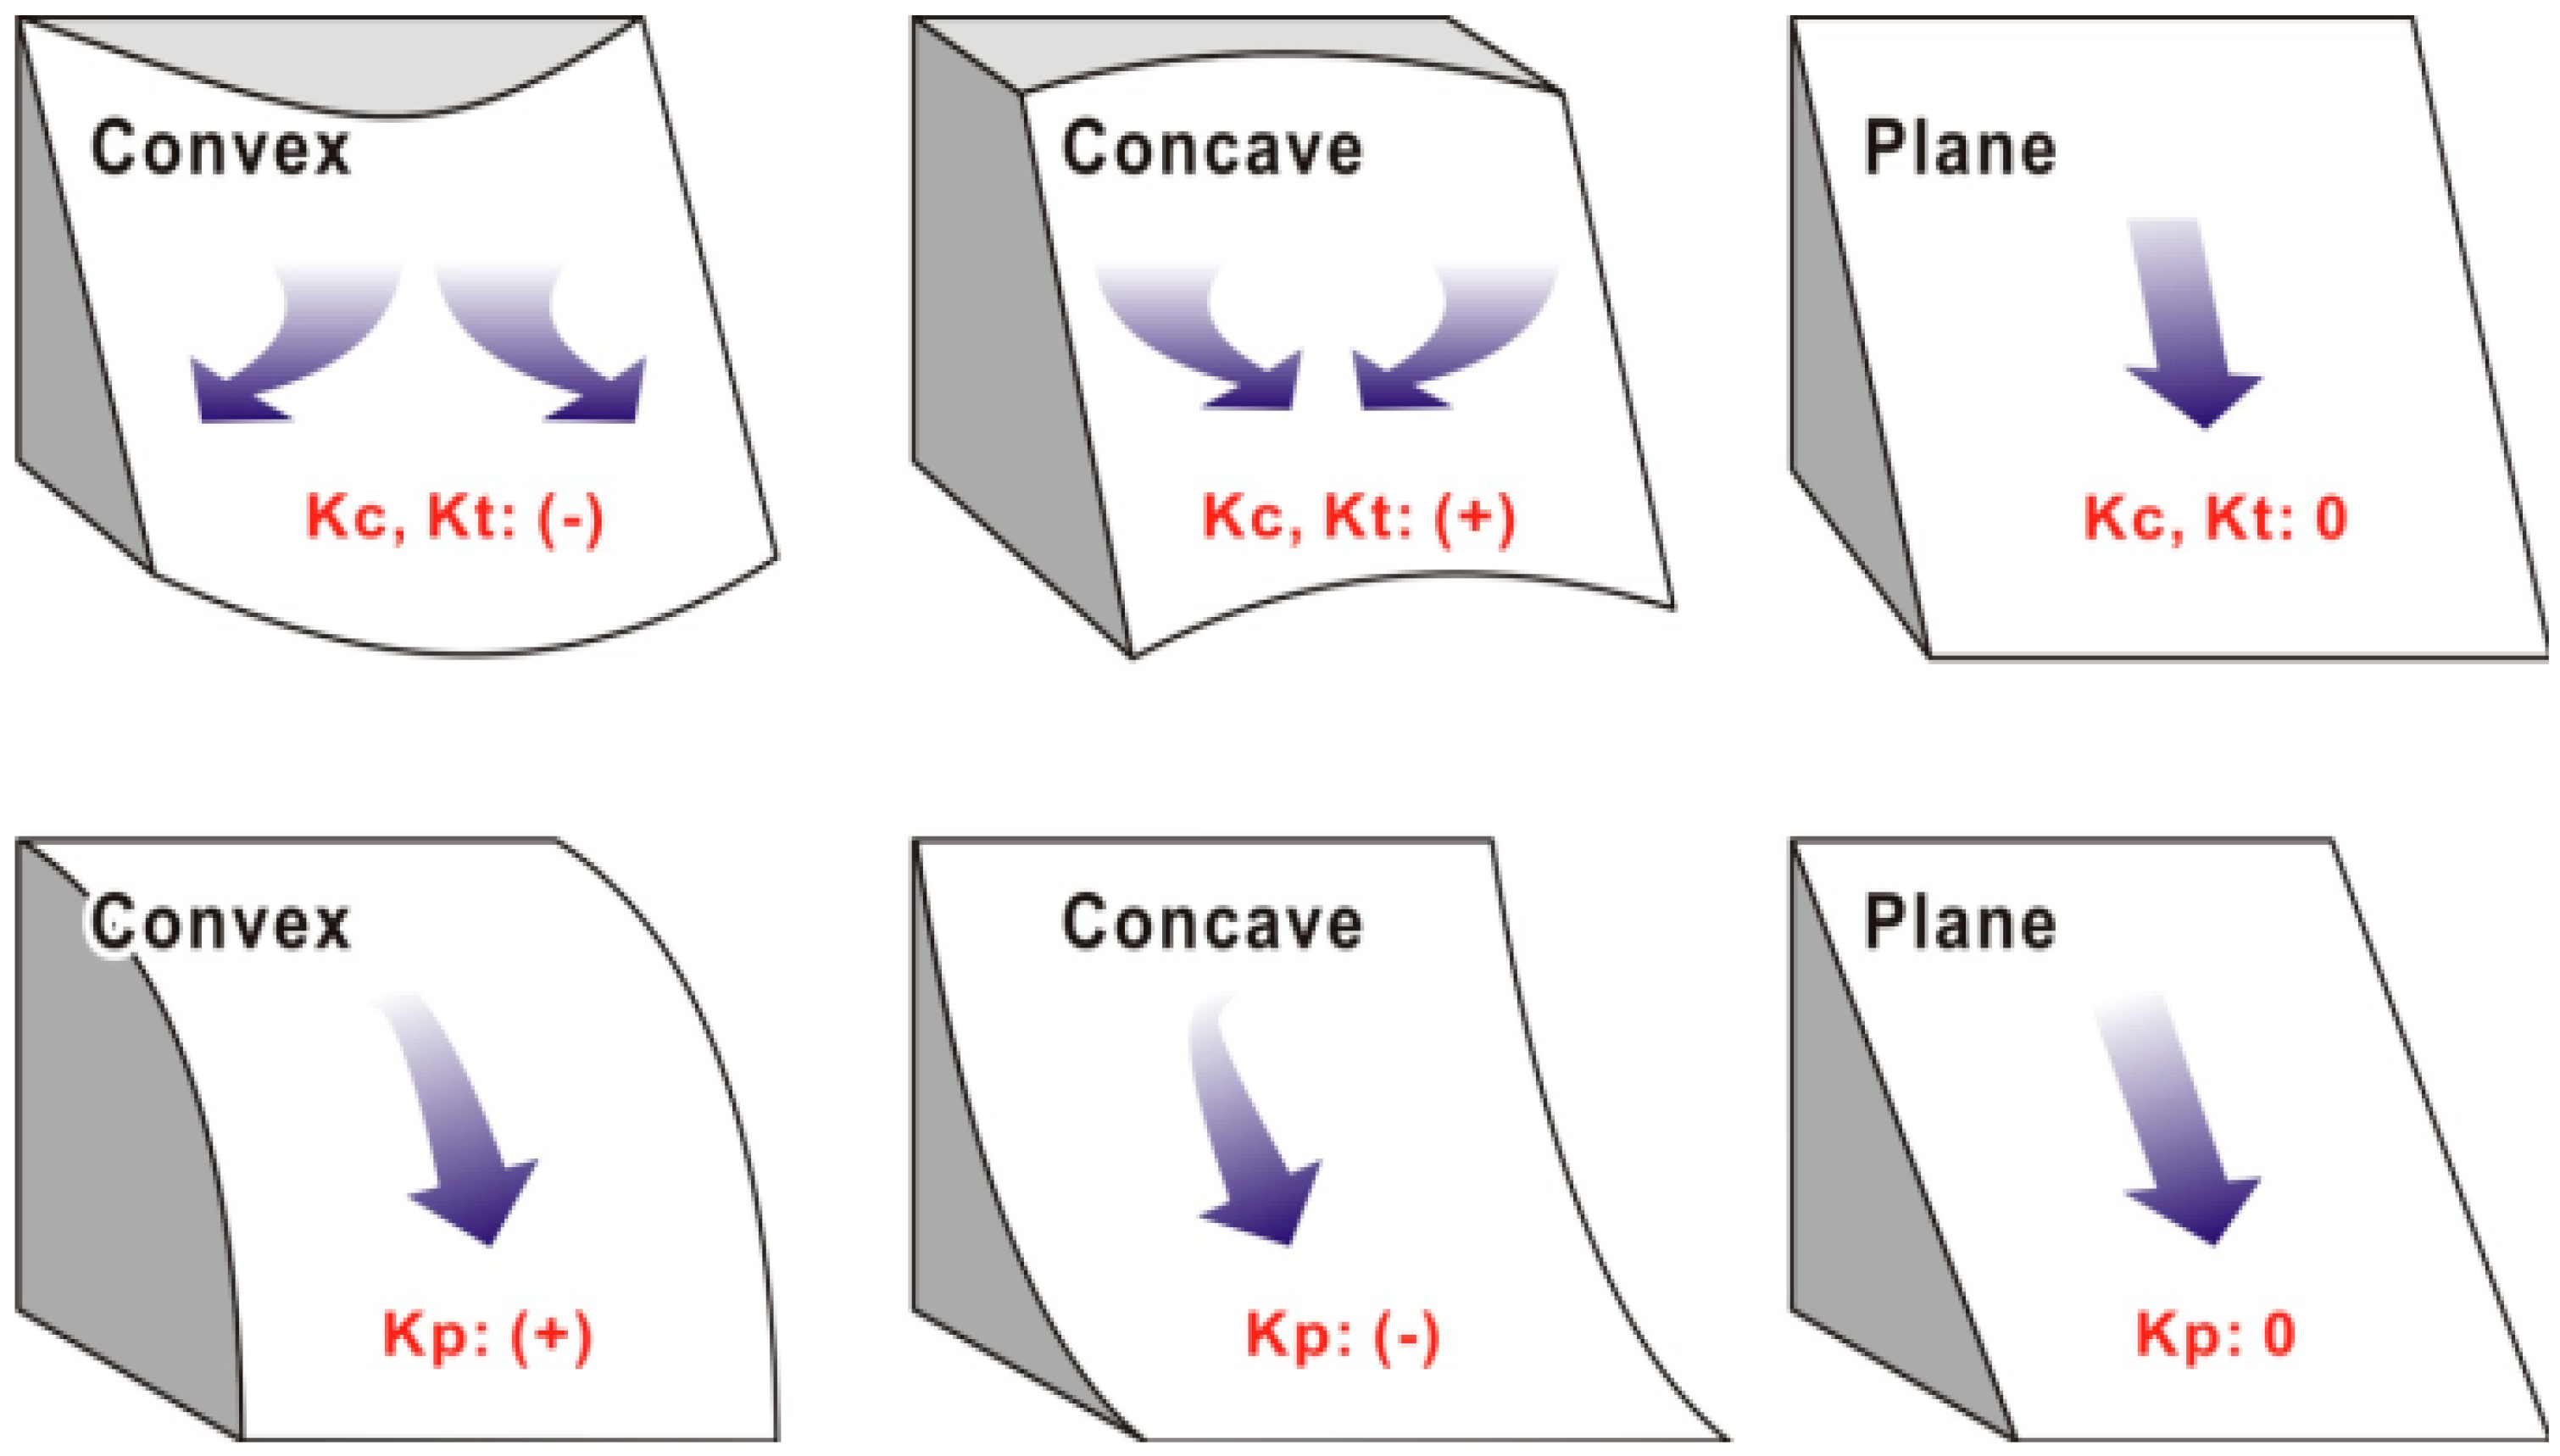
Figure 2 shows a schematic of the surface form in terms of the curvature type and magnitude.
2.2.2. Intelligent Quality Management System
Intelligent compaction is a technology that improves the accuracy and efficiency of compaction work for foundation grounds. In intelligent quality management, an integrated vibration roller system that provides CCC is defined as an IC system [
22,
23]. Verification of the compaction quality during earthwork is important to ensure the required performance (degree of compaction) of the foundation ground. Partial under-compaction or over-compaction, which typically occurs when managing compaction with conventional vibratory rollers, can cause differential settlement of the ground or deterioration in the foundation performance. This is because it is difficult for roller operators to understand compaction areas and the degree of ground compaction in real-time during compaction work, making uniform compaction challenging. To overcome this, nondestructive and penetration test methods that allow for rapid compaction evaluation (soil stiffness gauge, dynamic cone penetrometer, lightweight deflectometer, nuclear density gauge, etc.) are sometimes used to quickly assess the physical and mechanical properties of the ground. However, even with nondestructive rapid testing, spot testing methods have limitations in terms of the number of tests (approximately 1% of the total area), making it difficult to provide quality test results in sufficient quantities to represent the compaction state of the entire site [
24].
The concept of intelligent compaction was coined in Europe in the 1970s [
25,
26]. Initially, it started as a concept relating the compaction layer stiffness to the vibration frequency, and the compaction meter value (CMV) was proposed. The first research on roller-based acceleration measurement was conducted in 1974 when the Swedish Highway Administration used Dynapac’s vibratory roller equipped with accelerometers. In 1975, Sweden’s Geodynamik was established, and the CMV for evaluating compaction was developed and introduced in 1978. In 1980, Sweden’s Dynapac began commercially providing CMV-based compaction meters, after which OEMs, such as Switzerland’s Ammann and USA’s Caterpillar, also began providing CMV-based IC rollers. Germany’s Bomag developed Evib in the late 1990s to measure dynamic ground stiffness. In 1999, Ammann introduced ks, which considers a lumped parameter two-degree-of-freedom spring-mass-dashpot system for soil compaction measurements. These two parameters (Evib and ks) help characterize the ground performance, unlike the existing acceleration-based characteristic CMV. In 2003, Caterpillar introduced machine drive power (MDP) based on the rotational resistance, and in 2004, Japan’s Sakai developed and applied the compaction control value (CCV) based on the CMV using the harmonic components of vibration to evaluate the compaction state for the IC rollers [
24]. Recently, the intelligent compaction measurement value (ICMV) has been used as a common expression for various parameters of IC rollers as the IC measurement value.
To utilize the ICMV, it includes GNSS antennas and receivers, vibration sensors (accelerometers), connection cables, and monitoring displays [
27]. The IC mounting kit provides mapping (pass count and ICMV), real-time information (roller speed, location, amplitude, and frequency), and real-time reports (compaction performance, ICMV data, and location data), enabling it to perform the same as the OEM IC rollers.
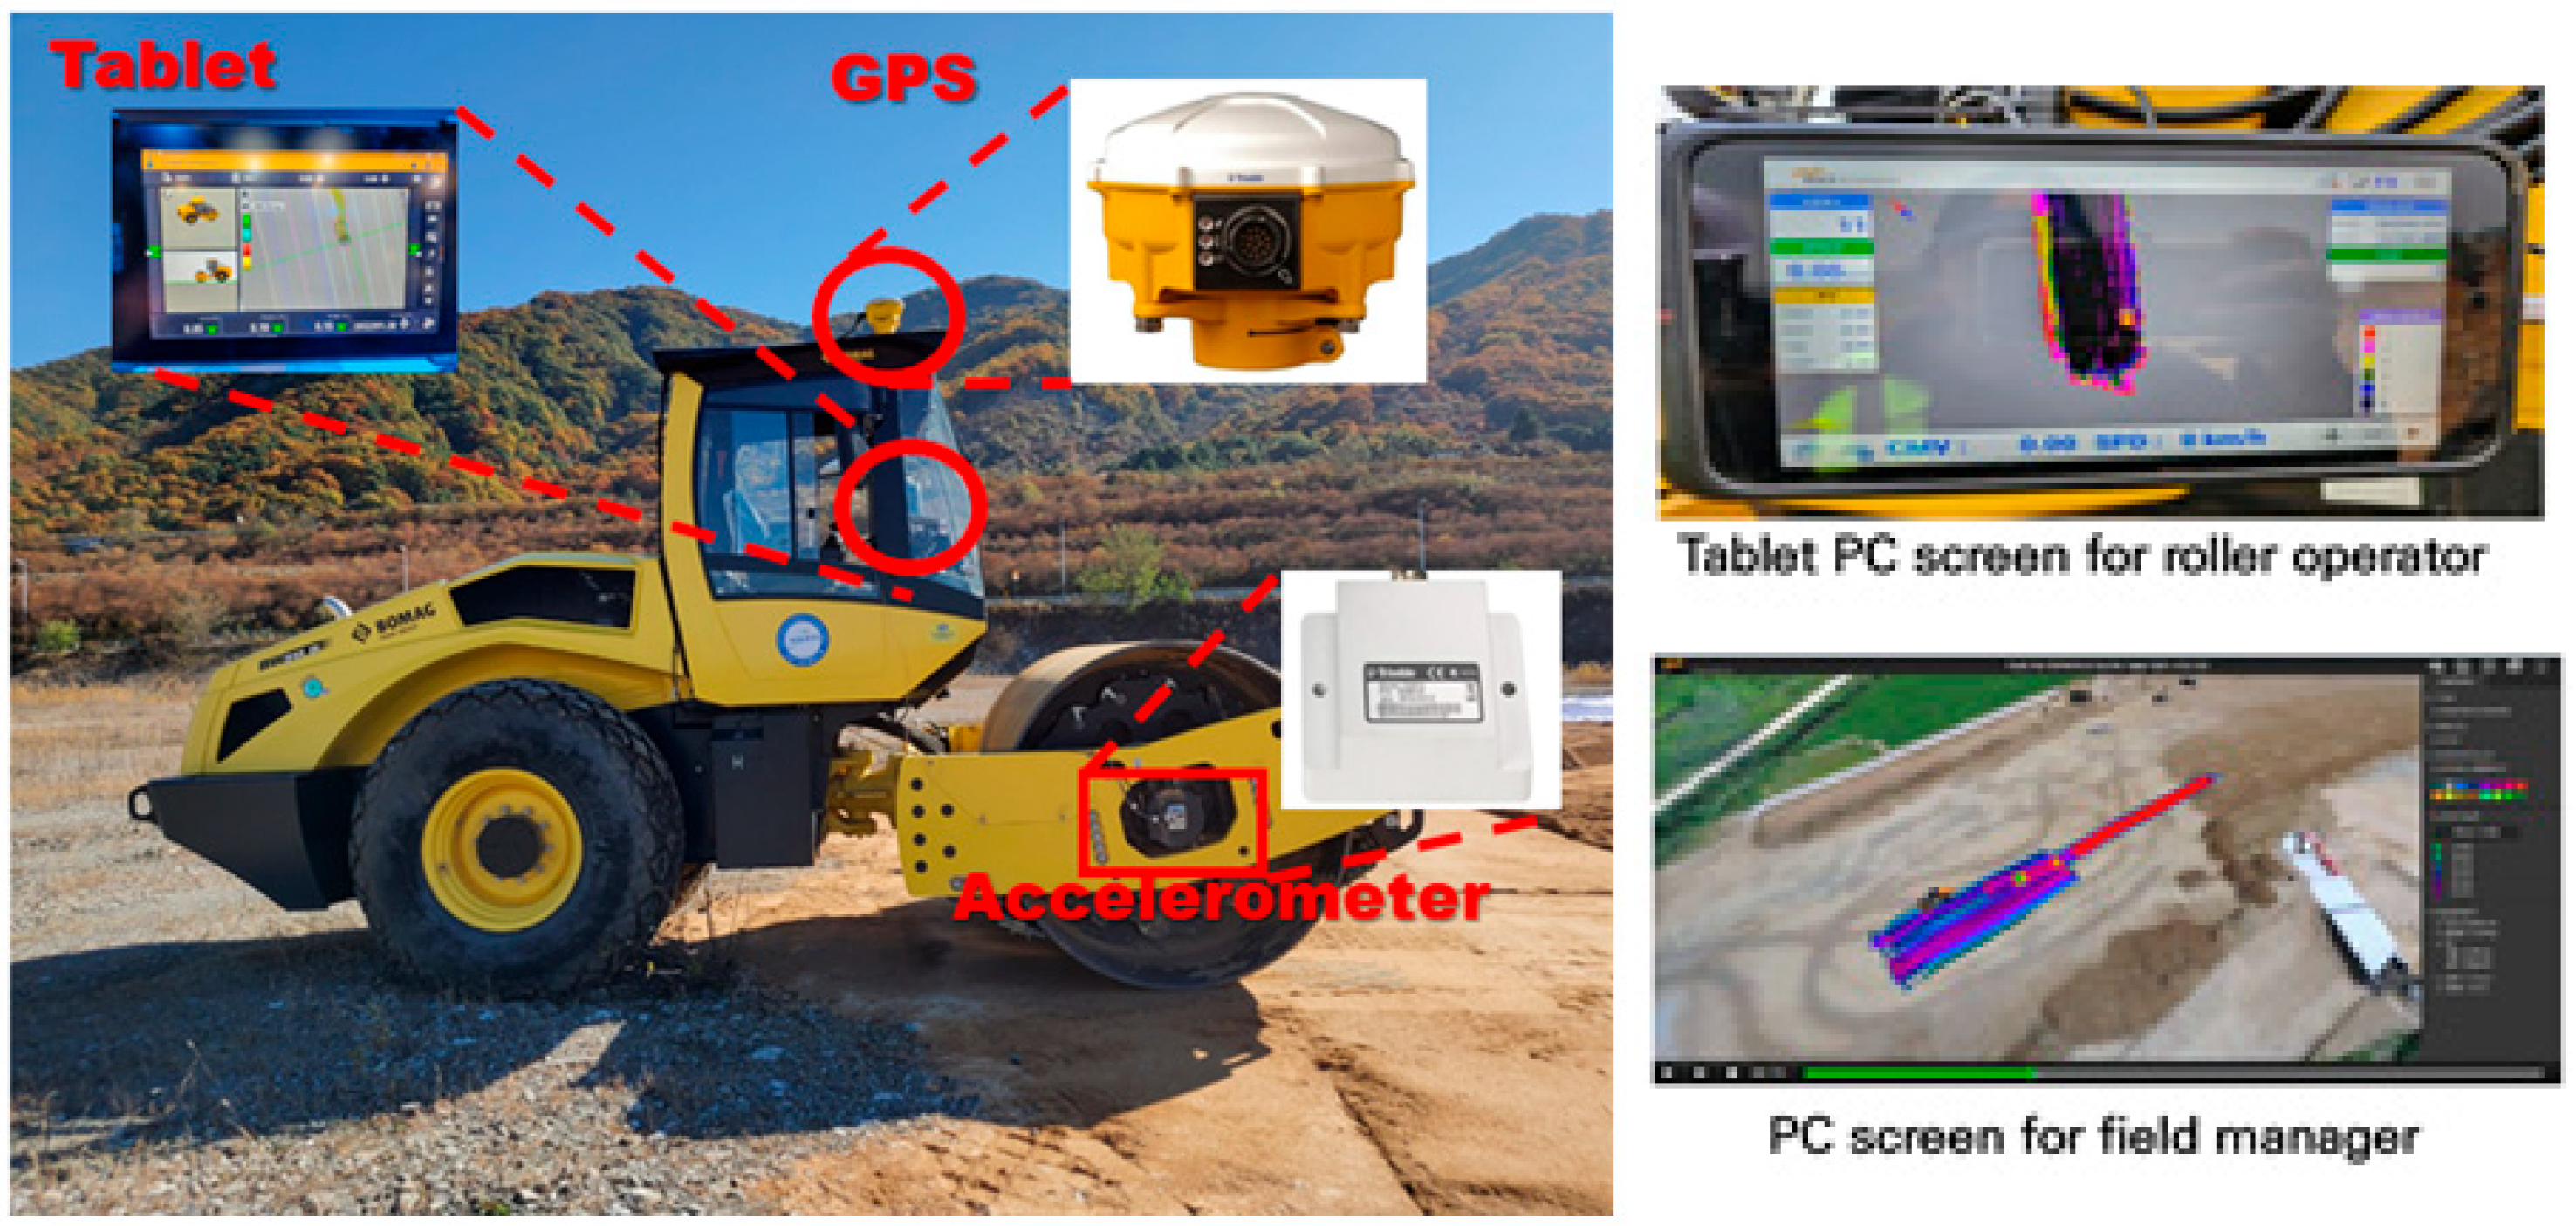
Figure 3 shows the IC roller utilized in this study, which is a conventional compaction roller equipped with accelerometers, GPS sensors, and a tablet that can continuously evaluate the degree of compaction, acquire data in real-time, and visualize them. This system can be used to manage the number of compactions and the quality of the entire compaction area.
Continuous compaction evaluation methods provide the CMV, which is calculated by analyzing the measured acceleration during vibratory roller operation based on the time history, as the ratio of the first harmonic amplitude to the fundamental frequency component amplitude. In the previous literature, the CMV has been expressed as in Equation (5) [
25,
26,
28].
where C is a constant (related to ground conditions; a value of 300 is typically used). A
0 is the acceleration amplitude of the fundamental frequency component, and A
1 is the acceleration amplitude of the first harmonic component. In this study, we set C = 300, following common practice. The position data and intelligent compaction values are time-synchronized and recorded at a rate of one measurement per second. The CMV value is a relative index, and the reference CMV is determined through trial compaction by correlating it with the plate load test (PLT) results. The intelligent compaction system used in this study incorporates a Trimble tri-axial accelerometer and a Trimble MS992 dual-frequency GNSS receiver. The accelerometer has a measurement range of ± 30 g and a resolution of 0.01 g. Its accuracy is typically within ± 0.2 g, and its precision is better than ± 0.1 g under stable conditions. The MS992 GNSS (Trimble Inc., Sunnyvale, CA, USA) receiver provides RTK-based horizontal positioning accuracy of ± 8 mm + 1 ppm and vertical accuracy of ± 15 mm + 1 ppm, making it suitable for high-precision geolocation tasks during compaction.
2.2.3. Test Site Construction
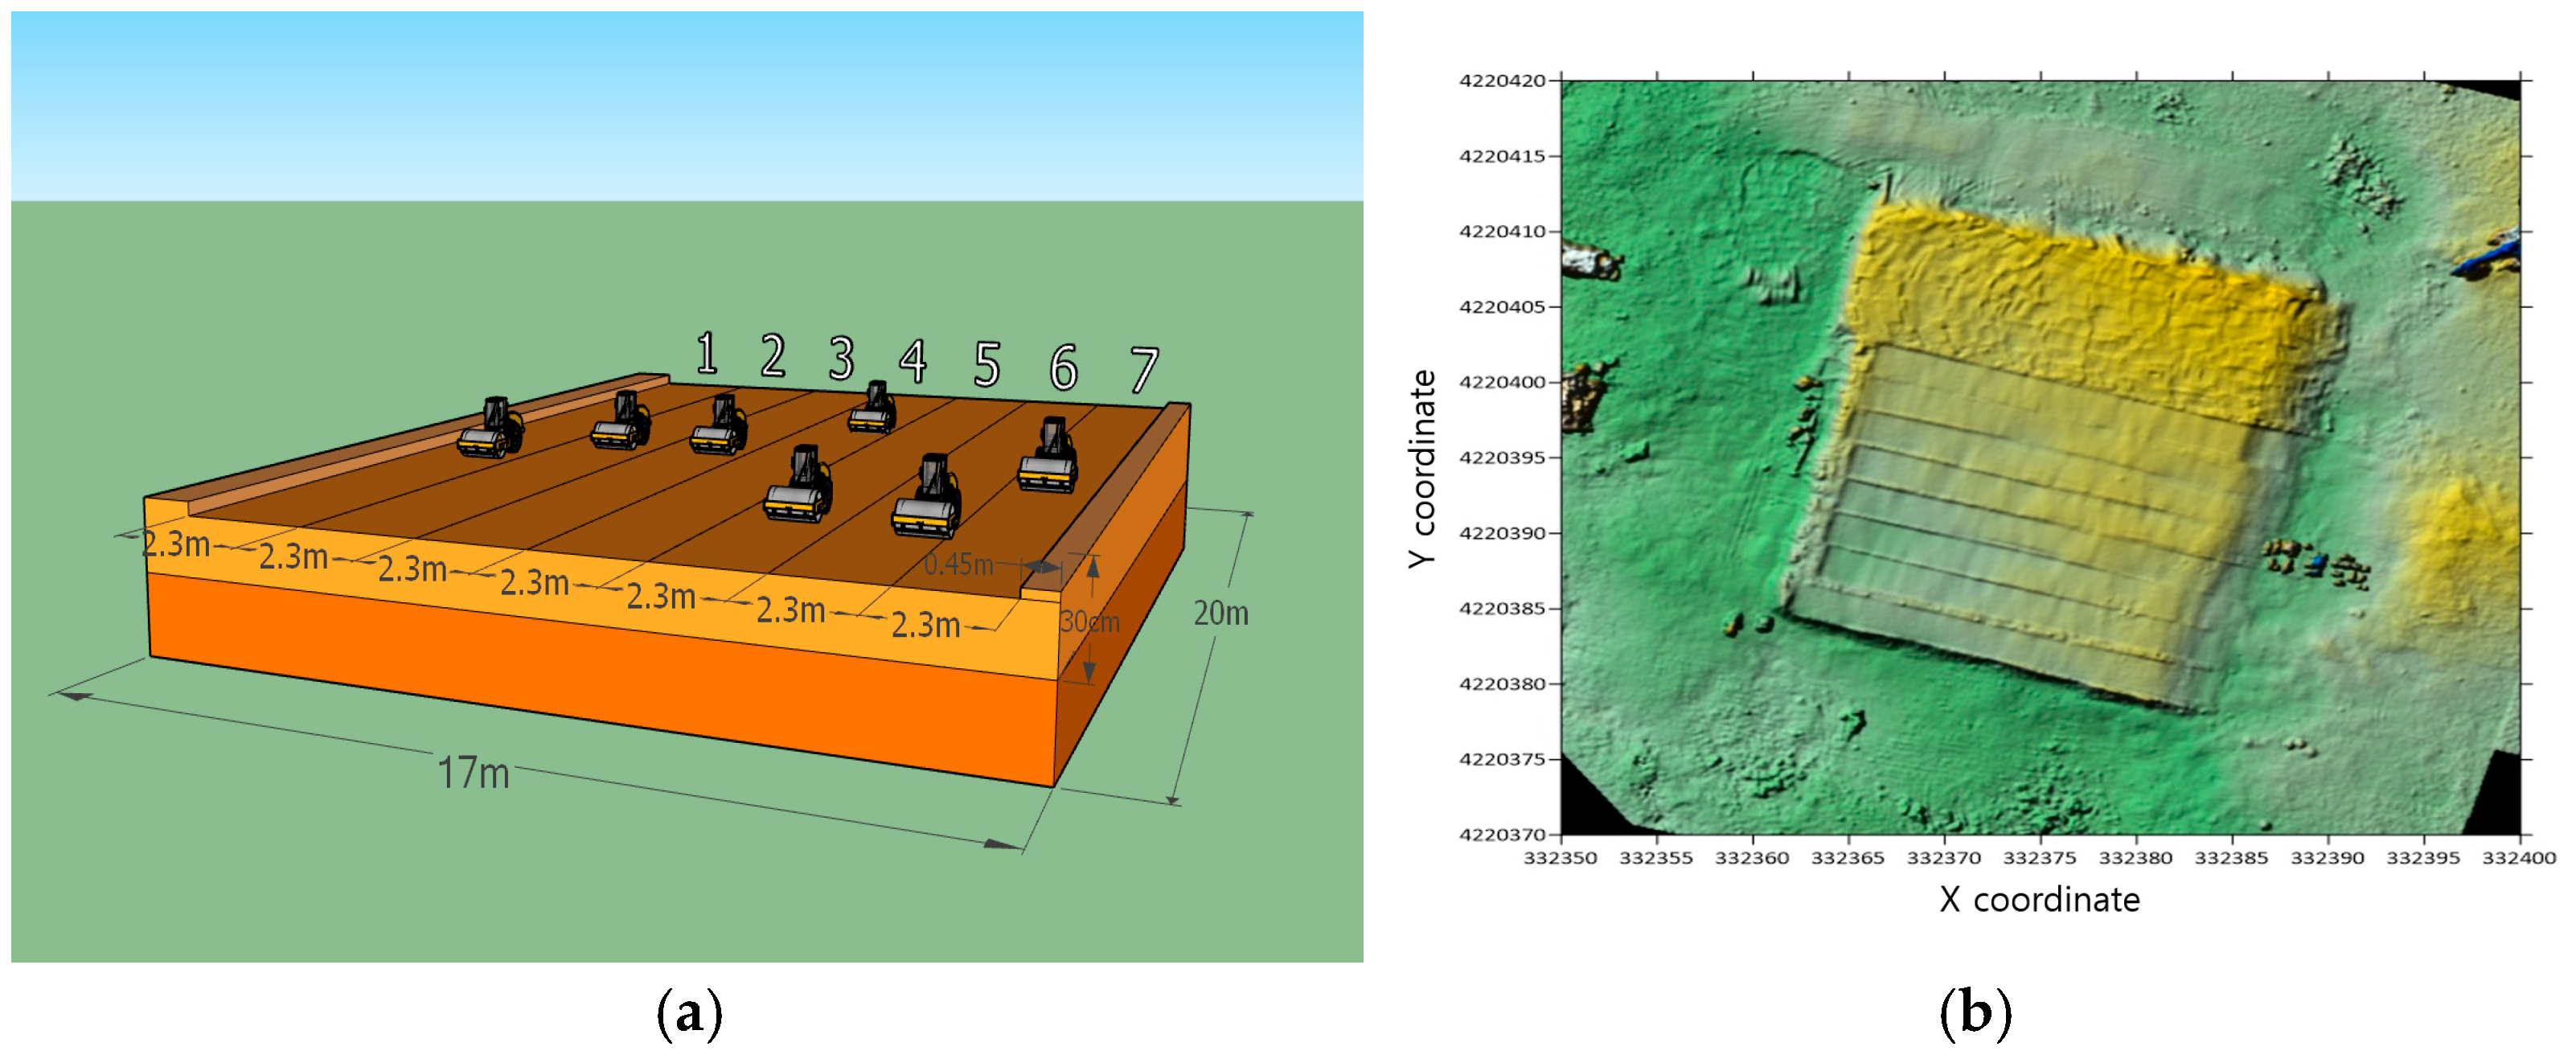
A full-scale field site was constructed to evaluate the applicability of the intelligent quality management system. The test was conducted at the planned site of the “Road Infrastructure National Performance Test Field” construction project within the Yeoncheon SOC Demonstration Research Center of the Korea Institute of Civil Engineering and Building Technology. For the test method, a round-trip compaction was calculated as 1 pass, and a total of 7 passes (14 one-way trips) of compaction were implemented. The compaction section comprised a total of seven lanes (approximately 17 m) and was constructed with a length of approximately 20 m.
Figure 4 shows the schematic of the test site and the actual field view.
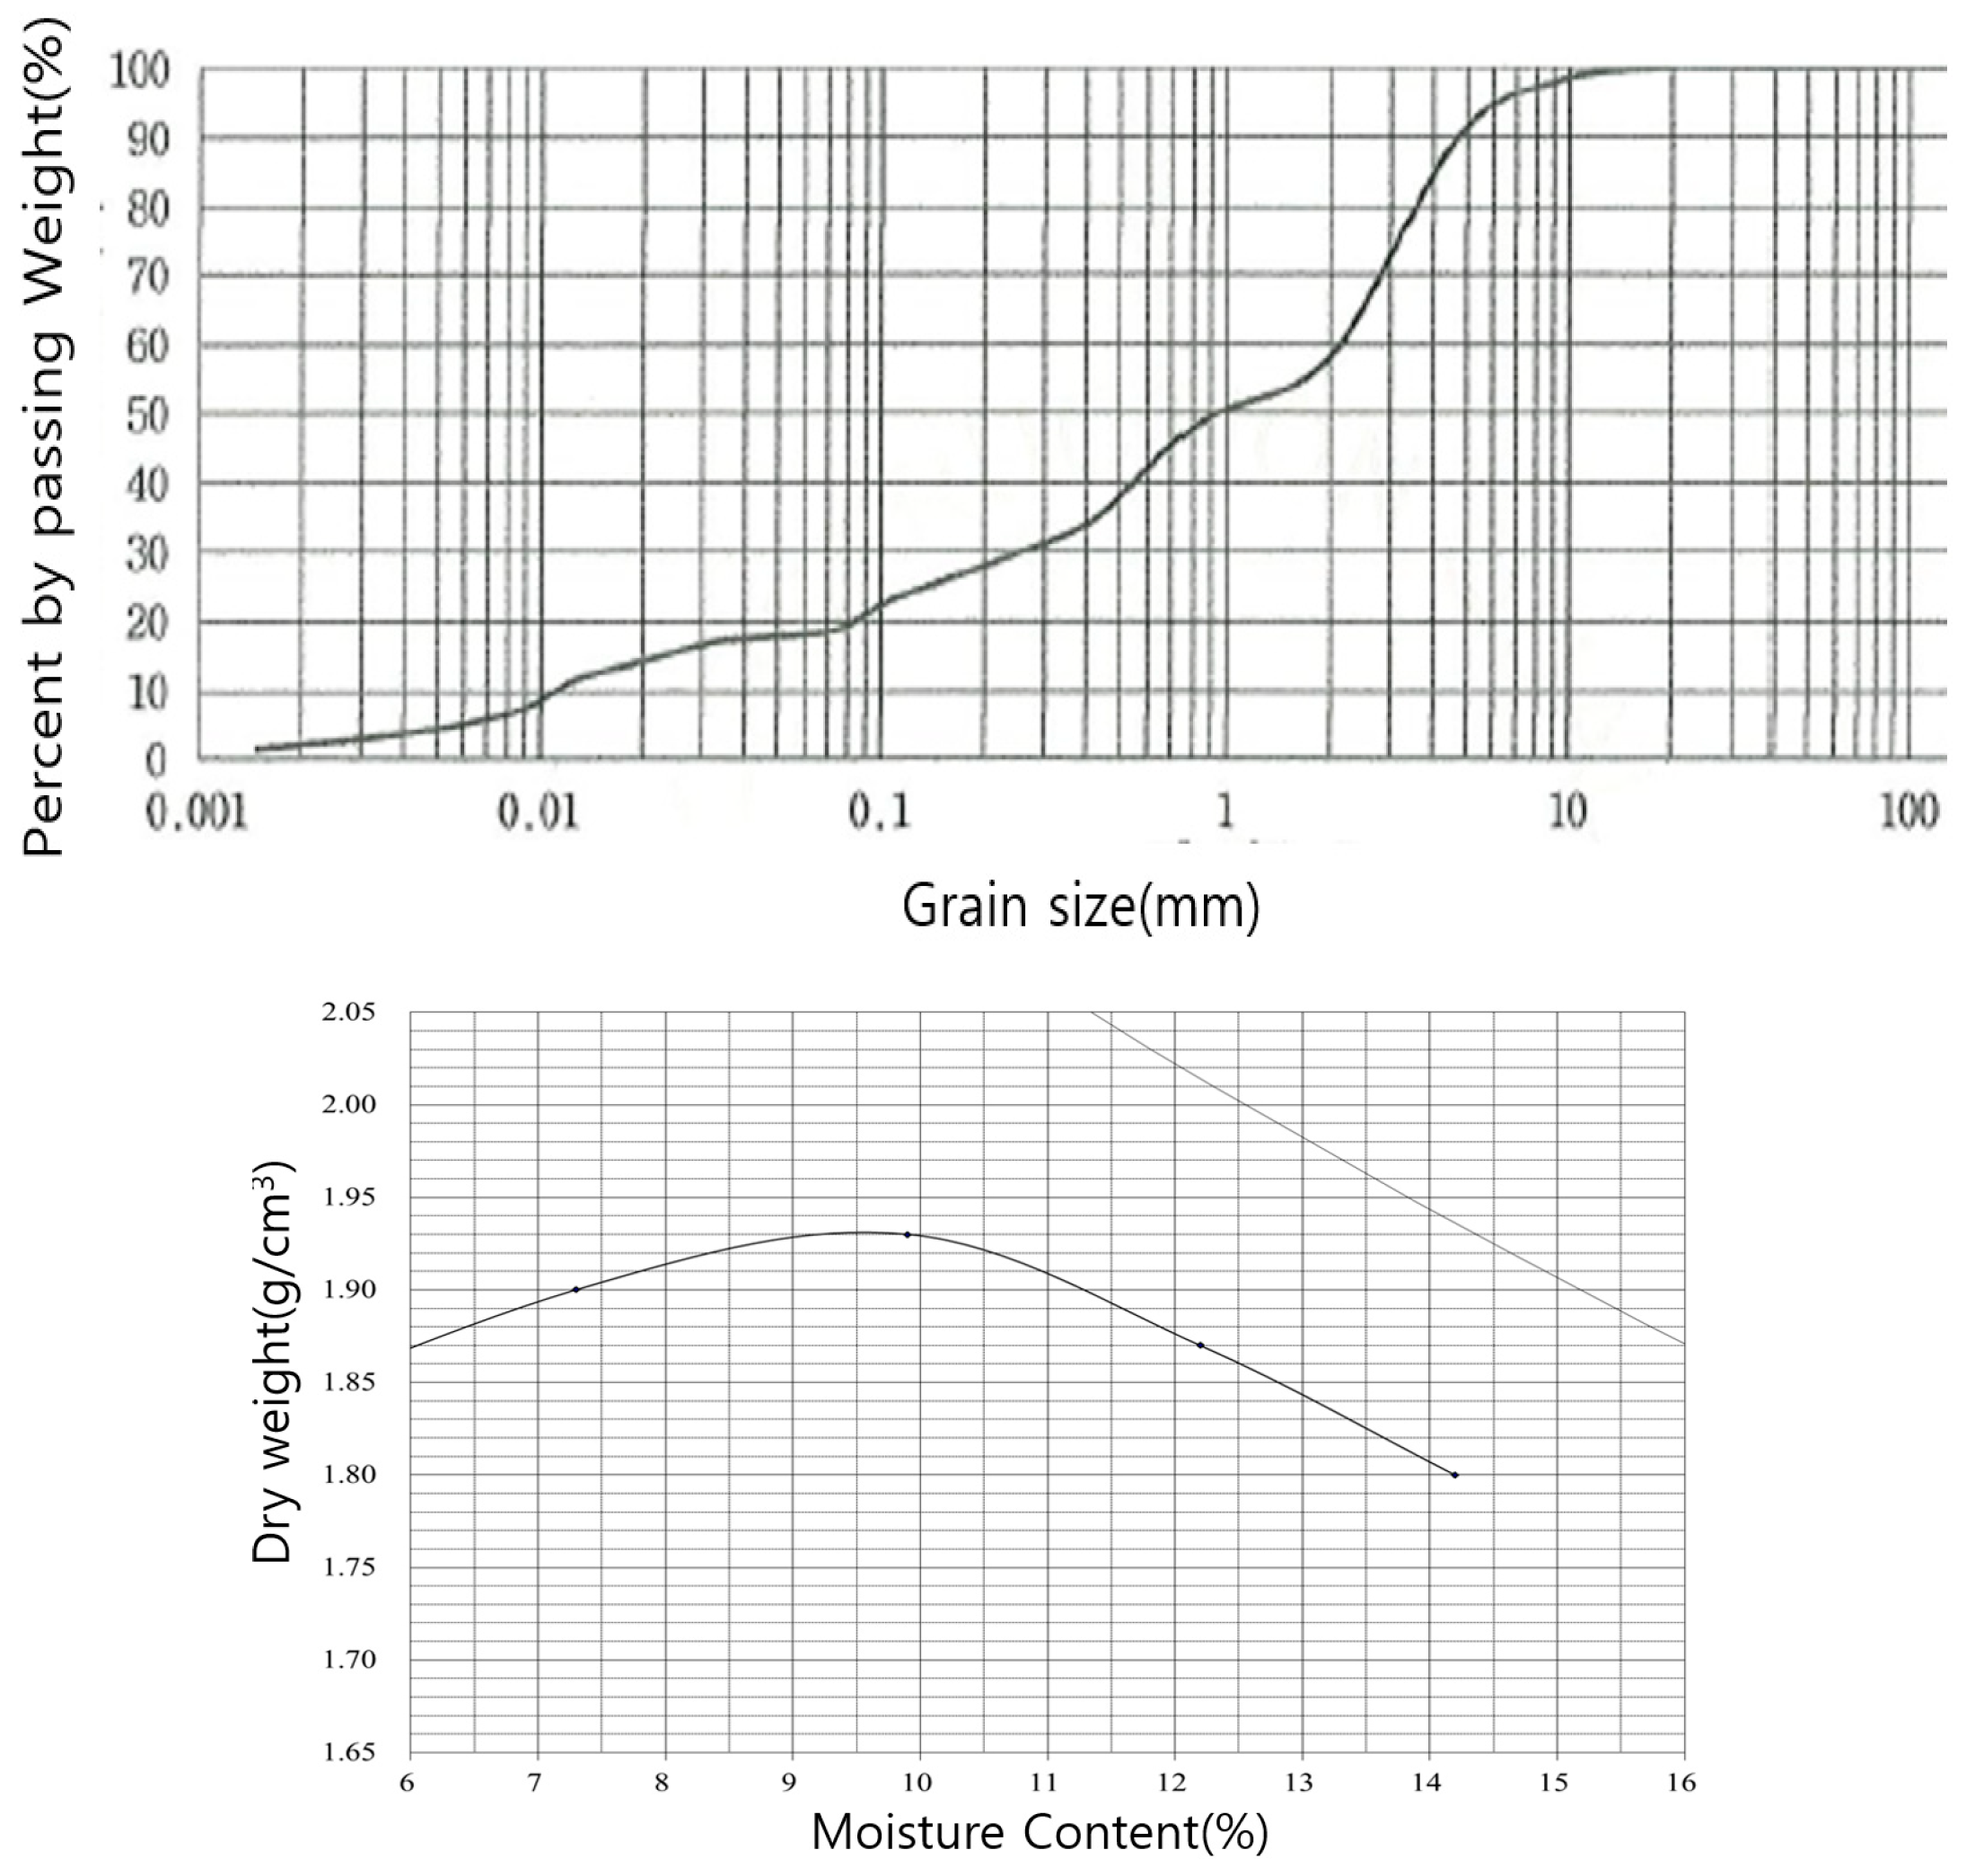
Table 1 presents the results of the gradation test of the embankment material obtained from laboratory tests. From the soil compaction test (KS F 2312, 2016) (D compaction test), the maximum dry density was 1.928 t/m
3 and the optimum moisture content was 9.9%, which satisfy the quality standards for subgrade soil filling materials.
Figure 5 illustrates the geotechnical characteristics of the soil samples used in the field tests, including the grain size distribution curve (top) and the moisture–dry density relationship curve (bottom).
3. Results
3.1. Flatness Analysis
3.1.1. Flatness Evaluation Results Using UAV-Based Elevation Data
Flatness evaluation using a profile meter (KS F 2373:2010) measures the distance between the sensor of the measurement device and the surface, and then determines the upper and lower connecting lines within a certain range from the mean or median of the observed data; therefore, it is unaffected by the slope and elevation of the surface. In contrast, the elevation data of the surface acquired from remote images mostly have a slope and elevation difference with respect to the distance. Therefore, to apply the existing flatness index evaluation method to remote images, it is necessary to correct the slope and elevation difference of the surface to consider only the effect of roughness.
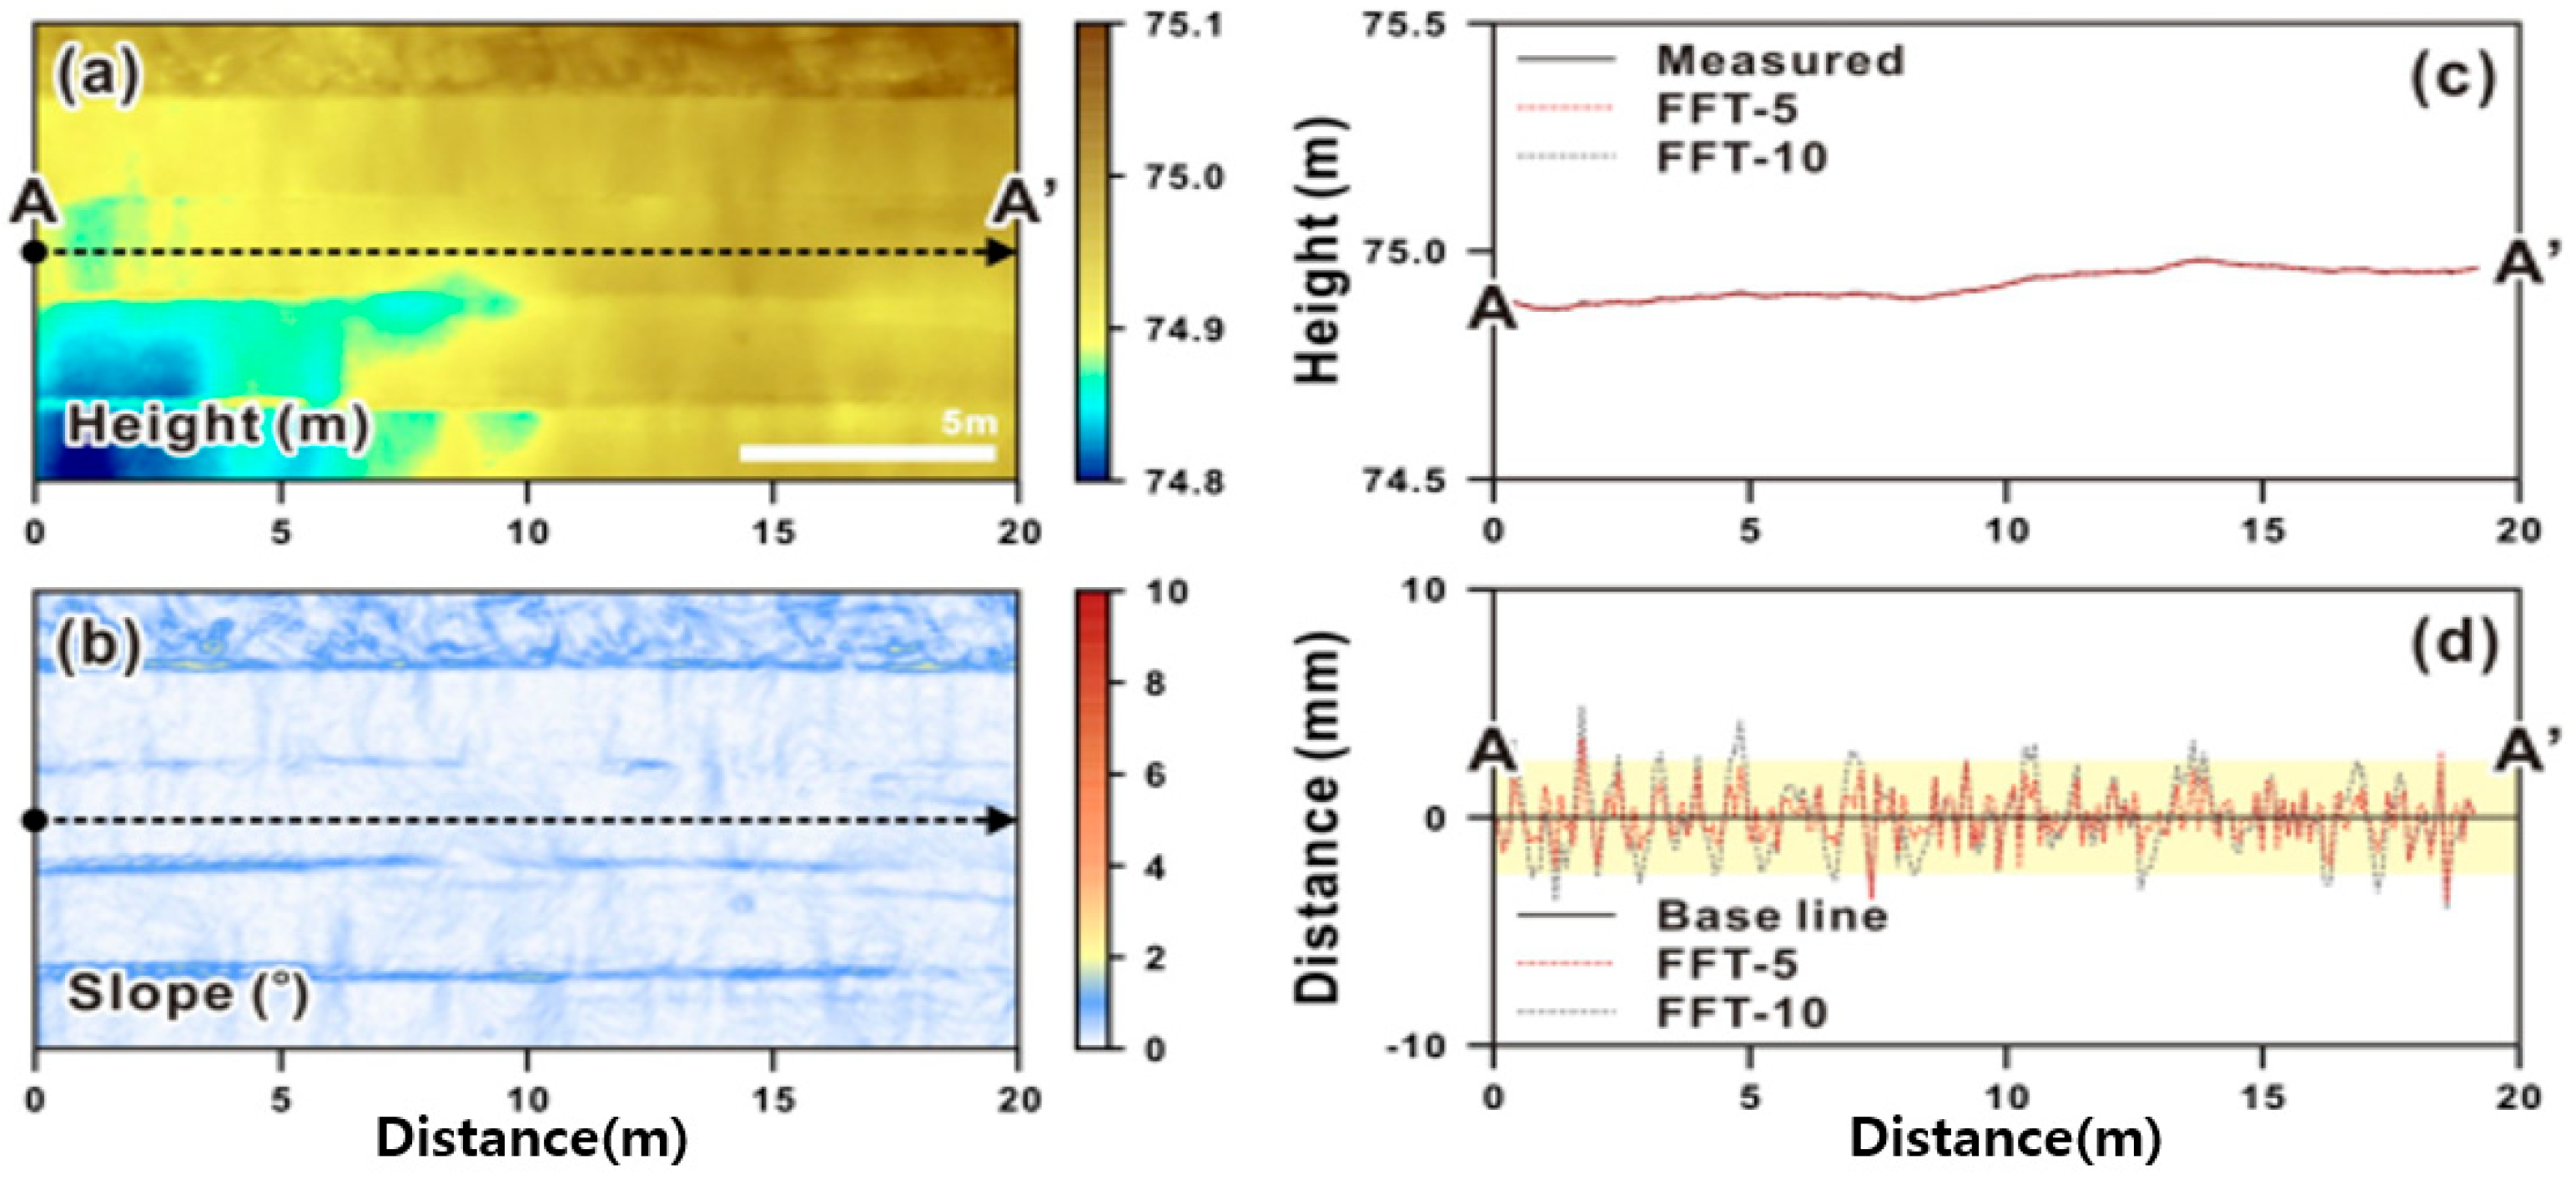
In this study, a 2D elevation profile at an interval of 3 mm was created using a high-precision DEM acquired from remote images. Subsequently, to set a reference line for the surface roughness, the fast Fourier transform (FFT) algorithm was applied to the elevation data measured at regular intervals to calculate the elevation by domain, which was used as a correction filter. By extracting the difference between the elevation measured from the drone image and that calculated through FFT, we could remove the effect of elevation, leaving only the effect of surface roughness. FFT is a method for confirming the intensity of specific frequencies through a frequency spectrum analysis of the obtained signals; domains without roughness have the same elevation in the remote images and FFT results, resulting in a difference of 0. Therefore, by setting the surface with a correction value of 0 using the FFT as the reference line, upper and lower connecting lines were created from the roughness waveform, and the frequency and distance of the roughness were quantitatively calculated. Field condition test facilities were established in the SOC Performance Research Center located in Yeoncheon to evaluate the shape and homogeneity of the surface flattened by soil compaction, and a stage-by-stage evaluation of the compaction was performed [
4]. The rectangular flattened surface using a roller showed an elevation range of 74.79–74.99 m above sea level, with an elevation difference of approximately 20 cm. A section line (A-A’) for the flatness analysis was set along the central part of the rectangular area, and the elevation difference on the section showed a distribution of 10 cm, with a slope of less than 0.5° (
Figure 6a,b).
Figure 6c shows the elevation of the remote image and the elevation by domain obtained from FFT, where FFT-5 and FFT-10 represented changes according to the domain size.
Figure 6d shows the difference between the elevation measured from the remote images and the results of FFT-5 and FFT-10, where FFT-5 showed changes from (+) 3.0 mm to (−) 3.5 mm from the reference line, and FFT-10 showed changes from (+) 4.7 mm to (−) 3.8 mm. The flatness index (PrI) calculated using Equation (1) for FFT-5 was 105.6 mm/km, and the flatness index for FFT-10 was 446.8 mm/km. Considering that the surface in the flattening process was mostly composed of media with continuity and that the surface roughness mostly showed local changes, it was believed that the flatness of FFT-5 and FFT-10 would show similar values. However, when evaluating the flatness through FFT, setting an optimal size for the domain became important.
3.1.2. Curvature-Based Surface Flatness Analysis
The terrain curvature is a concept that numerically expresses the shape and degree of the roughness on a surface. It is expressed as the plan curvature (K
c) or tangential curvature (K
t) on a plane, representing the degree to which the surface is horizontally curved. Under this condition, a positive (+) curvature indicates the degree of convexity, while a negative (−) curvature represents a concave surface. The profile curvature is expressed as the profile curvature (K
p) and represents the vertical shape of the roughness; similar to the plan curvature, a positive (+) curvature indicates the degree of convexity, while a negative (−) curvature represents a concave surface (refer to
Figure 2). The curvature, expressed as a numerical value, can be effectively used for surface flatness analysis as it is affected by the shape and size of the roughness, unlike elevation and slope. Additionally, from the planar distribution of the curvature, independent roughness and roughness with directionality can be distinguished.
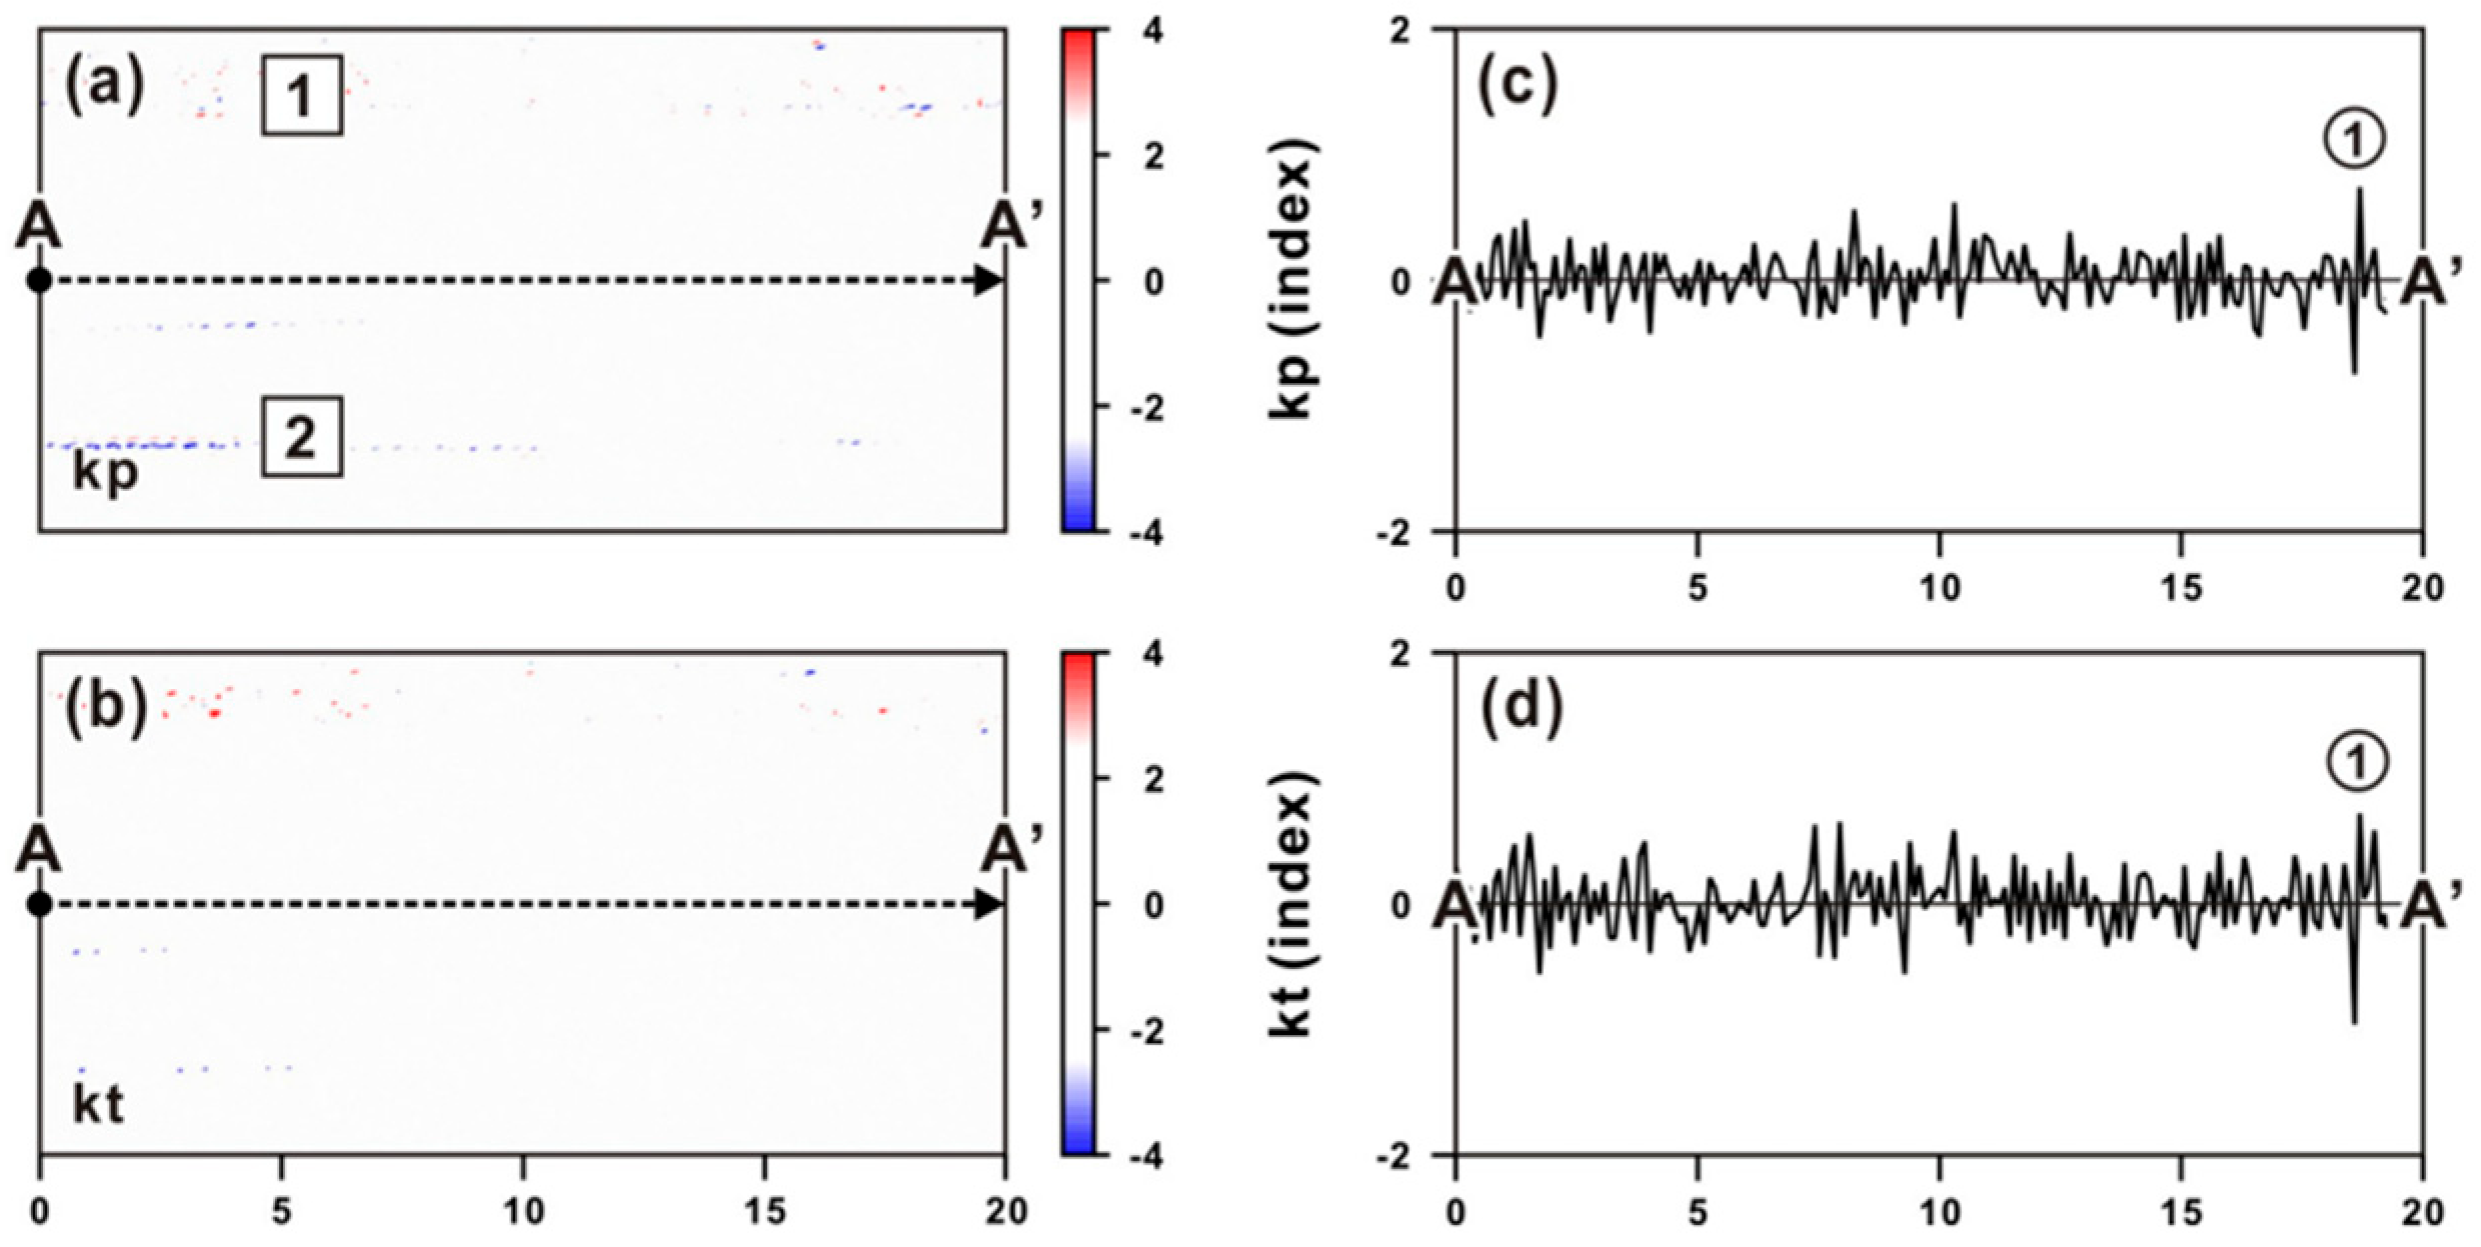
Figure 7 shows the curvature distribution of the surface of the test bed located in Yeoncheon SOC Performance Research Center, where the tangential and profile curvatures mostly showed values within (±) 0.5. Considering that the slope of the surface was almost constant at 0.5° or less (
Figure 7b) and generally showed index values close to 0, the flatness can be evaluated as good. In the curvature distribution of the surface, the independent roughness had a circular boundary distinguishable from the surroundings, while the roughness showing a linear distribution in a specific direction can be interpreted as a nonhomogeneous compaction or stratum deformation.
3.2. Quality Inspection Results
3.2.1. Plate Load Test (PLT)
Due to PLT limitations, it is practically difficult to test every area and every compaction pass. Therefore, at this test site, PLTs were performed in one lane during the 2nd, 4th, and 6th passes (one-way 4, 8, and 12 passes) of compaction. The test results were obtained based on the asphalt pavement 2.5 mm (subgrade) standard.
Table 2 presents the results.
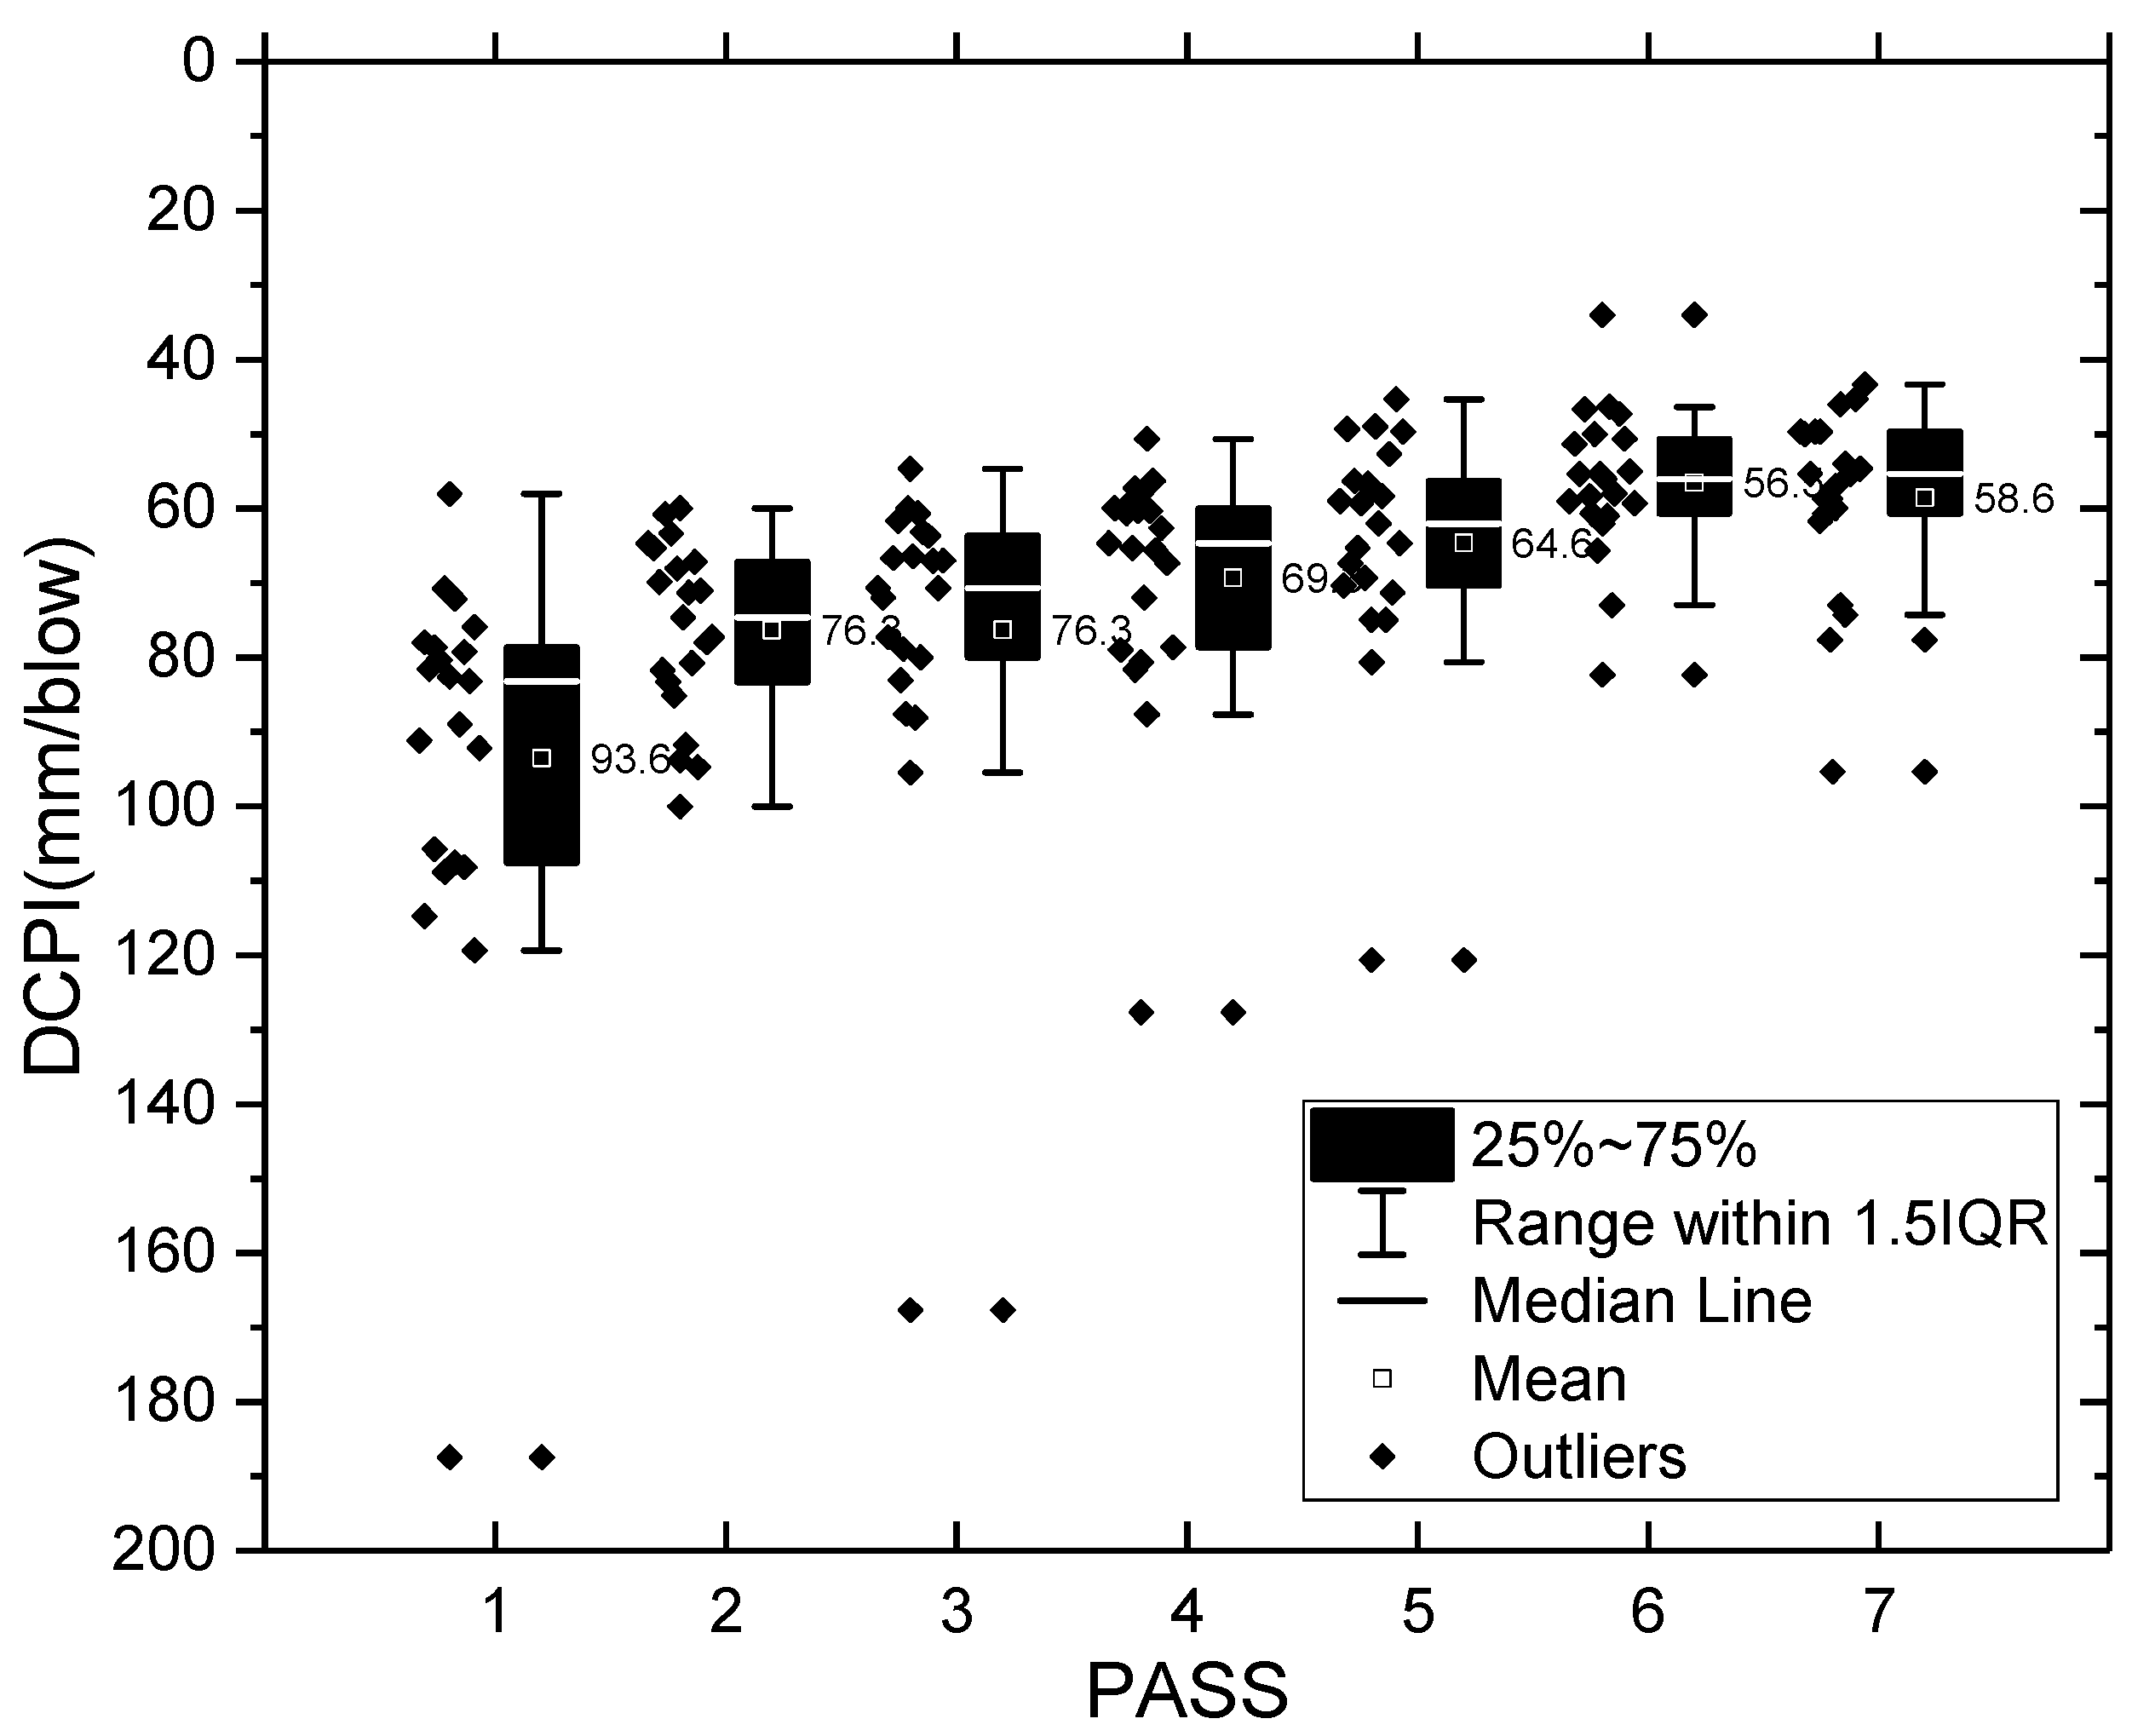
3.2.2. Dynamic Cone Penetrometer Test (DCPT)
Dynamic cone penetration tests (DCPTs) were performed in all lanes, and data were acquired for all compaction passes. With an increase in the number of passes, the DCPI value showed a decreasing trend. Data from each lane were grouped according to the number of compaction passes. Moreover, a box plot was drawn, as shown in
Figure 8, to remove outliers from all the values and confirm the mean value.
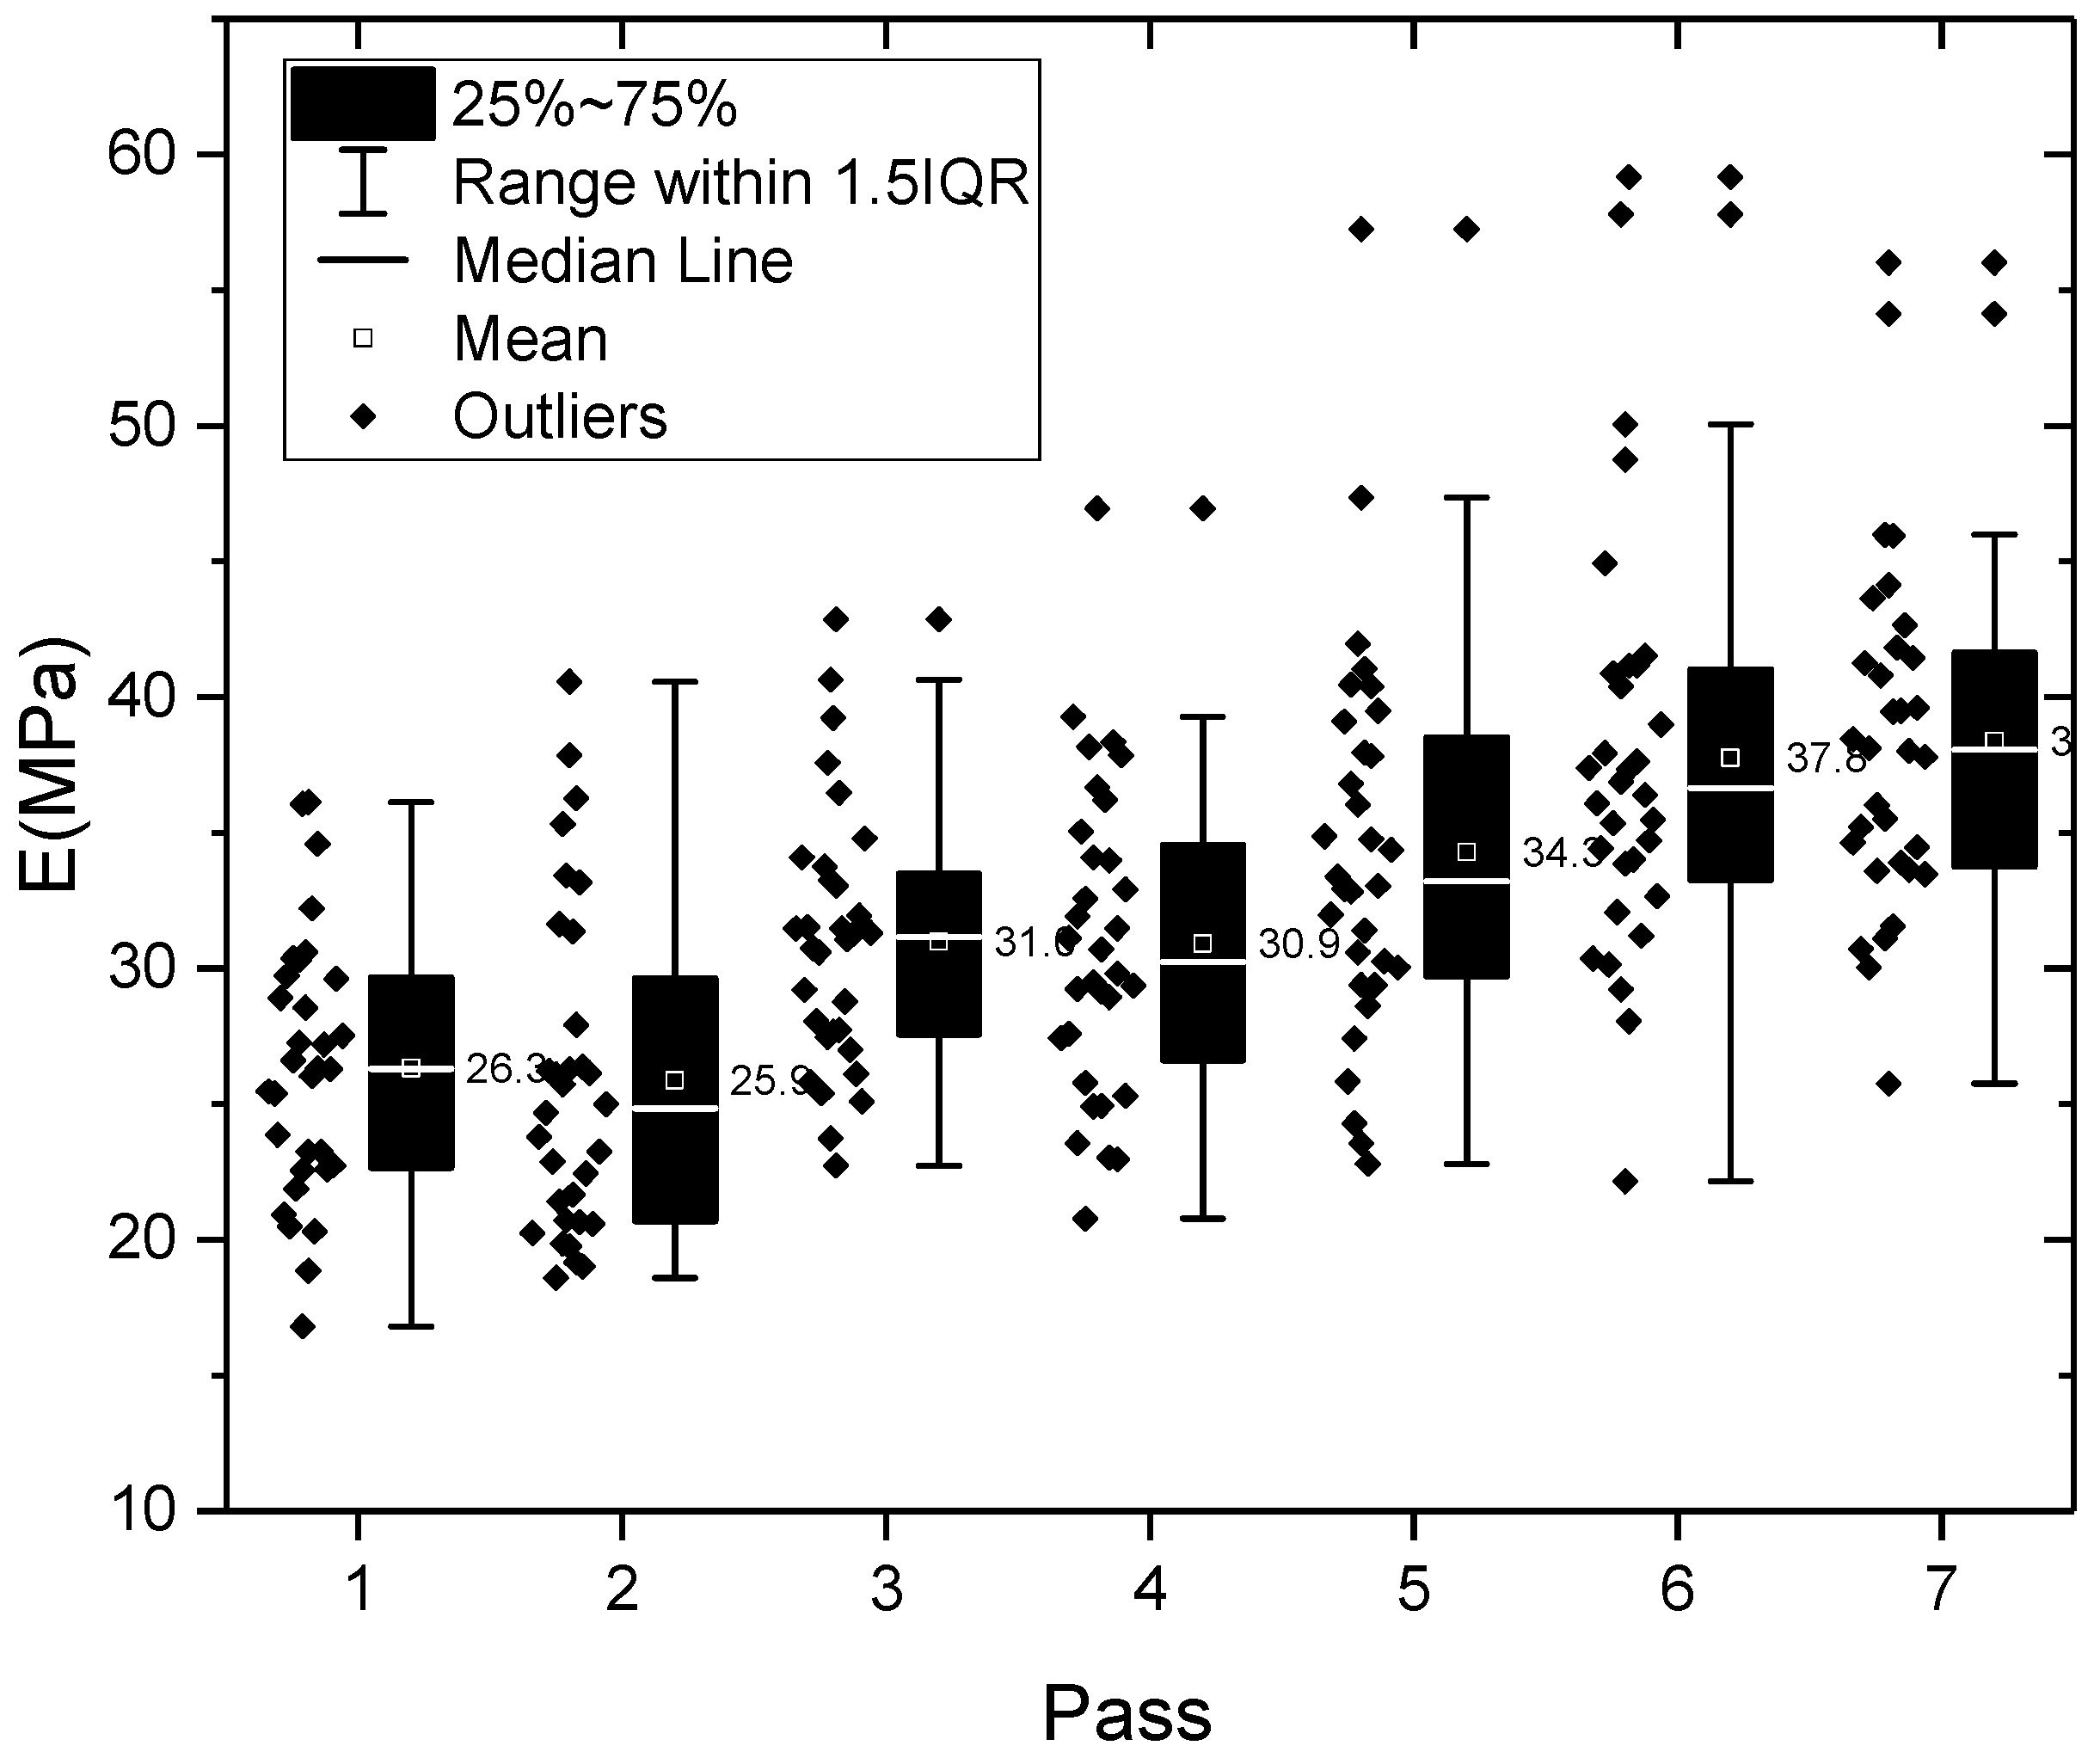
3.2.3. Light Falling Weight Deflectometer (LFWD)
Dynamic PLTs were performed in all the sections, and data were acquired through testing at all compaction pass counts.
Figure 9 shows the
E values according to the number of compaction passes for each lane. An increasing trend can be seen with an increase in the number of compaction passes.
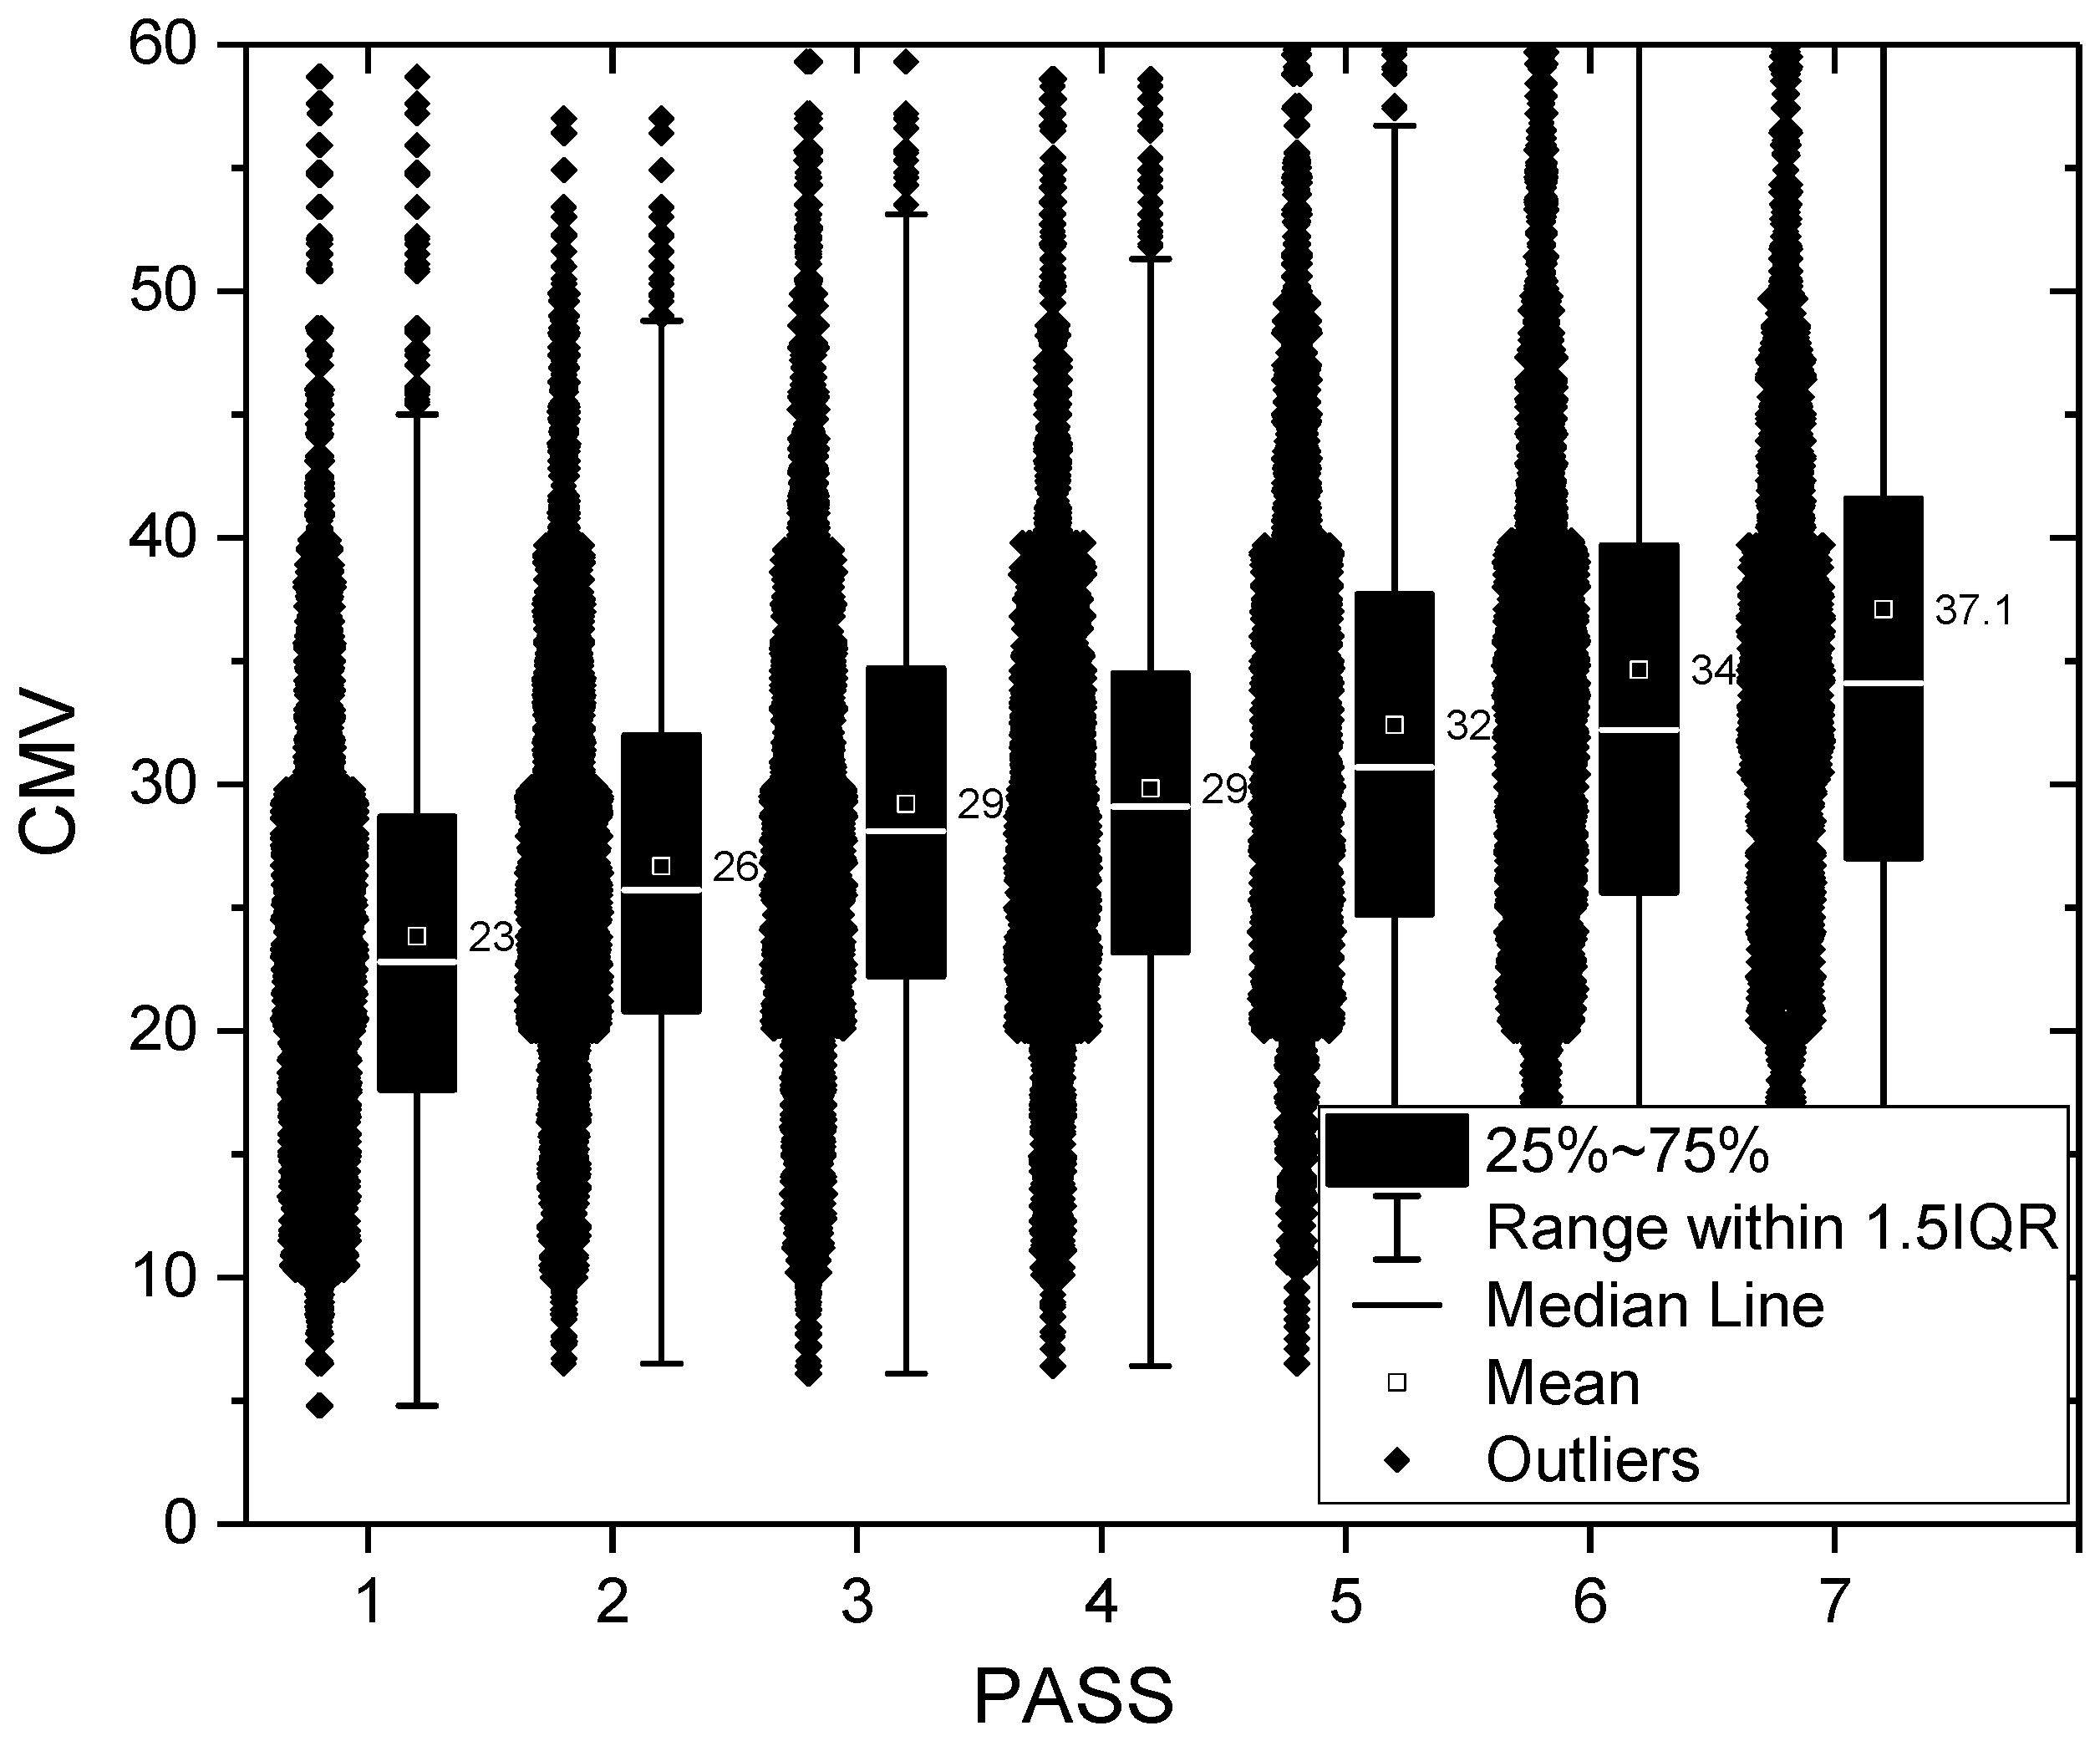
3.2.4. Compaction Meter Value (CMV)
Intelligent quality management tests using accelerometers were performed in all the sections, and data were acquired through testing at all compaction pass counts.
Figure 10 shows the CMV values based on the number of compaction passes for each lane; an increasing trend can be seen with an increasing number of compaction passes.
Figure 11 provides a representation of the CMV distribution throughout the full extent of the compacted area
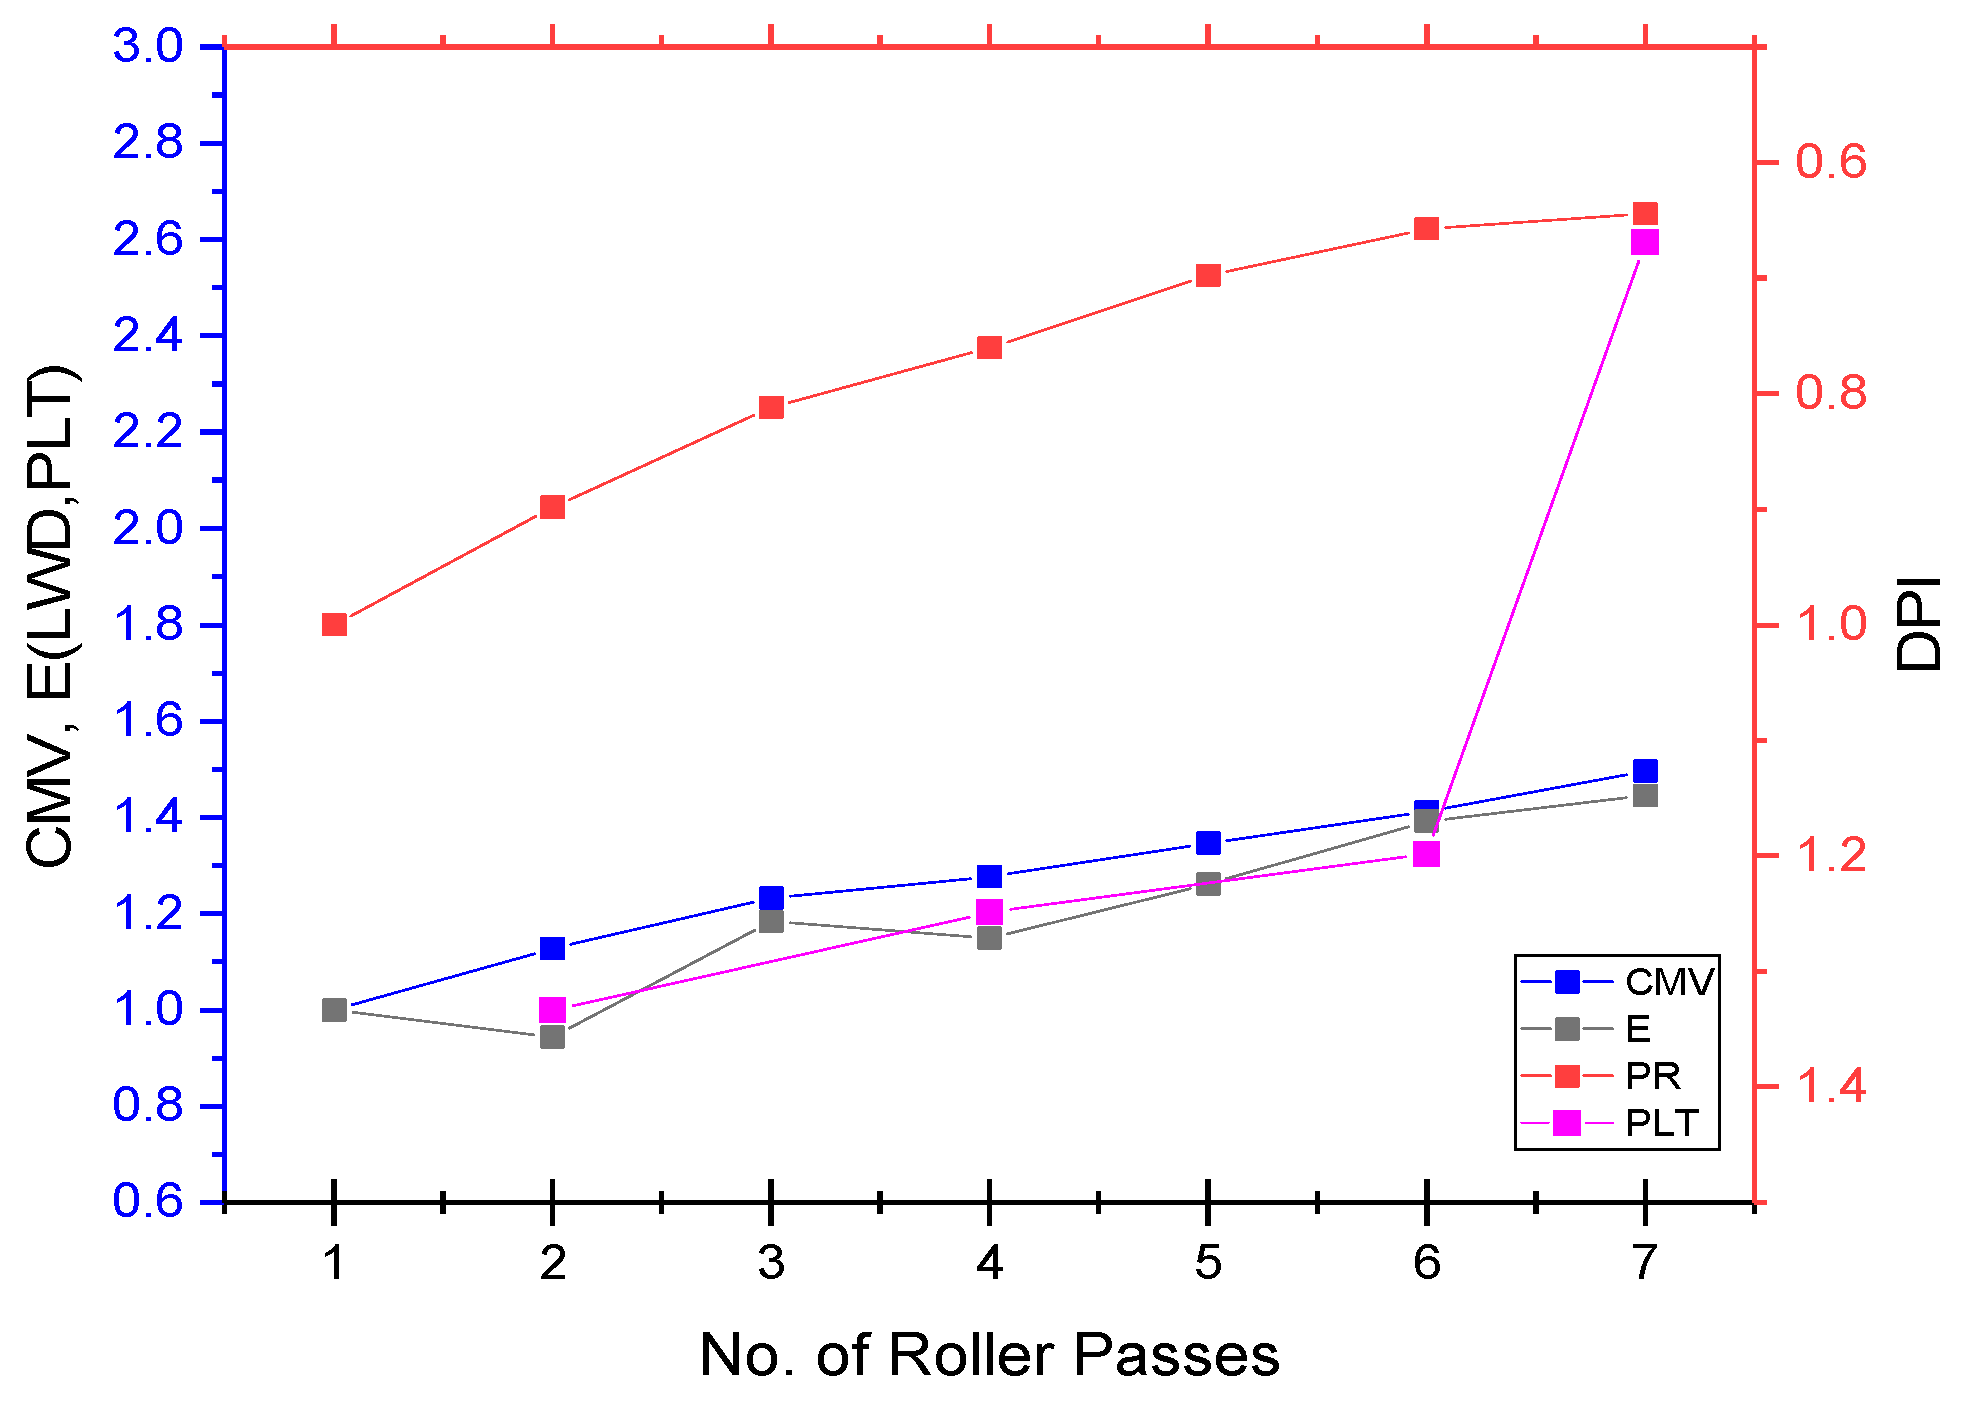
3.2.5. Comparative Analysis of Intelligent Quality Management System and Conventional Quality Management Results
As a result of correlation analysis among the four test methods, a strong correlation was observed between the intelligent quality management system and the conventional quality control test methods, as illustrated in
Figure 12. Furthermore, as shown in
Table 3, the correlations among all test methods were statistically significant at the 0.01 level, indicating a very strong statistical association between the variables. The Pearson correlation coefficients were also found to be very high, suggesting that the intelligent quality management method is viable and reliable for field application.
4. Discussion
The integration of UAV-based surface analysis, FFT filtering, and terrain curvature metrics provides a robust and innovative framework for evaluating road embankment quality in real time. The results confirm that this methodology offers high spatial resolution and noncontact surface characterization, allowing for rapid and accurate quantification of flatness. Frequency domain filtering not only eliminates elevation and slope effects but also enhances the detection of local roughness variations, providing insight into surface uniformity that conventional techniques often miss.
Furthermore, curvature analysis adds geometric sensitivity to the evaluation process. While elevation and slope reflect global surface trends, curvature captures local deformation patterns and directionally aligned irregularities often associated with nonuniform compaction or underlying stratification. The near-zero mean curvature and narrow variability observed in this study suggest that the test surface achieved a high degree of flatness and homogeneity.
In terms of operational feasibility, the UAV-based survey and analysis process required approximately 2 to 3 h for a 50 × 20 m embankment section, including data acquisition, photogrammetric processing, and analysis. Although the initial setup (e.g., flight planning and ground control point installation) demands preparation, the method significantly reduces the time, labor, and interruption associated with manual or sampling-based inspections.
The method also proved effective when integrated with intelligent compaction (IC) systems. The compaction meter value (CMV), derived from vibratory roller sensors, showed strong correlation with conventional quality indicators such as the plate load test (PLT), dynamic cone penetrometer test (DCPT), and light falling weight deflectometer (LFWD). The statistically significant correlations (p < 0.01) and Pearson coefficients exceeding 0.95 in some cases underscore the reliability of CMV as a surrogate indicator of ground stiffness and deformation resistance.
One of the major advantages of the IC system is its ability to provide continuous real-time measurements without halting construction operations. This supports immediate feedback and quality control during compaction. Compared with conventional point-based testing, which is time-consuming and spatially limited, the ICS enables full-area monitoring with integrated geolocation, making it better suited for modern smart construction workflows.
Despite its strengths, the proposed method has certain limitations. UAV-based surveys can be influenced by weather conditions (e.g., rain, wind) and may face restrictions in regulated airspaces. Photogrammetric accuracy also depends on factors such as camera resolution and GCP precision. Additionally, IC values like CMV are relative and must be calibrated for each site through trial compaction and correlation with baseline tests.
Furthermore, since soil compaction quality is highly influenced by moisture content, maintaining field conditions within an optimal moisture range is crucial to achieving uniform stiffness and strength. Excessive or insufficient moisture can result in under- or over-compaction, ultimately degrading embankment performance. Although direct moisture measurements were not integrated in this study, UAV-mounted thermal infrared (TIR) cameras provide a promising approach for estimating surface moisture distribution. Wet soils typically exhibit lower surface temperatures due to evaporative cooling, making thermal imagery a potential proxy for identifying moisture anomalies. However, as this method is indirect and sensitive to environmental conditions, further research is needed to calibrate and validate UAV-based moisture estimation techniques for practical field applications.
In summary, this integrated methodology aligns well with the objectives of smart construction (automation, digitalization, and real-time monitoring). It offers a powerful complement to both traditional and modern quality assessment tools, enabling more efficient, accurate, and data-driven earthwork management.
5. Conclusions
This study presented an integrated methodology that combines UAV-based high-resolution terrain analysis with an intelligent compaction quality management system (ICS) to overcome the spatial limitations and inefficiencies of conventional point-based compaction evaluation methods. Through the use of drone photogrammetry, a digital elevation model (DEM) was generated, and terrain curvature indicators—profile curvature (Kp) and tangential curvature (Kt)—were calculated to enable detailed and full-coverage surface characterization.
The proposed approach demonstrated strong agreement with traditional tests such as the plate load test (PLT) and field density test. In addition, FFT-based flatness filtering further enhanced the accuracy of roughness detection, while the integration of ICS enabled real-time compaction monitoring using compaction meter value (CMV) data. These findings confirmed the system’s effectiveness in identifying spatial variation in compaction quality and enabling immediate corrective actions without halting the construction process.
The key contributions of this study can be summarized as follows:
Overcoming spatial limitations: the UAV-based method allows for noncontact high-resolution assessment of the entire embankment area, addressing the limited coverage of traditional point-based testing.
Introduction of curvature-based indicators: terrain curvature metrics are introduced as sensitive and intuitive indicators for evaluating surface uniformity and detecting compaction anomalies.
Integration with real-time intelligent systems: the incorporation of ICS enables real-time quality monitoring, data synchronization, and visualization of compaction trends across space and time.
Alignment with smart construction principles: the methodology supports key aspects of smart construction, including automation, digitalization, and data-driven quality control.
This research is aimed at civil engineers, construction managers, researchers, and practitioners engaged in earthwork quality control, UAV-based surveying, and smart construction technologies. It is particularly relevant for projects requiring real-time full-coverage monitoring and where digital transformation and intelligent process management are essential.
Future work will focus on the application of the methodology to various soil types and construction conditions, and on the development of automated algorithms using artificial intelligence to enable fully autonomous quality control. Additionally, wireless sensor communication and integration with cloud-based platforms will further support smart construction workflows and sustainability objectives.
Ultimately, this study provides a scientific foundation for advancing quantitative, efficient, and real-time earthwork quality management, contributing to improved productivity, reduced rework, standardized quality practices, and the digital evolution of the construction industry.


