Abstract
With advancements in cloud computing and machine learning algorithms, an increasing number of cropland datasets have been developed, including the China land-cover dataset (CLCD) and GlobeLand30 (GLC). The unique climatic conditions of the Tibetan Plateau (TP) introduce significant differences and uncertainties to these datasets. Here, we used a quantitative and visual integrated assessment approach to assess the accuracy and spatial consistency of five cropland datasets around 2020 in the TP, namely the CLCD, GLC30, land-use remote sensing monitoring dataset in China (CNLUCC), Global Land Analysis and Discovery (GLAD), and global land-cover product with a fine classification system (GLC_FCS). We analyzed the impact of terrain, climate, population, and vegetation indices on cropland spatial consistency using structural equation modeling (SEM). In this study, the GLAD cropland area had the highest fit with the national land survey (R2 = 0.88). County-level analysis revealed that the CLCD and GLC_FCS underestimated cropland areas in high-elevation counties, whereas the GLC and CNLUCC tended to overestimate cropland areas on the TP. Considering overall accuracy, GLC and GLAD performed the best with scores of 0.76 and 0.75, respectively. In contrast, CLCD (0.640), GLC_FCS (0.640), and CNLUCC (0.620) exhibited poor overall accuracy. This study highlights the significantly low spatial consistency of croplands on the TP, with only 10.60% consistency in high and complete agreement. The results showed substantial differences in spatial accuracy among zones, with relatively higher consistency observed in low-altitude zones and notably poorer accuracy in zones with sparse or fragmented cropland. The SEM results indicated that elevation and slope directly influenced cropland consistency, whereas temperature and precipitation indirectly affected cropland consistency by influencing vegetation indices. This study provides a valuable reference for implementing cropland datasets and future cropland mapping studies on the TP region.
1. Introduction
The Tibetan Plateau (TP), often referred to as “the third pole of the world”, holds immense significance as an agricultural and pastoral area and serves as an ecological security barrier for China. Croplands serve as a crucial platform for agricultural production and play a significant role in stabilizing and consolidating borders [1]. The government places immense importance on the advancement of cropland and agricultural practices on the TP. Consequently, it initiated an array of impactful policies aimed at bolstering the agricultural sector [2,3].
In addition to their significant contribution to local economic development [4], agricultural activities aimed at land reclamation and cropland management have brought about notable land transformations and substantial disturbances to pristine ecosystems on the TP. These activities have had a profound impact on local and regional environments and climate [5,6,7]. For instance, the adoption of intensive agricultural practices, such as facility agriculture, has led to the release of microplastics in the TP. Specifically, low temperatures and drought conditions have necessitated the increased use of plastic materials and mulch in greenhouses, exacerbating microplastic pollution [8,9]. Furthermore, agricultural production has been identified as a significant risk factor for water chemistry alterations in the Lhasa River Basin, with croplands being the primary areas of concern [10]. Agricultural activities on the TP contribute to the accelerated degradation of the soil surface layer, resulting in severe soil and wind erosion. The vulnerability of croplands on the TP to abandonment further exacerbates this issue, leading to more pronounced soil degradation and sandification [11]. Therefore, accurate identification of cropland distribution is imperative as a fundamental requirement for assessing regional food security, environmental pollution, and climate change impacts on the TP.
Remote sensing is an invaluable tool for monitoring cropland distribution over extended periods and contributes significantly to regional, national, and global cropland mapping efforts [12,13,14]. Advancements in cloud computing and machine learning have facilitated the production of numerous high-resolution land-use/cover (LULC) and cropland datasets that are freely accessible for public use [15]. Notable examples include the China land-cover dataset (CLCD) [16], GlobeLand30 (GLC) [17], Global Land Analysis and Discovery (GLAD) [18], global land-cover product with a fine classification system (GLC_FCS) [19], Finer Resolution Observation and Monitoring of Global Land Cover (FROM-GLC) [20], and a global cropland-extent product (GFSAD) [21] (Table 1). These datasets have found widespread applications in various studies at regional and global scales, not only for food security evaluation [22] but also for land-use change simulation and climate change effect assessments [23,24]. Nevertheless, these datasets adopted different remote sensing data, mapping methods, and classification schemes, leading to variations in the results obtained for the same regions [25,26].
Given the unique topographic and climatic conditions of the TP, considerable uncertainties exist in national- or global-scale cropland datasets specific to this region [27]. Additionally, the relatively small cropland plots and presence of mixed pixels significantly contributed to the discrepancies and uncertainties in these datasets. Although comparative studies of cropland datasets have been conducted at national, continental, and global scales, indicating substantial variations in cropland dataset uncertainties across different regions [28,29,30,31], there is a lack of research analyzing the underlying factors responsible for the lower accuracy and consistency of cropland datasets on the TP compared to other regions. This knowledge gap hinders efforts to improve cropland and land-cover mapping at high altitudes. Therefore, it is crucial to assess the accuracy and consistency of global- and national-scale cropland datasets on the TP to improve cropland mapping and subsequent related research in high-altitude regions.
Moreover, each dataset serves different functional purposes due to variations in data sources, classification systems, and spatial/temporal resolutions. For example, GLAD focuses on cropland used for annual and perennial herbaceous crops with a global scope [18], while GLC provides multi-type cropland classes suitable for regional analysis [17]. CLCD emphasizes national-scale consistency using random forest algorithms [16], and CNLUCC is primarily designed for administrative land-use planning [32]. These functional differences necessitate a clearer understanding of how datasets should be selected and applied in specific research contexts, especially in ecologically fragile zones like the TP.
Therefore, this study aimed to compare and evaluate the accuracy and consistency of five cropland datasets (CLCD, GLC, land-use remote sensing monitoring dataset in China (CNLUCC), GLAD, and GLC_FCS) on the TP and analyze the effects of climatic, topographic, and demographic factors on the consistency of these datasets. The specific contents of this study are as follows: (1) comparison of cropland area differences and accuracy among the five cropland datasets at the climate, topographic, and county scales using statistics of cropland area and ground validation points as benchmarks; (2) assessment of the distribution and disparities in cropland dataset consistency at the climate, topographic, and county scales using a quantitative and visual integrated assessment approach; and (3) analysis of the effects of topography, climate, demographics, and vegetation indices on spatial consistency, along with their variations across different climate zones, using structural equation models (SEMs). This study not only provides a comprehensive comparison of dataset performance but also sheds light on the spatial heterogeneity of cropland mapping accuracy and consistency in complex terrains. The findings are expected to support more informed decisions in ecological protection, agricultural development, and land-use management in high-altitude regions, underlining the necessity and significance of this research.
2. Materials and Methods
2.1. Study Area
The TP, situated in southwestern China, experiences a mountain plateau climate characterized by abundant sunshine, low temperatures, and significant diurnal temperature variations. The dominant land-cover types on the plateau include grasslands, bare land, and forests, which constitute over 90% of the total land area [33]. Cropland and construction land account for less than 1% of the land cover and are primarily concentrated in specific regions, namely “the Yarlung Tsangpo River, Lhasa River, Nianchu River” (YLN) and Yellow River–Huangshui River Valley (YHV). To enable the comparison and evaluation of cropland datasets, we divided the TP into 10 climate zones according to the China Climate Zone classification [34] (Figure 1).
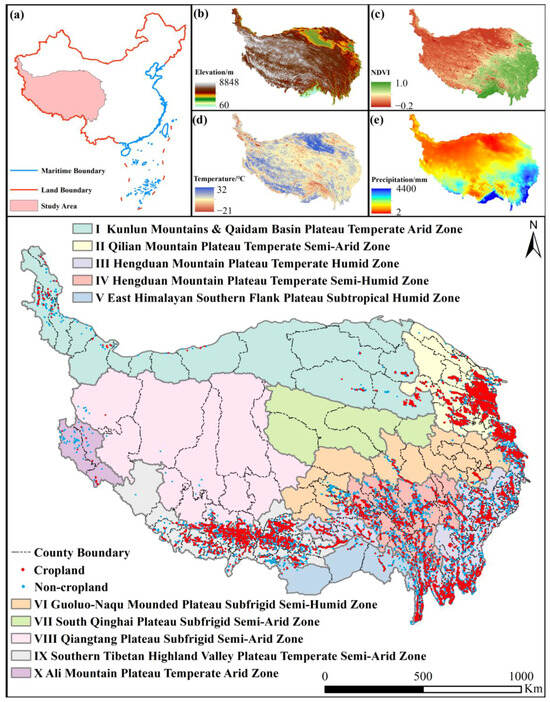
Figure 1.
Climate zones of the Tibetan Plateau, their basic information, and the spatial distribution of ground truth data. (a) Geographical location, (b) elevation, (c) mean normalized difference vegetation index (NDVI), (d) annual mean temperature, and (e) total annual precipitation.
2.2. Data
2.2.1. LULC/Cropland Datasets in the Tibetan Plateau
In this study, we used five prominent global and Chinese LULC and cropland datasets (CLCD, GLC, CNLUCC, GLAD, and GLC_FCS) that encompassed the TP. Detailed information about these datasets is presented in Table 1. The base year for the analysis was set to 2020 to ensure temporal consistency across the datasets. For datasets where 2020 data were available (CLCD, GLC, and GLC_FCS), we directly used the 2020 data. In cases where 2020 data were unavailable, we selected the closest available year as a substitute to minimize temporal discrepancies. Specifically, CNLUCC data from 2018 and GLAD data from 2019 were used. To ensure consistent spatial analysis, all five cropland datasets were reprojected on the Albers_Conic_Equal_Area coordinate system and resampled to a spatial resolution of 30 m using the natural neighborhood method.

Table 1.
Basic information of five LULC/cropland datasets.
2.2.2. Field Validation Data
We adopted the definition of cropland from the national land survey, which encompasses land primarily used for crop cultivation via surface tillage, fallow land, and croplands interspersed with trees. The validation points were obtained from patch data derived from a national land survey. To ensure spatial representativeness and reduce potential sampling bias, cropland validation points were selected using stratified random sampling based on cropland area within each climate zone. Specifically, the number of cropland validation points in each zone was proportionally determined by the total cropland area of that zone. Within each climate zone, cropland patches were randomly sampled. In total, 16,389 cropland validation points were collected across the TP (Figure 1). Considering the limited area of cropland on the TP and the need to ensure accurate verification, we selected non-cropland validation points located within a 10 km radius of the cropland validation points. This approach yielded a set of 16,525 non-cropland validation points. To ensure a consistent and unbiased evaluation of the five cropland datasets, we used the same set of validation points to verify the accuracy of each dataset. Table 2 presents the distribution of validation points within each climate zone. This sampling strategy helps ensure coverage across diverse geomorphological and climatic zones and minimizes sampling bias.
Table 2.
Number of validation points in each climate zone.
2.2.3. Other Data
Statistics on the cropland areas in 2020 were acquired from the Third National Land Survey (https://gtdc.mnr.gov.cn/ (accessed on 23 May 2023)). Elevation and slope data were obtained from SRTM [35] with a spatial resolution of 90 m. These data were used to assess variations in the spatial accuracy and consistency of the cropland datasets across different elevation and slope ranges. In addition, they were employed to investigate the influence of topographic factors on the spatial consistency of cropland.
Temperature data were derived from the MODIS data with a spatial resolution of 1 km [36]. The average temperature of the crops during the growing period (April to September) for each pixel on the TP in 2020 was computed using these data. Similarly, precipitation data were obtained from the Climate Hazards Group InfraRed Precipitation with Station data (CHIRPS) with a spatial resolution of 5 km [37], which allowed the calculation of the total annual precipitation for each pixel on the TP in 2020. Population data for 2020 were acquired from the Center for International Earth Science Information Network [38] at a spatial resolution of 1 km. Normalized difference vegetation index (NDVI) data were obtained from MODIS data [36] with a spatial resolution of 250 m. The 95th NDVI value for each pixel on the TP in 2020 was computed. The above data were used as influencing factors to assess their impact on the spatial consistency of croplands.
2.3. Methodology
This study consisted of three primary components to comprehensively evaluate the performance of the cropland datasets on the TP (Figure 2): (1) comparative analysis of the cropland area between the datasets and the statistical area, (2) evaluation of spatial accuracy across the datasets, and (3) assessment of spatial consistency among the datasets. In addition, we investigated factors influencing cropland consistency.
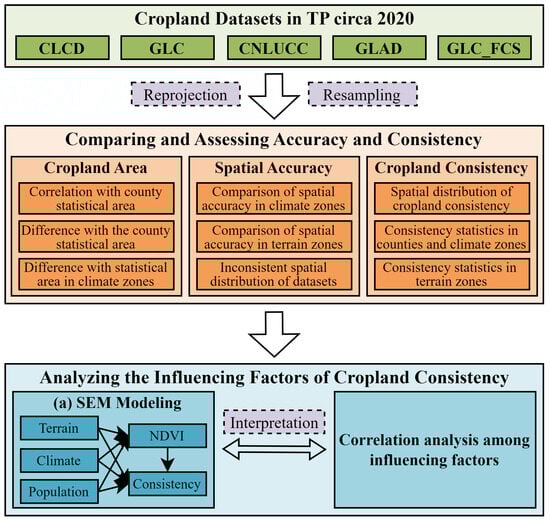
Figure 2.
Workflow of this study: (a) shows the SEM a priori hypothesis framework.
2.3.1. Comparison of Cropland Area in Different Datasets
To validate the accuracy of each dataset regarding the cropland area at the county and climate zone levels, a comparison was conducted with statistics from the national land survey. The root-mean-square error (RMSE), R-squared (R2), and Lin’s concordance correlation coefficient (LCCC) were computed to evaluate the goodness of fit between the cropland areas derived from each dataset and the corresponding statistical data. Additionally, the ratio of cropland area differences between the datasets (CLCD, GLC, CNLUCC, GLAD, and GLC_FCS) and the statistical data were calculated to assess the accuracy of the datasets at the county and climate zone levels in terms of area estimation.
Here, is the cropland area in county or climate zone as derived from the cropland dataset; is the corresponding cropland area in county or climate zone as obtained from the statistical data; is the total number of counties; is the average cropland area at the county level for the cropland dataset; and is the average cropland area at the county level for the statistical data; is the correlation coefficient between and ; is the variance of cropland area at the county level for the cropland dataset; is the variance of cropland area at the county level for the statistical data.
2.3.2. Comparison of Cropland Spatial Accuracy in Different Datasets
To evaluate the spatial accuracy of the cropland datasets in various regions of the TP, climate zones, and topographic zones, several metrics were calculated using the validation point data, including the confusion matrix (CM), overall accuracy (OA), omission error (OE), commission error (CE), and the Matthews correlation coefficient (MCC). The MCC has been demonstrated to yield more realistic and informative results in binary classification than traditional metrics such as Kappa coefficients and F1 scores. Moreover, MCC is deemed more reliable, particularly in the context of unbalanced datasets [39,40,41,42]. The CM and the corresponding metrics were used to assess the performance of each dataset in different regions. Additionally, the spatial distribution of misclassified validation points was analyzed to gauge the reliability of each dataset in diverse regions.
Here, is a true negative, indicating the accurate identification of non-cropland areas; is a false positive, representing the incorrect identification of non-cropland as cropland; is a false negative, indicating the misclassification of cropland as non-cropland; is a true positive, denoting the accurate identification of cropland areas.
2.3.3. Analysis of the Cropland Consistency
A synthetic map was constructed to evaluate the spatial consistency of the five cropland datasets. Each pixel in the synthetic map was assigned a value ranging from 0 to 5 based on the number of times a cropland was identified within that pixel. In the datasets, cropland pixels were assigned a value of 1, whereas non-cropland pixels were assigned a value of 0. A value of 5 indicated complete agreement, whereas values of 4, 3, 2, 1, and 0 represented high agreement, medium agreement, low agreement, disagreement, and non-cropland, respectively. A quantitative and visual integrated assessment approach was then applied to analyze the spatial differences in cropland consistency. Specifically, average cropland consistency was quantified across climate zones and counties, allowing for a comprehensive understanding of the overall consistency trends. The proportion of cropland consistency within each class was determined for each climatic and topographical zone. To compare the spatial differences and cropland consistency among the five datasets, five typical districts were selected based on climate and topography, and a detailed visual analysis of the five areas was conducted on a 0.05° × 0.05° grid.
2.3.4. Analysis of Influencing Factors on Cropland Consistency
SEM models can directly quantify the causal relationship between multiple variables based on a researcher’s hypotheses [43,44,45]. Human responsibility for the management and distribution of croplands is related to terrain and climate, and the consistency of croplands is affected by population, terrain, and climate. As an important index for crop and cropland mapping, NDVI is considered an influencing factor and a mediator. In this study, we formulated an a priori hypothesis (Figure 2a) to establish the following relationships: the NDVI index has a direct influence on cropland consistency, while topographic, climatic, and demographic factors exert themselves directly on cropland consistency and indirect effects on cropland consistency by influencing the NDVI index.
Using cropland validation point data, we constructed a general regional model and seven climate zone sub-models to investigate the influence of each factor on cropland consistency. However, because of the limited availability of validation points, modeling analysis was not performed for climate zones V, VII, and X. The goodness of fit of the SEM was assessed using chi-square (), degrees of freedom (), comparative fit index (), and root-mean-squared error of approximation (). A valid and stable SEM is indicated when 0 ≤ ≤ 2, 0.97 ≤ ≤ 1.00, and 0 ≤ ≤ 0.05. Notably, all SEMs in this study satisfied these criteria, demonstrating their validity and stability. Additionally, we analyzed the correlations among the factors using Pearson’s correlation coefficient to further validate the reasonableness of the SEM analysis results.
3. Results
3.1. Cropland Area in Different Datasets
We conducted a comparative analysis to assess the accuracy and regional variations in the cropland datasets by comparing their correlations with the county-level statistics of cropland area (Figure 3). GLAD demonstrated the highest statistical correlation (R2 = 0.88) and the lowest RMSE (0.68), indicating the best fit and superior accuracy compared to the other datasets (Figure 3d). The GLC (R2 = 0.81, RMSE = 0.83, LCCC = 0.12), CLCD (R2 = 0.77, RMSE = 0.93, LCCC = 0.17), and CNLUCC (R2 = 0.73, RMSE = 1.01, LCCC = 0.14) displayed reasonable correlation and accuracy. Conversely, GLC_FCS exhibited the weakest correlation (R2 = 0.68) and the highest RMSE (1.10), indicating a lower accuracy (Figure 3e). In terms of area accuracy and fit with statistics, GLAD emerged as the superior dataset, whereas GLC, CNLUCC, and GLC_FCS exhibited significant overestimation issues (Figure 3f).
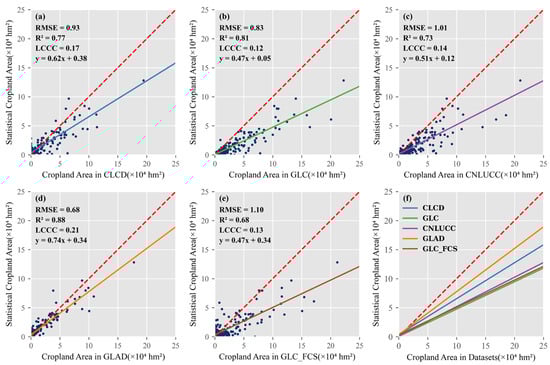
Figure 3.
Scatter plot of cropland area from the cropland dataset and county-level statistics from the national land survey. (a) CLCD, (b) GLC, (c) CNLUCC, (d) GLAD, (e) GLC_FCS, (f) fitting curve. The red dashed line represents the reference line of x = y.
To further explore the regional differences, we calculated the ratio of cropland area differences between the datasets and statistics within counties and climate zones (Figure 4). The CLCD displayed a pronounced overestimation around the TP and an underestimation at the center of the TP (Figure 4a). The GLC tended to overestimate cropland areas, with variations across different zones. The GLC displayed relatively lower overestimation in Zones IV and IX and underestimation in Zone X, with only a few counties showing underestimation (Figure 4c,d). The CNLUCC and GLC exhibited significant overestimation problems at the climatic zone level (Figure 4e), whereas an underestimation problem was prevalent at the county level in the southwestern TP (Figure 4f). In contrast, GLAD exhibited the least difference in the cropland area, with a distinct overestimation in the north and an underestimation in the south (Figure 4g). At the county level, the underestimation was concentrated in the central TP, where croplands were scarce (Figure 4h). Finally, GLC_FCS exhibited significant underestimation and overestimation at the county level. Underestimation was primarily observed in the south-central part of the TP, whereas overestimation was spread across the rest of the TP (Figure 4j).
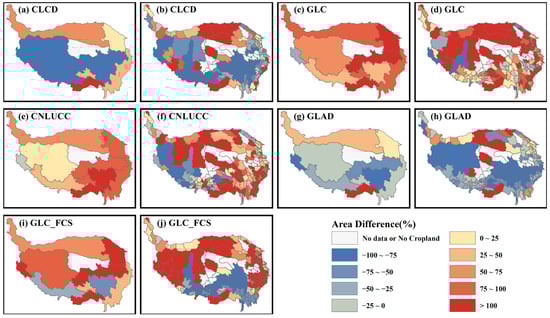
Figure 4.
The area difference ratios between the cropland dataset and statistical data at the climate zones and counties. (a,c,e,g,i) are area difference ratios in climatic zones, and (b,d,f,h,j) are area difference ratios at the counties.
3.2. Cropland Spatial Accuracy in Different Datasets
3.2.1. Cropland Spatial Accuracy in Different Climate Zones
The accuracy evaluation of the cropland datasets on the TP revealed significant findings. GLC and GLAD exhibited OA above 0.70, with GLC at 0.76 and GLAD at 0.75, indicating superior performance (Figure 5a). In contrast, the CNLUCC had the lowest OA of 0.62, followed closely by the CLCD and GLC_FCS, both of which achieved OA values of 0.64 (Figure 5a). Except for zone VI, GLC and GLAD consistently attained the highest OA across all climate zones, demonstrating their superior performances in various geographical regions (Figure 5a). MCC assessments further corroborated the credibility of OA assessments (Figure 5b).
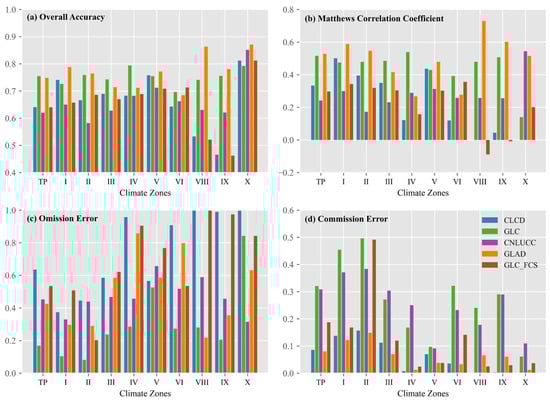
Figure 5.
Accuracy metrics of five cropland datasets in the Tibetan Plateau and climate zones. (a) Overall accuracy, (b) Matthews correlation coefficient, (c) Omission error, (d) Commission error.
However, all datasets, except for GLC, exhibited OEs exceeding 0.40 on the TP, with CLCD reaching 0.60, indicating a significant underestimation (Figure 5c). CLCD and GLC_FCS consistently demonstrated OEs surpassing 0.60, with values approaching 1.00 in the southwestern TP. In contrast, GLC and CNLUCC showed higher CEs on the TP and within each climate zone (Figure 5d), indicating a notable tendency to overestimate the cropland area.
To reinforce this evaluation, an analysis based on the spatial distribution of misclassification verification points was conducted (Figure 6). The CLCD and GLC_FCS datasets predominantly exhibited blue points (Figure 6a,e), signifying a severe issue of omission, namely underestimation of the cropland area. In contrast, GLC and CNLUCC predominantly exhibited red points (Figure 6b,c), indicating a significant overestimation of the cropland area. Notably, GLAD showed a lower number of misclassified points in the southern TP compared with the other datasets, although some instances of omissions were still observed (Figure 6d).
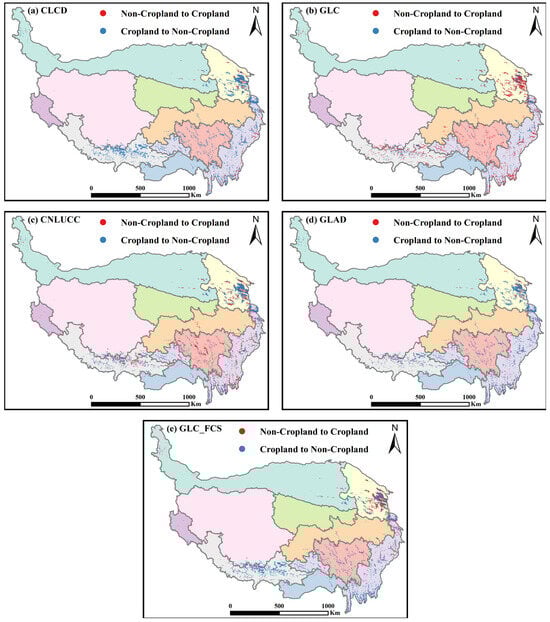
Figure 6.
Spatial distribution of misclassification verification points. Red points correspond to commission errors; blue points correspond to omission errors. (a) CLCD, (b) GLC, (c) CNLUCC, (d) GLAD, (e) GLC_FCS.
3.2.2. Cropland Spatial Accuracy in Different Terrains
The spatial accuracy of the cropland datasets in the TP was closely associated with elevation (Figure 7). While OA may be influenced by imbalanced sample sizes across elevation bands, the MCC offers a more robust measure of classification performance (Figure 7a,b). Notably, the CLCD performed relatively well below 3500 m, but both CLCD and GLC_FCS exhibited sharp declines in accuracy at higher elevations, with MCC values dropping below 0.1 and OE exceeding 0.85 above 4000 m (Figure 7b,c), indicating serious under-detection of cropland. These results suggest that in high-altitude regions, these datasets struggle to distinguish cropland from spectrally similar land covers such as alpine meadows or barren land. In contrast, GLC and GLAD demonstrated stronger robustness, with OA increasing steadily with elevation and exceeding 0.85 in the >4500 m range (Figure 7a) and MCC values maintaining between 0.4 and 0.6 across most elevation intervals (Figure 7b), reflecting better generalization in high-elevation environments. However, CNLUCC exhibited relatively low MCC values and consistently high OE and CE across all elevation ranges (Figure 7c,d), suggesting limited adaptability regardless of altitude.
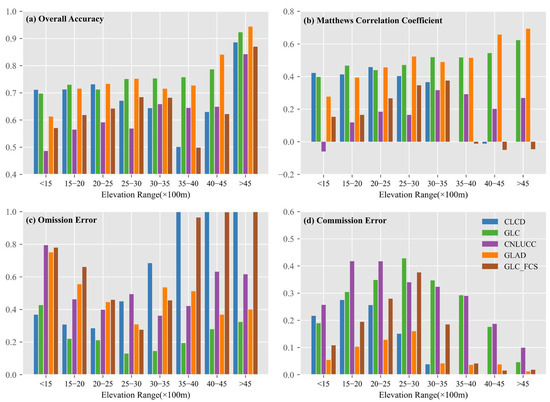
Figure 7.
Accuracy metrics of five cropland datasets in different elevation intervals. (a) Overall accuracy, (b) Matthews correlation coefficient, (c) Omission error, (d) Commission error.
Similarly, slope influenced the spatial accuracy of the cropland datasets, though to a lesser extent than elevation (Figure 8). GLAD and GLC consistently achieved the highest OA and MCC across all slope ranges. Their OA reached approximately 0.85 when the slope exceeded 25°, while CNLUCC remained below 0.6 across all slope categories (Figure 8a). The MCC values for GLAD and GLC peaked around 0.5 in the 15–25° slope range (Figure 8b), reflecting strong adaptability to moderately complex terrain. However, the performance of GLAD declined on steeper slopes, with OE approaching 0.7 in the >25° class (Figure 8c), suggesting challenges in detecting fragmented or terraced cropland. CLCD and GLC_FCS also exhibited consistently high OE (0.6–0.8) across all slope ranges, indicating systematic underestimation of cropland regardless of terrain. Their MCC values showed a rise-and-fall trend, peaking within the 15–25° range but dropping on either side (Figure 8b), which reflects their sensitivity to topographic variation. In contrast, the MCC of GLC continued to increase with slope, accompanied by a corresponding decline in CE, indicating improved discrimination of cropland from non-cropland in steeper regions (Figure 8d). Meanwhile, GLC and CNLUCC showed high CE values (>0.4) at gentle slopes (<2°), likely due to misclassification of grasslands or built-up areas as cropland. These patterns suggest that topography affects not only spectral separability but also model generalization, particularly for classifiers not trained on terrain-diverse datasets.
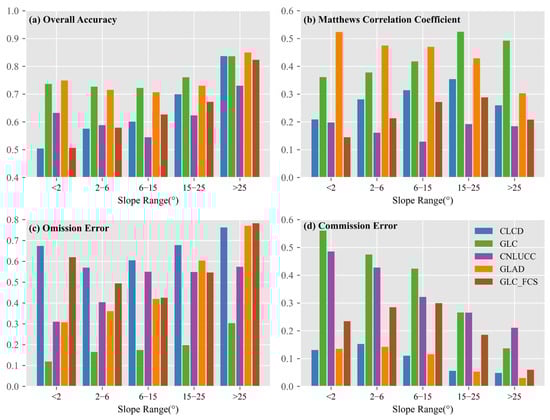
Figure 8.
Accuracy metrics of five cropland datasets in different slope intervals. (a) Overall accuracy, (b) Matthews correlation coefficient, (c) Omission error, (d) Commission error.
3.3. Cropland Spatial Consistency of Different Datasets
Analysis of cropland consistency on the TP revealed varying levels of agreement (Figure 9e). While only 4.3% of the regions exhibited complete agreement, 62.6% demonstrated disagreement, with higher-consistency regions showing lower overall proportions (Figure 9e). Notably, the YHV and Qaidam basins predominantly exhibited higher consistency, particularly at lower elevations, influenced by the CLCD and GLC_FCS datasets (Figure 9a,b). In contrast, the consistency diminished in the higher-elevation regions of the YLN and scattered cropland areas on the southeastern TP (Figure 9c,d).
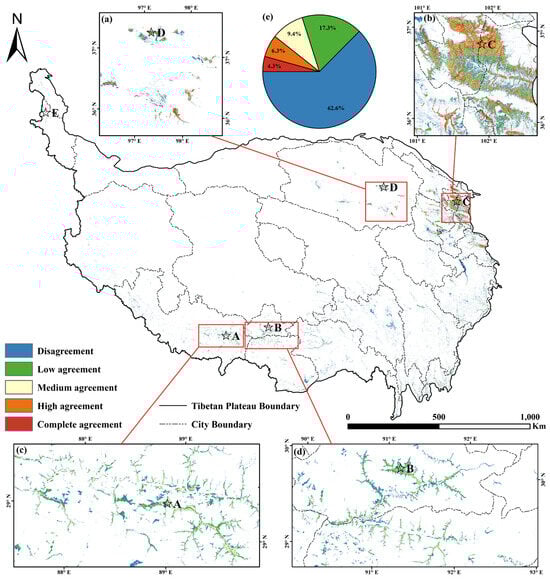
Figure 9.
Spatial consistency of the five cropland datasets on the Tibetan Plateau. (a) is the Qaidam Basin, (b) is the Yellow River–Huangshui River Valley (YHV), (c,d) are the Basin of Yarlung Tsangpo River, Lhasa River, and Nianchu River (YLN), and (e) is the proportion of consistency on the Tibetan Plateau. A−D is four typical regions.
Furthermore, the analysis considered consistency within each climate zone and county (Figure 10). Zone II demonstrated the highest average consistency, with proportions exceeding the medium agreement by 30% (Figure 9b and Figure 10a). In contrast, other climate zones, particularly those with sparse croplands, displayed lower consistency levels, with disagreements reaching 90% (Figure 10a). At the county level, average consistency corresponded to climate zones, with low-elevation counties exhibiting significantly higher average consistency values. Counties characterized by concentrated croplands in the YHV and YLN regions generally exceeded an average consistency of 1.5, whereas counties with sparse croplands exhibited lower average consistency levels (Figure 9c,d and Figure 10b).

Figure 10.
Average consistency of cropland in the climatic zones and counties of the Tibetan Plateau: (a) climate zones; (b) counties.
The terrain significantly affected only spatial accuracy and consistency (Figure 11). The proportion of complete agreement peaks in the elevation range of 2500–3000 m but drops sharply at higher elevations, accompanied by a notable increase in disagreement (Figure 11a). Regions with elevations exceeding 3500 m exhibited minimal high and complete agreement, with the proportion of disagreement surpassing 70% (Figure 11a), associated with an OE close to 1.00 for the CLCD and GLC_FCS in this region (Figure 7c). Additionally, as the slope increased, the cropland consistency declined markedly, with regions exceeding 15° showing high levels of disagreement. The proportion of disagreement exceeded 70%, whereas the total proportion of high agreement and complete agreement fell below 5% (Figure 11b).
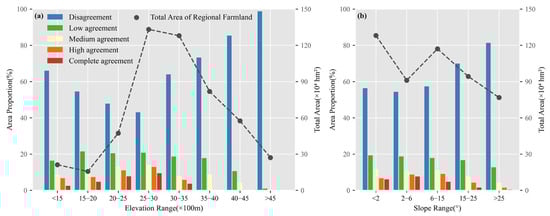
Figure 11.
Proportion of consistent area for different elevation (a) and slope ranges (b). The black dashed line indicates the sum of cropland areas in each consistency within each range.
To illuminate the spatial disparities in the cropland datasets across diverse regions, we selected five areas with a spatial extent of 0.05° × 0.05° (Figure 9) for a detailed comparison (Figure 12). These visual results, echoing previous findings (Figure 7 and Figure 11a), show reduced cropland consistency in elevated terrains owing to the inability of CLCD and GLC_FCS to distinguish croplands in high-altitude regions (Figure 12a,b). Moreover, discrepancies among the datasets are induced by the slope, where terraces manifest in a fragmented manner, resulting in a disordered pixel distribution for the CLCD and GLC_FCS (Figure 12c). Although GLC excels in continuous cropland identification, it overestimates the extent (Figure 12a,b), as evidenced by classifying entire regions as croplands (Figure 12c). In contrast, CNLUCC, which relies on manual interpretation, exhibits interpretational subjectivity, leading to substantial uncertainty. Despite its proficiency in identifying expansive cropland patches, the CNLUCC encounters challenges in accurately discerning intricate or diminutive cropland patches and other land-cover types in croplands (Figure 12c). GLAD emerged as the preeminent performer in spatial accuracy, consistently exhibiting accurate cropland identification (Figure 12a–d). In Figure 12e, the capability of GLAD to identify croplands diminishes, possibly because of its region-adaptive classifier, resulting in a suboptimal classification in that specific region.
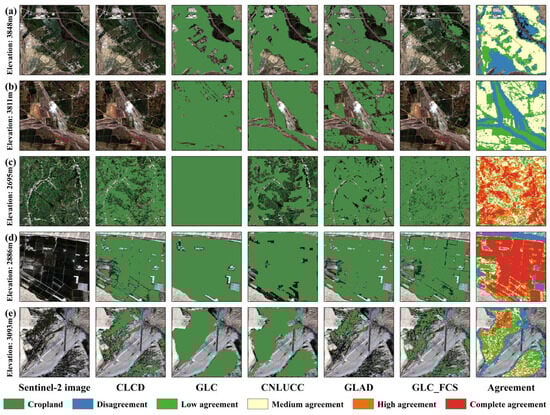
Figure 12.
Detailed visualization of local performance variation among various cropland datasets in specific locations, featuring a 0.05° × 0.05° extent. The positions of (a–e) are shown in Figure 9.
3.4. Influencing Factors of Cropland Spatial Consistency
The cropland consistency on the TP is primarily affected by terrain elements (Figure 13a), which aligns with the findings discussed in Section 3.2.2 and Section 3.3 regarding the impact of terrain on spatial accuracy and consistency (Figure 7 and Figure 11a). In addition, precipitation and the NDVI played crucial roles. Precipitation negatively affected consistency, whereas NDVI positively influenced consistency. These factors similarly influenced consistency aggregation. NDVI was primarily influenced by climatic elements rather than terrain elements, with temperature negatively affecting it and precipitation positively affecting it. The influence of population elements on NDVI, consistency, and consistency aggregation was insignificant for TP.
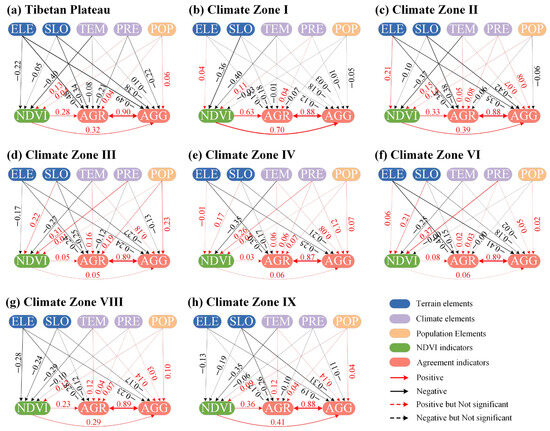
Figure 13.
SEM results in the Tibetan Plateau and different climate zones. AGR indicates cropland consistency, and AGG indicates aggregate cropland consistency within 5 × 5 pixels, which is the consistency aggregation. ELE, SLO, TEM, PRE, POP, and NDVI indicate elevation, slope, the average temperature over the growing period of the crops, annual precipitation, population density, and annual 95th NDVI, respectively. The effect is significant at p-values less than 0.05.
Across the climate zones of the TP, the degree of influence varies for each factor, with NDVI, elevation, and slope emerging as the primary influential factors. Elevation and slope negatively influenced consistency, whereas NDVI had a predominantly positive influence (Figure 13). Terrain elements primarily affected climatic zones II, III, IV, VI, and VIII, whereas NDVI emerged as the main influencing factor in zones I and IX. Zone III was the only climatic zone where population emerged as the main influencing factor for consistency, with no significant influence observed from the NDVI (Figure 13d).
While climate elements did not have a significant direct impact on consistency, they indirectly influenced cropland consistency by affecting NDVI (Figure 13). The influence of temperature on the NDVI was consistently negative, whereas precipitation had a predominantly positive influence. Additionally, terrain elements affect the NDVI, with the nature of their positive or negative influence depending on the specific climate zone. Elevation demonstrated a positive influence in zones II, IV, and VI and a negative influence in zones III, VIII, and IX. Similarly, the slope exhibited a positive influence in zones III, IV, and VI and a negative influence in zones I, II, VIII, and IX. However, the population was not significant across all climate zones.
4. Discussion
4.1. Other Factors Influencing the Accuracy and Consistency of Cropland Datasets
Despite conducting a thorough evaluation of the accuracy and consistency of the cropland datasets, it is important to acknowledge the potential factors that can influence their performance. First, the choice of satellite imagery and classification methods employed in the cropland datasets may have an influence. The five datasets primarily utilized Landsat data, with GLC incorporating HJ-1 and GF-1 and CNLUCC incorporating high-resolution CBERS imagery. The inclusion of additional satellite data theoretically reduced uncertainties; however, GLC and CNLUCC significantly overestimated the cropland area on the TP. One commonality between these two datasets is their reliance on manual interpretation during classification, which may introduce overestimation owing to variations in human cognitive abilities and subjective decision making. Manual interpretation, as used in GLC and CNLUCC, often involves visual analysis of satellite imagery, which can lead to inconsistent identification of cropland boundaries, especially in the TP’s fragmented and heterogeneous landscape. Additionally, the reliance on manual methods may struggle to account for the TP’s complex terrain and seasonal variations, such as snow cover or short growing seasons, further exacerbating classification errors.
In contrast, datasets using machine learning methods, such as CLCD, GLAD, and GLC_FCS, encounter difficulties in acquiring representative cropland samples on the TP, leading to increased uncertainty. Machine learning algorithms, particularly random forest and decision tree classifiers, depend heavily on the quality and quantity of training data. On the TP, the limited availability of ground truth data, coupled with the region’s small and scattered cropland patches, can result in undertrained models that fail to capture the spectral and temporal signatures of cropland, leading to underestimation. Moreover, machine learning methods may struggle with mixed pixels and spectral confusion in high-altitude areas, where cropland signatures are often obscured by shadows or resemble natural vegetation. These differences in classification approaches directly impacted this study’s results, with manual interpretation contributing to overestimation in GLC and CNLUCC, and machine learning limitations leading to underestimation in CLCD and GLC_FCS, highlighting the need for tailored classification strategies to address the TP’s unique environmental challenges.
Second, other factors may have influenced the assessment results. The reprojection and resampling of the dataset can introduce errors compared with the original data. For example, resampling the CNLUCC from 100 to 30 m would grossly overestimate the cropland area for river valley agriculture in the Tibetan Plateau with fragmented farmland. In addition, some degree of temporal mismatch exists among the datasets due to differences in update cycles and data availability. While CLCD, GLC, and GLC_FCS were available for 2020, CNLUCC and GLAD used data from 2018 and 2019, respectively. Although this temporal inconsistency may introduce uncertainty, cropland in the TP has shown strong temporal stability. Most cropland in the region is permanent, having remained under cultivation for more than a decade, which mitigates the impact of slight time lags between datasets. Given the relatively small size of cropland plots on the TP, even at a 30 m resolution, mixed pixel effects can influence the accuracy assessment results.
Additionally, remote sensing in high-elevation areas of the TP, where cropland detection inconsistencies are pronounced, faces several environmental and technical challenges that exacerbate classification uncertainties. Snow cover, prevalent at higher altitudes, can obscure cropland surfaces during significant portions of the year, leading to misclassification of cropland as non-cropland or other land-cover types, particularly in datasets relying on optical imagery like Landsat. Terrain shadows, caused by the complex topography and steep slopes of the TP, further complicate remote sensing by reducing the visibility of cropland features in shadowed areas, especially during periods of low solar angles. These shadows can cause spectral confusion, where cropland pixels are mistaken for forested or barren land. Moreover, the high-altitude environment of the TP is characterized by thin cloud cover and atmospheric interference, which can degrade the quality of satellite imagery and affect the accuracy of vegetation indices like NDVI used for cropland mapping. The short growing season at high elevations also limits the temporal window for capturing distinct cropland signatures, making it challenging to differentiate cropland from surrounding natural vegetation or fallow land.
Finally, the differing definitions of cropland among the five datasets (Table 1) introduce an additional source of uncertainty in the accuracy and consistency assessment. For instance, land categories such as orchards, greenhouses, cultivated pastures, and fallow land may be included in some datasets but excluded in others. These inconsistencies in classification logic may result in spatial mismatches even when the underlying land use is similar. While we used the definition from the Third National Land Survey of China as a consistent validation benchmark, readers should be aware that part of the observed disagreement between datasets may stem from these semantic differences rather than purely from classification error. Future research could benefit from developing standardized or harmonized cropland definitions, especially when integrating multi-source land-cover products for ecological and agricultural monitoring. Furthermore, the cropland landscape within the TP is highly fragmented, and embankments or footpaths between crop fields have become crucial factors in overestimating cropland areas in 30 m resolution datasets. In summary, although thematic cropland datasets generally outperform LULC datasets, understanding the potential influencing factors is crucial for accurately assessing and interpreting cropland data in the TP.
4.2. Advantages and Limitations of the SEM
This study utilized SEM to quantitatively assess the effects of terrain, climate, population, and vegetation indices on the consistency of cropland datasets. Using SEM, this study offers a more comprehensive understanding of the underlying mechanisms contributing to the uncertainty of cropland datasets compared to traditional regression analysis [46]. Moreover, this study introduces a hypothetical path model that enables a more comprehensive analysis of each factor than previous studies [25,26,31]. Notably, the influential vegetation index NDVI is used as a mediator to investigate the direct and indirect effects of each element on cropland consistency, considering its significance in cropland and crop classification.
In this study, six elements (elevation, slope, air temperature, precipitation, population, and NDVI) were selected to construct SEMs. First, topographic elements (elevation and slope) are important for the distribution of croplands, and humans usually carry out agricultural production in flat regions. Agricultural production is also affected by elevation, which is more prominent on the TP. Second, climatic elements (temperature and precipitation) affect the hydrothermal conditions within a region, which in turn affects the growth conditions of the crops. Furthermore, most of the cropland datasets were mapped using NDVI as the base data. NDVI has a significant impact on the accuracy of cropland datasets, which in turn affects cropland consistency. Topographic and climatic elements also affect NDVI; therefore, the SEMs were constructed using NDVI as a mediating element. Finally, according to the hypothesis, agricultural production as a human activity and the distribution of croplands should be related to population density. However, the modeling results showed that the correlation between cropland consistency, NDVI, and population density was weak. This may be related to the sparse population of the TP, where the population density in agricultural production areas is equal and does not fluctuate significantly.
However, it is essential to acknowledge the limitations of SEM. Prior hypotheses in the path model simplify complex situations [47], and limitations in data acquisition further contribute to these simplifications. SEM captures only linear relationships among variables, whereas the relationships between elements and consistency may not be strictly linear. This linear assumption is a significant limitation, as natural environments like the Tibetan Plateau often exhibit nonlinear dynamics—such as threshold effects where elevation or precipitation abruptly alters cropland consistency— which SEM cannot adequately capture. Additionally, this study did not account for potential interactions among the variables. For instance, terrain impacts climate; thus, the consistency of cropland and terrain and climate are pivotal factors that influence population clustering. Consequently, future studies should refine the path model by considering more detailed relationships among variables and their interactions.
4.3. Implications for Future Research and Dataset Application
Accurately mapping croplands on the TP presents significant challenges because of its diverse terrain, high fragmentation, and varying climatic conditions. The complex topography and smallholder farming practices of the region contribute to mixed pixels and classification uncertainties. Additionally, the limited availability of high-quality ground truth data hampers the thorough validation of mapping products at the regional level.
Despite these challenges, advancements in satellite technology and machine learning offer promising avenues for enhancing the accuracy of cropland mapping. Increasing spatial resolution through satellites such as Landsat and Sentinel, coupled with machine learning and segmentation algorithms, can mitigate issues related to mixed pixels and improve mapping precision, particularly in fragmented areas. The integration of collaborative mapping methods among existing cropland datasets holds promise for improving cropland mapping on the TP [48]. Collaborative mapping can overcome the limitations and uncertainties associated with single-source datasets by combining the strengths of individual datasets and leveraging their complementary information. Leveraging crowdsourcing platforms for data collection validation and employing consistency analysis among datasets can further enhance mapping reliability [49]. Integrating multi-source data and refining mapping algorithms will be crucial for future research to produce more accurate and comprehensive cropland maps of the TP.
Moreover, the results of this study offer practical guidance for dataset selection based on specific application contexts. For instance, when evaluating the effectiveness of nature reserves by analyzing changes in cropland extent within their boundaries, GLAD may be the most suitable dataset due to its high spatial accuracy and strong agreement with statistical cropland areas, especially in high-altitude zones. Conversely, for monitoring large-scale land-use changes in relatively flat regions, GLC can be considered due to its higher completeness and better performance in continuous cropland mapping. These findings enable more informed use of cropland products for conservation planning, policy evaluation, and environmental monitoring in the TP.
5. Conclusions
The TP, which serves as a crucial agricultural and pastoral region and an ecological barrier in China, emphasizes the significance of accurately assessing cropland datasets. This study aimed to evaluate the accuracy and performance of five cropland datasets (CLCD, GLC, CNLUCC, GLAD, and GLC_FCS) for the TP in 2020. The spatial consistency of these datasets was quantitatively and visually assessed, and the influences of terrain, climate, population, and vegetation indices on cropland consistency were investigated. Compared to county-level statistical data from the national land survey, the cropland area estimated by the GLAD dataset exhibited the highest level of agreement. Although the GLC and CNLUCC overestimated the cropland area across the entire region, the CLCD and GLC_FCS slightly underestimated it at high elevations. Spatial accuracy assessments indicate that GLC and GLAD exhibited the highest accuracy, followed by CLCD and GLC_FCS, whereas CNLUCC demonstrated the lowest accuracy. GLC and CNLUCC displayed large commission errors on the TP, whereas CLCD and GLC_FCS exhibited large omission errors in the high-altitude regions. Cropland consistency exhibited substantial variations across climatic zones and elevation ranges, indicating significant regional disparities. The results of SEM analysis revealed that elevation and slope were negatively correlated with cropland consistency. Moreover, temperature and precipitation indirectly affected cropland consistency through their influence on vegetation indices. Considering these factors, this study provides a comprehensive evaluation of cropland dataset accuracy on the TP, serving as a valuable reference for selecting appropriate cropland datasets and facilitating cropland mapping endeavors in the region.
Author Contributions
Conceptualization, F.Z.; methodology, F.Z.; software, F.Z.; validation, F.Z.; formal analysis, F.Z.; investigation, F.Z.; resources, X.W.; data curation, F.Z. and X.W.; writing—original draft preparation, F.Z. and X.W.; writing—review and editing, F.Z. and X.W.; visualization, F.Z.; supervision, X.W., X.L. and L.X.; project administration, X.W., X.L. and L.X.; funding acquisition, X.W., X.L. and L.X. All authors have read and agreed to the published version of the manuscript.
Funding
This research was funded by the Second Tibetan Plateau Scientific Expedition and Research (2019QZKK0603) and the National Natural Science Foundation of China (42361144881 and W2412128).
Data Availability Statement
The CLCD dataset is available at https://zenodo.org/records/4417810 (accessed on 2 May 2023). The GLC dataset is available at https://www.ngcc.cn/zdchgc/qqdbfg (accessed on 4 May 2023). The CNLUCC dataset is available at https://www.resdc.cn (accessed on 5 May 2023). The GLAD dataset is available at https://glad.umd.edu/dataset/croplands (accessed on 7 May 2023). The GLC_FCS dataset is available at https://zenodo.org/records/3986872 (accessed on 9 May 2023).
Conflicts of Interest
The authors declare that they do not have any commercial or associative interests that represent a conflict of interest in connection with the work submitted.
References
- Li, X.-Y.; Li, X.; Fan, Z.; Mi, L.; Kandakji, T.; Song, Z.; Li, D.; Song, X.-P. Civil war hinders crop production and threatens food security in Syria. Nat. Food 2022, 3, 38–46. [Google Scholar] [CrossRef] [PubMed]
- Ding, R.; Shi, W.; Lu Ch Lu, H.; Shi, X.; Deng, X.; Cui, J. Future unbalanced-trends of grain supply and demand on the Tibetan Plateau. J. Clean. Prod. 2022, 367, 132993. [Google Scholar]
- Yu, L.; Liu, S.; Wang, F.; Liu, Y.; Li, M.; Wang, Q.; Dong, S.; Zhao, W.; Tran, L.-S.P.; Sun, Y.; et al. Effects of agricultural activities on energy-carbon-water nexus of the Qinghai-Tibet Plateau. J. Clean. Prod. 2022, 331, 129995. [Google Scholar] [CrossRef]
- Zhang, Y.; Cai, X.; Lv, J. Size and dynamics of soil organic carbon stock in cropland of the Eastern Qinghai-Tibetan Plateau. Agric. Ecosyst. Environ. 2016, 222, 125–132. [Google Scholar] [CrossRef]
- Guan, Z.-H.; Li, X.G.; Wang, L.; Mou, X.M.; Kuzyakov, Y. Conversion of Tibetan grasslands to croplands decreases accumulation of microbially synthesized compounds in soil. Soil Biol. Biochem. 2018, 123, 10–20. [Google Scholar] [CrossRef]
- Song, D.; Tang, X.; Tariq, A.; Pan, K.; Li, D. Regional distribution and migration potential of antibiotic resistance genes in croplands of Qinghai Tibet Plateau. Environ. Res. 2023, 231, 116233. [Google Scholar] [CrossRef]
- Wang, Y.; Cheng, H. Soil heavy metal(loid) pollution and health risk assessment of farmlands developed on two different terrains on the Tibetan Plateau, China. Chemosphere 2023, 335, 139148. [Google Scholar] [CrossRef]
- Wang, T.; Qu, L.; Luo, D.; Ji, X.; Ma, Z.; Wang, Z.; Dahlgren, R.A.; Zhang, M.; Shang, X. Microplastic pollution characteristics and its future perspectives in the Tibetan Plateau. J. Hazard. Mater. 2023, 457, 131711. [Google Scholar] [CrossRef]
- Lang, M.; Wang, G.; Yang, Y.; Zhu, W.; Zhang, Y.; Ouyang, Z.; Guo, X. The occurrence and effect of altitude on microplastics distribution in agricultural soils of Qinghai Province, northwest China. Sci. Total Environ. 2022, 810, 152174. [Google Scholar] [CrossRef]
- Mao, G.; Duan, X.; Niu, Z.; Xu, J.; Xiao, X.; Huang, X.; Chen, H.; Mehr, F.; Moti, R.; Qiao, Z. Application of source-sink theory and MCR model to assess hydrochemical change risk in Lhasa River basin, Tibet, China. Environ. Impact Assess. Rev. 2023, 101, 107124. [Google Scholar] [CrossRef]
- Li, Y.; Allan Degen, A.; Sun, T.; Wang, W.; Bai, Y.; Zhang, T.; Long, R.; Shang, Z. Three years of cultivating or fencing lands have different impacts on soil nutrients and properties of a subalpine meadow in the Tibetan plateau. Catena 2020, 186, 104306. [Google Scholar] [CrossRef]
- Oliphant, A.J.; Thenkabail, P.S.; Teluguntla, P.; Xiong, J.; Gumma, M.K.; Congalton, R.G.; Yadav, K. Mapping cropland extent of Southeast and Northeast Asia using multi-year time-series Landsat 30-m data using a random forest classifier on the Google Earth Engine Cloud. Int. J. Appl. Earth Obs. Geoinf. 2019, 81, 110–124. [Google Scholar] [CrossRef]
- Qiu, B.; Lin, D.; Chen, C.; Yang, P.; Tang, Z.; Jin, Z.; Ye, Z.; Zhu, X.; Duan, M.; Huang, H.; et al. From cropland to cropped field: A robust algorithm for national-scale mapping by fusing time series of Sentinel-1 and Sentinel-2. Int. J. Appl. Earth Obs. Geoinf. 2022, 113, 103006. [Google Scholar] [CrossRef]
- Zhang, C.; Dong, J.; Xie, Y.; Zhang, X.; Ge, Q. Mapping irrigated croplands in China using a synergetic training sample generating method, machine learning classifier, and Google Earth Engine. Int. J. Appl. Earth Obs. Geoinf. 2022, 112, 102888. [Google Scholar] [CrossRef]
- Zhang, C.; Dong, J.; Ge, Q. Quantifying the accuracies of six 30-m cropland datasets over China: A comparison and evaluation analysis. Comput. Electron. Agric. 2022, 197, 106946. [Google Scholar] [CrossRef]
- Yang, J.; Huang, X. The 30 m annual land cover dataset and its dynamics in China from 1990 to 2019. Earth Syst. Sci. Data Discuss. 2021, 13, 3907–3925. [Google Scholar] [CrossRef]
- Chen, J.; Chen, J.; Liao, A.; Cao, X.; Chen, L.; Chen, X.; He, C.; Han, G.; Peng, S.; Lu, M.; et al. Global land cover mapping at 30m resolution: A POK-based operational approach. ISPRS J. Photogramm. Remote Sens. 2015, 103, 7–27. [Google Scholar] [CrossRef]
- Potapov, P.; Turubanova, S.; Hansen, M.C.; Tyukavina, A.; Zalles, V.; Khan, A.; Song, X.P.; Pickens, A.; Shen, Q.; Cortez, J. Global maps of cropland extent and change show accelerated cropland expansion in the twenty-first century. Nat. Food 2022, 3, 19–28. [Google Scholar] [CrossRef]
- Zhang, X.; Liu, L.; Chen, X.; Gao, Y.; Xie, S.; Mi, J. GLC_FCS30: Global land-cover product with fine classification system at 30 m using time-series Landsat imagery. Earth Syst. Sci. Data Discuss. 2021, 13, 2753–2776. [Google Scholar] [CrossRef]
- Gong, P.; Wang, J.; Yu, L.; Zhao, Y.; Zhao, Y.; Liang, L.; Niu, Z.; Huang, X.; Fu, H.; Liu, S.; et al. Finer resolution observation and monitoring of global land cover: First mapping results with Landsat TM and ETM+ data. Int. J. Remote Sens. 2012, 34, 2607–2654. [Google Scholar] [CrossRef]
- Thenkabail, P.S.; Geological Survey (USA). Global Cropland-Extent Product at 30-M Resolution (Gcep30) Derived from Landsat Satellite Time-Series Data for the Year 2015 Using Multiple Machine-Learning Algorithms on Google Earth Engine Cloud; USA Department of the Interior; USA Geological Survey: Reston, VA, USA, 2021. [Google Scholar]
- Perez-Hoyos, A.; Udias, A.; Rembold, F. Integrating multiple land cover maps through a multi-criteria analysis to improve agricultural monitoring in Africa. Int. J. Appl. Earth Obs. Geoinf. 2020, 88, 102064. [Google Scholar] [CrossRef] [PubMed]
- An, X.; Jin, W.; Zhang, H.; Liu, Y.; Zhang, M. Analysis of long-term wetland variations in China using land use/land cover dataset derived from Landsat images. Ecol. Indic. 2022, 145, 109689. [Google Scholar] [CrossRef]
- Vilar, L.; Garrido, J.; Echavarría, P.; Martínez-Vega, J.; Martín, M.P. Comparative analysis of CORINE and climate change initiative land cover maps in Europe: Implications for wildfire occurrence estimation at regional and local scales. Int. J. Appl. Earth Obs. Geoinf. 2019, 78, 102–117. [Google Scholar] [CrossRef]
- Nabil, M.; Zhang, M.; Bofana, J.; Wu, B.; Stein, A.; Dong, T.; Zeng, H.; Shang, J. Assessing factors impacting the spatial discrepancy of remote sensing based cropland products: A case study in Africa. Int. J. Appl. Earth Obs. Geoinf. 2020, 85, 102010. [Google Scholar] [CrossRef]
- Wei, Y.; Lu, M.; Wu, W.; Ru, Y. Multiple factors influence the consistency of cropland datasets in Africa. Int. J. Appl. Earth Obs. Geoinf. 2020, 89, 102087. [Google Scholar] [CrossRef]
- Cai, L.; Wang, S.; Jia, L.; Wang, Y.; Wang, H.; Fan, D.; Zhao, L. Consistency Assessments of the Land Cover Products on the Tibetan Plateau. IEEE J. Sel. Top. Appl. Earth Obs. Remote Sens. 2022, 15, 5652–5661. [Google Scholar] [CrossRef]
- Herold, M.; Mayaux, P.; Woodcock, C.E.; Baccini, A.; Schmullius, C. Some challenges in global land cover mapping: An assessment of agreement and accuracy in existing 1 km datasets. Remote Sens. Environ. 2008, 112, 2538–2556. [Google Scholar] [CrossRef]
- Lu, M.; Wu, W.; Zhang, L.; Liao, A.; Peng, S.; Tang, H. A comparative analysis of five global cropland datasets in China. Sci. China Earth Sci. 2016, 59, 2307–2317. [Google Scholar] [CrossRef]
- Pérez-Hoyos, A.; Rembold, F.; Kerdiles, H.; Gallego, J. Comparison of Global Land Cover Datasets for Cropland Monitoring. Remote Sens. 2017, 9, 1118. [Google Scholar] [CrossRef]
- Xue, J.; Zhang, X.; Chen, S.; Hu, B.; Wang, N.; Shi, Z. Quantifying the agreement and accuracy characteristics of four satellite-based LULC products for cropland classification in China. J. Integr. Agric. 2023, 23, 283–297. [Google Scholar] [CrossRef]
- Liu, J.; Kuang, W.; Zhang, Z.; Xu, X.; Qin, Y.; Ning, J.; Zhou, W.; Zhang, S.; Li, R.; Yan, C.; et al. Spatiotemporal characteristics, patterns, and causes of land-use changes in China since the late 1980s. J. Geogr. Sci. 2014, 24, 195–210. [Google Scholar] [CrossRef]
- Wang, X.; Zhang, Y.; Wu, X.; Zheng, D.; Wang, Z.; Yan, J.; Liu, L.; Zhang, B.; Zhao, Z.; Bai, W.; et al. Spatial and temporal characteristics of land use and cover changes in the Tibetan Plateau. Chin. Sci. Bull. 2019, 64, 2865–2875. [Google Scholar] [CrossRef]
- Ge, Q.; Bian, J.; Zheng, J.; Liao, Y.; Hao, Z.; Yin, Y. The climate regionalization in China for 1981–2010. Chin. Sci. Bull. 2013, 58, 3088–3099. [Google Scholar] [CrossRef]
- Jarvis, A.; Reuter, H.I.; Nelson, A.; Guevara, E. Hole-Filled SRTM for the Globe Version 4, Available from the CGIAR-CSI SRTM 90m Database. 2008. Available online: https://srtm.csi.cgiar.org (accessed on 23 May 2023).
- Wan, Z.; Hook, S.; Hulley, G. MOD11A2 MODIS/Terra Land Surface Temperature/Emissivity 8-Day L3 Global 1 km SIN Grid V006; NASA EOSDIS Land Processes DAAC: Sioux Falls, SD, USA, 2015. [Google Scholar] [CrossRef]
- Funk, C.; Peterson, P.; Landsfeld, M.; Pedreros, D.; Verdin, J.; Shukla, S.; Husak, G.; Rowland, J.; Harrison, L.; Hoell, A.; et al. The climate hazards infrared precipitation with stations--a new environmental record for monitoring extremes. Sci. Data 2015, 2, 150066. [Google Scholar] [CrossRef]
- Center for International Earth Science Information Network-CIESIN—Columbia University. Gridded Population of the World, Version 4 (GPWv4): Population Density, Revision 11; NASA Socioeconomic Data and Applications Center (SEDAC): Palisades, NY, USA, 2018. [Google Scholar] [CrossRef]
- Longepe, N.; Thibaut, P.; Vadaine, R.; Poisson, J.-C.; Guillot, A.; Boy, F.; Picot, N.; Borde, F. Comparative Evaluation of Sea Ice Lead Detection Based on SAR Imagery and Altimeter Data. IEEE Trans. Geosci. Remote Sens. 2019, 57, 4050–4061. [Google Scholar] [CrossRef]
- Chicco, D.; Jurman, G. The advantages of the Matthews correlation coefficient (MCC) over F1 score and accuracy in binary classification evaluation. BMC Genom. 2020, 21, 6. [Google Scholar] [CrossRef]
- Chicco, D.; Warrens, M.J.; Jurman, G. The Matthews correlation coefficient (MCC) is more informative than Cohen’s Kappa and Brier score in binary classification assessment. IEEE Access 2021, 9, 78368–78381. [Google Scholar] [CrossRef]
- Uhl, J.H.; Leyk, S. A scale-sensitive framework for the spatially explicit accuracy assessment of binary built-up surface layers. Remote Sens. Environ. 2022, 279, 113117. [Google Scholar] [CrossRef]
- Grace, J.B. Structural Equation Modeling and Natural Systems; Cambridge University Press: Cambridge, UK; New York, NY, USA, 2006. [Google Scholar]
- Yang, L.; Shen, F.; Zhang, L.; Cai, Y.; Yi, F.; Zhou, C. Quantifying influences of natural and anthropogenic factors on vegetation changes using structural equation modeling: A case study in Jiangsu Province, China. J. Clean. Prod. 2021, 280, 124330. [Google Scholar] [CrossRef]
- Yang, C.; Zhao, S. Diverse seasonal hysteresis of surface urban heat islands across Chinese cities: Patterns and drivers. Remote Sens. Environ. 2023, 294, 113644. [Google Scholar] [CrossRef]
- Van Acker, V.; Witlox, F. Car ownership as a mediating variable in car travel behaviour research using a structural equation modelling approach to identify its dual relationship. J. Transp. Geogr. 2010, 18, 65–74. [Google Scholar] [CrossRef]
- Hu, R.; Wang, Y.; Chang, J.; Istanbulluoglu, E.; Guo, A.; Meng, X.; Li, Z.; He, B.; Zhao, Y. Coupling water cycle processes with water demand routes of vegetation using a cascade causal modeling approach in arid inland basins. Sci. Total Environ. 2022, 840, 156492. [Google Scholar] [CrossRef] [PubMed]
- Liu, X.; Jin, X.; Luo, X.; Zhou, Y. Identifying and quantifying local uncertainty and discrepancy in the comparison of global cropland extent through a synergistic approach. Appl. Geogr. 2024, 162, 103–164. [Google Scholar] [CrossRef]
- Fritz, S.; McCallum, I.; Schill, C.; Perger, C.; See, L.; Schepaschenko, D.; van der Velde, M.; Kraxner, F.; Obersteiner, M. Geo-Wiki: An online platform for improving global land cover. Environ. Model. Softw. 2012, 31, 110–123. [Google Scholar] [CrossRef]
Disclaimer/Publisher’s Note: The statements, opinions and data contained in all publications are solely those of the individual author(s) and contributor(s) and not of MDPI and/or the editor(s). MDPI and/or the editor(s) disclaim responsibility for any injury to people or property resulting from any ideas, methods, instructions or products referred to in the content. |
© 2025 by the authors. Licensee MDPI, Basel, Switzerland. This article is an open access article distributed under the terms and conditions of the Creative Commons Attribution (CC BY) license (https://creativecommons.org/licenses/by/4.0/).