1. Introduction
Remote sensing (RS) image change detection (CD) is a technique aimed at analyzing whether and what kind of changes exist between images acquired from the same area at different times [
1]. As a research hotspot in the field of RS, change detection has experienced continuous development and progress. It is widely applied in various practical scenarios, such as post-disaster assessment [
2], environmental monitoring [
3], and land resource management [
4]. With the ongoing evolution of RS technology, the data sources for change detection have become increasingly diverse. High-resolution RS images provide rich surface details, facilitating fine-grained change detection, and have gradually become the primary data source for change detection.
Early change detection methods primarily rely on extracting, analyzing, and comparing the spectral or spatial information of corresponding pixels in bi-temporal images, which roughly include algebra-based methods, image transformation methods, and post-classification methods. Algebra-based methods calculate the spectral differences of the same pixels in bi-temporal images through algebraic operations to generate a change intensity map, followed by threshold segmentation algorithms to obtain the change results. The common ones are image difference (ID) [
5], image ratio (IR) [
6], and change vector analysis (CVA) [
7]. These methods only extract shallow spectral information, making it challenging to analyze the complex spectral features. Image transformation methods analyze and compare bi-temporal images by transforming them into a common higher-dimensional feature space. Examples include principal component analysis (PCA) [
8], multivariate alteration detection (MAD) [
9], and slow feature analysis (SFA) [
10]. This category of methods utilizes deep spectral information for change detection and improves the detection accuracy. Post-classification methods classify land cover in different temporal images separately and then compare the differences to detect changes. Examples include support vector machines (SVMs) [
11] and random forests (RFs) [
12]. These methods can mitigate changes due to varying environmental conditions during imaging, but the detection performance is significantly influenced by classification accuracy. The aforementioned early change detection methods often require manually designed feature extractors, making it challenging to exploit deep, high-dimensional features in images and greatly limiting the development of change detection.
In recent years, deep learning (DL) has undergone significant development. It has achieved great success in multiple research fields in computer vision, including classification [
13], object detection [
14], semantic segmentation [
15], medical diagnosis [
16], and so on. Its excellent feature representation capabilities and high level of automation have attracted significant attention from researchers in the field of CD. A series of DL-based change detection methods have been proposed to improve the performance of change detection. In terms of feature extraction and fusion, these methods can be roughly categorized into the following three types: Early Fusion (EF), Siamese, and Triplet. The EF structure first fuses bi-temporal images through methods such as differencing or concatenation and then inputs them into a feature extraction network for feature analysis and change detection, e.g., a fully convolutional network (FCN) [
17] and UNet [
18]. This structure is simple and easy to implement, but its major drawback lies in the pre-fusion of images before inputting them into the network, disrupting the semantic information of different temporal phases and making it difficult to distinguish pseudo-changes caused by varying external factors. The Siamese structure employs two sub-networks to independently extract features from different temporal images and performs feature fusion and analysis during this process. The sub-networks are commonly composed of a convolutional neural network (CNN) [
19,
20] or a vision transformer (ViT) [
21,
22,
23]. This structure greatly retains the geospatial features of the original images for difference analysis but may lack emphasis on change features. The Triplet structure [
24] enhances the identification of change areas by extracting features from three branches, analyzing both the geospatial features of the original images and their fused features. Such a comprehensive analysis significantly improves the performance of change detection. However, current change detection methods still face challenges in accurately discerning change area boundaries, leading to a considerable amount of misdetections and omissions.
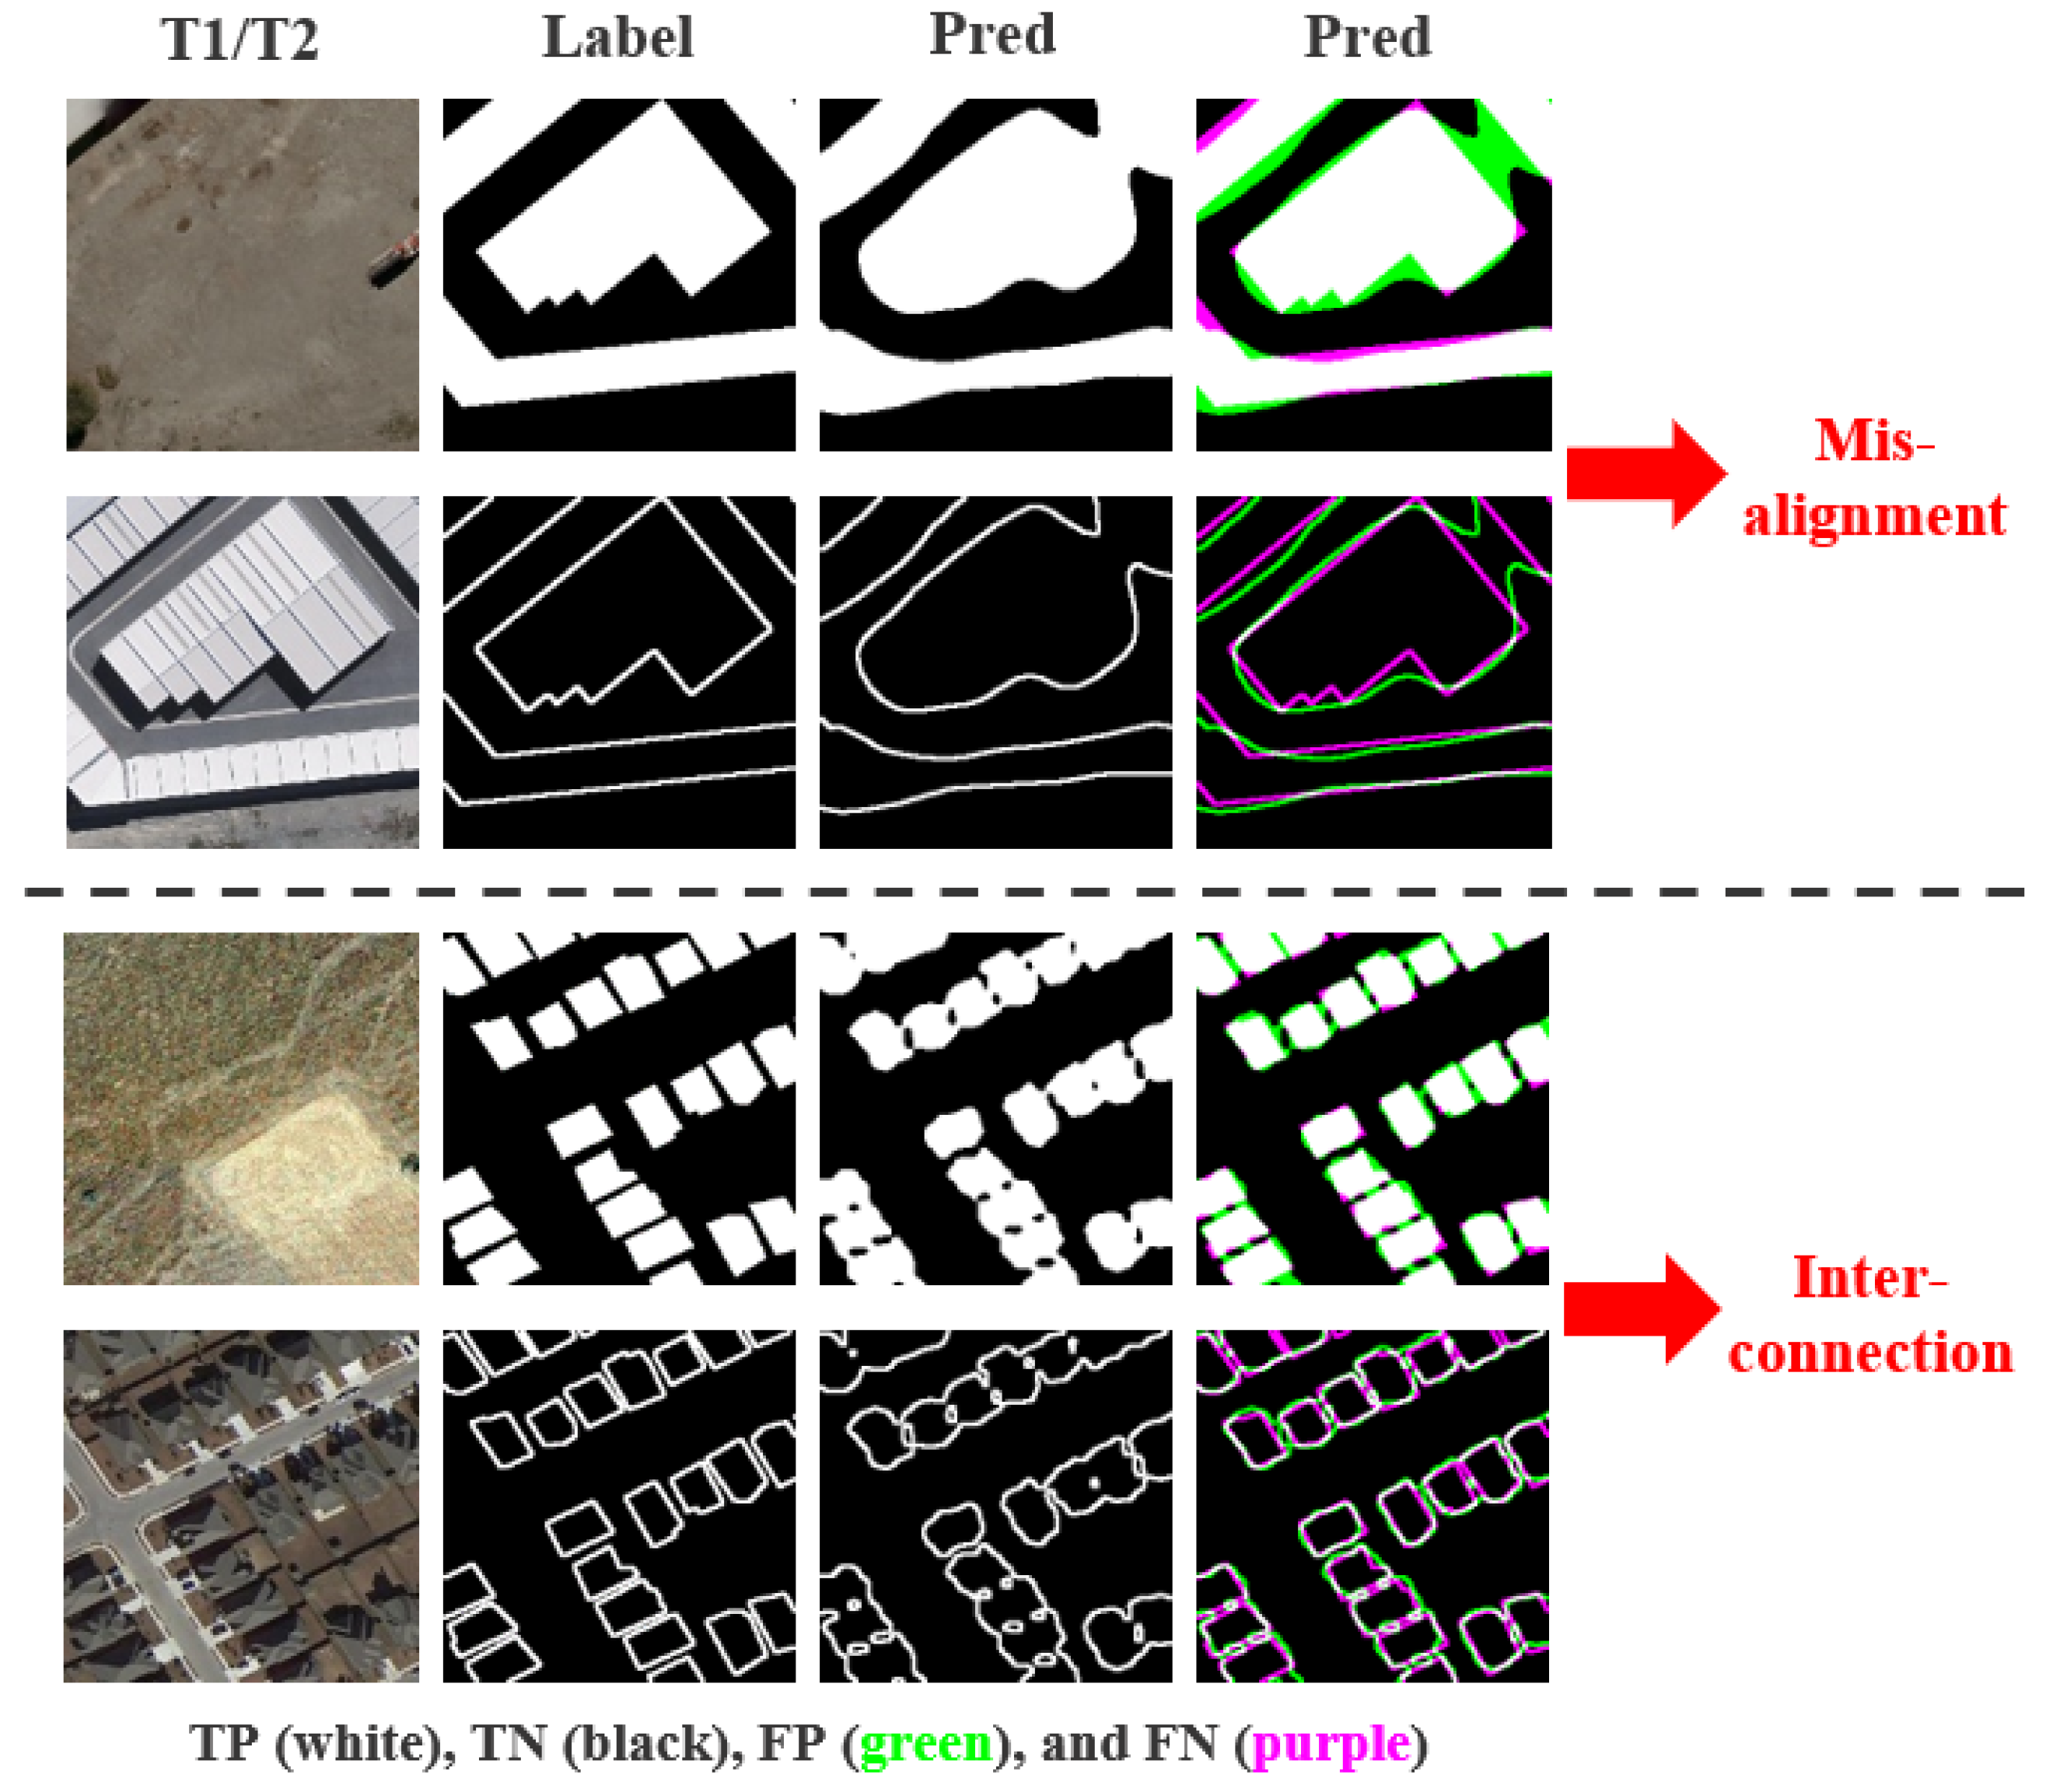
Although existing change detection methods have shown satisfactory performance, there is still room for improvement. Accurately discriminating the edge details of change areas remains challenging. As shown in
Figure 1, the boundaries of large change areas exhibit misalignment, and the boundaries of small change targets tend to become interconnected. Possible reasons for these challenges include insufficient focus on change features and a lack of constraints on the boundaries between change areas and the background. Additionally, during the commonly used pooling process in feature extraction, regional information may be smoothed or blurred, leading to distortion in data distribution and, subsequently, affecting boundary discrimination. Accurately discriminating the boundaries between change areas and the background contributes to improving the overall effectiveness of change detection tasks. Such improvement is essential for addressing more complex application scenarios.
To address the aforementioned issues, this paper proposes a novel change detection network, LRNet, based on a strategy that involves localization (detecting change areas) followed by refinement (detecting change edges). In the localization stage, a three-branch encoder simultaneously extracts original image features and their differential features, while allowing interaction among the branches to localize the position of each change area. To minimize information loss during feature extraction, learnable optimal pooling (LOP) is proposed as a replacement for the widely used max pooling. Additionally, LOP is trainable and participates in the overall optimization of the network. To effectively integrate features from different branches and accurately localize change areas of various sizes, we propose the change alignment attention (C2A) mechanism and the hierarchical change alignment (HCA) module. C2A is employed to integrate change features from different branches, enhancing attention to change areas in a more targeted manner, reducing focus on the background, and generating the change alignment attention map (C2AM). These enhanced features are then skip-connected to the corresponding level in the refinement stage to assist in the discrimination of change area edges. HCA hierarchically propagates C2AM in a densely connected manner to subsequent levels, aiding in the comprehensive discrimination of attention weights at different granularities. This ensures that attention maps generated for deep features are more representative and global, facilitating the accurate discrimination of change areas. In the refinement stage, the proposed edge-area alignment module (E2A) corrects change areas and change edges of the localization results, providing a good start for subsequent edge refinement. Then, the decoder, combined with the C2A-enhanced differential features from the localization stage, refines the change areas of different sizes and their edges. To address sample imbalance, this paper adopts a hybrid loss function combining binary cross-entropy (BCE) and intersection over union (IoU) for supervised training optimization. Finally, we obtain results with accurate discrimination of change areas and boundaries. The main contributions of this paper include the following points:
A novel change detection network, LRNet, is proposed based on a localization-then-refinement strategy to address the issue of edge discrimination. The learnable optimal pooling (LOP) is proposed as a replacement for max pooling in feature extraction, aiming to reduce information loss and participate in network optimization.
Change alignment attention (C2A) is proposed to integrate features from different branches in a more reasonable way, enhancing attention to change areas. Additionally, a hierarchical change alignment module (HCA) is proposed to hierarchically propagate the change alignment attention map (C2AM) in a densely connected manner to different levels, aiding in the accurate localization of change areas of various sizes.
The edge-area alignment module (E2A) is proposed to constrain change areas and change edges of the localization results. A hybrid loss of binary cross-entropy (BCE) and intersection over union is adopted for supervised training to optimize the network.
The remainder of this paper is organized as follows.
Section 2 introduces the related work.
Section 3 presents the proposed methodology in detail.
Section 4 analyzes and discusses the experimental results.
Section 5 concludes this paper.
3. Methodology
3.1. Framework Overview
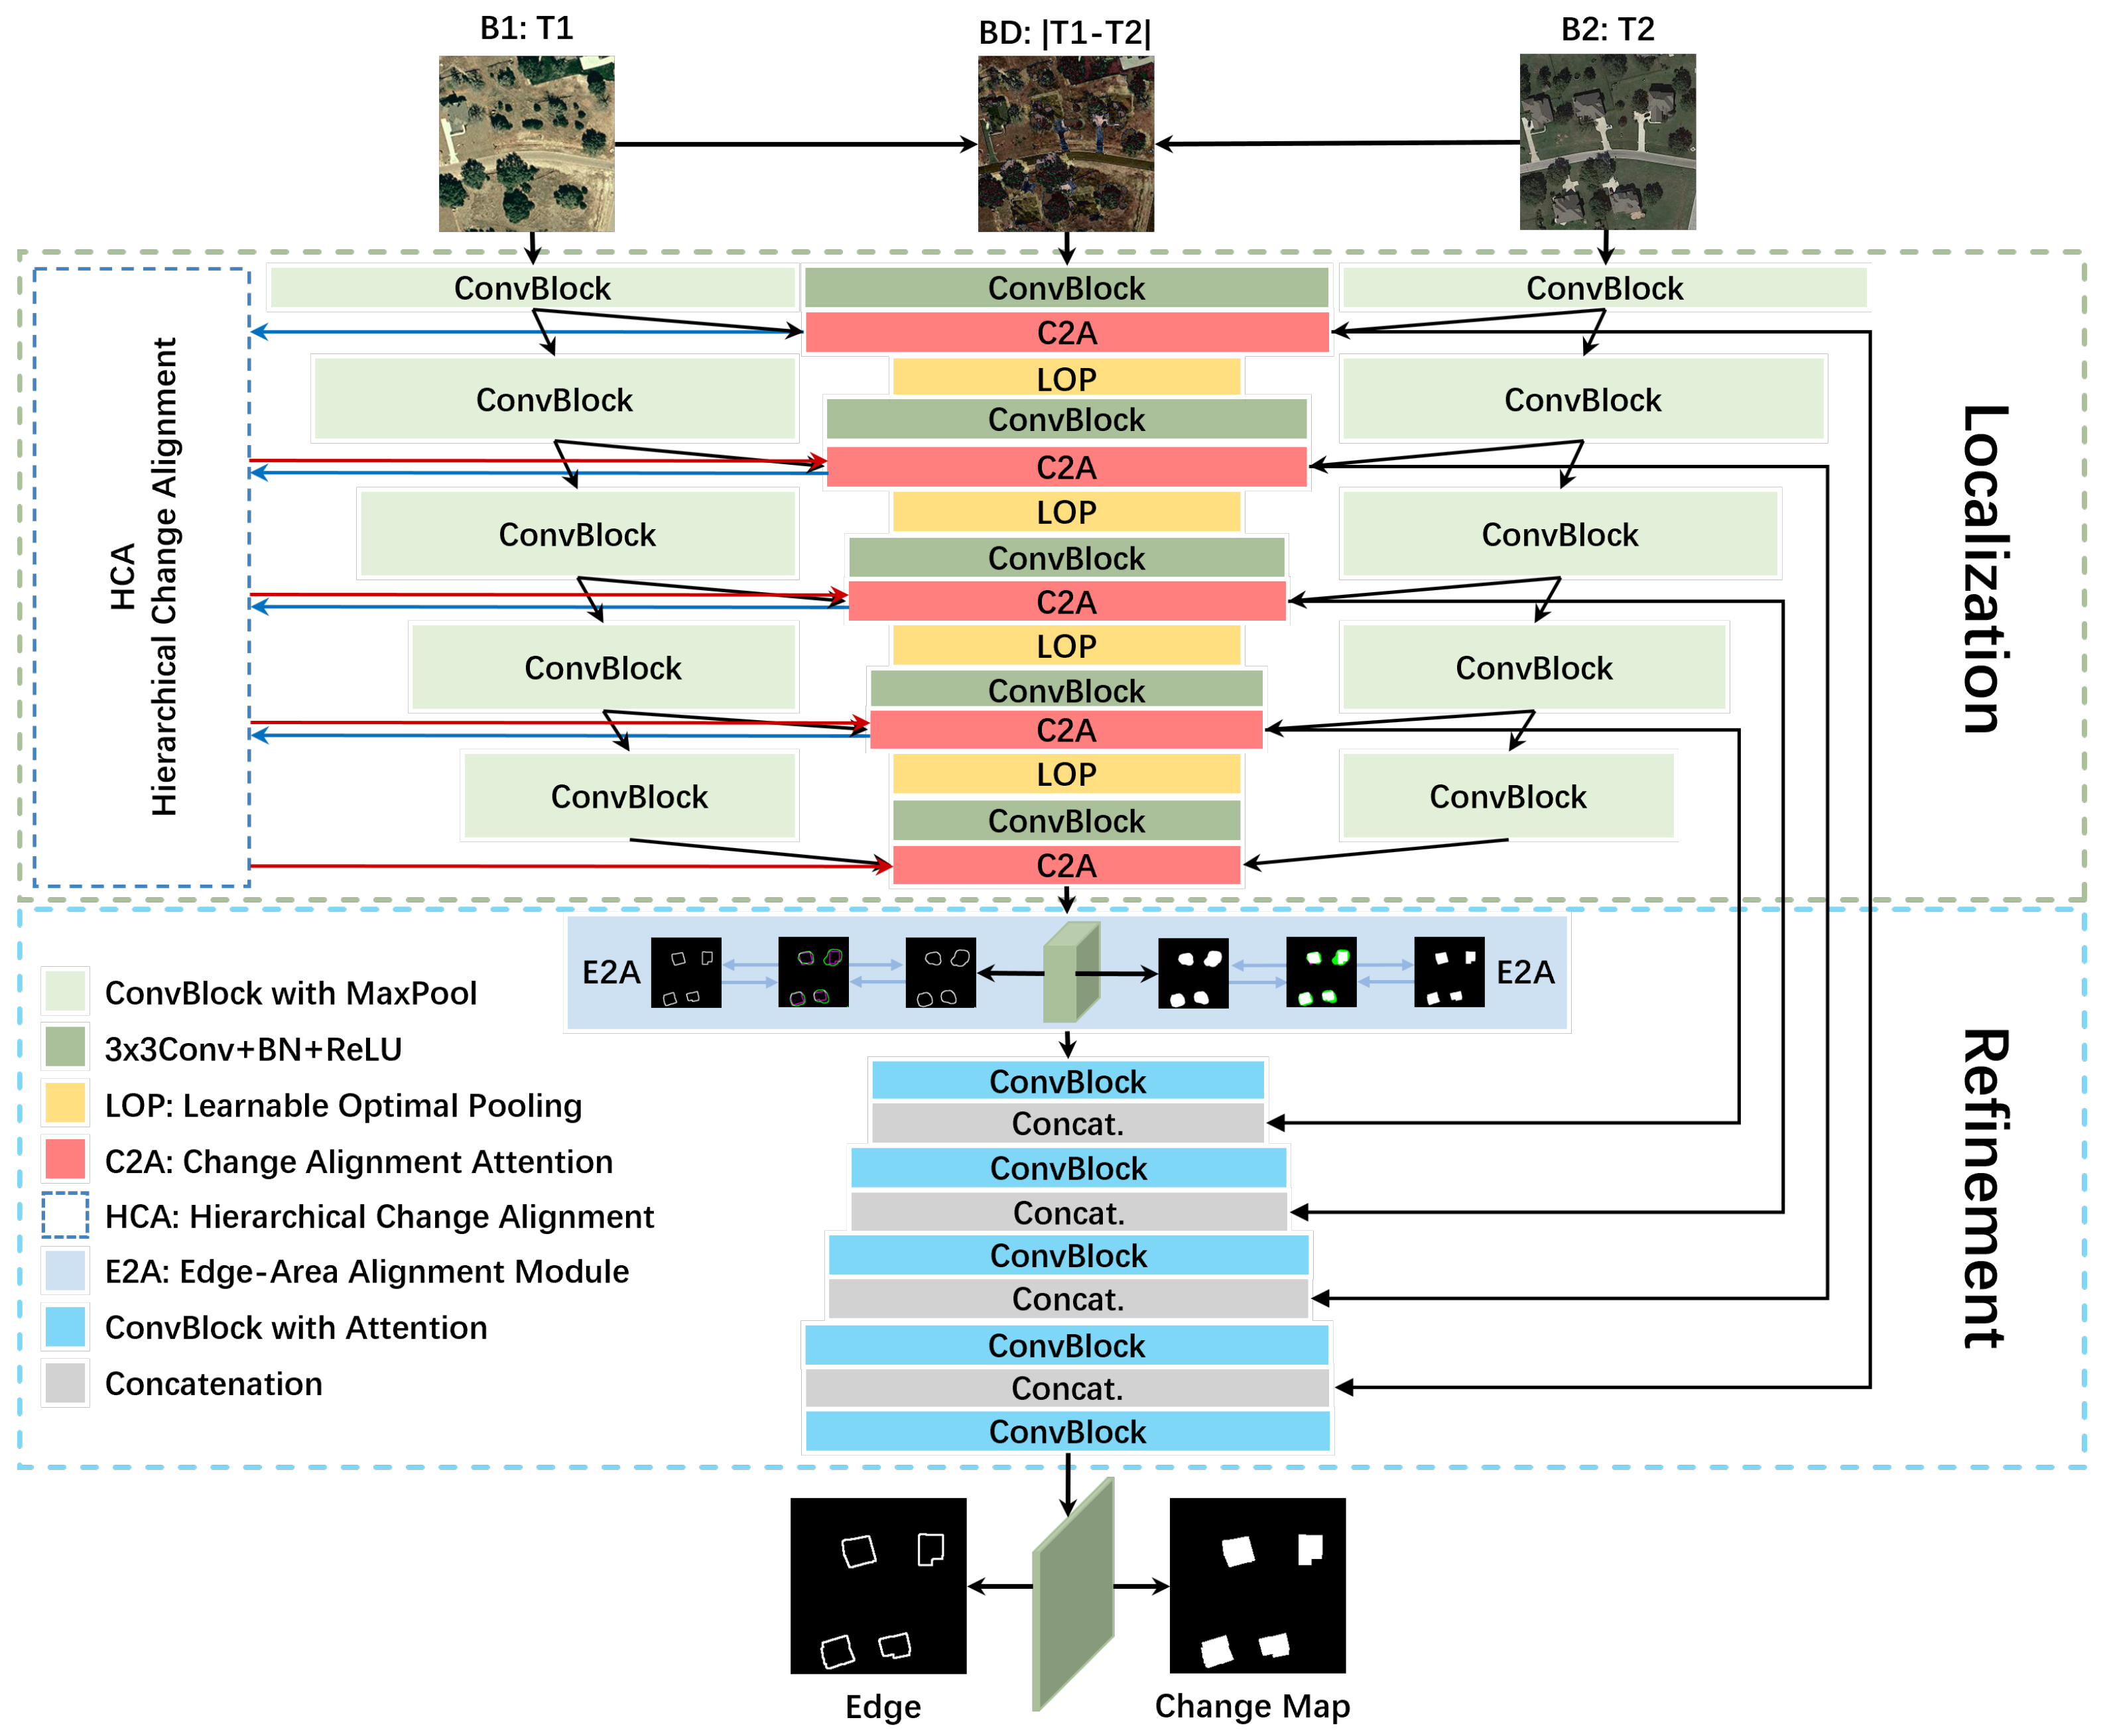
The proposed change detection network, LRNet, as illustrated in
Figure 2, consists of the following stages: localization and refinement.
The localization stage involves a three-branch encoder that simultaneously extracts features from the original bi-temporal images and their differences, then integrates these features to pinpoint the location of each change area. The three branches are denoted as B1, B2, and BD. B1 and B2 use a pre-trained VGG16 network from ImageNet to extract features from the original images, while BD employs learnable optimal pooling (LOP) to replace max pooling in VGG16 as the backbone for difference feature extraction. LOP reduces information loss during feature extraction and contributes to the optimization of the entire network, as detailed in
Section 3.2. Let
,
, and
represent the inputs to branches B1, B2, and BD, respectively, where
and
are the original bi-temporal images.
is the difference image, and the relationship between
and
is described in Equation (
1).
Each branch consists of five convolutional blocks, each comprising several convolution layers, batch normalization layers, and ReLU layers. Branches B1 and B2 also include max-pooling layers. The output of the
y-th (
) convolutional block in branch B
is denoted as
. After each convolutional block, we utilize the proposed change alignment attention (C2A) and hierarchical change alignment (HCA) modules to integrate features from different branches, thereby accurately localizing change areas of different sizes. The feature transformation in C2A is described in Equation (
2). Details about C2A and HCA are provided in
Section 3.3 and
Section 3.4, respectively.
where
represents the
y-th (
) C2A module, taking inputs from
,
,
,
, and producing outputs
and
.
denotes the change-aligned attention map output by the corresponding level of HCA, while
denotes the change-aligned attention map input to that corresponding level.
represents the enhanced feature aligned with change areas, which is further exploited for precise localization in subsequent layers and is connected to the refinement stage via skip connections to assist in refining change targets of different sizes. In particular, since
serves as the fused attention from previous stages, and the first-layer C2A and HCA modules have no preceding stage,
does not exist. So the feature transformation of the first layer C2A is shown in Equation (
3). Finally, the feature output from the localization stage is denoted as
, serving as the input to the refinement stage.
The refinement stage starts with constraining and refining the change areas and edges obtained from the localization stage using the proposed edge-area alignment (E2A) module, providing a solid starting point for subsequent edge refinement. Details of E2A are discussed in
Section 3.5. Corresponding to the localization stage, the refinement stage comprises five convolutional blocks, each consisting of several convolution layers, transpose convolution layers, batch normalization layers, and ReLU layers. Each block refines change areas of different sizes and their edges, from deep to shallow, by incorporating difference features enhanced by C2A from the localization stage. Let
represent the output of the
z-th (
) convolutional block in the refinement stage, ultimately resulting in the change intensity map
. Threshold segmentation using the sigmoid function yields accurately discriminated change areas and edges. The structure and role of each module are described in detail below.
3.2. Learnable Optimal Pooling
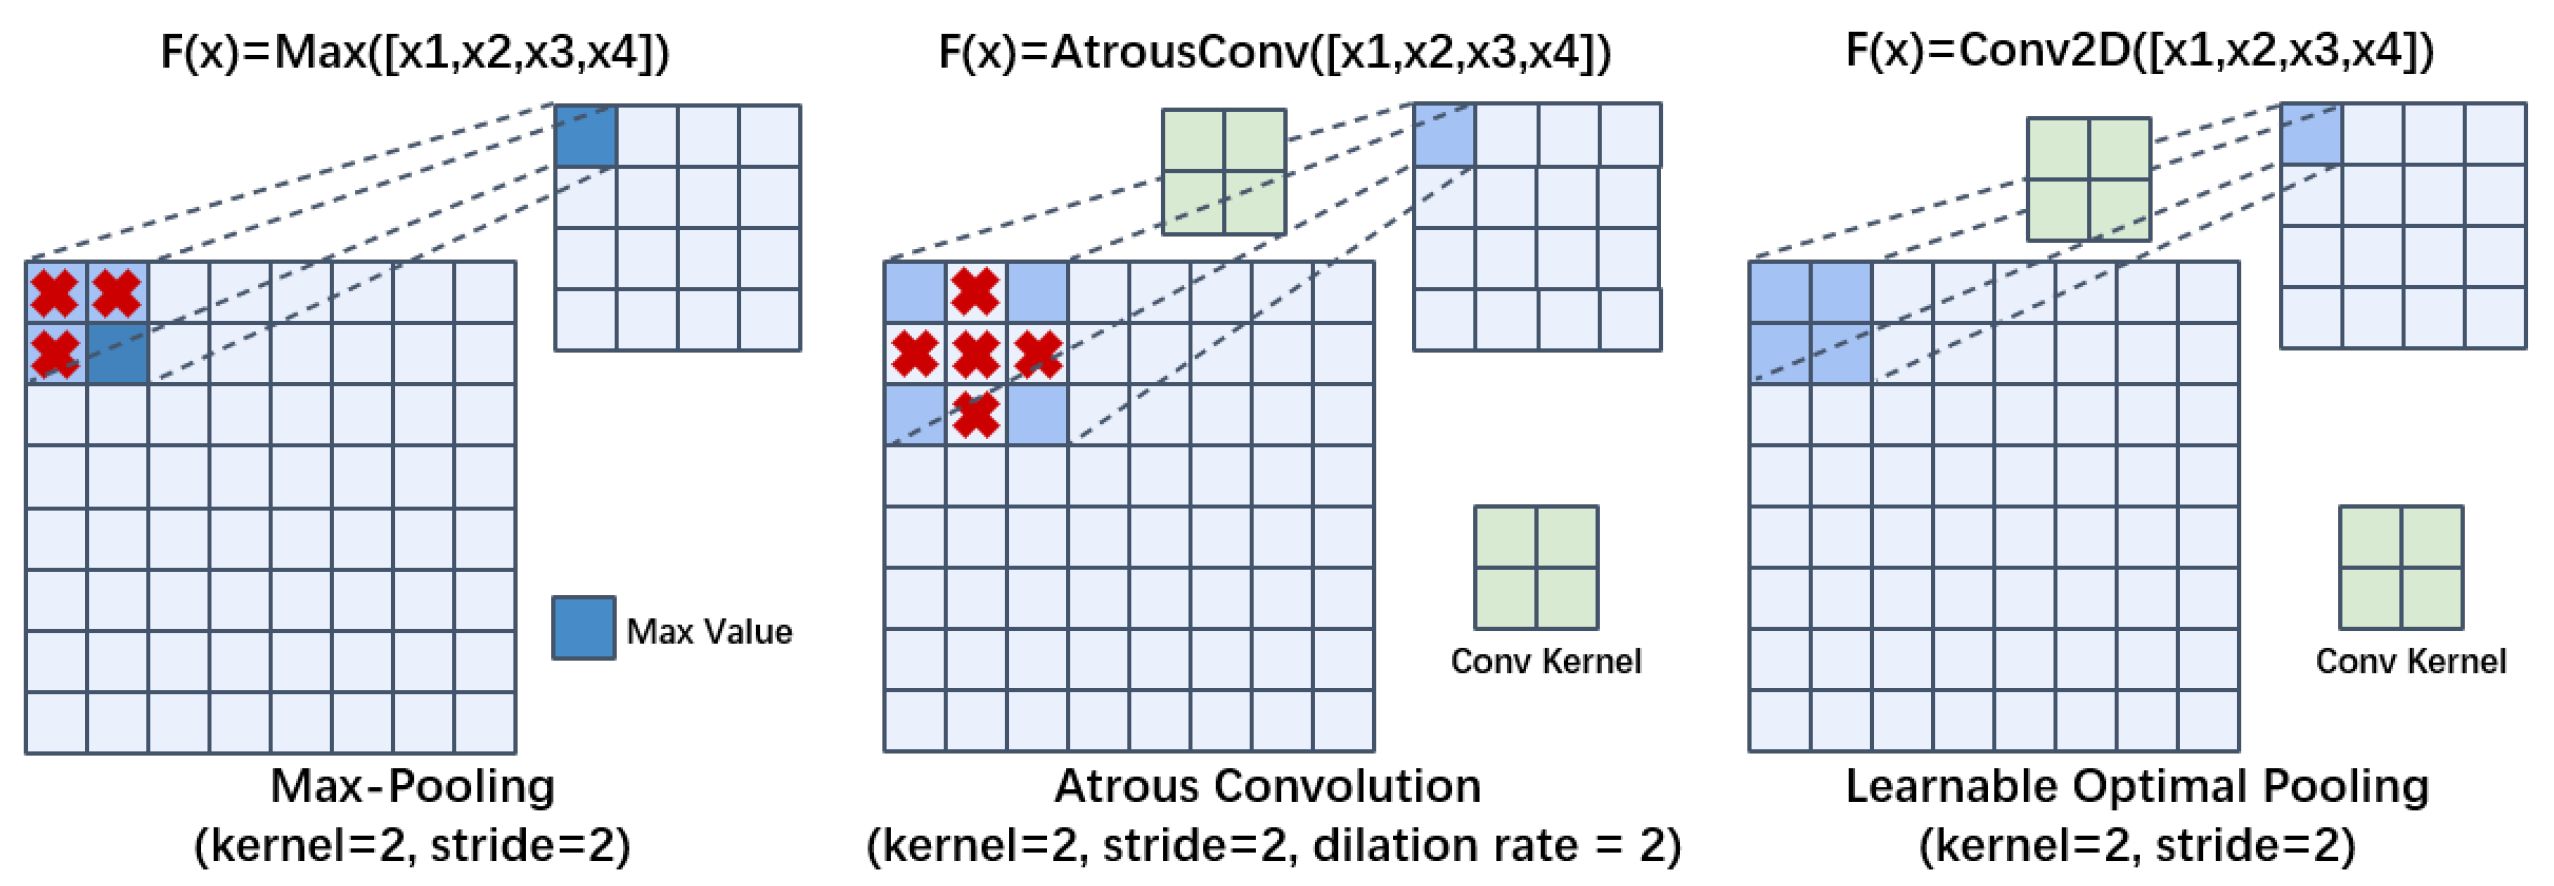
To address information loss during feature extraction, the discussion is primarily about the pooling layer in CNN. The pooling idea originates from the visual mechanism, which is the process of abstracting information. It can enlarge receptive fields while reducing feature dimensions, decreasing network parameters with lower optimization difficulty. Max pooling, a commonly used technique, highlights texture features but smooths out non-maximal features within the kernel region. Additionally, some scholars have employed dilated convolutions to emulate pooling layers; however, this approach often results in information loss as the internal details of dilated pixels within the convolution kernel are disregarded.
As shown in
Figure 3, to address the aforementioned issues, we propose learnable optimal pooling (LOP). Unlike standard convolution, which focuses on local feature extraction, LOP acts as a learnable pooling operator. It aggregates regional information through dense kernels while reducing spatial dimensions, thereby preserving critical boundary details often lost in max-pooling. LOP adopts a dense convolution kernel strategy, utilizing convolutional learning to compute aggregated information within the kernel region rather than relying on simple statistical values like the maximum. This pooling strategy ensures that the kernels cover all feature regions, reducing information loss. Meanwhile, the convolutional parameters are used to learn the regional aggregation information, preventing the information from being smoothed excessively and ensuring that the aggregated features remain representative. LOP can reduce information loss during feature extraction and ensure comprehensive key change features for assisted localization and refinement, which in turn improves the detection performance of the network. The BD branch depicted in
Figure 2 contains four LOP modules, each LOP performs feature aggregation on the output of C2A, enlarging the receptive field while reducing feature scale. The transformation process of LOP is illustrated in Equation (
4).
Here,
represents the
y-th (
) LOP module, taking the output
of the
y-th C2A as input and producing
as the input for the next convolutional block.
3.3. Change Alignment Attention
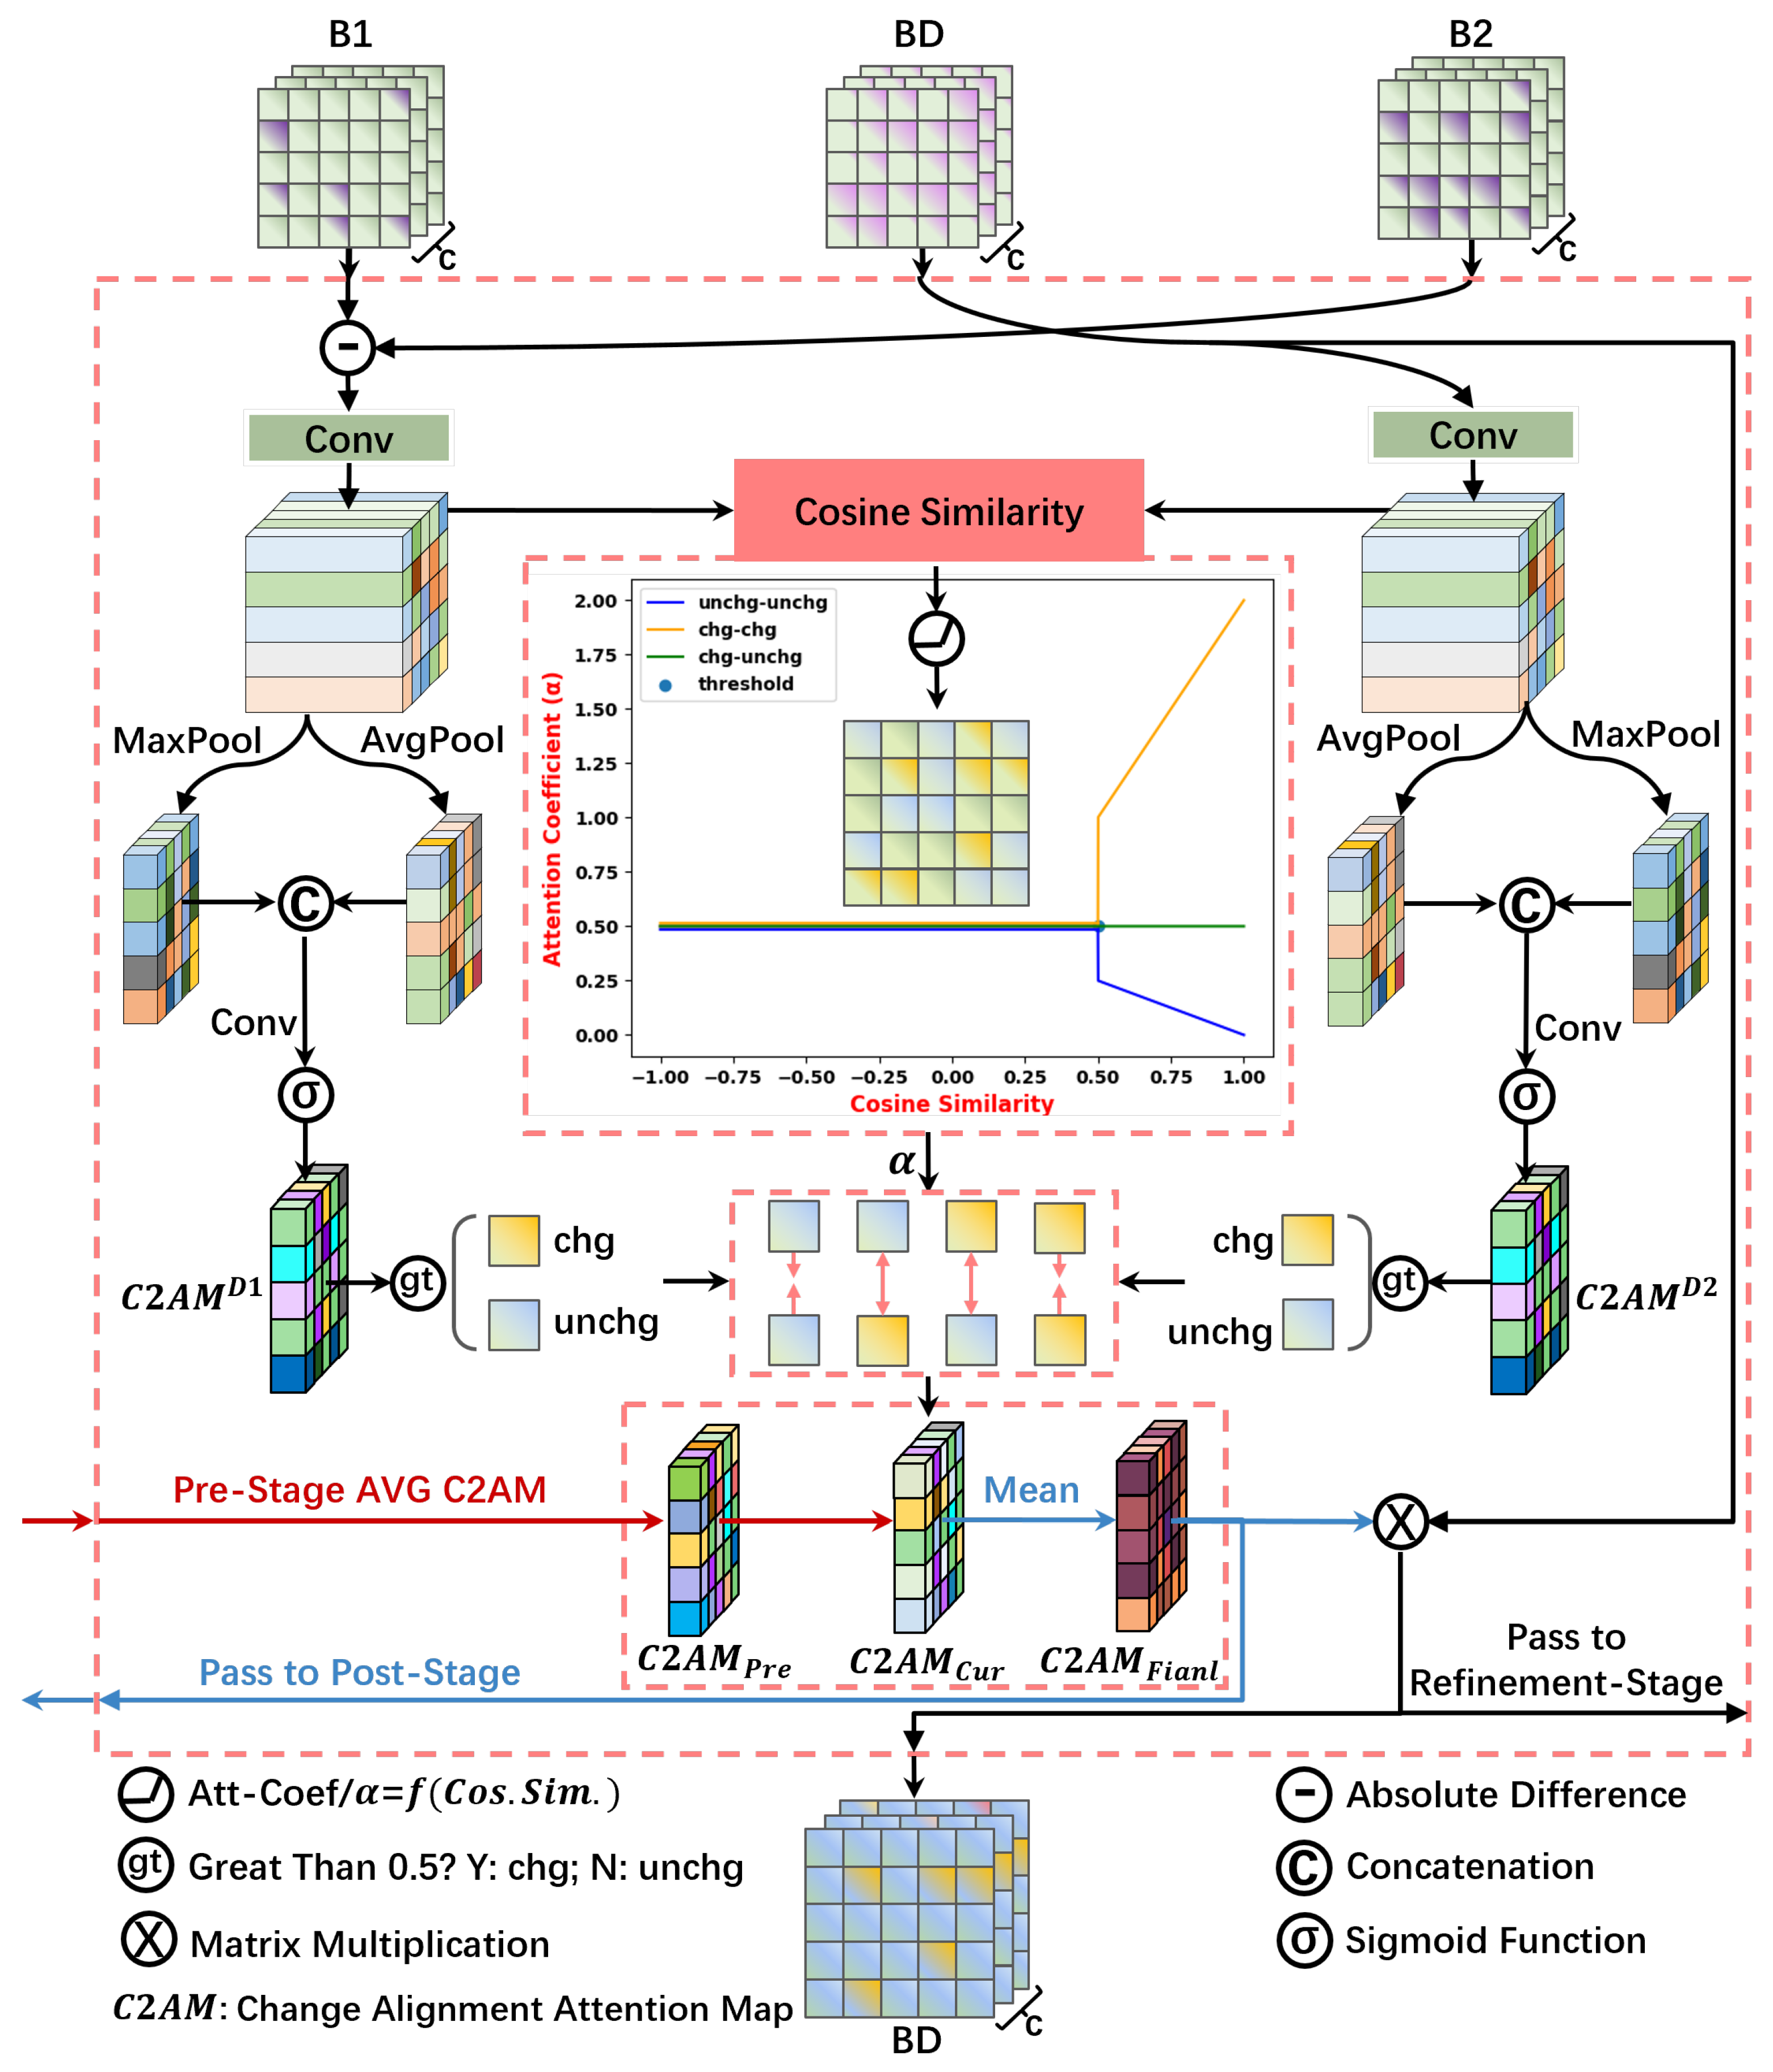
To facilitate effective interaction among features from different branches and accurately locate change areas of various sizes, the change alignment attention (C2A) and hierarchical change alignment (HCA) modules are designed. The processing of C2A is illustrated in
Figure 4. The inputs consist of features from the three branches, denoted as
,
,
, and the change alignment attention map from the corresponding HCA module, denoted as
. Initially, features from branches B1 and B2 undergo differencing to highlight changes, followed by convolution with the features from branch BD to obtain the original change features, denoted as
and
, as shown in Equation (
5).
The original change features,
and
, undergo information aggregation through max-pooling and average pooling. Subsequently, the pooled information is concatenated and processed through convolutional learning to obtain the preliminary attention weights, denoted as
and
, as shown in Equation (
6).
where
refers to the corresponding branch,
denotes the concatenation operation, and
represents the sigmoid function.
Due to their different sources,
and
contain different and complementary information. The former emphasizes more on change features highlighted by direct differencing, while the latter contains more differential information from deep features of the bi-temporal images. By analyzing the similarity of the original change features, attention weights are assigned to enhance consistent information. Areas that are consistent across both features are given higher weights for the change category and lower weights for the unchanged category. First, the attention weight map is thresholded to generate a binary flag indicating whether each pixel represents change, using a common threshold of 0.5, as shown in Equation (
7).
where
h and
w represent the height and width of
, respectively, and
denotes the flag corresponding to each pixel in
. The combination of
and
yields four possible cases, that is,
change vs. change,
unchanged vs. unchanged,
change vs. unchanged, and
unchanged vs. change. The last two cases can be regarded as the same.
The cosine similarity (
) of the original change features is calculated, and the attention weight coefficient
is obtained in accordance with the similarity threshold
T as well as the weighting rule. The corresponding formulas are shown in Equations (
8) and (
9):
Here,
,
h and
w represent the height and width of the corresponding feature map, respectively. In the experiments,
T is set to 0.5.
According to
, the weighted fusion of
and
yields an attention weight map
that enhances the representation of change category and suppresses the representation of unchanged category. Considering the different levels of attention information, the final change-aligned attention weight map,
, for the current stage, is obtained by averaging it with the previously fused attention map,
, as shown in Equation (
10):
where
represents the output of the corresponding level HCA module, while the resulting weight map,
, which serves as the input to the same level HCA module, is used for fusing attention information across different levels in the subsequent stage. The product of
and the input feature
yields the new feature
, enhancing the alignment of change areas.
is utilized both to further explore change features for improved localization in the BD branch and as a skip connection to the refinement stage to assist in refining change targets of different sizes. Overall, C2A facilitates the interaction of change feature information from different branches, aligning and enhancing change areas in a more targeted manner while reducing attention to the background.
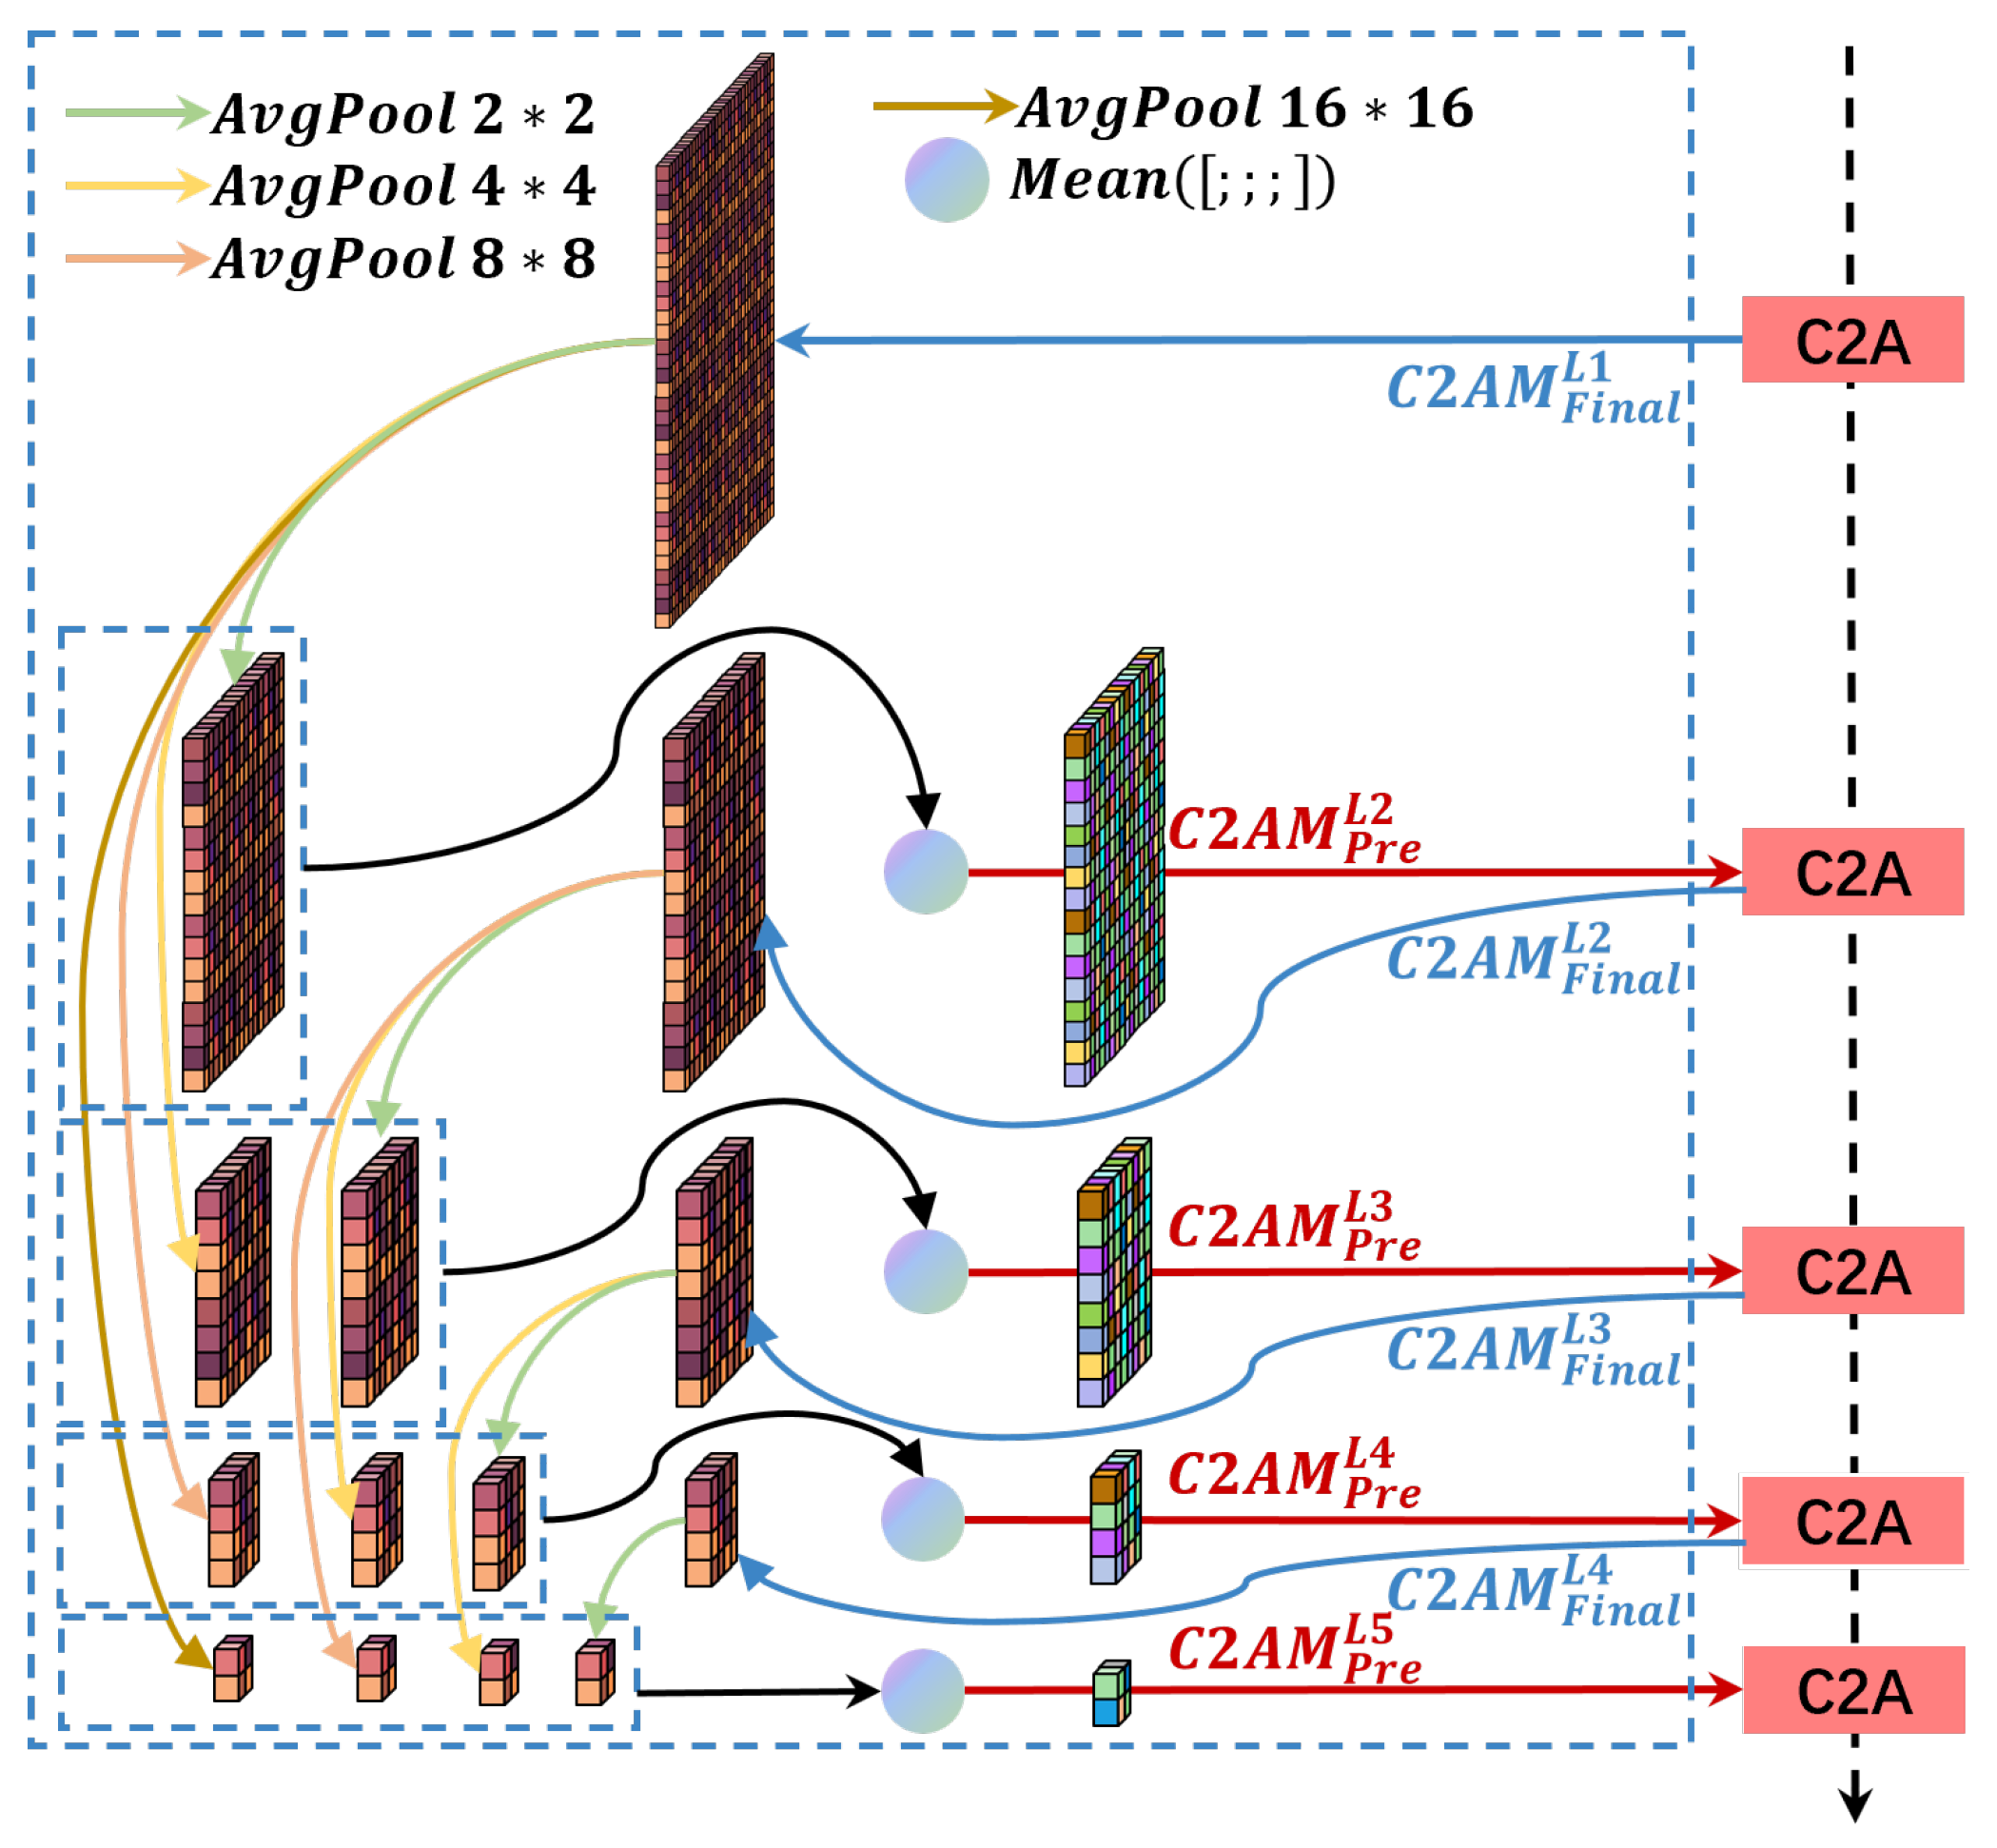
3.4. Hierarchical Change Alignment
In the network architecture, features at different levels exhibit varying granularity and receptive fields, which can be utilized for identifying targets of different sizes. To effectively synthesize change-aligned attention from different granularities, the hierarchical change alignment (HCA) module is proposed. The structure of HCA is depicted in
Figure 5. HCA propagates the change alignment attention maps (C2AM) output from different levels of C2A to subsequent levels in a densely connected manner, facilitating comprehensive discrimination of attention weights at multiple granularities. It ensures that the attention weight generation for deep features is more representative, which is conducive to the identification of change targets of various sizes.
HCA consists of five layers corresponding to C2A. Specifically, the first layer of HCA only has input, represented by
; the last layer of HCA only has output, represented by
. Other layers have both input and output, where the input is the change-aligned attention map from the corresponding layer of C2A, denoted as
, and the output is the fused attention from previous layers, denoted as
. Using
as an example, the processing of HCA is demonstrated in Equation (
11):
In the equation, denotes the concatenation operation, and denotes average pooling with kernel sizes of 4 × 4 and 2 × 2, respectively. Following the same procedure, we obtain , , and , which all contain fused information of change-aligned attention from different levels in the preceding layer, facilitating the localization and refinement of change targets of various sizes. The output of the last layer HCA, , serves as the input to the final layer of C2A, where it is combined with change features from the three branches to produce accurately localized change areas in . serves as input to the refinement stage, proceeding from deep to shallow layers to refine change areas of different sizes and their edges. The structures and modules of the refinement stage are discussed next.
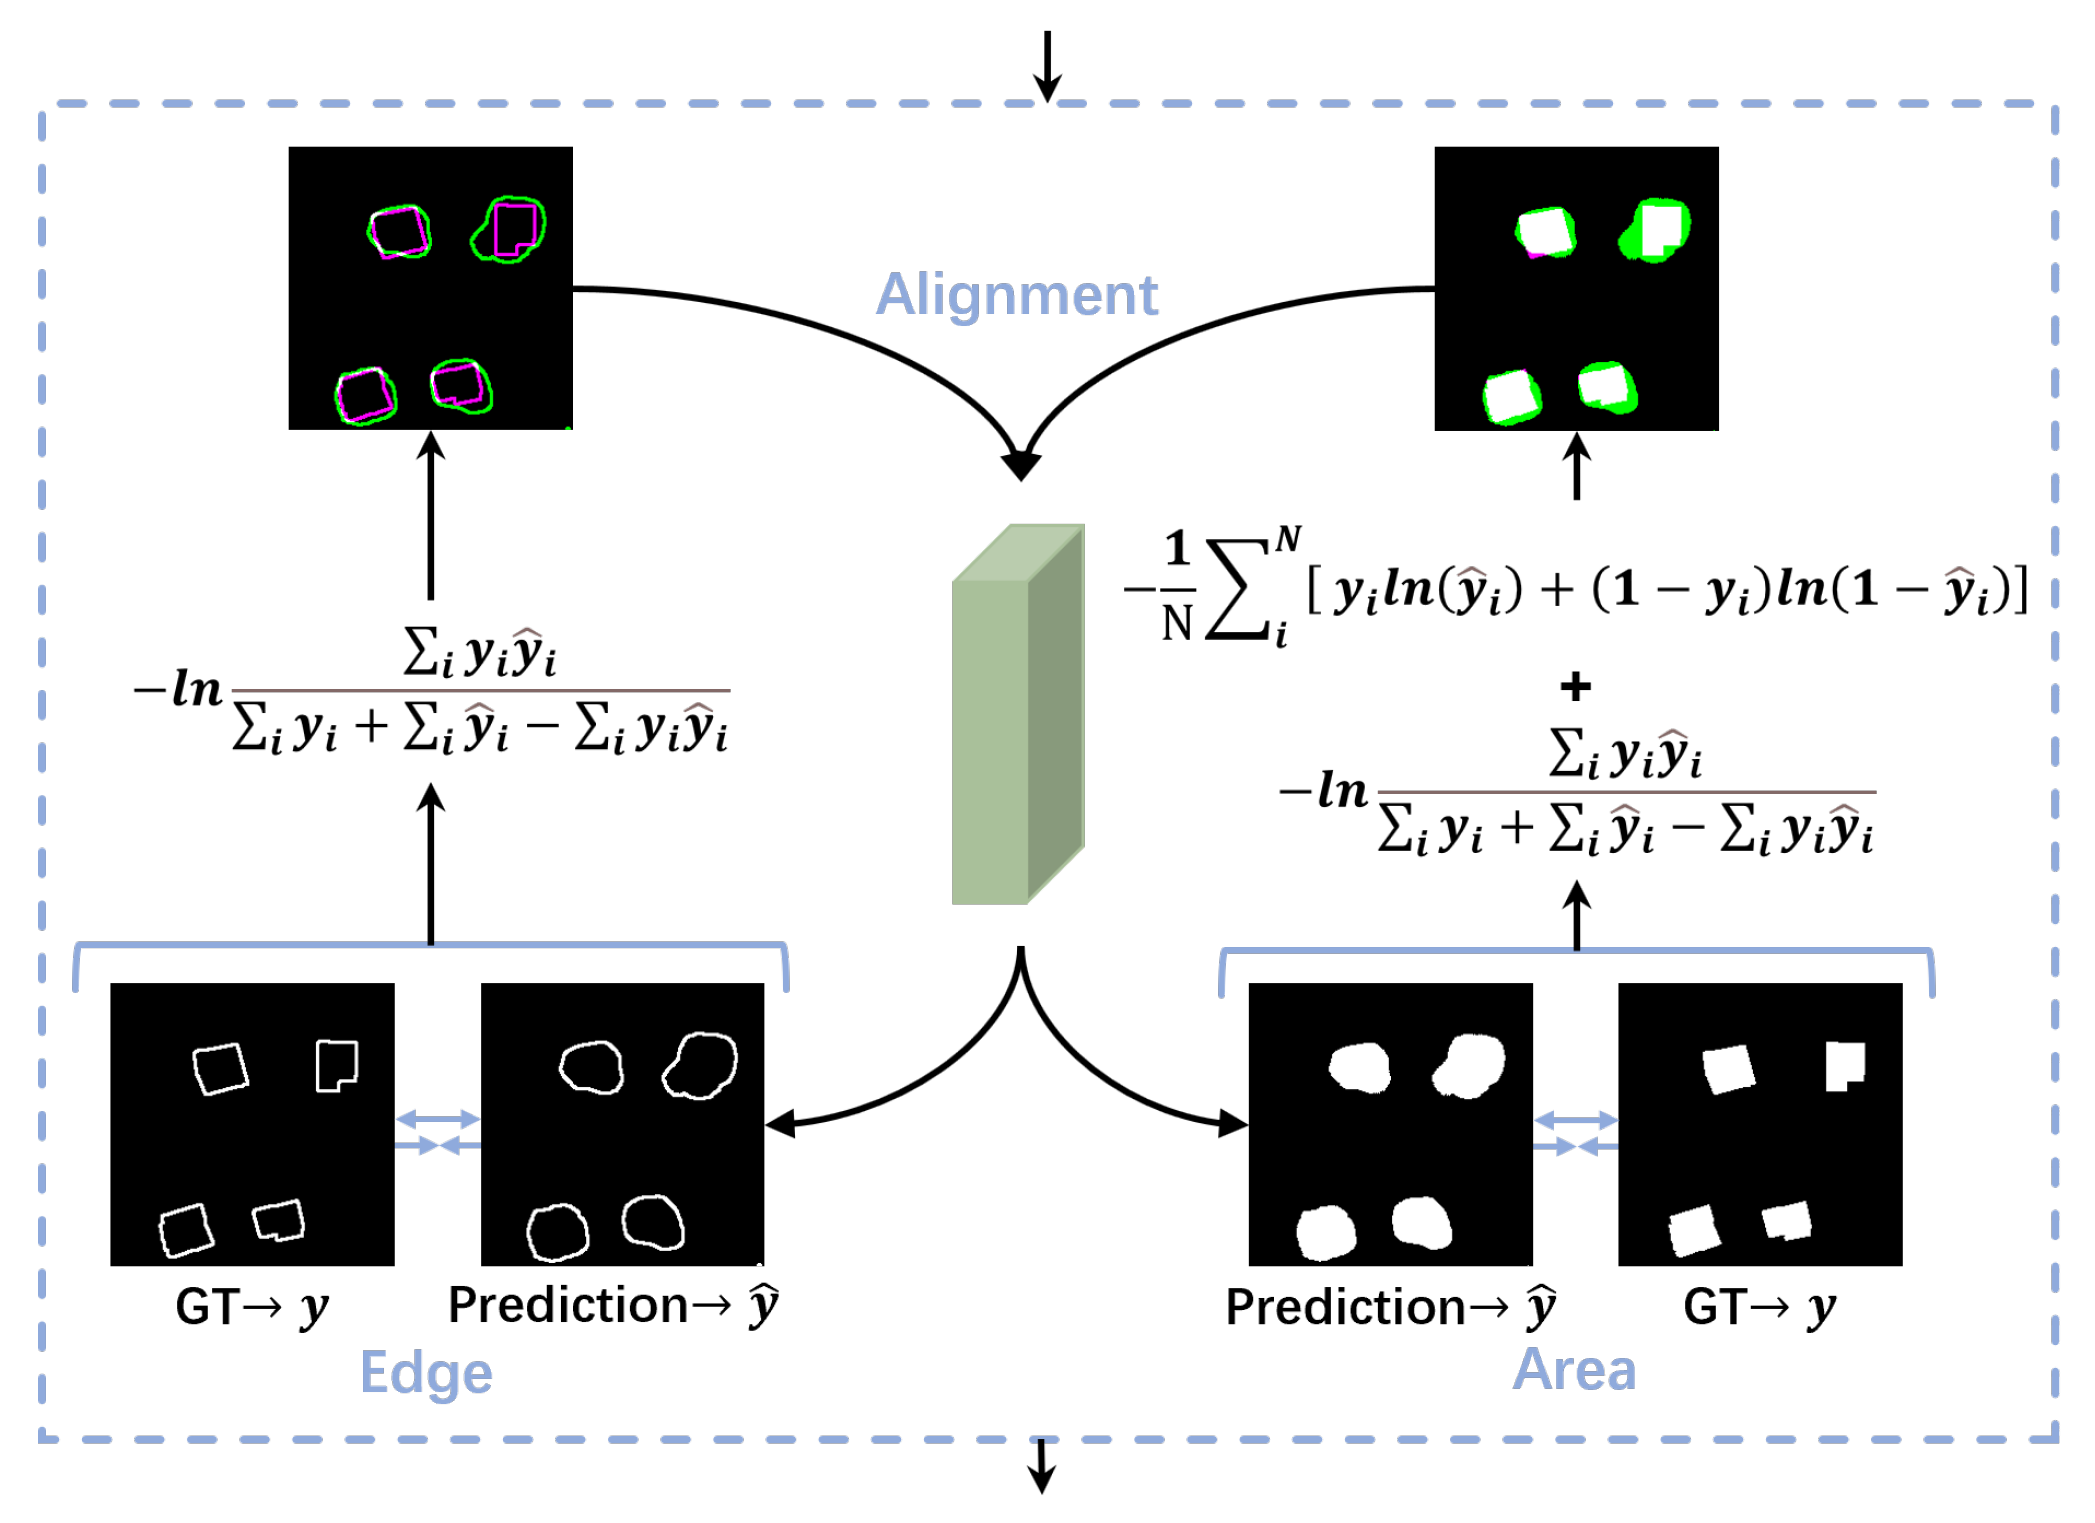
3.5. Edge-Area Alignment Module
To provide a solid foundation for the refinement stage, the edge-area alignment module (E2A) is designed to constrain and rectify the change areas and edges identified in the localization stage. The E2A procedure is illustrated in
Figure 6. Firstly, the output from the localization stage is processed using a convolution and sigmoid function to obtain the inference result of the change areas. Subsequently, the Canny algorithm [
44] is applied to the change areas to obtain the edge detection results. Comparing the inference result with the ground truth, different loss functions are employed for supervision. Inspired by lane detection in autonomous driving [
45], it is more stable to use the intersection over union (IOU) for evaluation and constraints when the target proportion is significantly smaller than the background, which allows us to focus primarily on the less-targeted category. Specifically, we employ the IoU loss function to constrain the detection of change edges, while for change areas, we combine the binary cross-entropy loss and IoU loss functions to apply a joint constraint. Equations (
12) and (
13) are the formulas for the binary cross-entropy loss function and IOU loss function, respectively.
where
represents the ground truth,
denotes the inference result, and
N refers to the total number of pixels.
The constraints for edge, area, and overall are shown in Equation (
14).
By imposing constraints on the changed edges and areas between the localization and refinement stages, the inference values are brought closer to the ground truth, laying a solid foundation for further refinement of the change details. Additionally, at the end of the refinement stage, we supervise the training and optimization of the model by constraining the changed edges and areas in the same manner.
3.6. Refinement Stage
As illustrated in
Figure 2, the refinement stage utilizes the E2A module to process the localization results, yielding deep features corrected for changed areas and edges. Considering that deep features contain more abstract semantic information while shallow features contain more detailed change information, the refinement stage integrates different levels of features passed from C2A, from deep to shallow and from the center to the edge, to refine the delineation of changed areas and edges.
Corresponding to the localization stage, the refinement stage comprises five convolutional blocks, each consisting of several convolution layers, transpose convolution layers, batch normalization layers, and ReLU layers. The features from the first four convolutional blocks are fused with the change-enhanced features by the corresponding C2A module, refining the edges of different-sized changed areas. CAM is embedded in the concatenation operation to assist in feature fusion and filtering of redundant information, and SAM is embedded to enhance the change features before enlarging the resolution. Progressively refining the changed features from deep to shallow, the final convolutional block generates the change intensity map . Utilizing a sigmoid function on yields the change detection results with accurate area and edge discrimination.
4. Experiments
In this section, we first introduce the datasets, experimental setting, and evaluation metrics in turn. And then we provide a detailed analysis of the comparison experiments. Finally, we discuss the effectiveness of the proposed modules and loss functions, as well as the complexity of the model.
4.1. Data Description
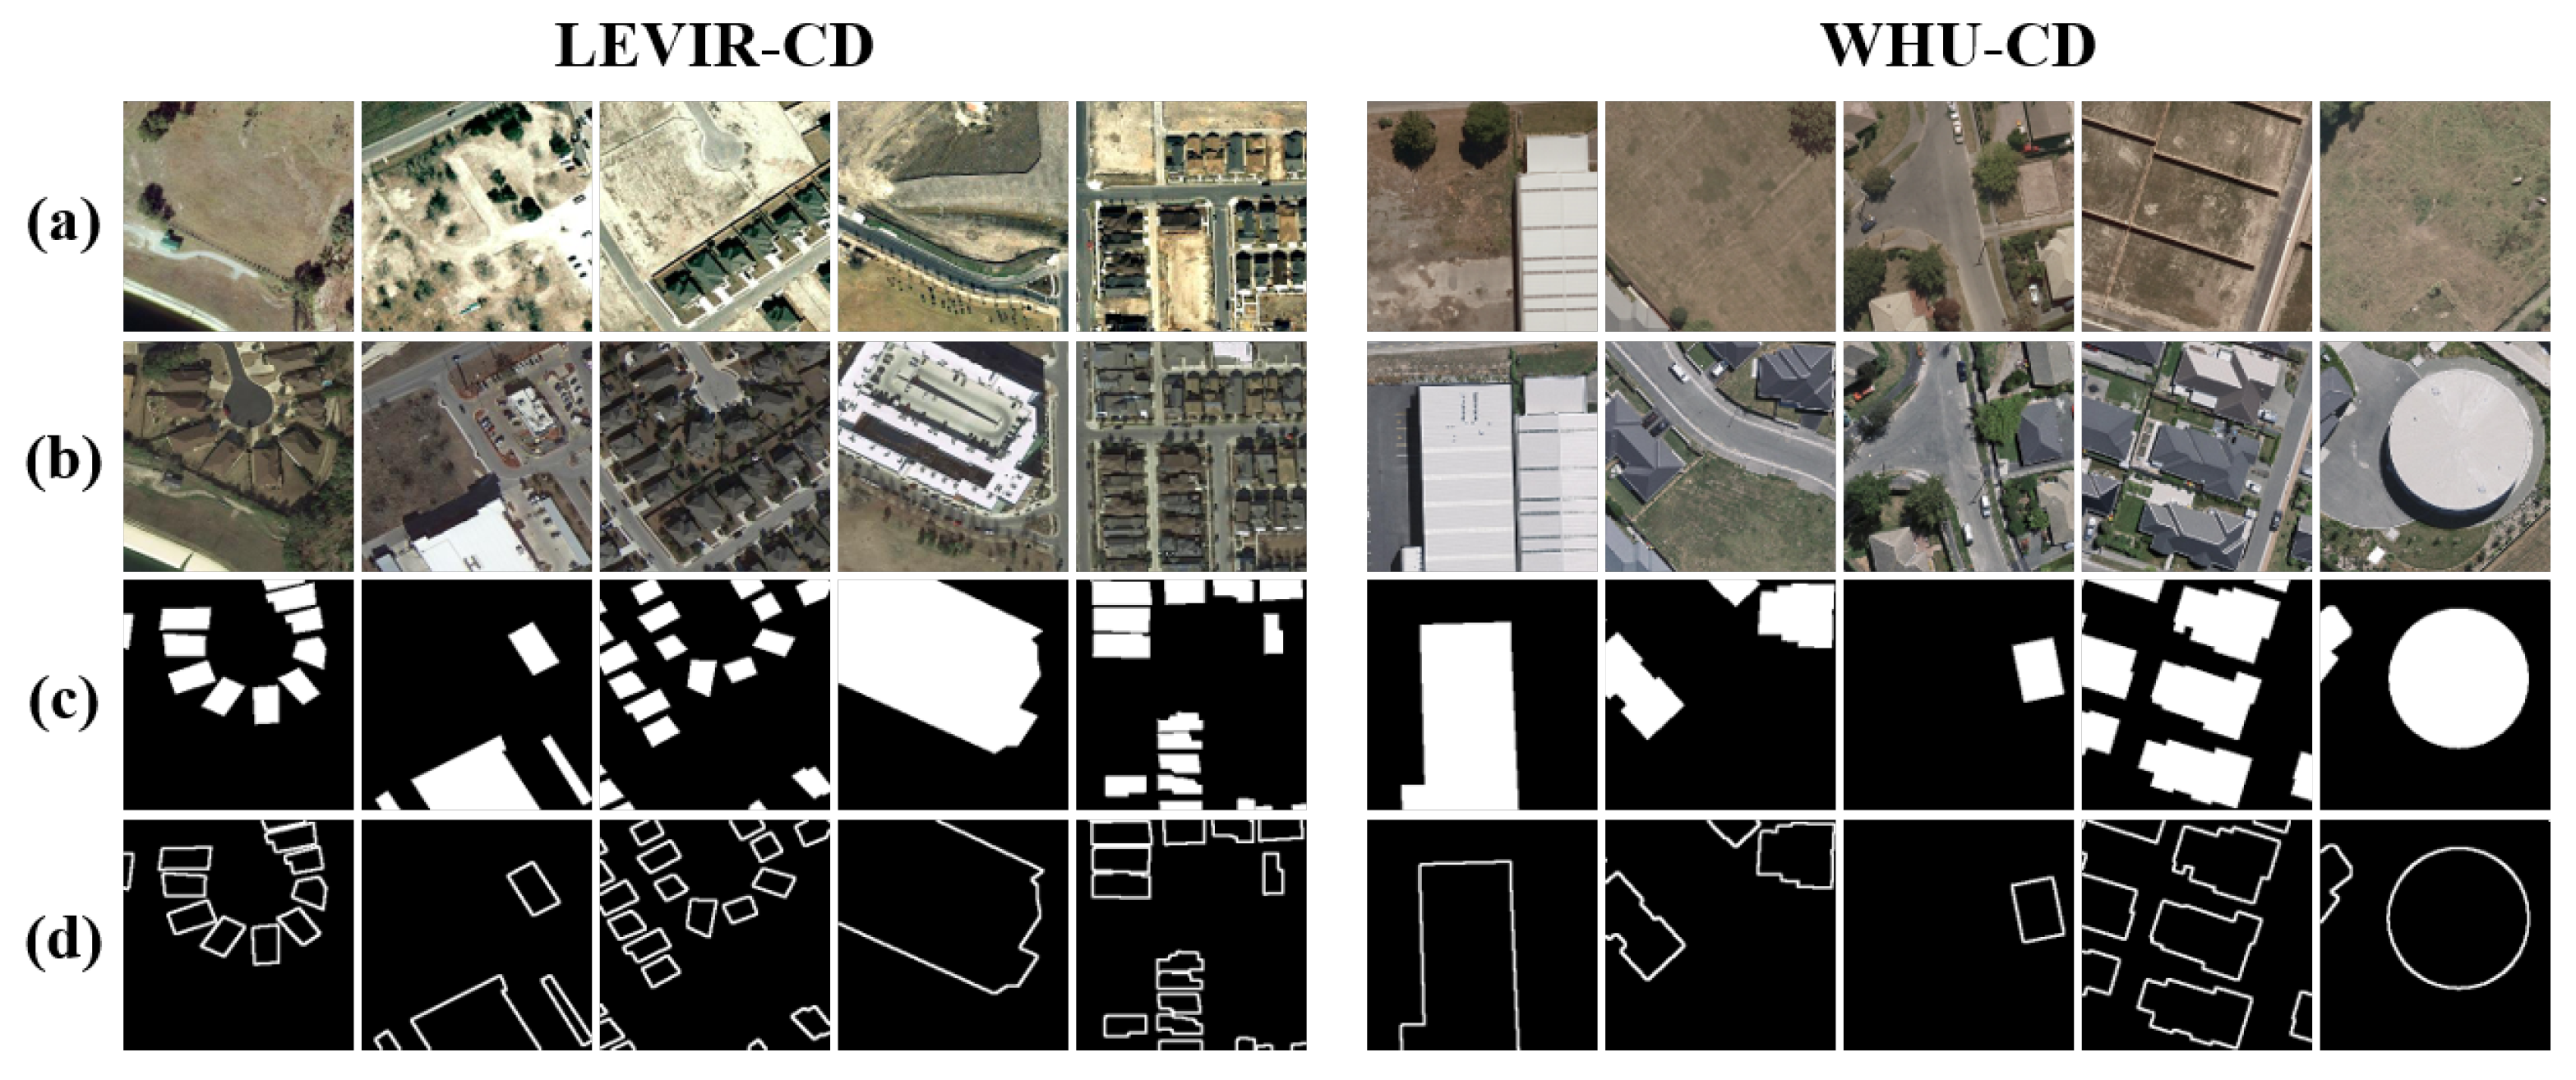
The experiments were conducted on two publicly available change detection datasets, namely, the LEVIR-CD and WHU-CD datasets.
(1) LEVIR-CD dataset [
46]: This dataset consists of 637 pairs of high-resolution remote sensing images, each with a size of 1024 × 1024 pixels and a spatial resolution of 0.5 m/pixel. To facilitate training and reduce memory burden, the original images were cropped into new pairs (256 × 256 pixels) without overlapping, and finally, 10,192 pairs of samples were obtained. In the experiments, the dataset was randomly divided according to the default official split ratio of 7:1:2. The training, validation, and test sets contained 7120, 1024, and 2048 pairs of samples, respectively.
(2) WHU-CD dataset [
47]: This dataset comprises a single pair of high-resolution remote sensing images, each with a size of 32,507 × 15,354 pixels and a spatial resolution of 0.3 m/pixel. Similarly, the original images were cropped into blocks of 256 × 256 pixels, resulting in 7620 pairs of samples. The dataset was randomly divided into training, validation, and test sets in an 8:1:1 ratio, containing 6096, 762, and 762 sample pairs, respectively.
Some samples from the LEVIR-CD and WHU-CD datasets are shown in
Figure 7.
4.2. Experimental Setting
In the experiments, the proposed LRNet is compared with 13 other state-of-the-art change detection methods. Wherein, CNN-based methods include FC-EF [
29], FC-Siam-Conc [
29], FC-Siam-Diff [
29], DASNet [
30], SNUNet [
48], DSIFN [
31], DESSN [
49], DMINet [
19], GeSANet [
32], and TCD-Net [
37]; ViT-based methods include BIT [
21], VcT [
34], and EATDer [
35]. FC-EF and TCD-Net were constructed based on the EF structure and the Triplet structure, respectively, while the other compared methods were based on the Siamese structure.
All models were trained and tested on an NVIDIA GeForce RTX 3090 GPU, sourced from NVIDIA, Santa Clara, CA, USA, with 24 GB of memory and were implemented using PyTorch 1.8. In the experiments, the Adam optimization algorithm [
50] with an initial learning rate of 1e-4 was used to update the weights of the model. LRNet was trained for 200 epochs on each dataset with a batch size of 16. The implementation details of the compared methods are consistent with their respective papers.
4.3. Evaluation Metrics
In the experiments, the following evaluation metrics were adopted to quantitatively evaluate the change detection performance of different methods: precision (Pre), recall (Rec), F1 score (F1), intersection over union (IOU), and overall accuracy (OA). Pre and Rec reflect the classification accuracies of the model from different perspectives. Changed pixels are defined as positive samples, while unchanged pixels are negative samples. Pre refers to the proportion of correctly predicted positive samples among all samples predicted as positive. Rec refers to the proportion of correctly predicted positive samples among all positive samples in the dataset. For the change detection task, a higher Pre value indicates fewer false detections, while a higher Rec value indicates fewer missed detections.
F1, IOU, and OA can reflect the overall performance of the model. F1 is the harmonic average of Pre and Rec. IOU measures the overlap between the predicted values and ground truth for positive samples, where a larger value indicates a closer match to the ground truth. OA refers to the proportion of correctly predicted pixels among all pixels. The definitions of these metrics are shown in Equation (
15):
where
,
,
, and
represent true positive, true negative, false positive, and false negative, respectively.
To evaluate the detection performance of the model on change edges, we not only compare the detection metrics of change areas but also further measure the metrics of change edges, i.e., , , , . These metrics are computed in the same way as the change area metrics but focus on the change edges instead.
4.4. Comparison with SOTA Methods
(1) Comparison experiments on the LEVIR-CD dataset.
Table 1 presents the quantitative results of each model on the LEVIR-CD dataset, where the best results are highlighted in bold. The proposed LRNet achieves optimal results in the overall evaluation metrics of change areas, that is, OA (99.10%), F1 (91.08%), and IOU (83.63%). It performs slightly lower than the compared methods in terms of Pre (92.19%) and Rec (90.00%). Among them, FC-Siam-Conc exhibits the highest Rec (96.44%), but its Pre (48.56%) is significantly lower when compared to other SOTA methods and LRNet. The oversimplified structure of FC-Siam-Conc struggles to differentiate between real and pseudo-changes, resulting in a high Rec but low Pre scenario, where many pseudo-changes or unchanged objects are misclassified as changes. TCD-Net achieves the best Pre (92.70%) by effectively utilizing three branches to extract features from original bi-temporal images and their difference features for change detection. However, it tends to miss some ambiguous changed objects, reflected in its lower Rec (88.16%). Considering both Pre and Rec, LRNet achieves the best F1, with improvements ranging from 0.71% to 39.8% compared to other models. For the discrimination of change edges, LRNet achieves the best values in all four evaluation metrics—
(72.05%),
(67.96%),
(70.95%), and
(54.78%)—with improvements of 1.27%, 0.67%, 2.45%, and 2.69%, respectively, compared to the suboptimal values. These quantitative results demonstrate the outstanding change detection performance of LRNet, especially in improving the discrimination of change edges.
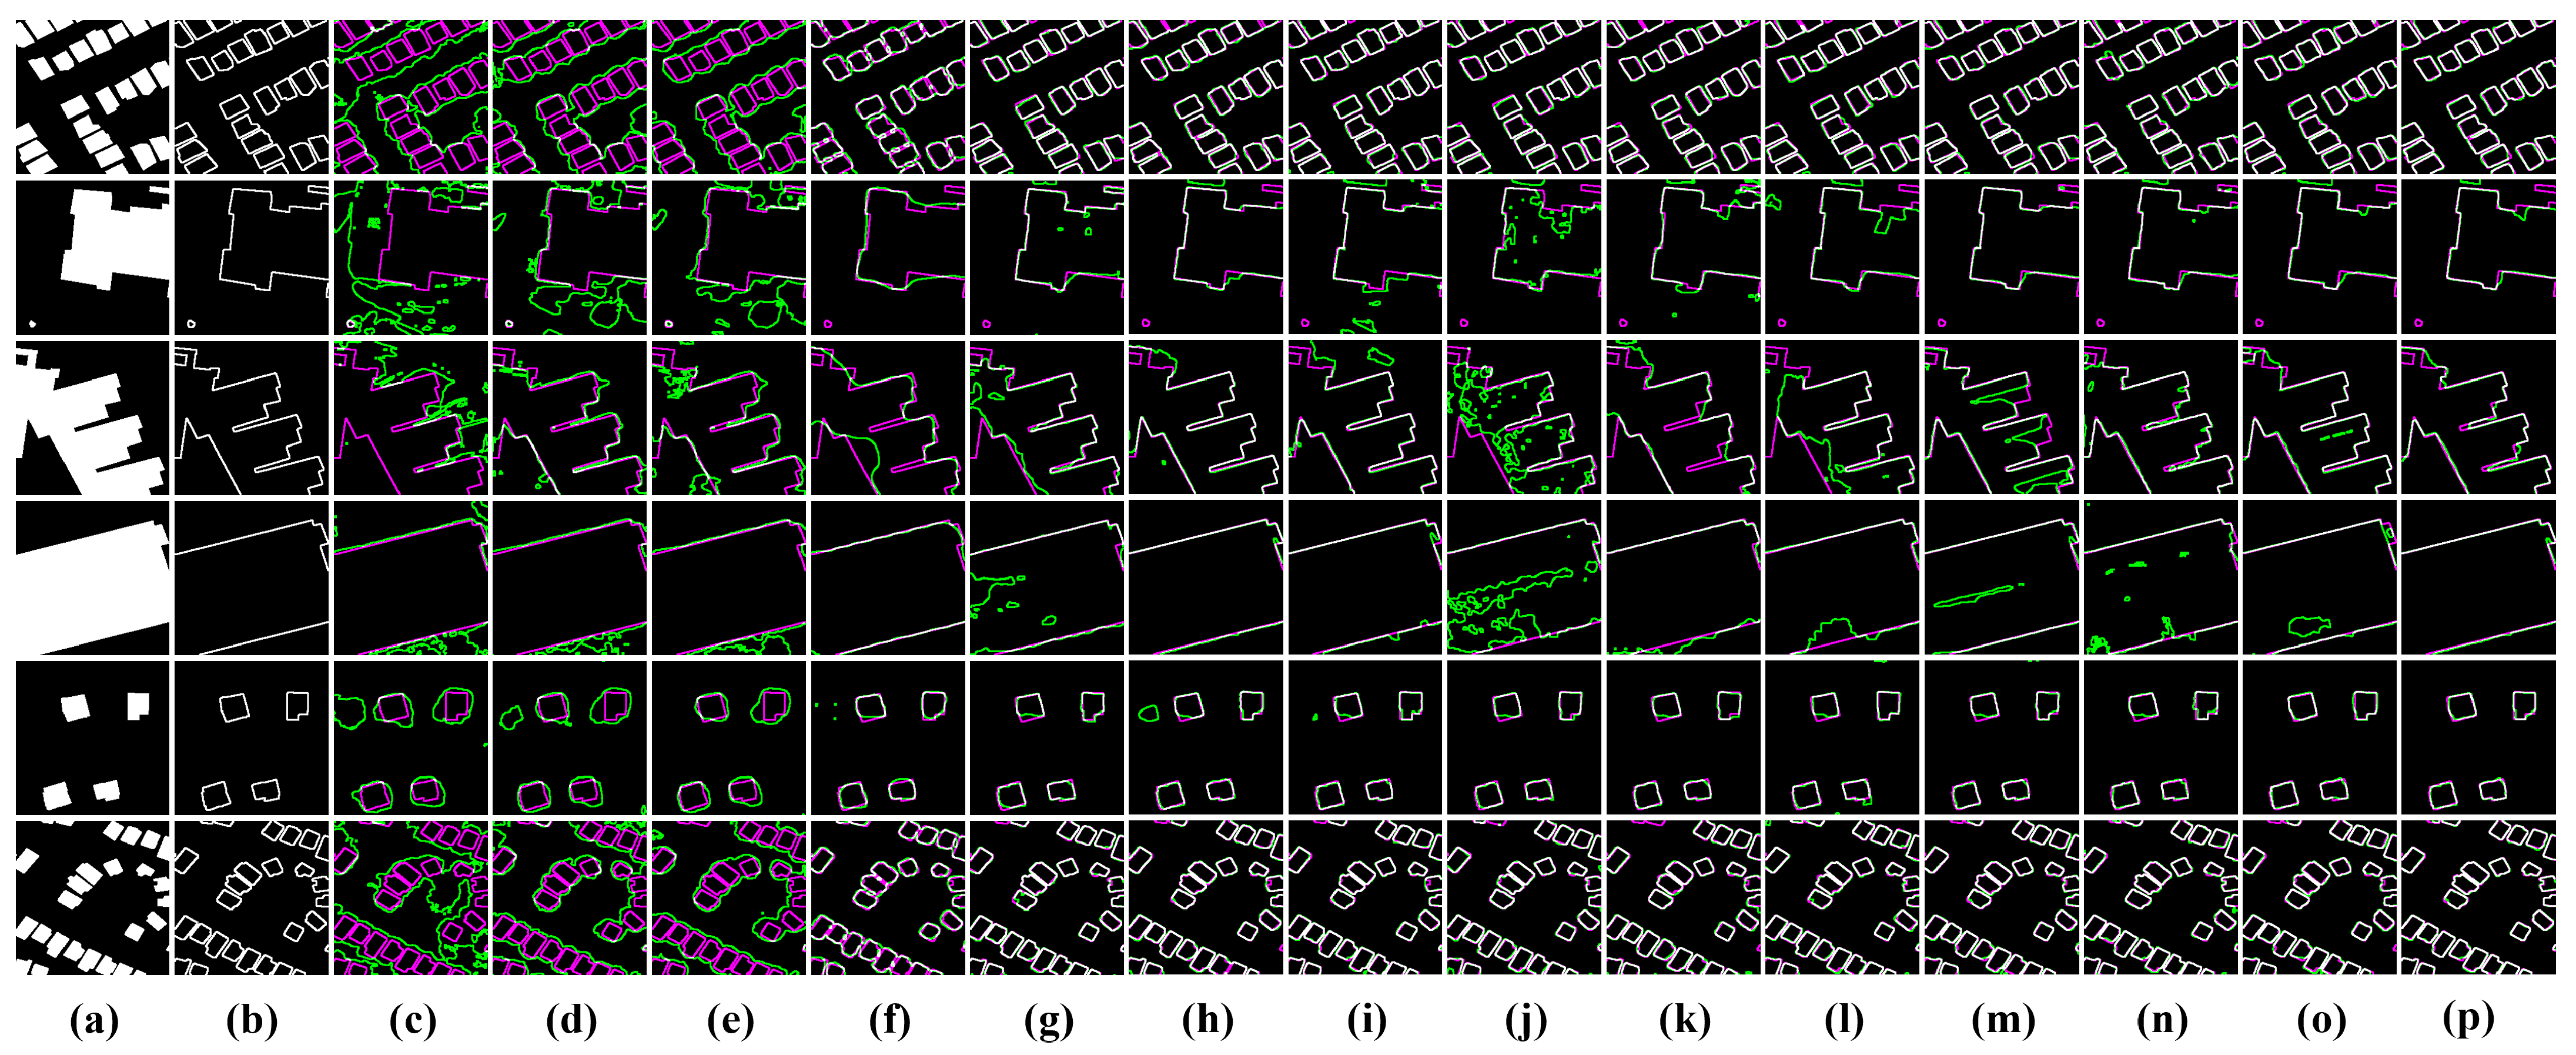
To further evaluate the change detection performance of different models on the LEVIR-CD dataset, the test results are visualized and compared with the original bi-temporal images as well as the labels, as shown in
Figure 8 (area) and
Figure 9 (edge). From
Figure 8, it can be seen that the three baseline models (d–f) exhibit numerous false detections, indicating that their simplistic design struggles to analyze complex features. BiT (k), as a ViT-based model, focuses more on global information, which leads to an imbalance of attention with the local information, resulting in a large number of missed detections. Other attention-based or ViT-based models introduce different modules to improve the identification and attention to change areas, significantly reducing false and missed detections of changed objects. The proposed LRNet, employing a localization-then-refinement strategy, achieves accurate localization of change areas and effectively improves edge detection accuracy, thereby enhancing overall performance. The visualization results of LRNet are the closest to those of the labels.
Figure 9 illustrates the edge discrimination performance of different models. It can be seen that the compared models have—more or less—some bias in the discrimination of edges. Models c–e barely detect any edges. Models f–o detect most edges but still exhibit significant deviations in the interior and details of change areas. The proposed LRNet effectively identifies and detects change edges through accurate localization of change areas by the change alignment modules, as well as the depth-to-light refinement. Corresponding to the quantitative results in
Table 1, the discrimination results of change edges by LRNet match the labels the most.
(2) Comparison experiments on the WHU-CD dataset.
Table 2 presents the quantitative results of each model on the WHU-CD dataset. Compared to the other compared methods, LRNet achieves the best results in the evaluation metrics of change areas, as follows: OA (99.47%), Pre (95.11%), F1 (92.51%), and IOU (86.06%). FC-Siam-Conc exhibits the highest Rec (95.45%), but its Pre (45.54%) is significantly lower than other SOTA methods and LRNet. Considering both Pre and Rec, the proposed LRNet achieves the best F1, with improvements ranging from 0.95% to 40.56% compared to other models. Only LRNet and TCD-Net achieve F1 values above 90%, among all the models, indicating that the three-branch structure can effectively extract and retain key information from original bi-temporal images and their difference features. For the discrimination of change edges, similar to the results on the LEVIR-CD dataset, LRNet achieves the best values in all four evaluation metrics—
(68.01%),
(63.56%),
(65.71%), and
(48.93%)—with improvements of 10.24%, 3.59%, 9.15%, and 9.50%, respectively, compared to the suboptimal values. The significant improvement in quantitative evaluation metrics highlights the superior change detection performance of LRNet.
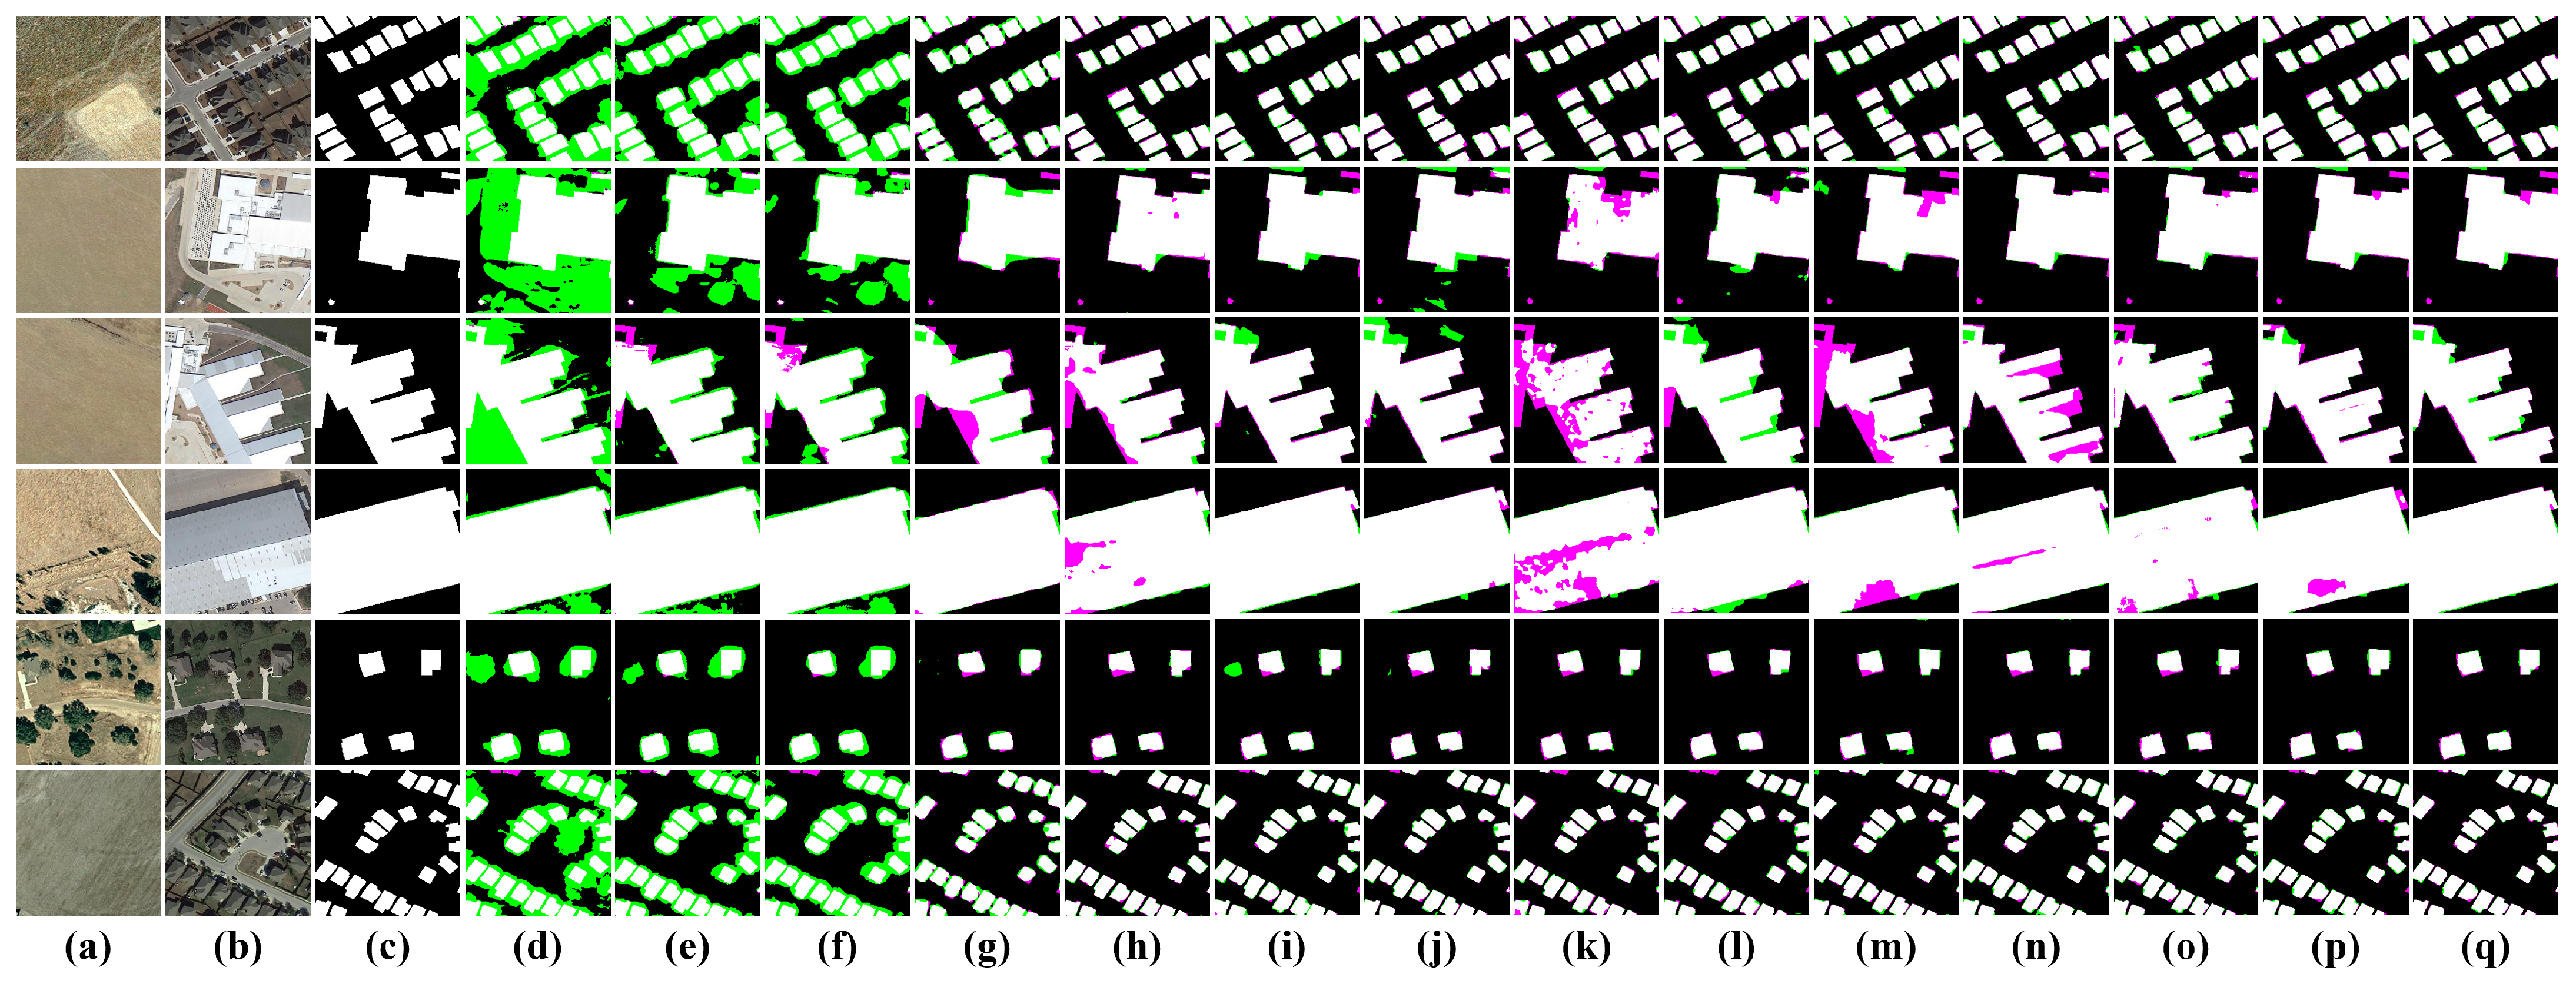
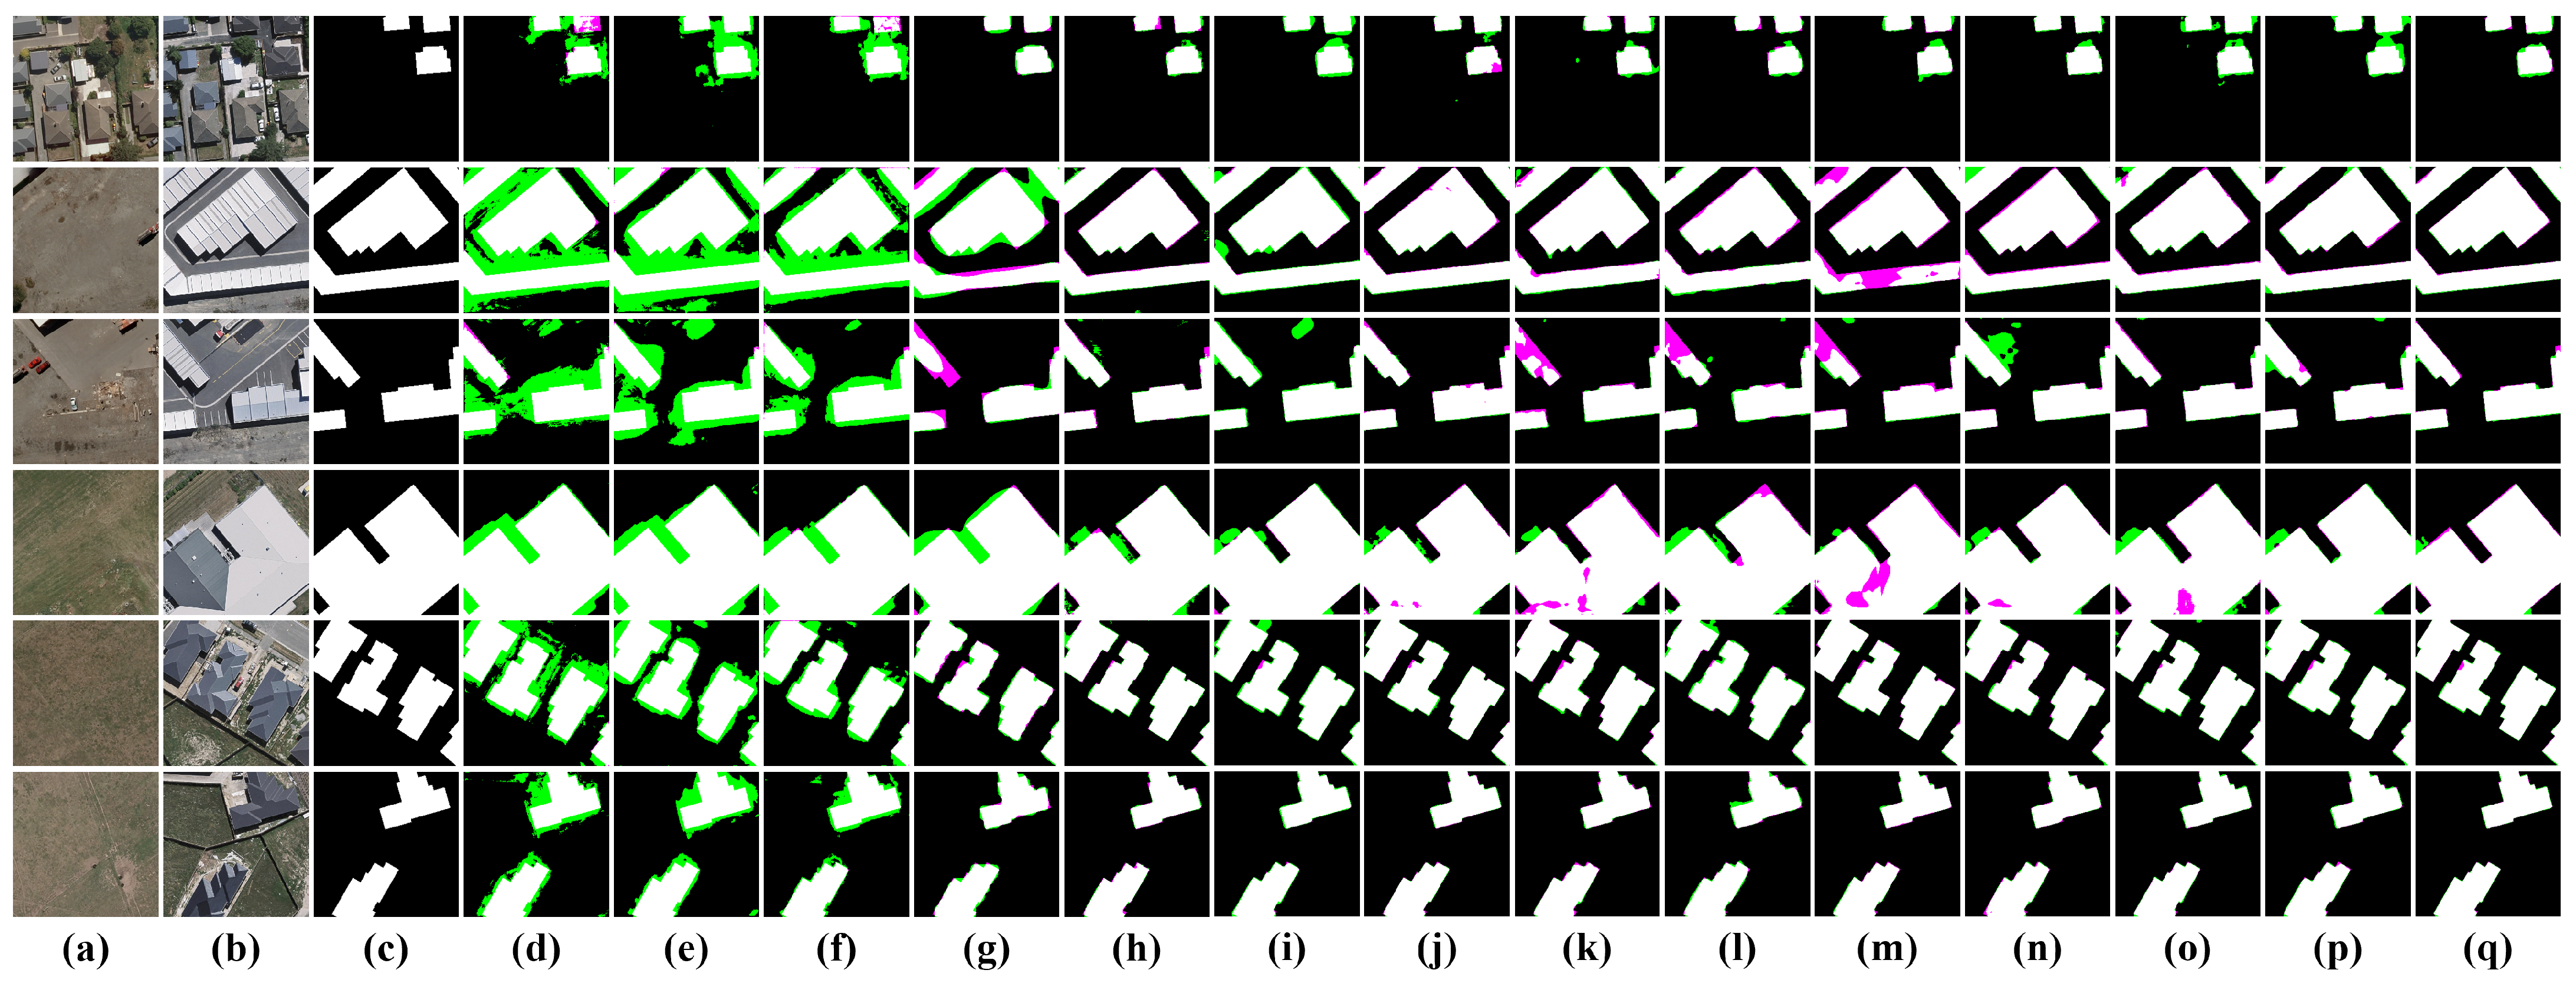
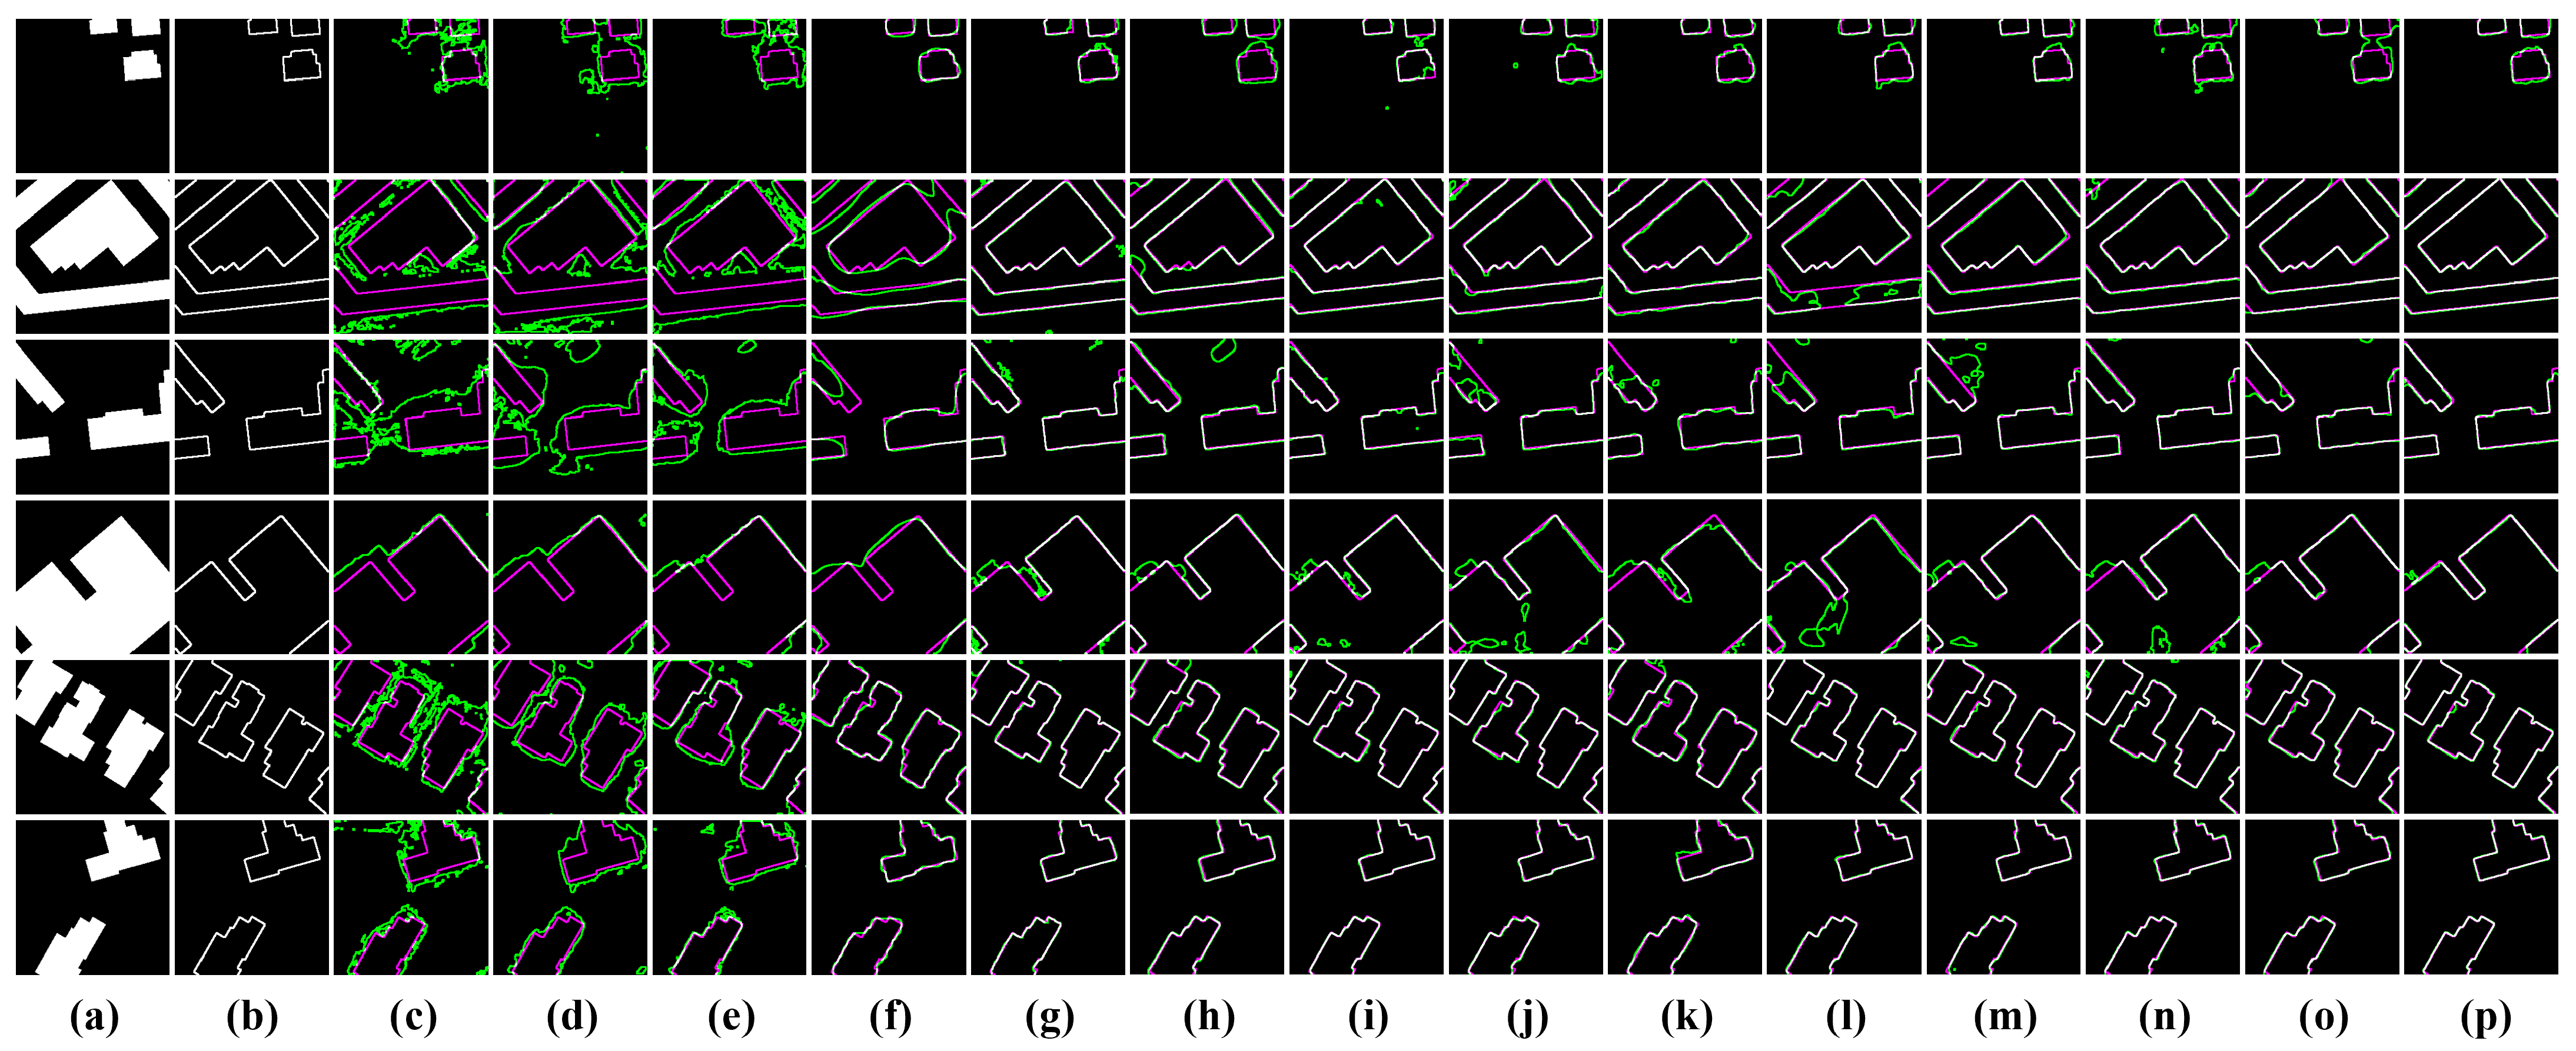
To further evaluate the change detection performance of different models on the WHU-CD dataset, the test results are visualized and compared with the original bi-temporal images as well as the labels, as shown in
Figure 10 (area) and
Figure 11 (edge). From
Figure 10, it can be seen that all methods can accurately locate the positions of change areas, but there are significant discrepancies in the discrimination of edge details. Models d–f have difficulty in discriminating pseudo-changes and uninteresting changes, leading to numerous false detections. Since the WHU-CD dataset focuses on changes in buildings, models d–f incorrectly detect roads or other types of changes. Other attention-based or ViT-based methods effectively differentiate between the different types of changes by enhancing attention to change areas and extracting global information, thus reducing the false detection number. The proposed LRNet integrates change features extracted from the three branches and utilizes change alignment modules to align change objects with constraints and accurately locate them. And then the change edges are refined from deep to shallow, which effectively balances the number of false detections and missed detections to achieve optimal results.
Figure 11 illustrates the edge discrimination performance of different models. It can be observed that the compared models exhibit varying degrees of bias in edge discrimination, manifested as false detections (green) and missed detections (purple). The edge discrimination results of the proposed LRNet are almost entirely white, i.e., they are identical to the labels, with only minor deviations in a few cases, significantly outperforming other methods. These quantitative and qualitative results demonstrate that the proposed LRNet effectively leverages the features extracted by the three-branch encoder for both the localization and refinement of changes, significantly enhancing the accuracy of change detection, particularly in the discrimination of change edges.
4.5. Ablation Study
In this section, the effectiveness of key components for LRNet will be discussed, including LOP, C2A, HCA, and E2A. Since HCA works on top of C2A, C2A and HCA are discussed together as a whole. The baseline, “Model base”, is a three-branch change detection model with VGG16 as the backbone. Ablation experiments were conducted on both datasets. As OA, F1, and IOU can evaluate the overall performance of the model, they were selected as the evaluation metrics for the ablation experiments, along with
and
. The results of the ablation experiments are presented in
Table 3.
(1) Effectiveness of LOP: To reduce information loss during feature extraction, LOP is proposed. As shown in
Table 3, Model1, with the addition of LOP to the model’s base, exhibits improvements in all four metrics (OA, F1, IOU, and
) on both datasets. Model5, built upon Model3 with the LOP module added, demonstrates significant improvements in all metrics on both datasets. Similarly, for Model6 and Model4, LRNet and Model7 also show the same trend. These findings suggest that the inclusion of LOP effectively reduces the loss of critical information, which in turn assists the model in identifying and detecting changes, thus improving the accuracy of change detection and validating the effectiveness of LOP.
(2) Effectiveness of C2A and HCA: To enable the interaction of change features from different branches and the fusion of features across levels for identifying targets of varying sizes, C2A and HCA are designed. Model2 adds the C2A module to the model’s base to assist in the interaction and fusion of change features. All metrics on both datasets show significant improvement, indicating that C2A effectively integrates features from different branches, aligning and strengthening the representation of change areas. Compared to Model2, Model3 has an additional HCA module, which propagates the change alignment attention map across different levels in a hierarchical and densely connected manner to enable precise localization of changes of varying sizes. Model3 exhibits improvements in area metrics (OA, F1, IOU) on both datasets, while the edge metrics ( and ) decrease on the LEVIR-CD dataset. This suggests that the addition of HCA helps the localization and identification of change areas in different scenarios, but may not be favorable for edge discrimination when the edge is unconstrained.
Considering C2A and HCA together, Model3 displays significant improvement in all metrics compared to the model’s base with the additional combination of C2A and HCA. Similar trends also occur between Model5 and Model1, Model7 and Model4, and LRNet and Model6. These results indicate that the combination of C2A and HCA effectively facilitates the interaction and fusion of change features, assisting in the localization and identification of change areas, which in turn improves the detection performance of the model. Additionally, this confirms the effectiveness of the proposed C2A and HCA.
(3) Effectiveness of E2A: To constrain and correct the change areas and edges in the localization results, the E2A module is proposed. Similarly, we constrain the inference results of LRNet in the same manner. Model4, Model6, Model7, and LRNet are obtained by adding the E2A module to the model’s base, Model1, Model3, and Model5, respectively. As shown in
Table 3, all the evaluation metrics on both datasets of the models with an additional E2A module are increased compared to the corresponding models without the addition. Notably, the edge metrics,
and
, show significant improvements, with gains of 2.51% and 2.67%, respectively. These results reflect the effective constraint imposed by the E2A module on change areas and edges, validating its effectiveness.
By sequentially adding the proposed modules to the model’s base, it is evident that the overall metrics on both datasets improve significantly. In particular, the E2A module plays a crucial role in edge discrimination, improving the detection accuracy of the areas when incorporated, with a larger improvement in edge discrimination compared to area-level metrics. The best performance is the base + LOP + C2A + HCA + E2A combination, i.e., the proposed network LRNet. The above results and findings strongly validate the outstanding change detection performance of LRNet, as well as the effectiveness and necessity of each module.
4.6. Discussion
(1) Discussion on loss functions: In this section, we evaluate the difference in the effectiveness of the models trained using BCE loss, IOU loss, and their joint loss, respectively. From
Table 4, it can be seen that the proposed model achieves the best performance when trained using the joint BCE and IOU loss. The model performs the worst when trained using BCE loss alone. Experimental results indicate that the joint loss can improve the model’s accuracy by leveraging the complementary constraints of BCE and IoU, where IoU places greater emphasis on segmentation accuracy and better handles class imbalance in change areas with fewer categories. Additionally, it is noteworthy that the use of joint loss improves the accuracy of change edge detection significantly more than that of change area detection.
(2) Complexity analysis: For a comprehensive and fair comparison of the performance, we evaluate the complexity of the models using the number of parameters (Params) and floating-point operations (FLOPs). Furthermore, the ratio of FLOPs to Params is introduced to measure the efficiency of the parameters, where a lower value indicates that the increase in parameters brings about a proportionally smaller increase in computational load.
Table 5 presents the complexity metrics of different models along with their comprehensive evaluation results on each dataset. It can be seen that FC-EF, FC-Siam-Conc, and FC-Siam-Diff have the lowest FLOPs and Params, but they also exhibit the poorest performance on both datasets. The other compared models improve feature extraction capabilities and increase model complexity through the introduction of deeper network structures, attention mechanisms, deep supervision, or ViT modules. These models lead to an increase in both FLOPs and Params, and simultaneously achieve significantly improved change detection accuracy. Although the proposed LRNet utilizes three branches for feature extraction, resulting in the highest FLOPs and Params, its ratio of FLOPs to Params is the second lowest, indicating that the parameter increase is efficient and does not proportionally raise the computational load. Notably, while maintaining reasonably acceptable levels of Params and FLOPs, the proposed LRNet achieves the best comprehensive evaluation results on both datasets.
5. Conclusions
In this study, a novel change detection network based on a localization-then-refinement strategy, namely LRNet, is proposed to address the challenge of discriminating change edges. LRNet consists of two stages, namely, localization and refinement. In the localization stage, a three-branch encoder extracts features from the original images and their differences from shallow to deep, progressively locating the position of each changed area. LOP is proposed to reduce information loss during feature extraction and participate in the optimization of the entire network. The C2A and HCA modules are proposed to integrate change feature information from different branches and accurately locate changed areas of various sizes. In the refinement stage, E2A is designed to constrain and refine the localization results. By combining the difference features enhanced by C2A from deep to shallow, different sizes of changed areas and their edges are refined, ultimately obtaining accurate results. The proposed LRNet achieves the best comprehensive evaluation metrics and the most precise edge discrimination results compared to the 13 other state-of-the-art methods on the LEVIR-CD and WHU-CD datasets. However, the current model still has some shortcomings. While achieving optimal detection accuracy, the overall complexity of the proposed LRNet is relatively high. In the future, we will explore lightweight backbones or knowledge distillation methods to reduce model complexity while maintaining high detection accuracy. Additionally, we will investigate more advanced and efficient techniques to support more complex scenarios.


