1. Introduction
Interferometric synthetic aperture radar (InSAR), which combines space geodesy with active microwave remote sensing, has become a powerful tool for monitoring surface deformation. Its advantages—including wide spatial coverage, high spatial resolution, and all-weather, day-and-night observation capabilities—make it especially well-suited for geodetic applications. InSAR has been widely adopted in geoscience research, playing a critical role in monitoring earthquakes and fault movements [
1,
2,
3,
4], volcanic activity [
5,
6,
7], land subsidence [
8,
9], landslides [
10,
11], and changes in glaciers and permafrost [
12,
13,
14,
15]. In recent years, advances in synthetic aperture radar (SAR) satellite missions have significantly enhanced the availability and accessibility of SAR data, further propelling the development and application of InSAR techniques. The Sentinel-1 SAR satellites, operated by the European Space Agency (ESA), have become a cornerstone of modern InSAR-based deformation monitoring. Featuring a short revisit cycle (12 days for a single satellite and 6 days for the two-satellite constellation), a wide imaging swath (~250 km per scene), and an open-access policy, the Sentinel-1 mission generates over 10 terabytes of SAR data daily [
16]. This unprecedented data volume lays a solid foundation for leveraging deep learning (DL) techniques in InSAR analysis, opening new possibilities for large-scale, data-driven deformation research.
Deep learning has been widely adopted in remote sensing [
17], with most research centered on tasks such as land cover classification, object detection, change detection, and semantic segmentation using optical data (including multispectral and hyperspectral imagery) and SAR data [
18,
19,
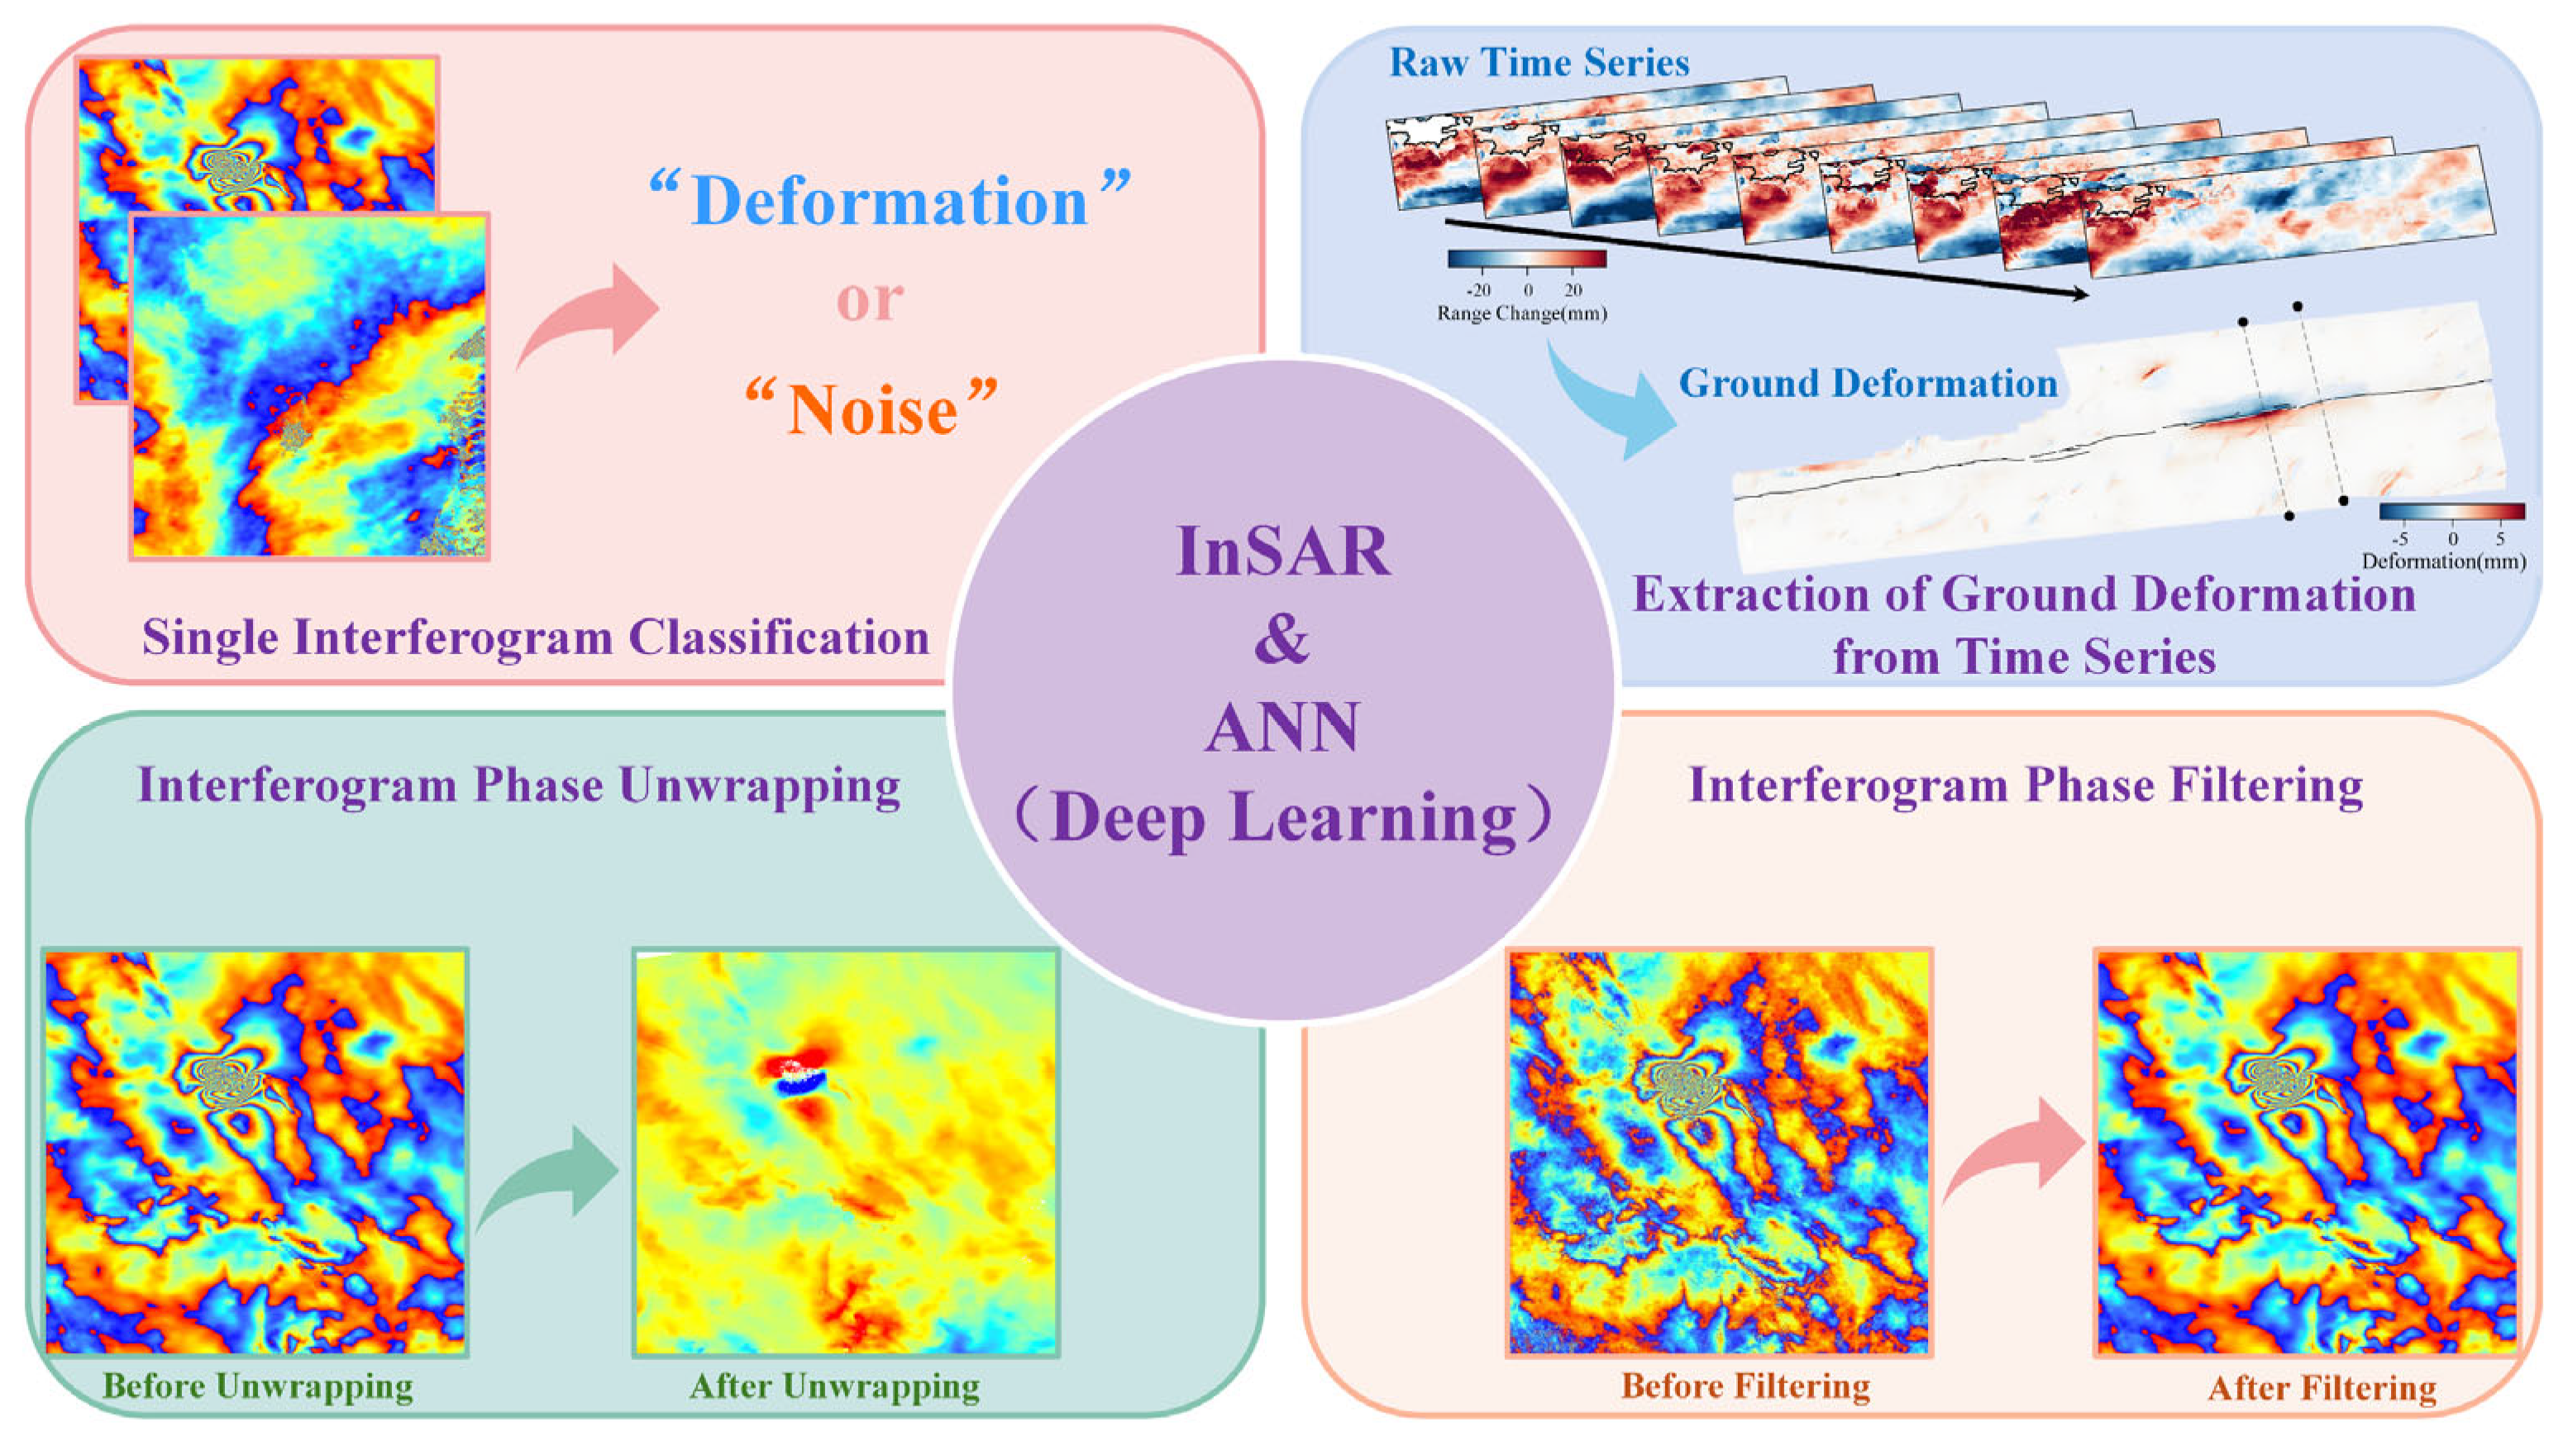
20]. In contrast, research specifically focused on InSAR remains relatively limited, especially studies that leverage its geodetic measurement capability—specifically, the phase information in SAR data—for deep learning applications. As illustrated in
Figure 1, current deep learning applications with InSAR primarily rely on artificial neural networks (ANNs) and address tasks such as the classification of wrapped or unwrapped interferograms [
21,
22], millimeter-level ground deformation extraction from InSAR time series [
23,
24], phase unwrapping [
25,
26], and phase filtering [
27,
28]. However, the effectiveness of these methods is often limited by the lack of high-quality labeled training data and the high cost of manual annotation. To address these challenges, many studies utilize large-scale synthetic datasets and data augmentation (DA) techniques [
29]. While such strategies help alleviate issues related to limited training data and class imbalance [
30], significant distributional differences between synthetic and real-world observational data may hinder the generalization capability of trained models in real-world scenarios.
Currently, the absence of a large-scale, high-quality training dataset of coseismic InSAR samples poses a major barrier to the advancement and application of deep learning in geophysical research and earthquake hazard monitoring. Owing to the complexity of acquiring and processing InSAR data, most current deep learning studies rely on small, manually curated datasets, which are insufficient to meet the data-intensive demands of modern deep learning models. InSAR observations consist of a complex superposition of signals, including not only actual ground deformation but also residual atmospheric delays, topographic artifacts, and spatiotemporal decorrelation noise introduced during data processing [
31]. Although numerical models for simulating surface deformation are relatively advanced, the complex spatiotemporal variability of InSAR noise often limits the effectiveness of synthetic datasets in training deep learning models [
21,
32]. Therefore, it is essential to develop an automated and scalable approach to generating large-scale training datasets from real InSAR observations, particularly for coseismic deformation. Establishing a standardized database of observed coseismic InSAR samples would offer a more reliable and representative foundation for deep learning applications in InSAR-based earthquake monitoring and geophysical studies.
This study is built upon the open-source Sentinel-1 InSAR database provided by COMET LiCSAR [
33,
34] and the Global Centroid Moment Tensor (GCMT) earthquake catalog. Through automated data retrieval and processing, we obtained global coseismic InSAR deformation fields spanning 2015 to 2024. By applying sliding-window segmentation and data augmentation, we created a labeled dataset for training deep learning models, offering open-source training data to support deep learning applications in earthquake hazard analysis.
2. Related Work
Although the satellites generate a vast amount of SAR data daily, InSAR interferograms that contain clear seismic deformation signals remain extremely scarce due to the prevalence of noise sources such as atmospheric delays and decorrelation. This results in a significant data imbalance problem. Specifically, interferograms exhibiting coseismic deformation are vastly outnumbered by those dominated by noise. To mitigate this challenge, researchers have adopted several dataset-oriented strategies, such as applying data augmentation to expend real interferogram samples, generating synthetic interferograms using physical modeling, and employing generative adversarial networks (GANs) to enrich the dataset.
2.1. Physical Model-Based Synthesis of Deformation Interferograms
Synthetic datasets derived from physical models offer an effective means of addressing the scarcity of real-world data. Numerical simulation techniques for generating surface deformation fields using physical models are now relatively well established. Most existing approaches are based on Okada’s elastic half-space dislocation theory [
35]. By randomly sampling source parameters such as fault strike, dip angle, and slip, researchers can simulate a wide variety of coseismic deformation fields. Because of the complexity and variety of noise, which make precise simulation challenging, synthetic data generation often focuses on accurately modeling different types of noise. For instance, Brengman et al. [
21] synthesized atmospheric noise with spatial wavelengths ranging from 10 km to 100 km and simulated topographic noise by randomly scaling digital elevation models (DEMs). Rouet-Leduc et al. [
24] further modeled atmospheric turbulence delays using Gaussian noise and simulated terrain-related delays with a quadratic polynomial. They also introduced random pixels to simulate decorrelation and phase unwrapping errors. Subsequent studies on InSAR time series employed more refined noise modeling techniques, using various functional models to simulate both temporal and spatial noise components [
36,
37]. Numerous studies have shown that physically based interferogram synthesis techniques can effectively produce data resembling real interferograms, thereby partially alleviating the problem of data scarcity.
The fidelity of the physical model directly affects the quality of the synthetic data. The physical processes underlying seismic deformation are inherently complex. Although current physical models are capable of simulating ground deformation to some degree, they fall short in capturing the full range of potential deformation scenarios–especially in regions with irregular topography, complex geological settings, or across varying temporal scales. More importantly, synthesizing noise is substantially more difficult than modeling deformation. Various types of interferometric noise—including atmospheric delays, topographic distortions, decorrelation, orbital errors, and processing-induced artifacts—exhibit highly intricate spatial patterns and temporal variability. Existing physical models face significant limitations in accurately replicating such noise components. Consequently, the overall quality of synthetic interferograms is largely constrained by the fidelity of the underlying physical models.
2.2. Expanding the Number of Interferograms with Data Augmentation
To overcome challenges posed by limited dataset sizes and imbalanced data distribution—which often result in model overfitting and poor generalization—researchers have introduced image data augmentation techniques. The fundamental principle of data augmentation lies in applying various transformation operations to original samples to generate numerous new instances that closely resemble—but are not identical to—the originals (e.g., Anantrasirichai et al. [
32]). Data augmentation has proven particularly effective in constructing InSAR image datasets, especially when deformation data are scarce, as it significantly increases the number of available samples. In a study by Brengman et al. [
21] that focused on detecting coseismic deformation in InSAR imagery using deep learning, data augmentation techniques—including horizontal and vertical flipping, random 30° rotations, and lateral shifts—were employed to alleviate the scarcity of real deformation interferograms. As a result, 32 interferograms were expanded to 3168 samples, enabling the final model to achieve a detection accuracy of 85.22% through transfer learning.
The effectiveness of data augmentation methods is largely determined by the size and quality of the original dataset. Although data augmentation can increase dataset size through various transformations, the generated data remain constrained by the inherent characteristics and distribution of the original dataset, making it difficult to fundamentally resolve the problem of data scarcity. In other words, even with data augmentation, class imbalance remains a significant issue [
38], and the limited number of deformation samples may be inadequate to fully capture the diversity of global seismic deformation patterns. Compared to data synthesized using physical models, augmented data generally lack the diversity and complexity required to represent real-world conditions.
2.3. Enhancing Real Data with Generative Adversarial Networks (GANs)
With the rapid development of deep learning technologies, generative adversarial networks (GANs) have shown considerable promise in image generation and data augmentation. In the domain of InSAR image processing—especially under data-scarce conditions—GANs have been successfully utilized for data augmentation. By leveraging adversarial training between a generator and a discriminator, GANs are capable of producing synthetic images that closely approximate the distribution of real data, thereby compensating for the limited availability of authentic datasets. Zhou et al. [
39] successfully generated InSAR images resembling real deformation signals using GANs, presenting a novel approach to addressing sample scarcity. As noted by Shorten and Khoshgoftaar [
29], GANs represent one of the most promising techniques for data augmentation. Without question, GANs hold considerable potential for the generation and enhancement of InSAR imagery, particularly in applications involving surface deformation signals associated with volcanic or seismic activity. By generating samples that closely mirror real observational data, GANs can significantly enhance training performance and model accuracy.
The realism and physical fidelity of InSAR interferograms generated by GANs involve inherent uncertainties. Compared to physically based data synthesis methods, GANs exhibit limited capability in accurately replicating real-world physical contexts and noise characteristics. Physical models, which incorporate complex processes such as seismic activity and topographic variations, can produce interferograms that maintain both physical consistency and accuracy. In contrast, GANs rely heavily on large volumes of real training data, and their performance often degrades significantly under data-scarce conditions. As a result, the generated interferograms may lack meaningful physical grounding, often leading to reduced output quality. Although GANs are capable of generating visually plausible images through adversarial training between the generator and discriminator [
40], their model architectures inherently lack an understanding of physical processes such as seismic deformation. Consequently, the generated images may exhibit discrepancies when compared to actual physical phenomena.
3. Materials and Methods
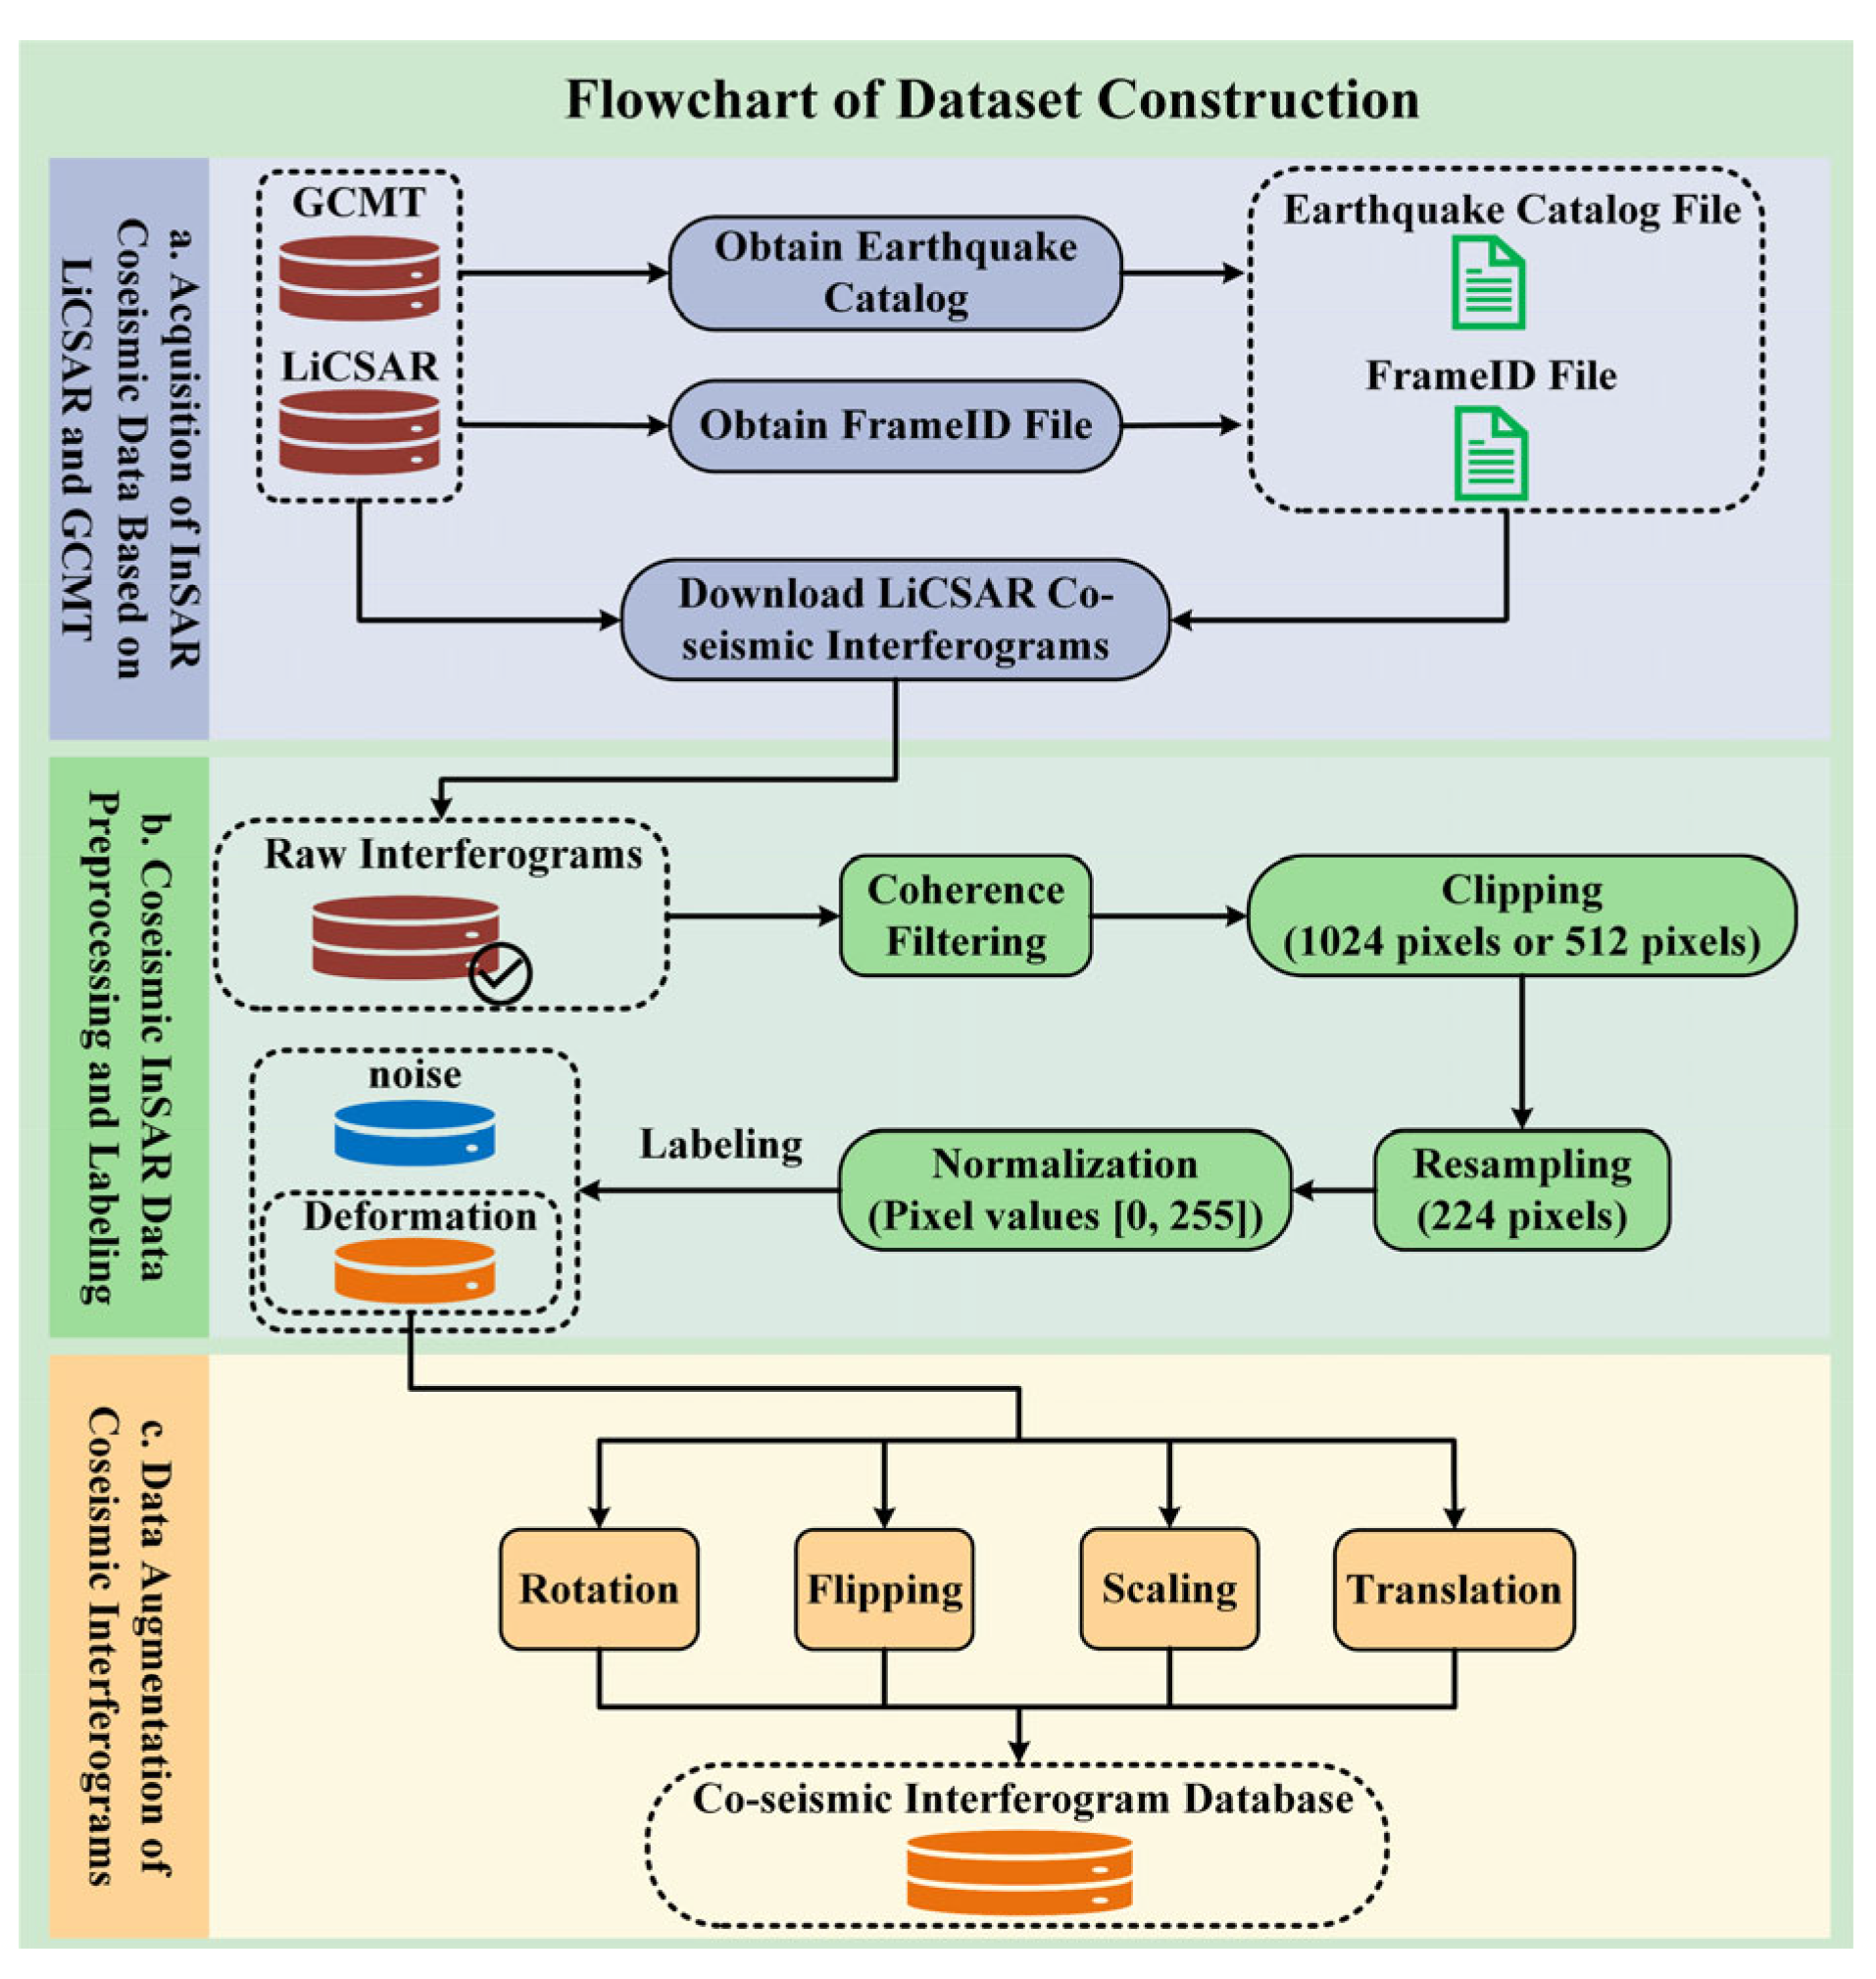
Real observational data better capture the complexity of seismic deformation scenarios and the multifaceted noise characteristics inherent in real-world observations. Consequently, deep learning models trained on real observational data demonstrate improved generalizability and robustness in real-world applications. Moreover, a comprehensive observational dataset serves as a foundation for implementing data augmentation and GAN-based methods, enabling the construction of large-scale training datasets. This study presents an automated approach to constructing datasets using the Sentinel-1 InSAR database (COMET LiCSAR), aiming to enhance the efficiency of data acquisition, processing, and augmentation. The detailed workflow is illustrated in
Figure 2.
3.1. Experimental Environment
To ensure the reproducibility and transparency of our dataset construction workflow, we present a detailed description of the computational environment and software tools employed in this study. All data preprocessing, image patch generation, and labeling procedures were performed at a workstation featuring an Intel® Core™ i5-14600KF CPU (3.5 GHz, 14 cores; Intel Corporation, Santa Clara, CA, USA), 64 GB of RAM, and an NVIDIA® GeForce RTX 3080 Ti GPU with 12 GB of VRAM (NVIDIA Corporation, Santa Clara, CA, USA). The system ran on Ubuntu Linux, version 22.04 LTS.
The preprocessing and labeling pipeline was developed using Python 3.12, incorporating the following key libraries and tools:
NumPy (v2.2.3): utilized for efficient numerical computations and array manipulation.
OpenCV (v4.11.0): employed for image cropping, resizing, interpolation, and visualization.
Matplotlib (v3.10.0): used to visualize interferograms within the graphical user interface.
GDAL (v3.10.2): applied for managing GeoTIFF files and performing geospatial operations.
scikit-image (v0.25.2): used for image filtering and normalization.
Tkinter (v8.6): used to develop the custom graphical user interface for the labeling process.
PyTorch (v2.6.0): employed for preliminary compatibility testing with deep learning frameworks.
All data processing scripts and labeling tools were executed within a Conda virtual environment to ensure consistency and reproducibility across software versions.
3.2. Methodology for Acquiring Coseismic InSAR Data Based on LiCSAR and GCMT
This study proposes a methodology for acquiring coseismic InSAR data based on LiCSAR and GCMT, aiming to meet the increasing demand for large-scale, high-quality datasets in deep learning research. In this approach, the global earthquake catalog is automatically retrieved from the GCMT website (
https://www.globalcmt.org/CMTsearch.html, accessed on 11 February 2025). Researchers define filtering criteria, including time range (start and end dates), magnitude range, geographic bounds (latitude and longitude), and focal depth. Based on these parameters, the system accesses the GCMT database and employs Python-based web scraping techniques to efficiently extract relevant earthquake information. The retrieved catalog contains key attributes, including event time, epicenter coordinates, and focal depth. The structured data are then stored locally to support subsequent InSAR interferogram retrieval.
Building on this, the system automatically scrapes the LiCSAR website to retrieve the geographic extent (latitude and longitude range) associated with each Sentinel-1 satellite FrameID. By parsing the LiCSAR product catalog, the system maps each FrameID to its geographic coverage, providing an accurate foundation for subsequent data acquisition. This process generates a reference table containing FrameIDs and their associated geographic bounds, ensuring that future InSAR interferogram downloads can be accurately matched to relevant FrameIDs based on earthquake epicenter locations. This significantly improves both the efficiency and accuracy of the data retrieval process.
After retrieving the earthquake catalog and FrameID reference files, the system uses the epicenter coordinates of each earthquake to accurately match the corresponding FrameID. It then automatically downloads the preprocessed Sentinel-1 coseismic interferograms from the LiCSAR website. All downloaded data are stored in a local database, along with detailed metadata, including FrameID, acquisition time, and data source, to ensure full traceability. Furthermore, the system incorporates an automated validation mechanism to verify data integrity and prevent redundant downloads. In the event of a download failure or missing data, an automatic retry mechanism is triggered to ensure maximum data quality, completeness, and usability.
3.3. Coseismic InSAR Data Preprocessing and Labeling
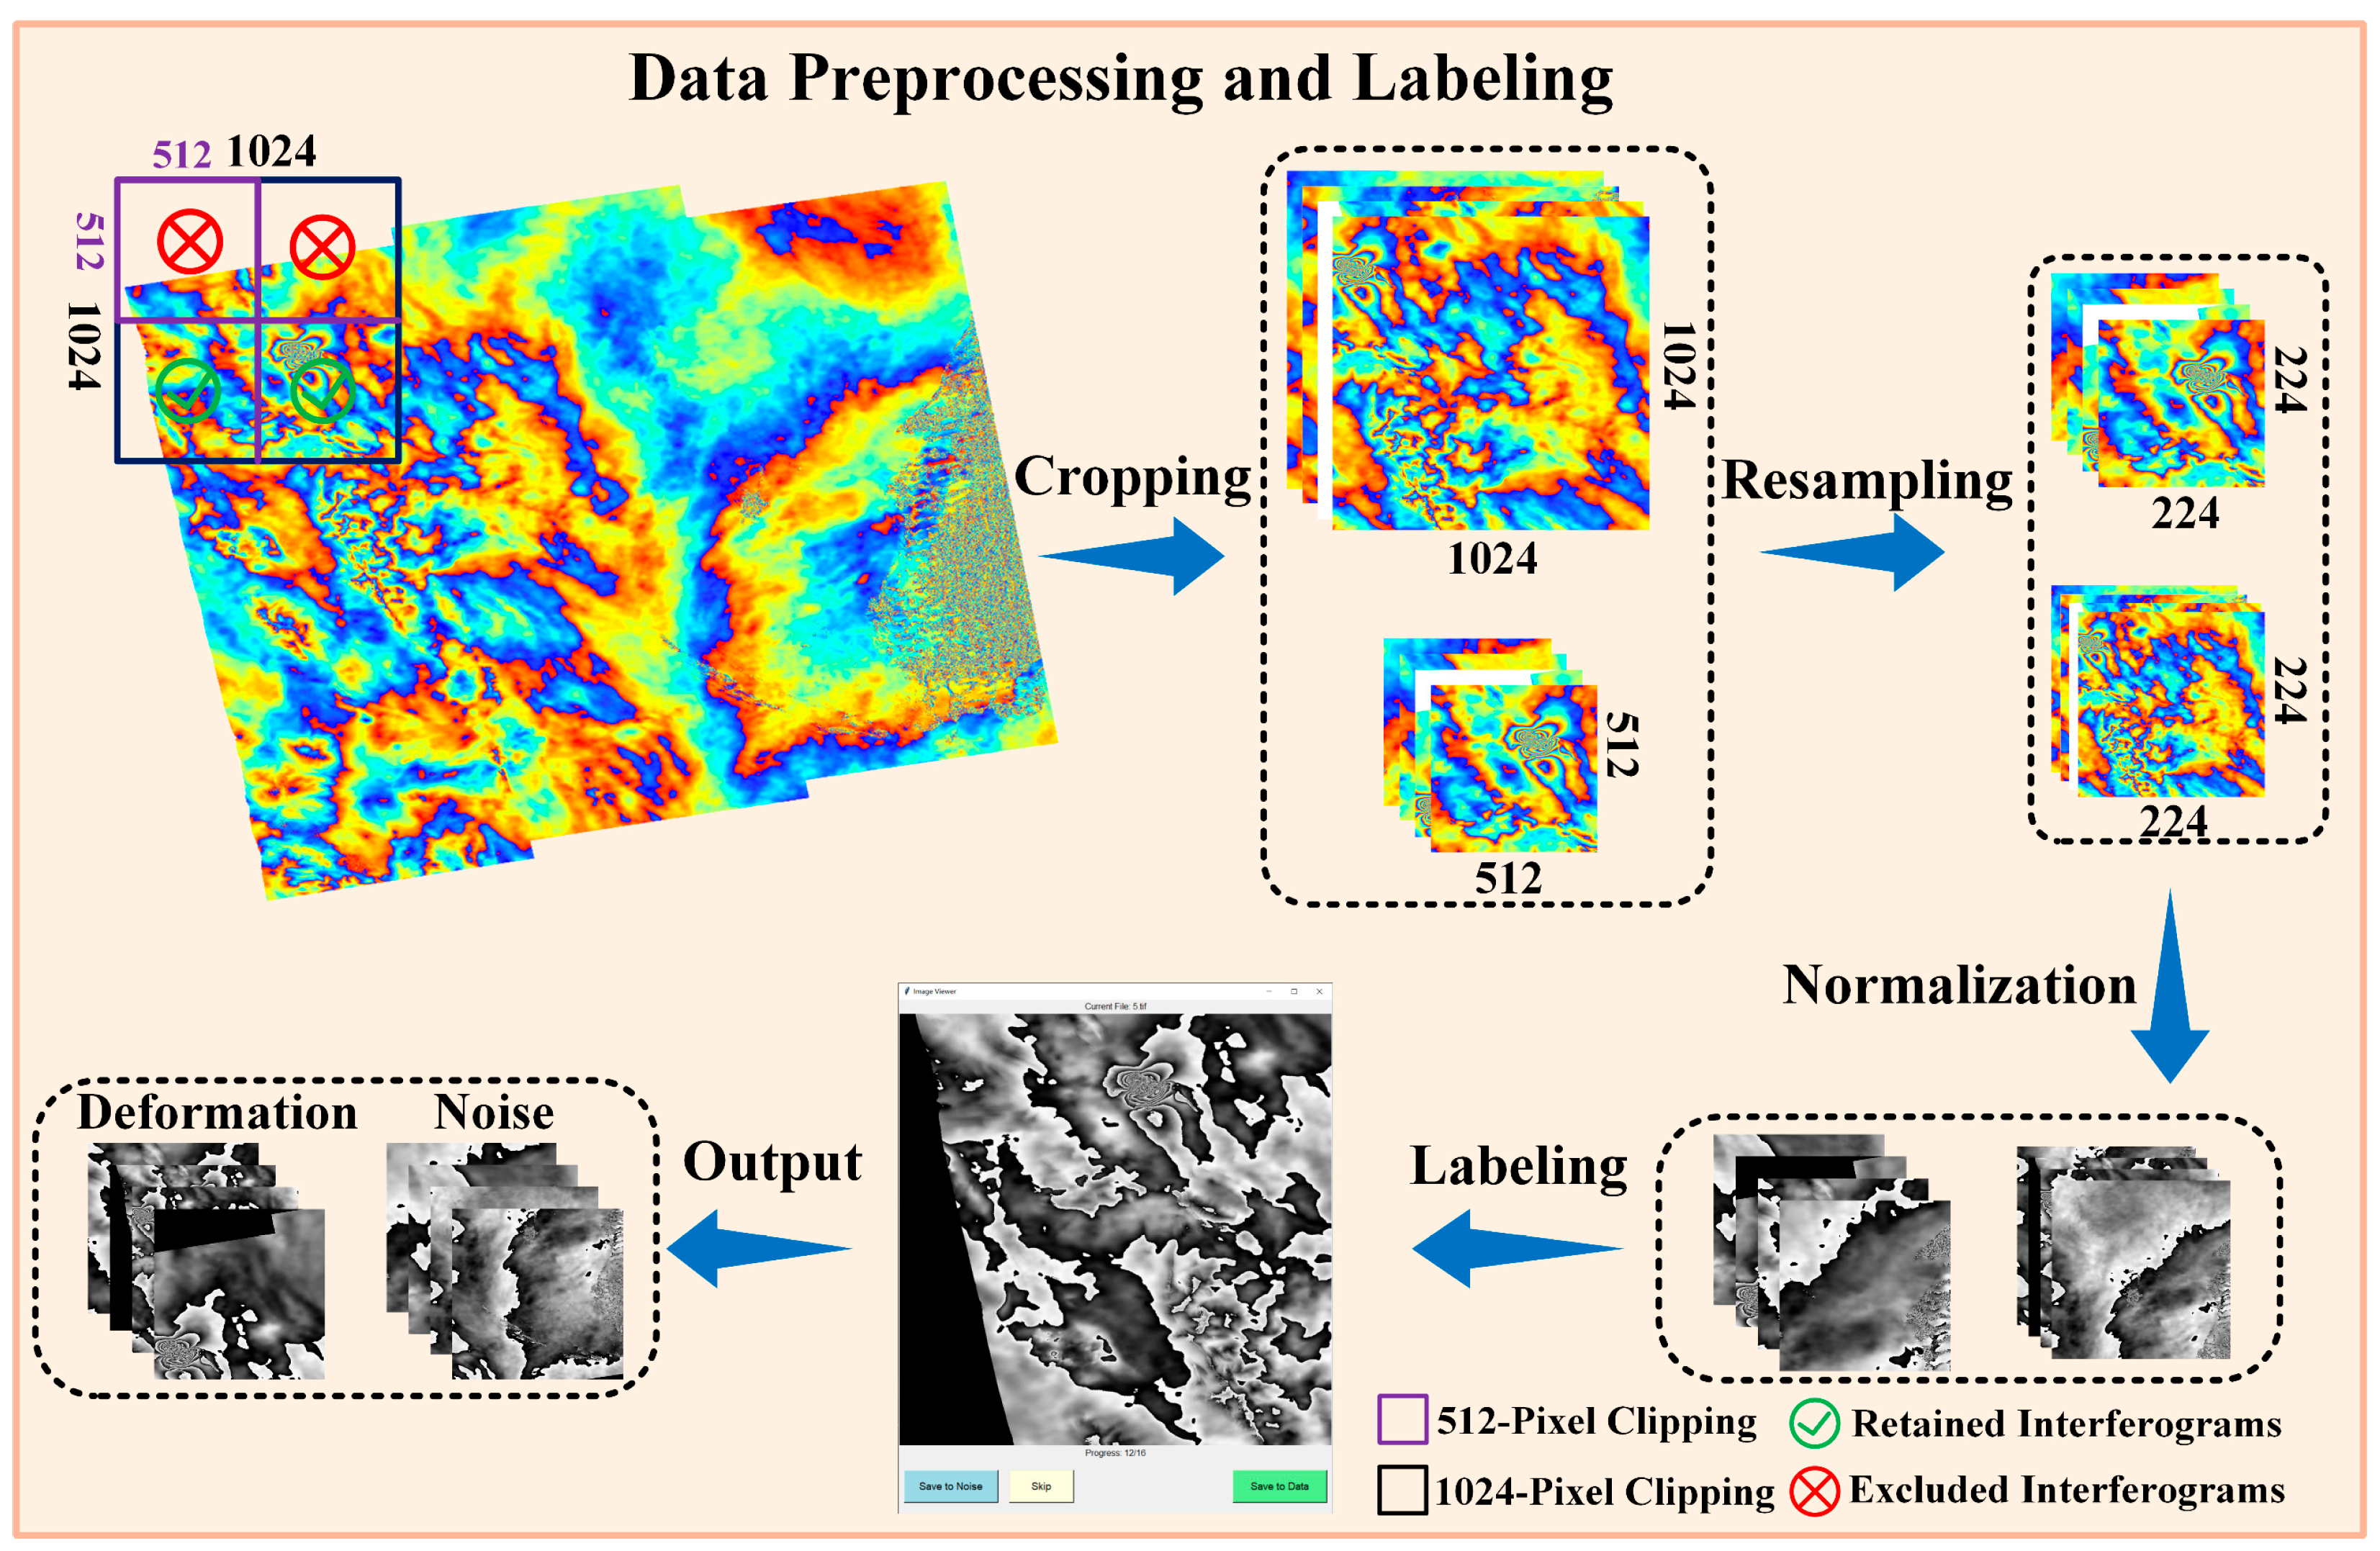
The InSAR coseismic interferograms obtained in the previous steps are typically large-scale image files that require preprocessing before being used for deep learning model training. To improve model generalization and stability, a systematic preprocessing pipeline is applied, as illustrated in
Figure 3. The preprocessing consists of the following steps:
Coherence Filtering: Interferograms with more than 20% missing or invalid pixels are discarded to eliminate low-quality data affected by severe decorrelation or data gaps, thereby retaining only high-quality images with reliable deformation information.
Cropping: To improve training efficiency and reduce memory consumption, large-size interferograms are cropped into smaller patches of uniform size and resolution (e.g., 1024 × 1024 or 512 × 512 pixels). During this process, priority is given to preserving regions containing seismic deformation while minimizing the inclusion of irrelevant areas to maintain the integrity of valid deformation signals.
Resampling: Cropped image patches are resampled to a fixed size of 224 × 224 pixels using cubic convolution interpolation to match the input requirements of deep learning models. This standardization improves dataset consistency and facilitates efficient model training.
Normalization: Pixel values are normalized to the standard range of [0, 255] to reducing grayscale variability across samples and ensure a uniform data distribution. This process improves model stability, reduces gradient fluctuations during training, accelerates convergence, and enhances overall model performance.
To classify each image patch as either “Deformation” or “Noise”, we employed a semi-automated labeling tool developed in Python, utilizing libraries such as Matplotlib, OpenCV, and NumPy. This tool incorporates a graphical user interface (GUI) that allows annotators to visually inspect interferograms and identify the presence or absence of discernible coseismic deformation signals. Although the classification process remains primarily manual, the interactive interface and streamlined workflow significantly reduce the time and effort required to construct large-scale datasets compared to conventional labeling approaches.
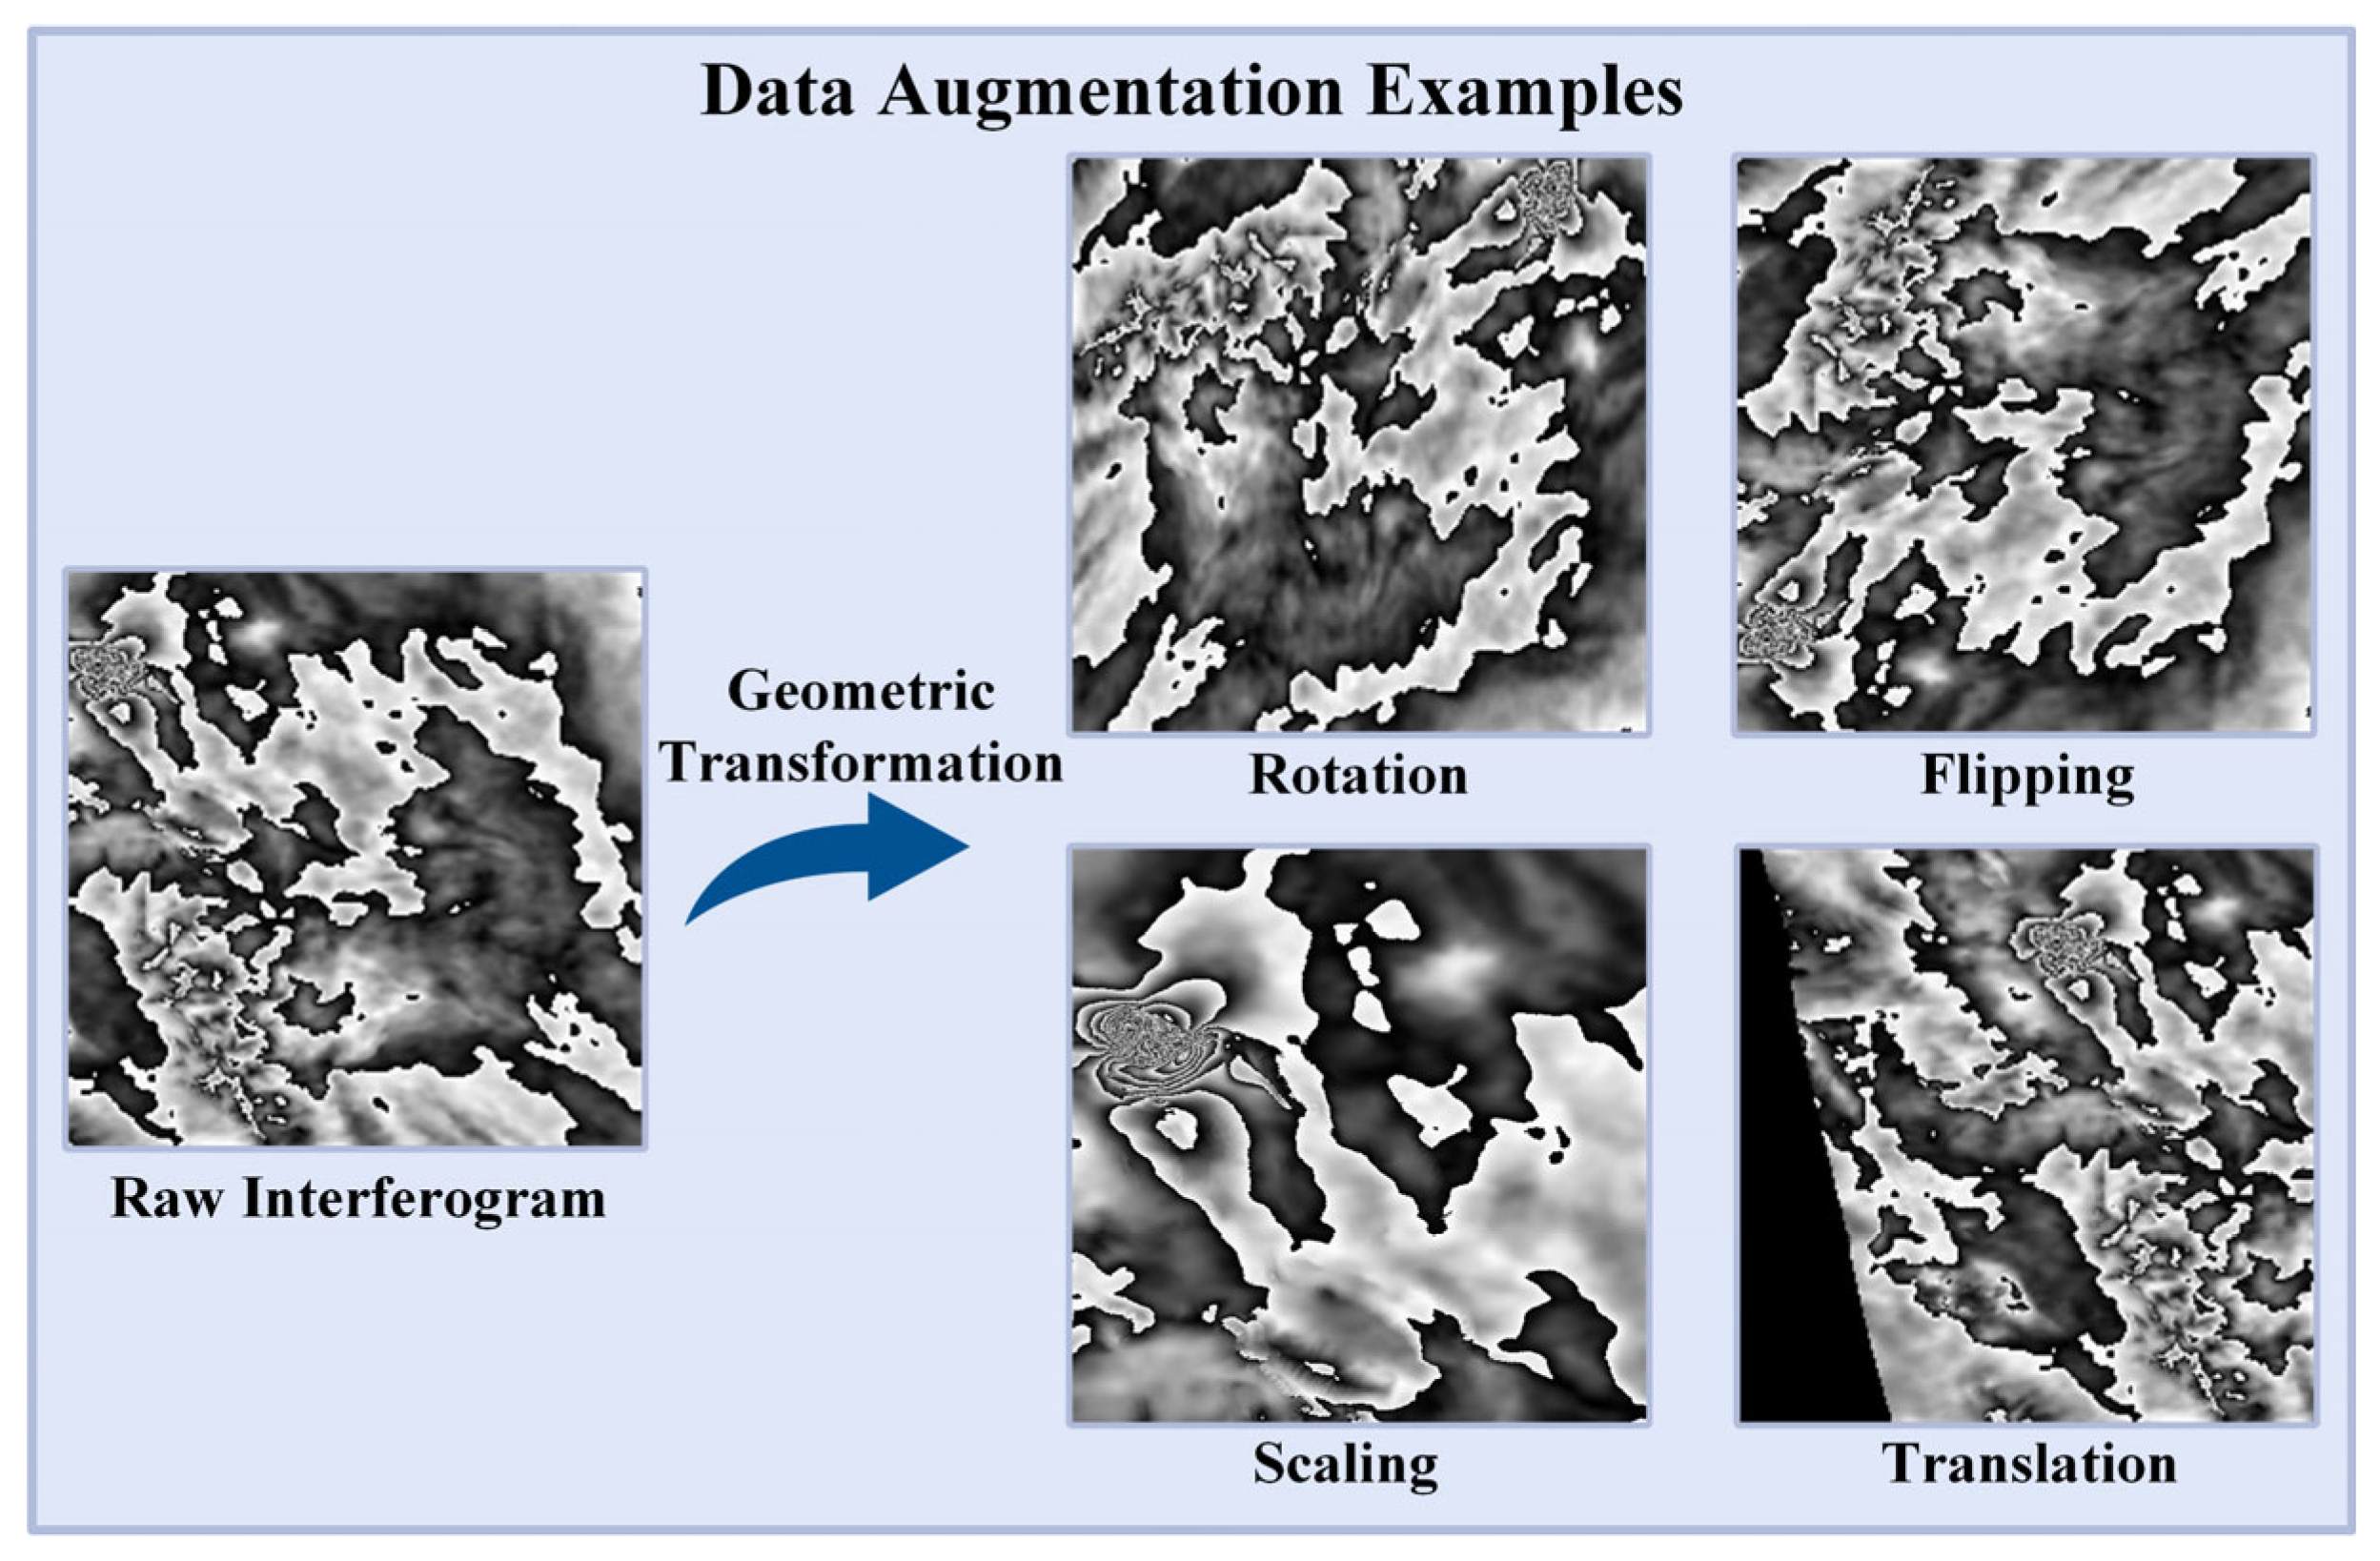
3.4. Data Augmentation for Coseismic InSAR Interferograms
The quality and distribution of training samples play a critical role in determining the performance of deep learning models. Low-quality or imbalanced data can introduce dataset bias and degrade predictive accuracy. To increase dataset diversity and enhance model generalization, standard data augmentation techniques were applied to the labeled “Deformation” samples, as illustrated in
Figure 4. These techniques included random rotations, flips (horizontal, vertical, and diagonal), scaling, translations, and their combinations. These transformations simulated diverse earthquake scenarios and deformation patterns, enabling the model to generalize more effectively across various geophysical conditions.
Through systematic preprocessing and augmentation, a large-scale and diverse InSAR coseismic deformation dataset was constructed, encompassing earthquakes of varying magnitudes, geographic regions, and focal depths. The standardized workflow ensured data consistency, accuracy, and overall high quality. From the preprocessed interferograms, 1773 high-quality samples were selected and augmented to generate a total of 14,000 images via augmentation, significantly increasing the dataset’s scale and diversity. This enriched dataset provides a robust and comprehensive foundation for training subsequent deep learning models. The dataset is publicly available at
https://zenodo.org/records/15382562, accessed on 11 April 2025.
4. Results
This dataset comprises 62 moderate-to-large earthquakes (Mw 5.5–7.5) that occurred worldwide between 1 October 2015 and 31 December 2024. These events were selected based on the following criteria:
Availability of preprocessed Sentinel-1 interferograms from the COMET LiCSAR archive;
Presence of clear and coherent coseismic deformation signals in the interferograms, with minimal noise contamination;
Minimal decorrelation due to vegetation, surface water, or large temporal baselines;
Inclusion of onshore moderate-to-large earthquakes (Mw ≥ 5.5) exhibiting significant and interpretable surface deformation.
Detailed parameters for these events are listed in
Table 1. Based on the methodology described in
Section 2, a total of 353 raw interferograms (with a resolution of approximately 3000 × 2500 pixels) were automatically retrieved for these earthquakes. These interferograms were subsequently processed through a standardized workflow that included image cropping, quality filtering, resampling, and normalization, yielding 1773 high-quality, standardized coseismic interferograms with dimensions of 224 × 224 pixels. Data augmentation techniques were then applied to expand the dataset to 14,000 images, significantly increasing both the scale and diversity of real interferogram samples.
This section presents a comprehensive statistical analysis of the dataset from various perspectives, including spatial and temporal distribution, magnitude range, focal depth, and earthquake classification. The objective is to demonstrate the scientific value and broad applicability of the dataset for InSAR-based studies of coseismic deformation.
4.1. Spatiotemporal Distribution Statistical Analysis
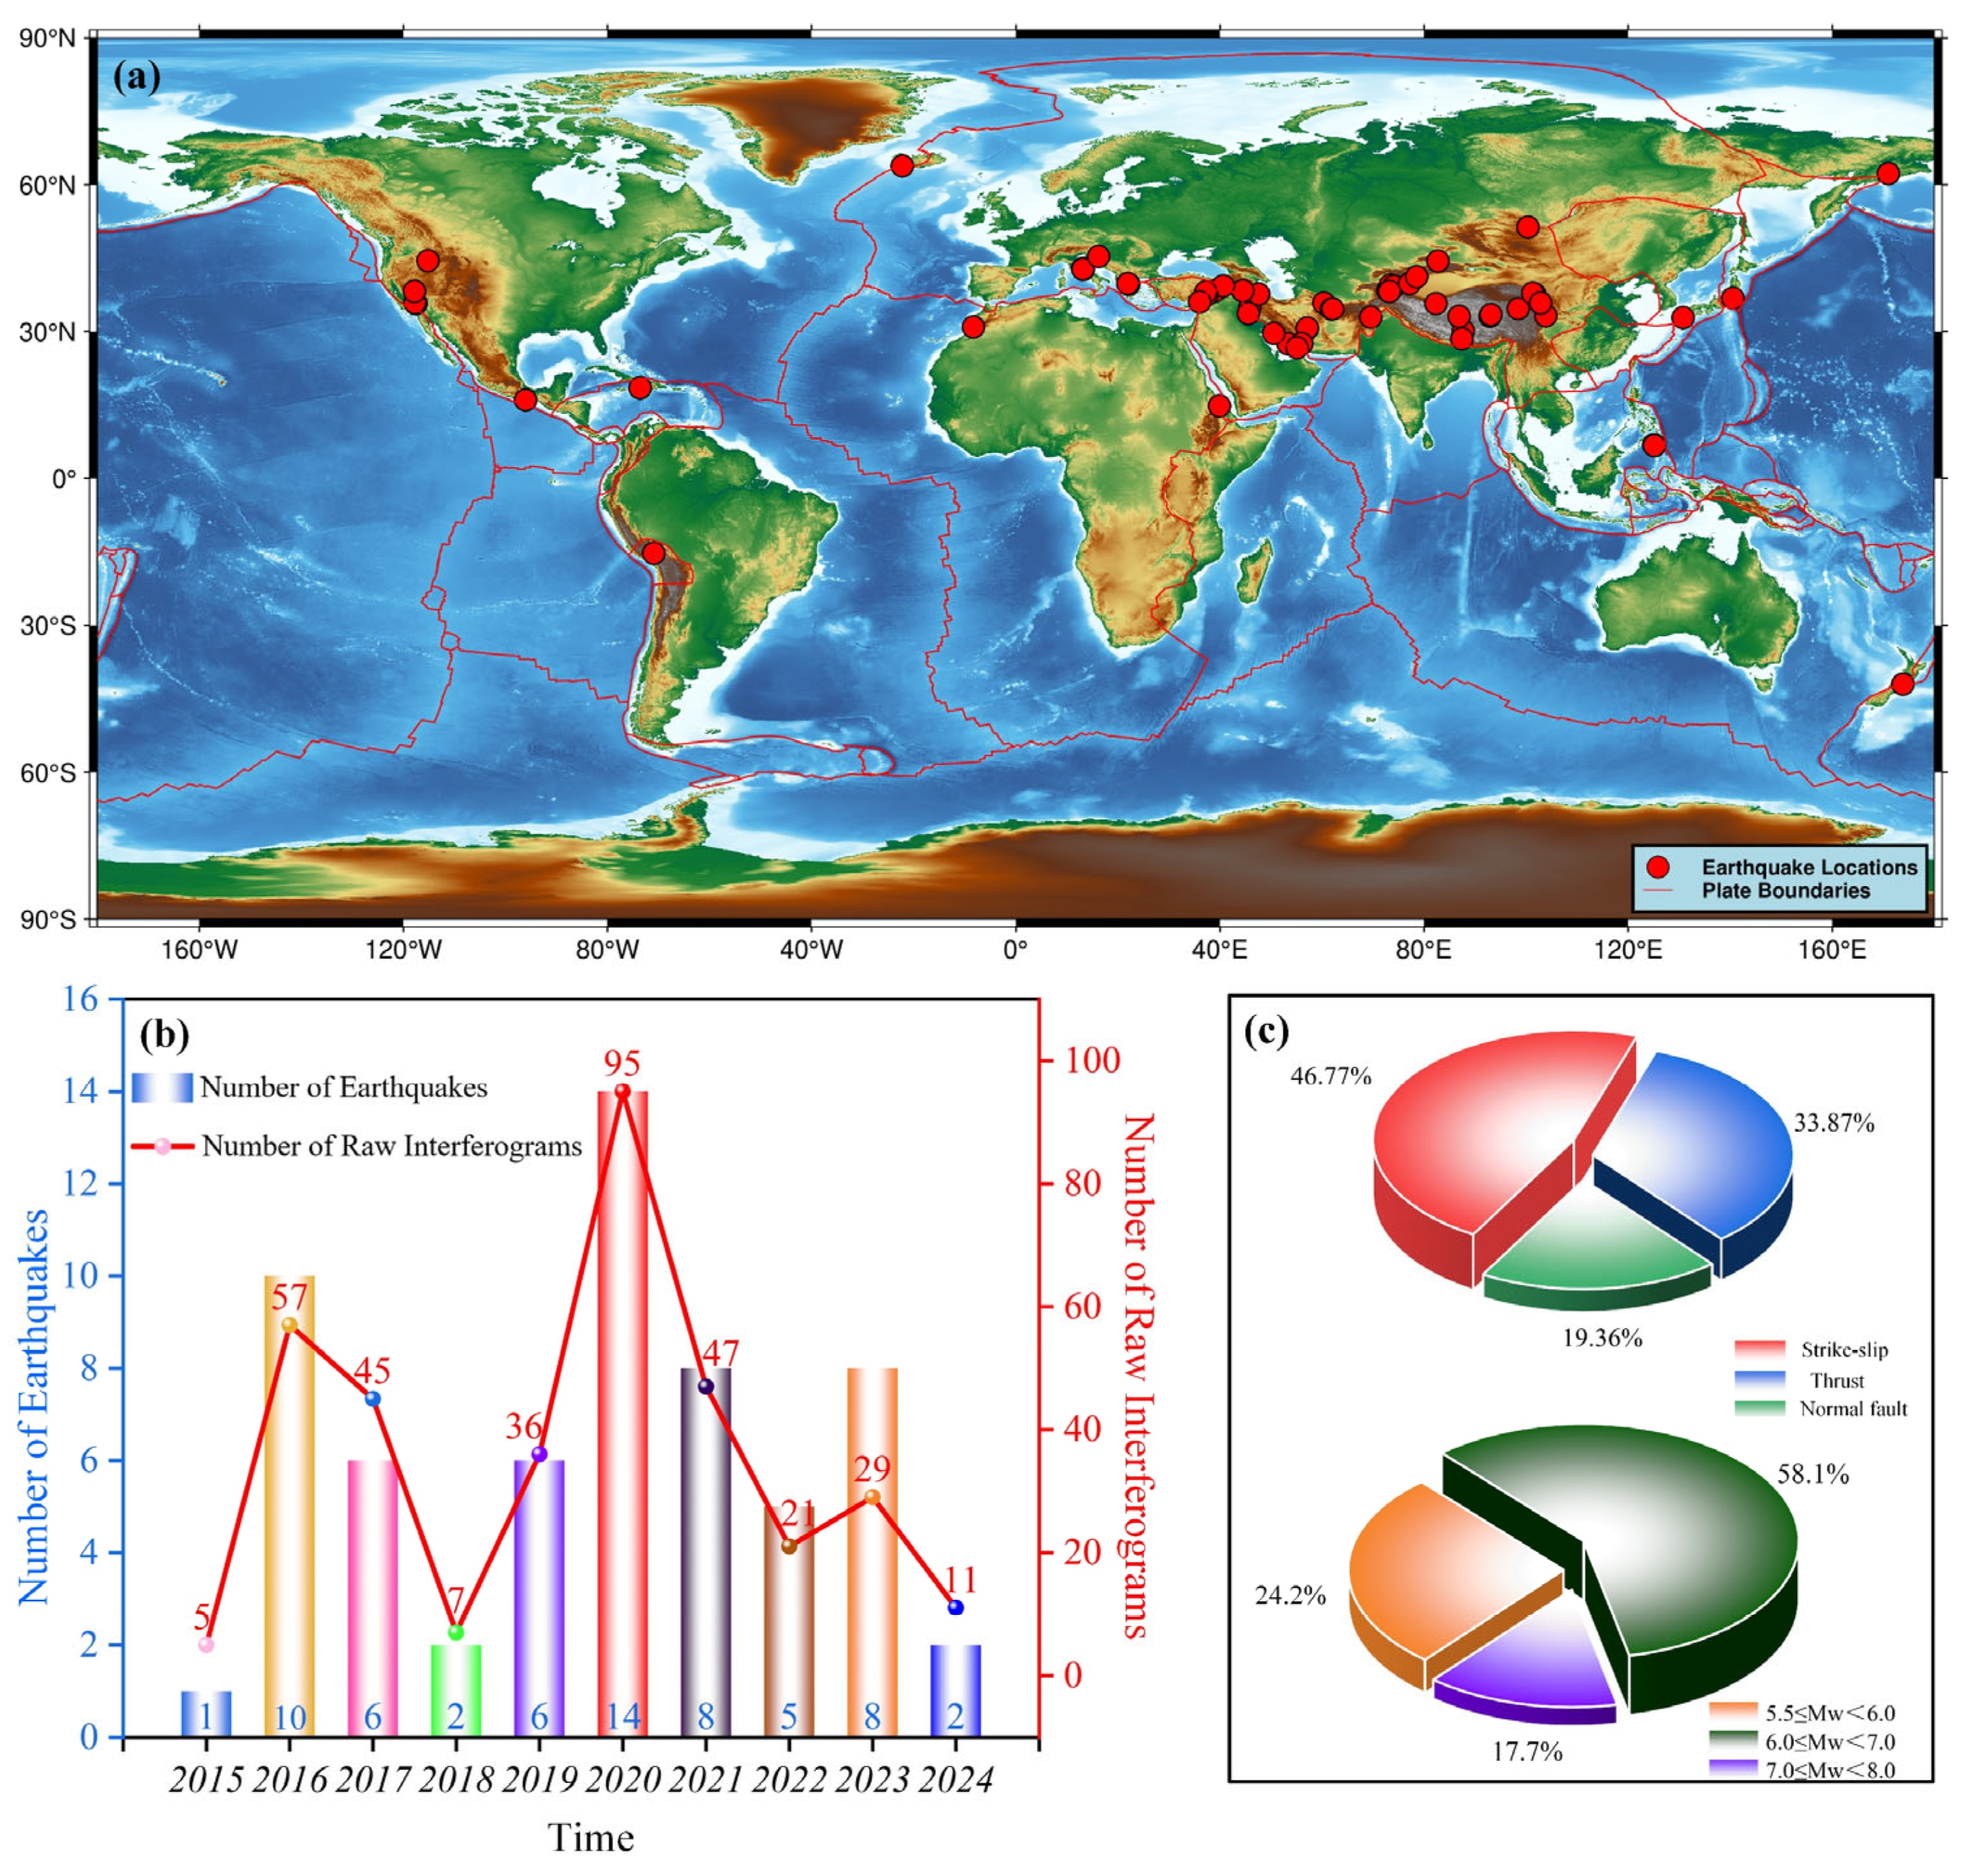
From a spatial perspective, the dataset covers numerous tectonically active regions worldwide, particularly areas near plate boundaries and intra-continental fault zones, thereby ensuring broad applicability across diverse tectonic settings. As shown in
Figure 5a, the 62 earthquakes included in this dataset are predominantly located in seismically active regions such as the Pamir-Himalaya belt, the Middle East, the western Americas, and the Mediterranean. These events frequently occur along active plate boundaries—including collision, rift, and subduction zones—that are characterized by high seismicity and constitute a significant portion of the dataset. In contrast, the dataset contains relatively fewer earthquake interferograms from tropical regions. This limitation arises not from the lack of seismic activity but from the dense vegetation cover and complex climatic conditions that hinder the effective detection of seismic deformation using InSAR techniques. Overall, the dataset reflects significant global tectonic diversity and broad spatial coverage.
Figure 5b illustrates the temporal distribution of the earthquakes. The dataset spans from 2015 to 2024, offering extensive temporal coverage. As seismic events continue to occur over time, additional InSAR coseismic interferograms are expected to be integrated into the dataset, thereby enhancing its completeness and utility for future research.
4.2. Statistical Analysis of Magnitude Distribution and Focal Depth
In terms of magnitude distribution, the dataset predominantly consists of moderate-to-strong earthquakes (Mw 5.5–8.0), with low-magnitude events (Mw < 5.5) deliberately excluded. This exclusion criterion is guided by inherent limitations in InSAR technology. For earthquakes with Mw 5.5, atmospheric delays often dominate the signal in individual interferograms, significantly impeding the reliable extraction of coseismic deformation [
41]. Although advanced techniques—such as stacking [
42] and the SSC method [
43]—have been developed to improve the detection of low-magnitude events, this study directly employs interferograms from the COMET LiCSAR archive without additional refinement. Processing such data is computationally demanding and requires frequent parameter tuning, making fully automated and efficient data generation difficult. Furthermore, the resulting interferograms may not align with the standardized requirements of this study. Therefore, to ensure consistency, quality, and suitability for deep learning applications, InSAR data corresponding to low-magnitude earthquakes were deliberately excluded from the final dataset.
Furthermore, statistical analysis of focal depth distribution indicates that all earthquakes in this dataset are shallow-focus events, occurring within the upper crust at depths ranging from 0 to 30 km. The effectiveness of InSAR in monitoring coseismic deformation largely depends on factors such as the spatial extent of the deformation field and the signal-to-noise ratio (SNR). For earthquakes of comparable magnitudes, shallow-focus events (0–30 km) typically produce more pronounced surface deformations, which are more readily detected by InSAR. In contrast, deeper earthquakes tend to produce smaller surface displacements that are often obscured by noise, making their detection significantly more difficult. Consequently, this dataset primarily includes shallow-focus earthquakes to ensure that the corresponding InSAR interferograms exhibit high SNR, thereby enhancing their reliability, consistency, and suitability for deep learning applications.
4.3. Statistical Analysis of Earthquake Types
The dataset includes earthquakes from a variety of tectonic settings—namely strike-slip, thrust, and normal faulting regimes—providing a comprehensive representation of the coseismic deformation characteristics associated with each fault type. The statistical distribution of faulting mechanisms is shown in
Figure 5c. Strike-slip earthquakes represent the largest proportion of the dataset, comprising approximately 46.77%, which aligns with their global predominance along transform plate boundaries [
44]. Thrust earthquakes are moderately represented, accounting for approximately 33.87% of the dataset. In contrast, normal faulting events are less frequent, making up around 19.35% of the dataset. This lower proportion is primarily attributed to their occurrence in extensional environments, such as rift zones and back-arc basins, where slower stress accumulation leads to reduced seismic activity. Additionally, a subset of earthquakes in the dataset exhibit complex rupture mechanisms that involve combinations of multiple fault types. These events serve as valuable training samples for deep learning models designed to interpret coseismic deformation in structurally complex fault systems.
5. Discussion
In their study on the application of machine learning for detecting surface deformation in InSAR imagery, Brengman and Barnhart [
21] developed a coseismic InSAR dataset comprising 32 real observational images. To facilitate a rigorous comparative analysis between their dataset and the one developed in this study, we applied identical data augmentation techniques to their dataset, increasing its size to 184 coseismic InSAR images. For clarity, the dataset constructed in this study is hereafter referred to as Dataset A, and the dataset from Brengman et al. [
21] is referred to as Dataset B. In terms of scale, Dataset A comprises 14,000 coseismic InSAR interferograms, while Dataset B, after augmentation, contains only 184 images. Dataset A encompasses a broader range of deformation patterns, including earthquake events of varying magnitudes and fault types, thereby offering a more comprehensive set of training samples for deep learning applications. In contrast, Dataset B exhibits limited coverage of diverse scenarios, which may constrain its ability to capture the full spectrum of deformation features and reduce its generalization capability.
The mean entropy and the standard deviation of entropy are commonly used metrics for evaluating the information richness and statistical stability of different datasets [
45]. Entropy serves as an effective indicator of the complexity and variability of seismic deformation patterns in the images. Specifically, a higher mean entropy indicates that the dataset encompasses a wider range of deformation features, reflecting greater complexity and diversity in coseismic deformation patterns [
46]. This, in turn, provides more challenging and generalized learning scenarios, thereby improving the robustness and adaptability of deep learning models.
5.1. Mean Entropy and Entropy Standard Deviation of the Dataset
Entropy is calculated based on the grayscale histogram of the image, which reflects the distribution of pixel intensity levels in the image. The entropy formula is given as follows:
In this context,
represents the entropy of the image,
denotes the
-th intensity level (pixel value) in the image,
refers to the probability distribution of the intensity level
, and
represents the total number of distinct intensity levels in the image. For coseismic InSAR observations, the dataset-level mean entropy and standard deviation of entropy are calculated using the following equations to quantitatively evaluate the overall informational diversity and statistical consistency of the dataset.
Here,
denotes the average entropy of dataset
,
represents the total number of interferograms in the dataset,
is the entropy of the
-th interferogram, and
refers to the standard deviation of entropy across the dataset.
As shown in
Table 2, the mean entropy of Dataset A is 7.58, higher than the 7.55 observed in Dataset B. This suggests that Dataset A exhibits greater diversity in coseismic deformation features. The standard deviation of entropy is 0.25 for Dataset A, compared to 0.42 for Dataset B. The notably lower standard deviation in Dataset A indicates greater consistency in image quality and structural complexity. Such stability is essential for deep learning-based InSAR modeling and seismic deformation detection, as it facilitates more effective learning of key features and reduces the risk of poor convergence and generalization caused by large variations in data quality. In contrast, the higher entropy standard deviation in Dataset B reflects greater variability in information complexity, which may introduce instability during training and ultimately compromise the model’s accuracy and reliability in practical applications.
5.2. Significance Analysis of the Mean Entropy of the Datasets
In this study, the Mann–Whitney U test [
47] was employed to determine whether a statistically significant difference exists between the entropy distributions of the two datasets. The Mann–Whitney U test, also known as the Wilcoxon rank-sum test, is a non-parametric method used to compare the distributions of two independent samples. Unlike parametric tests, it does not assume a normal distribution of the data, making it particularly suitable for analyzing the entropy characteristics of InSAR coseismic observations. The test works by ranking all combined observations and calculating a U-statistic based on the sum of ranks within each group. The statistical significance of the observed difference is assessed using the corresponding
p-value. If the
p-value is below a predefined significance level (commonly 0.05), the null hypothesis is rejected, indicating a statistically significant difference between the two distributions.
The results yielded a Mann–Whitney U-statistic of 1,051,840 and a p-value of 0.000006 (<0.05), indicating a statistically significant difference between the entropy distributions of the two datasets. This suggests that the two datasets exhibit fundamentally different information characteristics, with Dataset A containing significantly more coseismic deformation information than Dataset B.
This comparison is justified, as Dataset A comprises a significantly greater number of earthquake events and associated deformation scenarios (353 real seismic observations) than Dataset B, which contains only 32 observations. Moreover, Dataset A includes all seismic events present in Dataset B. Therefore, the observed statistical differences can be attributed not to fundamentally distinct deformation characteristics but to the greater diversity and information content present in Dataset A.
6. Conclusions
Deep learning-based identification of coseismic deformation using InSAR has emerged as a pivotal research focus in earthquake monitoring and surface deformation analysis. However, existing studies are limited by dataset size, sample diversity, and data processing efficiency, which constrain the generalizability and real-world applicability of deep learning models. To overcome these challenges, this study presents an automated approach for constructing InSAR-based coseismic datasets specifically designed for deep learning applications. A high-quality, manually labeled dataset was developed, encompassing 62 moderate-to-large earthquakes that occurred globally between 2015 and 2024. From 353 raw interferograms, 1773 standardized coseismic interferograms were generated through a preprocessing pipeline and subsequently expanded to 14,000 samples using data augmentation techniques. The resulting dataset demonstrates substantial diversity in earthquake magnitude, focal depth, fault mechanism, and temporal distribution, thereby ensuring broad representativeness. Compared to existing datasets, it provides greater volume, richer deformation features, and improved internal consistency. The dataset construction methodology proposed in this study is systematic, reproducible, and scalable, enabling continuous expansion as new InSAR coseismic observations become available. This work delivers a large-scale, diverse, and high-quality dataset that offers a robust foundation for advancing deep learning research in InSAR-based coseismic deformation detection and analysis.
Author Contributions
Conceptualization, X.L., Z.W. and Y.Z.; methodology, X.L., Z.W. and Y.Z.; resources, X.L., Z.W., Y.Z. and X.S.; investigation, X.L., Y.Z. and Z.L.; data curation, X.L., Z.W., Y.Z., X.S. and Z.L.; writing—original draft preparation, X.L., Z.W., Y.Z., X.S. and Z.L.; writing—review and editing, Y.Z. and Z.W.; visualization, X.L., Y.Z. and Z.L.; supervision, Y.Z., Z.W. and X.S.; project administration, Y.Z. and Z.W.; funding acquisition, Z.W. All authors have read and agreed to the published version of the manuscript.
Funding
This research was funded by the National Natural Science Foundation of China (Nos. 42476063, 42176068).
Data Availability Statement
The dataset generated in this study has been publicly released through Zenodo. The full InSAR dataset, consisting of 14,000 Sentinel-1 based image patches, can be accessed at
https://zenodo.org/records/15382562, accessed on 11 April 2025.
Acknowledgments
The Sentinel-1 SAR data were freely provided by COMET LiCSAR. LiCSAR contains modified Copernicus Sentinel data 2015–2024 analyzed by the Centre for the Observation and Modelling of Earthquakes, Volcanoes and Tectonics (COMET). LiCSAR uses JASMIN, the UK’s collaborative data analysis environment (
http://jasmin.ac.uk). Some maps were generated using the General Map Tool (GMT) version 6 [
48].
Conflicts of Interest
The authors declare no conflicts of interest.
References
- Shan, X.; Qu, C.; Gong, W.; Zhao, D.; Zhang, Y.; Zhang, G.; Song, X.; Liu, Y.; Zhang, G. Coseismic deformation field of the Jiuzhaigou MS7.0 earthquake from Sentinel-1A InSAR data and fault slip inversion. Chin. J. Geophys. 2017, 60, 4527–4536. [Google Scholar]
- Ghayournajarkar, N.; Fukushima, Y. Using InSAR for evaluating the accuracy of locations and focal mechanism solutions of local earthquake catalogues. Geophys. J. Int. 2022, 230, 607–622. [Google Scholar] [CrossRef]
- Li, Y.; Jiang, W.; Li, Y.; Shen, W.; He, Z.; Li, B.; Li, Q.; Jiao, Q.; Tian, Y. Coseismic rupture model and tectonic implications of the January 7 2022, Menyuan Mw 6.6 earthquake constraints from InSAR observations and field investigation. Remote Sens. 2022, 14, 2111. [Google Scholar] [CrossRef]
- Zhao, L.; Chen, Z.; Xie, L.; Zhu, Z.; Xu, W. Coseismic deformation and slip model of the 2024 M W 7.0 Wushi earthquake obtained from InSAR observation. Rev. Geophys. Planet. Phys. 2024, 55, 453–460. [Google Scholar]
- Di Traglia, F.; De Luca, C.; Manzo, M.; Nolesini, T.; Casagli, N.; Lanari, R.; Casu, F. Joint exploitation of space-borne and ground-based multitemporal InSAR measurements for volcano monitoring: The Stromboli volcano case study. Remote Sens. Environ. 2021, 260, 112441. [Google Scholar] [CrossRef]
- Poland, M.P.; Zebker, H.A. Volcano geodesy using InSAR in 2020: The past and next decades. Bull. Volcanol. 2022, 84, 27. [Google Scholar] [CrossRef]
- Xu, W.; Luo, X.; Zhu, J.; Wang, J.; Xie, L. Review of Volcano Deformation Monitoring and Modeling with InSAR. Geomat. Inf. Sci. Wuhan Univ. 2023, 48, 1632–1642. [Google Scholar]
- Zhang, Y.; Liu, Y.; Jin, M.; Jing, Y.; Liu, Y.; Liu, Y.; Sun, W.; Wei, J.; Chen, Y. Monitoring land subsidence in Wuhan city (China) using the SBAS-InSAR method with radarsat-2 imagery data. Sensors 2019, 19, 743. [Google Scholar] [CrossRef]
- Zhang, P.; Guo, Z.; Guo, S.; Xia, J. Land subsidence monitoring method in regions of variable radar reflection characteristics by integrating PS-InSAR and SBAS-InSAR techniques. Remote Sens. 2022, 14, 3265. [Google Scholar] [CrossRef]
- Zhang, L.; Liao, M.; Dong, J.; Xu, Q.; Gong, J. Early Detection of Landslide Hazards in Mountainous Areas of West China Using Time Series SAR Interferometry-A Case Study of Danba, Sichuan. Geomat. Inf. Sci. Wuhan Univ. 2018, 43, 2039–2049. [Google Scholar]
- Liu, Z.; Qiu, H.; Zhu, Y.; Liu, Y.; Yang, D.; Ma, S.; Zhang, J.; Wang, Y.; Wang, L.; Tang, B. Efficient identification and monitoring of landslides by time-series InSAR combining single-and multi-look phases. Remote Sens. 2022, 14, 1026. [Google Scholar] [CrossRef]
- Li, S.; Li, Z.; Hu, J.; Sun, Q.; Yu, X. Investigation of the seasonal oscillation of the permafrost over Qinghai-Tibet Plateau with SBAS-InSAR algorithm. Chin. J. Geophys. 2013, 56, 1476–1486. [Google Scholar]
- Zhao, R.; Li, Z.; Feng, G.; Wang, Q.; Hu, J. Monitoring surface deformation over permafrost with an improved SBAS-InSAR algorithm: With emphasis on climatic factors modeling. Remote Sens. Environ. 2016, 184, 276–287. [Google Scholar] [CrossRef]
- Chen, J.; Wu, T.; Zou, D.; Liu, L.; Wu, X.; Gong, W.; Zhu, X.; Li, R.; Hao, J.; Hu, G. Magnitudes and patterns of large-scale permafrost ground deformation revealed by Sentinel-1 InSAR on the central Qinghai-Tibet Plateau. Remote Sens. Environ. 2022, 268, 112778. [Google Scholar] [CrossRef]
- Zhang, X.; Feng, M.; Zhang, H.; Wang, C.; Tang, Y.; Xu, J.H.; Yan, D.; Wang, C. Detecting rock glacier displacement in the central Himalayas using multi-temporal InSAR. Remote Sens. 2021, 13, 4738. [Google Scholar] [CrossRef]
- Silva, B.; Sousa, J.J.; Lazecky, M.; Cunha, A. Deformation fringes detection in SAR interferograms using deep learning. Procedia Comput. Sci. 2022, 196, 151–158. [Google Scholar] [CrossRef]
- Zhu, X.; Montazeri, S.; Ali, M.; Hua, Y.; Wang, Y.; Mou, L.; Shi, Y.L.; Xu, F.; Bamler, R. Deep learning meets SAR: Concepts, models, pitfalls, and perspectives. IEEE Geosci. Remote Sens. Mag. 2021, 9, 143–172. [Google Scholar] [CrossRef]
- Kussul, N.; Lavreniuk, M.; Skakun, S.; Shelestov, A. Deep learning classification of land cover and crop types using remote sensing data. IEEE Geosci. Remote Sens. Lett. 2017, 14, 778–782. [Google Scholar] [CrossRef]
- Li, Y.; Zhang, H.; Xue, X.; Jiang, Y.; Shen, Q. Deep learning for remote sensing image classification: A survey. Wiley Interdiscip. Rev. Data Min. Knowl. Discov. 2018, 8, e1264. [Google Scholar] [CrossRef]
- Kemker, R.; Salvaggio, C.; Kanan, C. Algorithms for semantic segmentation of multispectral remote sensing imagery using deep learning. ISPRS J. Photogramm. Remote Sens. 2018, 145, 60–77. [Google Scholar] [CrossRef]
- Brengman, C.M.; Barnhart, W.D. Identification of surface deformation in InSAR using machine learning. Geochem. Geophys. Geosyst. 2021, 22, e2020GC009204. [Google Scholar] [CrossRef]
- Gaddes, M.; Hooper, A.; Albino, F. Simultaneous classification and location of volcanic deformation in SAR interferograms using a convolutional neural network. Earth Space Sci. 2024, 11, e2024EA003679. [Google Scholar] [CrossRef]
- Anantrasirichai, N.; Biggs, J.; Albino, F.; Bull, D. The application of convolutional neural networks to detect slow, sustained deformation in InSAR time series. Geophys. Res. Lett. 2019, 46, 11850–11858. [Google Scholar] [CrossRef]
- Rouet-Leduc, B.; Jolivet, R.; Dalaison, M.; Johnson, P.A.; Hulbert, C. Autonomous extraction of millimeter-scale deformation in InSAR time series using deep learning. Nat. Commun. 2021, 12, 6480. [Google Scholar] [CrossRef]
- Spoorthi, G.; Gorthi, R.K.S.S.; Gorthi, S. PhaseNet 2.0: Phase unwrapping of noisy data based on deep learning approach. IEEE Trans. Image Process. 2020, 29, 4862–4872. [Google Scholar] [CrossRef]
- Wang, K.; Li, Y.; Kemao, Q.; Di, J.; Zhao, J. One-step robust deep learning phase unwrapping. Opt. Express 2019, 27, 15100–15115. [Google Scholar] [CrossRef]
- Murdaca, G.; Rucci, A.; Prati, C. Deep learning for InSAR phase filtering: An optimized framework for phase unwrapping. Remote Sens. 2022, 14, 4956. [Google Scholar] [CrossRef]
- Wang, J.; Liu, J.; Ling, X.; Duan, Z. Deep Learning-Based Joint Local and Non-local InSAR Image Phase Filtering Method. Geomat. Inf. Sci. Wuhan Univ. 2024, 1–17. [Google Scholar] [CrossRef]
- Shorten, C.; Khoshgoftaar, T.M. A survey on image data augmentation for deep learning. J. Big Data 2019, 6, 60. [Google Scholar] [CrossRef]
- Johnson, J.M.; Khoshgoftaar, T.M. Survey on deep learning with class imbalance. J. Big Data 2019, 6, 27. [Google Scholar] [CrossRef]
- Wu, Y.-Y.; Madson, A. Error Sources of Interferometric Synthetic Aperture Radar Satellites. Remote Sens. 2024, 16, 354. [Google Scholar] [CrossRef]
- Anantrasirichai, N.; Biggs, J.; Albino, F.; Hill, P.; Bull, D. Application of machine learning to classification of volcanic deformation in routinely generated InSAR data. J. Geophys. Res. Solid Earth 2018, 123, 6592–6606. [Google Scholar] [CrossRef]
- Lazecký, M.; Spaans, K.; González, P.J.; Maghsoudi, Y.; Morishita, Y.; Albino, F.; Elliott, J.; Greenall, N.; Hatton, E.; Hooper, A. LiCSAR: An automatic InSAR tool for measuring and monitoring tectonic and volcanic activity. Remote Sens. 2020, 12, 2430. [Google Scholar] [CrossRef]
- Morishita, Y.; Lazecky, M.; Wright, T.J.; Weiss, J.R.; Elliott, J.R.; Hooper, A. LiCSBAS: An open-source InSAR time series analysis package integrated with the LiCSAR automated Sentinel-1 InSAR processor. Remote Sens. 2020, 12, 424. [Google Scholar] [CrossRef]
- Okada, Y. Surface deformation due to shear and tensile faults in a half-space. Bull. Seismol. Soc. Am. 1985, 75, 1135–1154. [Google Scholar] [CrossRef]
- Zhu, C.; Li, X.; Wang, C.; Zhang, B.; Li, B. Deep learning-based coseismic deformation estimation from InSAR interferograms. IEEE Trans. Geosci. Remote Sens. 2024, 62, 5203610. [Google Scholar] [CrossRef]
- Li, C.; Xi, X.; Zhang, G.; Song, X.; Shan, X. A Deep-Learning Neural Network for Postseismic Deformation Reconstruction from InSAR Time Series. IEEE Trans. Geosci. Remote Sens. 2024, 63, 4505214. [Google Scholar] [CrossRef]
- Japkowicz, N. Concept-learning in the presence of between-class and within-class imbalances. In Proceedings of the Conference of the Canadian Society for Computational Studies of Intelligence, Ottawa, ON, Canada, 7–9 June 2001; pp. 67–77. [Google Scholar]
- Zhou, Z.; Sun, X.; Yang, F.; Wang, Z.; Goldsbury, R.; Cheng, I. GANInSAR: Deep Generative Modeling for Large-Scale InSAR Signal Simulation. IEEE J. Sel. Top. Appl. Earth Obs. Remote Sens. 2024, 17, 5303–5316. [Google Scholar] [CrossRef]
- Goodfellow, I.J.; Pouget-Abadie, J.; Mirza, M.; Xu, B.; Warde-Farley, D.; Ozair, S.; Courville, A.; Bengio, Y. Generative Adversarial Nets. In Proceedings of the Advances in Neural Information Processing Systems 27, Montreal, QC, Canada, 8–13 December 2014. [Google Scholar]
- Luo, H.; Wang, T.; Wei, S. Systematic comparison of InSAR and seismic source models for moderate-size earthquakes in Western China: Implication to the seismogenic capacity of the shallow crust. J. Geophys. Res.Solid Earth 2022, 127, e2022JB024794. [Google Scholar] [CrossRef]
- Luo, H.; Wang, T.; Wei, S.; Liao, M.; Gong, J. Deriving centimeter-level coseismic deformation and fault geometries of small-to-moderate earthquakes from time-series Sentinel-1 SAR images. Front. Earth Sci. 2021, 9, 636398. [Google Scholar] [CrossRef]
- Gong, W.; Zhao, D.; Zhu, C.; Zhang, Y.; Li, C.; Zhang, G.; Shan, X. A new method for InSAR stratified tropospheric delay correction facilitating refinement of coseismic displacement fields of small-to-moderate earthquakes. Remote Sens. 2022, 14, 1425. [Google Scholar] [CrossRef]
- Kim, Y.S.; Sanderson, D.J. Structural similarity and variety at the tips in a wide range of strike–slip faults: A review. Terra Nova 2006, 18, 330–344. [Google Scholar] [CrossRef]
- Shannon, C.E. A mathematical theory of communication. Bell Syst. Tech. J. 1948, 27, 379–423. [Google Scholar] [CrossRef]
- Guan, X.; He, L.; Li, M.; Li, F. Entropy based data expansion method for blind image quality assessment. Entropy 2019, 22, 60. [Google Scholar] [CrossRef]
- McKnight, P.E.; Najab, J. Mann-Whitney U Test. In The Corsini Encyclopedia of Psychology; John Wiley & Sons: Hoboken, NJ, USA, 2010; p. 1. [Google Scholar]
- Wessel, P.; Luis, J.F.; Uieda, L.a.; Scharroo, R.; Wobbe, F.; Smith, W.H.; Tian, D. The generic mapping tools version 6. Geochem. Geophys. Geosyst. 2019, 20, 5556–5564. [Google Scholar] [CrossRef]
| Disclaimer/Publisher’s Note: The statements, opinions and data contained in all publications are solely those of the individual author(s) and contributor(s) and not of MDPI and/or the editor(s). MDPI and/or the editor(s) disclaim responsibility for any injury to people or property resulting from any ideas, methods, instructions or products referred to in the content. |
© 2025 by the authors. Licensee MDPI, Basel, Switzerland. This article is an open access article distributed under the terms and conditions of the Creative Commons Attribution (CC BY) license (https://creativecommons.org/licenses/by/4.0/).


