1. Introduction
Urbanization is a dynamic and transformative process that significantly impacts natural landscapes, converting wetlands, open spaces, and green areas into built-up environments [
1]. This shift introduces several environmental challenges, including the effects of climate change, biodiversity loss, and the intensification of urban heat islands [
2]. Additionally, rapid urban growth alters hydrological cycles, increasing surface runoff and modifying local climate conditions, highlighting the need for precise and up-to-date monitoring tools for effective urban management.
Accurate Land Use and Land Cover (LULC) classification plays a crucial role in urban planning, environmental conservation, and disaster risk reduction, supporting sustainable urban development and effective land management. High-quality LULC maps are crucial for monitoring the growth of built-up areas, thereby ensuring compliance with Sustainable Development Goal (SDG) 11, which aims to promote inclusive, safe, resilient, and sustainable cities [
3,
4,
5,
6,
7]. However, traditional LULC mapping approaches often face challenges related to data availability, processing limitations, and infrequent updates, limiting their ability to capture rapid urban transformations.
The evolution of geomatics, remote sensing technologies, and cloud computing platforms has transformed LULC monitoring methodologies, enabling the automated, large-scale analysis of built-up area changes. Traditionally, LULC classification has been performed using maximum likelihood pixel-based classification [
8,
9] and object-based classification [
10,
11]. However, these methods often struggle with spectral variability, spatial inconsistencies, and the complexity of urban environments, reducing classification accuracy in dynamic landscapes.
Recent advancements in Geospatial Artificial Intelligence (GeoAI), multi-temporal satellite data processing, and high-performance cloud computing have significantly improved urban monitoring techniques. These approaches integrate multi-temporal Earth Observation (EO) data, machine learning (ML) models, and Geographic Information Systems (GIS) to provide real-time, data-driven insights into urban expansion and land use transformations [
12,
13,
14,
15].
GeoAI refers to the integration of artificial intelligence techniques, including ML, with geospatial data and systems, enabling scalable, automated, and intelligent spatial analysis. According to [
16], GeoAI represents a human-centered approach that utilizes large-scale geospatial models to extract patterns from diverse spatial and temporal datasets, thereby supporting complex decision-making processes, such as urban planning, hazard forecasting, and infrastructure management. This integration enables both spatial pattern recognition and temporal prediction, allowing researchers and planners to address urbanization dynamics more effectively.
Despite these advancements, processing large-scale geospatial data remains a computational challenge, requiring significant storage, processing power, and advanced data-handling capabilities [
17]. Cloud-based platforms, such as Google Earth Engine (GEE), have emerged as powerful tools for planetary-scale remote sensing analysis, addressing these limitations. GEE provides access to a vast repository of MODIS, Landsat, and Sentinel imagery, enabling high-speed ML integration for land cover classification [
18,
19,
20].
ML has revolutionized LULC classification, offering a higher accuracy, scalability, and adaptability than traditional approaches. ML algorithms, such as Random Forest (RF) and Support Vector Machine (SVM), have demonstrated a strong performance in extracting built-up areas from multi-temporal satellite imagery [
21,
22]. In particular, RF is widely recognized for its versatility in classification and regression tasks, making it ideal for land use modeling, land cover mapping, and forest change detection [
23,
24].
A review of 222 land cover mapping studies conducted by Phiri et al. (2020) [
25] confirmed that RF and SVM consistently achieved a high classification accuracy with Sentinel-2 and Landsat imagery.
However, one of the main challenges in ML-based classification remains the need for frequently labeled training datasets, which can be resource-intensive and time-consuming to acquire. To address this issue, transfer learning techniques have gained popularity in remote sensing applications, enabling models trained on historical LULC data to be adapted for new classification periods with minimal retraining.
Transfer learning has proven to be an effective strategy for enhancing classification accuracy and improving model generalization across diverse temporal and spatial contexts. Several studies have demonstrated its effectiveness in LULC classification. Praveen et al. (2019) [
26] evaluated the transferability of ML models such as RF for agricultural land cover mapping using GEE-based feature selection and parameter tuning. Similarly, Naushad et al. (2021) [
27] highlighted that transfer learning reduces computational costs compared to traditional ML-based classification approaches, making it a highly efficient solution for large-scale LULC mapping [
28].
The reviewed literature confirms that ML techniques are extensively used in land use classification, predictive modeling, and transferability analysis, offering significant advantages in scalability, computational efficiency, and adaptability. In particular, transfer learning enhances the ability of ML models to generalize across datasets, allowing for efficient large-scale land cover mapping without extensive retraining.
Many existing land cover datasets, such as those provided by spatial agencies, often suffer from outdated information or an insufficient spatial resolution, limiting their applicability iin detailed urban analysis. Moreover, while recent studies have explored individual applications of GeoAI components, there remains a lack of integrated, reproducible, and planning-oriented GeoAI frameworks that address the complexity of urban morphology, particularly in data-scarce regions [
29].
To overcome the limitations outlined in recent GeoAI and ML-based LULC classification research, this study proposes an integrated, scalable, and transferable multi-temporal built-up area classification framework that leverages GeoAI principles, remote sensing observations, and the computational capabilities of the GEE platform. The methodology is applied to a fragmented and data-scarce urban region in southern Italy, where reliable high-resolution LULC maps are unavailable. By integrating multi-temporal and multispectral Landsat imagery from 2006 to 2024, the framework enables the detection of both gradual and abrupt urbanization trends. A Random Forest classifier is trained using historical land cover data from CORINE (2006, 2012, and 2018) and then applied to predict built-up areas in 2024 through a transfer learning approach, without the need for newly labeled training data. Pixel-level data, spectral indices, and decision-level fusion techniques are employed to ensure a consistent classification accuracy over time.
The novelty of the proposed GeoAI framework in relation to existing built-up area monitoring approaches lies in its integration of several methodological innovations specifically tailored to data-scarce and fragmented urban regions. Unlike studies that rely on global-scale or coarsely labeled datasets (e.g., MODIS), this study employs CORINE Land Cover (CLC) maps, harmonized to Landsat resolution via bilinear interpolation, to enhance thematic precision at the regional level. The training and validation protocol is explicitly defined and reproducible, utilizing stable built-up areas across three historical time points (2006, 2012, and 2018) to ensure temporal consistency and reduce class ambiguity. Moreover, this study employs a transparent and interpretable RF classifier within a temporal transfer learning strategy, enabling the extrapolation of past patterns to classify 2024 data without requiring newly labeled samples. The framework is fully implemented in GEE, ensuring reproducibility and scalability across fragmented or under-monitored regions.
Based on these premises, the specific objectives of this research are as follows:
To develop an automated and transferable classification framework within GEE for generating and updating built-up area maps, integrating multi-temporal multispectral Landsat images to capture urban growth trends and urban texture dynamics, with a consequent consistency in classification outputs;
To adopt a transfer learning-based approach, utilizing historical built-up area classifications (2006, 2012, and 2018) to improve the accuracy and temporal consistency of the 2024 classification, even in the absence, for this timeline, of recently labeled datasets from spatial agencies;
To improve LULC classification performance by integrating multi-temporal data fusion, multispectral features, and spectral indices (NDVI, NDBI, MNDWI, and EVI), ensuring enhanced discrimination between built-up and non-built-up areas while reducing misclassification errors due to atmospheric and seasonal variations;
To evaluate the spatial and morphological evolution of urban growth through the computation of urban spatial metrics, including Urban Density and the Urban Dispersion Index (UDI), demonstrating the methodology’s utility for supporting spatial planning and environmental decision making, particularly in regions with fragmented urban textures.
This research paper is structured into five sections, providing a systematic approach to understanding the methodology and results of the proposed GeoAI-driven multi-temporal built-up area classification framework. After the Introduction,
Section 2 details the study area, describes the satellite and reference datasets, and explains the methodology.
Section 3 presents the analysis of results, evaluating the effectiveness of transfer learning and multi-temporal satellite data fusion. It also quantifies built-up area evolution and analyzes urban morphological changes using indicators such as Urban Density and the Urban Dispersion Index (UDI).
Section 4 presents the results, highlighting the benefits of integrating GeoAI-based classification, transfer learning, urban metrics, and cloud computing for urban monitoring. It also discusses the method’s scalability, potential limitations, and possible improvements, including the integration of additional data sources.
Section 5 presents the conclusions, summarizing the key findings and highlighting the potential for future enhancements and a broader applicability.
2. Materials and Methods
2.1. Study Area
This study was conducted over a territorial-scale area encompassing 15 municipalities within the Calabria region in southern Italy (
Figure 1). The selected municipalities include Carolei, Castiglione Cosentino, Castrolibero, Cerisano, Cosenza, Dipignano, Lappano, Marano Marchesato, Marano Principato, Mendicino, Montalto Uffugo, Rende, San Pietro in Guarano, San Vincenzo la Costa, and Zumpano. The study area encompasses an approximate surface area of 773.24 km
2, with a population of approximately 176,000 inhabitants. Among these municipalities, Cosenza and Rende serve as the region’s primary economic and administrative hubs, concentrating most of the urban development and commercial activities.
The selection of this study area provides an ideal setting for evaluating the effectiveness of the proposed methodology in determining the multi-temporal dynamics of built-up areas. Calabria is characterized by densely populated urban areas and small municipalities, with most towns of fewer than 5000 residents. This diverse urban fabric facilitates a comprehensive assessment of land use transformations, encompassing both urban growth and rural development.
Additionally, this multi-municipal approach allows for identifying subtle urbanization trends and long-term landscape modifications that might not be evident when analyzing a single city.
2.2. Satellite Data and Reference Datasets
To ensure an accurate and temporally consistent classification of built-up areas, this study utilizes multi-temporal Landsat satellite imagery in combination with reference datasets from CORINE Land Cover maps. Integrating multi-temporal satellite data fusion with machine learning-based classification enables a comprehensive assessment of urban growth trends, ensuring compatibility with both historical and current land cover distributions.
The satellite data source for this study’s multispectral image consists of Landsat Collection 2, Level-2 Surface Reflectance (SR) products, which provide atmospherically corrected multispectral images. Landsat imagery was selected due to its long-term continuity, global coverage, and 30 m spatial resolution, making it highly suitable for analyzing the dynamics of built-up areas over time.
The following Landsat datasets were employed:
Landsat 5 (Thematic Mapper, TM) images were acquired for 2006 and provide six spectral bands in the visible, near-infrared (NIR), and shortwave infrared (SWIR) regions.
Landsat 7 (Enhanced Thematic Mapper Plus, ETM+) images were acquired for 2012 and 2018. This sensor technology offers similar spectral characteristics to those of Landsat 5, but with improvements in radiometric resolution (8-bit).
Landsat 9 (Operational Land Imager-2, OLI-2) images were used for 2024. This sensor type offers a 16-bit radiometric resolution, with 65,536 levels of radiometric sensitivity, which is significantly higher than that of Landsat 5 and 7, thereby enhancing classification accuracy.
The CORINE Land Cover (CLC) dataset, provided by the Copernicus Land Monitoring Service, served as the primary reference dataset for the training and validation of the RF model in the automatic classification process of Landsat multispectral images. CORINE maps provide land use and land cover classifications at a 100 m resolution and span multiple years (for this study, 2006, 2012, and 2018).
To enhance the consistency of training and validation processes for classifying built-up and non-built-up areas, CORINE urban land cover classes 111 (continuous urban fabric) and 112 (discontinuous urban fabric) were reclassified into a single “built-up” category. In contrast, all other classes were merged into the “non-built-up” category.
2.3. Preprocessing and Data Standardization
From a cartographic perspective, maintaining uniformity across different datasets is crucial for accurate land cover classification. Variations in sensor specifications, atmospheric influences, and spatial resolution among different Landsat missions can lead to errors and inconsistencies in classification if not properly managed. To avoid this problem, all datasets employed in this study underwent preprocessing and standardization, ensuring a consistent spatial resolution, a standard reference system, and a uniform classification framework, while preserving the temporal integrity of built-up area mapping.
2.3.1. Geometric and Radiometric Corrections
Geometric corrections were applied to ensure that all images were correctly aligned in the WGS 84 UTM Zone 33N coordinate system, which was chosen for its high precision in regional-scale land cover mapping. A reprojection process was performed to minimize distortions and ensure that the classification outputs from different years were spatially comparable.
Landsat imagery was preprocessed using Google Earth Engine (GEE) to correct for atmospheric and sensor-related distortions, ensuring that spectral values remained comparable across different years. Landsat Collection 2, Level-2 images were selected to ensure the standardization of surface reflectance. Indeed, this collection provides atmospherically corrected surface reflectance values, thereby reducing variations caused by differences in sun angle and atmospheric conditions.
A cloud mask was applied using the QA bands and a cloud cover threshold of less than 10%. Median composite filtering was then applied to reduce noise and seasonal anomalies further. A median composite was generated for each classification year, improving the consistency of spectral data.
2.3.2. Resampling and Spatial Resolution Standardization
The Landsat datasets used in this study (Landsat 5, 7, and 9) have a 30 m pixel resolution. Since all Landsat datasets already share the exact native spatial resolution, no additional resampling was required.
Similarly, the CORINE Land Cover (CLC) datasets were initially available at a 100 m spatial resolution. A bilinear interpolation method was used to align them with the 30 m Landsat resolution. This method prevents spatial distortions in land cover classification, ensures smooth transitions between adjacent pixels, and allows for seamless integration with the Landsat dataset, reducing mismatches when comparing classifications across different years.
After resampling, a mode-based aggregation technique was used to assign dominant land cover types to each 30 m pixel, ensuring that the classification adequately represented urban areas.
2.3.3. Coordinate Reference System (CRS) Harmonization
All datasets were reprojected to the WGS 84 UTM Zone 33N reference system to ensure geometric accuracy and consistency. Through this procedure, it was possible to avoid spatial distortions in multi-temporal analysis and maintain consistency in urban area delineation across different classification years, ensuring compatibility between Landsat imagery and CORINE Land Cover datasets.
This preprocessing framework ensured that all classified datasets remained spatially comparable by standardizing the coordinate reference system (CRS), spatial resolution, and radiometric properties. This enabled the reliable detection and monitoring of changes in built-up areas over time.
2.4. The Landsat Multispectral Image Classification Framework
A Random Forest (RF) classifier was applied to the Landsat multispectral imagery, creating a training dataset derived from CORINE Land Cover maps for the years 2006, 2012, and 2018. The methodology integrates spectral indices with multispectral bands to enhance classification accuracy, ensuring a more precise separation of features between built-up and non-built-up areas.
To improve classification performance and capture built-up area changes over time, a multi-level, multi-temporal data fusion approach was implemented, as follows:
Pixel-level data fusion, combining spectral data from multiple Landsat bands with derived spectral indices (NDVI, NDBI, MNDWI, and EVI) to improve land cover separability.
Temporal data fusion, integrating land cover trends from previous years (2006, 2012, and 2018) to enhance classification transferability for 2024, utilizing transfer learning techniques.
Decision-level data fusion, refining final classifications by considering independent validation datasets.
2.4.1. Training Data and Spectral Feature Selection for Classification
Training points were extracted from the CORINE Land Cover maps, selecting stable built-up areas. These areas were defined as urban regions classified as built-up in all three reference years (2006, 2012, and 2018). This methodological choice provides a consistent classification baseline for training the RF model, ensuring that built-up landforms are well-represented across different temporal datasets.
The model was trained using 240,000 training pixels, ensuring a balanced representation of “built-up” and “non-built-up” areas. Each pixel of the Landsat multispectral image was represented by a set of multispectral bands and spectral indices, which were selected based on their ability to differentiate between built-up areas and other classes. The following spectral features were used as input variables for the RF classifier:
SR_B1 (Blue, 0.45–0.52 μm)—Sensitive to water bodies, useful in separating urban areas from water surfaces.
SR_B2 (Green, 0.52–0.60 μm)—Contrasts vegetation and built-up surfaces.
SR_B3 (Red, 0.63–0.69 μm)—Highlights vegetation and urban features due to differential reflectance.
SR_B4 (Near-Infrared, 0.76–0.90 μm, NIR)—Very important for vegetation analysis; built-up areas generally show lower NIR reflectance.
SR_B5 (Shortwave Infrared 1, 1.55–1.75 μm, SWIR1)—Distinguishes built-up areas and soil moisture content.
SR_B7 (Shortwave Infrared 2, 2.08–2.35 μm, SWIR2)—Very important in separating built-up areas from vegetation and bare soil.
Several spectral indices were calculated and integrated into the classification model to improve the spectral contrast between built-up and non-built-up areas.
The Normalized Difference Vegetation Index (NDVI) generally measures vegetation health. Built-up areas typically exhibit low NDVI values due to limited vegetation cover. This spectral index can be calculated as follows:
The Normalized Difference Built-up Index (NDBI) enhances urban area detection, which tends to have high SWIR1 reflectance and low NIR reflectance values. The equation to calculate this spectral index is as follows:
The Modified Normalized Difference Water Index (MNDWI), which is very important for distinguishing built-up areas from nearby rivers, lakes, and coastal zones, can be calculated as follows:
The Enhanced Vegetation Index (EVI) reduces atmospheric influences and enhances the vegetation signal, indirectly improving urban detection by reducing spectral confusion with vegetation. It can be calculated as follows:
2.4.2. Transfer Learning Framework for 2024 Built-Up Classification
In Land Use and Land Cover (LULC) classification, and, therefore, in built-up area mapping, machine learning models learn to associate the spectral characteristics of pixels with their corresponding land cover types. Each training sample is represented as (x,y), where the following applies:
x ∈ X represents a pixel’s spectral properties from Landsat imagery, including reflectance values across multiple bands (e.g., Red, Green, Blue, Near-Infrared, and Shortwave Infrared);
y ∈ Y represents that pixel’s corresponding land cover classification, such as built-up or non-built-up.
Given a classification task, T, the input space X consists of all multispectral feature variables extracted from Landsat imagery, while the output space Y consists of all land cover class labels. Each training sample (x,y) is drawn from a joint probability distribution p(x,y), which defines the statistical relationship between input features and land cover classes.
The relationship can be expressed as follows:
p(x,y) represents the probability distribution of input features and class labels, capturing the statistical relationship between them in the dataset.
p(y|x) represents the conditional probability of a land cover label y given the spectral features x, which corresponds to the classifier’s decision boundary.
p(x|y) describes the distribution of spectral characteristics within a given land cover class.
p(x) and p(y) denote the marginal distributions of the input features and the output labels, respectively.
A Random Forest (RF) classifier is trained to estimate p(y|x), minimizing classification errors during training. The primary objective is to ensure that the model generalizes well, meaning that when applied to untreated satellite imagery, it can accurately predict built-up areas.
In a standard supervised learning setting, an RF model would be trained independently on a labeled dataset (X
t, Y
t) for the target classification period T
t (in this study, 2024). However, for 2024, no up-to-date land cover reference dataset with the required resolution (such as CORINE Land Cover) exists, and generating a new labeled training set is resource-intensive. This is a common problem in remote sensing applications, where labeled land cover datasets for recent years, which are time-consuming and expensive to produce, are often unavailable [
30].
To overcome the limitation of the absence of labeled training data for 2024, a transfer learning (TL) approach is adopted. The labeled datasets (Xs, Ys) from 2006, 2012, and 2018 (the source domain) are used to classify built-up areas in 2024 (the target domain).
However, directly applying an RF model trained on past data to 2024 without adaptation can lead to substantial classification errors due to domain shift, where the statistical properties of the source and target domains differ (ps(x, y) ≠ pt(x, y)).
According to Bayes’ theorem, the joint distribution can be decomposed as follows:
According to Equation (5), domain shifts can occur due to changes in p(x), p(y), or p(y|x) between past datasets (2006, 2012, and 2018) and 2024. In this study, the following three types of domain shifts are identified [
31,
32]:
An inductive transfer learning approach, utilizing model fine-tuning, was employed to address these domain shifts. This ensures that the RF classifier adapts to the evolving landscape of 2024 while maintaining spatial consistency.
Fine-tuning-based transfer learning is widely used in deep learning (DL) models, where a pre-trained model is adapted to a new task by fine-tuning its parameters on a smaller, labeled dataset [
33,
34]. Unlike DL, where earlier layers capture generic features and later layers specialize in task-specific representations [
35], RF fine-tuning transfers learned decision rules from past classifications and refines them using newly labeled data.
The steps in fine-tuning RF for the 2024 classification are as follows:
Pre-training the RF model on the 2006, 2012, and 2018 datasets, capturing the spectral characteristics of built-up areas over time.
Applying the pre-trained RF model to Landsat 9 (2024) imagery, using prior decision rules to make initial predictions.
Fine-tuning the RF model using an independent 2024 validation dataset (comprising built-up and non-built-up reference points) to enhance classification accuracy.
Assessing classification performance using Overall Accuracy (OA) and F1-score to ensure adaptation success.
Fine-tuning enables the RF classifier to correctly identify newly developed built-up areas, preserving classification consistency across different years.
2.5. Accuracy Assessment and Validation Process
The accuracy assessment process is fundamental to evaluating the reliability and effectiveness of the built-up area classification methodology across different years. Accuracy varies depending on factors such as the size and quality of the input dataset, the characteristics of the study area, and the type of satellite sensor used. Different studies have evaluated the performances of various classifiers using Landsat satellite imagery in land use and land cover classification, reporting varying accuracy levels based on different validation techniques [
36,
37].
The model was validated using independent reference pixels evenly distributed across the study area to maintain class balance. This large validation dataset ensures statistical significance, minimizing potential biases in classification performance.
OA and F1-score were the primary validation metrics used to comprehensively assess the classification performance of this study. The assessment was carried out for the following two different validation scenarios:
The validation of the 2006, 2012, and 2018 classifications using CORINE Land Cover (CLC) as a reference dataset;
Independent validation of the 2024 built-up area classification using newly selected ground truth samples.
2.5.1. Accuracy Assessment for 2006, 2012, and 2018 Classifications
For the classification of the 2006, 2012, and 2018 Landsat multispectral images, CORINE Land Cover (CLC) maps served as the primary reference datasets for validation. Since CLC datasets are produced through expert-driven photo interpretation, they provide a reliable “ground truth” for assessing classification accuracy. However, because CLC has a native resolution of 100 m, as specified in
Section 2.3, it was resampled to 30 m to match the Landsat imagery resolution and ensure spatial comparability.
The validation procedure consisted of a multi-step process. In the first step, stratified random samples were extracted from the CLC dataset, ensuring that 72,000 validation points were evenly distributed to guarantee balanced classes of built-up and non-built-up areas. Afterwards, a confusion matrix was determined for each classification year to compute accuracy metrics, including OA and F1-score, which measure classification performance.
OA measures the proportion of correctly classified pixels out of the total number of pixels. It is computed as follows:
This metric provides a general indication of the classifier’s performance across built-up and non-built-up classes.
The F1-score is the harmonic mean of Precision (User’s Accuracy) and Recall (Producer’s Accuracy) and is particularly useful in cases of class imbalance. It is calculated as follows:
where:
By combining Precision and Recall, the F1-score provides a more balanced accuracy measure that penalizes both false positives and negatives, offering a comprehensive evaluation of classification performance.
2.5.2. Independent Validation of 2024 Built-Up Area Mapping
An independent validation approach was required, since an official land cover dataset for 2024 was not available. A new ground truth dataset was created using manually selected validation samples, ensuring a spatially representative distribution of built-up and non-built-up areas within the study area.
To build a validation set for 2024, a stratified random sampling strategy was adopted to prevent class imbalance, ensuring equal pixel samples of built-up and non-built-up areas. Specifically, 800 ground-truth pixels were selected, comprising 400 for built-up areas and 400 for non-built-up areas. Moreover, validation points were distributed across the study area, ensuring representation from both highly urbanized municipalities and smaller municipalities where urban expansion may be less substantial.
For 2024, the same OA and F1-score metrics were used to evaluate classification performance.
2.5.3. Methodological Workflow Overview
To synthesize the complex, multi-stage procedure implemented within the Google Earth Engine platform into a structured and reproducible sequence, a methodological roadmap is presented in
Figure 2, facilitating a clearer understanding of the complete methodological process. The diagram summarizes the main steps of the proposed workflow, including data acquisition, preprocessing, classification using Random Forest (RF), the application of transfer learning for the 2024 built-up map, validation of the results, and the computation of urban spatial metrics.
2.6. Method for Quantifying Built-Up Area Evolution and Urban Spatial Metrics
Two complementary metrics, the Urban Dispersion Index (UDI) [
38] and Urban Density [
39], were calculated based on the classified Landsat imagery to assess the spatial and temporal characteristics of urban development within the study area. These dimensionless indices support the quantitative interpretation of built-up area patterns over time.
The surface area of built-up land was calculated for 2006, 2012, 2018, and 2024 by summing the classified built-up pixels from the Random Forest output. These values are expressed in square kilometers to evaluate the extent and evolution of urban growth across the 773.24 km2 study area.
The UDI measures the fragmentation of built-up areas and is defined as the number of discrete urban nuclei (connected built-up pixel clusters) per square kilometer of the total study area, as follows:
where N
uc is the number of identified built-up nuclei and A is the total surface area (773.24 km
2). A higher UDI indicates more fragmented, scattered urban development, commonly associated with urban sprinkling, a growth model frequently observed in southern Italy.
Urban Density was calculated as the ratio between the total built-up surface area and the total study area, quantifying the concentration of urban development over the territory, as follows:
3. Results
3.1. Classification Accuracy and Performance
Built-up area classification accuracy was assessed for 2006, 2012, and 2018 using a Random Forest (RF) classifier trained on CORINE Land Cover datasets. The validation process was conducted using a stratified random sampling approach, comparing RF-classified built-up areas with reference datasets.
The evaluation was based on the OA and F1-score metrics (see
Section 2.5, Accuracy Assessment and Validation Process).
The results of the accuracy assessment are summarized in
Table 1.
The classification process achieved a high accuracy across all years, with the OA exceeding 88.9% and an F1-score above 0.80, indicating that the model effectively distinguished urban from non-urban areas.
The true positives (TP) for the “built-up” class increased from 24,324 in 2006 to 25,158 in 2018, reflecting the expansion of built-up areas over time.
The false positives (FP) remained very low (about 600 in all years), meaning that non-urban areas were rarely misclassified as built-up.
The F1-score increased from 0.8030 (2006) to 0.811 (2012) and stabilized at 0.810 (2018), demonstrating the RF classifier’s ability to generalize built-up patterns across different years.
The false negatives (FN) for the “built-up” class remained around 11,000 across all years, indicating that some newly developed urban areas may have spectral characteristics that resemble those of non-urban land cover.
These misclassifications could have been due to spectral similarities between urban areas and bare soil, seasonal variations, or changes in satellite sensor characteristics.
The true negatives (TN) for the “non-built-up” class remained extremely high (about 71,400), showing that natural and rural areas were well classified and had very few misclassifications.
The FP rate (about 0.8%) was particularly low, indicating that the RF classifier rarely confused non-urban land with built-up areas.
3.2. Validation of 2024 Classification
The classification of built-up areas for 2024 was conducted using a transfer learning-based Random Forest (RF) model, employing historical training data (2006, 2012, and 2018) to predict built-up areas in 2024 (see
Section 2.4, Transfer Learning Framework for 2024 Built-Up Classification). Given the absence of a recent, high-resolution land cover dataset for 2024, a fine-tuning approach was applied to adapt the RF model to the latest Landsat 9 imagery while maintaining consistency with past classifications.
An independent validation process was carried out to ensure the reliability of the 2024 classification (see
Section 2.5, Accuracy Assessment and Validation Process). The classification results were compared with the reference validation dataset, and the accuracy metrics were calculated using a confusion matrix (
Table 2).
The high overall accuracy (92.6%) confirms that the transfer learning-based RF model successfully adapted past land cover classifications to 2024, producing a reliable built-up area classification. The F1-score of 92.6%, which balances Precision and Recall (92.5% and 92.7%, respectively), suggests that the model effectively captured urbanization trends while minimizing misclassification errors.
High TP values (370 TP out of 400) indicate that the model effectively identified built-up areas.
The low FP rate (30 FP out of 400) shows that very few non-urban areas were mistakenly classified as urban, enhancing reliability for land use planning applications.
The transfer learning approach effectively mitigated temporal domain shifts by adapting classification rules from past years to the 2024 dataset.
The limited number of FNs (30 FN out of 400) suggests that while the model generalizes well, some recently developed built-up areas might exhibit spectral characteristics that differ from those used in past training datasets, leading to minor misclassifications.
The validation confirms that the RF model maintained spatial consistency across different classification years, making it a reliable tool for the long-term monitoring of built-up areas.
3.3. Built-Up Area Evolution and Urban Spatial Metrics (2006–2024)
After assessing the accuracy of the Random Forest classification framework, the built-up areas within the study area were determined for the years 2006, 2012, 2018, and 2024 using the classified Landsat satellite images. The spatial evolution of urbanized land was quantified, revealing significant urban growth over the 18 years under analysis.
The study region’s total surface area is 773.24 km
2. The analysis, summarized in
Table 3, revealed a clear and continuous growth trend in built-up areas.
In 2006, built-up surfaces occupied approximately 23.22 km
2, representing about 3.00% of the total study area. Between 2006 and 2012, the built-up land experienced moderate growth, reaching 23.89 km
2—an increase of 0.67 km
2 (+2.89%). The next period, from 2012 to 2018, exhibited slightly more pronounced growth, expanding the built-up area to 25.11 km
2, reflecting an increase of 1.22 km
2 (+5.11%) (
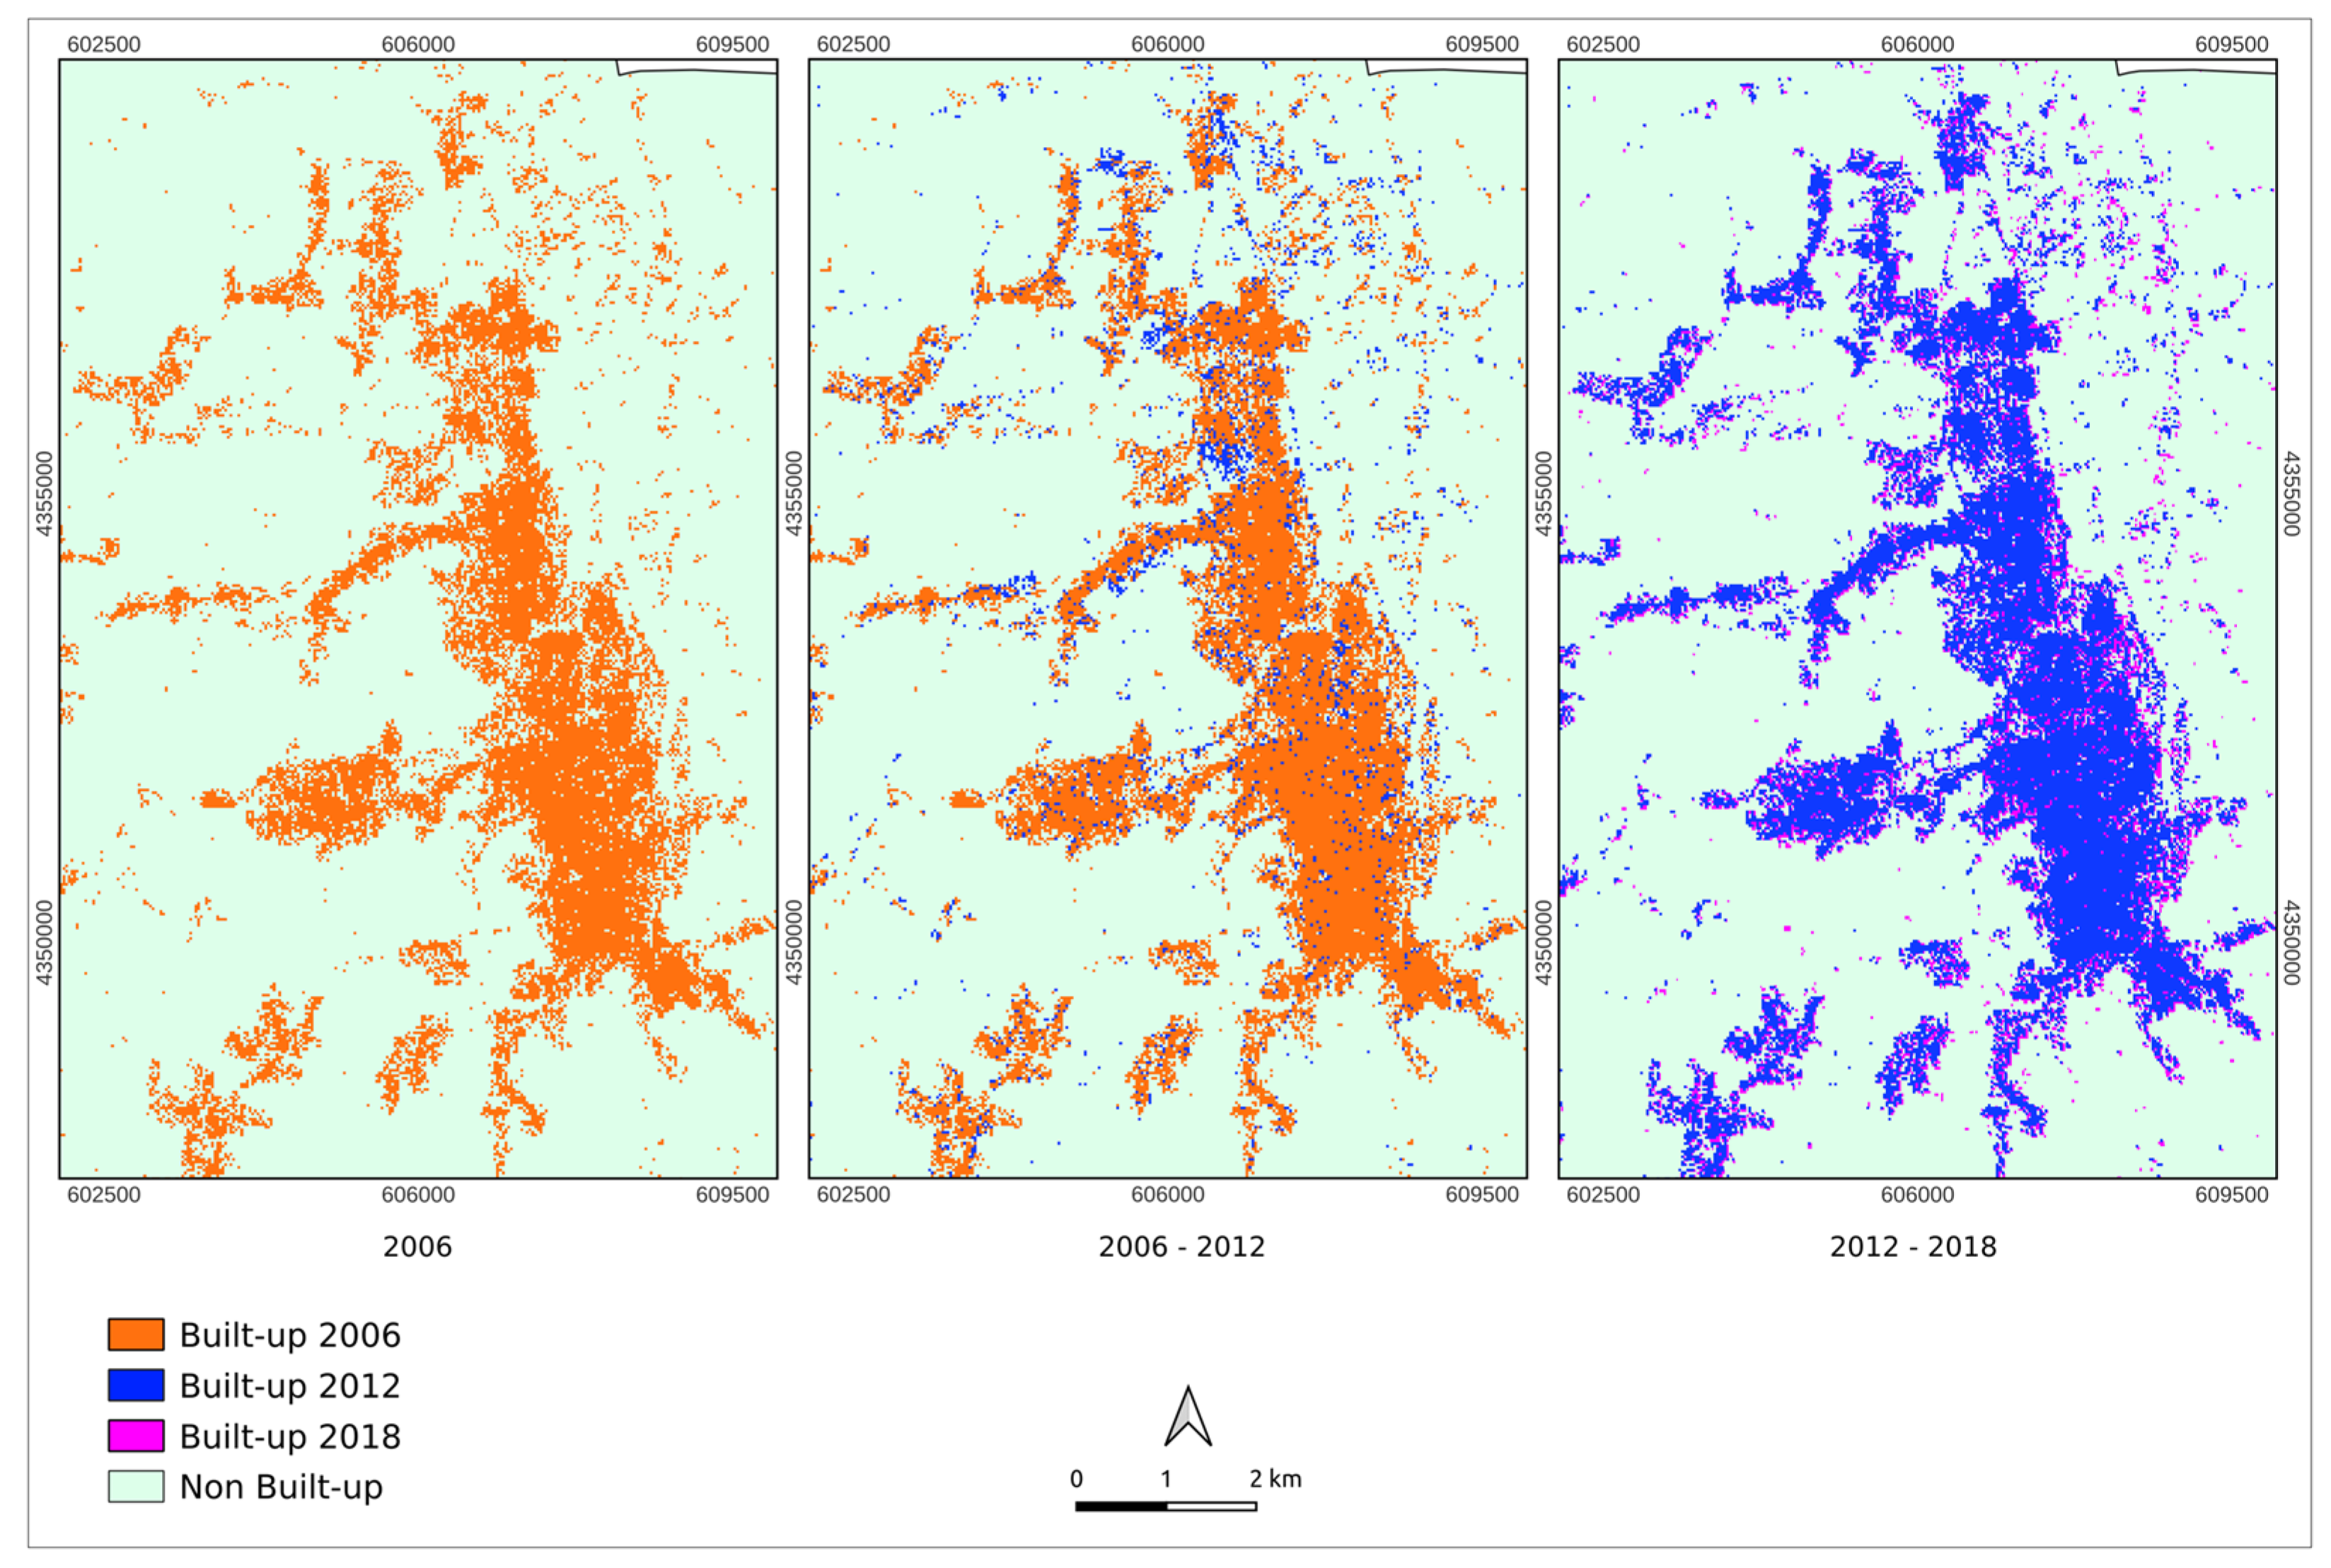
Figure 3).
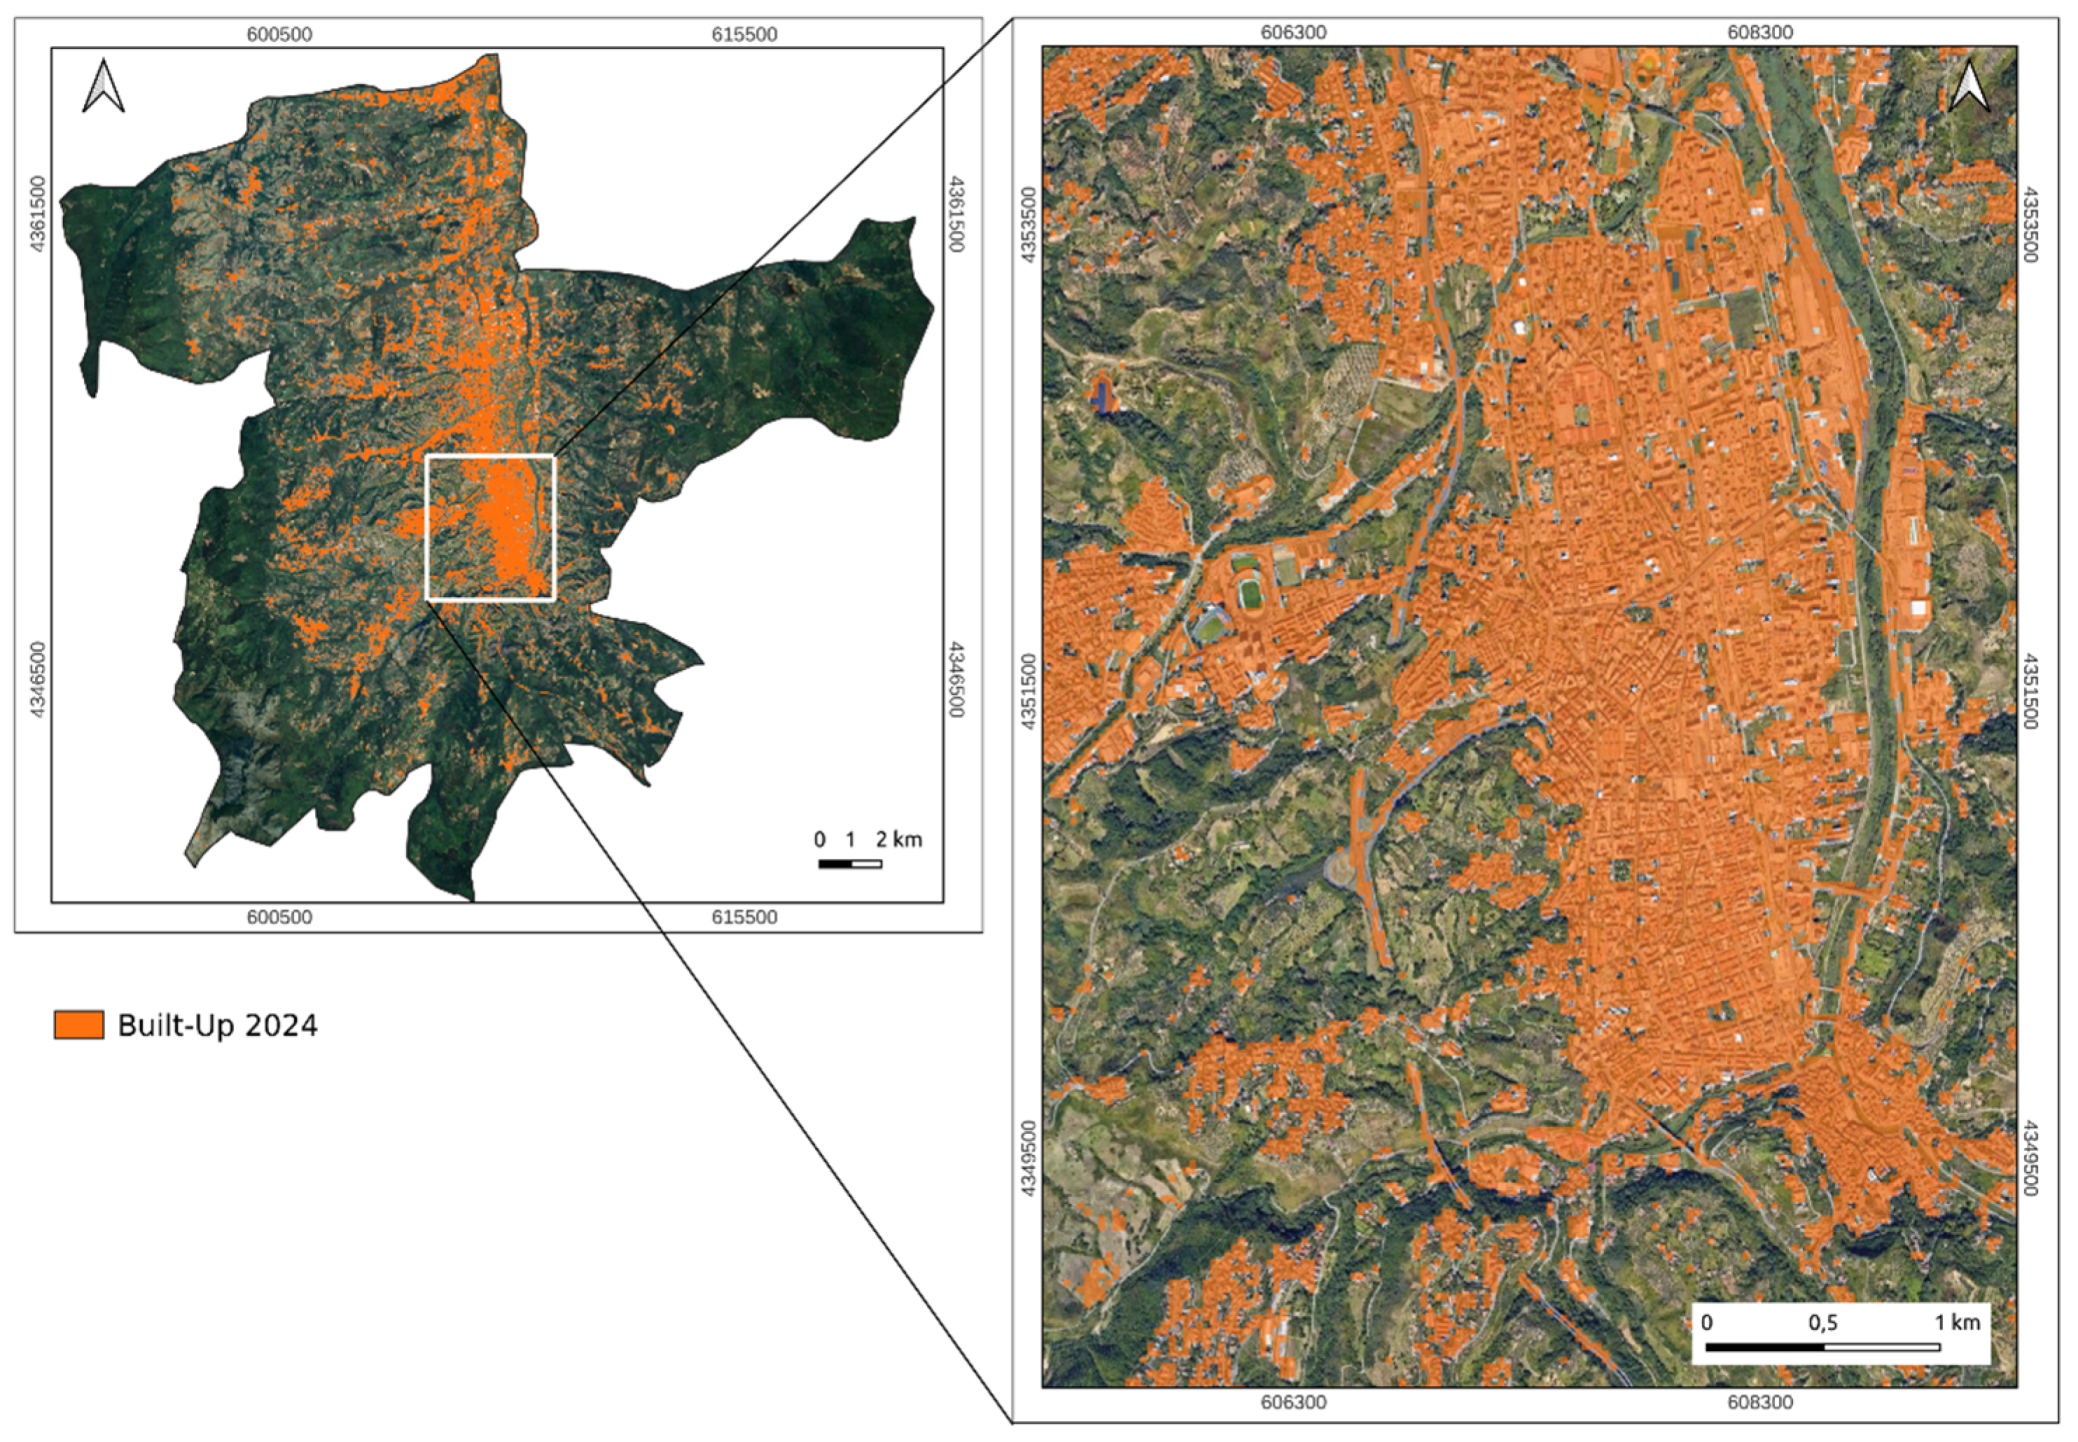
The most significant urban expansion occurred between 2018 and 2024, during which the built-up area increased to 36.64 km
2, representing a notable rise of 11.53 km
2. This change represents a percentage growth of approximately 45.92% over six years, highlighting the rapid and substantial urbanization in the region (
Figure 4).
This accelerated urban growth is closely linked to the presence and expansion of key urban centers, primarily driven by economic and demographic factors. Notably, the municipalities of Cosenza and Rende, which host the University of Calabria, have played a pivotal role in catalyzing urban expansion, attracting a population influx and stimulating demand for new residential and commercial infrastructure. The consistent presence and expansion of the university have notably fostered increased residential settlements, commercial zones, and infrastructure dedicated to educational and research activities.
The Urban Dispersion Index (UDI) and Urban Density were also computed to better characterize the structure of this urban expansion (
Table 3).
While Urban Density gradually increased from 0.0300 in 2006 to 0.0474 in 2024, in-dictating growing land consumption, the UDI saw a sharp rise from 2.27 to 3.94 nuclei/km2 over the same period. This marked increase highlights a recent shift toward a more fragmented and discontinuous urban fabric, particularly between 2018 and 2024.
Such fragmentation is emblematic of the urban sprinkling pattern identified in previous studies of southern Italy [
39]. These metrics confirm the intensity and spatial dispersion of urban growth, raising essential concerns regarding infrastructure efficiency, ecological sustainability, and the long-term effectiveness of regional planning.
Such urban growth underscores the importance of timely and accurate monitoring tools, such as the proposed methodology, in guiding sustainable urban planning strategies and mitigating the potential environmental impacts of urban sprawl.
4. Discussion
The results from the classification framework presented in this study confirm the transferability, scalability, and interpretability of the proposed methodological approach for fusing multi-temporal satellite data. Integrating Random Forest classification with transfer learning demonstrates notable advantages in monitoring built-up dynamics, particularly in scenarios where up-to-date, high-resolution land cover reference datasets are lacking. This approach enables the use of historical knowledge from previously available datasets to accurately detect built-up areas, significantly reducing the resources required for frequent manual updates.
Specifically, the analysis highlighted substantial built-up growth in the municipalities of the Calabria region from 2006 to 2024. The accelerated urban growth observed between 2018 and 2024 emphasizes the influence of socio-economic dynamics, notably around key urban centers such as Cosenza and Rende. Consistent urbanization aligns with demographic growth and economic development, heavily influenced by the University of Calabria’s expansion, which is a strong attractor for residential and commercial infrastructure. The University of Calabria, which now accommodates around 70,000 students, stands as the first major public university in terms of the growth of enrolled students in Italy, marking a 23% increase in 2022 compared to the pre-pandemic period (2019/2020), and is among the only three universities in Italy to boast an increase in the number of newly enrolled students each year over the last three years. This development has undoubtedly played a pivotal role in driving the area’s urbanization, highlighting the direct impact of educational infrastructure and associated services on local land use dynamics.
The urban spatial metrics calculated in this study, Urban Density and the Urban Dispersion Index (UDI), highlight a significant trend toward more fragmented urban growth, particularly pronounced between 2018 and 2024. Such fragmentation aligns closely with the “urban sprinkling” phenomenon, which has been extensively documented in southern Italy. In [
38], Romano et al. investigated land transformations in Italy from post-World War II (1950s) to the early 2000s. They reported regional UDI value for Calabria of approximately 2.18 nuclei/km
2 in the early 2000s aligns very closely with the UDI value of 2.227 nuclei/km
2 obtained in the present study for 2006. This consistency emphasizes the continuation of dispersed, fragmented urban growth patterns into the contemporary period.
Moreover, Romano et al. [
39] highlighted Urban Density values ranging from 0.02 to 0.05 across southern Italy, including Calabria, over 50 years. The calculated Urban Density values, ranging from 0.0300 in 2006 to 0.0474 in 2024, closely match the reported range. The strong alignment between the study’s presented findings and these long-term trends not only supports the validity of classification outputs, but also highlights the potential of GeoAI approaches to capture spatial complexity, not just extent.
The increase in the UDI from 2.227 in 2006 to 3.942 nuclei/km2 by 2024, coupled with Urban Density approaching the upper threshold identified in previous studies, underscores ongoing and potentially intensifying fragmentation. This dispersed pattern poses significant planning and environmental challenges, including inefficient land use, ecological degradation, and increased infrastructural costs. Addressing these challenges through sustainable and consolidated urban planning practices is, thus, increasingly critical.
From a methodological viewpoint, the present study extends beyond typical GeoAI applications that focus on component-level automation. In contrast, the proposed framework offers a transparent and reproducible pipeline that integrates temporal transfer learning, regional-scale data harmonization, and urban texture analysis. Rather than relying on MODIS or low-resolution global datasets, the proposed methodology used CORINE Land Cover maps, harmonized via bilinear interpolation to match Landsat’s 30 m resolution, ensuring thematic consistency with regional planning data. Additionally, the training and validation processes are clearly defined based on temporally stable built-up areas, which helps to reduce ambiguity and improve classification robustness.
This integration responds to current recommendations in the GeoAI literature. As noted by Li et al. [
29], the future of GeoAI lies in methodological integration and reproducibility, goals that our study directly addresses. The proposed transfer learning approach effectively manages inherent temporal and spectral variations across different Landsat missions (Landsat 5, 7, and 9), successfully adapting the RF model to the most recent period (2024). This significantly minimizes domain shifts and spectral misclassification due to sensor changes or land cover transformations, ensuring spatial and temporal coherence. The achieved Overall Accuracy exceeding 90% for 2024 validates this strategy, confirming the method’s robustness and suitability for long-term urban monitoring.
However, limitations must be acknowledged. The use of medium-resolution imagery (Landsat, 30 m) limits the granularity of built-up detection in dense urban cores or heterogeneous peri-urban zones. Future research could explore the integration of higher-resolution data sources (e.g., Sentinel-2, PlanetScope), the incorporation of socio-economic datasets, and the extension of the transfer learning framework with semi-supervised learning techniques to further enhance adaptability and performance. Additionally, the use of more advanced temporal feature extraction methods, such as time series modeling, temporal convolutional networks, or attention-based architectures, could enable the identification of subtle temporal patterns and improve the effectiveness of multi-temporal data fusion. The broader application of the methodology to other fragmented and rapidly changing geographies in the Mediterranean and the Global South would also help to validate its generalizability and operational utility.
5. Conclusions
This study proposed and validated a novel multi-temporal built-up area classification methodology that integrates remote sensing, machine learning, and open-access cloud computing within the Google Earth Engine (GEE) platform. The framework was specifically designed to support urban monitoring in regions where up-to-date, high-resolution land cover datasets are lacking, particularly in fragmented and spatially heterogeneous territories such as southern Italy, where reliable data are essential for evidence-based planning and land governance.
The core methodological innovation lies in the integration of multi-temporal Landsat imagery with a temporal transfer learning strategy, which leverages historical land cover data (2006, 2012, and 2018) to generate accurate built-up classifications for 2024, even in the absence of updated reference maps. The Random Forest classifier, enhanced with spectral indices and temporally fused features, achieved a high classification accuracy of 92.6% in 2024, as confirmed by independent ground truth validation, demonstrating the robustness and reliability of the proposed approach.
Beyond classification accuracy, the framework demonstrates added value through its ability to quantify long-term urban expansion and assess morphological changes in urban texture. By computing spatial metrics such as the Urban Dispersion Index (UDI) and Urban Density, the method provides detailed insights into the structural evolution of urbanization. The observed trend toward increasingly fragmented development between 2006 and 2024 aligns with long-term regional patterns previously described in southern Italy, reinforcing the validity of the results.
Overall, the proposed GeoAI-based framework embodies the principles of methodological integration, scalability, and reproducibility. Its cloud-based implementation ensures ease of deployment across various geographies. At the same time, its transparent and interpretable structure provides a reliable decision support tool for urban planners, regional authorities, and policymakers concerned with sustainable urban development in data-scarce environments.


